the confluence model - deep blue - university of michigan
TRANSCRIPT

INTELLIGENCE 4, 349-361 0980)
The Confluence Model: Parameter Estimation
for Six Divergent Data Sets
on Family Factors and Intelligence*
R. B. ZAJONC AND J O H N BARGH
The University of Michigan
Theoretical predictions, based on the confluence model, were made for data from six national surveys of intellectual performance. All six surveys relate intellectual performance scores to family configuration variables. Widely divergent patterns of relationships between the major family factors, such as birth order and family size, and intellectual performance scores characterize the six data sets. Nevertheless, the confluence model was capable of accurate prediction in all cases when all three parameters were estimated. Little accuracy was lost using only two parameters. Variations in the estimated parameter values that reflected the variations in patterns of effects could be meaningfully interpreted for their psychological significance.
The effects o f family conf igura t ion variables , such as family size, b i r th order , and spac ing between siblings, on inte l lectual g rowth were recently descr ibed by means of the conf luence mode l (Za jonc & Markus , 1975). A r epa rame t r i za t ion o f this model was subsequent ly employed to expl icate the confl ic t ing results repor ted in the b i r th o rder l i tera ture (Zajonc, Markus , & M arkus , 1979).
This pape r repor ts more s t r ingent and extensive tests of the confluence model than have been carr ied out thus far. A var ie ty of da t a sets on the re la t ionship between family conf igura t ion variables , such as b i r th order and family size on the one hand, and inte l lectual per formance scores on the other, have been compi led and the pa ramete r s o f the mode l were es t imated for these data . These da t a sets, which come from large na t iona l intell igence surveys, show m a r k e d l y divergent pa t te rns o f results. Thus , for example , in one da ta
*This research was supported by Grant No. BNS77-13973 from the National Science Foundation. Requests for reprints should be sent to R. B. Zajonc, Research Center for Group Dynamics, University of Michigan, Ann Arbor, Michigan.
349

350 Z AJONC AND BARGH
set (Breland, 1974), the birth order effect is clearly negative, following the typical pattern of findings (Zajonc et al., 1979). However, in another data set (Davis, Cahan, & Bashi, 1976), the birth order effect is negative only for small families. In that data set, large families show a distinct parabolic trend in birth order effect, with an upswing in intellectual scores among the lower birtlr ranks. There is one data set which reveals no birth order effect at all (INl~D, 1973). In one set, the only child shows the highest intellectual score, while in another the only child scores at the level of the first child in a family of five. And the family size effect is sometimes quite robust and sometimes it is quite weak.
The present paper has two related purposes: (a) we wish to establish whether the confluence model is capable of accurately describing data sets with strikingly divergent patterns of results, and (b) to examine the parameters of the model to determine whether they generate useful information--that is, whether variations in these parameters, as diverse data are fit, reflect theoretically meaningful consequences.
THE CONFLUENCE MODEL: REPARAMETRIZED VERSION
As in the original version, the reparametrized confluence model predicts the level of mental maturity M#t,I attained at age t by the ith child ofj children in a family or household of n persons. M~(t) is expressed as a first-order difference equation,
( I ) M#(,) = Mu.(,-l) + at + ~.t,
where t = 1,2,3... years. The sum of the two components, at and ~,, both measured at age t, represents the growth increment accumulating each year. The term at reflects yearly increments due to variations in the intellectual environment, which is the basic concept of the model, whereas the term ,\t reflects yearly increments occasioned by the special circumstances of last children.
It is assumed in the model that the environmental factors that influence intellectual growth do not have the same effects at different ages of the child. Thus, the acquisition of a sibling at age three has a more pronounced effect than at age 12, when the child is much nearer intellectual maturity. In the original paper (Zajonc & Markus, 1975) it was supposed that the effects of
-k2 t 2 family configuration cumulated as a sigmoid function of age,j~t) = 1 - e , where k was a growth constant and t age. The two components, at and ~,t, are therefore expressed as weighted yearly increments of this sigmoid function, Af(t) : (1 - e -k¢~) - (1 - e -k~l-ll2) = e -*2(~-lF - e-k~:~:

THE CONFLUENCE M ODE L 351
(2)
and
(3)
oh = w l A f ( t ) n~t-l~ + 1 J
w2L~At( t) At( ~) ( Ik - 1) 2
The above terms wl and w2 are weights associated with the two components, f ( r ) = 1 - e -t 2~'2where r is the age of the adjacent younger sibling, and Lt is the last child index which is equal to zero for children who at age t are not followed by a younger sibling and equal to one otherwise. A more detailed and extensive psychological interpretation of the specific features of the confluence model is given elsewhere (Zajonc et al., 1979). Suffice it to point out here that the weights Wl and w2 represent metric contributions of the component sources of influence upon intellectual growth, and need to be estimated from the data. The constant k in f i t ) and f i r ) must also be estimated, and it reflects the rate at which intellectual effects cumulate. It will, therefore, vary with the population investigated, with the type of ability measured, and with the test employed for its measurement. In Equation (2) the intellectual environment within the home is represented as a root mean square of the intellectual levels of all family members. This formulation is used, as previously (Markus & Zajon¢,' 1977), to reflect the greater contribution of the more mature members. Moreover, the denominator is n + 1 to allow the quality of the intellectual environment to rise with increasing number of family members. It is reasonable to consider an environment consisting of four adults to be richer than one consisting of one adult. Thus, for a given value of M, the inequality n M / n + 1 < (n + I ) M / n + 2 is always satisfied. This formulation of the intellectual environment also reflects the fact that an addition of a new birth will reduce its quality, whereas the addition of an adult will increase it. The term kt, on the other hand, reflects the fact that last children do not share the advantage enjoyed by children having a younger sibling they are not used by these younger siblings as intellectual resources. That is, unlike their older brothers and sisters they are not called upon to answer questions about meanings of words, rules of games, solutions to puzzles, etc.
DATA SETS ON FAMILY CONFIGURATION FACTORS AND INTELLIGENCE
There are six large data sets that have sufficient information for our purposes. Required, of course, is information about family size and, independently of family size, about birth order. Also necessary is information

352 ZAJONC AND BARGH
about spacing between sueeesive births. Birth intervals for a large population, however, can be estimated from census data, as in the Markus and Zajonc (1977) simulation.
Following is a description of the six populations and of the data which are available for them:
The Dutch survey. Belmont and Marolla (1973) presented the average Raven Progressive Matrices score by birth order and family size for the entire male population of the Netherlands who attained age 19 between 1963 and 1966 (N = 386,114). The Raven scores were reported in terms of six categories, from I (high) to 6 (low). The overall mean score for the population was 2.82, with a standard deviation of 1.43.
The French survey. The Institut National d'l~tudes Demographiques conducted an extensive survey of intellectual performance and family background for a sample of over 120,000 French elementary school children between 6 and 14 years of age. This survey (INI~D, 1973) employed an intelligence measure including subtests on analogies, comprehension, vocabulary, differences, series completion, and proverbs. The sample mean was 99.2, and the sample standard deviation was 14.53.
The Scottish survey. In the earliest study of the relationship between family variables and the intellectual test performance of a large population, the Scottish Council for Research in Education surveyed and tested 70,000 Scottish 1 l-year-olds (Scottish Council, 1949). The Scottish Council Verbal Test had shown a mean of 36.74 and a standard deviation of 16.1 for the sample.
The American survey. The U.S. data is taken from a study by Breland (1974) of the National Merit Scholarship Qualification Test (NMSQT) averages of nearly 800,000 candidates, which were examined as a function of birth order and family size. The mean NMSQT score for this population of 17-year-old Americans was 102.5, with a corresponding standard deviation of 21.25.
The Israeli survey. Davis et al. (1976) published mathematical achievement test data of 14-year-old Israeli students as a function of family size and birth order. The data consist of the arithmetic computation and mathematical problem-solving subtests of a standard achievement test given to all eighth-grade students in Israel. The results were given separately for students whose parents had immigrated to Israel from Europe, America, Australia, and South Africa (N = 82,689) and for students whose parents had immigrated from North African and Middle Eastern countries (N = 109,302).

THE CONFLUENCE MODEL 353
The authors described the former group as having aWestern cultural pattern, and the latter group as having a Middle Eastern or "Oriental" cultural pattern. This was the only data set for which indications of parental intelligence were available. These two subpopulations were found to differ in the percentage of mothers with some formal education. There was a much higher percentage of educated Western mothers than Oriental mothers; this information was presented separately for the two subpopulations by family size. From these percentages we estimated the average parental M-values at chronological age 19 for each family size in the two subpopulations using the linear transformation Mp = .08 (percentage of mothers with education) + 12.02. The Israeli data sets were the only ones of tbe six we examined which contained some information on parental education or intelligence. For the remaining data sets the parental M-value was assumed to be 19.
For the confluence model to predict intellectual test performance for a given population, the average number of years between births of successive children must be known or estimated for each family size. Unfortunately, there is no direct empirical information about age gaps for the six samples, and so indirect indices, such as census birth rate data, must be used to estimate the intervals. When birth rate is low or on the decline, intervals between successive births are relatively long, whereas rather short intervals are the rule during periods of high or rising birth rate. For the periods in which each sample was born, the Dutch, American, and Israeli birth rates were high and increasing, while those of France and Scotland were low and on the decline. Estimates of birth intervals for the Dutch data were made from Dutch census information on births since years of marriage, by birth order, for the period during which the survey population was born (1944-46). These intervals were also employed in the simulations of the American and Israeli data. The intervals used in the French and Scottish simulations differed slightly from the Dutch intervals, in order to reflect both lower population birth rates and considerations stemming from the relatively young age of the samples (Markus & Zajone, 1977). I
M E T H O D OF E S T I M A T I O N
In order to perform simulations of the intellectual development of the six samples based on the confluence model, starting values of M for each birth rank within all family sizes are required, as are age gaps between siblings.
~A substantial constraint is placed on spacing when test scores of young children are evaluated. Thus, for example, since the Scottish data were coUected on 1 l-year-olds, a first born in a family of nine children could have siblings separated by only a little more than one year. No large gaps were thus possible except for multiple births cases which, of course, must have been exceptional. These considerations are reflected in the estimated age gaps (see Markus & Zajonc, 1977).

354 ZAJONC AND BARGH
Values for the three constants (k, w~, and w2) must also be supplied. The initial M for a child at birth was assigned the value zero. And as previously (e.g., Markus & Zajonc, 1977; Zajonc, et al, 1979) the parental M's for each family size were set to a constant value of 19 for the Dutch, French, Scottish, and American data. Since information about parental education was available for the two Israeli samples, estimates of the actual parental M's were made accordingly.
The general procedure of estimating the parameters for each data set was to adjust the parameter values by means of successive iterations using the Pearson product-moment correlation coefficient and visual inspection as criteria of best fit between the values generated by the simulation and the observed data. For each data set the same initial parameter values were used in the iteratior~ k = .225, w~ = 1.0, and w2 = 100. One of the three constants was then increased or decreased on successive iterations until the correlation coefficient was maximized, with the other two constants remaining unchanged. When the highest correlation had been achieved for the first constant, the second constant was varied in a like manner, until the correlation was again maximized. Finally, the third constant was varied to achieve the same end. This sequence was then repeated until the correlation could not be improved by at least .001. The iteration procedure always began with the adjustment of the k constant, followed by w~ and then w2. 2
In this way we sampled from the universe of possible combinations of values for these constants in an efficient and routinized manner. Of course, as only a sample of combinations could be examined, no matter how select that sample, the possibility remains that even better-fitting values exist. Thus the fit between the six sets of simulation and actual values obtained through the above procedure should be considered as not necessarily the best possible, such as could perhaps be obtained, for example, by some especially adapted nonlinear estimation procedures (e.g., Dixon, 1976).
RESULTS OF SIMULATIONS
For each data set, Table I presents th~ set of constants which generated the best-fitting predicted values, and Figure 1 shows the observed data and simulation results by birth order and family size. All the data that were used for the present purposes were originally published as IQ scores or equivalent units, such as Raven Progressive Matrices or NMSQT scores. In order to make the comparisons between observed and predicted values, these scores were transformed into standard aggregate form using ,q' = (Xc - :Xs)/S.D.s,
2These parameters can also be estimated by BMD07R (Dixon, 1976) which, using the partial derivatives of the functions in the modal, minimizes mean square error for each parameter by the iterative Gauss-Newton method. This procedure, however, does not generate more accurate parameter estimates than the simple one we employed.

TABLE 1 Best-fitting Parameter Values
Data Set k wt w~ r
Dutch .126 .42 i 50. .950 French .114 1.30 150. .957 Scottish .110 1.10 80. .975 American .195 .70 150. .940 Western Israeli .161 .80 150. .961 Oriental Israeli .089 1.20 500. .969
.2
.I
0
.5
.4
Mar 'o l l a (197:5) ~ \ (r : . 9 5 )
~--~-4- 2 -~ ~---~ f ~ ' - i--~ t- ~ -i -r--I i .N.E.D.(1975) r , S imulof ion
r tL
, l a,~, ( r=.94)
S.C.R.E.(1949) i ~ 3i;,ni.,hi~ior! . . . . ~ ( r : . g S )
2 1--- ,i - - - - i [ . . . . / _ ]ri,~z t \ /
..... 1 i C J z !i J tb j . . - r ~ - _ _ , ~ . - ' / . . .
. ( , . . Dav~s et al. x~ \ Strnulghoa t; Dovt5 (t| (,l. i Sl i , lU,O.]On p!.,~_ (~g~?~)- i .X\ (r--.gs) i (~9-,'~;i- i (~=.g,'} • ~ " ~ - - Weste,-n [I[ ~ . J 'O en <1 In~,e i [i
-J 1 , 1 i ~ ~ . . . . , I . . . . . . . . . . . . .
"2 4 6 8 2 4 6 8 2 4 G S 2 4 6 BIRTH ORDER
FIG. 1. Average transformed test scores, by birth order and family size: actual data and simulation results.
355
356 ZAJONC AND BARGH
where Xc is the mean of a given family position category, Xs is the grand mean of the data set, and S.D.s is the standard deviation of that data set. Since the simulation generates M-values which, unlike IQ scores, are dependent on age, they were set in standard scores in the same way that observed values were treated. The simulations generated results which fit the actual aggregate data quite well, with an average correlation of .96 between predicted and observed s c o r e s .
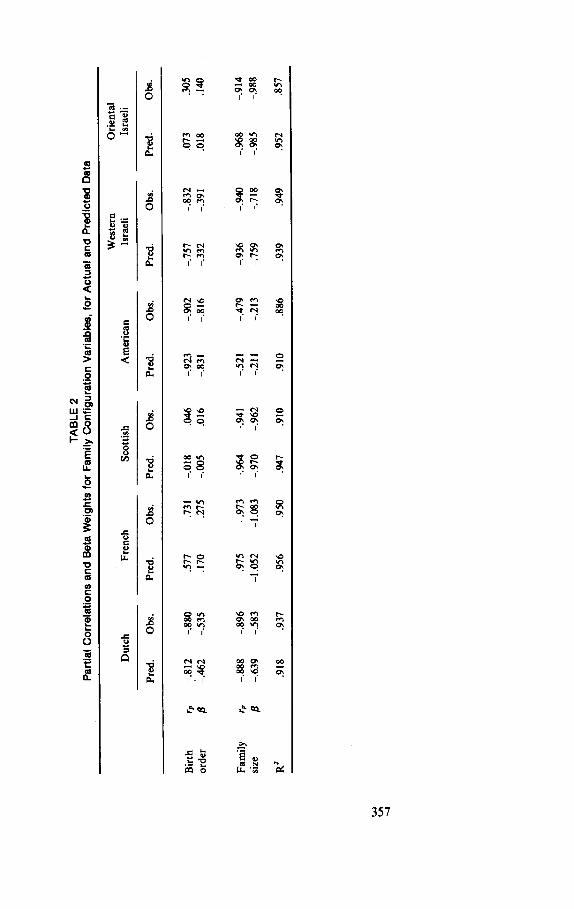
In addition to the correlation coefficient and the visual comparison of the observed and predicted data profiles, a third method of evaluating the quality of the predictions is through multiple regression analyses in which predicted values and empirical data are regressed on the major family configuration variables (birth order and family size). Table 2 presents the partial correlations and the standardized regression coefficients for the predicted and the observed data. For each data set, the partial correlations and beta weights for the simulation-generated data are very similar to those for the empirical data, demonstrating that the model does accurately reflect the kinds of systematic fine grain variations that are found in actual data. Note that linear multiple regressions describe the data fairly well and, in fact, for two of the six data sets they do somewhat better than the model. Of course, no theoretical advantage is gained by the mere fact that the coefficients describe the effects of birth order and family size fairly accurately in some cases. This was clear just from visual inspection of the data. We knew from this inspection that the family size effect was there and that birth order had sometimes a positive (French and Oriental Israeli data) and sometimes a negative effect on intellectual performance scores. But the multiple regression analysis would not have told us why this was so. Even if the percent of variance accounted for by linear multiple regression were higher in every case, the advantage of the confluence model could not be surpassed by it because no understanding about the causal dynamics of these effects would have been gained. We can predict weather most reliably if we predict tomorrow's to be identical to today's. But we would miss all the hurricanes!
Differences in the obtained parameter values between the six data sets correspond to meaningful differences between the six populations. The highest value for the growth constant k was obtained in the simulation of the American data, which consisted of the intelligence test scores of a population of National Merit Scholarship Qualification Test candidates who could be expected to perform higher than average on such tests. The obtained k for the Western Israeli sample is nearly twice that found for the Oriental Israeli sample, whose average test scores were about one standard deviation lower than those of the Western Israelis (Davis et al., 1976). The Dutch, French, and Scottish k-values are very similar, corresponding to the similarity of the samples that were tested. All three of these surveys examined cross-sections of a total national population, whereas the American and the two Israeli
TA
BL
E 2
Pa
rtia
l C
orre
latio
ns a
nd B
eta
Wei
ghts
for
Fam
ily C
onfig
urat
ion
Varia
bles
, fo
r A
ctua
l an
d Pr
edic
ted
Dat
a
Wes
tern
O
rien
tal
Du
tch
F
renc
h S
cott
ish
Am
eric
an
Isra
eli
Isra
eli
Pre
d.
Obs
. P
red.
O
bs.
Pre
d.
Obs
. P
red.
O
bs.
Pre
d.
Obs
. P
red.
O
bs.
Bi~
h
orde
r
-.81
2 -.
880
.577
.7
31
-.01
8 .0
46
-.92
3 -.
902
-.75
7 -.
832
L.4
62
-.53
5 .1
70
.275
-.
005
.016
-.
831
-.81
6 -.
332
-.39
1 .0
73
.018
.3
05
.140
Fam
ily
rp
-.
888
size
~
-.63
9
-.89
6 -.
975
-.97
3 -.
964
-.94
1 -.
521
-.47
9 -.
936
-.94
0 -.
968
-.91
4
-.58
3 -!
.05
2
-1.0
83
-.97
0 -.
962
-.21
1 -.
213
-.75
9 -.
718
-.98
5 -.
988
R 2
.9
18
.937
.9
56
.950
.9
47
.910
.9
10
.886
.9
39
.949
.9
52
.857
358 Z,~JONC AND BARGH
samples were selective and not representative of their respective national populations. The Western Israeli k is higher and the Oriental Israeli k is lower than the k's obtained for the three cross-section samples, suggesting that the best=fitting k-value for the combined Israeli samples would be similar to that of the Dutch, French, and Scottish samples.3
The obtained best-fitting values for wt, the constant associated with the intellectual environment within the family, show a perfect inverse relationship with the ages at testing of the six samples. The French w] is the highest obtained, and the average age at testing of the French sample (10 years) is the youngest among the samples we examined. The obtained w] of .42 for the Dutch data, the lowest best-fitting wt value, corresponds to the oldest age at testing, 19 years. Considering the two Israeli data sets together and averaging their obtained Wl'S, we find that, without exception, the older the sample at the time of testing, the lower the best-fitting value of w~. As the confluence model assumes that the impact of the family intellectual environment decreases as the child grows older, with changes in family structure (e.g., a new birth, or the death of a parent) having greater effect during the preschool years than during adolescence, this inverse relationship between best-fitting w~ values and testing ages seems not unreasonable.
The obtained values for the constant corresponding to the lastborn's handicap, w2, indicate how much elder siblings gain from serving as an intellectual resource for the lastborn. For the six surveys we examined, only the two Israeli data sets contain information on the extent to which children provide intellectual stimulation for their younger siblings. Davis et al. (1976, p. 1472) report that questionnaire responses from a representativd sample of 4,321 Israeli sixth-grade students indicate that the liklihood of older siblings rather than parents helping with the students' schoolwork increases with decreasing formal education of the parents. With increasing family size, the percentage of Western Israeli mothers with some formal education becomes progressively greater than the corresponding percentage of Oriental Israeli mothers, with up to a 49 point difference in this percentage for the larger family sizes. Therefore, Oriental Israeli children should gain much more intellectually from having younger siblings in the family than should their Western Israeli counterparts. This is reflected in the obtained best-fitting w2 values for the two samples, with the Oriental Israeli w2 over three times larger than the Western Israeli value. By extrapolation, we can speculate that the members of the Dutch, French, American, and Western Israeli samples had
~l'he differences in k are probably exaggerated to some extent. While k reflects the rate of intellectual growth of the child, this rate can also be influenced by the patents'intellectual levels. Since it is quite probable that these levels were higher in the American and Western Israeli data than in the ot her samples, and since we set the patents'M-values equal to 19 for all but the Israeli data sets, the actual k's for those two populations would he somewhat lower than shown in Table 1.

THE CONFLUENCE MODEL 359
similar degrees of experience with serving as an intellectual resource for their younger siblings, while those surveyed in Scotland had relatively less of such experience.
Simplification of the model to two free parameters by holding w~ constant at 150 resulted in only a slight reduction in the quality of fit between actual data and simulation results. The best-fitting k and wl values for four of the data sets remained unchanged as their obtained w2 was already equal to 150, and so the quality of fit for the simulation results of these four surveys remained the same. The highest obtained correlations with wz constrained between predicted and actual data for the other two surveys, the Scottish and the Oriental Israeli, were only .002 and .009 less, respectively, than the highest correlations with all three parameters free. Thus the two-parameter model is able to fit this variety of observed data sets just as well as the three-parameter version. Moreover, one set of parameter values (k = .167, wl = .90, and w~ = 150) that fit all six data sets with an average correlation of .903 was found through the same basic procedure as employed in the six individual estimations, which demonstrates that the major variables of the confluence model, age gaps between siblings and the age of testing, contribute significantly to the pattern of results.
The sensitivity of the confluence model to variations in the populations examined can be further assessed by estimating the data using false values of the critical variables, such as age of testing, parental IQ, spacing, etc. If the parameters k, w~, and w, are retained at their previously estimated levels and if the value of one of the essential variables, say the age of the child at the time 05 testing, is changed, we would expect the agreement between the obtained and predicted scores to be reduced if the model is sensitive to the variations in the age of testing. This is indeed the case. If, for example, the estimation for the Oriental Israeli sample is carried out for age 19 rather than 14 (which was the age when these children were actually tested and for which the previous estimates were made), and ff the parameter values are kept at their estimated levels (k = .089, w~ = 1.20, and w~ = 500), R z is reduced from.952 to .449, and the partial correlations for birth order and family size no longer resemble those in the observed data. The partial correlation between birth order and predicted scores changes from a positive to a negative value, and that for family size is substantially decreased. While this partial correlation was -.988 for the data and -.985 for the predicted scores (see Table 2), with age of testing changed to the false value of 19 years the partial correlation between family size and predicted scores is reduced to -.480.
A final point has to do with the improvement of prediction obtained by I1 . .
including parental IQ information. The highest correlation we were able to obtain for the two sets of Israeli data when the parental M's were all set to 19 was .945 for the Western and .952 for the Oriental data. Thus, the inclusion of the more exact parental M's based on the maternal education data resulted in 2.1% and 3.3% additional variance explained in the Western and Oriental

360 ZAJONC AND BARGH
Israeli data, respectively. Therefore much of the variance in the six aggregate data sets that was not explained by the model may be attributed solely to imperfect sibling spacing and /or parental mental age information. The external validity of the confluence model is supported by the fact that providing it with more accurate information about the population whose scores are to be simulated serves to increase the accuracy of the simulation.
CONCLUSIONS
Our findings extend those of the original confluence model simulation (Markus & Zajonc, 1977) by demonstrating that six dissimilar aggregate intellectual performance data patterns are entirely consistent with a single underlying model. Using only two free parameters, k and wl, and a rather simple estimation procedure, the model is clearly able to fit aggregate data from widely different populations, despite differences in abilities measured, tests utilized, or age at testing. The best-fitting parameter values have been shown to mirror important features of the populations for which they were obtained. Finally, improving the quality of the information which the model uses to make its predictions improves the quality of those predictions, further attesting to the model's validity.
The most pronounced differences among the data examined were those associated with birth order effects. Some data sets were characterized by intellectual scores that decreased with birth order, while in other data sets intellectual performance either did not vary with birth order, or had a shallow positive parabolic relationship with it. Some of these variations in birth order effects depend on the spacing between successive births which are reflected in the estimates. Another component of these variations, however, depends on the age of testing. It was shown in a recent publication (Zajonc et al., 1979), that the age of testing has a significant influence over birth order effects. When a new child enters the family, two significant changes are assumed to occur in the process of intellectual development of the older child. First, the intellectual environment of the family is diluted by the addition of the immature sibling. Secondly, the older child acquires a teaching function: the value of X, changes from zero to a positive number. The first effect has negative consequences on intellectual growth because the values of at increments for the years when there is a newly born sibling in the family, are smaller than o the rwi se .The second change, however , has posi t ive consequences. The combined influence of both changes in the situation of the older sibling is to decelerate for a period of time the rate of intellectual growth. This deceleration which occurs because the negative effects of environmental dilution are initially more pronounced than the benefits which accrue from the teaching function, may result in a reversal of birth order effects, such that sometimes the younger child surpasses the older in
THE CONFLUENCE MODEL 361
in te l lec tual per formance . I t was shown in the previous publ ica t ion tha t these reversals occur before the age of 14 years. S imi la r ly here, the confluence mode l r ep roduced the flat b i r th o rde r effects for da t a sets obta ined for younger subjects, i.e., INI~D and S C R E , for example , and reflected equal ly well the steep intel lectual declines tha t occur wi th b i r th o rder for popula t ions which are older, i.e., N M S Q T cand ida tes and D u t c h a rmy recruits.
R E F E R E N C E S
Belmont, L., & Marolla, F. A. Birth order, family size, and intelligence. Science, 1973, 182, 1096-1101.
Breland, H. M. Birth order, family configuration, and verbal achievement. Child Development, 1974, 45, 1011-1019.
Davis, D., Cahan, S., & Bashi, J. Birth order and intellectual development: The confluence model in the light of cross-cultural evidence. Science, 1976, 196, 1470-1472.
Dixon, W. J. (Ed.). BMD: Biomedical computer programs. Berkeley: University of California Press, 1976.
Institut National d'i~tudes Demographiques. Enquire nationale sur le niveau intellectuel des enfants dTtge scolaire. Paris, France, 1973.
Markus, G. B., & Zajonc, R. B. Family configuration and intellectual development: A simulation. Behavioral Science, 1977, 22, 137-142.
Scottish Council for Research in Education. The trend of Scottish intelligence. London: University Press, 1949.
Zajonc, R. B., & M arkus, G. B. Birth order and intellectual development. PsychologicalReview, 1975, 82, 7448.
Zajonc, R. B., Markus, H., & Markus, G. B. The birth order puzzle. Journal of Personality and Social Psychology, 1979, 37, 1325-1341.