the comparative reactivity method – a new tool to measure total
TRANSCRIPT

Atmos. Chem. Phys., 8, 2213–2227, 2008www.atmos-chem-phys.net/8/2213/2008/© Author(s) 2008. This work is distributed underthe Creative Commons Attribution 3.0 License.
AtmosphericChemistry
and Physics
The Comparative Reactivity Method – a new tool to measure totalOH Reactivity in ambient air
V. Sinha, J. Williams, J. N. Crowley, and J. Lelieveld
Max Planck Institute for Chemistry, J.J. Becher Weg 27, 55128 Mainz, Germany
Received: 13 November 2007 – Published in Atmos. Chem. Phys. Discuss.: 19 December 2007Revised: 12 March 2008 – Accepted: 4 April 2008 – Published: 22 April 2008
Abstract. Hydroxyl (OH) radicals play a vital role in main-taining the oxidizing capacity of the atmosphere. To under-stand variations in OH radicals both source and sink termsmust be understood. Currently the overall sink term, or thetotal atmospheric reactivity to OH, is poorly constrained.Here, we present a new on-line method to directly measurethe total OH reactivity (i.e. total loss rate of OH radicals)in a sampled air mass. In this method, a reactive molecule(X), not normally present in air, is passed through a glassreactor and its concentration is monitored with a suitable de-tector. OH radicals are then introduced in the glass reactor ata constant rate to react withX, first in the presence of zeroair and then in the presence of ambient air containing VOCsand other OH reactive species. Comparing the amount ofX
exiting the reactor with and without the ambient air allowsthe air reactivity to be determined. In our existing set up,X
is pyrrole and the detector used is a proton transfer reactionmass spectrometer. The present dynamic range for ambientair reactivity is about 6 to 300 s−1, with an overall maximumuncertainty of 25% above 8 s−1 and up to 50% between 6–8 s−1. The system has been tested and calibrated with dif-ferent single and mixed hydrocarbon standards showing ex-cellent linearity and accountability with the reactivity of thestandards. Potential interferences such as high NO in ambi-ent air, varying relative humidity and photolysis of pyrrolewithin the setup have also been investigated. While interfer-ences due changing humidity and photolysis of pyrrole areeasily overcome by ensuring that humidity in the set up doesnot change drastically and the photolytic loss of pyrrole ismeasured and taken into account, respectively, NO>10 ppbin ambient air remains a significant interference for the cur-rent configuration of the instrument. Field tests in the tropicalrainforest of Suriname (∼53 s−1) and the urban atmosphere
Correspondence to:J. Williams([email protected])
of Mainz (∼10 s−1) Germany, show the promise of the newmethod and indicate that a significant fraction of OH reac-tive species in the tropical forests is likely missed by currentmeasurements. Suggestions for improvements to the tech-nique and future applications are discussed.
1 Introduction
Every year, approximately 1.3 billion tonnes of carbon are re-leased into the troposphere due to natural and anthropogenicgaseous emissions (Goldstein et al., 2004). Photochemi-cal reactions, initiated by the hydroxyl radical (OH), oxi-dize many of these emitted primary atmospheric pollutantssuch as carbon monoxide (CO), sulphur dioxide (SO2), ni-trogen oxides (NOx=NO and NO2) and VOCs (Volatile Or-ganic Compounds) into forms, which are more readily re-moved from the atmosphere by deposition or formation ofaerosol. Ultimately, if a carbon compound remains in the gasphase it will be oxidised in radical reaction chains to CO2 andwater, which is vital for maintaining the self cleansing ca-pacity of the atmosphere (Heard and Pilling, 2003; Lelieveldet al., 2004). In order to ascertain how well we understandthese OH initiated photochemical processes, measured am-bient OH radical concentrations from field studies are oftencompared with OH radical concentrations predicted by pho-tochemical models (e.g. Poppe et al., 1994; Hofzumahaus etal., 1996; Carslaw et al., 2002; Holland et al., 2003; Martinezet al., 2003; Olson et al., 2004; Ren et al., 2005; Ren et al.,2006; Smith et al., 2006).
The accuracy of photochemical models depends to a largeextent on how well the OH sources, OH sinks and associatedchemical mechanisms are represented. For example, if themodel predicts significantly higher OH concentrations thanthe measured OH concentrations, it could be due to an over-estimation of the OH sources and/or an underestimation ofthe OH sinks. Currently, the source term is better understood
Published by Copernicus Publications on behalf of the European Geosciences Union.
2214 V. Sinha et al.: CRM – a new tool to measure atmospheric OH Reactivity
and more readily quantified than the sink. While the sourceinvolves a limited number of reactants and rate coefficientsthat can be determined using available instruments, the sinkis dependent on a multitude of species, all of which com-pete for the available OH. An accurate sink term can con-strain models and thus clarify the possible reasons for dis-crepancies between models and measurements. AtmosphericOH is produced primarily by the photolysis of O3 with solarUV (λ≤320 nm) radiation followed by reaction of the excitedoxygen atoms (O1D) with water vapour,
O3 + hν → O2 + O(1D) (R1)
O(1D) + H2O → 2OH (R2)
The reactions of OH radicals with VOCs in the atmospherecan be summarized by the following four generalized reac-tions. In the first step, OH attacks a hydrocarbon in the pres-ence of O2,
RH + OH + O2 → RO2 + H2O (R3)
to produce water and an alkyl peroxy radical, whereR=any organic moiety.
Next, the alkyl peroxy radical may react with NO whenpresent,
RO2 + NO → RO+ NO2 (R4)
to produce an alkoxy radical that reacts with O2,
RO+ O2 → carbonyls+ HO2 (R5)
This step produces a carbonyl and HO2. Alternatively, thealkyl peroxy radicals, RO2 and HO2, may also react witheach other,
RO2 + R′O2 → peroxides, alcohols, carbonyls+ O2 (R6)
resulting in the production of peroxides, alcohols and car-bonyls, which may dissolve into the liquid phase and precip-itate out of the atmosphere or further react with OH. BothR
andR′ can be any organic moiety.Reaction (3) represents a major sink term of OH radicals in
the atmosphere, namely reaction with the generic hydrocar-bon RH. Often, the overall sink term is estimated by calcu-lating OH loss frequencies (product of concentration and ratecoefficient) for all individually measured species and sum-ming them. Thus, the OH reaction frequency (also termedOH reactivity) of a chemical is given by
OH reaction frequency of reactant
X(s−1)=k(X+OH)[X] (1)
wherek(X+OH) is the rate coefficient for the reaction ofX
with OHHowever, it is not certain whether all relevant OH reac-
tive species are measured by the suite of measurement tech-niques deployed in current field studies. Roberts et al. (1998)
and Maris et al. (2003) determined the total carbon budget ofambient VOCs, but while this information is useful for under-standing what fraction of the carbon budget remains uniden-tified by VOC measurements, it lacks the critical informationabout how reactive the missing carbon might be for chemicalreactions in the atmosphere (e.g. 10 ppbC of isoprene is notequivalent to 10 ppbC of methane for OH reactivity). Lewiset al. (2000) identified more than 500 reactive VOCs in ur-ban air using comprehensive gas chromatography and con-cluded that a large number of VOCs, particularly those withmore than 6 carbon atoms and especially aromatics, are notresolved in the more commonly employed single column gaschromatography measurements. More recently, Goldstein etal. (2004) and Holzinger et al. (2005) reported the presenceof unknown reactive biogenic compounds (up to 30 times theemission of total monoterpenes observed in the forest canopyon a molar basis), from a pine forest in California. Direct OHreactivity measurement techniques circumvent the dauntingtask of measuring all the OH reactive species individually, inorder to obtain the total OH reactivity (sink) and can evenserve as a diagnostic tool for missing reactivity due to pos-sibly unmeasured reactive species (Di Carlo et al., 2004).Additionally, OH production rates can also be estimated bysimultaneous measurements of total OH reactivity and OHconcentrations, assuming the steady state of OH using
d [OH]
d t= POH − k [OH] = 0 (2)
wherePOH andk represent the OH production rate and itsmeasured first-order decay constant, respectively. Finally, in-formation about the lifetime of OH is also easily obtained bytaking the reciprocal of the measured OH reactivity.
In the last decade, new instruments capable of directlymeasuring the OH reactivity of ambient air have been de-veloped (Kovacs and Brune, 2001; Sadanaga et al., 2004b).With some variations, all of them employ laser induced flu-orescence (LIF) to monitor the loss rate (decay) of OH radi-cals in a reactor in the presence of ambient air. While thesemeasurement systems have provided new insights on the OHreactivity budget, their cost, complexity and large size aredeterrents to their widespread deployment for field studies.Thus, other techniques capable of measuring the total OH re-activity of ambient air that are more economical and portablethan the existing LIF based method, would be a valuable ad-dition to current atmospheric measurements.
In this study, we present a new method for direct onlinemeasurements of the total OH reactivity of ambient air. Thismethod can be easily integrated with commonly employedin-situ analytical techniques such as gas chromatography andchemical ionization mass spectrometry at modest additionalcosts. Presented below is a detailed description of the gen-eral concept, the reactor design, the method validation andcalibration, choice of reagent (in this case pyrrole; C4H5N)and the detector system employed (in this case a proton trans-fer reaction mass spectrometer). First field results from the
Atmos. Chem. Phys., 8, 2213–2227, 2008 www.atmos-chem-phys.net/8/2213/2008/
V. Sinha et al.: CRM – a new tool to measure atmospheric OH Reactivity 2215
tropical rainforest in Suriname and the urban atmosphere ofMainz, Germany, are shown and potential interferences fromNO and relative humidity are investigated. Finally an outlookfor future applications of the new method is given.
2 Methodology
2.1 Concept of Comparative Reactivity Method (CRM)
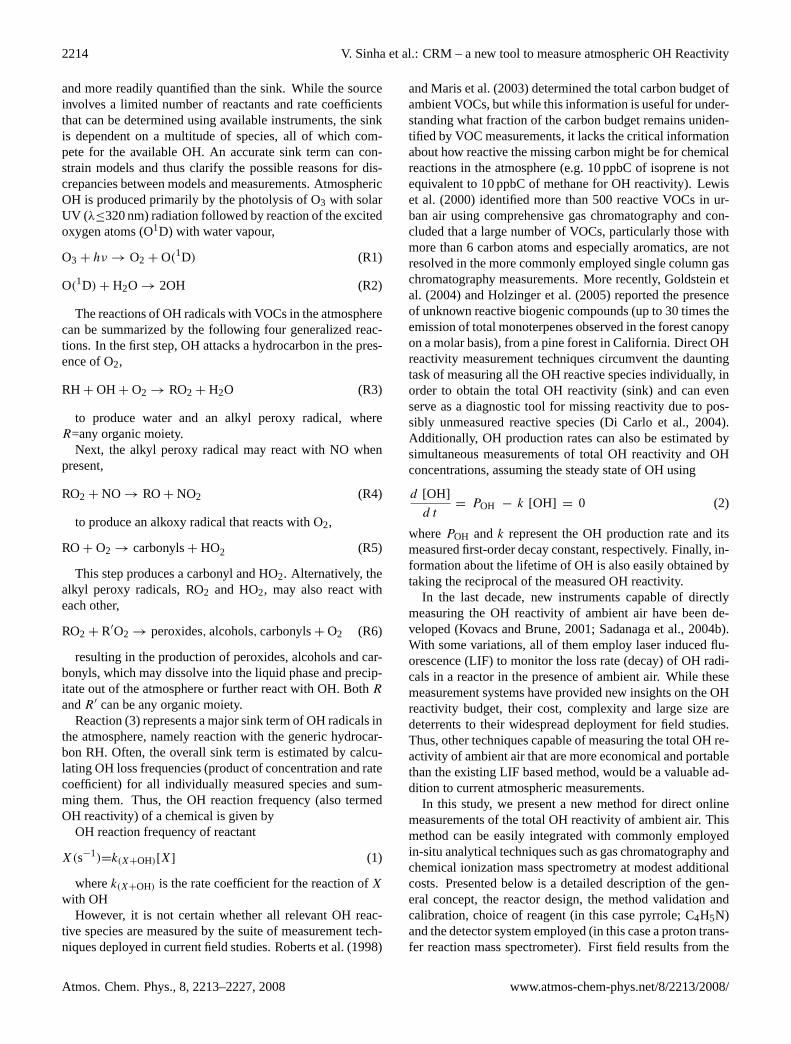
Figure 1 illustrates the general concept schematically. A re-active molecule (X), not normally present in air, is intro-duced into a glass reactor and its concentration C1 is mon-itored with a suitable detector, in the air exiting the reactor.After some time when C1 is well determined, syntheticallygenerated OH radicals (OH<[X]) are introduced into the re-actor at a constant rate to react with X. This causes C1, themonitored concentration ofX, to decrease to C2, as X reactswith the OH radicals. The decrease in the monitored concen-tration ofX (from C1 to C2) also gives the initial concentra-tion of the OH radicals, as all the OH is completely titratedby X. Next, an air sample containing reactive species is in-troduced into the glass reactor. The various species present inambient air then compete withX for the available OH radi-cals, so that the concentration ofX in the air exiting the reac-tor increases to C3. Comparing the amount ofX exiting thereactor without (C2) and with the ambient air (C3) allowsthe introduced air sample’s OH reactivity to be determinedin a quantitative manner, provided the system is suitably cal-ibrated. Some general criteria that the reagent moleculeX
must satisfy are:
1. it reacts with OH at a suitable rate so as to compete withreactive species in ambient air;
2. the rate coefficient for reaction with OH should be wellestablished;
3. it must be volatile (to make into a good bottled stan-dard);
4. it must have the necessary physical and chemical prop-erties for easy and accurate detection (without interfer-ences) using a suitable detector (e.g. the proton affinityof X should be greater than water to be detectable by aPTR-MS);
5. it should not be present in ambient air (under normalcircumstances) as this can complicate the analysis. Inthe present version of the CRM developed in Mainz, thereagent molecule X is pyrrole (C4H5N) and the detectoris a PTR-MS.
2.2 Determining OH reactivity: derivation of the basicequation for CRM
Based on competitive kinetics, an expression may be derivedfor the total OH reactivity of the analysed air sample (de-
Fig. 1. Schematic illustrating concept of the Comparative ReactivityMethod.
noted byRair) in terms of the measured pyrrole signals C1,C2 and C3 (shown in Fig. 1).
Consider the loss of OH in a two component reactive mix-ture consisting of pyrrole and air, the equations describingthe loss of OH are:
OH + pyrrole→ products (R7)
OH + air → products (R8)
leading to the rate expression
− δ[OH]/dt = kp[OH][Pyrrole] + kOH+air[OH][air] (3)
wherekp is the rate coefficient for reaction of OH withpyrrole andkOH+air is the effective rate coefficient of all re-active components in the air sample and [air] is their summedconcentration. As [pyrrole] is>[OH] the first order lossrate coefficients of OH in its reactions with pyrrole and airare given approximately byRp=kp [Pyrrole] andRair=kair[air], respectively, resulting in a total loss rate coefficient ofRp+Rair. If all OH is lost in reaction with pyrrole and air, thechange in pyrrole concentration (C1–C3) is approximatelygiven by
(C1− C3) =Rp
Rp + Rair· [OH] (4)
As discussed previously, the OH concentration is given bythe loss of pyrrole in the absence of air (C1–C2), so that:
(C1− C3) =Rp
Rp + Rair· (C1− C2) (5)
rearranging we get
Rair =
{(C1− C2)
(C1− C3)− 1
}· Rp (6)
and, equating [pyrrole] to C1,
Rair =
{(C1− C2)
(C1− C3)− 1
}· kpC1 (7)
www.atmos-chem-phys.net/8/2213/2008/ Atmos. Chem. Phys., 8, 2213–2227, 2008
2216 V. Sinha et al.: CRM – a new tool to measure atmospheric OH Reactivity
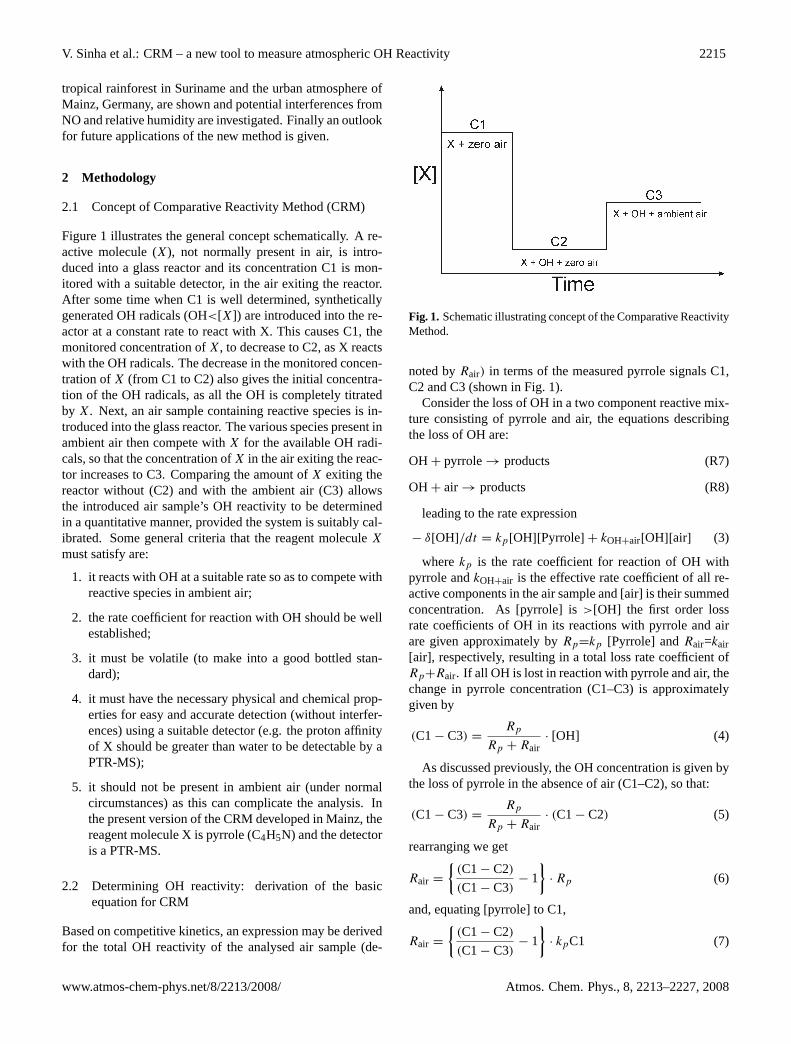
Fig. 2. Schematic of the glass reactor used in the Mainz CRM in-strument.
which is numerically equivalent to
Rair =(C3− C2)
(C1− C3)· kpC1 (8)
[OH], C1, C2 and C3 have the units of molecules cm−3 andkp has the unit of cm3 molecule−1s−1, so that the unit forRairis s−1. It should be noted that Eq. (8) assumes that mixingwithin the reactor does not favour reaction ofX with OHcompared with the reaction of ambient air with OH or viceversa. It also assumes that throughout its reactive lifetime theOH is partitioned to the pyrrole and air reactants according totheir initially available concentrations, i.e. the reaction takesplace under pseudo-first order conditions. We examine theeffect of this assumption in Sect. 4.1 when we present theresults of some numerical simulations of the reactor.
3 Experimental
The simple set up consists of a small glass reactor (wherepyrrole and ambient air/standards mix and react with OH rad-icals), a PTR-MS which detects pyrrole in the air exiting thereactor and a set of mass flow controllers along with two gasbottles (nitrogen and zero air).
3.1 Glass reactor
Figure 2 shows a diagram of the glass reactor used alongwith its inlets and outlets labelled as arms A, B, C, D and E.The length and volume of the glass reactor are approximately14 cm and 94 cm3, respectively. The typical flow rate insidethe reactor is approximately 260 ml min−1.
Gas phase pyrrole (Westfalen A.G., stated uncertainty 5%;10µmol mol−1) is mixed with zero air (Synthetic air, West-falen A.G., 99.999% purity,<0.5µmol mol−1 THC) and in-troduced through inlet A at a constant flow. Its concentra-tion is monitored in the air exiting the reactor (outlet D) witha PTR-MS. Inlet B consists of a pen ray spectral mercuryvapour lamp (L.O.T Oriel GmbH and Co. KG), over whichhumidified nitrogen/nitrogen (Westfalen A.G., 99.9999% pu-rity) is passed at a constant flow rate. The humidification isaccomplished by bubbling gaseous nitrogen through water,which is maintained at room temperature (298 K). When the
lamp is switched on, OH and H radicals are produced dueto photolysis of the water vapour (atλ=184.9 nm) presentin the humidified nitrogen. The lamp is 5 cm long and themaximum time the OH radicals spend in arm B before theyemerge into the glass reactor, is 0.6 s. This method of pro-ducing OH radicals has been used extensively in gas phasekinetic studies, including calibration of OH measurement in-struments, and for more details the reader is referred to Heardand Pilling (2003) and references therein.
The tapered arm E is a Wood’s horn which minimizes re-flection of the mercury lamp down the reactor and hencephotochemical reactions along the length of the glass re-actor. Outlet C is connected to an exhaust pump (ModelNO22AV.18, KNF Neuberger, Germany) that draws out theexcess air from the main flow. The total incoming flow rate(A+B) is circa 260 ml min−1, slightly more (∼5 ml min−1)
than the combined flow through the exhaust pump (arm C)and the PTR-MS. To prevent an over-pressure from build-ing up within the reactor, and to ensure that the pressure inthe reactor is always atmospheric pressure (760 Torr), one ofthe lines linked to arm A (with a T-shaped Teflon joint) iskept open-ended at all times. The pressure and temperatureinside the reactor are also monitored using a digital pressuremanometer (Model 13 AN, Greisinger Elektronik, Germany)and a temperature probe connected to the line exiting armC. A total of four mass flow controllers (MKS Instruments,Deutschland GmbH) are used to maintain constant flows inarm A (one each for pyrrole and zero air), arm B (one fornitrogen) and arm C (for the exhaust pump). All the gas car-rier lines leading into and from the reactor are plumbed usingshort (<1 m) 1/4 inch (0.635 cm) (outer diameter; o.d.) and1/8 inch (0.3175 cm) (o.d.) Teflon tubing.
To sample ambient air for reactivity, the zero air isswitched off and an equivalent amount (130–150 ml min−1)
of ambient air is pumped in, using a Teflon VOC samplingpump (Laboport N86-KN18; at arm A). This causes dilutionof the ambient air within the reactor, and the dilution factorhas to be taken into account when determining the total OHreactivity of the introduced ambient air. It is worth mention-ing that the ambient air is not subject to any gas chromatog-raphy column, preconcentration step or laser excitation andits reactivity is directly converted into a modulation of thepyrrole signal so that any potential losses of VOCs and/orassociated artefacts are minimised. Typical pyrrole and OHradical mixing ratios (the signal C1–C2 in Fig. 1) in the setup are∼120 nmol mol−1 (∼3.23×10¹² molecules cm−3) andup to 100 nmol mol−1 (∼2.69×10¹² molecules cm3), respec-tively.
3.2 PTR-MS: the detector
The mixing ratio of pyrrole in the air exiting the glass reactorthrough arm D was monitored using a proton transfer reac-tion mass spectrometer (PTR-MS), a device used extensivelyover the last decade to measure ambient VOCs (Lindinger et
Atmos. Chem. Phys., 8, 2213–2227, 2008 www.atmos-chem-phys.net/8/2213/2008/
V. Sinha et al.: CRM – a new tool to measure atmospheric OH Reactivity 2217
al. 1998a; de Gouw and Warneke, 2007). Within the instru-ment, organic species with a proton affinity greater than wa-ter are chemically ionised by proton transfer with H3O+ ionsand the products are detected using a quadrupole mass spec-trometer (Lindinger et al., 1998b). The entire inlet system ofthe PTR-MS including switching valves is made of Teflon.Details about the operation of the PTR-MS used here, in-cluding its mass identifications, its sensitivity and detectionlimits for masses other than pyrrole (C4H5N) are given else-where (Williams et al. 2001, Salisbury et al., 2003; Sinhaet al., 2007a). Pyrrole is detectable by the PTR-MS sinceits proton affinity (209.2 kcal mol−1) is higher than that ofwater (165.2 kcal mol−1) and the signal is observed with-out fragmentation at mass 68 (C4H5NH+). There are noknown species in ambient air that could interfere at mass68 within the PTR-MS, and experience from field campaignshas shown this mass to be stable. It is advantageous that mass68 is an even mass (pyrrole has a nitrogen atom), since mostorganic compounds detectable by PTR-MS (e.g. methanol,acetone, acetaldehyde and isoprene) are detected after pro-tonation at odd masses. Pyrrole is not normally present inambient air, and has only been observed in emission plumesfrom specific energy production processes such as coal gasi-fication and shale and coal-based oil production (Sickles etal., 1977).
Calibrations performed with custom prepared pyrrole stan-dards from Westfalen A.G. show that the protonated ion ofpyrrole (m/z=68) does not fragment within the instrumentand high mixing ratios of up to circa 250 nmol mol−1 donot significantly decrease the signal of the H3O+ reagentions. Furthermore, no significant humidity effect has beenobserved at the pyrrole signal (mass 68). The linearity of thepyrrole signal is excellent (r=0.99 between the investigatedrange of 0.5 to 250 nmol mol−1) and the total uncertaintyin the measured pyrrole signal is estimated to be 11%. Thisincludes a 5% accuracy error inherent in the pyrrole gas stan-dard and a 2σ precision error of 6%, while measuring pyrroleat 25 nmol mol−1(the typical baseline value, C2, Fig. 1). Asa detector for the CRM technique, the PTR-MS offers theadded advantage of tracking humidity changes in the air ex-iting the glass reactor (more details in Sect. 4.2.3), by mon-itoring masses 37 (cluster ion H3O+
·H2O) and 55 (clusterion H3O+
·(H2O)2), which can be used as proxies for watervapour in the air sampled by the PTR-MS. Further details ofthis approach are available in Ammann et al. (2006).
4 Results
4.1 Calibrations and method validation
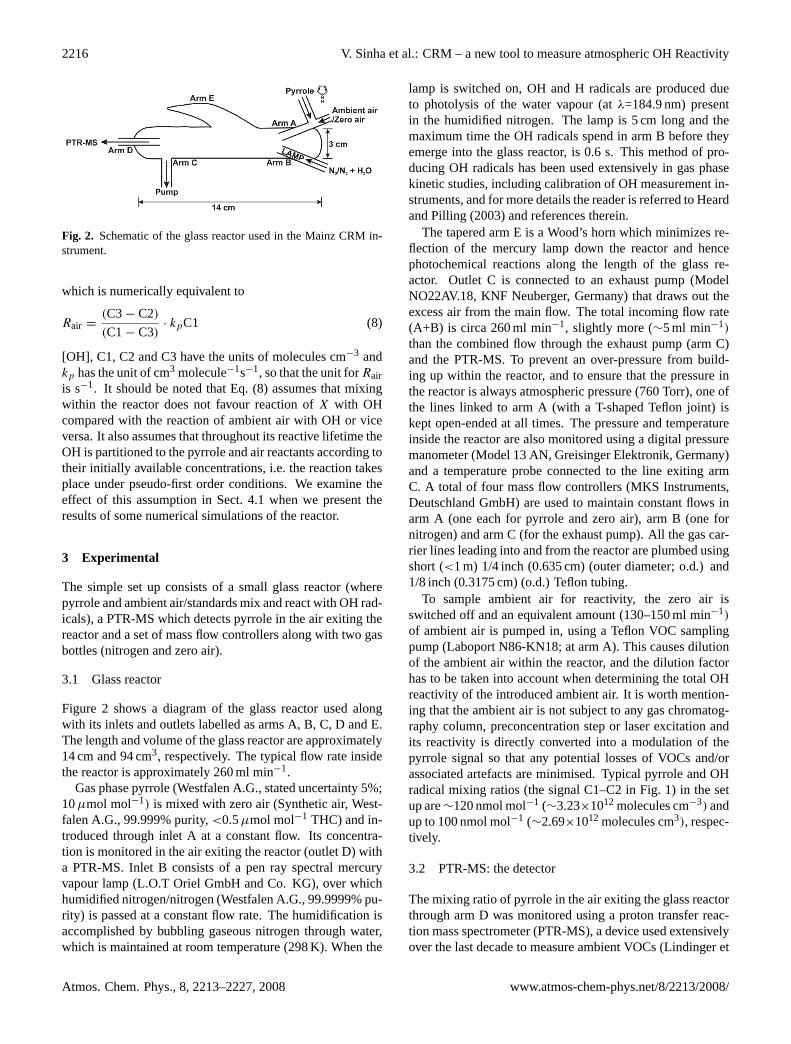
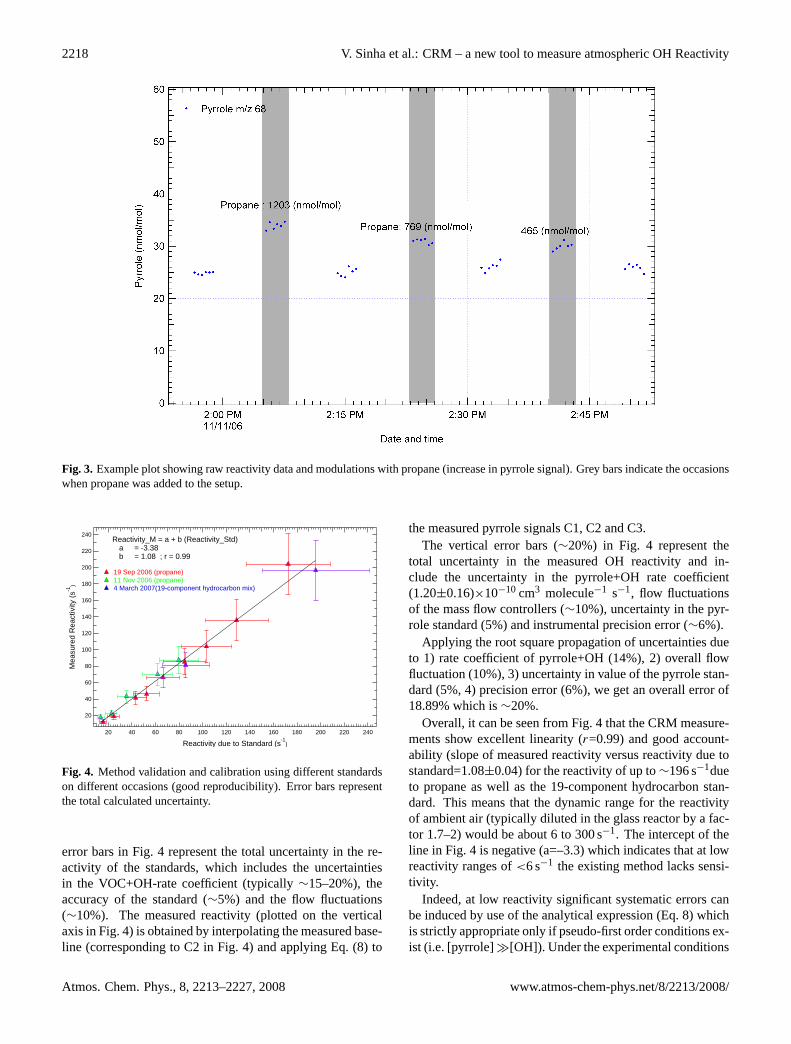
Several tests with single and mixed hydrocarbon standardswere performed to ascertain whether the Comparative Reac-tivity Method can reliably quantify samples of known OH re-activity. Figure 3 shows an example plot of the measured raw
reactivity data versus time. A propane gas standard (West-falen A.G.; 33µmol mol−1; stated uncertainty 4%) was in-troduced at different concentrations through the same linethat is used to introduce ambient air into the glass reactor.The PTR-MS is blind to propane since the proton affinityof propane is less than that of water. The occasions whenpropane was introduced are indicated by shaded areas. Ascan be seen in Fig. 3, the baseline value (corresponding toC2 in Fig. 1) of pyrrole is∼25 nmol mol−1 and after everymodulation (increase in signal corresponding to C3 in Fig. 1)with propane concentrations of 1203 nmol mol−1, 769 nmolmol−1and 465 nmol mol−1, respectively, the pyrrole signalreproducibly returns to its baseline value (from C3 to C2),within the instrumental precision error of∼6%. This showsthat the modulation (from C2 to C3) occurs due to the com-petition between propane and pyrrole for the available OHradicals. The evaluated rate coefficient for the reaction ofpropane with OH is (1.1±0.2)×10−12 cm3 molecule−1 s−1
(Atkinson et al., 2007). Using Eq. (1), the reactivities due tothe propane amounts shown in Fig. 3, were calculated to be∼35.3 s−1, 22.5 s−1 and 13.6 s−1, respectively. The breaks inthe data plot in Fig. 3 correspond to periods where the instru-mental background was measured. The background signal iscollected by passing the sampled air over a Pt catalyst kept at350◦C to oxidize all the organics. This enables correction forthe noise at the measured masses and results in more accuratequantification.
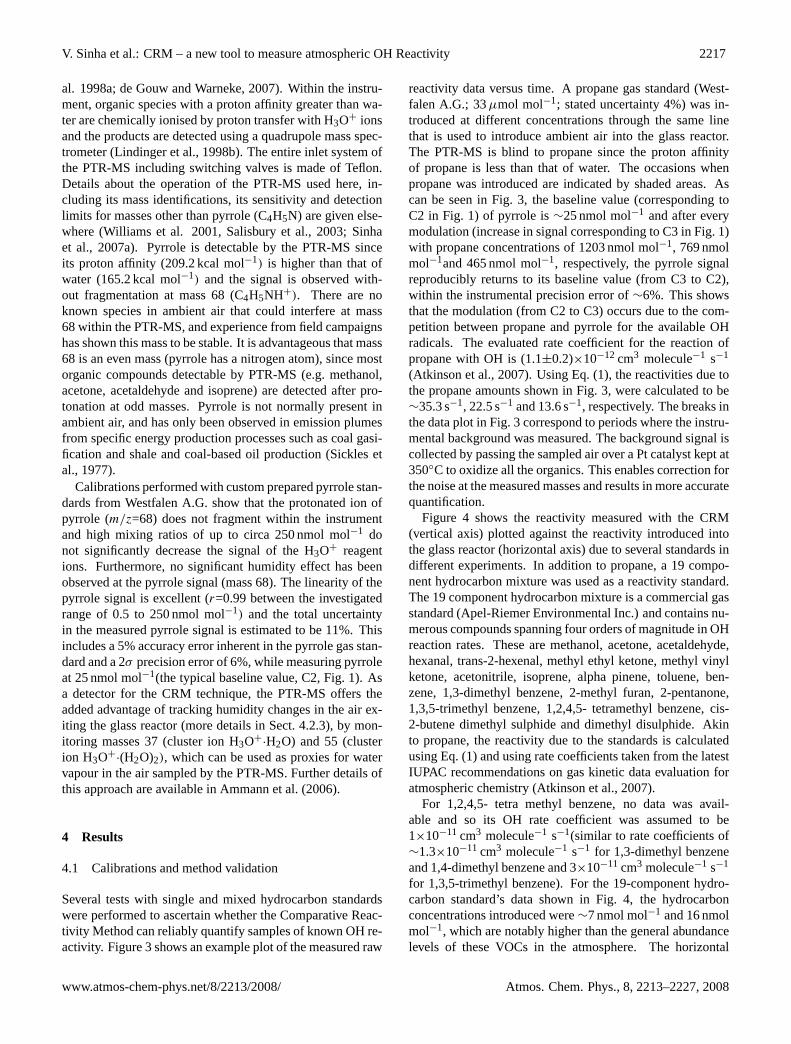
Figure 4 shows the reactivity measured with the CRM(vertical axis) plotted against the reactivity introduced intothe glass reactor (horizontal axis) due to several standards indifferent experiments. In addition to propane, a 19 compo-nent hydrocarbon mixture was used as a reactivity standard.The 19 component hydrocarbon mixture is a commercial gasstandard (Apel-Riemer Environmental Inc.) and contains nu-merous compounds spanning four orders of magnitude in OHreaction rates. These are methanol, acetone, acetaldehyde,hexanal, trans-2-hexenal, methyl ethyl ketone, methyl vinylketone, acetonitrile, isoprene, alpha pinene, toluene, ben-zene, 1,3-dimethyl benzene, 2-methyl furan, 2-pentanone,1,3,5-trimethyl benzene, 1,2,4,5- tetramethyl benzene, cis-2-butene dimethyl sulphide and dimethyl disulphide. Akinto propane, the reactivity due to the standards is calculatedusing Eq. (1) and using rate coefficients taken from the latestIUPAC recommendations on gas kinetic data evaluation foratmospheric chemistry (Atkinson et al., 2007).
For 1,2,4,5- tetra methyl benzene, no data was avail-able and so its OH rate coefficient was assumed to be1×10−11 cm3 molecule−1 s−1(similar to rate coefficients of∼1.3×10⁻¹¹ cm3 molecule−1 s−1 for 1,3-dimethyl benzeneand 1,4-dimethyl benzene and 3×10⁻¹¹ cm3 molecule−1 s−1
for 1,3,5-trimethyl benzene). For the 19-component hydro-carbon standard’s data shown in Fig. 4, the hydrocarbonconcentrations introduced were∼7 nmol mol−1 and 16 nmolmol−1, which are notably higher than the general abundancelevels of these VOCs in the atmosphere. The horizontal
www.atmos-chem-phys.net/8/2213/2008/ Atmos. Chem. Phys., 8, 2213–2227, 2008
2218 V. Sinha et al.: CRM – a new tool to measure atmospheric OH Reactivity
Fig. 3. Example plot showing raw reactivity data and modulations with propane (increase in pyrrole signal). Grey bars indicate the occasionswhen propane was added to the setup.
240
220
200
180
160
140
120
100
80
60
40
20
Mea
sure
d R
eact
ivity
(s-1
)
24022020018016014012010080604020
Reactivity due to Standard (s-1
)
19 Sep 2006 (propane)11 Nov 2006 (propane)4 March 2007(19-component hydrocarbon mix)
Reactivity_M = a + b (Reactivity_Std) a = -3.38 b = 1.08 ; r = 0.99
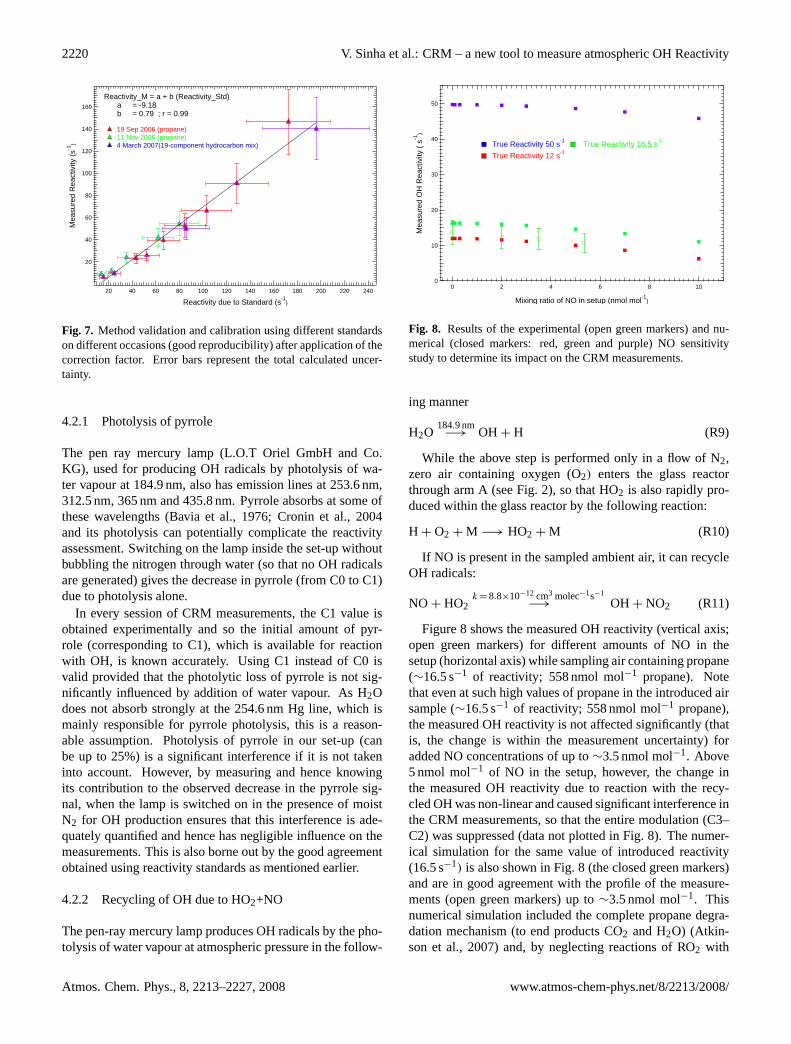
Fig. 4. Method validation and calibration using different standardson different occasions (good reproducibility). Error bars representthe total calculated uncertainty.
error bars in Fig. 4 represent the total uncertainty in the re-activity of the standards, which includes the uncertaintiesin the VOC+OH-rate coefficient (typically∼15–20%), theaccuracy of the standard (∼5%) and the flow fluctuations(∼10%). The measured reactivity (plotted on the verticalaxis in Fig. 4) is obtained by interpolating the measured base-line (corresponding to C2 in Fig. 4) and applying Eq. (8) to
the measured pyrrole signals C1, C2 and C3.The vertical error bars (∼20%) in Fig. 4 represent the
total uncertainty in the measured OH reactivity and in-clude the uncertainty in the pyrrole+OH rate coefficient(1.20±0.16)×10−10 cm3 molecule−1 s−1, flow fluctuationsof the mass flow controllers (∼10%), uncertainty in the pyr-role standard (5%) and instrumental precision error (∼6%).
Applying the root square propagation of uncertainties dueto 1) rate coefficient of pyrrole+OH (14%), 2) overall flowfluctuation (10%), 3) uncertainty in value of the pyrrole stan-dard (5%, 4) precision error (6%), we get an overall error of18.89% which is∼20%.
Overall, it can be seen from Fig. 4 that the CRM measure-ments show excellent linearity (r=0.99) and good account-ability (slope of measured reactivity versus reactivity due tostandard=1.08±0.04) for the reactivity of up to∼196 s−1dueto propane as well as the 19-component hydrocarbon stan-dard. This means that the dynamic range for the reactivityof ambient air (typically diluted in the glass reactor by a fac-tor 1.7–2) would be about 6 to 300 s−1. The intercept of theline in Fig. 4 is negative (a=–3.3) which indicates that at lowreactivity ranges of<6 s−1 the existing method lacks sensi-tivity.
Indeed, at low reactivity significant systematic errors canbe induced by use of the analytical expression (Eq. 8) whichis strictly appropriate only if pseudo-first order conditions ex-ist (i.e. [pyrrole]�[OH]). Under the experimental conditions
Atmos. Chem. Phys., 8, 2213–2227, 2008 www.atmos-chem-phys.net/8/2213/2008/

V. Sinha et al.: CRM – a new tool to measure atmospheric OH Reactivity 2219
200
180
160
140
120
100
80
60
40
20
0
Req
n (s
-1)
140120100806040200
Rtrue (s-1)
y = 1.05 x - 0.15 ; r= 0.99 Pyrrole/OH ratio = 10
y = 3.16 x0.84
- 2.55 Pyrrole/OH ratio = 1.22
Fig. 5. Plots showing relation betweenReqnandRtrue for numericalsimulations at [pyrrole]/[OH] ratios of 10 (purple markers) and 1.22(green markers).
here a significant depletion of pyrrole was however neces-sary in order to make accurate measurement of C2 feasi-ble. In fact, even under near pseudo first order conditions([Pyrrole]/[OH] ratio=10), for sample air having 5 s−1 OHrate reactivity and OH radical concentration in the set up of∼2.7×10¹¹ molecules cm−3, one would have to measure amodulation of 0.2 nmol mol−1 on a baseline (C2) pyrrolesignal of 1µmol mol−1, which is not possible with a PTR-MS. Only the initial flux of OH to either pyrrole or air isadequately described by Eq. (8), but the integrated flux toboth reactants (i.e. over the entire reaction time for OH) maydeviate from this if the two pools of reactants (i.e. pyrroleversus air) are depleted at different rates. In order to investi-gate this, simple numerical simulations (Curtis et al.,1988)were carried out in which an initial concentration of OH(2.7×10¹² molecules cm−3) was allowed to react firstly withpyrrole only and then with pyrrole and a hydrocarbon witha rate coefficient of 2×10⁻¹³ at different concentrations, togive OH reactivity between 5 and 150 s−1. Considering thedilution factor for ambient air in the set up, this would corre-spond to a reactivity range of about 8 to 300 s−1 for ambientair sampling.
The results are summarised in Fig. 5 which plots the re-activity, Reqn, obtained by applying Eq. (8) to the numer-ical simulations of the pyrrole concentration (C2 and C3)after OH had reacted to zero, versus the true reactivity,Rtrue (derived from kRH. [RH]; Eq. 1). Two scenarioswere considered, one approaching pseudo-first order condi-tions with [pyrrole]/[OH]=10 and the second one with [pyr-role]/[OH]=1.22. The simulations for near-pseudo-first orderconditions (see Fig. 5) provide confirmation of the analyticalexpression used and return a slope of 1.05. Note that the re-lationship betweenReqn andRtrue is however not perfectlylinear, with a maximum deviation of 6%. For the case where[pyrrole]/[OH]=1.22 (also shown in Fig. 5), which is more
160
140
120
100
80
60
40
20
Rtr
ue (s
-1)
200180160140120100806040200
Reqn (s-1)
y = 0.262 x1.188
+ 1.234
Pyrrole/OH ratio = 1.22
Fig. 6. Plot showing the fitting function obtained betweenRtrue andReqnat [pyrrole]/[OH] ratio of 1.22 (the experimental conditions).
relevant for the experiments described here, we obtain thefollowing fitting function:
Reqn = 3.16× R0.84true − 2.55 (9)
This shows that using Eq. (8) under the conditions of [pyr-role]/[OH]=1.22, may cause the measurements to overesti-mate the OH reactivity of the analyzed air sample, especiallyat lower ranges of OH reactivity. Also, in the real experimentthis curvature would not have been observed (e.g. Fig. 4).Nevertheless, as the [pyrrole]/[OH] ratio is known from theexperiments (C1/C1–C2), this simple analysis does enable acorrection factor to be derived for the measured data. Forconditions typical of the present set of experiments, the cor-rection factor is easily obtained by plottingRtrue versusReqnas shown in Fig. 6, and we obtain the following correctionfactor:
Rtrue = 0.26R1.19eqn + 1.2 (10)
Applying Eq. (10) to the measured reactivity data in thecalibration plot of Fig. 4, we obtain a line with a slope of0.79±0.03 (as shown in Fig. 7). From Fig. 7, it is again obvi-ous that the OH reactivity measured by the CRM accounts forthe introduced air sample’s OH reactivity, within the overalluncertainty of the measurement (20%). For all measured OHreactivity data shown hereafter, the correction factor (Eq. 10),has already been applied.
4.2 Investigation of possible interferences
Three main potential interferences have been identified whileoperating the Comparative Reactivity Method in its presentconfiguration. These are: photolysis of pyrrole; recyclingof OH at high NO due to the NO+HO2 reaction; and dras-tic changes in the relative humidity within the set-up whenambient air is sampled. A detailed discussion of each is pre-sented in the following sub-sections.
www.atmos-chem-phys.net/8/2213/2008/ Atmos. Chem. Phys., 8, 2213–2227, 2008
2220 V. Sinha et al.: CRM – a new tool to measure atmospheric OH Reactivity
160
140
120
100
80
60
40
20
Mea
sure
d R
eact
ivity
(s-1
)
24022020018016014012010080604020
Reactivity due to Standard (s-1
)
Reactivity_M = a + b (Reactivity_Std) a = -9.18 b = 0.79 ; r = 0.99
19 Sep 2006 (propane)11 Nov 2006 (propane)4 March 2007(19-component hydrocarbon mix)
Fig. 7. Method validation and calibration using different standardson different occasions (good reproducibility) after application of thecorrection factor. Error bars represent the total calculated uncer-tainty.
4.2.1 Photolysis of pyrrole
The pen ray mercury lamp (L.O.T Oriel GmbH and Co.KG), used for producing OH radicals by photolysis of wa-ter vapour at 184.9 nm, also has emission lines at 253.6 nm,312.5 nm, 365 nm and 435.8 nm. Pyrrole absorbs at some ofthese wavelengths (Bavia et al., 1976; Cronin et al., 2004and its photolysis can potentially complicate the reactivityassessment. Switching on the lamp inside the set-up withoutbubbling the nitrogen through water (so that no OH radicalsare generated) gives the decrease in pyrrole (from C0 to C1)due to photolysis alone.
In every session of CRM measurements, the C1 value isobtained experimentally and so the initial amount of pyr-role (corresponding to C1), which is available for reactionwith OH, is known accurately. Using C1 instead of C0 isvalid provided that the photolytic loss of pyrrole is not sig-nificantly influenced by addition of water vapour. As H2Odoes not absorb strongly at the 254.6 nm Hg line, which ismainly responsible for pyrrole photolysis, this is a reason-able assumption. Photolysis of pyrrole in our set-up (canbe up to 25%) is a significant interference if it is not takeninto account. However, by measuring and hence knowingits contribution to the observed decrease in the pyrrole sig-nal, when the lamp is switched on in the presence of moistN2 for OH production ensures that this interference is ade-quately quantified and hence has negligible influence on themeasurements. This is also borne out by the good agreementobtained using reactivity standards as mentioned earlier.
4.2.2 Recycling of OH due to HO2+NO
The pen-ray mercury lamp produces OH radicals by the pho-tolysis of water vapour at atmospheric pressure in the follow-
50
40
30
20
10
0
Mea
sure
d O
H R
eact
ivity
( s
-1)
1086420
Mixing ratio of NO in setup (nmol mol-1
)
True Reactivity 50 s-1
True Reactivity 16.5 s-1
True Reactivity 12 s-1
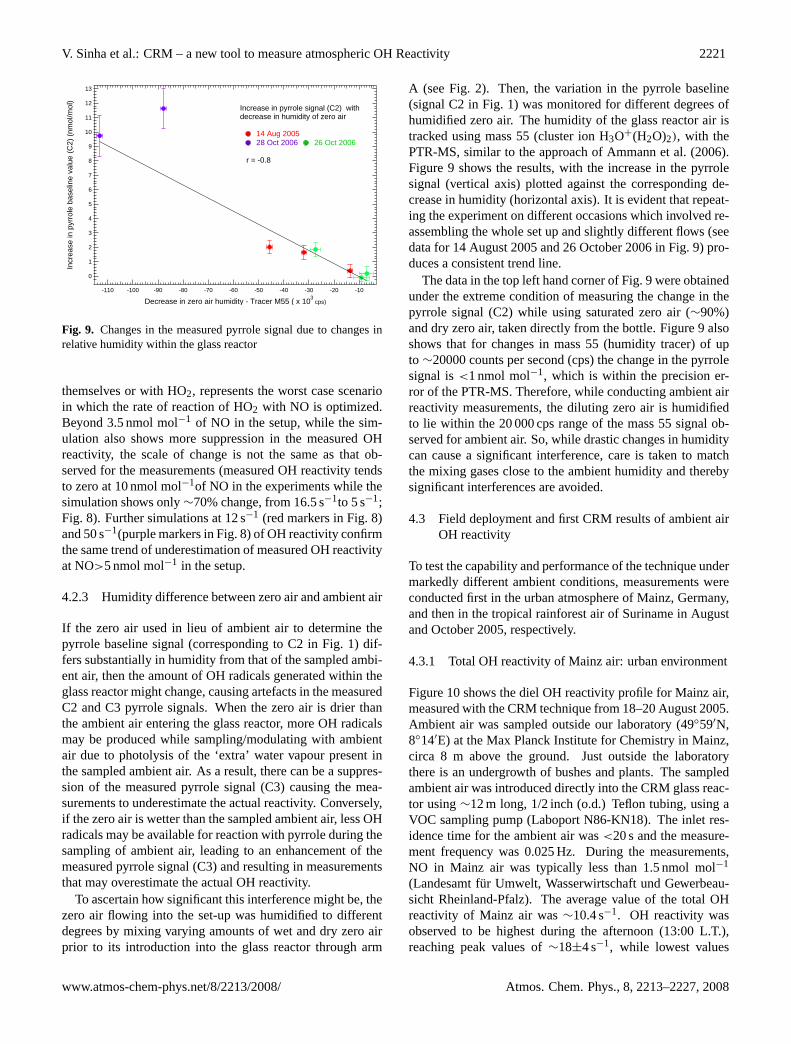
Fig. 8. Results of the experimental (open green markers) and nu-merical (closed markers: red, green and purple) NO sensitivitystudy to determine its impact on the CRM measurements.
ing manner
H2O184.9 nm−→ OH + H (R9)
While the above step is performed only in a flow of N2,zero air containing oxygen (O2) enters the glass reactorthrough arm A (see Fig. 2), so that HO2 is also rapidly pro-duced within the glass reactor by the following reaction:
H + O2 + M −→ HO2 + M (R10)
If NO is present in the sampled ambient air, it can recycleOH radicals:
NO + HO2k = 8.8×10⁻¹² cm3 molec−1s−1
−→ OH + NO2 (R11)
Figure 8 shows the measured OH reactivity (vertical axis;open green markers) for different amounts of NO in thesetup (horizontal axis) while sampling air containing propane(∼16.5 s−1 of reactivity; 558 nmol mol−1 propane). Notethat even at such high values of propane in the introduced airsample (∼16.5 s−1 of reactivity; 558 nmol mol−1 propane),the measured OH reactivity is not affected significantly (thatis, the change is within the measurement uncertainty) foradded NO concentrations of up to∼3.5 nmol mol−1. Above5 nmol mol−1 of NO in the setup, however, the change inthe measured OH reactivity due to reaction with the recy-cled OH was non-linear and caused significant interference inthe CRM measurements, so that the entire modulation (C3–C2) was suppressed (data not plotted in Fig. 8). The numer-ical simulation for the same value of introduced reactivity(16.5 s−1) is also shown in Fig. 8 (the closed green markers)and are in good agreement with the profile of the measure-ments (open green markers) up to∼3.5 nmol mol−1. Thisnumerical simulation included the complete propane degra-dation mechanism (to end products CO2 and H2O) (Atkin-son et al., 2007) and, by neglecting reactions of RO2 with
Atmos. Chem. Phys., 8, 2213–2227, 2008 www.atmos-chem-phys.net/8/2213/2008/
V. Sinha et al.: CRM – a new tool to measure atmospheric OH Reactivity 2221
13
12
11
10
9
8
7
6
5
4
3
2
1
0
Incr
ease
in p
yrro
le b
asel
ine
valu
e (C
2) (
nmol
/mol
)
-110 -100 -90 -80 -70 -60 -50 -40 -30 -20 -10
Decrease in zero air humidity - Tracer M55 ( x 103 cps)
Increase in pyrrole signal (C2) with decrease in humidity of zero air
14 Aug 200528 Oct 2006 26 Oct 2006
r = -0.8
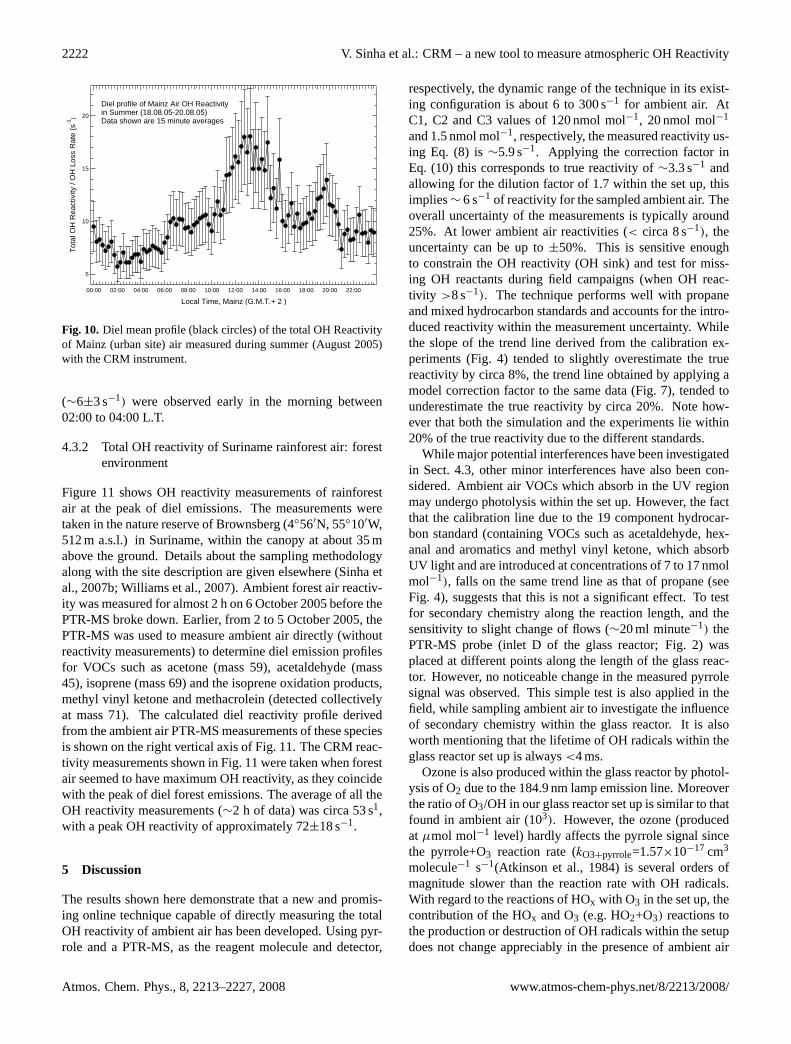
Fig. 9. Changes in the measured pyrrole signal due to changes inrelative humidity within the glass reactor
themselves or with HO2, represents the worst case scenarioin which the rate of reaction of HO2 with NO is optimized.Beyond 3.5 nmol mol−1 of NO in the setup, while the sim-ulation also shows more suppression in the measured OHreactivity, the scale of change is not the same as that ob-served for the measurements (measured OH reactivity tendsto zero at 10 nmol mol−1of NO in the experiments while thesimulation shows only∼70% change, from 16.5 s−1to 5 s−1;Fig. 8). Further simulations at 12 s−1 (red markers in Fig. 8)and 50 s−1(purple markers in Fig. 8) of OH reactivity confirmthe same trend of underestimation of measured OH reactivityat NO>5 nmol mol−1 in the setup.
4.2.3 Humidity difference between zero air and ambient air
If the zero air used in lieu of ambient air to determine thepyrrole baseline signal (corresponding to C2 in Fig. 1) dif-fers substantially in humidity from that of the sampled ambi-ent air, then the amount of OH radicals generated within theglass reactor might change, causing artefacts in the measuredC2 and C3 pyrrole signals. When the zero air is drier thanthe ambient air entering the glass reactor, more OH radicalsmay be produced while sampling/modulating with ambientair due to photolysis of the ‘extra’ water vapour present inthe sampled ambient air. As a result, there can be a suppres-sion of the measured pyrrole signal (C3) causing the mea-surements to underestimate the actual reactivity. Conversely,if the zero air is wetter than the sampled ambient air, less OHradicals may be available for reaction with pyrrole during thesampling of ambient air, leading to an enhancement of themeasured pyrrole signal (C3) and resulting in measurementsthat may overestimate the actual OH reactivity.
To ascertain how significant this interference might be, thezero air flowing into the set-up was humidified to differentdegrees by mixing varying amounts of wet and dry zero airprior to its introduction into the glass reactor through arm
A (see Fig. 2). Then, the variation in the pyrrole baseline(signal C2 in Fig. 1) was monitored for different degrees ofhumidified zero air. The humidity of the glass reactor air istracked using mass 55 (cluster ion H3O+(H2O)2), with thePTR-MS, similar to the approach of Ammann et al. (2006).Figure 9 shows the results, with the increase in the pyrrolesignal (vertical axis) plotted against the corresponding de-crease in humidity (horizontal axis). It is evident that repeat-ing the experiment on different occasions which involved re-assembling the whole set up and slightly different flows (seedata for 14 August 2005 and 26 October 2006 in Fig. 9) pro-duces a consistent trend line.
The data in the top left hand corner of Fig. 9 were obtainedunder the extreme condition of measuring the change in thepyrrole signal (C2) while using saturated zero air (∼90%)and dry zero air, taken directly from the bottle. Figure 9 alsoshows that for changes in mass 55 (humidity tracer) of upto ∼20000 counts per second (cps) the change in the pyrrolesignal is<1 nmol mol−1, which is within the precision er-ror of the PTR-MS. Therefore, while conducting ambient airreactivity measurements, the diluting zero air is humidifiedto lie within the 20 000 cps range of the mass 55 signal ob-served for ambient air. So, while drastic changes in humiditycan cause a significant interference, care is taken to matchthe mixing gases close to the ambient humidity and therebysignificant interferences are avoided.
4.3 Field deployment and first CRM results of ambient airOH reactivity
To test the capability and performance of the technique undermarkedly different ambient conditions, measurements wereconducted first in the urban atmosphere of Mainz, Germany,and then in the tropical rainforest air of Suriname in Augustand October 2005, respectively.
4.3.1 Total OH reactivity of Mainz air: urban environment
Figure 10 shows the diel OH reactivity profile for Mainz air,measured with the CRM technique from 18–20 August 2005.Ambient air was sampled outside our laboratory (49◦59′N,8◦14′E) at the Max Planck Institute for Chemistry in Mainz,circa 8 m above the ground. Just outside the laboratorythere is an undergrowth of bushes and plants. The sampledambient air was introduced directly into the CRM glass reac-tor using∼12 m long, 1/2 inch (o.d.) Teflon tubing, using aVOC sampling pump (Laboport N86-KN18). The inlet res-idence time for the ambient air was<20 s and the measure-ment frequency was 0.025 Hz. During the measurements,NO in Mainz air was typically less than 1.5 nmol mol−1
(Landesamt f̈ur Umwelt, Wasserwirtschaft und Gewerbeau-sicht Rheinland-Pfalz). The average value of the total OHreactivity of Mainz air was∼10.4 s−1. OH reactivity wasobserved to be highest during the afternoon (13:00 L.T.),reaching peak values of∼18±4 s−1, while lowest values
www.atmos-chem-phys.net/8/2213/2008/ Atmos. Chem. Phys., 8, 2213–2227, 2008
2222 V. Sinha et al.: CRM – a new tool to measure atmospheric OH Reactivity
20
15
10
5
Tot
al O
H R
eact
ivity
/ O
H L
oss
Rat
e (s
-1)
00:00 02:00 04:00 06:00 08:00 10:00 12:00 14:00 16:00 18:00 20:00 22:00
Local Time, Mainz (G.M.T.+ 2 )
Diel profile of Mainz Air OH Reactivityin Summer (18.08.05-20.08.05)Data shown are 15 minute averages
Fig. 10.Diel mean profile (black circles) of the total OH Reactivityof Mainz (urban site) air measured during summer (August 2005)with the CRM instrument.
(∼6±3 s−1) were observed early in the morning between02:00 to 04:00 L.T.
4.3.2 Total OH reactivity of Suriname rainforest air: forestenvironment
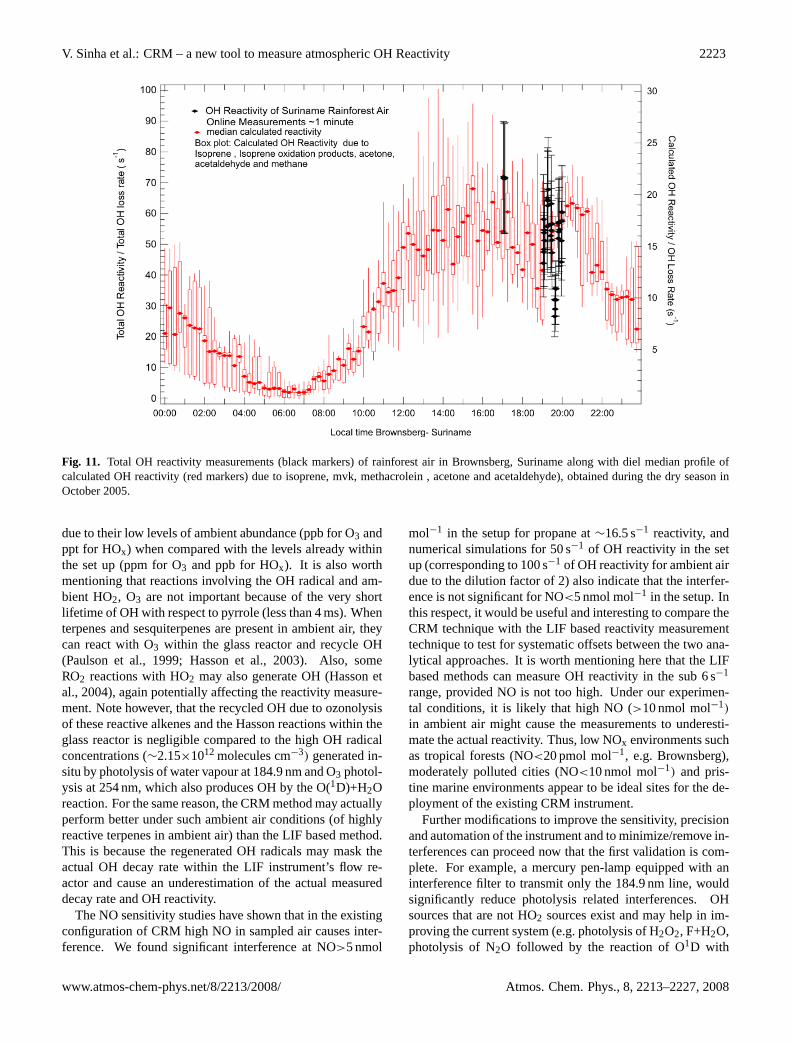
Figure 11 shows OH reactivity measurements of rainforestair at the peak of diel emissions. The measurements weretaken in the nature reserve of Brownsberg (4◦56′N, 55◦10′W,512 m a.s.l.) in Suriname, within the canopy at about 35 mabove the ground. Details about the sampling methodologyalong with the site description are given elsewhere (Sinha etal., 2007b; Williams et al., 2007). Ambient forest air reactiv-ity was measured for almost 2 h on 6 October 2005 before thePTR-MS broke down. Earlier, from 2 to 5 October 2005, thePTR-MS was used to measure ambient air directly (withoutreactivity measurements) to determine diel emission profilesfor VOCs such as acetone (mass 59), acetaldehyde (mass45), isoprene (mass 69) and the isoprene oxidation products,methyl vinyl ketone and methacrolein (detected collectivelyat mass 71). The calculated diel reactivity profile derivedfrom the ambient air PTR-MS measurements of these speciesis shown on the right vertical axis of Fig. 11. The CRM reac-tivity measurements shown in Fig. 11 were taken when forestair seemed to have maximum OH reactivity, as they coincidewith the peak of diel forest emissions. The average of all theOH reactivity measurements (∼2 h of data) was circa 53 s1,with a peak OH reactivity of approximately 72±18 s−1.
5 Discussion
The results shown here demonstrate that a new and promis-ing online technique capable of directly measuring the totalOH reactivity of ambient air has been developed. Using pyr-role and a PTR-MS, as the reagent molecule and detector,
respectively, the dynamic range of the technique in its exist-ing configuration is about 6 to 300 s−1 for ambient air. AtC1, C2 and C3 values of 120 nmol mol−1, 20 nmol mol−1
and 1.5 nmol mol−1, respectively, the measured reactivity us-ing Eq. (8) is∼5.9 s−1. Applying the correction factor inEq. (10) this corresponds to true reactivity of∼3.3 s−1 andallowing for the dilution factor of 1.7 within the set up, thisimplies∼ 6 s−1 of reactivity for the sampled ambient air. Theoverall uncertainty of the measurements is typically around25%. At lower ambient air reactivities (< circa 8 s−1), theuncertainty can be up to±50%. This is sensitive enoughto constrain the OH reactivity (OH sink) and test for miss-ing OH reactants during field campaigns (when OH reac-tivity >8 s−1). The technique performs well with propaneand mixed hydrocarbon standards and accounts for the intro-duced reactivity within the measurement uncertainty. Whilethe slope of the trend line derived from the calibration ex-periments (Fig. 4) tended to slightly overestimate the truereactivity by circa 8%, the trend line obtained by applying amodel correction factor to the same data (Fig. 7), tended tounderestimate the true reactivity by circa 20%. Note how-ever that both the simulation and the experiments lie within20% of the true reactivity due to the different standards.
While major potential interferences have been investigatedin Sect. 4.3, other minor interferences have also been con-sidered. Ambient air VOCs which absorb in the UV regionmay undergo photolysis within the set up. However, the factthat the calibration line due to the 19 component hydrocar-bon standard (containing VOCs such as acetaldehyde, hex-anal and aromatics and methyl vinyl ketone, which absorbUV light and are introduced at concentrations of 7 to 17 nmolmol−1), falls on the same trend line as that of propane (seeFig. 4), suggests that this is not a significant effect. To testfor secondary chemistry along the reaction length, and thesensitivity to slight change of flows (∼20 ml minute−1) thePTR-MS probe (inlet D of the glass reactor; Fig. 2) wasplaced at different points along the length of the glass reac-tor. However, no noticeable change in the measured pyrrolesignal was observed. This simple test is also applied in thefield, while sampling ambient air to investigate the influenceof secondary chemistry within the glass reactor. It is alsoworth mentioning that the lifetime of OH radicals within theglass reactor set up is always<4 ms.
Ozone is also produced within the glass reactor by photol-ysis of O2 due to the 184.9 nm lamp emission line. Moreoverthe ratio of O3/OH in our glass reactor set up is similar to thatfound in ambient air (103). However, the ozone (producedat µmol mol−1 level) hardly affects the pyrrole signal sincethe pyrrole+O3 reaction rate (kO3+pyrrole=1.57×10⁻¹⁷ cm3
molecule−1 s−1(Atkinson et al., 1984) is several orders ofmagnitude slower than the reaction rate with OH radicals.With regard to the reactions of HOx with O3 in the set up, thecontribution of the HOx and O3 (e.g. HO2+O3) reactions tothe production or destruction of OH radicals within the setupdoes not change appreciably in the presence of ambient air
Atmos. Chem. Phys., 8, 2213–2227, 2008 www.atmos-chem-phys.net/8/2213/2008/
V. Sinha et al.: CRM – a new tool to measure atmospheric OH Reactivity 2223
Fig. 11. Total OH reactivity measurements (black markers) of rainforest air in Brownsberg, Suriname along with diel median profile ofcalculated OH reactivity (red markers) due to isoprene, mvk, methacrolein , acetone and acetaldehyde), obtained during the dry season inOctober 2005.
due to their low levels of ambient abundance (ppb for O3 andppt for HOx) when compared with the levels already withinthe set up (ppm for O3 and ppb for HOx). It is also worthmentioning that reactions involving the OH radical and am-bient HO2, O3 are not important because of the very shortlifetime of OH with respect to pyrrole (less than 4 ms). Whenterpenes and sesquiterpenes are present in ambient air, theycan react with O3 within the glass reactor and recycle OH(Paulson et al., 1999; Hasson et al., 2003). Also, someRO2 reactions with HO2 may also generate OH (Hasson etal., 2004), again potentially affecting the reactivity measure-ment. Note however, that the recycled OH due to ozonolysisof these reactive alkenes and the Hasson reactions within theglass reactor is negligible compared to the high OH radicalconcentrations (∼2.15×10¹² molecules cm−3) generated in-situ by photolysis of water vapour at 184.9 nm and O3 photol-ysis at 254 nm, which also produces OH by the O(1D)+H2Oreaction. For the same reason, the CRM method may actuallyperform better under such ambient air conditions (of highlyreactive terpenes in ambient air) than the LIF based method.This is because the regenerated OH radicals may mask theactual OH decay rate within the LIF instrument’s flow re-actor and cause an underestimation of the actual measureddecay rate and OH reactivity.
The NO sensitivity studies have shown that in the existingconfiguration of CRM high NO in sampled air causes inter-ference. We found significant interference at NO>5 nmol
mol−1 in the setup for propane at∼16.5 s−1 reactivity, andnumerical simulations for 50 s−1 of OH reactivity in the setup (corresponding to 100 s−1 of OH reactivity for ambient airdue to the dilution factor of 2) also indicate that the interfer-ence is not significant for NO<5 nmol mol−1 in the setup. Inthis respect, it would be useful and interesting to compare theCRM technique with the LIF based reactivity measurementtechnique to test for systematic offsets between the two ana-lytical approaches. It is worth mentioning here that the LIFbased methods can measure OH reactivity in the sub 6 s−1
range, provided NO is not too high. Under our experimen-tal conditions, it is likely that high NO (>10 nmol mol−1)
in ambient air might cause the measurements to underesti-mate the actual reactivity. Thus, low NOx environments suchas tropical forests (NO<20 pmol mol−1, e.g. Brownsberg),moderately polluted cities (NO<10 nmol mol−1) and pris-tine marine environments appear to be ideal sites for the de-ployment of the existing CRM instrument.
Further modifications to improve the sensitivity, precisionand automation of the instrument and to minimize/remove in-terferences can proceed now that the first validation is com-plete. For example, a mercury pen-lamp equipped with aninterference filter to transmit only the 184.9 nm line, wouldsignificantly reduce photolysis related interferences. OHsources that are not HO2 sources exist and may help in im-proving the current system (e.g. photolysis of H2O2, F+H2O,photolysis of N2O followed by the reaction of O1D with
www.atmos-chem-phys.net/8/2213/2008/ Atmos. Chem. Phys., 8, 2213–2227, 2008
2224 V. Sinha et al.: CRM – a new tool to measure atmospheric OH Reactivity
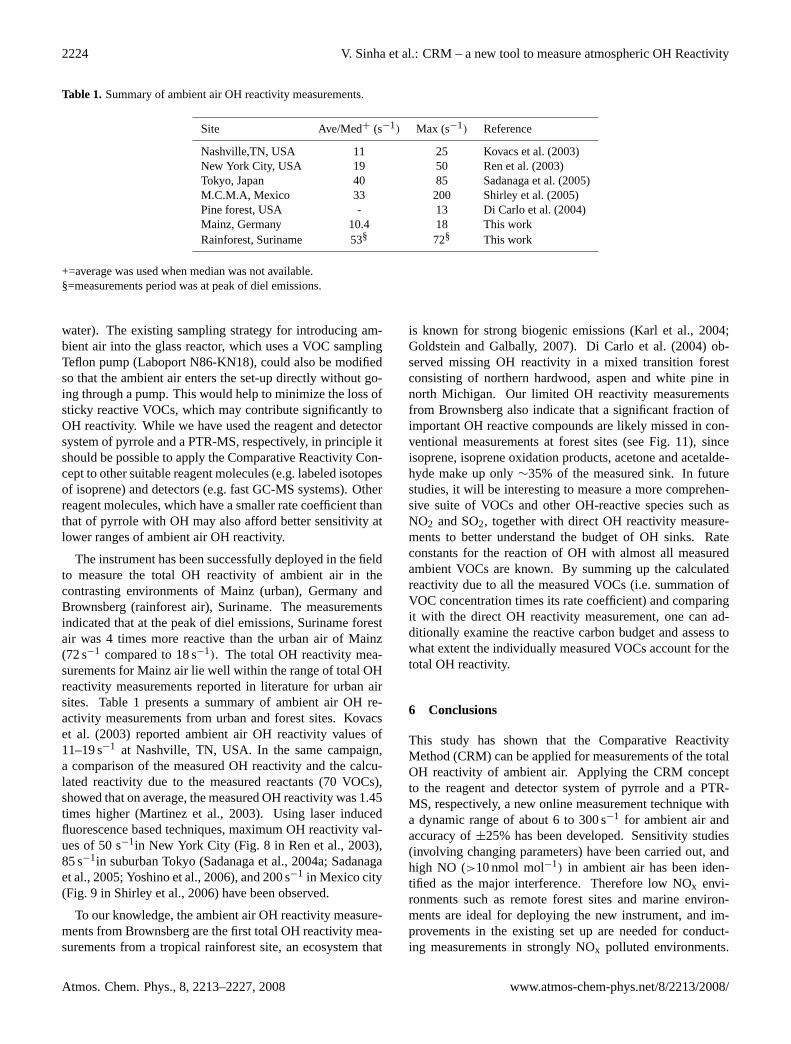
Table 1. Summary of ambient air OH reactivity measurements.
Site Ave/Med+ (s−1) Max (s−1) Reference
Nashville,TN, USA 11 25 Kovacs et al. (2003)New York City, USA 19 50 Ren et al. (2003)Tokyo, Japan 40 85 Sadanaga et al. (2005)M.C.M.A, Mexico 33 200 Shirley et al. (2005)Pine forest, USA - 13 Di Carlo et al. (2004)Mainz, Germany 10.4 18 This workRainforest, Suriname 53§ 72§ This work
+=average was used when median was not available.§=measurements period was at peak of diel emissions.
water). The existing sampling strategy for introducing am-bient air into the glass reactor, which uses a VOC samplingTeflon pump (Laboport N86-KN18), could also be modifiedso that the ambient air enters the set-up directly without go-ing through a pump. This would help to minimize the loss ofsticky reactive VOCs, which may contribute significantly toOH reactivity. While we have used the reagent and detectorsystem of pyrrole and a PTR-MS, respectively, in principle itshould be possible to apply the Comparative Reactivity Con-cept to other suitable reagent molecules (e.g. labeled isotopesof isoprene) and detectors (e.g. fast GC-MS systems). Otherreagent molecules, which have a smaller rate coefficient thanthat of pyrrole with OH may also afford better sensitivity atlower ranges of ambient air OH reactivity.
The instrument has been successfully deployed in the fieldto measure the total OH reactivity of ambient air in thecontrasting environments of Mainz (urban), Germany andBrownsberg (rainforest air), Suriname. The measurementsindicated that at the peak of diel emissions, Suriname forestair was 4 times more reactive than the urban air of Mainz(72 s−1 compared to 18 s−1). The total OH reactivity mea-surements for Mainz air lie well within the range of total OHreactivity measurements reported in literature for urban airsites. Table 1 presents a summary of ambient air OH re-activity measurements from urban and forest sites. Kovacset al. (2003) reported ambient air OH reactivity values of11–19 s−1 at Nashville, TN, USA. In the same campaign,a comparison of the measured OH reactivity and the calcu-lated reactivity due to the measured reactants (70 VOCs),showed that on average, the measured OH reactivity was 1.45times higher (Martinez et al., 2003). Using laser inducedfluorescence based techniques, maximum OH reactivity val-ues of 50 s−1in New York City (Fig. 8 in Ren et al., 2003),85 s−1in suburban Tokyo (Sadanaga et al., 2004a; Sadanagaet al., 2005; Yoshino et al., 2006), and 200 s−1 in Mexico city(Fig. 9 in Shirley et al., 2006) have been observed.
To our knowledge, the ambient air OH reactivity measure-ments from Brownsberg are the first total OH reactivity mea-surements from a tropical rainforest site, an ecosystem that
is known for strong biogenic emissions (Karl et al., 2004;Goldstein and Galbally, 2007). Di Carlo et al. (2004) ob-served missing OH reactivity in a mixed transition forestconsisting of northern hardwood, aspen and white pine innorth Michigan. Our limited OH reactivity measurementsfrom Brownsberg also indicate that a significant fraction ofimportant OH reactive compounds are likely missed in con-ventional measurements at forest sites (see Fig. 11), sinceisoprene, isoprene oxidation products, acetone and acetalde-hyde make up only∼35% of the measured sink. In futurestudies, it will be interesting to measure a more comprehen-sive suite of VOCs and other OH-reactive species such asNO2 and SO2, together with direct OH reactivity measure-ments to better understand the budget of OH sinks. Rateconstants for the reaction of OH with almost all measuredambient VOCs are known. By summing up the calculatedreactivity due to all the measured VOCs (i.e. summation ofVOC concentration times its rate coefficient) and comparingit with the direct OH reactivity measurement, one can ad-ditionally examine the reactive carbon budget and assess towhat extent the individually measured VOCs account for thetotal OH reactivity.
6 Conclusions
This study has shown that the Comparative ReactivityMethod (CRM) can be applied for measurements of the totalOH reactivity of ambient air. Applying the CRM conceptto the reagent and detector system of pyrrole and a PTR-MS, respectively, a new online measurement technique witha dynamic range of about 6 to 300 s−1 for ambient air andaccuracy of±25% has been developed. Sensitivity studies(involving changing parameters) have been carried out, andhigh NO (>10 nmol mol−1) in ambient air has been iden-tified as the major interference. Therefore low NOx envi-ronments such as remote forest sites and marine environ-ments are ideal for deploying the new instrument, and im-provements in the existing set up are needed for conduct-ing measurements in strongly NOx polluted environments.
Atmos. Chem. Phys., 8, 2213–2227, 2008 www.atmos-chem-phys.net/8/2213/2008/
V. Sinha et al.: CRM – a new tool to measure atmospheric OH Reactivity 2225
Moderately polluted Mainz air measurements (NO≤1.5 nmolmol−1) are consistent with OH reactivity measurements re-ported previously for urban air. Our measurements from thetropical rainforest (for which no other data exists) indicatethat a significant fraction of OH reactive species is missed incurrent measurements. Further OH reactivity measurements,combining comprehensive measurements of VOCs and otherOH reactive species are needed to clarify whether sinks arecurrently underestimated in forest environments and to con-strain the budget of reactive VOCs.
Finally, several measurement groups routinely employproton transfer reaction mass spectrometers and gas chro-matography detectors for measuring VOCs in ambient air,during field campaigns. It would be relatively easy and eco-nomical to integrate a glass reactor and employ the CRMbased technique proposed in this study with these detectorsfor direct quantification of the OH sink, using either pyrroleor another suitable molecule. One of the future objectiveswill also be to compare the newly developed CRM based in-strument with the existing more comprehensive laser inducedfluorescence (LIF) based reactivity measurement technique,to test for systematic offsets between the two analytical ap-proaches. Hopefully, this study will stimulate further effortsin the application of the Comparative Reactivity Method forambient air OH reactivity measurements.
Acknowledgements.Special thanks to S. Jung for helping with herexpertise in glass blowing and furnishing the requested myriadglassware and reactors, sometimes even at very short notice.K. Simon is appreciated for expediting delivery of the customordered hydrocarbon standards. V. Sinha acknowledges thefinancial support rendered by the Max Planck Society. Last butcertainly not the least, we thank all the members of the ORSUMgroup, in particular T. Kluepfel and T. Custer who have facilitatedthe successful accomplishment of this work.
Edited by: R. Cohen
References
Ammann, C., Brunner, A., Spirig, C., and Neftel, A.: Technicalnote: Water vapour concentration and flux measurements withPTR-MS, Atmos. Chem. Phys., 6, 4643–4651, 2006,http://www.atmos-chem-phys.net/6/4643/2006/.
Atkinson, R., Aschmann, S. M., Winer, A. M., and Carter, W. P. L.:Rate Constants for the Gas-Phase Reactions of OH Radicals andO3 with Pyrrole at 295+/-1k and Atmospheric-Pressure, Atmos.Environ., 18, 2105–2107, 1984.
Atkinson, R., Baulch, D. L., Cox, R. A., Crowley, J. N., Hampson,R. F., Hynes, R. G., Jenkin, M. E., Kerr, J. A., Rossi, M. J. andTroe, J.: IUPAC Subcommittee for gas kinetic data evaluation,Evaluated kinetic data:http://www.iupac-kinetic.ch.cam.ac.uk/,2007.
Bavia, M., Bertinelli, F., Taliani, C., and Zauli, C., Electronic-Spectrum of Pyrrole in Vapor and Crystal: Mol. Phys., 31, 479-489, 1976.
Carslaw, N., Creasey, D. J., Heard, D. E., Jacobs, P. J., Lee, J. D.,Lewis, A. C., McQuaid, J. B., Pilling, M. J., Bauguitte, S., Pen-kett, S. A., Monks, P. S., and Salisbury, G.: Eastern AtlanticSpring Experiment 1997 (EASE97) – 2. Comparisons of modelconcentrations of OH, HO2, and RO2 with measurements, J.Geophys. Res.-Atmos., 107,4190, doi:10.1029/2001JD001568,2002.
Cronin, B., Nix, M. G. D., Qadiri, R. H., and Ashfold, M. N. R.:High resolution photofragment translational spectroscopy stud-ies of the near ultraviolet photolysis of pyrrole, Phys. Chem.Chem. Phys., 6, 5031–5041, 2004.
Curtis, A. R. and Sweetenham, W. P.: Facsimile/Chekmat UsersManual, AERE Report R-12805, Her Majesty’s Stationary Of-fice, England, 1988.
de Gouw, J. and Warneke, C.: Measurements of volatile or-ganic compounds in the earths atmosphere using proton-transfer-reaction mass spectrometry, Mass Spectrom. Rev., 26, 223–257,2007.
Di Carlo, P., Brune, W. H., Martinez, M., Harder, H., Lesher, R.,Ren, X. R., Thornberry, T., Carroll, M. A., Young, V., Shepson,P. B., Riemer, D., Apel, E., and Campbell, C.: Missing OH reac-tivity in a forest: Evidence for unknown reactive biogenic VOCs,Science, 304, 722–725, 2004.
Goldstein, A. H., McKay, M., Kurpius, M. R., Schade, G. W., Lee,A., Holzinger, R., and Rasmussen, R. A.: Forest thinning experi-ment confirms ozone deposition to forest canopy is dominated byreaction with biogenic VOCs, Geophys. Res. Lett., 31, L22106,doi: 10.1029/2004GL21259, 2004.
Goldstein, A. H. and Galbally, I. E.: Known and unexplored organicconstituents in the earth’s atmosphere, Environ. Sci. Technol.,41, 1514–1521, 2007.
Hasson, A. S., Chung, M. Y., Kuwata, K. T., Converse, A. D.,Krohn, D., and Paulson, S. E.: Reaction of Criegee intermedi-ates with water vapor – An additional source of OH radicals inalkene ozonolysis?, J. Phys. Chem. A., 107, 6176–6182, 2003.
Hasson, A. S., Tyndall, G. S., and Orlando, J. J.: A productyield study of the reaction of HO2 radicals with ethyl peroxy(C2H5O2), acetyl peroxy (CH3C(O)O-2), and acetonyl peroxy(CH3C(O)CH2O2) radicals, J. Phys. Chem. A., 108, 5979–5989,2004.
Heard, D. E. and Pilling, M. J.: Measurement of OH and HO2 inthe troposphere, Chem. Rev., 103, 5163–5198, 2003.
Hofzumahaus, A., Aschmutat, U., Hessling, M., Holland, F., andEhhalt, D. H.: The measurement of tropospheric OH radicals bylaser-induced fluorescence spectroscopy during the POPCORNfield campaign, Geophys. Res. Lett., 23, 2541–2544, 1996.
Holland, F., Hofzumahaus, A., Schafer, R., Kraus, A., and Patz,H. W.: Measurements of OH and HO2 radical concentrationsand photolysis frequencies during BERLIOZ, J. Geophys. Res.-Atmos., 108, 8246, doi:10.1029/2001JD001393, 2003.
Holzinger, R., Lee, A., Paw, K. T., and Goldstein, A. H.: Observa-tions of oxidation products above a forest imply biogenic emis-sions of very reactive compounds, Atmos. Chem. Phys., 5, 67–75, 2005,http://www.atmos-chem-phys.net/5/67/2005/.
Jeanneret, F., Kirchner, F., Clappier, A., van den Bergh, H., andCalpini, B.: Total VOC reactivity in the planetary boundary layer1. Estimation by a pump and probe OH experiment, J. Geophys.Res.-Atmos., 106, 3083–3093, 2001.
www.atmos-chem-phys.net/8/2213/2008/ Atmos. Chem. Phys., 8, 2213–2227, 2008
2226 V. Sinha et al.: CRM – a new tool to measure atmospheric OH Reactivity
Karl, T., Potosnak, M., Guenther, A., Clark, D., Walker, J., Her-rick, J. D., and Geron, C.: Exchange processes of volatile organiccompounds above a tropical rain forest: Implications for model-ing tropospheric chemistry above dense vegetation, J. Geophys.Res.-Atmos., 109, D18306, doi:10.1029/2004JD004738, 2004.
Kovacs, T. A. and Brune, W. H.: Total OH loss rate measurement,J. Atmos. Chem., 39, 105–122, 2001.
Kovacs, T. A., Brune, W. H., Harder, H., Martinez, M., Simpas, J.B., Frost, G. J., Williams, E., Jobson, T., Stroud, C., Young, V.,Fried, A., and Wert, B.: Direct measurements of urban OH reac-tivity during Nashville SOS in summer 1999, J. Environ. Monit.,5, 68–74, 2003.
Lelieveld, J., Dentener, F. J., Peters, W., and Krol, M. C.: On therole of hydroxyl radicals in the self-cleansing capacity of the tro-posphere, Atmos. Chem. Phys., 4, 2337–2344, 2004,http://www.atmos-chem-phys.net/4/2337/2004/.
Lewis, A. C., Carslaw, N., Marriott, P. J., Kinghorn, R. M., Mor-rison, P., Lee, A. L., Bartle, K. D., and Pilling, M. J.: A largerpool of ozone-forming carbon compounds in urban atmospheres,Nature, 405, 778–781, 2000.
Lindinger, W., Hansel, A., and Jordan, A.: On-line monitoring ofvolatile organic compounds at pptv levels by means of proton-transfer-reaction mass spectrometry (PTR-MS) – Medical appli-cations, food control and environmental research, Int. J. MassSpectrom., 173, 191–241, 1998a.
Lindinger, W., Hansel, A., and Jordan, A.: Proton-transfer-reactionmass spectrometry (PTR-MS): on-line monitoring of volatile or-ganic compounds at pptv levels, Chem. Soc. Rev., 27, 347–354,1998b.
Maris, C., Chung, M. Y., Lueb, R., Krischke, U., Meller, R., Fox,M. J., and Paulson, S. E.: Development of instrumentation forsimultaneous analysis of total non-methane organic carbon andvolatile organic compounds in ambient air, Atmos. Environ., 37,S149–S158, 2003.
Martinez, M., Harder, H., Kovacs, T. A., et al.: OH and HO2 con-centrations, sources, and loss rates during the Southern OxidantsStudy in Nashville, Tennessee, summer 1999, J. Geophys. Res.-Atmos., 108(D19), 4617, doi:10.1029/2003JD003551, 2003.
Olson, J. R., Crawford, J. H., Chen, G., et al.: Testing fast pho-tochemical theory during TRACE-P based on measurements ofOH, HO2, and CH2O, J. Geophys. Res.-Atmos., 109, D15S10,doi:10.1029/2003JD004278, 2004.
Paulson, S. E., Chung, M. Y., and Hasson, A. S.: OH radical forma-tion from the gas-phase reaction of ozone with terminal alkenesand the relationship between structure and mechanism, J. Phys.Chem. A., 103, 8125–8138, 1999.
Poppe, D., Zimmermann, J., Bauer, R., et al.: Comparison Of Mea-sured Oh Concentrations With Model-Calculations, J. Geophys.Res.-Atmos., 99, 16 633–16 642, 1994.
Ren, X. R., Brune, W. H., Cantrell, C. A., Edwards, G. D., Shirley,T., Metcalf, A. R., and Lesher, R. L.: Hydroxyl and peroxy rad-ical chemistry in a rural area of Central Pennsylvania: Obser-vations and model comparisons, J. Atmos. Chem., 52, 231–257,2005.
Ren, X. R., Brune, W. H., Oliger, A., Metcalf, A. R., Simpas, J.B., Shirley, T., Schwab, J. J., Bai, C. H., Roychowdhury, U.,Li, Y. Q., Cai, C. X., Demerjian, K. L., He, Y., Zhou, X. L.,Gao, H. L., and Hou, J.: OH, HO2, and OH reactivity duringthe PMTACS-NY Whiteface Mountain 2002 campaign: Obser-
vations and model comparison, J. Geophys. Res.-Atmos., 111,D10S03, doi:10.1029/2005JD006126, 2006.
Ren, X. R., Harder, H., Martinez, M., Lesher, R. L., Oliger, A.,Shirley, T., Adams, J., Simpas, J. B., and Brune, W. H.: HOx
concentrations and OH reactivity observations in New York Cityduring PMTACS-NY2001, Atmos. Environ., 37, 3627–3637,2003.
Roberts, J. M., Bertman, S. B., Jobson, T., Niki, H., and Tanner, R.:Measurement of total nonmethane organic carbon (C-y): Devel-opment and application at Chebogue Point, Nova Scotia, duringthe 1993 North Atlantic Regional Experiment campaign, J. Geo-phys. Res.-Atmos., 103, 13 581–13 592, 1998.
Sadanaga, Y., Yoshino, A., Kato, S., and Kajii, Y.: Measurements ofOH reactivity and photochemical ozone production in the urbanatmosphere, Environ. Sci. Technol., 39, 8847–8852, 2005.
Sadanaga, Y., Yoshino, A., Kato, S., Yoshioka, A., Watanabe,K., Miyakawa, Y., Hayashi, I., Ichikawa, M., Matsumoto, J.,Nishiyama, A., Akiyama, N., Kanaya, Y., and Kajii, Y.: Theimportance of NO2 and volatile organic compounds in the urbanair from the viewpoint of the OH reactivity, Geophys. Res. Lett.,31, L08102, doi:10.1029/2004GL0196612004a.
Sadanaga, Y., Yoshino, A., Watanabe, K., Yoshioka, A., Waka-zono, Y., Kanaya, Y., and Kajii, Y.: Development of a mea-surement system of OH reactivity in the atmosphere by usinga laser-induced pump and probe technique: Rev. Sci. Instrum.,75, 2648–2655, 2004b.
Salisbury, G., Williams, J., Holzinger, R., Gros, V., Mihalopou-los, N., Vrekoussis, M., Sarda-Esteve, R., Berresheim, H., vonKuhlmann, R., Lawrence, M., and Lelieveld, J.: Ground-basedPTR-MS measurements of reactive organic compounds dur-ing the MINOS campaign in Crete, July–August 2001, Atmos.Chem. Phys., 3, 925–940, 2003,http://www.atmos-chem-phys.net/3/925/2003/.
Shirley, T. R., Brune, W. H., Ren, X., Mao, J., Lesher, R., Carde-nas, B., Volkamer, R., Molina, L. T., Molina, M. J., Lamb, B.,Velasco, E., Jobson, T., and Alexander, M.: Atmospheric oxi-dation in the Mexico City Metropolitan Area (MCMA) duringApril 2003, Atmos. Chem. Phys., 6, 2753–2765, 2006,http://www.atmos-chem-phys.net/6/2753/2006/.
Sickles, J. E., Eaton, W. C., Ripperton, L. A., and Wright, R. S.: USEnvironmental Protection Agency, EPA-60017-77-104, 1977.
Sinha, V., Williams, J., Meyerhofer, M., Riebesell, U., Paulino, A.I., and Larsen, A.: Air-sea fluxes of methanol, acetone, acetalde-hyde, isoprene and DMS from a Norwegian fjord following aphytoplankton bloom in a mesocosm experiment, Atmos. Chem.Phys., 7, 739–755, 2007a,http://www.atmos-chem-phys.net/7/739/2007/.
Sinha, V., Williams, J., Crutzen P., and Lelieveld J.: Methane emis-sions from boreal and tropical forest ecosystems derived fromin-situ measurements, Atmos. Chem. Phys. Discuss., 7, 14 011–14 039, 2007b.
Smith, S. C., Lee, J. D., Bloss, W. J., Johnson, G. P., Ingham, T.,and Heard, D. E.: Concentrations of OH and HO2 radicals dur-ing NAMBLEX: measurements and steady state analysis, Atmos.Chem. Phys., 6, 1435–1453, 2006,http://www.atmos-chem-phys.net/6/1435/2006/.
Williams, J., Poschl, U., Crutzen, P. J., Hansel, A., Holzinger, R.,Warneke, C., Lindinger, W., and Lelieveld, J.: An atmosphericchemistry interpretation of mass scans obtained from a proton
Atmos. Chem. Phys., 8, 2213–2227, 2008 www.atmos-chem-phys.net/8/2213/2008/

V. Sinha et al.: CRM – a new tool to measure atmospheric OH Reactivity 2227
transfer mass spectrometer flown over the tropical rainforest ofSurinam, J. Atmos. Chem., 38, 133–166, 2001.
Williams, J., Yassaa, N., Bartenbach, S., and Lelieveld, J.: Mirrorimage hydrocarbons from Tropical and Boreal forests, Atmos.Chem. Phys., 7, 973–980, 2007,http://www.atmos-chem-phys.net/7/973/2007/.
Yoshino, A., Sadanaga, Y., Watanabe, K., Kato, S., Miyakawa, Y.,Matsumoto, J., and Kajii, Y.: Measurement of total OH reactiv-ity by laser-induced pump and probe technique – comprehensiveobservations in the urban atmosphere of Tokyo, Atmos. Environ.,40, 7869–7881, 2006.
www.atmos-chem-phys.net/8/2213/2008/ Atmos. Chem. Phys., 8, 2213–2227, 2008