comparative analysis and remedial measure of …iaetsdjaras.org/gallery/3-november-821.pdf ·...
TRANSCRIPT
COMPARATIVE ANALYSIS AND REMEDIAL MEASURE OF DIFFERENT
WATER BODIES IN RASIPURAM ZONE
Suresh Kumar P1, Arun Kumar C2, Sri Ruban D3, Nagarajan N 4 1,2,3,4 Assistant Professor, Department of Civil Engineering, Sri Shakthi Institute of Engineering and Technology [email protected], [email protected], [email protected], [email protected]
Abstract--The zone of Rasipuram contains 4 lakes which having the high capacity of water. But, now-a-days,
they are in useless condition due to high contaminated pollutants. Due to this contamination in lake water, the
important source of drinking water bodies like ground and well water which is nearer to the lake are get
affected. People, who are using this water are affected by short term health problem like fever, jaundice, cholera
and long term problems like weakness in bone and teeth diseases and at the same time, the fresh water is
supplied from Mettur dam which is situated at a longer distance from the Rasipuram city. Hence, distribution of
water is more expensive. By considering this tough situation and to provide water economically. It is important
to identify, assess and estimate the quality and quantity of ground water. Therefore, This paper involves
collection of water samples from various water bodies like well, ground and lake water. Then, the collected water
sample are analysed with the physico-chemical parameters. By which the properties and characteristics of
various water bodies are checked. With the analyzed test result of various parameters. The solution for the
defected water sample is given by providing the remedy. The remedy consist of apparatus which contain the
traditional method of filtering elements such as sand, pebble, charcoal. Along with it, we introduced a new layer
contains mixture of Ground nut husk, Banana peel and Lemon peel treated with Concentrated Hydro chloric
acid. This layer have the property to absorb high quantity of fluoride and calcium content which is the reason
for such long-term health effects. In order to maintain the pH range, the mixture and HCL are taken at the ratio
of 1:1:1:6 similarly. The apparatus of filtration take 3 hours for the 70% of Filtration of water sample.
Keywords: Ground nut husk, Banana peel and Lemon peel
I .INTRODUCTION
A. GENERAL DEFINITION
Generally, Water is one of the most important and essential source of human beings for all purposes. In
Earth surface 97.2% of water is non-potable and remaining 2.8% of water is only fresh water. Therefore, it
becomes necessary to identify, assess and estimate the quality and quantity of ground water. Usually, Lake Water
is the major source for ground water and well water. But, now-a-days lakes are not maintained properly. So, that
the lake water is contaminated along with ground water. Hence, total source is affected. And also due to
dumping of wastes on the lakes, the water pollution occurs.
Rasipuram is one of the central part of Tamil Nadu. It is located in Latitude of 11.47’North and Longitude of
78.17’East.It of Elevation of 246m.It has Humidity of 82%.In this place, natural ground water having more
Fluoride content in the water. Due to drinking water scarcity, here, mostly peoples are using municipal water
rather than ground water. The fresh water is supplied from Mettur dam which is situated at a longer distance
from the Rasipuram city. Hence, distribution of water is more expensive .By considering this tough situation and
to provide water economically. Our project aims to analysis Physico-chemical characteristics of Lake Water,
Pond water and Ground water from Rasipuram zone. After Analysis the results will be compared with standards
such as WHO, ISI, BIS and suitable remedy will be provided for the treatment.
IAETSD JOURNAL FOR ADVANCED RESEARCH IN APPLIED SCIENCES
VOLUME 5, ISSUE 11, NOVEMBER/2018
ISSN NO: 2394-8442
PAGE NO:12
II. COLLECTION OF SAMPLES
B. AREA STUDY
Rasipuram is one of the central part of Tamil Nadu. It’s in the district of Namakkal. It is surrounded by
Hilly regions. So that natural ground water is available. It is located in Latitude of 11.47’N and Longitude of
78.17’E.It has the Elevation of 246m.It has Humidity of 82%.Rasipuram has the total area of more than 75,000
peoples.
1) General Information
Geographical area (Sq. Km) = 817.48
Population = More than 75,000
Average Annual Rainfall (mm) = 650 – 900
2) Geomorphology
Major physiographic Units: Plateau region with hill ranges
Major Drainages: Cauvery, Tirumanimutar, Vasista and Sweta.
3) Ground Water Quality
Presence of chemical constituents more than permissible limit:
CaCO3, NO3, F, Cl, Mg
Type of water: NaCl & mixed type
4) Drainage
Cauvery river, which is perennial in nature, flows along the western and southern boundaries of the
district. Tirumanimuttar river, which is the most important tributary of Cauvery in the district, has its origin in
Manjavadi area of Shevroy hills in Salem district and traverses the district before its confluence with Cauvery at
Nanjai Edayar village of Paramathi taluk. A small area in the northeastern part, which is drained mainly by
Vasista Nadi and Sweta Nadi rivers, which are tributaries of Vellar River.
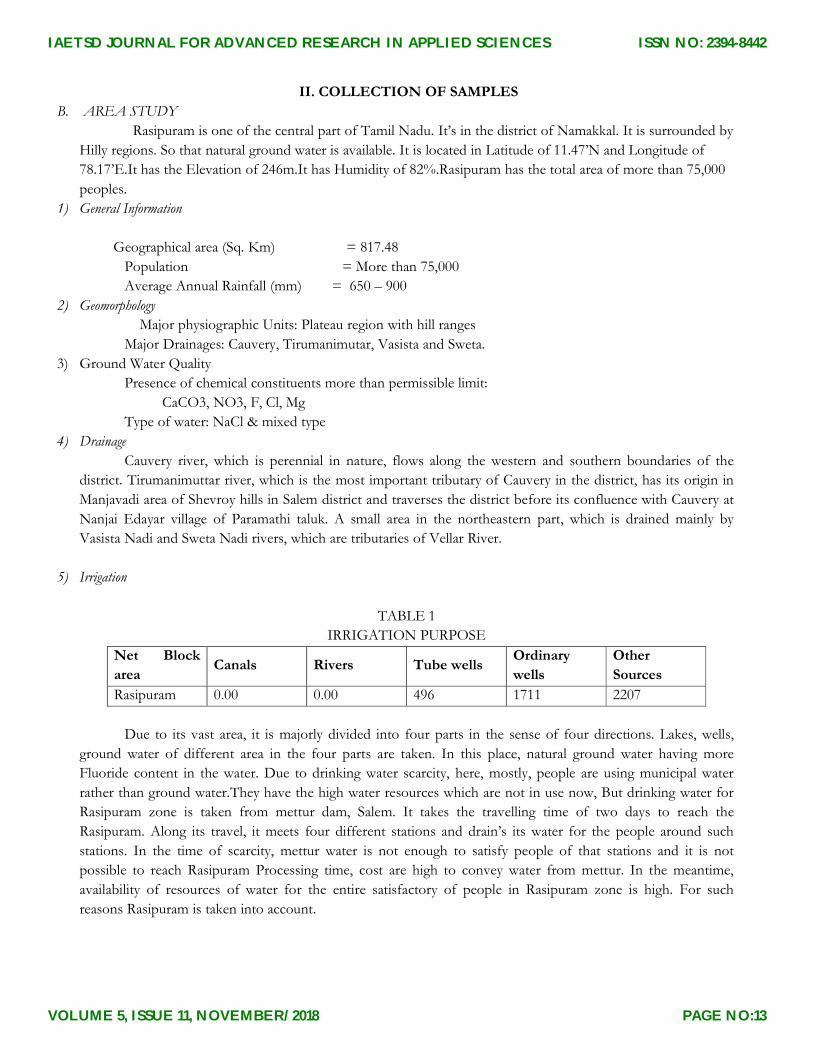
5) Irrigation
TABLE 1
IRRIGATION PURPOSE
Net Block
area Canals Rivers Tube wells
Ordinary
wells
Other
Sources
Rasipuram 0.00 0.00 496 1711 2207
Due to its vast area, it is majorly divided into four parts in the sense of four directions. Lakes, wells,
ground water of different area in the four parts are taken. In this place, natural ground water having more
Fluoride content in the water. Due to drinking water scarcity, here, mostly, people are using municipal water
rather than ground water.They have the high water resources which are not in use now, But drinking water for
Rasipuram zone is taken from mettur dam, Salem. It takes the travelling time of two days to reach the
Rasipuram. Along its travel, it meets four different stations and drain’s its water for the people around such
stations. In the time of scarcity, mettur water is not enough to satisfy people of that stations and it is not
possible to reach Rasipuram Processing time, cost are high to convey water from mettur. In the meantime,
availability of resources of water for the entire satisfactory of people in Rasipuram zone is high. For such
reasons Rasipuram is taken into account.
IAETSD JOURNAL FOR ADVANCED RESEARCH IN APPLIED SCIENCES
VOLUME 5, ISSUE 11, NOVEMBER/2018
ISSN NO: 2394-8442
PAGE NO:13
III. TESTING PARAMETER
The major parameters of water to be test for analysing the collected water sample,
• Ph
• Turbidity
• Total Dissolved Solids (TDS)
• Nitrite.
• Fluoride
• Hardness
• Alkalinity
• Chloride
• COD
• BOD or Biological Oxygen Demand
• DO or Dissolved Oxygen.
• Calcium
• Magnesium
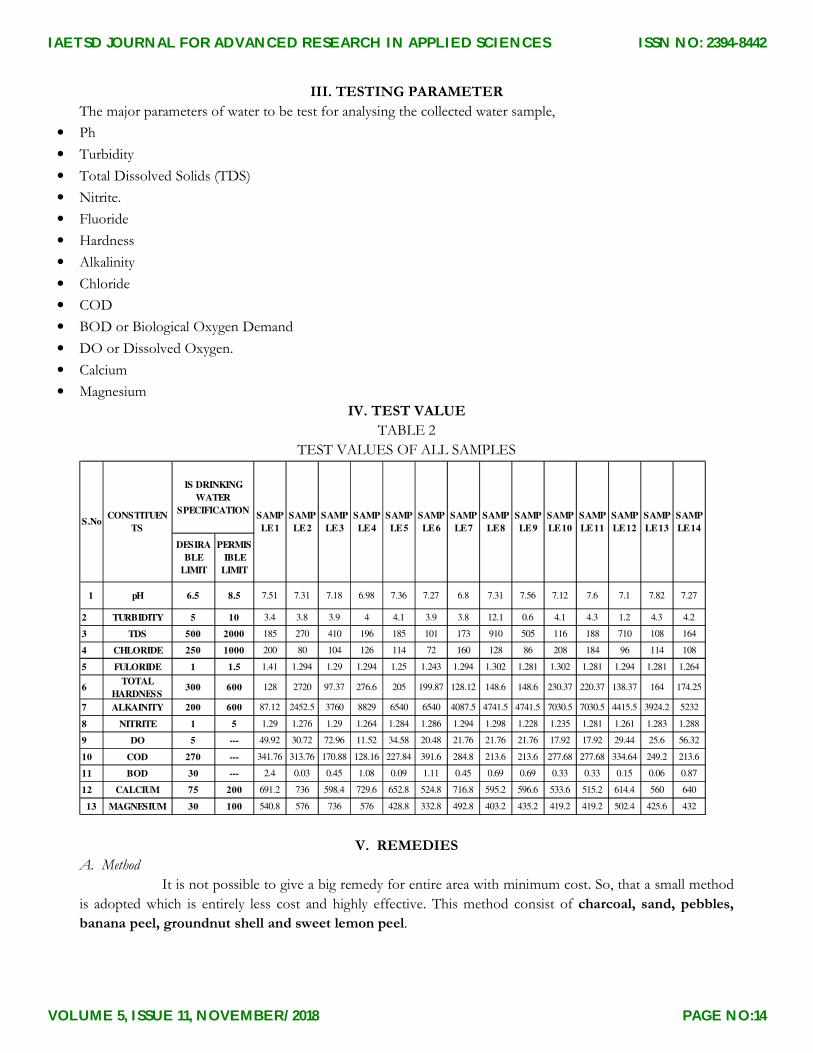
IV. TEST VALUE
TABLE 2
TEST VALUES OF ALL SAMPLES
V. REMEDIES
A. Method
It is not possible to give a big remedy for entire area with minimum cost. So, that a small method
is adopted which is entirely less cost and highly effective. This method consist of charcoal, sand, pebbles,
banana peel, groundnut shell and sweet lemon peel.
2 TURBIDITY 5 10 3.4 3.8 3.9 4 4.1 3.9 3.8 12.1 0.6 4.1 4.3 1.2 4.3 4.2
3 TDS 500 2000 185 270 410 196 185 101 173 910 505 116 188 710 108 164
4 CHLORIDE 250 1000 200 80 104 126 114 72 160 128 86 208 184 96 114 108
5 FULORIDE 1 1.5 1.41 1.294 1.29 1.294 1.25 1.243 1.294 1.302 1.281 1.302 1.281 1.294 1.281 1.264
6TOTAL
HARDNESS300 600 128 2720 97.37 276.6 205 199.87 128.12 148.6 148.6 230.37 220.37 138.37 164 174.25
7 ALKAINITY 200 600 87.12 2452.5 3760 8829 6540 6540 4087.5 4741.5 4741.5 7030.5 7030.5 4415.5 3924.2 5232
8 NITRITE 1 5 1.29 1.276 1.29 1.264 1.284 1.286 1.294 1.298 1.228 1.235 1.281 1.261 1.283 1.288
9 DO 5 --- 49.92 30.72 72.96 11.52 34.58 20.48 21.76 21.76 21.76 17.92 17.92 29.44 25.6 56.32
10 COD 270 --- 341.76 313.76 170.88 128.16 227.84 391.6 284.8 213.6 213.6 277.68 277.68 334.64 249.2 213.6
11 BOD 30 --- 2.4 0.03 0.45 1.08 0.09 1.11 0.45 0.69 0.69 0.33 0.33 0.15 0.06 0.87
12 CALCIUM 75 200 691.2 736 598.4 729.6 652.8 524.8 716.8 595.2 596.6 533.6 515.2 614.4 560 640
13 MAGNESIUM 30 100 540.8 576 736 576 428.8 332.8 492.8 403.2 435.2 419.2 419.2 502.4 425.6 432
7.27
CONSTITUEN
TS
7.31 7.56 7.12 7.6 7.1 7.827.278.56.5pH1 6.8
S.No
DESIRA
BLE
LIMIT
PERMIS
IBLE
LIMIT
7.18 6.98 7.36
SAMP
LE 10
SAMP
LE 11
SAMP
LE 12
SAMP
LE 13
SAMP
LE 14
SAMP
LE 4
SAMP
LE 5
SAMP
LE 6
SAMP
LE 7
SAMP
LE 8
SAMP
LE 9
IS DRINKING
WATER
SPECIFICATIONSAMP
LE 1
SAMP
LE 2
7.51 7.31
SAMP
LE 3
IAETSD JOURNAL FOR ADVANCED RESEARCH IN APPLIED SCIENCES
VOLUME 5, ISSUE 11, NOVEMBER/2018
ISSN NO: 2394-8442
PAGE NO:14
An apparatus is set with the 8 layers, 1st layer consist of sand, 2nd one consist of pebble, 3rd with the coal and 4th
with the mixture powder of banana peel, ground nut shell and lemon peel. And it is rotated
1) Making Of Powder-Preparation of Banana Peel Adsorbent Treated with Hydrochloric Acid: Banana peels are washed three
times from the tape water to remove the dust and primarily dried in the sun light for two days and then dried in
hot air oven in the range of 80Oc-100 0C for 36 h. Dried banana peels crushed in a jaw crusher and then sieved
by 510 µm ASTM mesh. Screened material is treated with 0.1 M hydrochloric acid for 24 h. After treatment with
acid, treated material is washed many times to make it neutral. Washed material is then dried in hot air oven at
110Oc for 24 h. The material is subsequently placed in an airtight container for further use.
2) Preparation of Sweet Lemon Peel Adsorbent: It’s collected from the juice making shop of Rookie, washed in tape
water and dried in sun light for four days. This material is dried in the hot air oven for two days at 120 co. Dried
Material crushed in jaw crusher and then sieved in 510 µm mesh ASTM. Sieved material is collected for further
use.
3) Preparation of Groundnut Shell Adsorbent: Collected shell of groundnut simply washed with tape water and dried in
sun light for two days. Dried sample is again dried in hot air oven at 100 co for 24 hr. This material is crushed in
jaw crusher and screened in 510 µm mesh ASTM, screened material is then placed in container for further use.
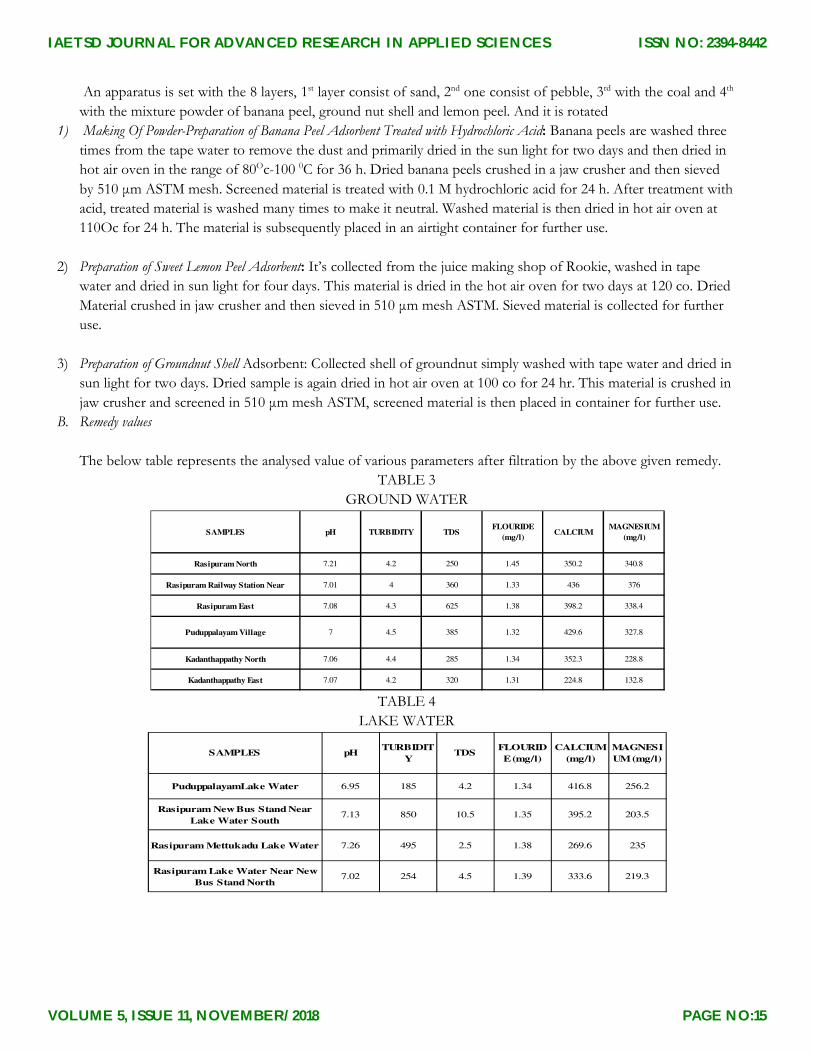
B. Remedy values
The below table represents the analysed value of various parameters after filtration by the above given remedy.
TABLE 3
GROUND WATER
TABLE 4
LAKE WATER
Kadanthappathy North 7.06 4.4 285 1.34 352.3 228.8
Kadanthappathy East 7.07 4.2 320 1.31 224.8 132.8
Rasipuram North
CALCIUMFLOURIDE
(mg/l)
Puduppalayam Village 7 4.5 385 327.8429.61.32
376
Rasipuram East 7.08 4.3 625 1.38 398.2 338.4
Rasipuram Railway Station Near 7.01 4 360 1.33 436
7.21 4.2 250 1.45 350.2 340.8
SAMPLES pH TURBIDITY TDSMAGNESIUM
(mg/l)
PuduppalayamLake Water 6.95 185 4.2 1.34 416.8 256.2
Rasipuram New Bus Stand Near
Lake Water South7.13 850 10.5 1.35 395.2 203.5
Rasipuram Mettukadu Lake Water 7.26 495 2.5 1.38 269.6 235
Rasipuram Lake Water Near New
Bus Stand North7.02 254 4.5 1.39 333.6 219.3
TDSMAGNESI
UM (mg/l)
FLOURID
E (mg/l)
CALCIUM
(mg/l)SAMPLES pH
TURBIDIT
Y
IAETSD JOURNAL FOR ADVANCED RESEARCH IN APPLIED SCIENCES
VOLUME 5, ISSUE 11, NOVEMBER/2018
ISSN NO: 2394-8442
PAGE NO:15
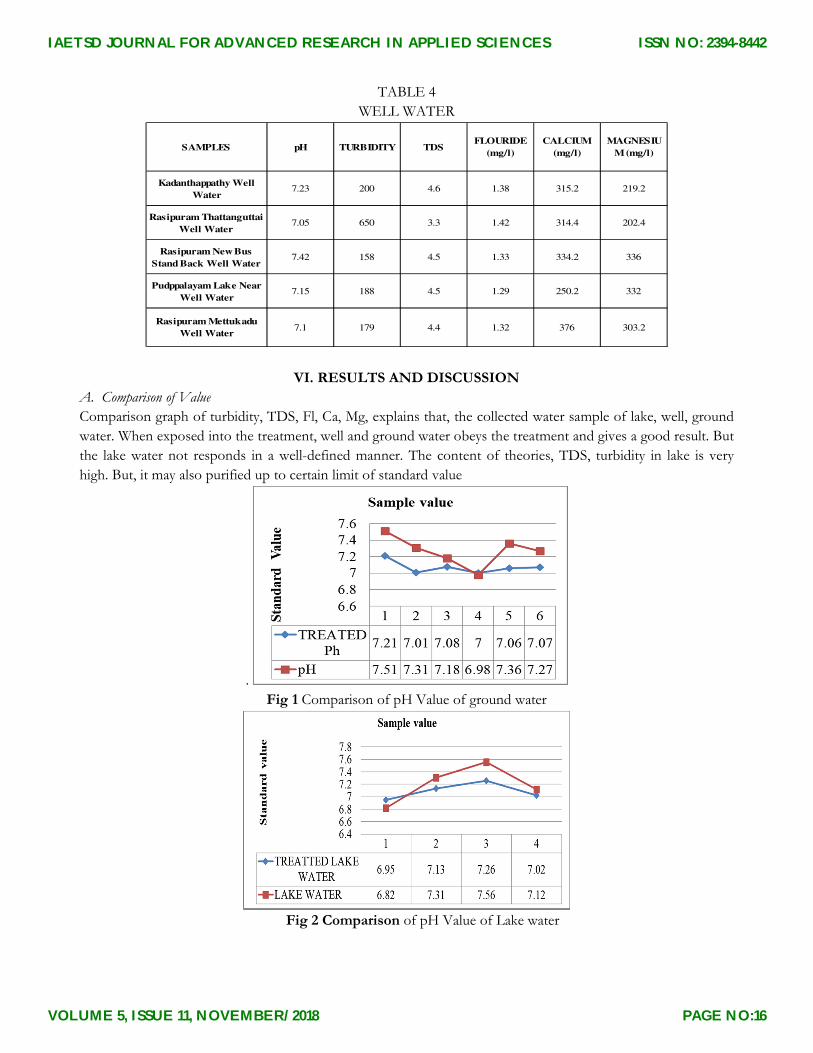
TABLE 4
WELL WATER
VI. RESULTS AND DISCUSSION
A. Comparison of Value
Comparison graph of turbidity, TDS, Fl, Ca, Mg, explains that, the collected water sample of lake, well, ground
water. When exposed into the treatment, well and ground water obeys the treatment and gives a good result. But
the lake water not responds in a well-defined manner. The content of theories, TDS, turbidity in lake is very
high. But, it may also purified up to certain limit of standard value
.
Fig 1 Comparison of pH Value of ground water
Fig 2 Comparison of pH Value of Lake water
Kadanthappathy Well
Water7.23 200 4.6 1.38 315.2 219.2
Rasipuram Thattanguttai
Well Water7.05 650 3.3 1.42 314.4 202.4
Rasipuram New Bus
Stand Back Well Water7.42 158 4.5 1.33 334.2 336
Pudppalayam Lake Near
Well Water7.15 188 4.5 1.29 250.2 332
Rasipuram Mettukadu
Well Water7.1 179 4.4 1.32 376 303.2
SAMPLES pH TURBIDITY TDSMAGNESIU
M (mg/l)
FLOURIDE
(mg/l)
CALCIUM
(mg/l)
IAETSD JOURNAL FOR ADVANCED RESEARCH IN APPLIED SCIENCES
VOLUME 5, ISSUE 11, NOVEMBER/2018
ISSN NO: 2394-8442
PAGE NO:16
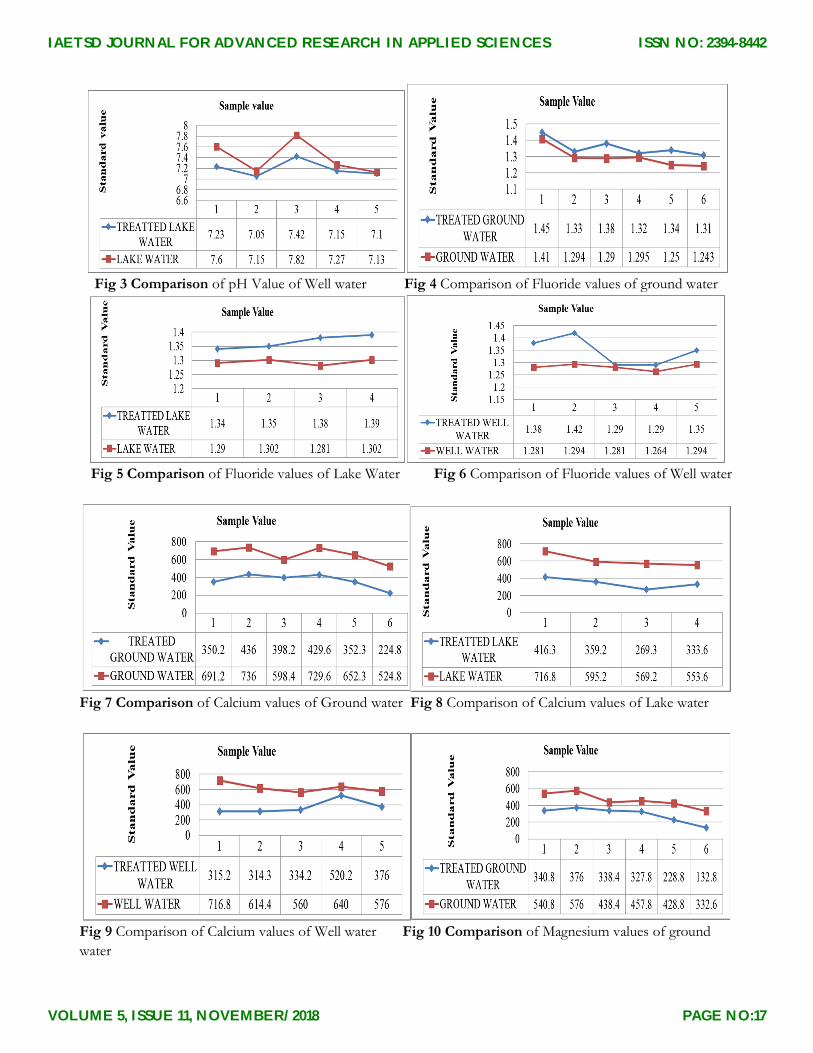
Fig 3 Comparison of pH Value of Well water Fig 4 Comparison of Fluoride values of ground water
Fig 5 Comparison of Fluoride values of Lake Water Fig 6 Comparison of Fluoride values of Well water
Fig 7 Comparison of Calcium values of Ground water Fig 8 Comparison of Calcium values of Lake water
Fig 9 Comparison of Calcium values of Well water Fig 10 Comparison of Magnesium values of ground
water
IAETSD JOURNAL FOR ADVANCED RESEARCH IN APPLIED SCIENCES
VOLUME 5, ISSUE 11, NOVEMBER/2018
ISSN NO: 2394-8442
PAGE NO:17
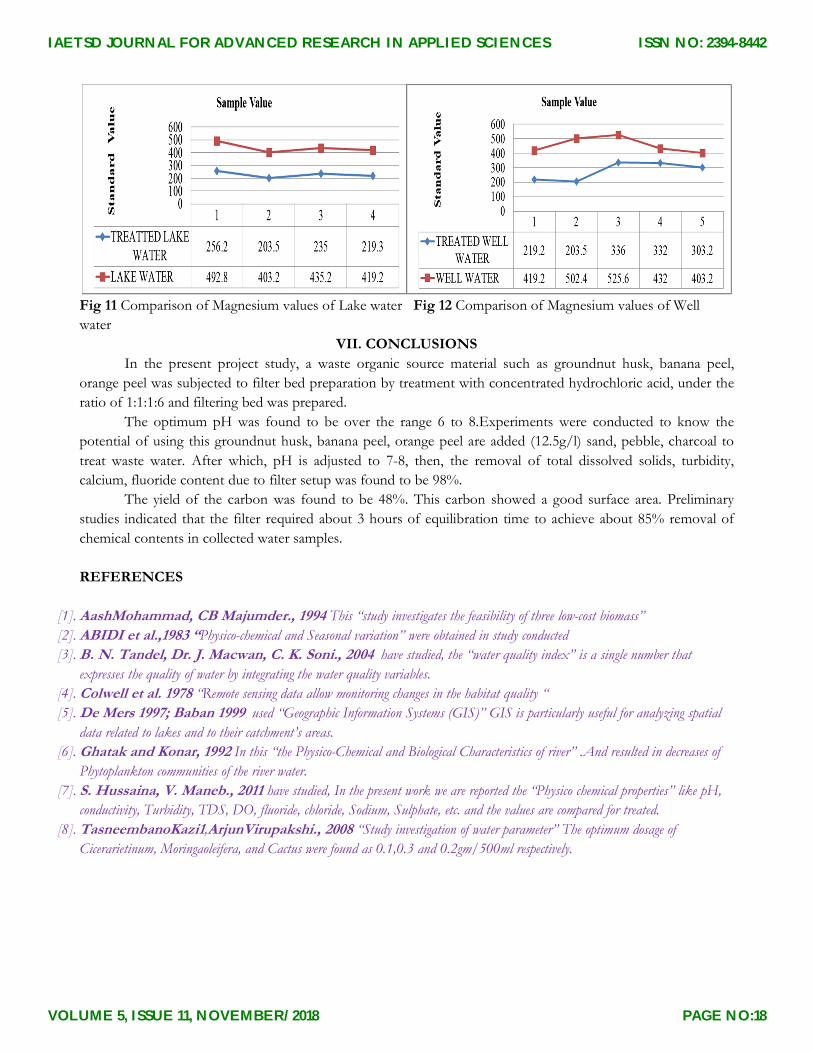
Fig 11 Comparison of Magnesium values of Lake water Fig 12 Comparison of Magnesium values of Well
water
VII. CONCLUSIONS
In the present project study, a waste organic source material such as groundnut husk, banana peel,
orange peel was subjected to filter bed preparation by treatment with concentrated hydrochloric acid, under the
ratio of 1:1:1:6 and filtering bed was prepared.
The optimum pH was found to be over the range 6 to 8.Experiments were conducted to know the
potential of using this groundnut husk, banana peel, orange peel are added (12.5g/l) sand, pebble, charcoal to
treat waste water. After which, pH is adjusted to 7-8, then, the removal of total dissolved solids, turbidity,
calcium, fluoride content due to filter setup was found to be 98%.
The yield of the carbon was found to be 48%. This carbon showed a good surface area. Preliminary
studies indicated that the filter required about 3 hours of equilibration time to achieve about 85% removal of
chemical contents in collected water samples.
REFERENCES
[1]. AashMohammad, CB Majumder., 1994 This “study investigates the feasibility of three low-cost biomass”
[2]. ABIDI et al.,1983 “Physico-chemical and Seasonal variation” were obtained in study conducted
[3]. B. N. Tandel, Dr. J. Macwan, C. K. Soni., 2004 have studied, the “water quality index” is a single number that
expresses the quality of water by integrating the water quality variables.
[4]. Colwell et al. 1978 “Remote sensing data allow monitoring changes in the habitat quality “
[5]. De Mers 1997; Baban 1999 used “Geographic Information Systems (GIS)” GIS is particularly useful for analyzing spatial
data related to lakes and to their catchment’s areas.
[6]. Ghatak and Konar, 1992 In this “the Physico-Chemical and Biological Characteristics of river” .And resulted in decreases of
Phytoplankton communities of the river water.
[7]. S. Hussaina, V. Maneb., 2011 have studied, In the present work we are reported the “Physico chemical properties” like pH,
conductivity, Turbidity, TDS, DO, fluoride, chloride, Sodium, Sulphate, etc. and the values are compared for treated.
[8]. TasneembanoKazi1,ArjunVirupakshi., 2008 “Study investigation of water parameter” The optimum dosage of
Cicerarietinum, Moringaoleifera, and Cactus were found as 0.1,0.3 and 0.2gm/500ml respectively.
IAETSD JOURNAL FOR ADVANCED RESEARCH IN APPLIED SCIENCES
VOLUME 5, ISSUE 11, NOVEMBER/2018
ISSN NO: 2394-8442
PAGE NO:18