the commitment to reducing inequality index measuring …
TRANSCRIPT
THE COMMITMENT TO REDUCING INEQUALITY INDEX
Measuring and Motivating:
Using data to incentivise progressive policies to tackle economic inequality
Dr. Chiara Mariotti Inequality Policy Manager Oxfam GB [email protected]
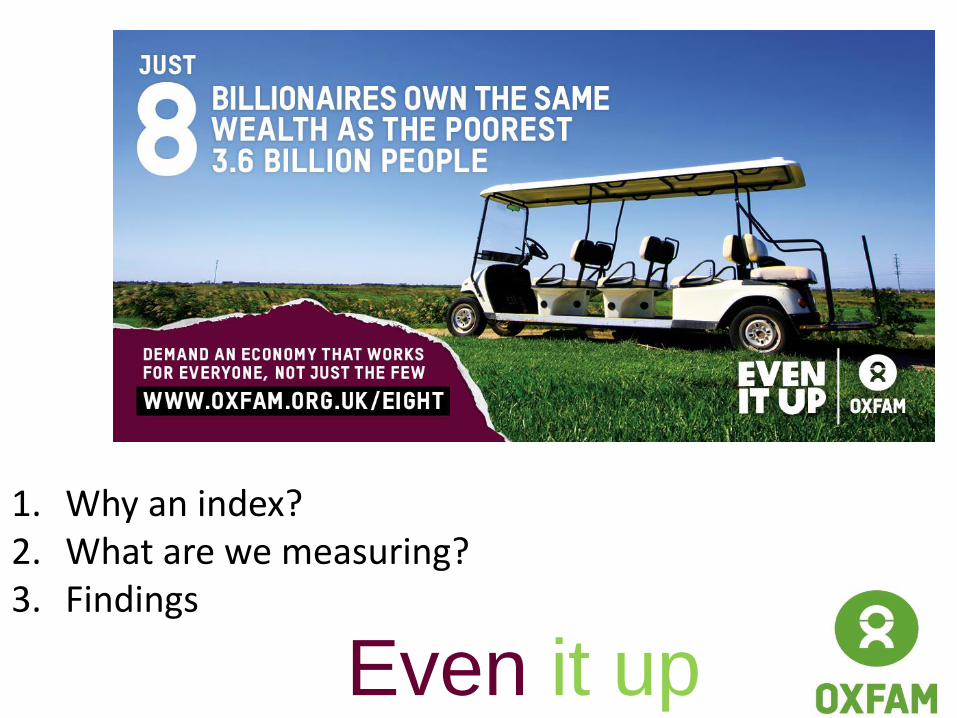
Even it up
1. Why an index? 2. What are we measuring? 3. Findings
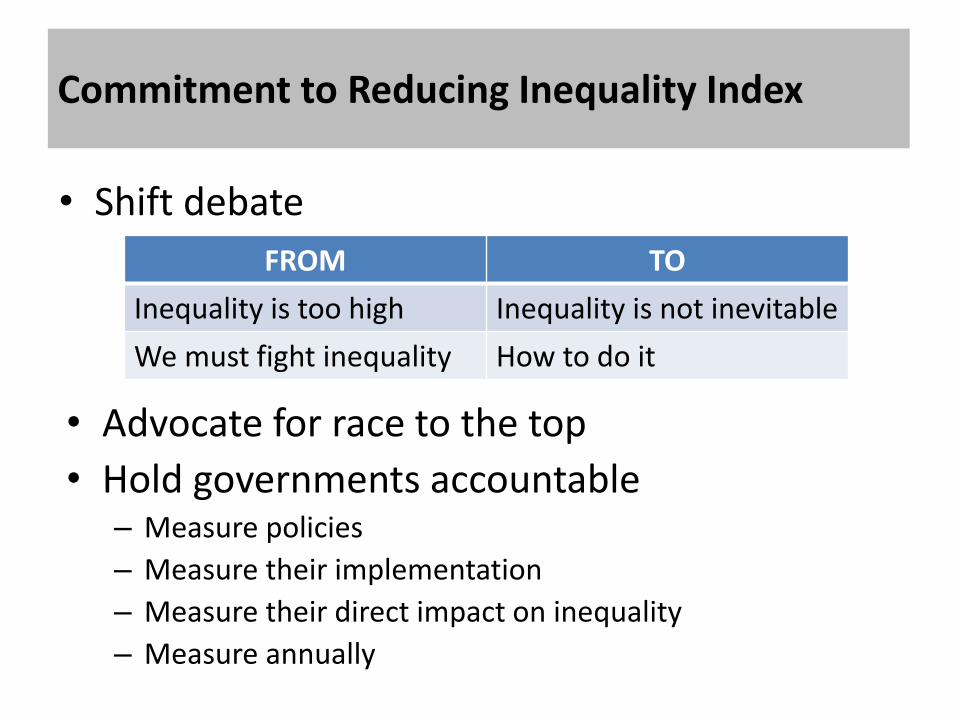
Commitment to Reducing Inequality Index
FROM TO
Inequality is too high Inequality is not inevitable
We must fight inequality How to do it
• Advocate for race to the top
• Hold governments accountable – Measure policies
– Measure their implementation
– Measure their direct impact on inequality
– Measure annually
• Shift debate
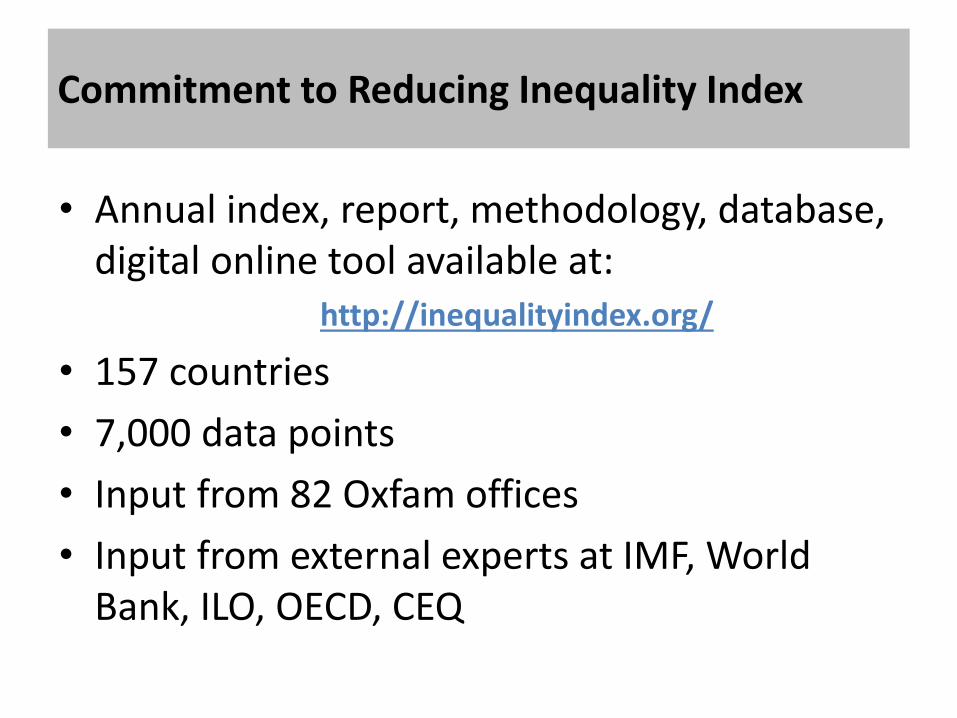
Commitment to Reducing Inequality Index
• Annual index, report, methodology, database, digital online tool available at:
http://inequalityindex.org/
• 157 countries
• 7,000 data points
• Input from 82 Oxfam offices
• Input from external experts at IMF, World Bank, ILO, OECD, CEQ
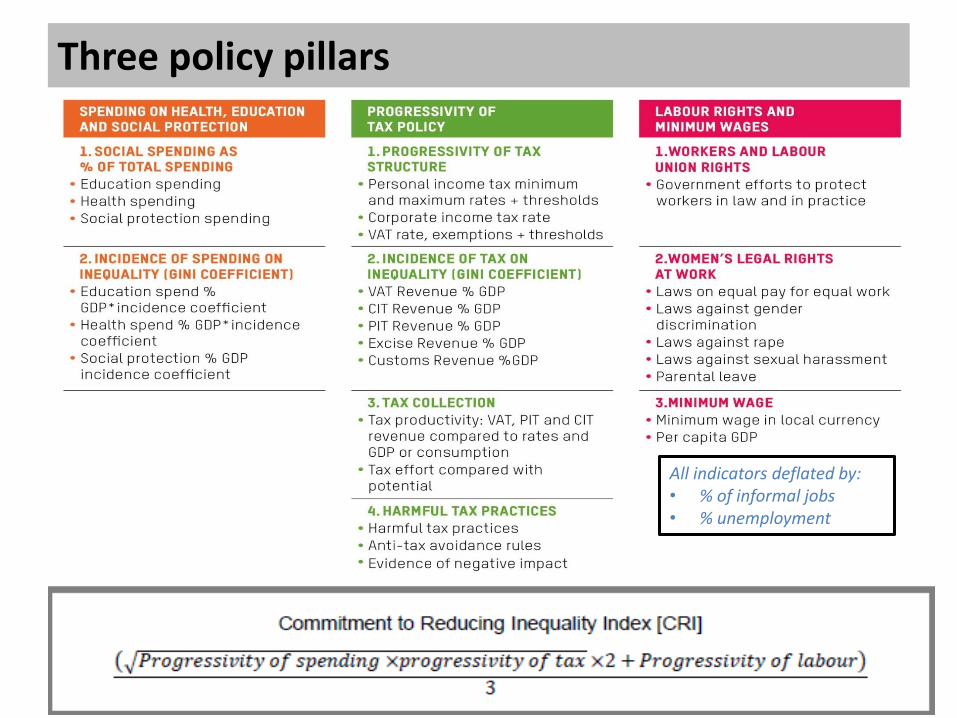
Three policy pillars
All indicators deflated by: • % of informal jobs • % unemployment
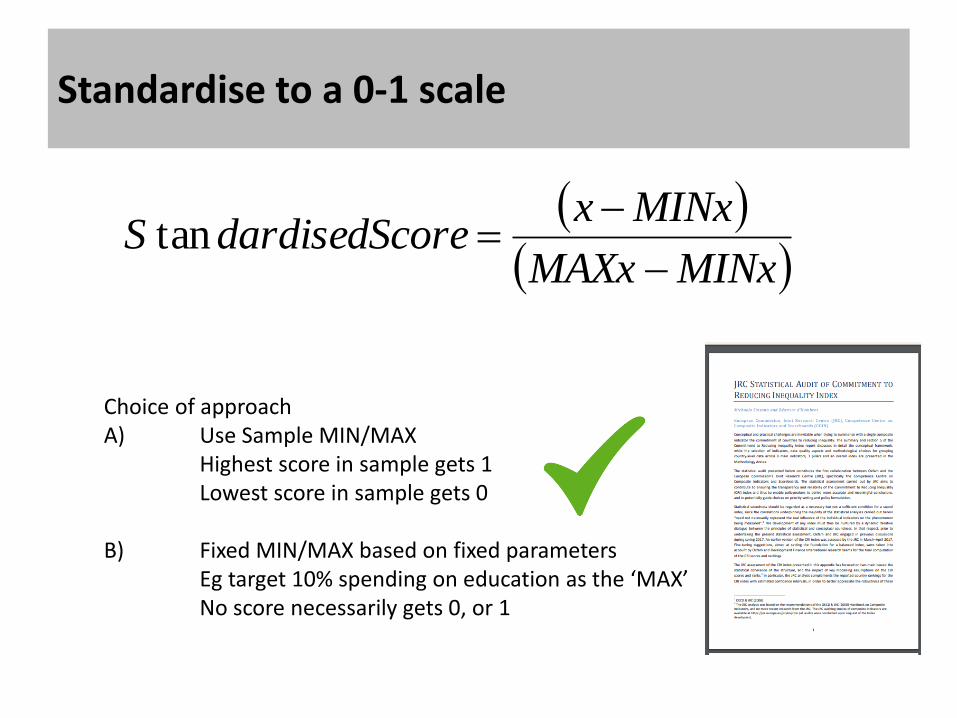
Standardise to a 0-1 scale
MINxMAXx
MINxxoredardisedScS
tan
Choice of approach A) Use Sample MIN/MAX Highest score in sample gets 1 Lowest score in sample gets 0 B) Fixed MIN/MAX based on fixed parameters
Eg target 10% spending on education as the ‘MAX’ No score necessarily gets 0, or 1
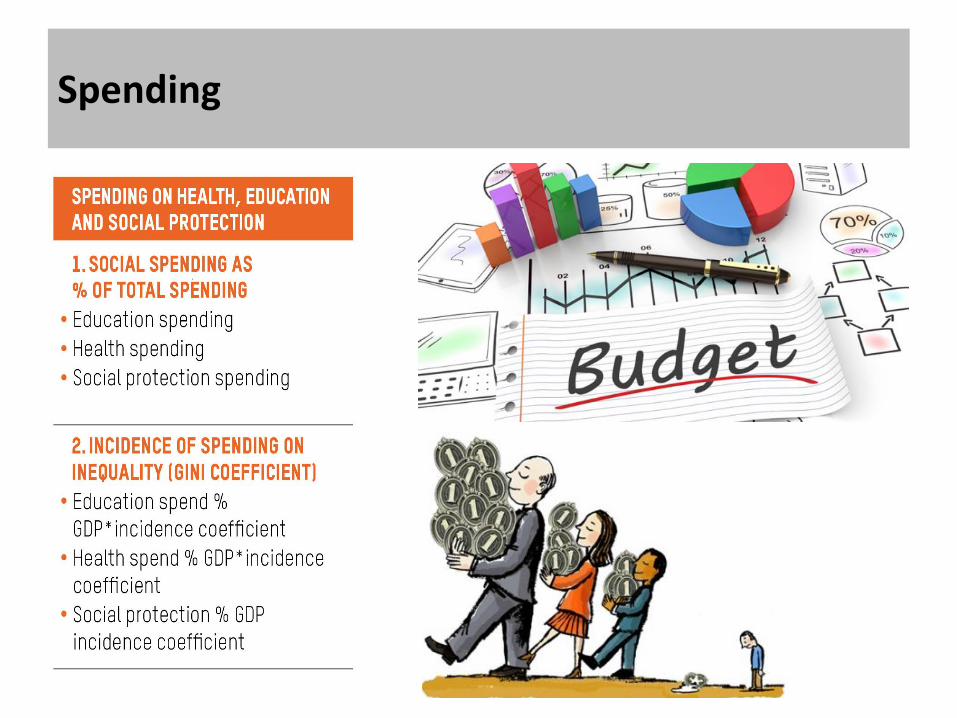
Spending
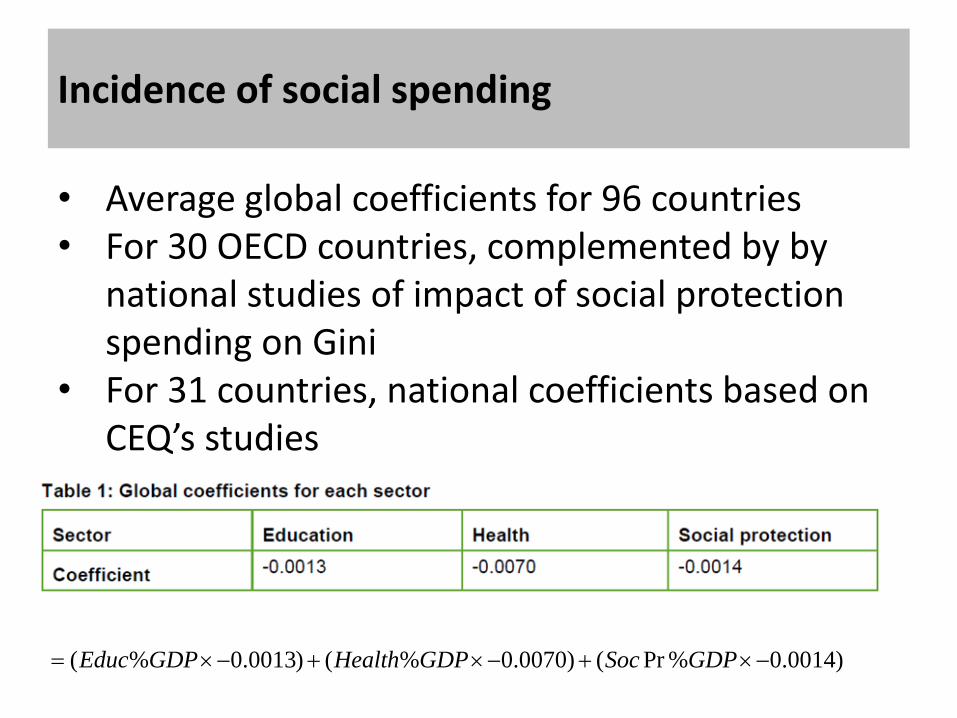
Incidence of social spending
)0014.0%Pr()0070.0%()0013.0%( GDPSocGDPHealthGDPEduc
• Average global coefficients for 96 countries • For 30 OECD countries, complemented by by
national studies of impact of social protection spending on Gini
• For 31 countries, national coefficients based on CEQ’s studies
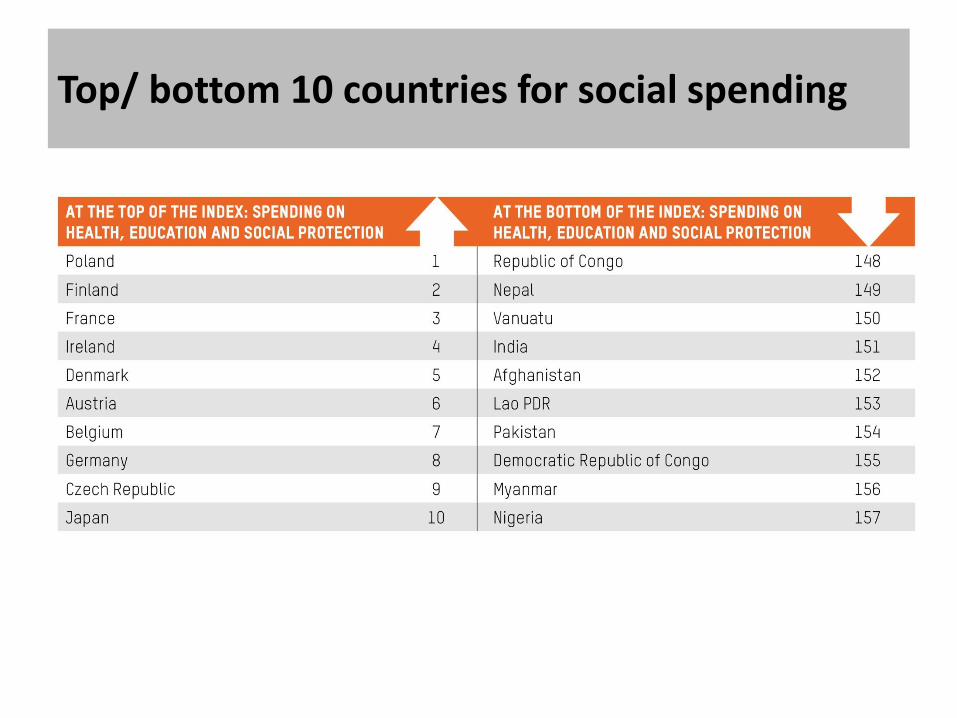
Top/ bottom 10 countries for social spending
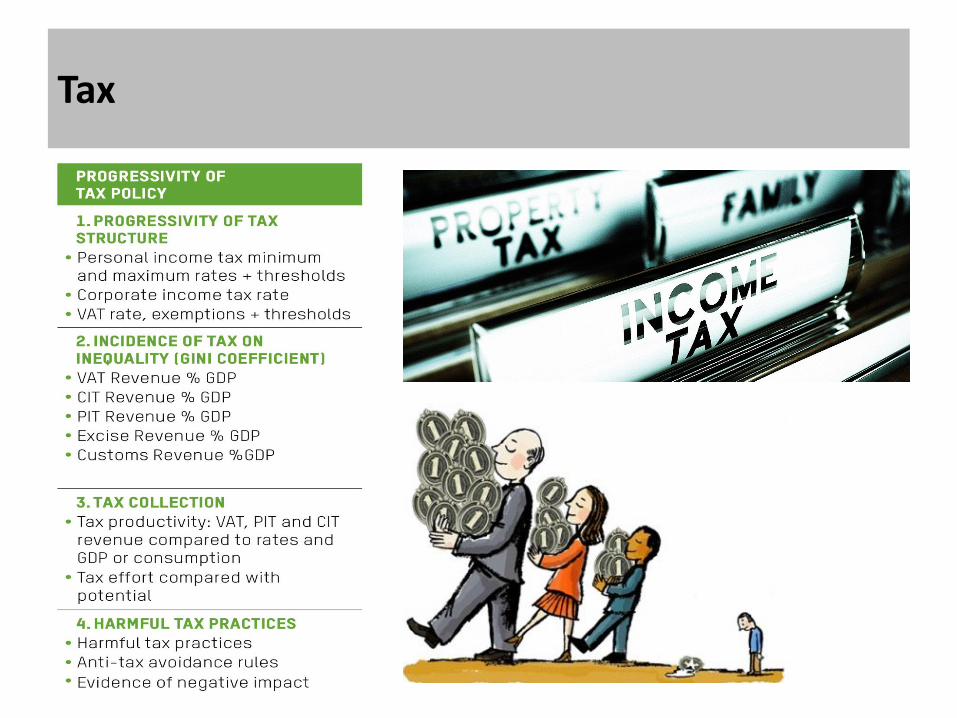
Tax
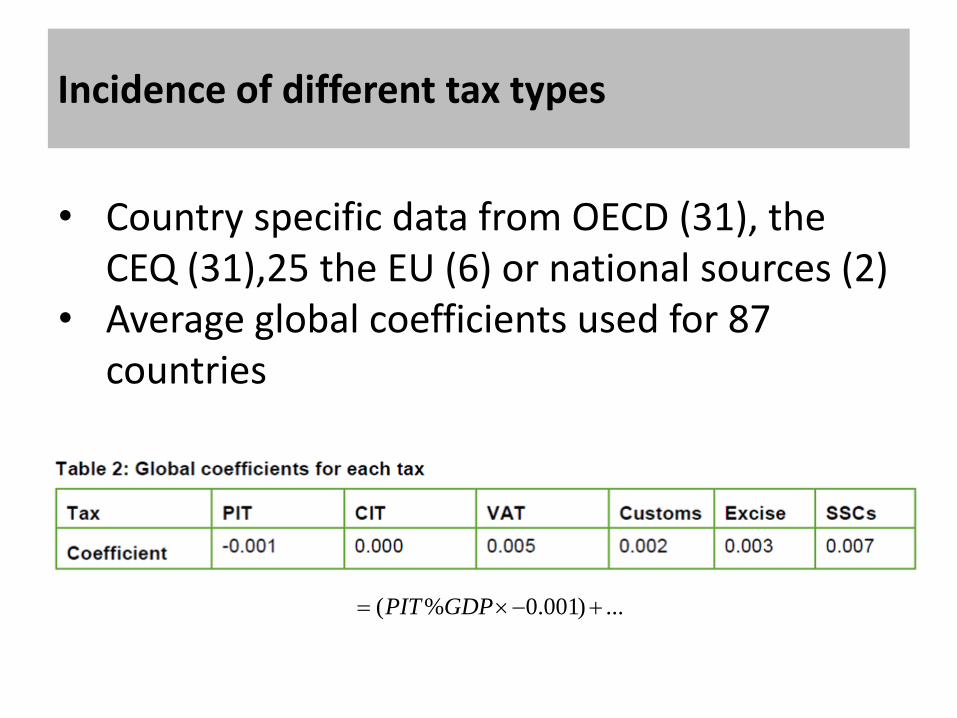
Incidence of different tax types
...)001.0%( GDPPIT
• Country specific data from OECD (31), the CEQ (31),25 the EU (6) or national sources (2)
• Average global coefficients used for 87 countries
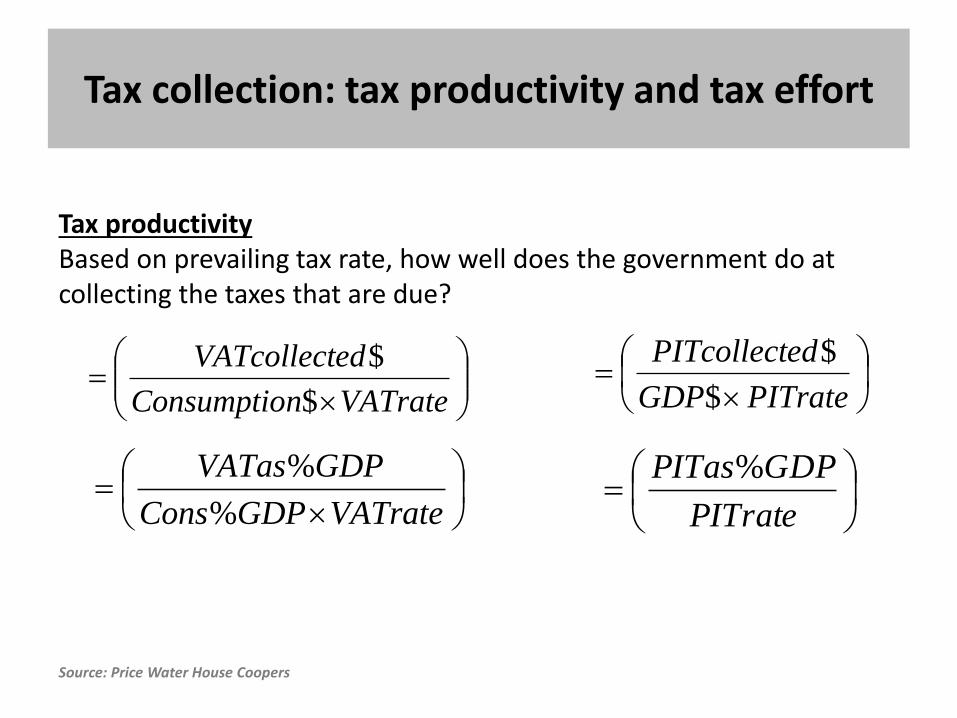
Tax collection: tax productivity and tax effort
Source: Price Water House Coopers
VATratenConsumptio
edVATcollect
$
$
VATrateGDPCons
GDPVATas
%
%
PITrateGDP
edPITcollect
$
$
PITrate
GDPPITas%
Tax productivity Based on prevailing tax rate, how well does the government do at collecting the taxes that are due?
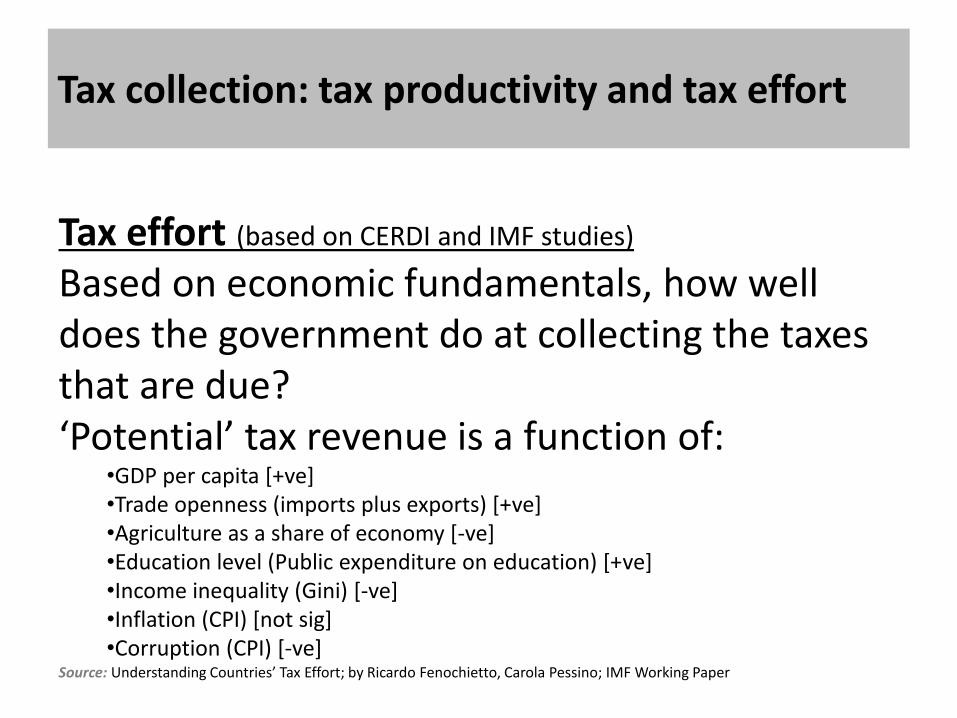
Tax collection: tax productivity and tax effort
Source: Understanding Countries’ Tax Effort; by Ricardo Fenochietto, Carola Pessino; IMF Working Paper
Tax effort (based on CERDI and IMF studies)
Based on economic fundamentals, how well does the government do at collecting the taxes that are due? ‘Potential’ tax revenue is a function of:
•GDP per capita [+ve] •Trade openness (imports plus exports) [+ve] •Agriculture as a share of economy [-ve] •Education level (Public expenditure on education) [+ve] •Income inequality (Gini) [-ve] •Inflation (CPI) [not sig] •Corruption (CPI) [-ve]
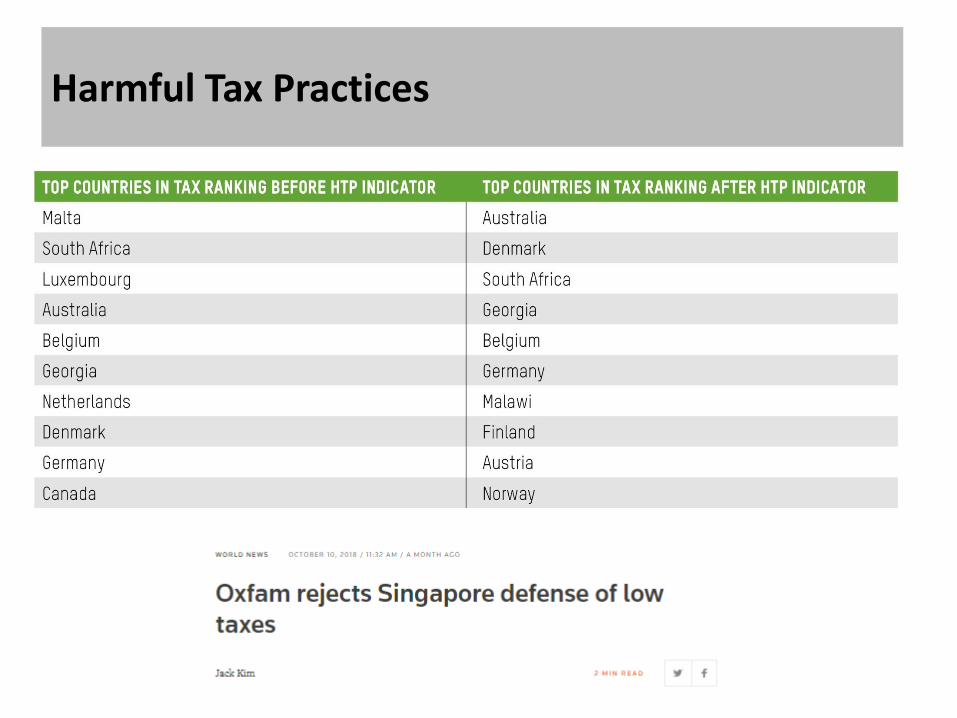
Harmful Tax Practices
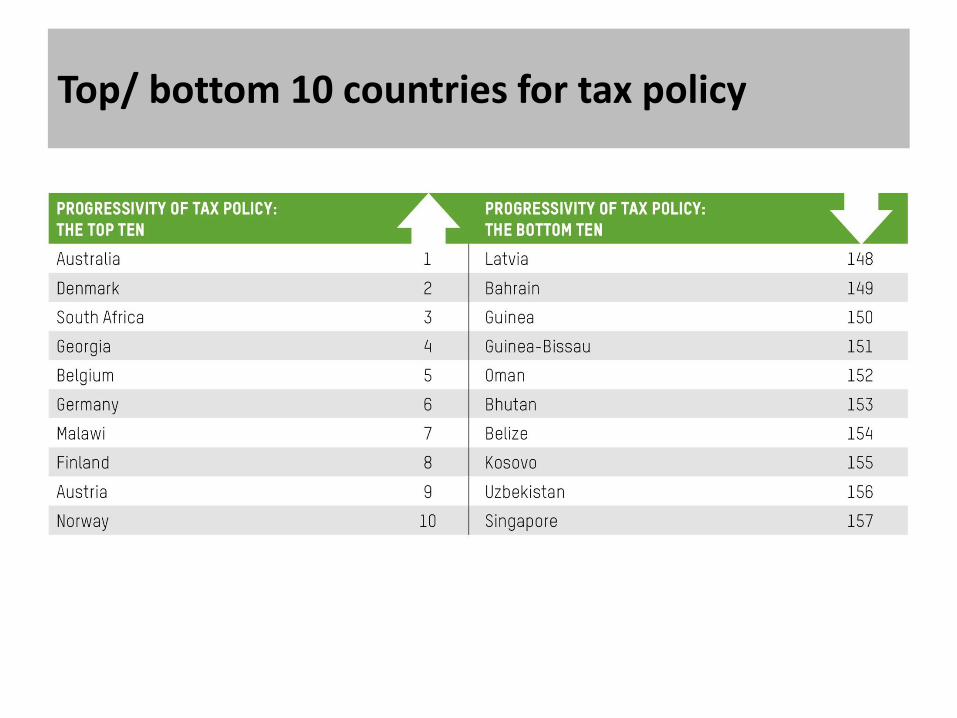
Top/ bottom 10 countries for tax policy
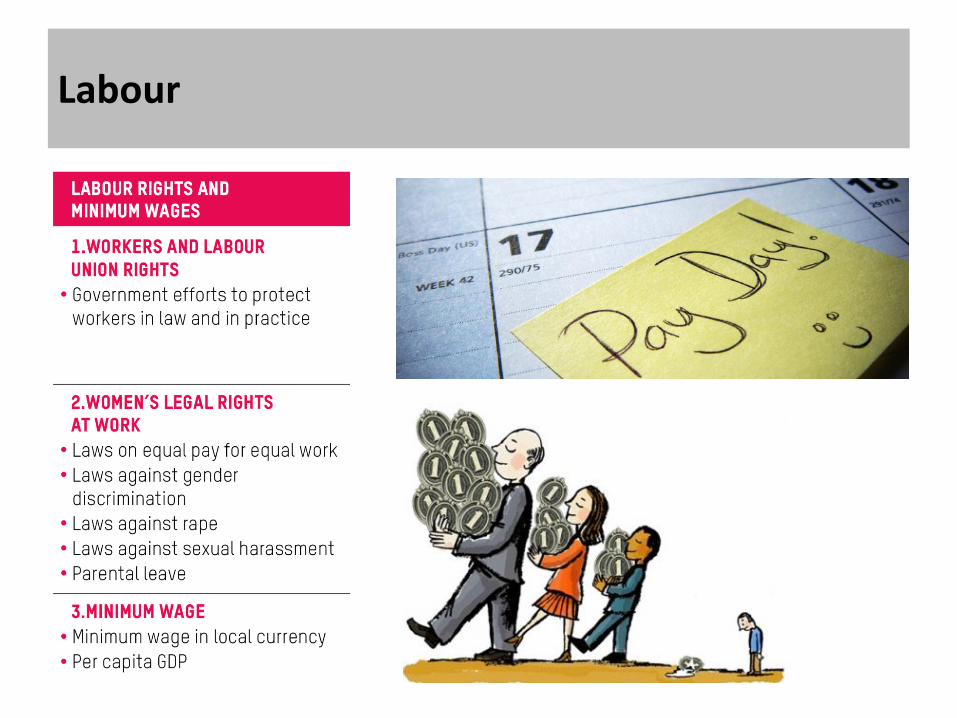
Labour
Data on women’s rights and gender equality
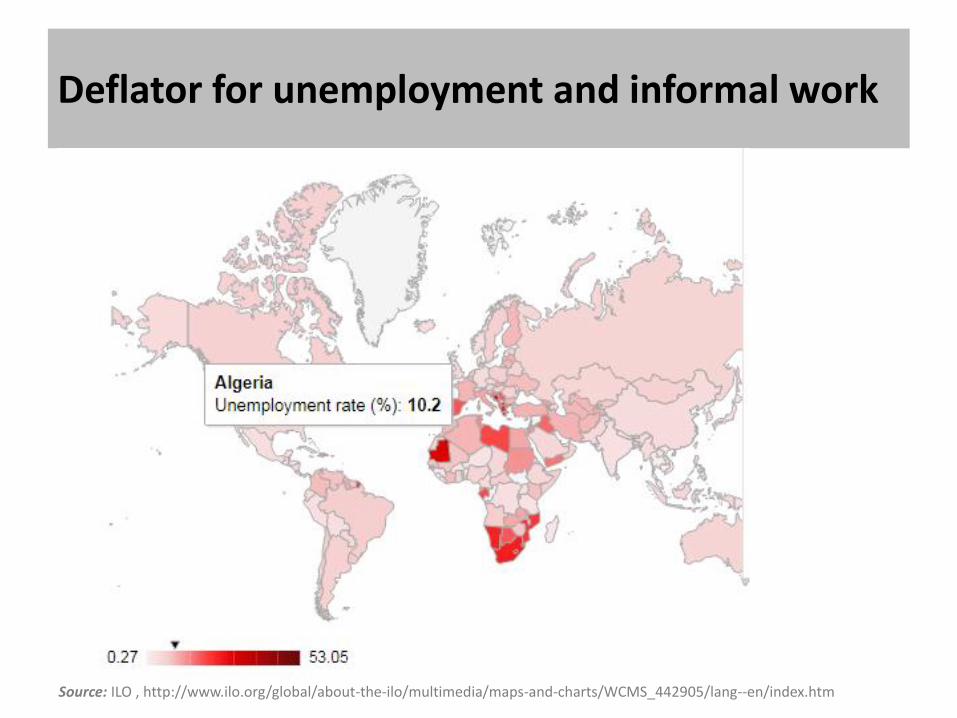
Deflator for unemployment and informal work
Source: ILO , http://www.ilo.org/global/about-the-ilo/multimedia/maps-and-charts/WCMS_442905/lang--en/index.htm
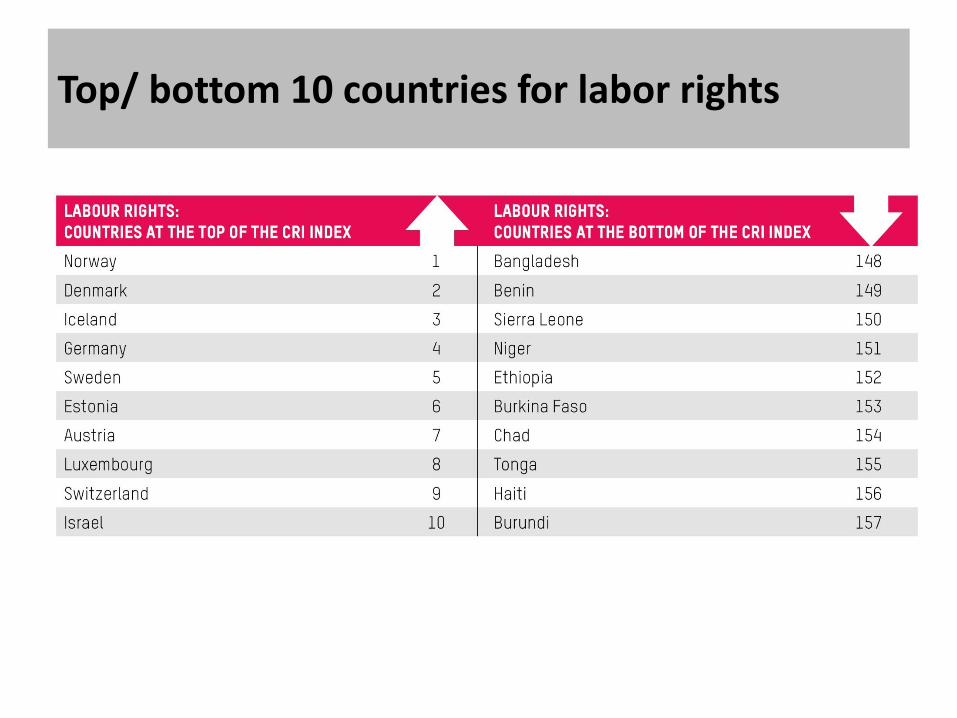
Top/ bottom 10 countries for labor rights
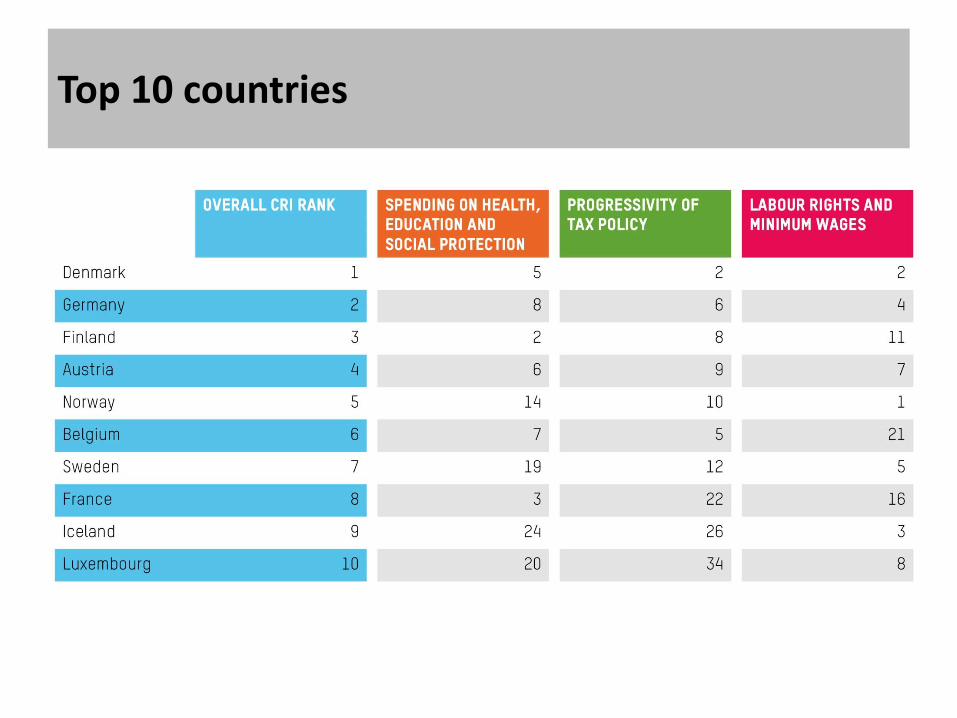
Top 10 countries
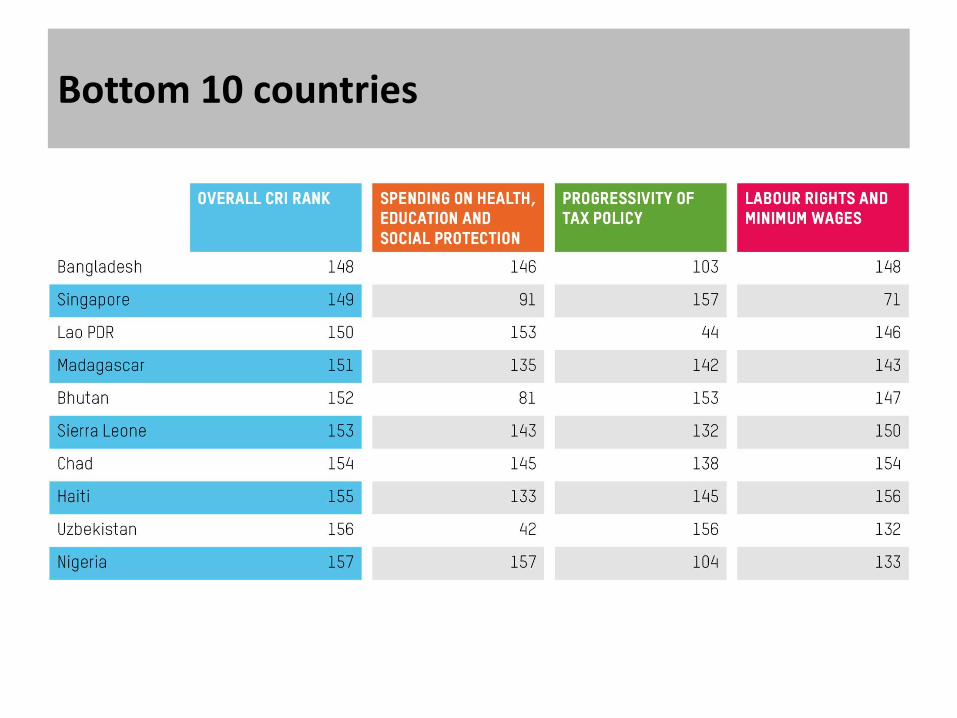
Bottom 10 countries
Key findings
• The vast majority of countries are doing much less than they could: three quarters are doing less than half of what the best do
• Nobody is doing everything they could, even the top performer Denmark 1st but 126th in tax progressivity; Germany 2nd but 142nd in education spending
• You don’t have to be rich to make progressive policy choices Poorer countries are outperforming much richer countries in a number of areas (Namibia, Ethiopia)
More than one in 5 of the countries in the top 50 are middle income countries (e.g. Namibia, Costa Rica, Tunisia, Georgia). 8 of the 47 high income countries that feature in the index fall well outside the top 50 ranks (Bahrain, Singapore)
• Positive stories: South Korea and Indonesia
Main trends between CRI 2017 and CRI 2018
• Only comparison in some indicators’ performance
• Small increase in average % of social spending (from 43.15% to 43.22% of total spend), driven by education and health.
• Mixed progress in taxation: small decrease in CIT, small increase in PIT but weaker collection rates.
• Mixed progress in labour: less legal violations but no legislation improvements with some exceptions in parental leave (Bhutan, India) and minimum wages (Indonesia, S.Korea).
Challenges and next steps
• Data gathering • Huge investment is needed in data on inequality and
on policy measures [SDG 10’S targets and indicators] • The relationship between CRI and inequality
outcome measures is complex • Trade off between methodology and data
improvement and over-time comparability • Comprehensiveness vs simplicity • Disalignment btwn a country’s ranking and its policy
debate • Launch at Annual Meetings 2018: 1st inequality
ministerial meeting to build a coalition of champions
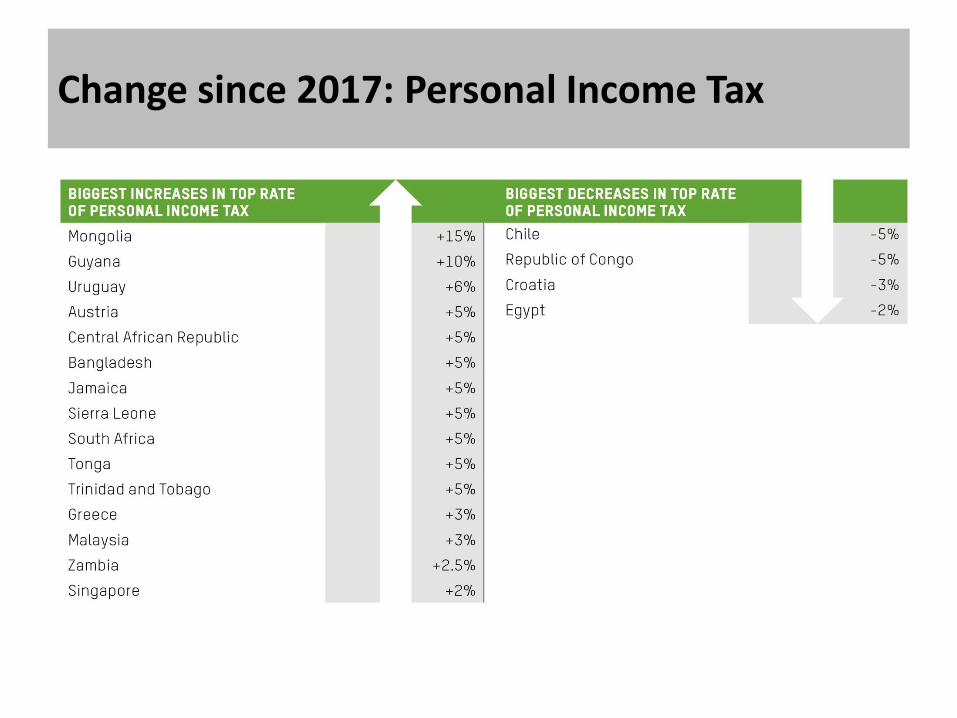
Change since 2017: Personal Income Tax
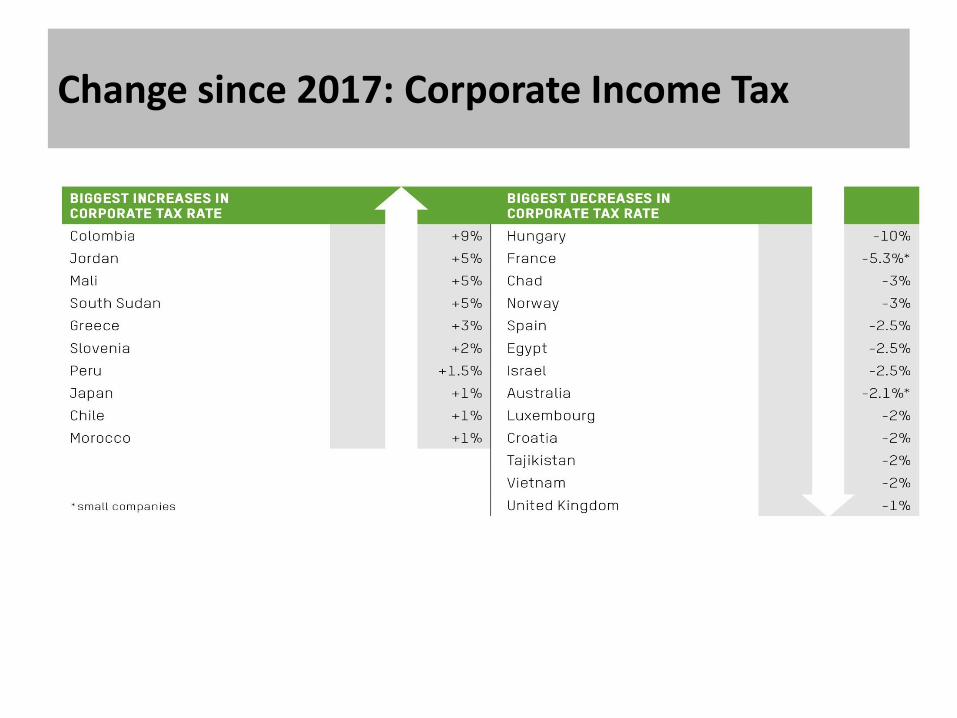
Change since 2017: Corporate Income Tax
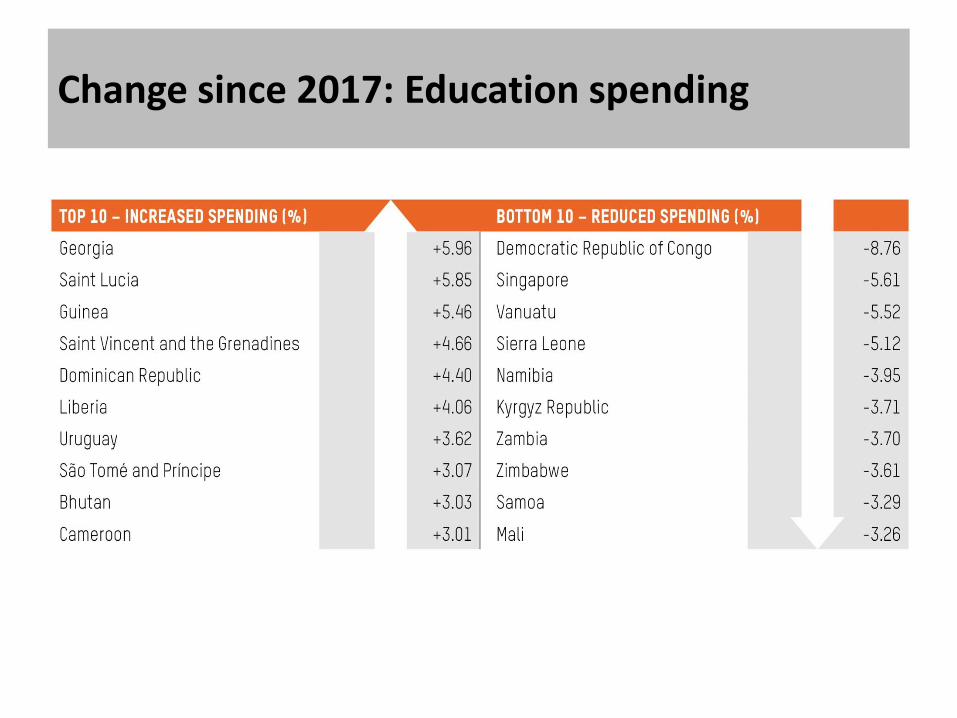
Change since 2017: Education spending

Change since 2017: Health spending
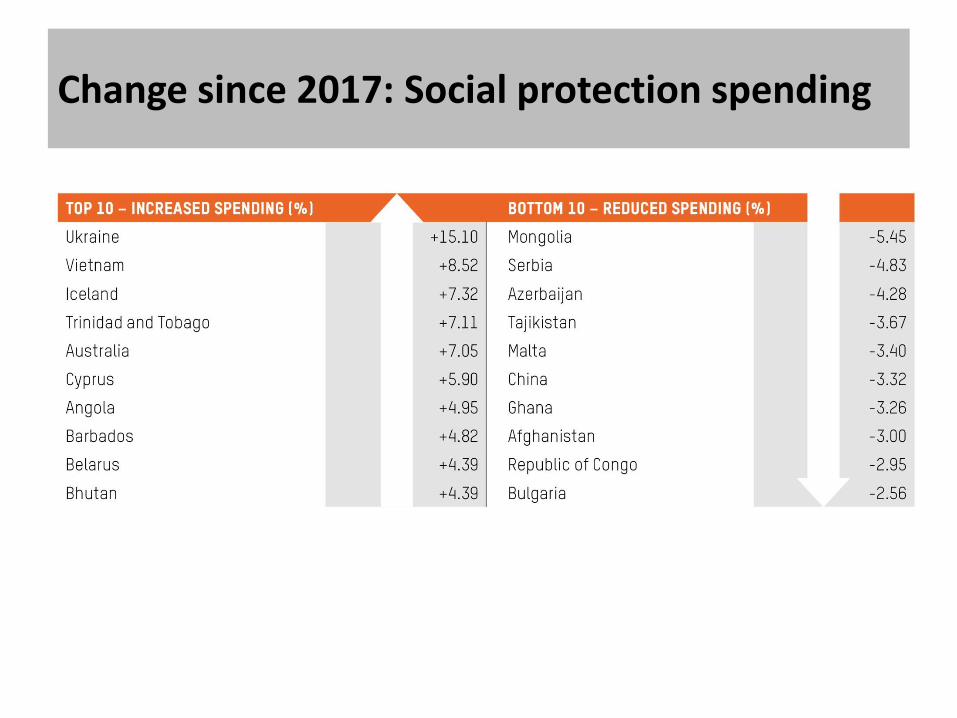
Change since 2017: Social protection spending
Measuring and Motivating: Using data to incentivise progressive policies
ADDITIONAL SLIDES
Didier Jacobs Senior Policy Advisor Oxfam America
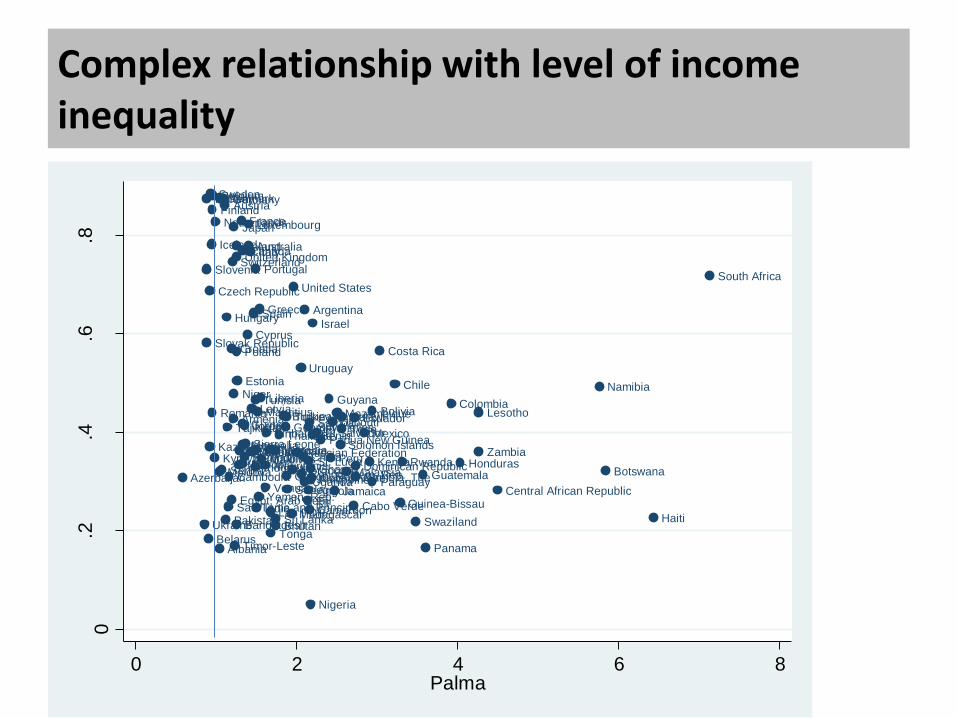
Complex relationship with level of income inequality
AustriaFinlandGermany
FranceJapan
DenmarkNorwaySwedenBelgium
Slovenia
Italy
Netherlands
Czech Republic
IrelandUnited Kingdom
Portugal
Iceland
Luxembourg
AustraliaCanada
Greece
Slovak Republic
Spain
Switzerland
Hungary
Poland
Argentina
South AfricaUnited States
Israel
Latvia
Estonia
Costa RicaCroatia
Uruguay
Cyprus
Serbia
Romania
Chile NamibiaLiberia Guyana
Samoa
Lithuania
Moldova
Bolivia
Niger
Bulgaria
ColombiaTunisia
ArmeniaTogo
MauritiusBurkina FasoTurkeyGuinea
Dominican Republic
Mexico
Mozambique Lesotho
TajikistanEcuador
Paraguay
Sierra LeoneMongoliaEl Salvador
Solomon IslandsKiribati
MalawiDjibouti
Papua New Guinea
St. LuciaMaldives
Benin
Kyrgyz Republic
Jordan
PeruMorocco
Cote d'Ivoire
Seychelles
Ukraine
Nepal Russian Federation
Tonga
BurundiVietnamAlgeria
Sao Tome and Principe
Guatemala
Albania
China ZambiaMali
ThailandGeorgia
Rwanda
Belarus
Madagascar
TanzaniaKenya
Cambodia
Bhutan
Kazakhstan
Congo, Dem. Rep.Gambia, The
Cabo Verde
HondurasEthiopia
Jamaica Central African Republic
Congo, Rep.
Guinea-Bissau
Ghana
SenegalPhilippines
Botswana
Egypt, Arab Rep.
Indonesia
Uganda
MauritaniaMalaysia
Azerbaijan
Swaziland
VanuatuAngolaYemen, Rep.Fiji
Panama
HaitiCameroon
Pakistan
Timor-Leste
IndiaSri Lanka
BangladeshLao PDR
Nigeria
0.2
.4.6
.8
CR
I sco
re
0 2 4 6 8Palma
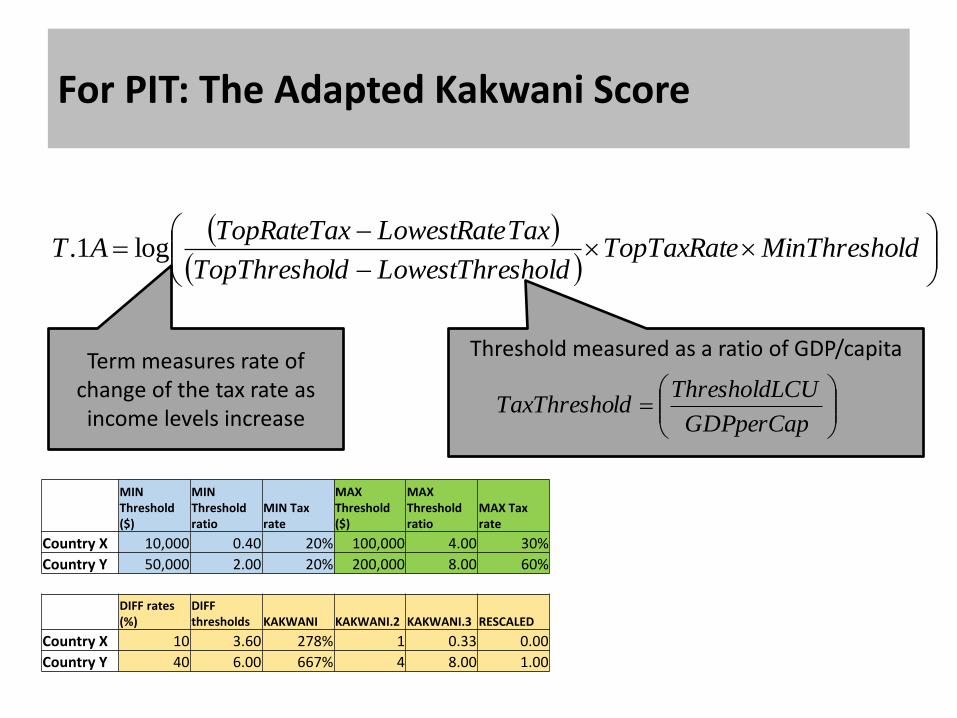
For PIT: The Adapted Kakwani Score
ldMinThreshoTopTaxRate
sholdLowestThreldTopThresho
TaxLowestRateTopRateTaxAT log1.
MIN Threshold ($)
MIN Threshold ratio
MIN Tax rate
MAX Threshold ($)
MAX Threshold ratio
MAX Tax rate
Country X 10,000 0.40 20% 100,000 4.00 30%
Country Y 50,000 2.00 20% 200,000 8.00 60%
DIFF rates (%)
DIFF thresholds KAKWANI KAKWANI.2 KAKWANI.3 RESCALED
Country X 10 3.60 278% 1 0.33 0.00
Country Y 40 6.00 667% 4 8.00 1.00
Term measures rate of change of the tax rate as income levels increase
Threshold measured as a ratio of GDP/capita
GDPperCap
CUThresholdLldTaxThresho
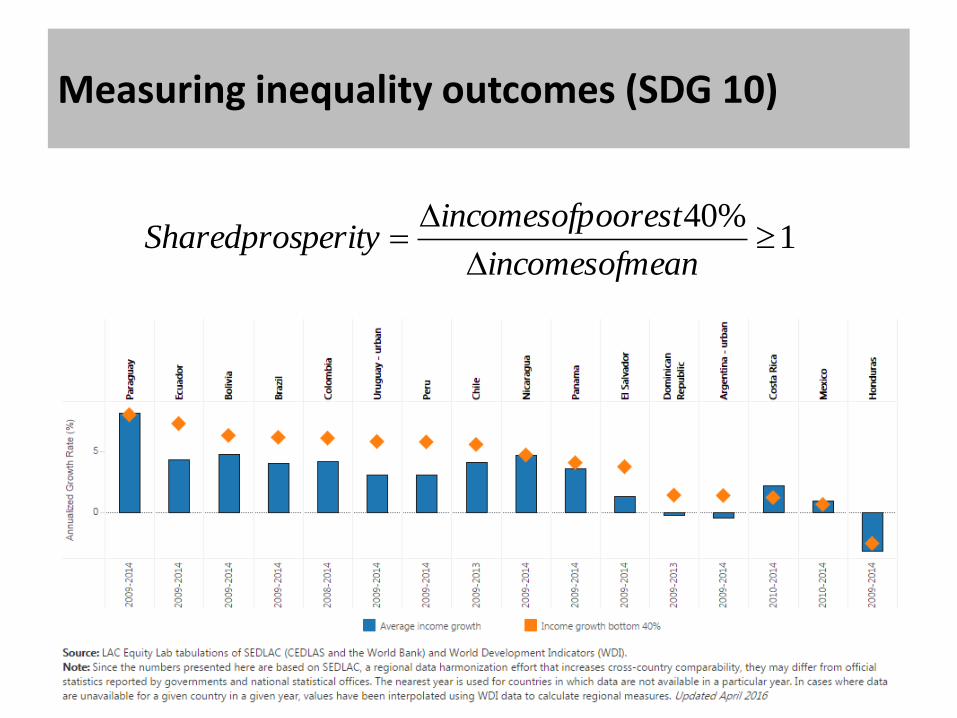
Measuring inequality outcomes (SDG 10)
1%40
eanincomesofm
oorestincomesofpperitySharedpros
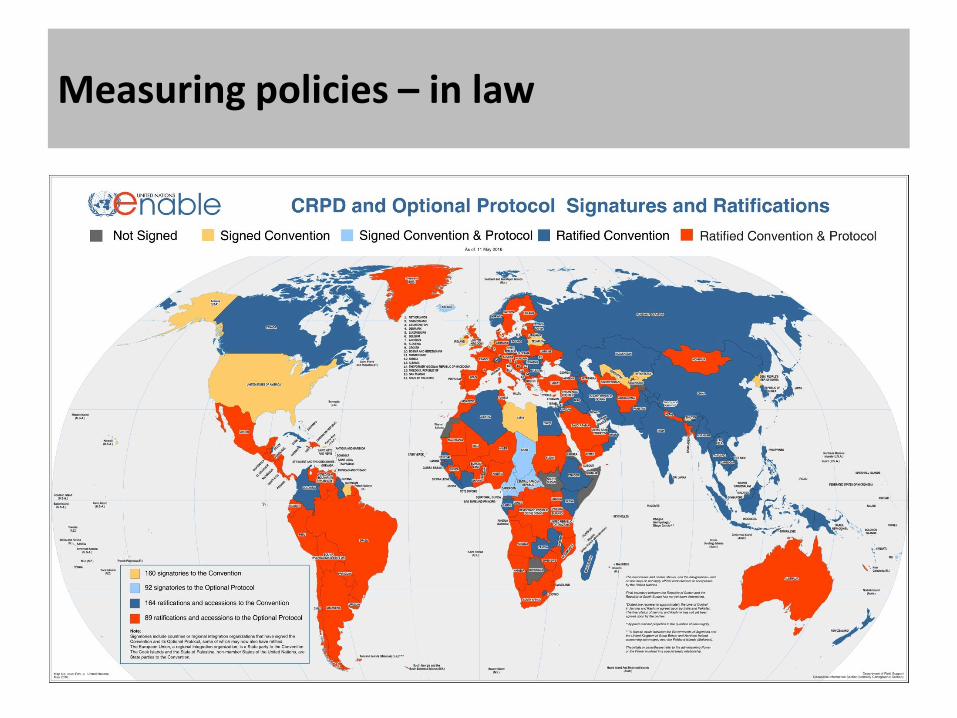
Measuring policies – in law
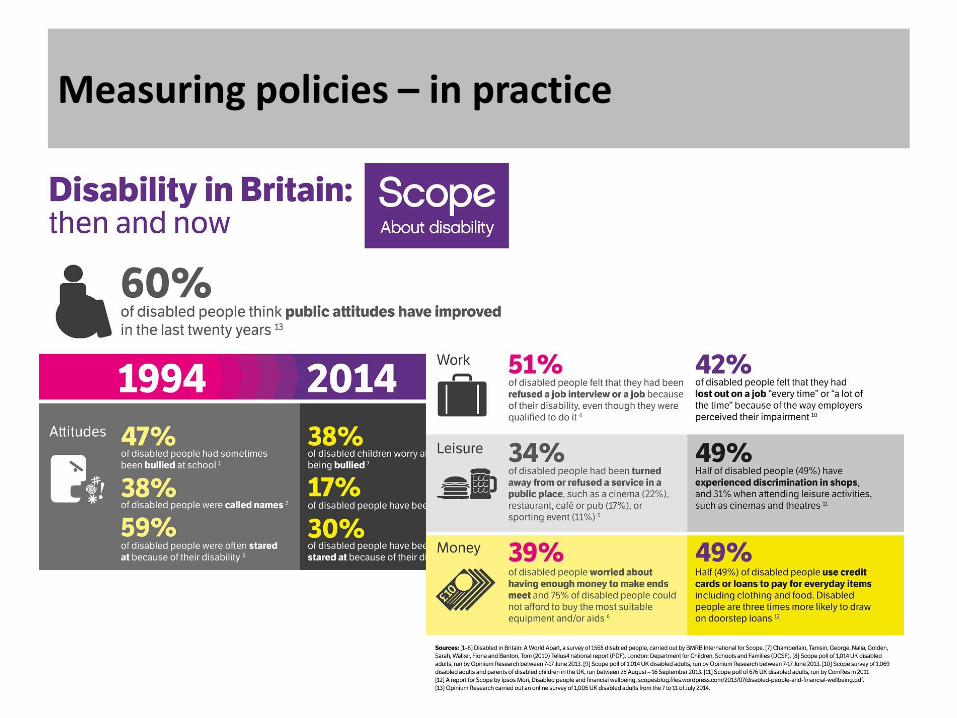
Measuring policies – in practice
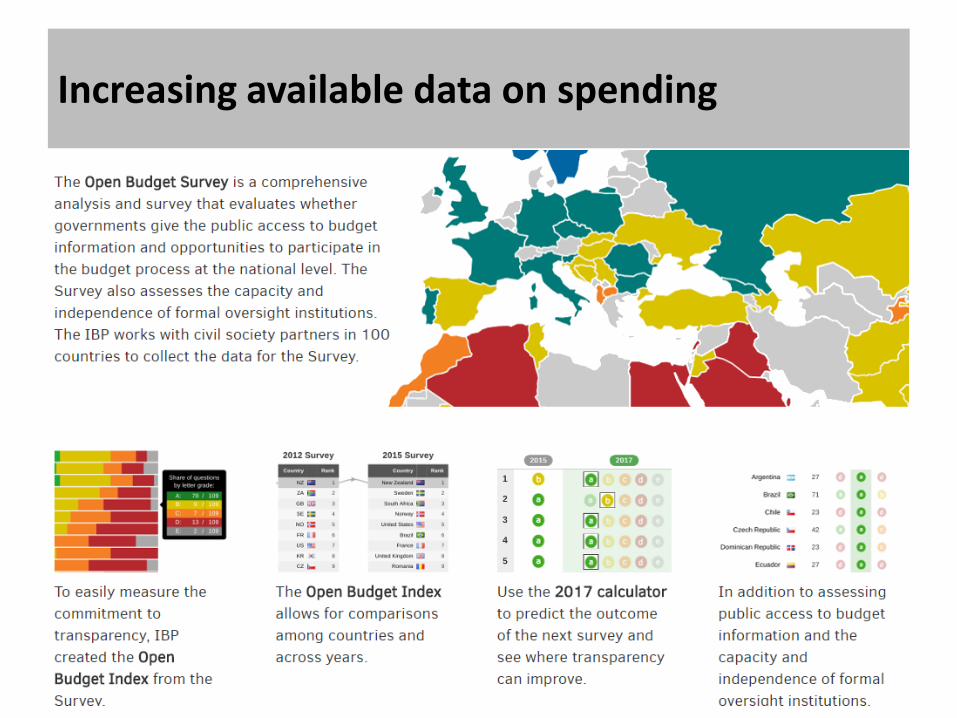
Increasing available data on spending
Social protection spending can boost the incomes of the poorest
What is social protection? “‘the public actions taken in response to levels of vulnerability, risk and deprivation which are deemed socially unacceptable within a given polity or society.’ ODI, (2001), “SOCIAL PROTECTION CONCEPTS AND APPROACHES: IMPLICATIONS FOR POLICY AND PRACTICE IN INTERNATIONAL DEVELOPMENT”
What’s included in social protection spending? In the EU-28 in 2015, expenditure on social protection stood at 19.2 % of GDP, 40.6 % of total expenditure. •'old age' = 10.3 % of GDP (pension payments) •'survivors‘ = 1.4 % of GDP (social benefits in cash or in kind) •'Sickness and disability‘ = 2.8 % of GDP (social payments in the operation of social insurance schemes) •'family and children' = 1.7 % of GDP, •'unemployment' = 1.4 % of GDP •'Housing' = 0.5 % of GDP (payments to households to help with the cost of housing as well as of social housing schemes) EUROSTAT, http://ec.europa.eu/eurostat/statistics-explained/index.php/Government_expenditure_on_social_protection
Social protection and inequality “In OECD countries, social protection schemes tend to be much larger and have been shown to reduce inequality by as much as 30%.” OECD, 2011, “In It Together”
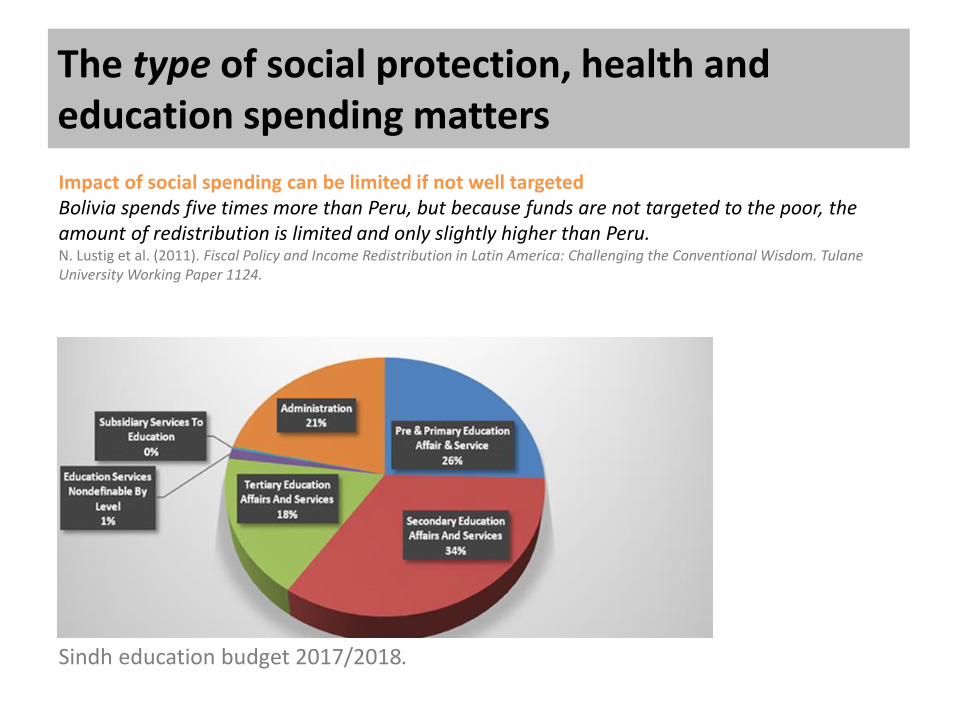
The type of social protection, health and education spending matters
Impact of social spending can be limited if not well targeted Bolivia spends five times more than Peru, but because funds are not targeted to the poor, the amount of redistribution is limited and only slightly higher than Peru. N. Lustig et al. (2011). Fiscal Policy and Income Redistribution in Latin America: Challenging the Conventional Wisdom. Tulane University Working Paper 1124.
Sindh education budget 2017/2018.
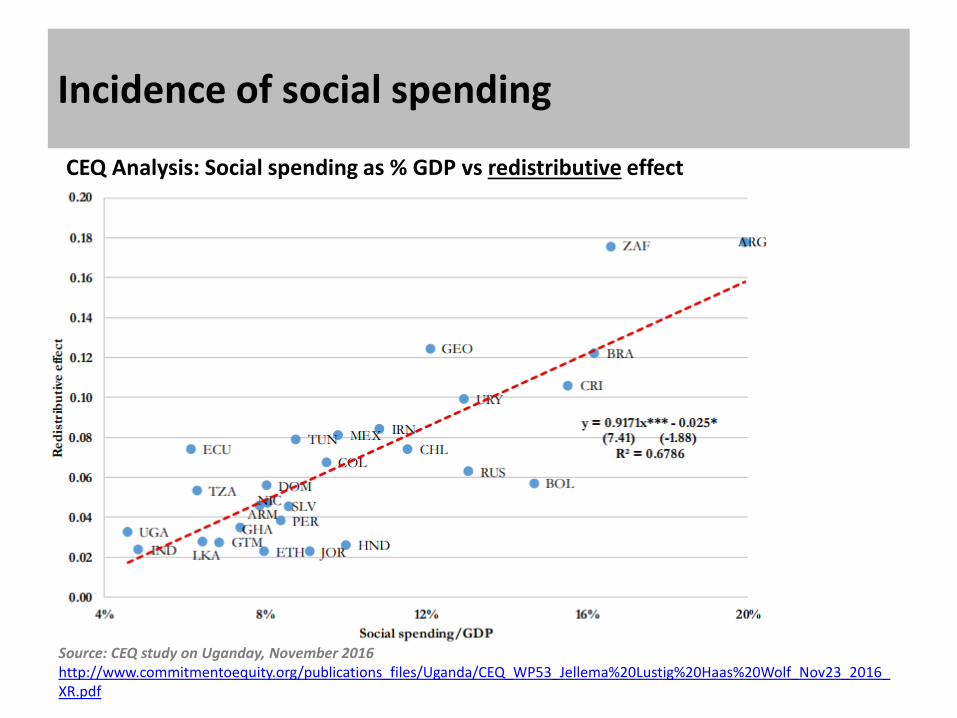
Incidence of social spending
CEQ Analysis: Social spending as % GDP vs redistributive effect
Source: CEQ study on Uganday, November 2016 http://www.commitmentoequity.org/publications_files/Uganda/CEQ_WP53_Jellema%20Lustig%20Haas%20Wolf_Nov23_2016_XR.pdf
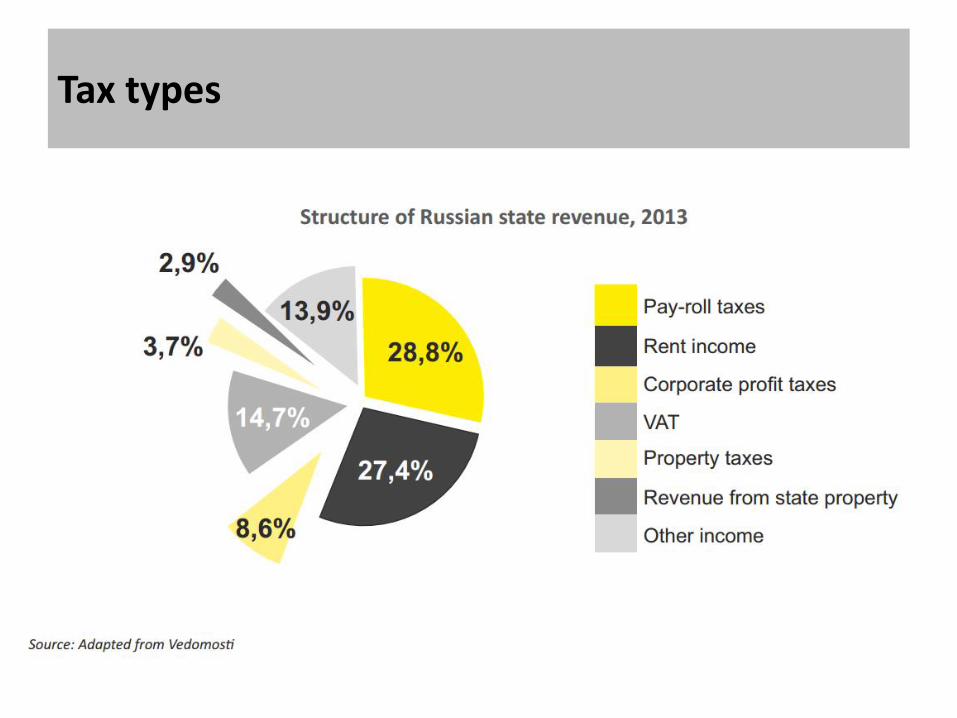
Tax types
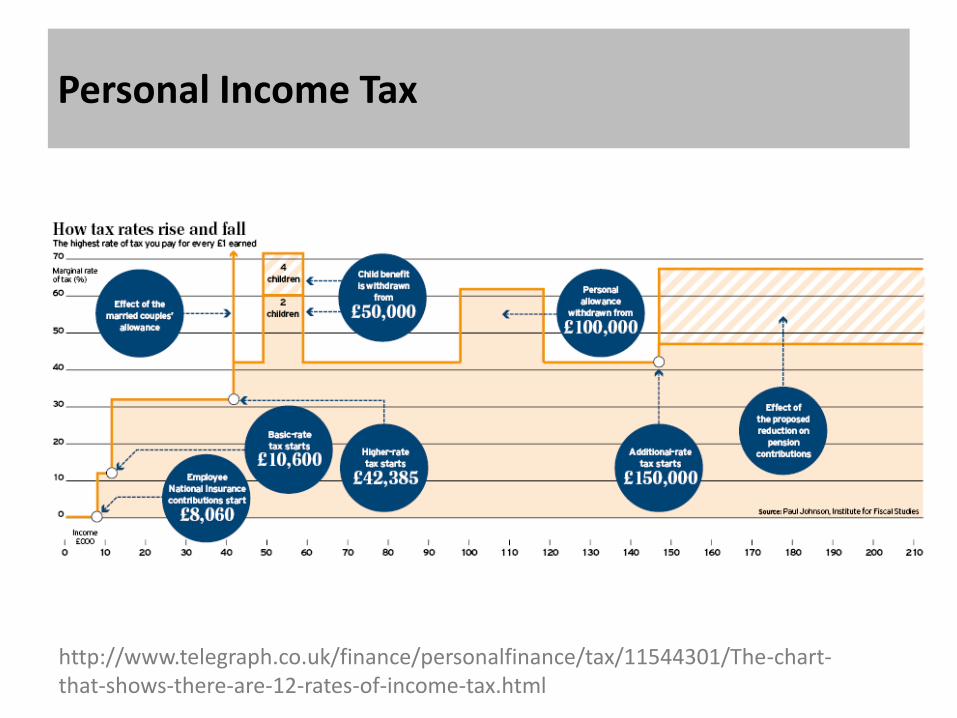
Personal Income Tax
http://www.telegraph.co.uk/finance/personalfinance/tax/11544301/The-chart-that-shows-there-are-12-rates-of-income-tax.html
Corporate Income Tax
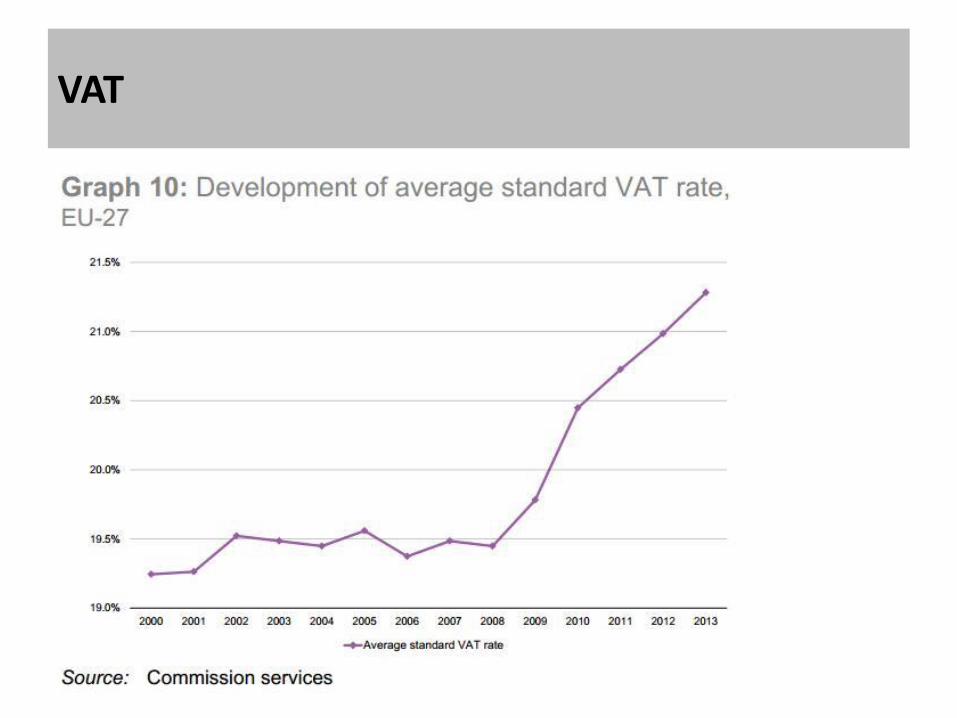
VAT
Tax is a powerful redistributive mechanism... depending how it is designed
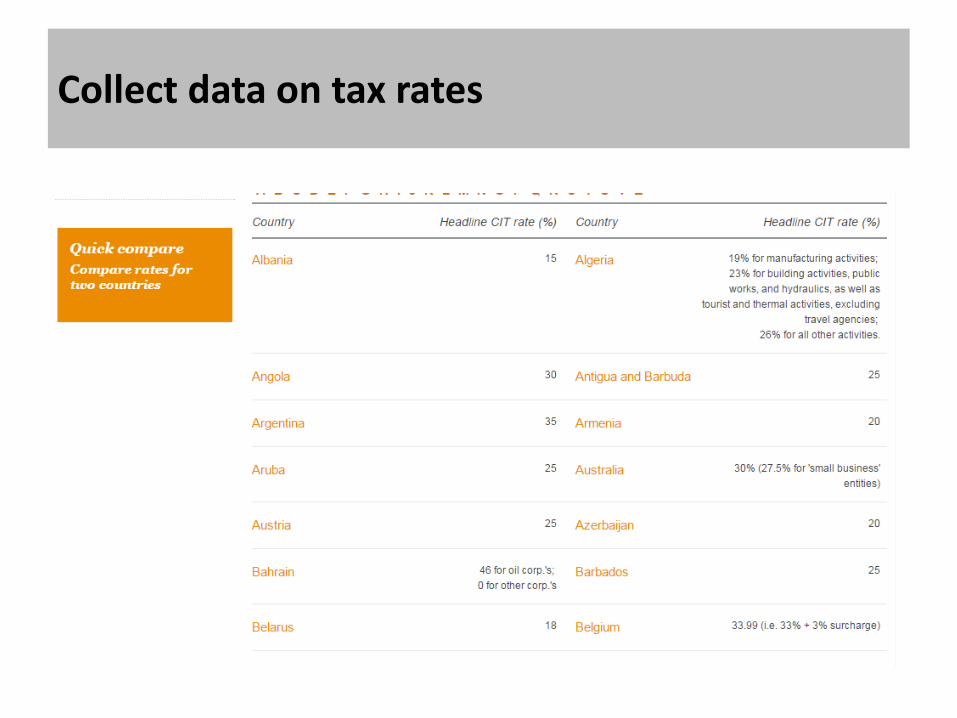
Collect data on tax rates
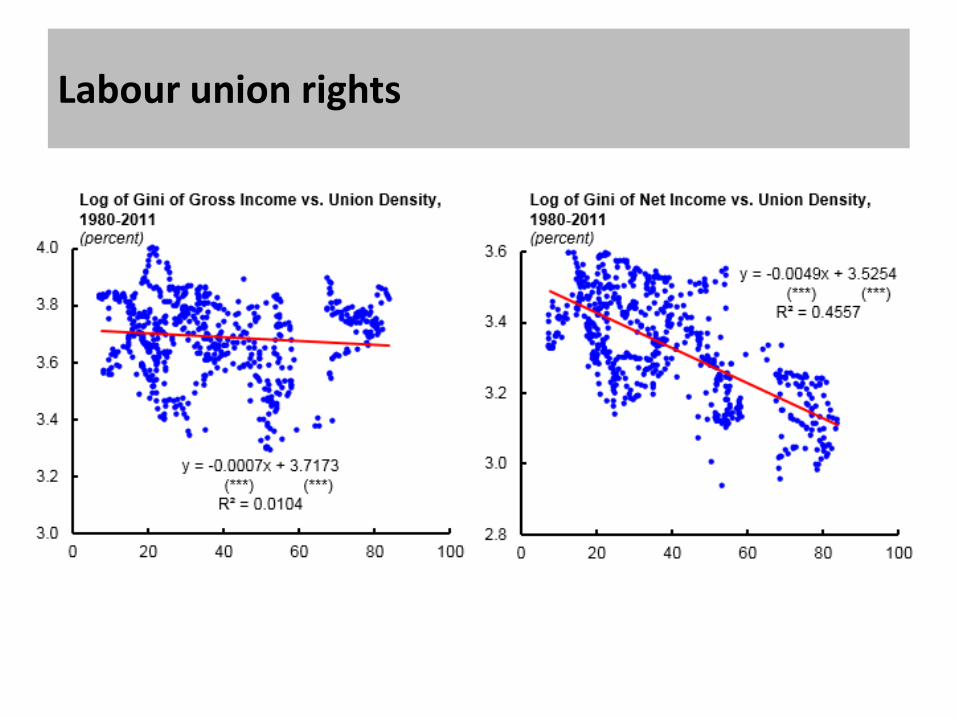
Labour union rights
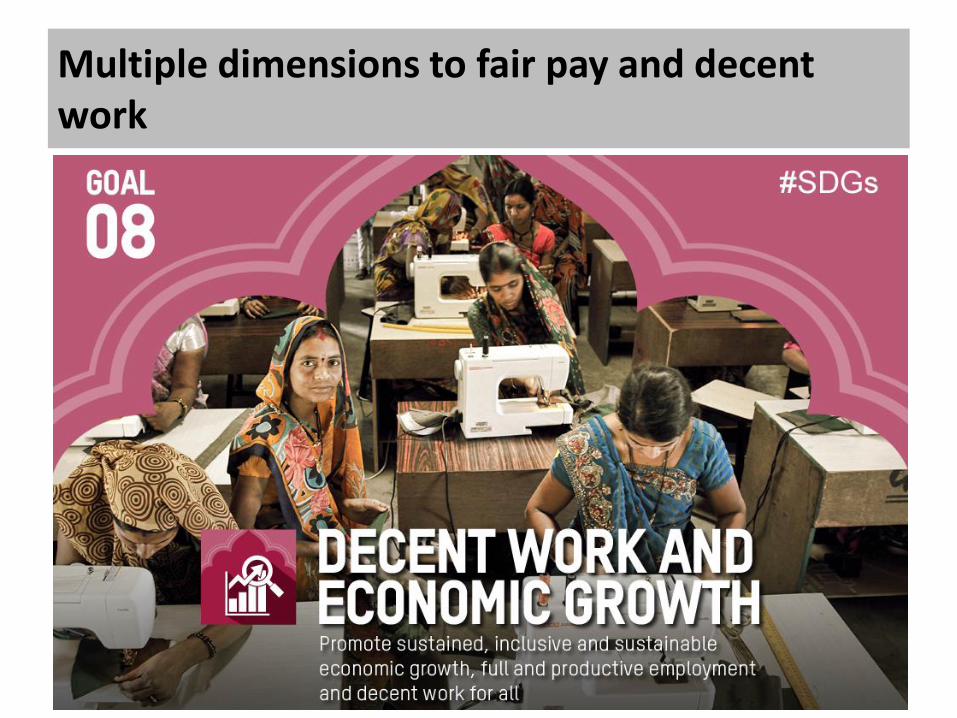
Multiple dimensions to fair pay and decent work
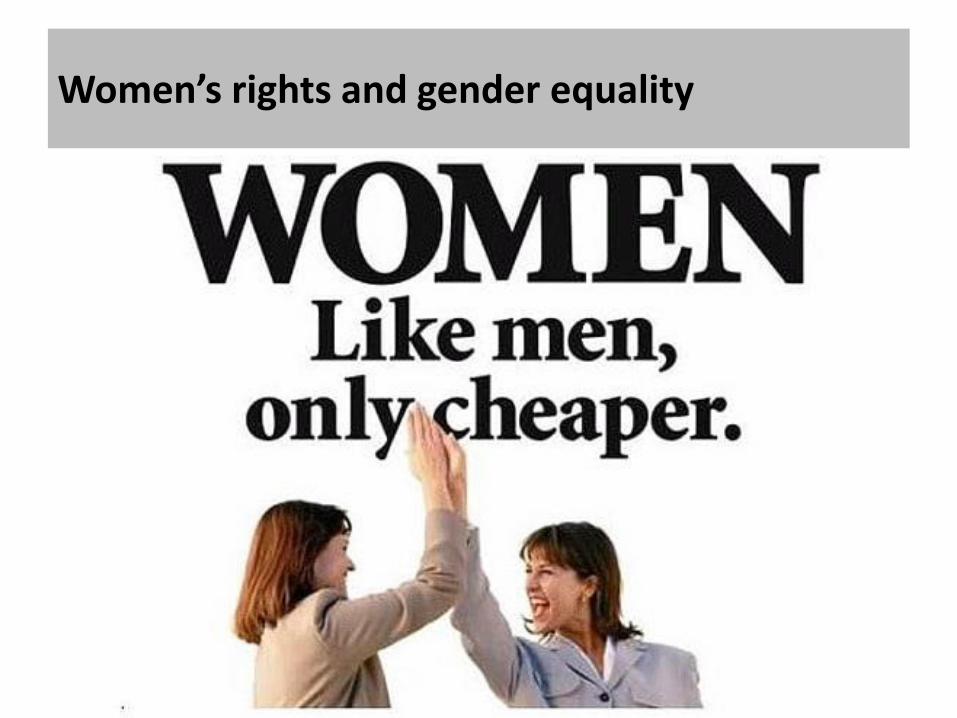
Women’s rights and gender equality
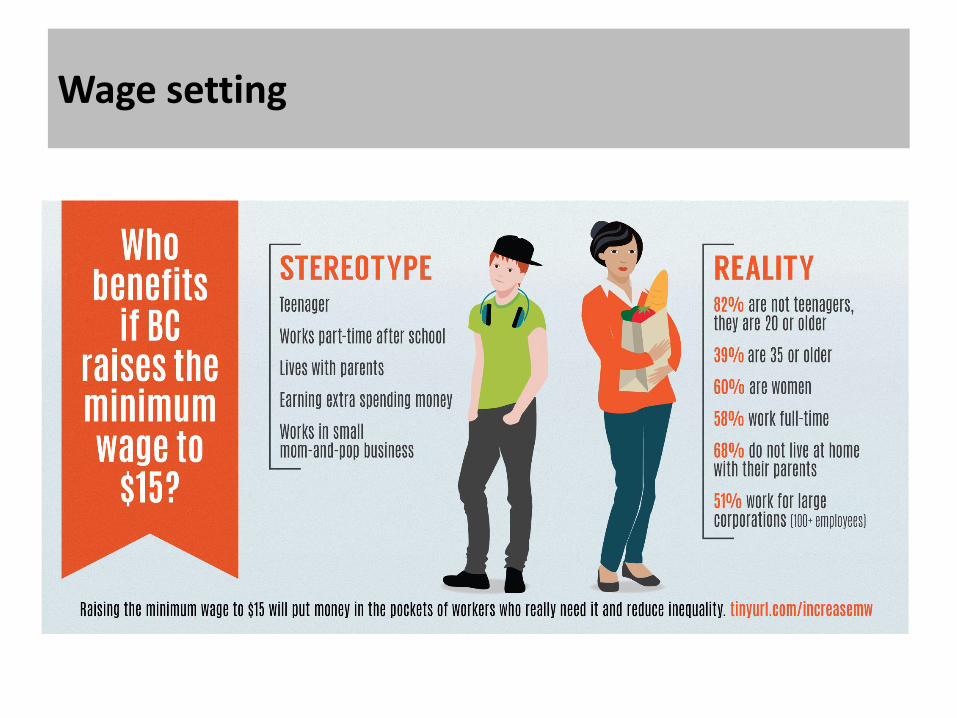
Wage setting
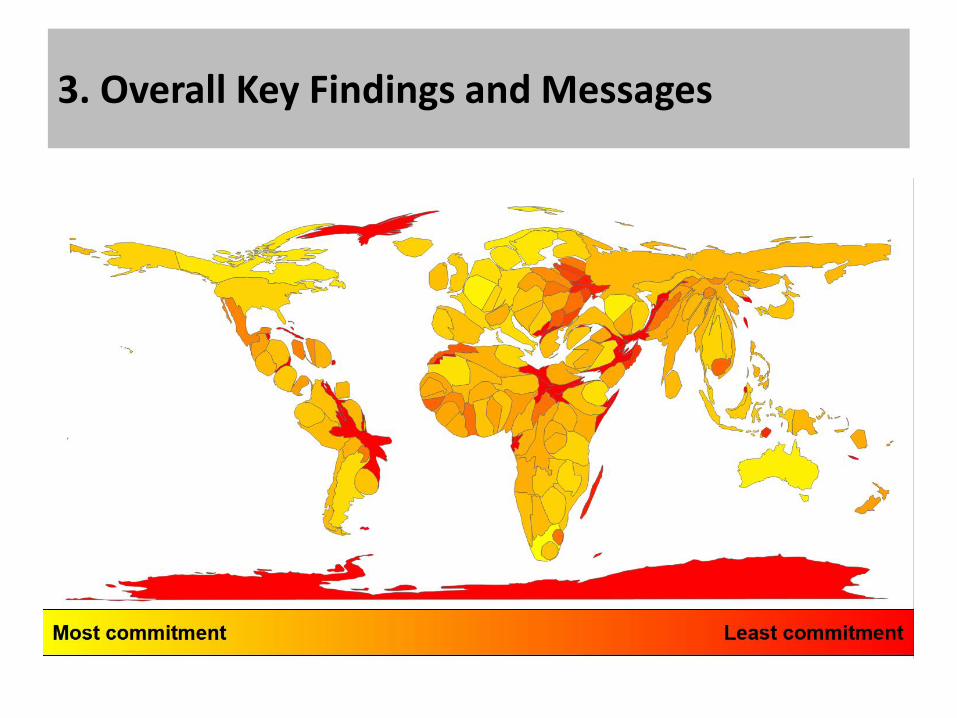
3. Overall Key Findings and Messages
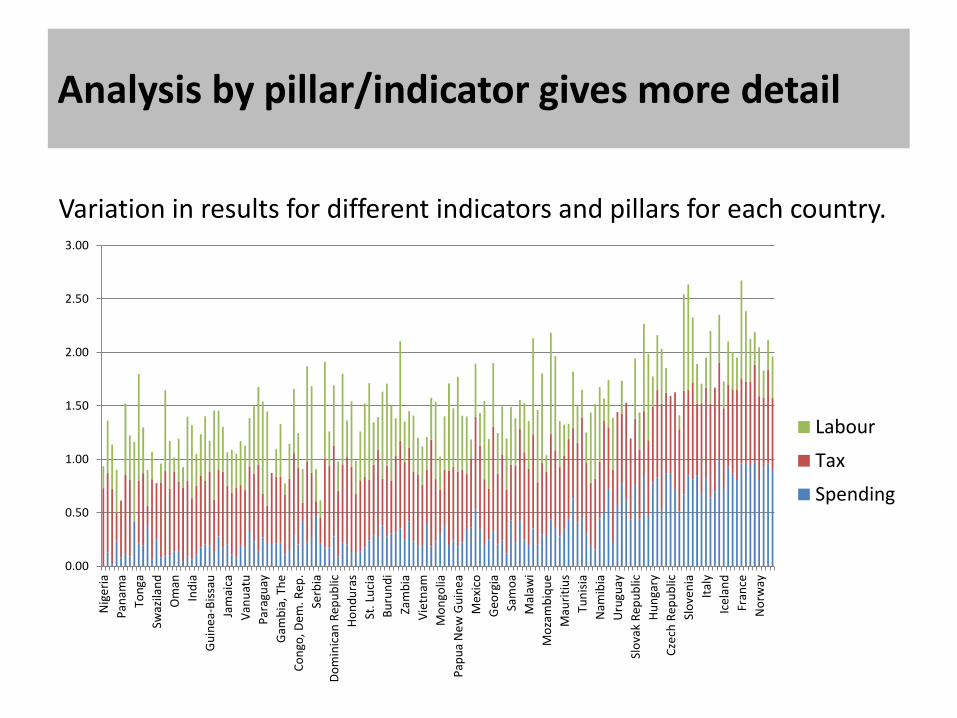
Analysis by pillar/indicator gives more detail
Variation in results for different indicators and pillars for each country.
0.00
0.50
1.00
1.50
2.00
2.50
3.00
Nig
eri
a
Pan
ama
Ton
ga
Swaz
ilan
d
Om
an
Ind
ia
Gu
ine
a-B
issa
u
Jam
aica
Van
uat
u
Par
agu
ay
Gam
bia
, Th
e
Co
ngo
, De
m. R
ep
.
Serb
ia
Do
min
ican
Rep
ub
lic
Ho
nd
ura
s
St. L
uci
a
Bu
run
di
Zam
bia
Vie
tnam
Mo
ngo
lia
Pap
ua
Ne
w G
uin
ea
Me
xico
Geo
rgia
Sam
oa
Mal
awi
Mo
zam
biq
ue
Mau
riti
us
Tun
isia
Nam
ibia
Uru
guay
Slo
vak
Rep
ub
lic
Hu
nga
ry
Cze
ch R
epu
blic
Slo
ven
ia
Ital
y
Ice
lan
d
Fran
ce
No
rway
Labour
Tax
Spending
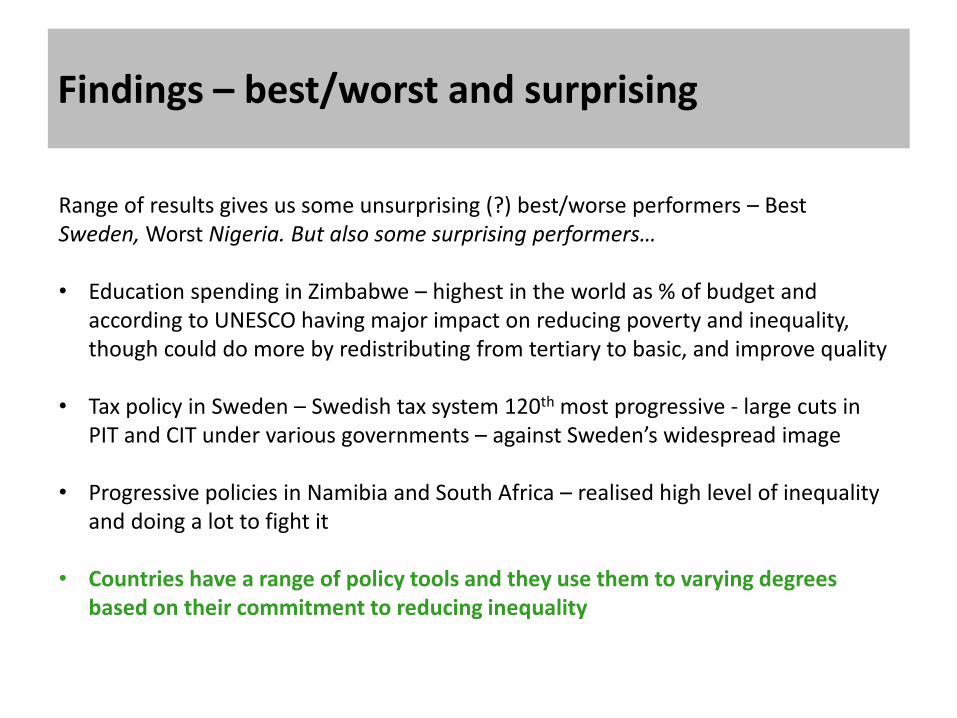
Findings – best/worst and surprising
Range of results gives us some unsurprising (?) best/worse performers – Best Sweden, Worst Nigeria. But also some surprising performers… • Education spending in Zimbabwe – highest in the world as % of budget and
according to UNESCO having major impact on reducing poverty and inequality, though could do more by redistributing from tertiary to basic, and improve quality
• Tax policy in Sweden – Swedish tax system 120th most progressive - large cuts in
PIT and CIT under various governments – against Sweden’s widespread image • Progressive policies in Namibia and South Africa – realised high level of inequality
and doing a lot to fight it
• Countries have a range of policy tools and they use them to varying degrees based on their commitment to reducing inequality
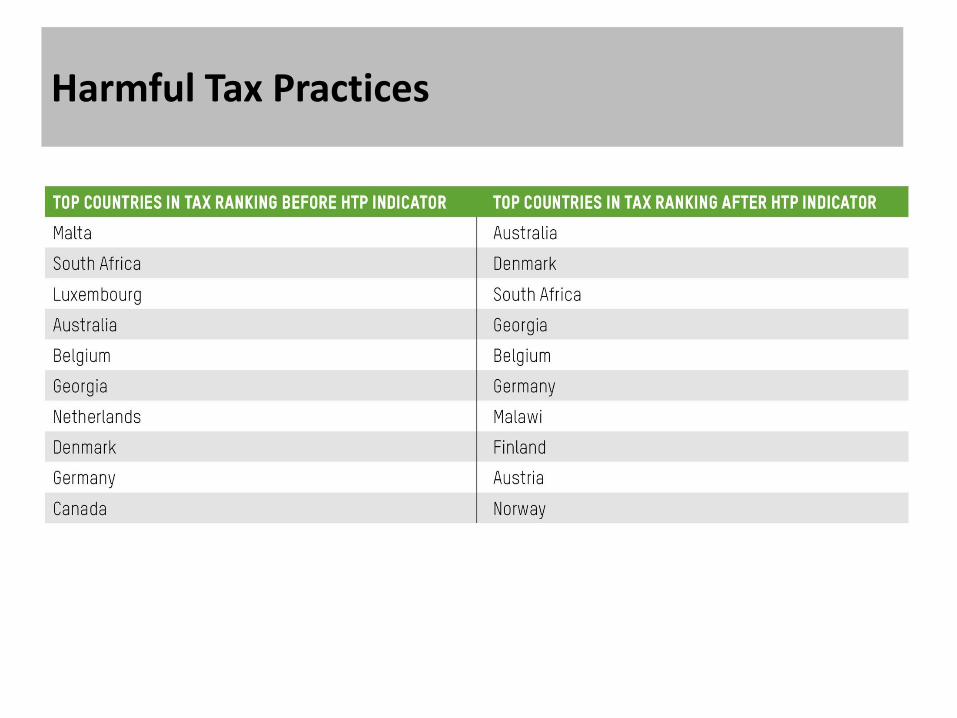
Harmful Tax Practices

Change since 2017: Education spending

Change since 2017: Health spending

Change since 2017: Social protection spending

Change since 2017: Personal Income Tax

Change since 2017: Corporate Income Tax