reducing income inequality while boosting economic · pdf filethere is growing consensus that...
TRANSCRIPT
Economic Policy Reforms 2012
Going for Growth
© OECD 2012
181
PART II
Chapter 5
Reducing income inequality while boosting economic growth:
Can it be done?
This chapter identifies inequality patterns across OECD countries and provides newanalysis of their policy and non-policy drivers. One key finding is that education andanti-discrimination policies, well-designed labour market institutions and large and/orprogressive tax and transfer systems can all reduce income inequality. On thisbasis, the chapter identifies several policy reforms that could yield a double dividendin terms of boosting GDP per capita and reducing income inequality, and also flagsother policy areas where reforms would entail a trade-off between both objectives.
II.5. REDUCING INCOME INEQUALITY WHILE BOOSTING ECONOMIC GROWTH: CAN IT BE DONE?
ECONOMIC POLICY REFORMS 2012: GOING FOR GROWTH © OECD 2012182
Summary and conclusionsIn many OECD countries, income inequality has increased in past decades. In some
countries, top earners have captured a large share of the overall income gains, while for
others income has risen only a little. There is growing consensus that assessments of
economic performance should not focus solely on overall income growth, but also take into
account income distribution. Some see poverty as the relevant concern while others are
concerned with income inequality more generally. A key question is whether the type of
growth-enhancing policy reforms advocated for each OECD country and the BRIICS in Going
for Growth might have positive or negative side effects on income inequality. More broadly,
in pursuing growth and redistribution strategies simultaneously, policy makers need to be
aware of possible complementarities or trade-offs between the two objectives.
This chapter sheds new light on this issue, following up on recent OECD work (OECD,
2011). It first highlights differences in income inequality across the OECD and the factors
driving them, such as cross-country differences in wage and non-wage income inequality,
as well as in hours worked and inactivity. The chapter then provides new analysis of the
policy and non-policy determinants of overall income inequality, assessing separately the
drivers of labour income inequality and the redistributive role of tax and transfer systems.
In each case, the analysis identifies “win-win” policies that can both reduce inequality and
promote economic growth, and also highlights policies that may entail trade-offs between
the two policy goals.
OECD countries can be divided into five groups according to their patterns of
inequality. For example, in five English-speaking countries (Australia, Canada, Ireland,
New Zealand and the United Kingdom) and the Netherlands wages are rather dispersed
and the share of part-time employment is high, driving inequality in labour earnings above
the OECD average. Means-tested public cash transfers and progressive household taxes
reduce overall income inequality, but it remains above the OECD average. At the other end
of the scale, four Nordic countries and Switzerland all have comparatively low labour
income inequality because wage dispersion is narrow and employment rates are high.
Cash transfers tend to be universal and are thus less redistributive. Income inequality for
this group is considerably below the OECD average.
This chapter also presents new empirical analysis which shows that although
technological change and globalisation have played a role in widening the distribution of
labour income, the marked cross-country variation is likely due to differences in policies
and institutions. This leads to the following conclusions about policies and institutions:
● Education policies matter. Policies that increase graduation rates from upper secondary
and tertiary education and that also promote equal access to education help reduce
inequality.
● Well-designed labour market policies and institutions can reduce inequality. A relatively
high minimum wage narrows the distribution of labour income, but if set too high it may
reduce employment, which dampens its inequality-reducing effect. Institutional
II.5. REDUCING INCOME INEQUALITY WHILE BOOSTING ECONOMIC GROWTH: CAN IT BE DONE?
ECONOMIC POLICY REFORMS 2012: GOING FOR GROWTH © OECD 2012 183
arrangements that strengthen trade unions also tend to reduce labour earnings
inequality by ensuring a more equal distribution of earnings. Job protection reforms that
make permanent and temporary contracts more even in their provisions lower income
inequality through smaller wage dispersion and also possibly via higher employment.
● Removing product market regulations that stifle competition can reduce labour income
inequality by boosting employment. The empirical evidence for the link between
product market reform and the dispersion of earnings is rather mixed.
● Policies that foster the integration of immigrants and fight all forms of discrimination
reduce inequality.
● Tax and transfer systems play a key role in lowering overall income inequality. Three
quarters of the average reduction in inequality they achieve across the OECD is due to
transfers. However, the redistributive impact of cash transfers varies widely across
countries, reflecting both the size and progressivity of these transfers. In some countries
(e.g. Australia, the United Kingdom to a lesser extent), cash transfers are small in size but
highly targeted on those in need. In some others (e.g. France or Germany), large transfers
redistribute income mainly over the life-cycle rather than across individuals, and their
progressivity is often low.
● Of the various types of taxes, the personal income tax tends to be progressive, while
social security contributions, consumption taxes and real estate taxes tend to be
regressive. But progressivity could be strengthened by cutting back tax expenditures that
benefit mainly high-income groups (e.g. tax relief on mortgage interest). In addition,
removing other tax reliefs – such as reduced taxation of capital gains from the sale of a
principal or secondary residence, stock options and carried interest – would increase
equity and allow a growth-enhancing cut in marginal labour income tax rates. It would
also reduce tax avoidance instruments for top-income earners.
These findings, combined with past OECD and other work on the gross domestic
product (GDP) per capita effects of policies and institutions – which underpins the
growth-enhancing reform recommendations made in Going for Growth – highlight the
existence of both complementarities and trade-offs between reducing inequality and
promoting economic growth:
● Many policies entail a double dividend as they reduce income inequality while at the
same time boosting long-run GDP per capita. Examples include facilitating the
accumulation of human capital, making educational potential less dependent on
personal and social circumstances, reducing labour market dualism or promoting the
integration of immigrants and fostering female labour market participation. Concerning
taxation, reducing tax expenditures, for instance for investing in housing, contributes to
equity objectives while also allowing a growth-friendly cut in marginal tax rates.
● By contrast, several policies may entail a trade-off between reducing income inequality
and raising GDP per capita. For instance, administrative extensions of collective wage
agreements may reduce wage earnings dispersion among workers, but if they set labour
costs at too-high levels for some employers they may harm competition and productivity
and possibly reduce employment. Shifting the tax mix to less-distorting taxes – in
particular away from labour and corporate income taxes towards consumption and real
estate taxes – would improve incentives to work, save and invest, but could undermine
equity. Cash transfers targeted to lower incomes can be used to ease this trade off.
II.5. REDUCING INCOME INEQUALITY WHILE BOOSTING ECONOMIC GROWTH: CAN IT BE DONE?
ECONOMIC POLICY REFORMS 2012: GOING FOR GROWTH © OECD 2012184
● Finally, some policies aimed at boosting GDP per capita have an uncertain impact on
income inequality. For instance, avoiding too-high and long-lasting unemployment
benefits may raise employment over the long run but also widen the distribution of
income among workers, with an ambiguous net effect on inequality. The same holds as
regards keeping minimum wages at moderate levels.
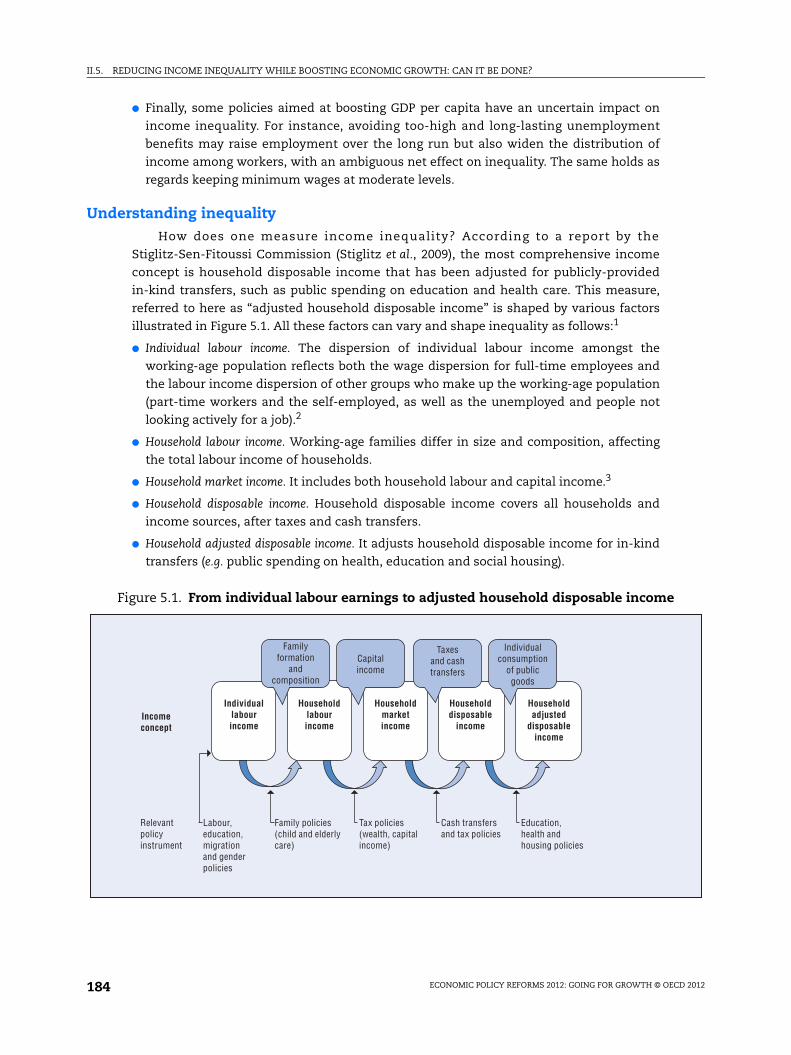
Understanding inequalityHow does one measure income inequality? According to a report by the
Stiglitz-Sen-Fitoussi Commission (Stiglitz et al., 2009), the most comprehensive income
concept is household disposable income that has been adjusted for publicly-provided
in-kind transfers, such as public spending on education and health care. This measure,
referred to here as “adjusted household disposable income” is shaped by various factors
illustrated in Figure 5.1. All these factors can vary and shape inequality as follows:1
● Individual labour income. The dispersion of individual labour income amongst the
working-age population reflects both the wage dispersion for full-time employees and
the labour income dispersion of other groups who make up the working-age population
(part-time workers and the self-employed, as well as the unemployed and people not
looking actively for a job).2
● Household labour income. Working-age families differ in size and composition, affecting
the total labour income of households.
● Household market income. It includes both household labour and capital income.3
● Household disposable income. Household disposable income covers all households and
income sources, after taxes and cash transfers.
● Household adjusted disposable income. It adjusts household disposable income for in-kind
transfers (e.g. public spending on health, education and social housing).
Figure 5.1. From individual labour earnings to adjusted household disposable income
Householdadjusted
disposableincome
Individualconsumption
of publicgoods
Familyformation
andcomposition
Taxesand cashtransfers
Capitalincome
Education,health andhousing policies
Cash transfersand tax policies
Tax policies(wealth, capitalincome)
Family policies(child and elderly care)
Labour,education,migrationand genderpolicies
Relevantpolicyinstrument
Householddisposable
income
Householdmarketincome
Householdlabourincome
Individuallabourincome
Incomeconcept
II.5. REDUCING INCOME INEQUALITY WHILE BOOSTING ECONOMIC GROWTH: CAN IT BE DONE?
ECONOMIC POLICY REFORMS 2012: GOING FOR GROWTH © OECD 2012 185
The rest of this chapter covers three of these five income concepts – household labour
income, household market income and household disposable income – since these are the
most relevant for the build-up of inequality and the most responsive to structural reforms,
while the measurement of the redistributive impact of in-kind benefits is difficult.4 Due to
data availability constraints, the chapter focuses on inequality at a given point in time,
while the issue should ideally also be looked at from a life-time perspective, taking into
account the role of social mobility.
The dispersion of household labour and market income differs across countries
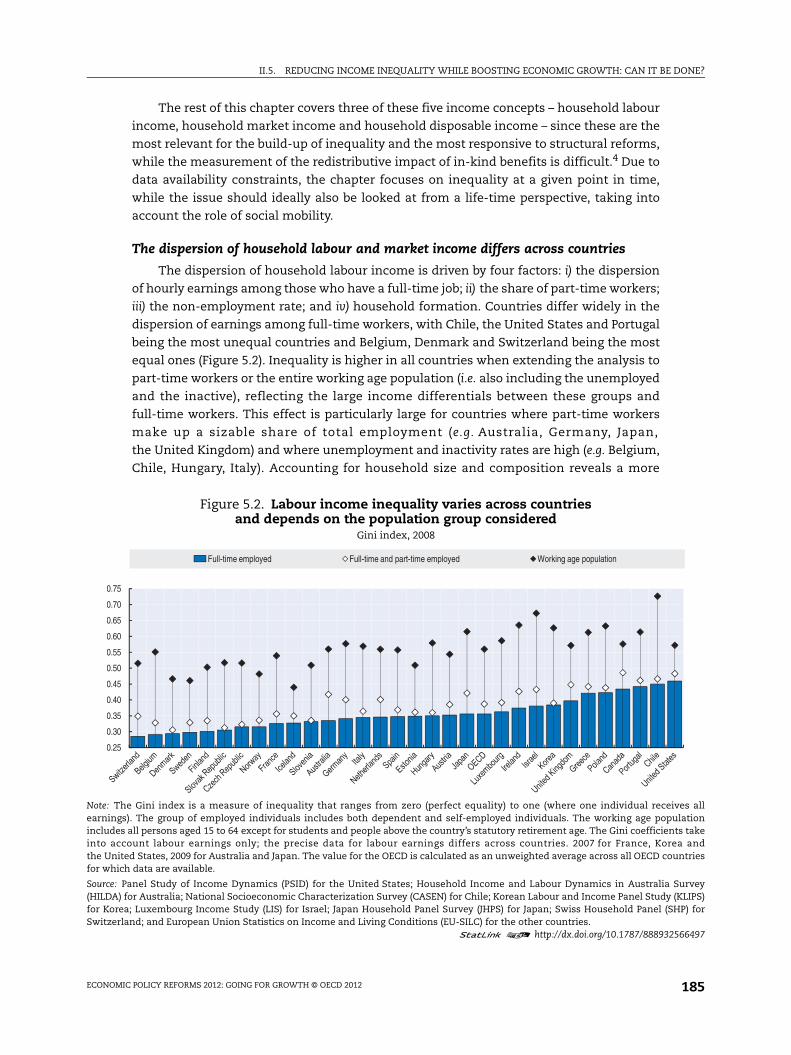
The dispersion of household labour income is driven by four factors: i) the dispersion
of hourly earnings among those who have a full-time job; ii) the share of part-time workers;
iii) the non-employment rate; and iv) household formation. Countries differ widely in the
dispersion of earnings among full-time workers, with Chile, the United States and Portugal
being the most unequal countries and Belgium, Denmark and Switzerland being the most
equal ones (Figure 5.2). Inequality is higher in all countries when extending the analysis to
part-time workers or the entire working age population (i.e. also including the unemployed
and the inactive), reflecting the large income differentials between these groups and
full-time workers. This effect is particularly large for countries where part-time workers
make up a sizable share of total employment (e.g. Australia, Germany, Japan,
the United Kingdom) and where unemployment and inactivity rates are high (e.g. Belgium,
Chile, Hungary, Italy). Accounting for household size and composition reveals a more
Figure 5.2. Labour income inequality varies across countries and depends on the population group considered
Gini index, 2008
Note: The Gini index is a measure of inequality that ranges from zero (perfect equality) to one (where one individual receives allearnings). The group of employed individuals includes both dependent and self-employed individuals. The working age populationincludes all persons aged 15 to 64 except for students and people above the country’s statutory retirement age. The Gini coefficients takeinto account labour earnings only; the precise data for labour earnings differs across countries. 2007 for France, Korea andthe United States, 2009 for Australia and Japan. The value for the OECD is calculated as an unweighted average across all OECD countriesfor which data are available.
Source: Panel Study of Income Dynamics (PSID) for the United States; Household Income and Labour Dynamics in Australia Survey(HILDA) for Australia; National Socioeconomic Characterization Survey (CASEN) for Chile; Korean Labour and Income Panel Study (KLIPS)for Korea; Luxembourg Income Study (LIS) for Israel; Japan Household Panel Survey (JHPS) for Japan; Swiss Household Panel (SHP) forSwitzerland; and European Union Statistics on Income and Living Conditions (EU-SILC) for the other countries.
1 2 http://dx.doi.org/10.1787/888932566497
0.25
0.30
0.35
0.40
0.45
0.50
0.55
0.60
0.65
0.70
0.75
Full-time employed Full-time and part-time employed Working age population
II.5. REDUCING INCOME INEQUALITY WHILE BOOSTING ECONOMIC GROWTH: CAN IT BE DONE?
ECONOMIC POLICY REFORMS 2012: GOING FOR GROWTH © OECD 2012186
complex picture (OECD, 2008a). Working household members often combine their income,
which narrows the dispersion of income because of the ensuing economies of scale in
consumption, whereas the inclusion of dependents in households widens it.
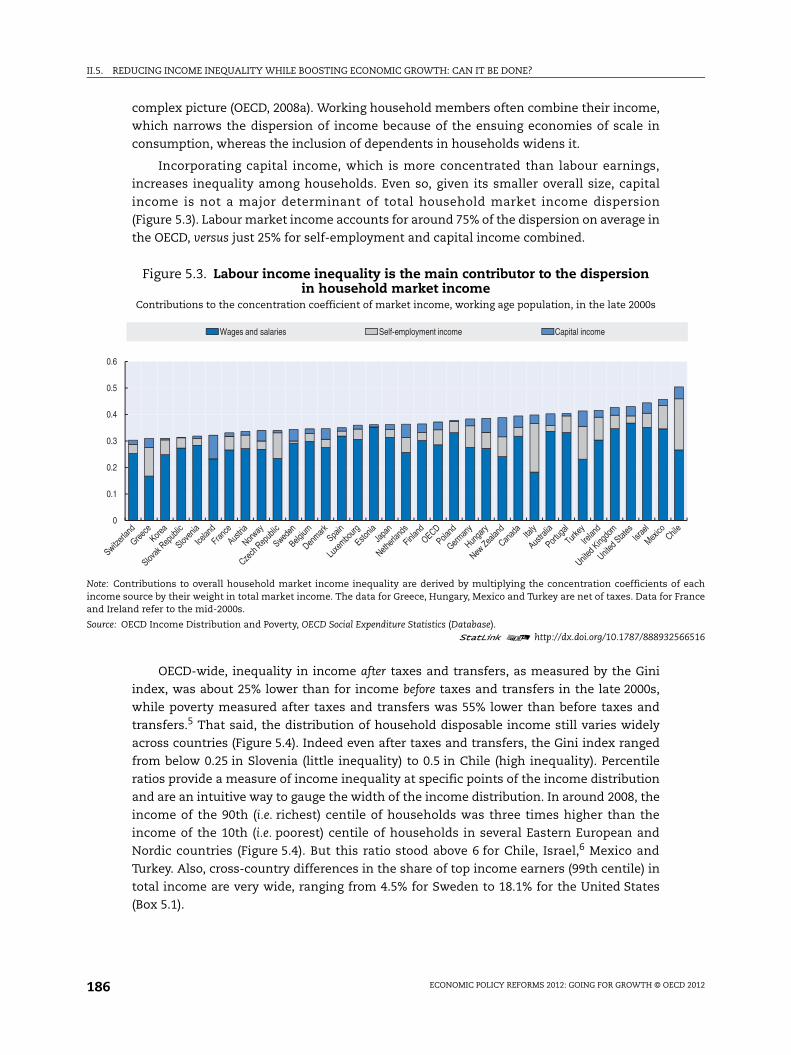
Incorporating capital income, which is more concentrated than labour earnings,
increases inequality among households. Even so, given its smaller overall size, capital
income is not a major determinant of total household market income dispersion
(Figure 5.3). Labour market income accounts for around 75% of the dispersion on average in
the OECD, versus just 25% for self-employment and capital income combined.
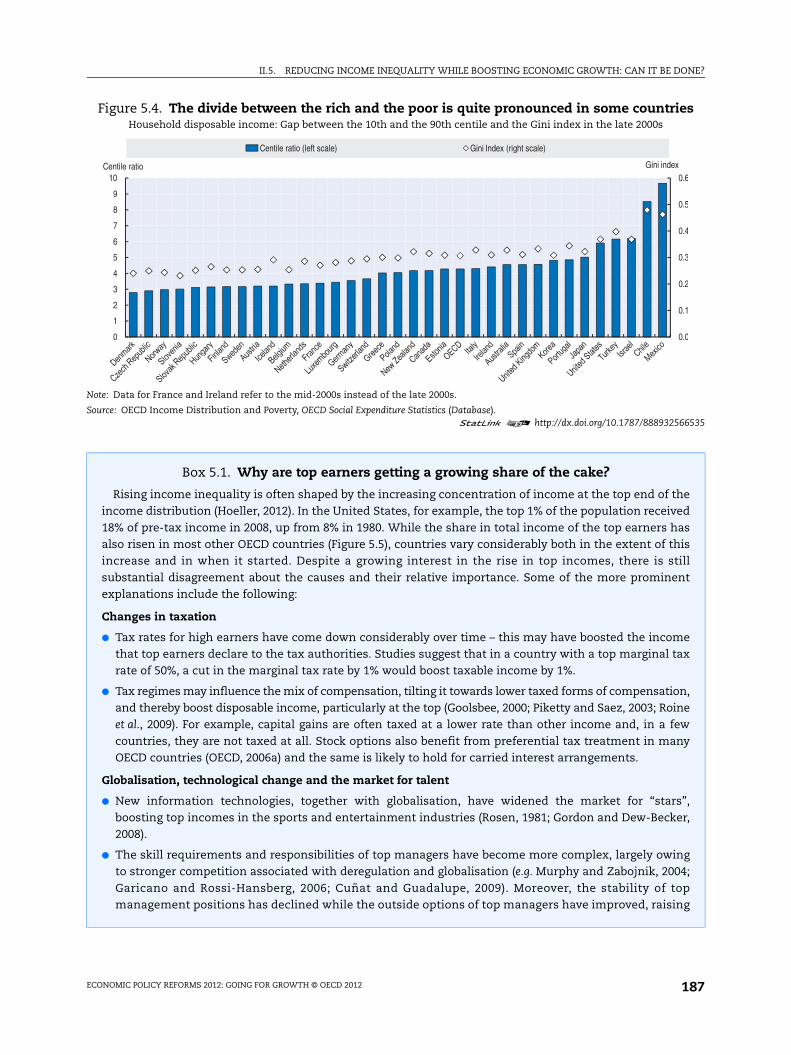
OECD-wide, inequality in income after taxes and transfers, as measured by the Gini
index, was about 25% lower than for income before taxes and transfers in the late 2000s,
while poverty measured after taxes and transfers was 55% lower than before taxes and
transfers.5 That said, the distribution of household disposable income still varies widely
across countries (Figure 5.4). Indeed even after taxes and transfers, the Gini index ranged
from below 0.25 in Slovenia (little inequality) to 0.5 in Chile (high inequality). Percentile
ratios provide a measure of income inequality at specific points of the income distribution
and are an intuitive way to gauge the width of the income distribution. In around 2008, the
income of the 90th (i.e. richest) centile of households was three times higher than the
income of the 10th (i.e. poorest) centile of households in several Eastern European and
Nordic countries (Figure 5.4). But this ratio stood above 6 for Chile, Israel,6 Mexico and
Turkey. Also, cross-country differences in the share of top income earners (99th centile) in
total income are very wide, ranging from 4.5% for Sweden to 18.1% for the United States
(Box 5.1).
Figure 5.3. Labour income inequality is the main contributor to the dispersionin household market income
Contributions to the concentration coefficient of market income, working age population, in the late 2000s
Note: Contributions to overall household market income inequality are derived by multiplying the concentration coefficients of eachincome source by their weight in total market income. The data for Greece, Hungary, Mexico and Turkey are net of taxes. Data for Franceand Ireland refer to the mid-2000s.
Source: OECD Income Distribution and Poverty, OECD Social Expenditure Statistics (Database).1 2 http://dx.doi.org/10.1787/888932566516
0
0.1
0.2
0.3
0.4
0.5
0.6
Wages and salaries Self-employment income Capital income
II.5. REDUCING INCOME INEQUALITY WHILE BOOSTING ECONOMIC GROWTH: CAN IT BE DONE?
ECONOMIC POLICY REFORMS 2012: GOING FOR GROWTH © OECD 2012 187
Figure 5.4. The divide between the rich and the poor is quite pronounced in some countriesHousehold disposable income: Gap between the 10th and the 90th centile and the Gini index in the late 2000s
Note: Data for France and Ireland refer to the mid-2000s instead of the late 2000s.
Source: OECD Income Distribution and Poverty, OECD Social Expenditure Statistics (Database).1 2 http://dx.doi.org/10.1787/888932566535
Box 5.1. Why are top earners getting a growing share of the cake?
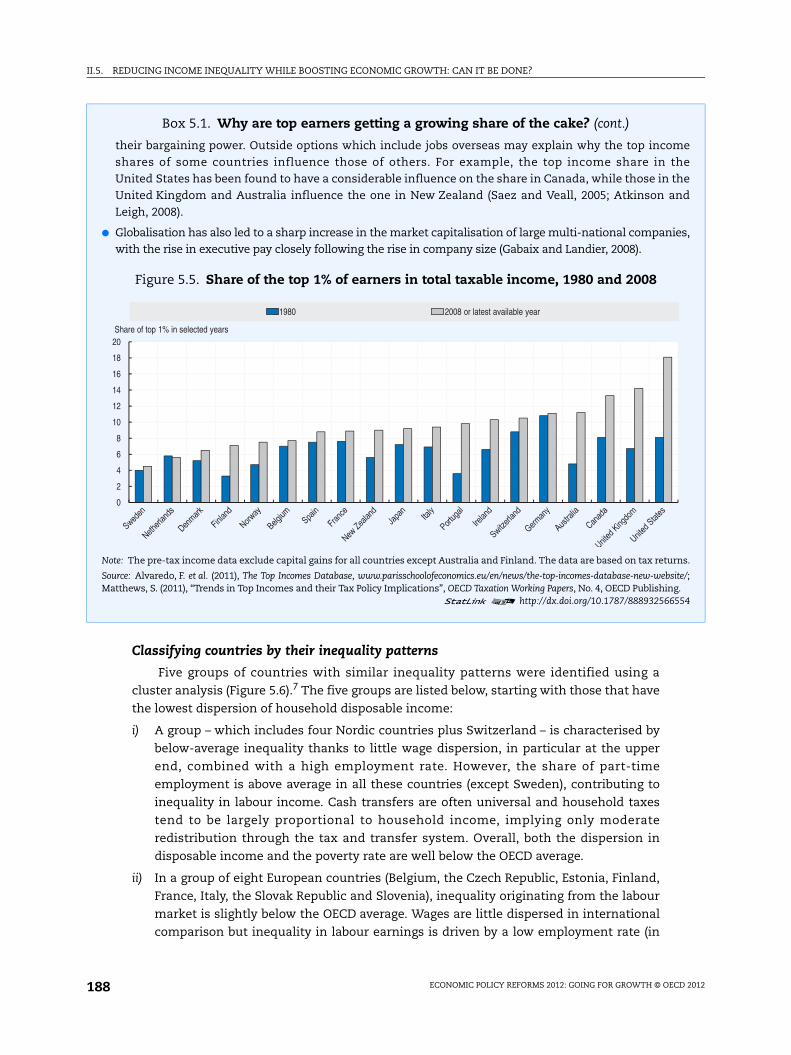
Rising income inequality is often shaped by the increasing concentration of income at the top end of theincome distribution (Hoeller, 2012). In the United States, for example, the top 1% of the population received18% of pre-tax income in 2008, up from 8% in 1980. While the share in total income of the top earners hasalso risen in most other OECD countries (Figure 5.5), countries vary considerably both in the extent of thisincrease and in when it started. Despite a growing interest in the rise in top incomes, there is stillsubstantial disagreement about the causes and their relative importance. Some of the more prominentexplanations include the following:
Changes in taxation
● Tax rates for high earners have come down considerably over time – this may have boosted the incomethat top earners declare to the tax authorities. Studies suggest that in a country with a top marginal taxrate of 50%, a cut in the marginal tax rate by 1% would boost taxable income by 1%.
● Tax regimes may influence the mix of compensation, tilting it towards lower taxed forms of compensation,and thereby boost disposable income, particularly at the top (Goolsbee, 2000; Piketty and Saez, 2003; Roineet al., 2009). For example, capital gains are often taxed at a lower rate than other income and, in a fewcountries, they are not taxed at all. Stock options also benefit from preferential tax treatment in manyOECD countries (OECD, 2006a) and the same is likely to hold for carried interest arrangements.
Globalisation, technological change and the market for talent
● New information technologies, together with globalisation, have widened the market for “stars”,boosting top incomes in the sports and entertainment industries (Rosen, 1981; Gordon and Dew-Becker,2008).
● The skill requirements and responsibilities of top managers have become more complex, largely owingto stronger competition associated with deregulation and globalisation (e.g. Murphy and Zabojnik, 2004;Garicano and Rossi-Hansberg, 2006; Cuñat and Guadalupe, 2009). Moreover, the stability of topmanagement positions has declined while the outside options of top managers have improved, raising
0.0
0.1
0.2
0.3
0.4
0.5
0.6
0
1
2
3
4
5
6
7
8
9
10Gini indexCentile ratio
Centile ratio (left scale) Gini Index (right scale)
II.5. REDUCING INCOME INEQUALITY WHILE BOOSTING ECONOMIC GROWTH: CAN IT BE DONE?
ECONOMIC POLICY REFORMS 2012: GOING FOR GROWTH © OECD 2012188
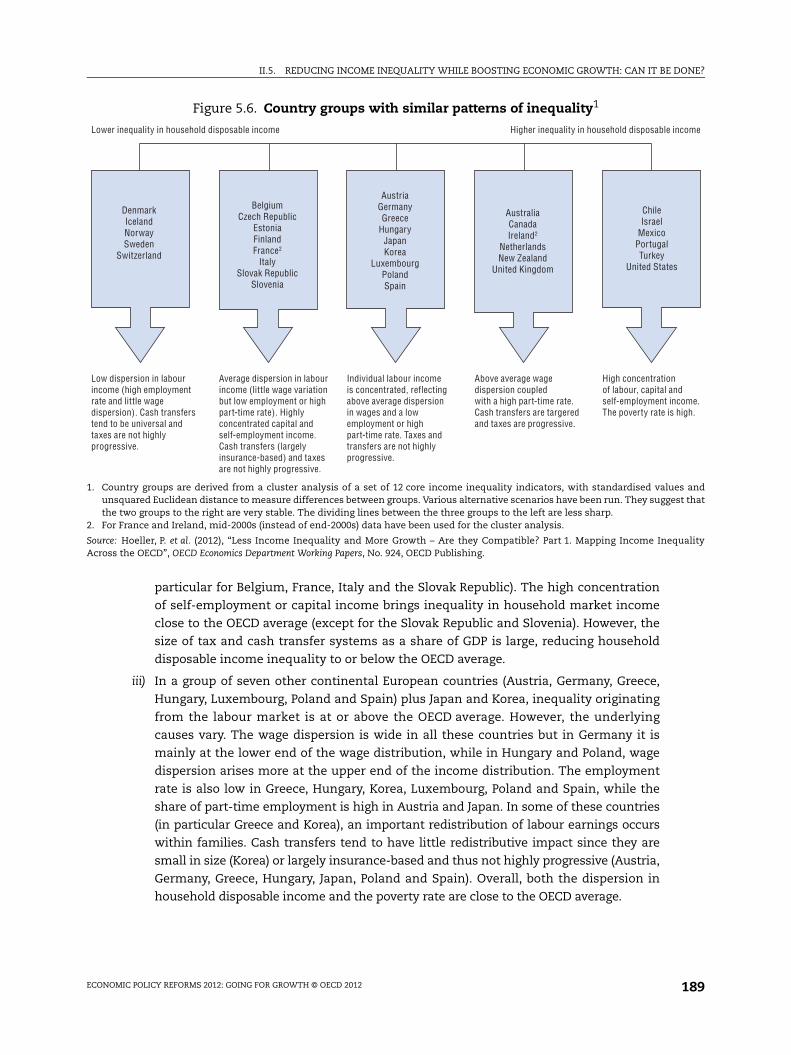
Classifying countries by their inequality patterns
Five groups of countries with similar inequality patterns were identified using a
cluster analysis (Figure 5.6).7 The five groups are listed below, starting with those that have
the lowest dispersion of household disposable income:
i) A group – which includes four Nordic countries plus Switzerland – is characterised by
below-average inequality thanks to little wage dispersion, in particular at the upper
end, combined with a high employment rate. However, the share of part-time
employment is above average in all these countries (except Sweden), contributing to
inequality in labour income. Cash transfers are often universal and household taxes
tend to be largely proportional to household income, implying only moderate
redistribution through the tax and transfer system. Overall, both the dispersion in
disposable income and the poverty rate are well below the OECD average.
ii) In a group of eight European countries (Belgium, the Czech Republic, Estonia, Finland,
France, Italy, the Slovak Republic and Slovenia), inequality originating from the labour
market is slightly below the OECD average. Wages are little dispersed in international
comparison but inequality in labour earnings is driven by a low employment rate (in
Box 5.1. Why are top earners getting a growing share of the cake? (cont.)
their bargaining power. Outside options which include jobs overseas may explain why the top incomeshares of some countries influence those of others. For example, the top income share in theUnited States has been found to have a considerable influence on the share in Canada, while those in theUnited Kingdom and Australia influence the one in New Zealand (Saez and Veall, 2005; Atkinson andLeigh, 2008).
● Globalisation has also led to a sharp increase in the market capitalisation of large multi-national companies,with the rise in executive pay closely following the rise in company size (Gabaix and Landier, 2008).
Figure 5.5. Share of the top 1% of earners in total taxable income, 1980 and 2008
Note: The pre-tax income data exclude capital gains for all countries except Australia and Finland. The data are based on tax returns.
Source: Alvaredo, F. et al. (2011), The Top Incomes Database, www.parisschoolofeconomics.eu/en/news/the-top-incomes-database-new-website/;Matthews, S. (2011), “Trends in Top Incomes and their Tax Policy Implications”, OECD Taxation Working Papers, No. 4, OECD Publishing.
1 2 http://dx.doi.org/10.1787/888932566554
0
2
4
6
8
10
12
14
16
18
20
1980 2008 or latest available year
Share of top 1% in selected years
II.5. REDUCING INCOME INEQUALITY WHILE BOOSTING ECONOMIC GROWTH: CAN IT BE DONE?
ECONOMIC POLICY REFORMS 2012: GOING FOR GROWTH © OECD 2012 189
particular for Belgium, France, Italy and the Slovak Republic). The high concentration
of self-employment or capital income brings inequality in household market income
close to the OECD average (except for the Slovak Republic and Slovenia). However, the
size of tax and cash transfer systems as a share of GDP is large, reducing household
disposable income inequality to or below the OECD average.
iii) In a group of seven other continental European countries (Austria, Germany, Greece,
Hungary, Luxembourg, Poland and Spain) plus Japan and Korea, inequality originating
from the labour market is at or above the OECD average. However, the underlying
causes vary. The wage dispersion is wide in all these countries but in Germany it is
mainly at the lower end of the wage distribution, while in Hungary and Poland, wage
dispersion arises more at the upper end of the income distribution. The employment
rate is also low in Greece, Hungary, Korea, Luxembourg, Poland and Spain, while the
share of part-time employment is high in Austria and Japan. In some of these countries
(in particular Greece and Korea), an important redistribution of labour earnings occurs
within families. Cash transfers tend to have little redistributive impact since they are
small in size (Korea) or largely insurance-based and thus not highly progressive (Austria,
Germany, Greece, Hungary, Japan, Poland and Spain). Overall, both the dispersion in
household disposable income and the poverty rate are close to the OECD average.
Figure 5.6. Country groups with similar patterns of inequality1
1. Country groups are derived from a cluster analysis of a set of 12 core income inequality indicators, with standardised values andunsquared Euclidean distance to measure differences between groups. Various alternative scenarios have been run. They suggest thatthe two groups to the right are very stable. The dividing lines between the three groups to the left are less sharp.
2. For France and Ireland, mid-2000s (instead of end-2000s) data have been used for the cluster analysis.
Source: Hoeller, P. et al. (2012), “Less Income Inequality and More Growth – Are they Compatible? Part 1. Mapping Income InequalityAcross the OECD”, OECD Economics Department Working Papers, No. 924, OECD Publishing.
ChileIsrael
MexicoPortugalTurkey
United States
High concentrationof labour, capital andself-employment income.The poverty rate is high.
Above average wagedispersion coupledwith a high part-time rate.Cash transfers are targeredand taxes are progressive.
Individual labour incomeis concentrated, reflectingabove average dispersionin wages and a lowemployment or highpart-time rate. Taxes andtransfers are not highlyprogressive.
Average dispersion in labourincome (little wage variationbut low employment or highpart-time rate). Highlyconcentrated capital andself-employment income.Cash transfers (largelyinsurance-based) and taxesare not highly progressive.
Low dispersion in labourincome (high employmentrate and little wagedispersion). Cash transferstend to be universal andtaxes are not highlyprogressive.
AustraliaCanadaIreland2
NetherlandsNew Zealand
United Kingdom
AustriaGermanyGreece
HungaryJapanKorea
LuxembourgPolandSpain
BelgiumCzech Republic
EstoniaFinlandFrance2
ItalySlovak Republic
Slovenia
DenmarkIcelandNorwaySweden
Switzerland
Lower inequality in household disposable income Higher inequality in household disposable income
II.5. REDUCING INCOME INEQUALITY WHILE BOOSTING ECONOMIC GROWTH: CAN IT BE DONE?
ECONOMIC POLICY REFORMS 2012: GOING FOR GROWTH © OECD 2012190
iv) Five English-speaking countries (Australia, Canada, Ireland, New Zealand and the
United Kingdom) and the Netherlands all have a large share of part-time employment,
driving inequality in labour earnings. On the other hand, the employment rate is above
the OECD average in all these countries except Ireland. While small in size (for all
countries except the Netherlands), cash transfers tend to be more targeted and taxes
more progressive than in the other OECD countries, and therefore have a sizable
redistributive impact. Household disposable income inequality is, however, above the
OECD average in all these countries except for the Netherlands.
v) Chile, Israel, Mexico, Portugal, Turkey and the United States are characterised by above
average inequality originating from the labour market. This reflects a very wide wage
dispersion coupled with a low employment rate (though here the United States is an
exception). Capital and self-employment income also tend to benefit a small group of
households. Cash transfers have little redistributive impact because they are small in
size and often largely insurance-based. The size of tax systems is also small in most of
these countries, although some embody more progressivity than on average in the
OECD. Overall, both inequality in household disposable income and the poverty rate
are well above the OECD average.
What drives inequality?
Technological change and globalisation partly explain recent trendsin labour income inequality
Technological advances may affect labour income inequality as they can benefit
higher-skilled workers more than others. For example, to the extent that medium-skilled
workers focus on routine tasks that can also be accomplished by computers, technological
change will reduce the demand for such workers. The opposite effect can be expected for
highly-skilled and low-skilled workers who tend to focus respectively on abstract and
manual non-routine tasks, both of which are harder to replace by machines. If the demand
shifts are not offset by equal shifts in the composition of labour supply (e.g. by a large
enough rise in tertiary education attainment), technological progress may reduce the
earnings or employment of medium-skilled workers relative to both the low- and
high-skilled ones. Indeed the data point to a polarisation of employment by skill level
(e.g. Autor et al., 2006, Goos et al., 2009).
Globalisation may also widen inequality. A first channel through which this may
happen is offshoring. The tasks that are relocated from richer to poorer countries are
typically not skill intensive from the perspective of the skill-rich country, but they are from
the perspective of the skill-poor country. As a result, offshoring makes labour demand
more skill intensive in both poorer and richer countries, thus increasing inequality in both
groups of countries (Feenstra and Hanson, 1996). Second, if firms differ in their profitability
and low-income workers work disproportionately in low-productivity firms that are
battered by import competition, trade may increase labour income inequality by lowering
employment or the relative earnings of low-income workers (e.g. Egger and Kreickemeier,
2009; Helpman et al., 2010). The implied positive link between globalisation and inequality
is supported by a growing body of studies of individual firms, but it is more difficult to
establish a robust link at the aggregate level.
II.5. REDUCING INCOME INEQUALITY WHILE BOOSTING ECONOMIC GROWTH: CAN IT BE DONE?
ECONOMIC POLICY REFORMS 2012: GOING FOR GROWTH © OECD 2012 191
Globalisation and technological change may also reinforce each other, thereby further
raising inequality. On the one hand, technology may underpin globalisation and on the
other, the increased competition that comes with globalisation may force firms to
innovate. Innovation may raise labour income inequality both temporarily – since R&D is
skill intensive (Dinopoulos and Segerstrom, 1999; Neary, 2003) – and permanently, provided
it results in skill-biased technological change as discussed above (Acemoglu, 2002).
Labour income inequality is also influenced by structural policies
Structural policies in the areas of education, labour and product markets influence
labour income inequality by affecting i) the employment rate and ii) the dispersion of
earnings among those that have a job (see Koske et al., 2012 for a detailed discussion).
Policies that foster equity in education lower income inequality by reducing the dispersion
of earnings. The same applies to policies that promote upper secondary or tertiary
education, at least in countries with an already high share of upper secondary or tertiary
graduates, respectively, among the working-age population. For many labour market
policies, by contrast, the impact is less clear cut as they affect both the dispersion of
earnings and the level of employment in sometimes conflicting ways, at least for some
types of workers. Examples include increasing the minimum wage relative to the median
wage, increasing the level of employment protection and increasing the generosity of
unemployment benefits. One labour market reform that stands out as having a positive
effect on both employment and earnings equality is lowering the gap of employment
protection on temporary and permanent work. The impact of product market liberalisation
on income inequality is ambiguous. While boosting employment, some types of product
market reforms may widen the distribution of earnings. A rough quantification of the
average size of the effects of selected structural policy reforms on the dispersion of
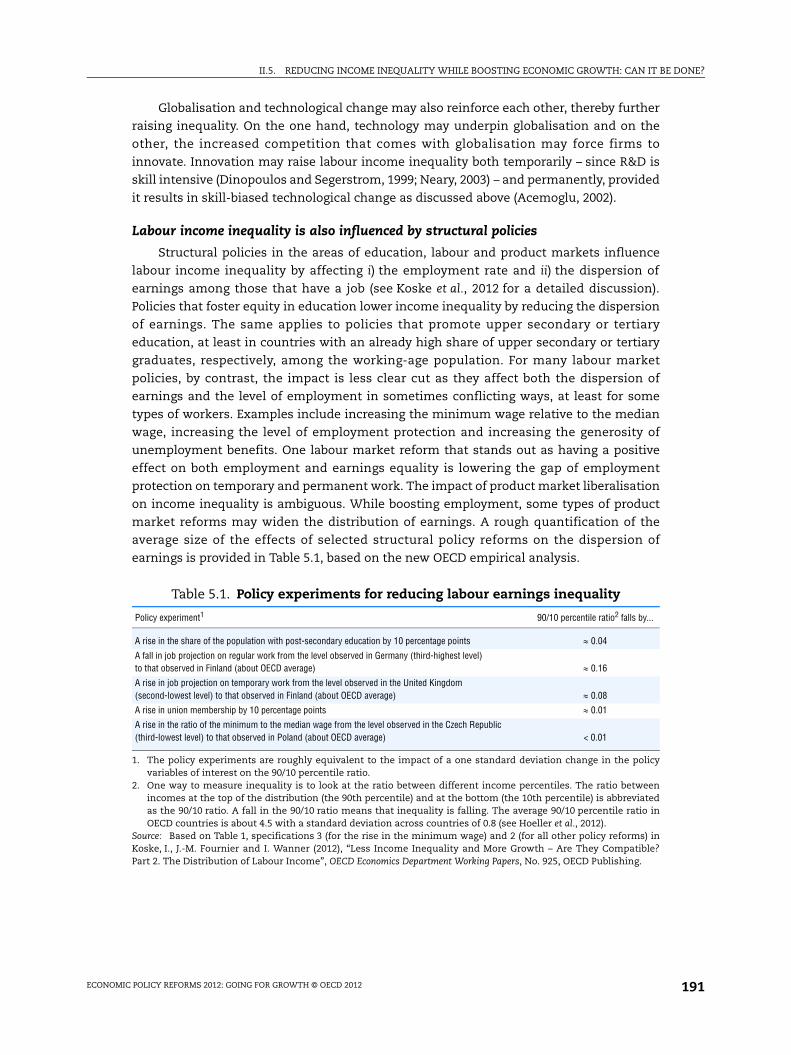
earnings is provided in Table 5.1, based on the new OECD empirical analysis.
Table 5.1. Policy experiments for reducing labour earnings inequality
Policy experiment1 90/10 percentile ratio2 falls by...
A rise in the share of the population with post-secondary education by 10 percentage points 0.04
A fall in job projection on regular work from the level observed in Germany (third-highest level) to that observed in Finland (about OECD average) 0.16
A rise in job projection on temporary work from the level observed in the United Kingdom (second-lowest level) to that observed in Finland (about OECD average) 0.08
A rise in union membership by 10 percentage points 0.01
A rise in the ratio of the minimum to the median wage from the level observed in the Czech Republic (third-lowest level) to that observed in Poland (about OECD average) < 0.01
1. The policy experiments are roughly equivalent to the impact of a one standard deviation change in the policyvariables of interest on the 90/10 percentile ratio.
2. One way to measure inequality is to look at the ratio between different income percentiles. The ratio betweenincomes at the top of the distribution (the 90th percentile) and at the bottom (the 10th percentile) is abbreviatedas the 90/10 ratio. A fall in the 90/10 ratio means that inequality is falling. The average 90/10 percentile ratio inOECD countries is about 4.5 with a standard deviation across countries of 0.8 (see Hoeller et al., 2012).
Source: Based on Table 1, specifications 3 (for the rise in the minimum wage) and 2 (for all other policy reforms) inKoske, I., J.-M. Fournier and I. Wanner (2012), “Less Income Inequality and More Growth – Are They Compatible?Part 2. The Distribution of Labour Income”, OECD Economics Department Working Papers, No. 925, OECD Publishing.
II.5. REDUCING INCOME INEQUALITY WHILE BOOSTING ECONOMIC GROWTH: CAN IT BE DONE?
ECONOMIC POLICY REFORMS 2012: GOING FOR GROWTH © OECD 2012192
Some countries rely heavily on taxes and transfers to influence distributional outcomes
Tax and transfer systems play a key role in lowering overall income inequality. Cash
transfers – such as pensions, unemployment and child benefits – account for more than
three quarters of the overall redistributive impact, and taxes for one quarter. However,
there are large differences across the OECD in the size, composition and progressivity of
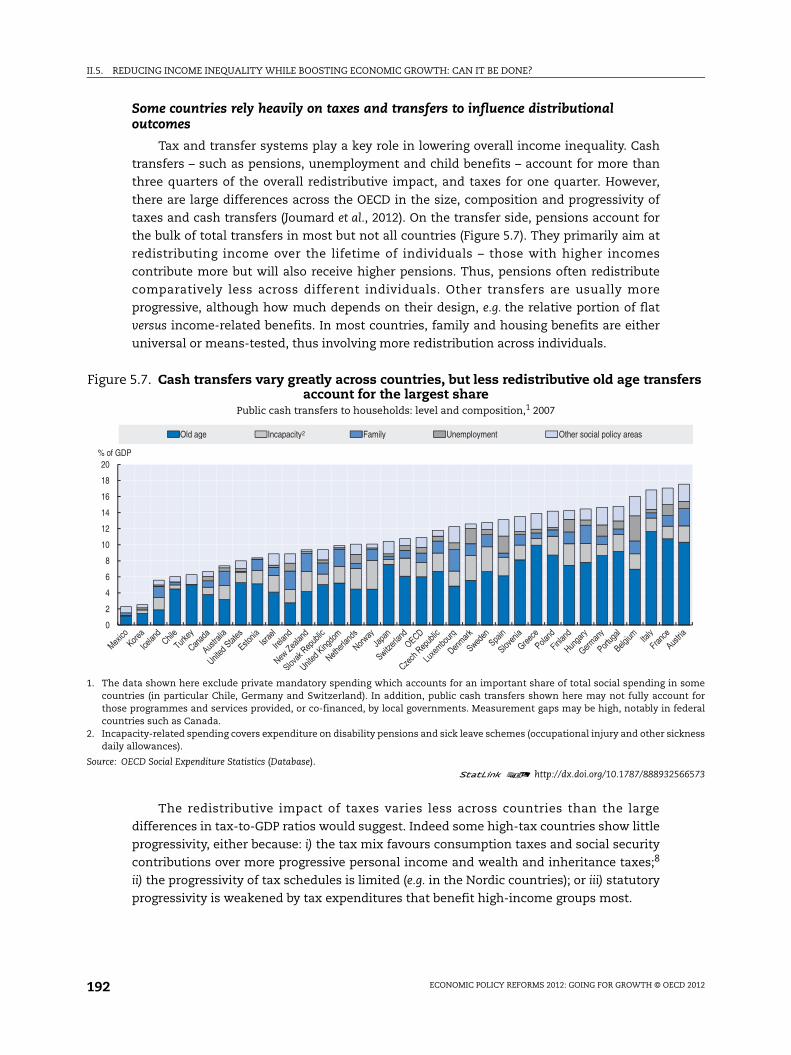
taxes and cash transfers (Joumard et al., 2012). On the transfer side, pensions account for
the bulk of total transfers in most but not all countries (Figure 5.7). They primarily aim at
redistributing income over the lifetime of individuals – those with higher incomes
contribute more but will also receive higher pensions. Thus, pensions often redistribute
comparatively less across different individuals. Other transfers are usually more
progressive, although how much depends on their design, e.g. the relative portion of flat
versus income-related benefits. In most countries, family and housing benefits are either
universal or means-tested, thus involving more redistribution across individuals.
The redistributive impact of taxes varies less across countries than the large
differences in tax-to-GDP ratios would suggest. Indeed some high-tax countries show little
progressivity, either because: i) the tax mix favours consumption taxes and social security
contributions over more progressive personal income and wealth and inheritance taxes;8
ii) the progressivity of tax schedules is limited (e.g. in the Nordic countries); or iii) statutory
progressivity is weakened by tax expenditures that benefit high-income groups most.
Figure 5.7. Cash transfers vary greatly across countries, but less redistributive old age transfers account for the largest share
Public cash transfers to households: level and composition,1 2007
1. The data shown here exclude private mandatory spending which accounts for an important share of total social spending in somecountries (in particular Chile, Germany and Switzerland). In addition, public cash transfers shown here may not fully account forthose programmes and services provided, or co-financed, by local governments. Measurement gaps may be high, notably in federalcountries such as Canada.
2. Incapacity-related spending covers expenditure on disability pensions and sick leave schemes (occupational injury and other sicknessdaily allowances).
Source: OECD Social Expenditure Statistics (Database).1 2 http://dx.doi.org/10.1787/888932566573
0
2
4
6
8
10
12
14
16
18
20% of GDP
Old age Incapacity Family Unemployment Other social policy areas2
II.5. REDUCING INCOME INEQUALITY WHILE BOOSTING ECONOMIC GROWTH: CAN IT BE DONE?
ECONOMIC POLICY REFORMS 2012: GOING FOR GROWTH © OECD 2012 193
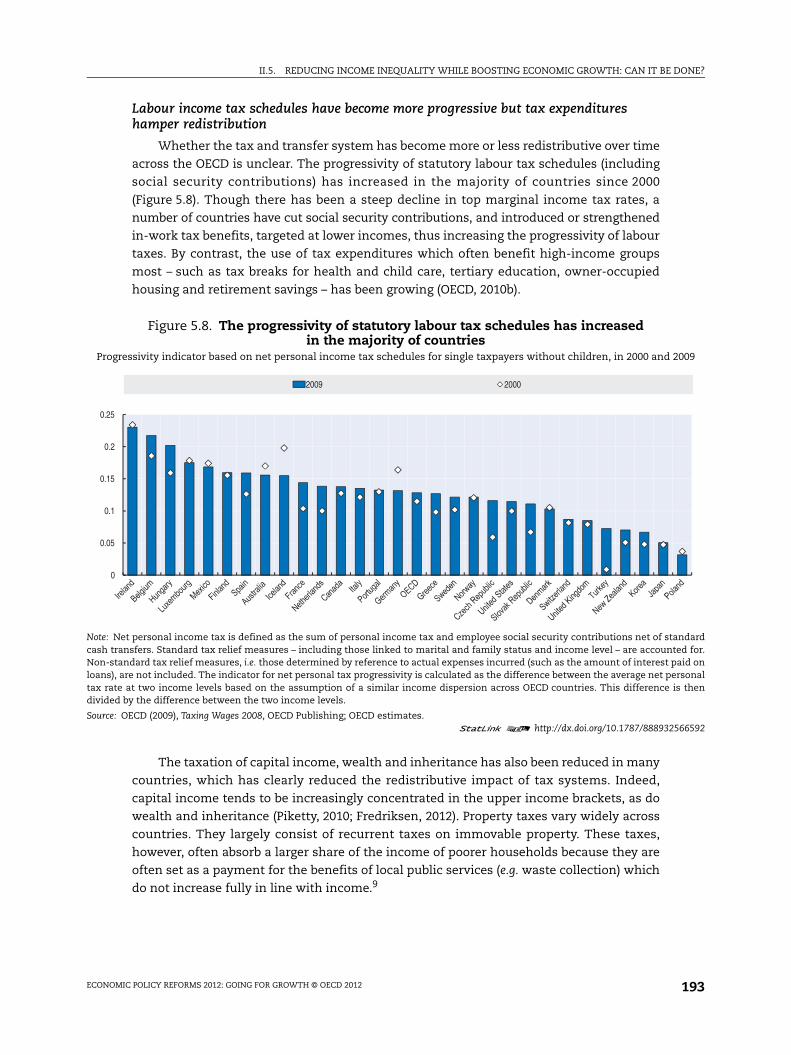
Labour income tax schedules have become more progressive but tax expenditures hamper redistribution
Whether the tax and transfer system has become more or less redistributive over time
across the OECD is unclear. The progressivity of statutory labour tax schedules (including
social security contributions) has increased in the majority of countries since 2000
(Figure 5.8). Though there has been a steep decline in top marginal income tax rates, a
number of countries have cut social security contributions, and introduced or strengthened
in-work tax benefits, targeted at lower incomes, thus increasing the progressivity of labour
taxes. By contrast, the use of tax expenditures which often benefit high-income groups
most – such as tax breaks for health and child care, tertiary education, owner-occupied
housing and retirement savings – has been growing (OECD, 2010b).
The taxation of capital income, wealth and inheritance has also been reduced in many
countries, which has clearly reduced the redistributive impact of tax systems. Indeed,
capital income tends to be increasingly concentrated in the upper income brackets, as do
wealth and inheritance (Piketty, 2010; Fredriksen, 2012). Property taxes vary widely across
countries. They largely consist of recurrent taxes on immovable property. These taxes,
however, often absorb a larger share of the income of poorer households because they are
often set as a payment for the benefits of local public services (e.g. waste collection) which
do not increase fully in line with income.9
Figure 5.8. The progressivity of statutory labour tax schedules has increasedin the majority of countries
Progressivity indicator based on net personal income tax schedules for single taxpayers without children, in 2000 and 2009
Note: Net personal income tax is defined as the sum of personal income tax and employee social security contributions net of standardcash transfers. Standard tax relief measures – including those linked to marital and family status and income level – are accounted for.Non-standard tax relief measures, i.e. those determined by reference to actual expenses incurred (such as the amount of interest paid onloans), are not included. The indicator for net personal tax progressivity is calculated as the difference between the average net personaltax rate at two income levels based on the assumption of a similar income dispersion across OECD countries. This difference is thendivided by the difference between the two income levels.
Source: OECD (2009), Taxing Wages 2008, OECD Publishing; OECD estimates.1 2 http://dx.doi.org/10.1787/888932566592
0
0.05
0.1
0.15
0.2
0.25
2009 2000
II.5. REDUCING INCOME INEQUALITY WHILE BOOSTING ECONOMIC GROWTH: CAN IT BE DONE?
ECONOMIC POLICY REFORMS 2012: GOING FOR GROWTH © OECD 2012194
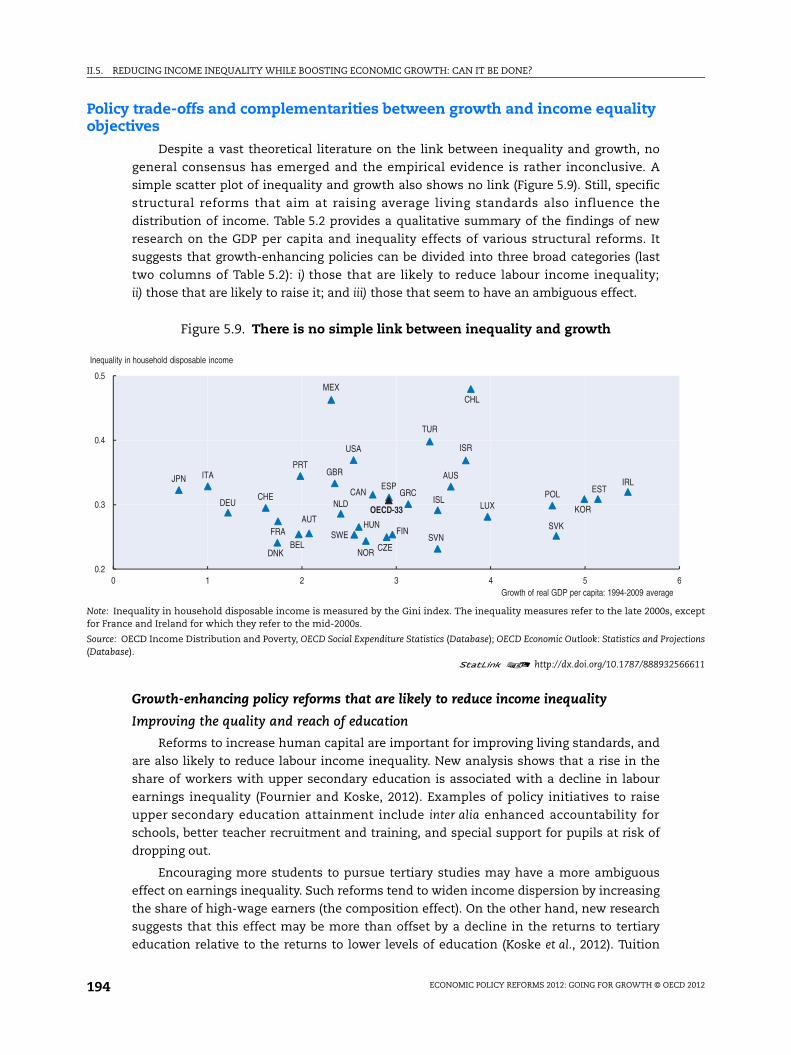
Policy trade-offs and complementarities between growth and income equality objectives
Despite a vast theoretical literature on the link between inequality and growth, no
general consensus has emerged and the empirical evidence is rather inconclusive. A
simple scatter plot of inequality and growth also shows no link (Figure 5.9). Still, specific
structural reforms that aim at raising average living standards also influence the
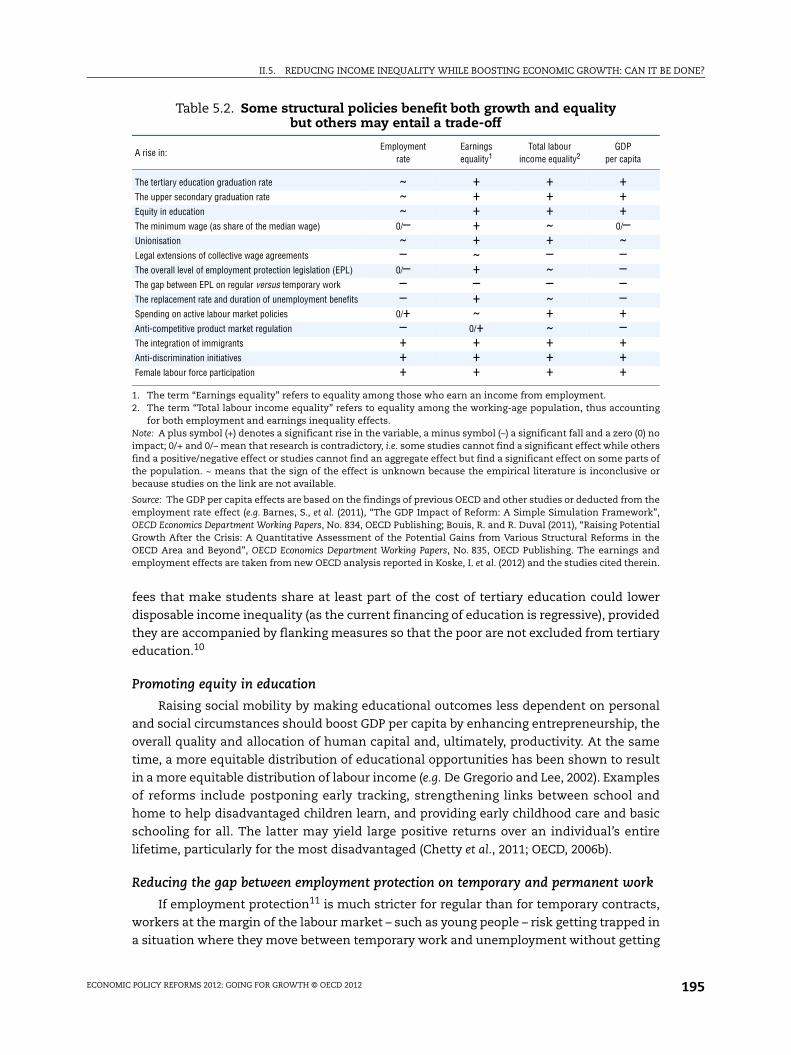
distribution of income. Table 5.2 provides a qualitative summary of the findings of new
research on the GDP per capita and inequality effects of various structural reforms. It
suggests that growth-enhancing policies can be divided into three broad categories (last
two columns of Table 5.2): i) those that are likely to reduce labour income inequality;
ii) those that are likely to raise it; and iii) those that seem to have an ambiguous effect.
Growth-enhancing policy reforms that are likely to reduce income inequality
Improving the quality and reach of education
Reforms to increase human capital are important for improving living standards, and
are also likely to reduce labour income inequality. New analysis shows that a rise in the
share of workers with upper secondary education is associated with a decline in labour
earnings inequality (Fournier and Koske, 2012). Examples of policy initiatives to raise
upper secondary education attainment include inter alia enhanced accountability for
schools, better teacher recruitment and training, and special support for pupils at risk of
dropping out.
Encouraging more students to pursue tertiary studies may have a more ambiguous
effect on earnings inequality. Such reforms tend to widen income dispersion by increasing
the share of high-wage earners (the composition effect). On the other hand, new research
suggests that this effect may be more than offset by a decline in the returns to tertiary
education relative to the returns to lower levels of education (Koske et al., 2012). Tuition
Figure 5.9. There is no simple link between inequality and growth
Note: Inequality in household disposable income is measured by the Gini index. The inequality measures refer to the late 2000s, exceptfor France and Ireland for which they refer to the mid-2000s.
Source: OECD Income Distribution and Poverty, OECD Social Expenditure Statistics (Database); OECD Economic Outlook: Statistics and Projections(Database).
1 2 http://dx.doi.org/10.1787/888932566611
AUS
AUT
BEL
CANCHE
CHL
CZE
DEU
DNK
ESP EST
FINFRA
GBR
GRC
HUN
IRL
ISL
ISR
ITAJPN
KORLUX
MEX
NLD
NOR
POL
PRT
SVKSVNSWE
TUR
USA
OECD-33
0.2
0.3
0.4
0.5
0 1 2 3 4 5 6Growth of real GDP per capita: 1994-2009 average
Inequality in household disposable income
II.5. REDUCING INCOME INEQUALITY WHILE BOOSTING ECONOMIC GROWTH: CAN IT BE DONE?
ECONOMIC POLICY REFORMS 2012: GOING FOR GROWTH © OECD 2012 195
fees that make students share at least part of the cost of tertiary education could lower
disposable income inequality (as the current financing of education is regressive), provided
they are accompanied by flanking measures so that the poor are not excluded from tertiary
education.10
Promoting equity in education
Raising social mobility by making educational outcomes less dependent on personal
and social circumstances should boost GDP per capita by enhancing entrepreneurship, the
overall quality and allocation of human capital and, ultimately, productivity. At the same
time, a more equitable distribution of educational opportunities has been shown to result
in a more equitable distribution of labour income (e.g. De Gregorio and Lee, 2002). Examples
of reforms include postponing early tracking, strengthening links between school and
home to help disadvantaged children learn, and providing early childhood care and basic
schooling for all. The latter may yield large positive returns over an individual’s entire
lifetime, particularly for the most disadvantaged (Chetty et al., 2011; OECD, 2006b).
Reducing the gap between employment protection on temporary and permanent work
If employment protection11 is much stricter for regular than for temporary contracts,
workers at the margin of the labour market – such as young people – risk getting trapped in
a situation where they move between temporary work and unemployment without getting
Table 5.2. Some structural policies benefit both growth and equalitybut others may entail a trade-off
A rise in:Employment
rateEarnings equality1
Total labour income equality2
GDP per capita
The tertiary education graduation rate ~ + + +The upper secondary graduation rate ~ + + +Equity in education ~ + + +The minimum wage (as share of the median wage) 0/– + ~ 0/–Unionisation ~ + + ~Legal extensions of collective wage agreements – ~ – –The overall level of employment protection legislation (EPL) 0/– + ~ –The gap between EPL on regular versus temporary work – – – –The replacement rate and duration of unemployment benefits – + ~ –Spending on active labour market policies 0/+ ~ + +Anti-competitive product market regulation – 0/+ ~ –The integration of immigrants + + + +Anti-discrimination initiatives + + + +Female labour force participation + + + +
1. The term “Earnings equality” refers to equality among those who earn an income from employment.2. The term “Total labour income equality” refers to equality among the working-age population, thus accounting
for both employment and earnings inequality effects.Note: A plus symbol (+) denotes a significant rise in the variable, a minus symbol (–) a significant fall and a zero (0) noimpact; 0/+ and 0/– mean that research is contradictory, i.e. some studies cannot find a significant effect while othersfind a positive/negative effect or studies cannot find an aggregate effect but find a significant effect on some parts ofthe population. ~ means that the sign of the effect is unknown because the empirical literature is inconclusive orbecause studies on the link are not available.
Source: The GDP per capita effects are based on the findings of previous OECD and other studies or deducted from theemployment rate effect (e.g. Barnes, S., et al. (2011), “The GDP Impact of Reform: A Simple Simulation Framework”,OECD Economics Department Working Papers, No. 834, OECD Publishing; Bouis, R. and R. Duval (2011), “Raising PotentialGrowth After the Crisis: A Quantitative Assessment of the Potential Gains from Various Structural Reforms in theOECD Area and Beyond”, OECD Economics Department Working Papers, No. 835, OECD Publishing. The earnings andemployment effects are taken from new OECD analysis reported in Koske, I. et al. (2012) and the studies cited therein.
II.5. REDUCING INCOME INEQUALITY WHILE BOOSTING ECONOMIC GROWTH: CAN IT BE DONE?
ECONOMIC POLICY REFORMS 2012: GOING FOR GROWTH © OECD 2012196
into permanent work. This can have adverse implications for human capital and career
progression (OECD, 2004) and, ultimately, income equality and economic growth. New
OECD analysis finds that low-income workers on temporary contracts earn less than
workers with similar characteristics on permanent contracts (Fournier and Koske, 2012).
This is not the case for higher-income workers. Tentative evidence on the size of the effect
illustrated in Table 5.1 suggests, for example, that reducing protection for permanent work
from the level observed in Germany (third-highest level) to that observed in Finland (which
is about OECD average) while increasing protection for temporary work from the level
observed in the United Kingdom (second-lowest level) to that observed in Finland (which is
about OECD average) would reduce the 90/10 percentile ratio by about 0.24 (which is
about 7% of the average 90/10 percentile ratio in OECD countries). More even job protection
for temporary and permanent contracts is also likely to reduce the income gap between
immigrants and non-immigrants, as previous studies have shown that immigrants suffer
disproportionately from contract-related labour market dualism (Causa and Jean, 2007).
Increasing spending on active labour market policies
High social benefits can reduce the incentives for work and employment. Active labour
market policies may limit these adverse effects by better matching jobs with skills and
enhancing job search support and monitoring. Existing empirical evidence suggests indeed
that active labour market policies raise employment (Bassanini and Duval, 2006). This
should entail positive effects for both GDP per capita and labour income equality.
Programme design is key to reaping such gains, however (Martin and Grubb, 2001).
Promoting the integration of immigrants
Better integration of immigrants in the labour market can both reduce inequality and
raise GDP per capita through higher labour force participation. Targeted policies, such as
language courses, and transparent systems of recognising foreign qualifications should
help to close the gap between immigrants and non-immigrants’ labour market
performance.
Improving labour market outcomes of women
Women tend to take on more caring responsibilities than men, meaning they work
fewer hours and thus take home less pay. Arguably, their higher labour supply elasticity
should lead women to be taxed at a lower rate than men. Since this is not feasible in
practice, policies to improve the availability of formal care for children and the elderly can
serve as an alternative solution. Such policies should help to reduce gender differences in
working hours and – at least to the extent that hourly wages are little affected – pay, and at
the same time improve long-run living standards through higher participation rates.
Fighting discrimination
Since at least part of the earnings gap between immigrants and non-immigrants and
between men and women is likely to be due to discrimination (Koske et al., 2012), more
effective legal rules (e.g. legal action against those who engage in discriminatory practices)
could also help.
II.5. REDUCING INCOME INEQUALITY WHILE BOOSTING ECONOMIC GROWTH: CAN IT BE DONE?
ECONOMIC POLICY REFORMS 2012: GOING FOR GROWTH © OECD 2012 197
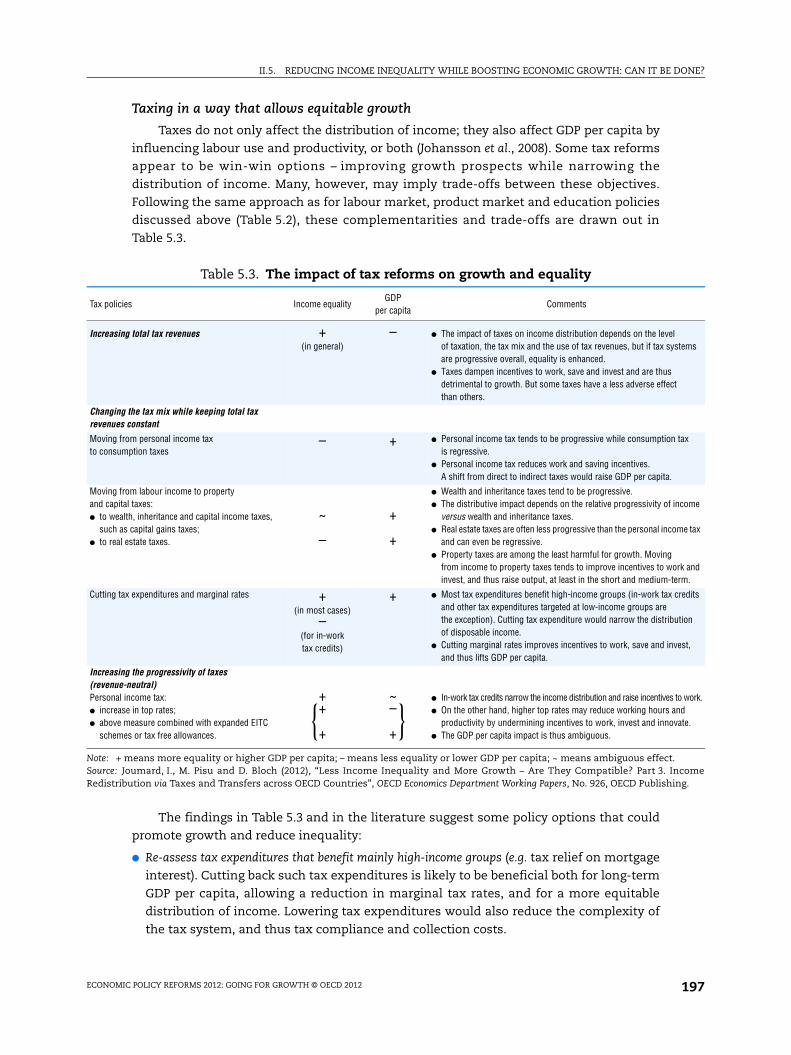
Taxing in a way that allows equitable growth
Taxes do not only affect the distribution of income; they also affect GDP per capita by
influencing labour use and productivity, or both (Johansson et al., 2008). Some tax reforms
appear to be win-win options – improving growth prospects while narrowing the
distribution of income. Many, however, may imply trade-offs between these objectives.
Following the same approach as for labour market, product market and education policies
discussed above (Table 5.2), these complementarities and trade-offs are drawn out in
Table 5.3.
The findings in Table 5.3 and in the literature suggest some policy options that could
promote growth and reduce inequality:
● Re-assess tax expenditures that benefit mainly high-income groups (e.g. tax relief on mortgage
interest). Cutting back such tax expenditures is likely to be beneficial both for long-term
GDP per capita, allowing a reduction in marginal tax rates, and for a more equitable
distribution of income. Lowering tax expenditures would also reduce the complexity of
the tax system, and thus tax compliance and collection costs.
Table 5.3. The impact of tax reforms on growth and equality
Tax policies Income equalityGDP
per capitaComments
Increasing total tax revenues +(in general)
– ● The impact of taxes on income distribution depends on the level of taxation, the tax mix and the use of tax revenues, but if tax systems are progressive overall, equality is enhanced.
● Taxes dampen incentives to work, save and invest and are thus detrimental to growth. But some taxes have a less adverse effect than others.
Changing the tax mix while keeping total tax revenues constant
Moving from personal income tax to consumption taxes
– + ● Personal income tax tends to be progressive while consumption tax is regressive.
● Personal income tax reduces work and saving incentives. A shift from direct to indirect taxes would raise GDP per capita.
Moving from labour income to property and capital taxes:● to wealth, inheritance and capital income taxes,
such as capital gains taxes;● to real estate taxes.
~
–
+
+
● Wealth and inheritance taxes tend to be progressive.● The distributive impact depends on the relative progressivity of income
versus wealth and inheritance taxes.● Real estate taxes are often less progressive than the personal income tax
and can even be regressive.● Property taxes are among the least harmful for growth. Moving
from income to property taxes tends to improve incentives to work and invest, and thus raise output, at least in the short and medium-term.
Cutting tax expenditures and marginal rates +(in most cases)
–(for in-work tax credits)
+ ● Most tax expenditures benefit high-income groups (in-work tax credits and other tax expenditures targeted at low-income groups are the exception). Cutting tax expenditure would narrow the distribution of disposable income.
● Cutting marginal rates improves incentives to work, save and invest, and thus lifts GDP per capita.
Increasing the progressivity of taxes (revenue-neutral)Personal income tax:● increase in top rates;● above measure combined with expanded EITC
schemes or tax free allowances.
++
+
~–
+
● In-work tax credits narrow the income distribution and raise incentives to work.● On the other hand, higher top rates may reduce working hours and
productivity by undermining incentives to work, invest and innovate.● The GDP per capita impact is thus ambiguous.
Note: + means more equality or higher GDP per capita; – means less equality or lower GDP per capita; ~ means ambiguous effect.Source: Joumard, I., M. Pisu and D. Bloch (2012), “Less Income Inequality and More Growth – Are They Compatible? Part 3. IncomeRedistribution via Taxes and Transfers across OECD Countries”, OECD Economics Department Working Papers, No. 926, OECD Publishing.
}{
II.5. REDUCING INCOME INEQUALITY WHILE BOOSTING ECONOMIC GROWTH: CAN IT BE DONE?
ECONOMIC POLICY REFORMS 2012: GOING FOR GROWTH © OECD 2012198
● Reduce distortions in taxing capital income. Tax relief – such as reduced taxation for capital
gains from the sale of a principal or secondary residence – often distorts resource
allocation without boosting aggregate savings and growth, and benefits mainly
high-income groups. Specific tax relief may also provide tax avoidance instruments for
top-income earners. In particular, there is little justification for tax breaks for stock
options and carried interest. Raising such taxes would increase equity and allow a
growth-enhancing cut in marginal labour income tax rates.
Growth-enhancing policy reforms that are likely to raise income inequality
Increasing the flexibility of wage determination
Extending collective wage agreements to firms that are not party to the original
settlement may make labour costs too high for some employers. This can hamper
productivity through lower competitive pressures from the entry of new firms, and can
also reduce employment (Murtin et al., 2012). However, new OECD evidence suggests that
unions compress the distribution of labour earnings. To the extent that administrative
extensions have a similar effect, their overall impact on income inequality is ambiguous,
reflecting offsetting effects on employment and the dispersion of labour earnings.
Shifting the tax mix from personal and corporate income taxes towards real estate and consumption taxes
Personal and corporate income taxes, as well as social security contributions, are the
most distortive taxes as they have sizable adverse effects on labour use, productivity and
capital accumulation. Shifting the tax mix away from such taxes and towards recurrent
taxes on immovable property (the least distortive) and consumption taxes should thus
raise living standards (Johansson et al., 2008). However, there is likely to be a trade-off with
the income distribution objective since personal income taxes are progressive while real
estate and consumption taxes are at best neutral in a lifetime perspective and in most
cases tend to be regressive. Targeted transfers can reduce the severity of this trade-off.
Growth-enhancing policy reforms that have an ambiguous effect on income inequality
Avoiding too high and long-lasting unemployment benefits
If unemployment benefits are too high or long-lasting, they risk reducing job-search
incentives and raising wages above market-clearing levels. This lowers employment with
negative effects on GDP per capita and labour income equality. In the short run, these
adverse income distribution effects are likely to be dominated by the direct
inequality-reducing impact of the income support for the unemployed.12
Liberalising product markets
A wide range of studies illustrate the large beneficial effects of product market
liberalisation on productivity (e.g. Bourlès et al., 2010; Conway et al., 2006), but the impact on
labour income inequality is uncertain. Product market liberalisation generally raises
employment (e.g. Bassanini and Duval, 2006; Griffith et al., 2007), but this inequality-reducing
effect could potentially be offset by a wider dispersion of earnings, though the evidence on
the latter link is far from conclusive (e.g. Guadalupe, 2007; Koske et al., 2012).
II.5. REDUCING INCOME INEQUALITY WHILE BOOSTING ECONOMIC GROWTH: CAN IT BE DONE?
ECONOMIC POLICY REFORMS 2012: GOING FOR GROWTH © OECD 2012 199
Lowering minimum labour costs
Minimum wages that are set too high can limit the job market opportunities for young
and low-skilled workers. Under such circumstances, lowering relative labour costs may
boost the employment of these marginal groups in the labour market (Neumark and
Wascher, 2007). Greater employment in turn raises GDP per capita and reduces labour
income inequality. However, existing studies, including new OECD analysis (Koske et al.,
2012), suggest that a fall in the minimum wage risks widening the dispersion of wages at
the bottom of the distribution among those who are already employed, so that the impact
on labour income inequality among the working age population is ambiguous. The
employment effect of a lower minimum wage is likely to be smaller when the initial level
of minimum labour costs is already low, which increases the likelihood that labour income
inequality will rise.
Moving from income to wealth or inheritance taxes
Shifting taxes from income to wealth or inheritance would raise GDP per capita, since
property taxes are among the least distortive taxes. As personal income, wealth and
inheritance taxes all tend to be progressive, the distributional impact would depend on the
relative progressivity of each tax but may be broadly neutral.
Notes
1. OECD (2011) provides more detail on the five main income concepts shown in Figure 5.1, and alsodiscusses changes over time.
2. When examining inequality in individual labour earnings, the unemployed and people not lookingactively for a job are assigned zero income.
3. As the focus of the first three income concepts is on market income, the population covered is theworking-age population.
4. The determinants of inequality for each of the five income concepts are discussed in greater detailin a series of OECD Economics Department Working Papers, in particular Hoeller et al. (2012), Koskeet al. (2012) and Joumard et al. (2012).
5. The poverty rate is defined as the share of the population whose equivalised household disposableincome is below 50% of the median income.
6. The statistical data for Israel are supplied by and under the responsibility of the relevant Israeliauthorities. The use of such data by the OECD is without prejudice to the status of the GolanHeights, East Jerusalem and Israeli settlements in the West Bank under the terms of internationallaw.
7. The cluster analysis is performed on a set of 12 variables: the Gini index for individual labourearnings for the working age population, the ratio of the 9th to 5th deciles for wage earnings offull-time employees, the ratio of the 5th to 1st deciles for wage earnings of full-time employees,the share of part-time employment in total employment, the non-employment rate, the Gini indexfor household labour earnings (working age population), the Gini index for household marketincome for the working age population, the concentration ratio for transfers, the concentrationratio for taxes, the Gini index for household disposable income for the whole population, theincome ratio of the 5th to the 1st quintile for household disposable income adjusted for in-kindpublic services and the poverty rate.
8. Consumption taxes tend to be regressive because lower-income households consume a largershare of their income. To mitigate this regressive impact, many OECD countries apply reducedrates and exemptions for goods and services that account for a large share of poorer households’consumption basket. The evidence, however, suggests that such tax reliefs benefit high-incomegroups most and may thus not be an effective redistributive tool (Dalsgaard, 2000; OECD, 2010a).
9. The regressive nature of recurrent taxes on immovable property may partly fade in a lifetimeperspective. Indeed, the elderly are often income-poor but wealth-rich and property taxes based
II.5. REDUCING INCOME INEQUALITY WHILE BOOSTING ECONOMIC GROWTH: CAN IT BE DONE?
ECONOMIC POLICY REFORMS 2012: GOING FOR GROWTH © OECD 2012200
on real estate values absorb a large share of their income. In contrast, working-age householdstend to have higher income and lower wealth and property taxes absorb a lower share of theirincome.
10. For example, this could be achieved by combining tuition fees with student loans and linkingrepayment to income. Empirical evidence suggests that any negative effect of tuition fees onparticipation rates can be fully offset through improvements in the financial support for students(OECD, 2008b; Heller, 1999).
11. Employment protection refers both to regulations concerning hiring (e.g. rules favouringdisadvantaged groups, conditions for using temporary or fixed-term contracts, trainingrequirements) and firing (e.g. redundancy procedures, mandatory notification periods andseverance payments, special requirements for collective dismissals and short-time workschemes).
12. In addition, the adverse effects on labour income inequality that stem from lower employmentmay potentially be offset – at least partially – by a more compressed income distribution (ifunemployment benefits are progressive or lower-income workers are more likely to receive them).
Bibliography
Acemoglu, D. (2002), “Technical Change, Inequality, and the Labor Market”, Journal of EconomicLiterature, Vol. 40, No. 1.
Atkinson, A.B. and A. Leigh (2008), “Top Incomes in New Zealand 1921-2005: Understanding the Effectsof Marginal Tax Rates, Migration Threat, and the Macroeconomy”, Review of Income and Wealth,Vol. 54, No. 2, pp. 149-165.
Autor, D.H., L.F. Katz and M.S. Kearney (2006), “The Polarization of the US Labour Market”, AmericanEconomic Review, Vol. 96, No. 2, pp. 189-194.
Bassanini, A. and R. Duval (2006), “Employment Patterns in OECD Countries: Reassessing the Role ofPolicies and Institutions”, OECD Economics Department Working Papers, No. 486, OECD Publishing.
Bourlès, R. et al. (2010), “Do Product Market Regulations in Upstream Sectors Curb Productivity Growth:Panel Data Evidence for OECD Countries”, OECD Economics Department Working Papers, No. 791,OECD Publishing.
Causa, O. and S. Jean (2007), “Integration of Immigrants in OECD Countries: Do Policies Matter?”, OECDEconomics Department Working Papers, No. 564, OECD Publishing.
Chetty, R. et al. (2011), “How Does Your Kindergarten Classroom Affect Your Earnings? Evidence fromProject Star”, Quarterly Journal of Economics, Vol. 126, No. 4.
Conway, P. et. al. (2006), “Regulation, Competition and Productivity Convergence”, OECD EconomicsDepartment Working Papers, No. 509, OECD Publishing.
Cuñat, V. and M. Guadalupe (2009), “Globalization and the Provision of Incentives inside the Firm: TheEffect of Foreign Competition”, Journal of Labor Economics, Vol. 27, No. 2, pp. 179-212.
Dalsgaard, T. (2000), “The Tax System in Mexico – A Need for Strengthening the Revenue-RaisingCapacity”, OECD Economics Department Working Papers, No. 233, OECD Publishing.
Dinopoulos, E. and P. Segerstrom (1999), “A Schumpeterian Model of Protection and RelativeWages,”American Economic Review, Vol. 89, No. 3, pp. 450-472.
Egger, H. and U. Kreickemeier (2009), “Firm Heterogeneity and the Labor Market Effects of TradeLiberalization”, International Economic Review, Vol. 50, No. 1, pp. 187-216.
Feenstra, R.C. and G.H. Hanson (1996), “Foreign Investment, Outsourcing and Relative Wages”, NBERWorking Paper, No. 5121, National Bureau of Economic Research.
Fournier, J.-M. and I. Koske (2012), “Equality and Growth – Are They Compatible? Part 7. The Drivers ofLabour Earnings Inequality – An Analysis Based on Conditional and Unconditional QuantileRegressions”, OECD Economics Department Working Papers, No. 930, OECD Publishing.
Fredriksen, K. (2012), “Less Income Inequality and More Growth – Are They Compatible? Part 6. TheDistribution of Wealth”, OECD Economics Department Working Papers, No. 929, OECD Publishing.
Gabaix, X. and A. Landier (2008), “Why Has CEO Pay Increased So Much?”, Quarterly Journal of Economics,Vol. 123, No. 1, pp. 49-100.
II.5. REDUCING INCOME INEQUALITY WHILE BOOSTING ECONOMIC GROWTH: CAN IT BE DONE?
ECONOMIC POLICY REFORMS 2012: GOING FOR GROWTH © OECD 2012 201
Garicano, L. and E. Rossi-Hansberg (2006), “Organization and Inequality in a Knowledge Economy”,Quarterly Journal of Economics, Vol. 121, No. 4, pp. 1383-1435.
Goolsbee, A. (2000), “Taxes, High-Income Executives, and the Perils of Revenue Estimation in the NewEconomy”, American Economic Review, Vol. 90, No. 2, pp. 271-275.
Goos, M., A. Manning and A. Salomons (2009), “The Polarization of the European Labor Market”,American Economic Review Papers and Proceedings, Vol. 99, No. 2, pp. 58-63.
Gordon, R. and I. Dew-Becker (2008), “Controversies about the Rise of American Inequality: A Survey”,NBER Working Papers, No. 13982, National Bureau of Economic Research.
Gregorio, J. De and J. Lee (2002), “Education and Income Inequality: New Evidence from Cross-CountryData”, Review of Income and Wealth, Vol. 48, No. 3, pp. 395-416.
Griffith, R., R. Harrison and G. Macartney (2007), “Product Market Reforms, Labour Market Institutionsand Unemployment”, Economic Journal, Vol. 117.
Guadalupe, M. (2007), “Product Market Competition, Returns to Skill, and Wage Inequality”, Journal ofLabor Economics, Vol. 25, No. 3, pp. 439-474.
Heller, D.E. (1999), “The Effects of Tuition and State Financial Aid on Public College Enrollment”, Reviewof Higher Education, Vol. 23, No. 1, pp. 65-89.
Helpman, E., O. Itskhoki and S.J. Redding (2010), “Inequality and Unemployment in a Global Economy”,Econometrica, Vol. 78, No. 4, pp. 1239-1283.
Hoeller, P. (2012), “Less Income Inequality and More Growth – Are They Compatible? Part 4. TopIncomes”, OECD Economics Department Working Papers, No. 927, OECD Publishing.
Hoeller, P. et al. (2012), “Less Income Inequality and More Growth – Are They Compatible? Part 1. MappingIncome Inequality Across the OECD”, OECD Economics Department Working Papers, No. 924,OECD Publishing.
Johansson, Å. et al. (2008), “Taxation and Economic Growth”, OECD Economics Department WorkingPapers, No. 620, OECD Publishing.
Joumard, I., M. Pisu and D. Bloch (2012), “Less Income Inequality and More Growth – Are TheyCompatible? Part 3. Income Redistribution via Taxes and Transfers across OECD Countries”, OECDEconomics Department Working Papers, No. 926, OECD Publishing.
Koske, I., Fournier, J.-M. and I. Wanner (2012), “Less Income Inequality and More Growth – Are TheyCompatible? Part 2. The Distribution of Labour Income”, OECD Economics Department Working Papers,No. 925, OECD Publishing.
Martin, J.P. and D. Grubb (2001), “What Works and for Whom: A Review of OECD Countries’ Experienceswith Active Labour Market Policies”, Swedish Economic Policy Review, Vol. 8, No. 2, pp. 9-56.
Murphy, K.J. and J. Zábojník (2004), “CEO Pay and Appointments: A Market-Based Explanation forRecent Trends”, American Economic Review, Vol. 94, No. 2, pp. 192-196.
Murtin, F., de Serres, A. and A. Hijzen (2012), “The Ins and Outs of Unemployment: The Role of LabourMarket Institutions”, OECD Economics Department Working Papers, OECD Publishing, forthcoming.
Neary, J.P. (2003), “Presidential Address: Globalization and Market Structure”, Journal of the EuropeanEconomic Association, Vol. 1, No. 2-3, pp. 245-271.
Neumark, D. and W. Wascher (2007), “Minimum Wages and Employment”, IZA Discussion Papers,No. 2570.
OECD (2004), OECD Employment Outlook 2004, OECD Publishing.
OECD (2006a), The Taxation of Employee Stock Options, OECD Tax Policy Studies, No. 11, OECD Publishing.
OECD (2006b), Starting Strong II: Early Childhood Education and Care, OECD Publishing.
OECD (2008a), Growing Unequal? Income Distribution and Poverty in OECD Countries, OECD Publishing.
OECD (2008b), Tertiary Education for the Knowledge Society: Volume 1 and Volume 2, OECD Publishing.
OECD (2010a), OECD Economic Surveys: Czech Republic 2010, OECD Publishing.
OECD (2010b), Tax Expenditures in OECD Countries, OECD Publishing.
OECD (2011), Divided We Stand: Why Inequality Keeps Rising, OECD Publishing.
II.5. REDUCING INCOME INEQUALITY WHILE BOOSTING ECONOMIC GROWTH: CAN IT BE DONE?
ECONOMIC POLICY REFORMS 2012: GOING FOR GROWTH © OECD 2012202
Piketty, T. (2010), “On the Long-Run Evolution of Inheritance: France 1820-2050”, Paris School ofEconomics Working Paper, May.
Piketty, T. and E. Saez (2003), “The Evolution of Top Incomes: A Historical and InternationalPerspective”, American Economic Review, Vol. 96, No. 2, pp. 200-205.
Roine, J., J. Vlachos and D. Waldenström (2009), “The Long-Run Determinants of Inequality: What CanWe Learn from Top Income Data?”, Journal of Public Economics, Vol. 93, No. 7-8, pp. 974-988.
Rosen, S. (1981), “The Economics of Superstars”, American Economic Review, Vol. 71, No. 5, pp. 845-858.
Saez, E. and M.R. Veall (2005), “The Evolution of High Incomes in Northern America: Lessons fromCanadian Evidence”, American Economic Review, Vol. 95, No. 3, pp. 831-849.
Stiglitz, J., A. Sen and J.P. Fitoussi (2009), Report by the Commission on the Measurement of EconomicPerformance and Social Progress, Commission on the Measurement of Economic Performance andSocial Progress.