the chemistry of the carbon-in--pulp process michael … · mr p. ellis and mrs i. klingbiel, for...
TRANSCRIPT
THE CHEMISTRY OF THE CARBON-IN--PULP PROCESS
Michael David Adams
A Thesis submitted to the Faculty of Science University of the Witwatersrand, Johannesburg in fulfilment of the requirements for the degree of Doctor of Philosophy
Johannesburg 1989
ABSTRACT
Several conflicting theories of the adsorption of aurocyanide onto activated carbon presently exist. To resolve the mechanism, adsorption and elution of aurocyanide are examined by several techniques, including Mossoauer spectroscopy, X-ray photoelectron spectroscopy, X-ray diffractometry, Fourier Transform Infrared spectrophotometry, ultraviolet-visible spectrophotometry and scanning electron microscopy.
The evidence gathered indicates that, under normal plant conditions, aurocyanide is extracted onto activated carbon in the form of an ion pair Mn* [Au(CN) 2 3 n, and eluted by hydroxide or cyanide. The hydroxide or cyanide ions react with the carbon surface, rendering it relatively hydrophilic with a decreased affinity for neutral species. Additional adsorption mechanisms are shown to operate under other conditions of ionic strength, pH, and temperature. The poor agreement in the literature regarding the mechanism of adsorption of aurocyanide onto activated carbon is shown to be due to the fact that different mechanisms operate under different experimental conditions. The AuCN produced on the carbon surface by acid treatment is shown to react with hydroxide ion via the reduction of AuCN to metallic gold with formation of Au (CN) 2, and the oxidation of cyanide to cyanate. Other species, such as An(CN)5 and Ag(CN)g adsorb onto activated carbon by a similar mechanism to that postulated for Au(CN)2.
Ion association of MAu(CN) 2 salts in aqueous solution is demonstrated by * aans of potentiometric titration and conductivity measurements, and various associated species of KAu(CN), salts are shown to occur in organic
solvents by means of infrared spectrophoteaietric and distribution measurements.
A kinetic model was developed for elution of aurocyanide from activated carbon and was found to predict gold elution performance successfully using the Zadra procedure.
The influence of the surface chemistry and structure of activated carbon on adsorption of aurocyanide was investigated by characterization of activated carbons that were synthesized or oxidized under various conditions. Synthetic polymeric adsorbents with characteristics similar to activated carbons were also studied. The evidence suggests that a large nicropore volume is important in providing suitable active sites for adsorption. Another important factor is the presence of basic functional groups within the micropore, which act as solvating agents for the ion pair.
The aim is to provide a self-consistent adsorption mechanism that accounts for all observations presented in the literature. Interprrtation of results in terras of preconceived ide..s, and neglect of observations of other authors has greatly contributed to current disagreement in the literature.

Declaration
I declare that this Thesis is ray own, unaided work. It is being submitted for the degree of Doctor of Philosophy. It has not been submitted before for any degree or examination in any other University.
2- 3 i day of , 1989

Acknowledgements
I wish to express my sincere gratitude and appreciation to
my supervisors. Prof R.D. Hancock and Prof R.G. Copperthvaite for their enthusiasm and help;
my wife, Jenni, for her support;
my colleagues, Dr C.A. Fleming, Dr R.L. Paul, Dr M.J. Niccl, Dr B.P. Green, Dr P.J. Harris amongst others, for the many hours of useful discussions;
Prof Dr F.E. Wagner of the Physik-Depart-ment, Technische Universitat Hunchen, for running the Mossbauer spectra and for engaging in a useful collaboration regarding this technique;
Mr P. Ellis and Mrs I. Klingbiel, for their patience with running the Scanning Electron Microscope;
Mr D.E. Imes, for running the X-ray Photoelectron spectra;
Mr P.W. Wade, for his time and help with the Molecular Mechanics calculations;
Mrs M. Arinto, Mrs M.R. Hazell and Ms T. McArthur, for their assistance in the typing of this manuscript;
the Council for Mineral Technology (Mintek), for allowing me to undertake this research during ray period of employment with them;
my parents, for their encouragement through the years.
i

Contents
pageCHAPTER 1 INTRODUCTION 11.1 The Adsorption of Aurocyanide onto Activated
Carbon - An Historical Perspective 11.2 The Carbon-in-pulp Process - Process
Chemistry and Unknown Areas 3a; Leaching of Gold from the Ore 3b) Adsorption of Aurocyanide onto Activated
Carbon lc) Carbon Acid Washing and Elution 7d) Gold Electrot'inning or Precipitation 8e) Carbon Reactivation 8f) Other Features of the CIP Process 91.3 The Structure and Chemistry of Activated
Carbon 10a) Physical Structure of Activated Carbon 10b) Chemical Stricture of Activated Carbon li1.4 The Chemistry of Gold - An Introduction 131.5 Current Processes for the Recovery of Gold 17
CHAPTER 2 EXPERIMENTAL PROCEDURE 192.1 Reagents and Chemicals 192.2 Activated Carbon Adsorption studies 20a) Equilibrium Adsorption 20b) Elution of the Carbon 21c) Precipitation of AuCN 21d) Decomposition of AuCN 22e) Oxygen Effect Experiments 22f) Gold(XII) Cyanide Experiments 23g) Silver and Mercury Experiments 23h) Miscellaneous Techniques 24
(i) X-ray diffractometry 24(ii) Scanning electron microscopy 24

(iii) Fourier Transform infraredSpectrophotometry 24
(iv) 197Au Mossbauer spectroscopy 25(v) x y photoelectron spectroscopy (XPS) 33
2.3 Solution Studies 35a) Pctantiometric Titration 35by Conductivity Measurements 35c) Infrared Spectrophotometry 36d) Distribution Experiments 36e; Determination of Chloride Concentration in
Organic Phases 37Determination of Dielectric Constant 37
g) Determination of Water Content by AutomaticKarl-Fischer Titration 38
2.4 Molecular Mechanics Calculations 38a) The Force Field 38by Conformations of Polyether in Organic
Solvents 392.5 Activated Carbon Elution Studies 40a) Elution Mechanism Experiments 40by Kinetic Experiments 412.6 Activated Carbon Surface Chemistry and
Structure Studies 4 5ay Carbons and Adsorbents Used 45by Synthesis of Activated Carbons 45cy Oxidation of Activated Carbons 47dy Synthesis of Polyxanthene and Polyquinone 47ey Adsorption of Aurocyanide 48fy Techniques for the Characterization of
Physical Properties 49gy Techniques for the Characterization of
Chemical Properties 51
CHAPTER 3 THE MECHANISM OF ADSORPTION OFAUROCYANIDE ONTO ACTIVATED CARBON 53
3.1 The Mechanism of Adsorption of Aurocyanideonto Activated Carbon - A Literature Review 53
ay Summary of Factors Influencing Adsorp-
vii

b!
c,
3.2
a)
b;
c)
<*}
B)
f)
9)
3.3
tioji of Aurocyanide onto Activated Carbon Summery of Mechanisms Postulated for Adsorption of Aurocyanide onto Activated CarbonSummary of Major Inconsistencies Present in Modern Theories ..or Adsorption of Aurocyanide onto Activated Carbon Novel Studies on the Nature of the Adsorbed SpeciesEffect of Gold Concentration on the Carbon on the Nature of the Adsorbed Species Elution of Aurocyanide from Activated Carbon with Sodium hydroxideEffect of the Treatment of Loaded Carbon with Hot Acid on the Nature of the Adsorbed Gold Species
(i) SEM and XRD studies of gold species on carbons subjected to acid and base treatments
(ii) Mossbauer spectroscopic study ofgold species on carbons subjected to acid and base treatments
(iii) Kinetics of AuCN precipitation from aqueous solution
(iv) Decomposition of AuCN in aqueous solution
Thermal Stability of Adsorbed Gold Species on Activated CarbonRelation Between the Effects of Oxygen and Ionic Strength on the Adsorftion of Aurocyanide onto Activated Carbon X-ray Photoelectron Spectroscopic Study of Adsorbed Gold Species on Activated Carbon Fourier Transform Infrared Spectroscopic Study of Adsorbed Aurocyanide Species on Activated CarbonMechanisms of Adsorption of Other Complex Metal-ion Species onto Activated Carbon
53
54
55
56
57
59
62
62
70
77
78
84
98
115
128
145

a) The Mechanism of Adsorption of Au(CN) ̂onto Activated Carbon 145
b) The Mechanicms of Adsorption of Ag(CN) 2and Ag* onto Activated Carbon 154
c) The Mechanisms of Adsorption of Hg(CN) 2 andHgCl2 onto Activated Carbon 172
d) The Mechanism of Adsorption of AuCl ~4 ontoActivated Carbon 182
3.4 Summary and Conclusions 182
CHAPTER 4 ION ASSOCIATION OF MAti(CN) , SALTS IN VARIOUS SOLVENTS
4.1 Ion Association of HAu(CN) 7 Salts in Various Solvents - A Literature Survey
4.2 The Study of Ion Association - A Literature Survey
4.3 Ion Association of MAu(CN) 2 Salts in Aqueous SolutionPotsntiometric i'itration of Aqueous Solution of HAufCN;2Conductimetric Study of Aqueous Solutions ofKAu(CN)? and NaAu(CN) 2Ion Association of MAu(CN)2 Salts in Organic SolventsInfrared Spectra cf MAu(CN) 2 Salts in Organic SolventsDistribution of MAu(CNj2 Salts between Aqueous Solutions and Organic SolventsEffect of Solvent Effect of Diluent Effect of Cation
Extraction of Aurocyanide Ion Pairs by Poly(oxyethylene) ExtractantsSolvent Extraction of M#Au(CN) 2 Ion Pairs by Triton X-10CMolecular Mechanics Calculations of the Complexation of Alkali Metal Cations by Polyethers
190
a)
h)
aj
a;b)
c)4.6
h)
195
212224234238
251
258
1%

4.7 Summary and Conclusions 266
CHAPTER 5 THE MECHANISM OF ELUTION OFAUROCYANIDE FROM ACTIVATED CARBON
5.1 Introductiona) Processes for Elution of Aurocyanide
frcm Activated Carbonb) Chemistry and Mechanism of Elution of
Aurocyanide from Activated Carbon5.2 Novel Studies on the Mechanism of Elution of
Aurocyanide from Activated Carbon5.3 Kinetics of Elution of Aurocyanide from
Activated Carbona) Effect of Finite, Constant Concentration
of Gold in Eluant Feedb) Effect of Variable Gold Concentration in
Eluant Feedc) Elution of Aurocyanide from Carbon in a
Packed Column5.4 Factors Influencing Elution of Gold from
Activated Carbona) Effect of Temperatureb) Effect of Ionic Strengthc) Effect of Cyanide and Hydroxide
Concentrationsd) Effect of Organic Solvents5.5 Other Aspects of the Elution Processa) Effect of Acid washing Prior to Elutionb) Effect of Cyanide Decomposition on
Gold Elution Efficiencyc) Effect of Removal of Cyanide from
Eluant Solutiond) Selective Elution of Copper and Mercury5.6 Conclusions
CHAPTER 6 THE INFLUENCE OF ACTIVATED CARBON SURFACE CHEMISTRY AND STRUCTURE ON THE ADSORPTION OF AUROCYANIDE
269269
269
270
272
278
286
291
293
298298301
301303306307
?08
311311316
319
X
6-1 Influence of Activation Conditions andStarting Material on the Surface Chemistry, Structure and Gold Adsorption Activity of Activated Carbon
a; Gold Adsorption Activityb) Activated Carbon Structurec) Activated Carbon Surface Chemistry6.2 Effect of Surface Oxidation on the
Surface Chemistry, Structure and Gold Adsorption Activity of Activated Carbon
a) Gold Adsorption Activityb) A. rivated Carbon Structurec) Activated Carbon Surface Chemistry6.3 Synthesis and Characterization of Polymeric
Models for Activated Carbon: Polyxanthenes and Pol uinones
a} Gold Adsorption Activityb) Polymer Structurec) Polyxanthene and Polyquinone Surface
Chemistry6.4 Summary and Conclusions
CHAPTER 7 CONCLUSIONS AND RAMIFICATIONS7.1 The Mechanism of Adsorption of Aurocyanide
onto Activated Carbon7.2 Ion Association of MAu{CN)z Salts in
Various Solvents7.3 The Mechanism of Elution of Aurocyanide from
Activated Carbon7.4 Influence of Activated Carbon Surface
Chemistry and Structure on the Process7.5 Ramifications for Existing Carbon-in-Pulp
Operationsa) Cyanide-free Elutionb) Acid Treatment of Loaded Carbon Followed by
Cyanide-fzee Elutionc) Effects of Oxygen and Ionic Strengthd) Kinetics of Elution
319320 322 337
347347349351
353357364
36737a
375
375
379
380
382
383383
384 384 384

7.6 Ramifications for Future Process Optionsa) Modification of Dielectric Constant within
the Ion-exchange Resinb) Alternative Functional Groups and Matrices
for Ion-exchange Resins
APPENDICES1. Some Physical and Chemical Properties of the
Organic Solvents Studied2. Calculation of Estimated Effective Ionic
Radii for Au(CN) ~2 and Ag(CN);3. Distribution and Association Data for
MAu(CN) 2 in Various Solvents4. Reduction Potentials of AuCN and AgCN5. List of Publications Arising from this
Thesis6 . Directory of Analytical Data Located on
Microfiche7. Directory of Computer Programs Developed
During this Research, Located on Microfiche
REFERENCES
?S4
385
385
386
387
389390
391
393
395
396
xli

List of Symbols
A Onsagar constanta interionic distance§ ionic radius in modified Born equationa degree of dissociationBV bed-volume of eluant solution8 XRD peak width at £ maximum intensityB3 stability constant of two-coordinate complexC concentration of gold on the carbon at time tCe initial concentration of gold on the carbonc concentration of gold in the aqueous phasechy velocity of lightc8 concentration of gold in the solvent phaseD distribution ratioDp pore diameter of adsorbentDN solvent donor numbaraHhyj hydration enthalpy
solvation enthalpy aHg electrostatic contribution to tne
solvation enthalpyneutral contribution to the solvation enthalpy
5 solubility parameterE single-pass electrowinning efficiencyEa activation energyEfc binding energy of electronE; energy of incident Mossbauer radie'jjnEp kinetic energy of photoelectronEuf work functionEy energy of 7-radiation from stationary Mossbauer
source @ ti electronic charge< bulk dielectric constant of solvent< % dielectric constant of primary solvation shell

F Faraday constantfs mean activity coefficient in organic phasef+ activity coefficientK equilibrium constantKk association constant
ionic extraction constant Kjj ion-pair extraction constantKj®T total extraction constantk intrinsic rate constantk' measured first order rate constant for gold
elutionki measured first order rate constant for cyanide
decomposition kg Boltzmann’s constantt conductivityL Avogadro1s number
microcrystallite diameter Lc microcrystallite heightA equivalent conductanceA0 equivalent conductance at infinite dilutionX wavelength of X-radiationX* equivalent cationic conductance at infinite
dilutionXg equivalent anionic conductance at infinite
dilutionM e mass of carbon in the elution columnM, mass of solution in the elution columnn aggregation numberi) solution viscosityR eras constantRa ratio of carbon mass to solution mass in the
elution column r solvent radiusrc erystallographic ionic radiusreff effective ionic radius of asymmetrical ion
j radial distance from centre of ionic chargers Stokes radiusSeut concentration of gold in the eluate solution

exiting the carbon column cr bed at time t concentration of gold in the eluant feed solution to the carbon column or bed at time t incident angle corresponding to XRD peak maximum flowrata of eluantflowrate of eluant solution from carbon bed intosimulated electrowjnning cellflowrate of diluent solution into simulatedelectrowinning cellvelocity applied to Mossbauet source mole fraction of water in the organic phase ionic charge
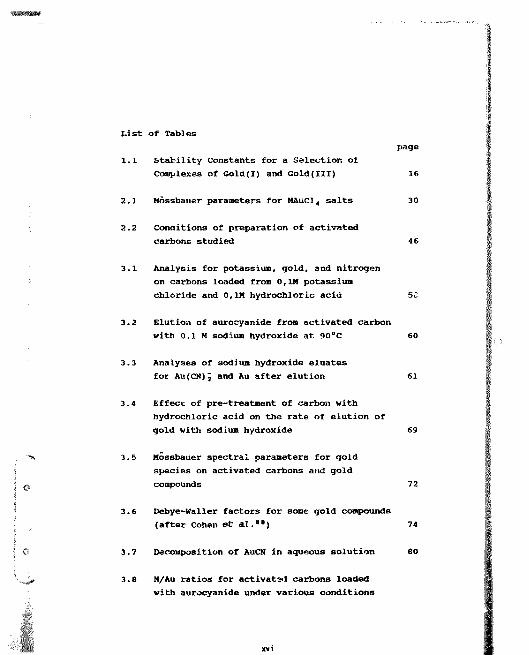
List of Tables
1.1 Stability Constants for a Selection of Complexes of Gold(I) and Gold(III)
2.1 Mossbauer parameters for MAuC14 salts
2.2 Conditions of preparation of activated carbons studied
3.1 Analysis for potassium, gold, and nitrogen on carbons loaded from 0,1M potassium chloride and 0 ,1M hydrochloric acid
3.2 Elution of aurocyanide from activated carbon with 0,1 M sodium hydroxide at 90°C
3.3 Analyses of sodium hydroxide eluates for Au(CN)2 and Au after elution
3.4 Effect of pre-treatment of carbon with hydrochloric acid on the rate of elution of gold with sodium hydroxide
3.5 Mossbauer spectral parameters for gold species on activated carbons and gold compounds
3.6 Debye-Waller factors for some gold compounds(after Cohen et al.88)
3.7 Decomposition of AuCN in aqueous solution
page
16
30
46
5C
60
61
69
72
74
80
3.8 N/Au ratios for activated carbons loaded with aurocyanide under various conditions

and dried at different temperatures 86
3.9 Mossbauer spectral parameters for gold species on activated carbons and gold compounds
3.10 Changes in solution pH during the adsorption of aurocyanide onto activated carbon under various conditions
3.11 Changes in pH of a 0 ,1M KC1 solution in contact with activated carbon, in the absence of aurocyanide
3.12 Concentrations of nitrogen and gold on ̂ carbons
3.13 Concentrations of anions in gold adsorption solutions
3.14 Concentrations of chloride on carbons
3.15 Au(4f 7/2) binding energies (eV) of gold compounds and adsorbed species
3.16 Na(2p), K(2p) and H(ls) binding energies of gold compounds and adsorbed species with referencing normalized to C(ls) of activated carbon at 284,4 eV
3.1" Au(4f 7/2) binding energies (eV) of gold compounds and adsorbed species with referencing normalized to C(ls) of activated carbon at 284,4 eV
3.18 Infrared spectral data for solid aurocyanide salts
97
105
106
107
107
108
117
119
123
133
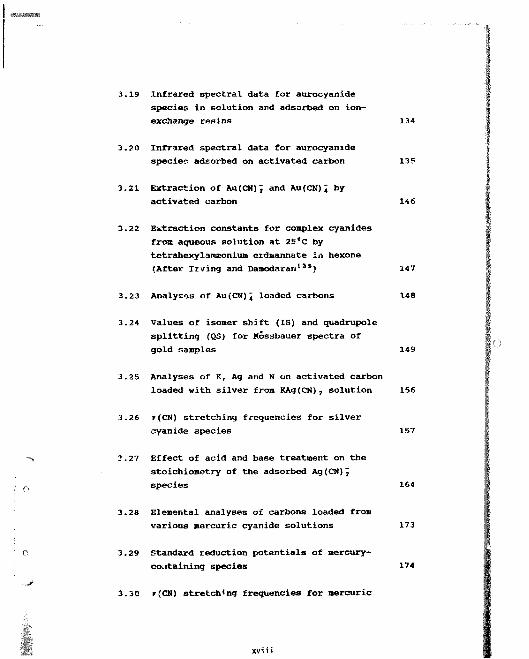
3.19 Infrared spectral data for aurocyanide species in solution and adsorbed on ion- exchange resins
3.20 Infrared spectral data for aurocyanide specie? adsorbed on activated carbon
3.21 Extraction of Au(CN); and Au(CN); by activated carbon
3.22 Extraction constants for complex cyanides from aqueous solution at 25eC by tetrahexylarasoniua eidmannate in hexone (After Irving and Damodaran138)
3.23 Analyses of Au(CN)^ loaded carbons
3.24 Values of isomer shift (IS) and quadrupole splitting (QS) for Mossbauer spectra of gold samples
3.25 Analyses of K, Ag and N on activated carbon loaded with silver from KAg(CN)2 solution
3.26 r(CN) stretching frequencies for silver cyanide species
3.27 Effect of acid and base treatment on thestoichiometry of the adsorbed Ag(CN)% species
3.28 Elemental analyses of carbons loaded from various mercuric cyanide solutions
3.29 Standard reduction potentials of mercury- containing species
3.30 y(CN) stretching frequencies for mercuric
xviii
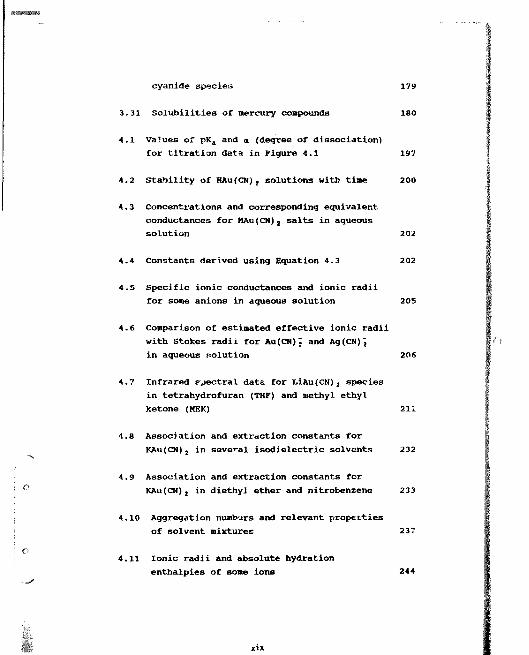
cyanide species 179
3.31
4.1
4.2
4.3
4.4
4.5
4.6
4.7
4.8
4.9
4.10
4.11
Solubilities of mercury compounds
Values of pKa and a (degree of dissociation) for titration data in Figure 4.1
Stability of HAu(CN)2 solutions with time
Concentrations and corresponding equivalent conductances for MAu(CH) 2 salts in aqueous solution
Constants derived using Equation 4.3
Specific ionic conductances and ionic radii for some anions in aqueous solution
Comparison of estimated effective ionic radii with Stokes radii for Au(CN)% and Ag(CN), in aqueous solution
Infrared spectral data for LiAu(CN)z species in tetrahydrofuran (THF) and methyl ethyl ketone (MEK)
Association and extraction constants for KAu(CN) 2 in several isodielectric solvents
Association and extraction constants for KAu(CN)2 in diethyl ether and nitrobenzene
Aggregation numbers and relevant properties of solvent mixtures
Ionic radii and absolute hydration enthalpies of some ions
180
197
200
202
202
205
206
211
232
233
237
244

4.12 Solubility of aurocyanide salts in aqueous solution
4.13 Efficiencies of extraction of M*Au(CN), ion pairs (M* = Li*, >.*, Cs*) by Triton X—100 dissolved in various solvents
4.14 Solubilities of water in the various solvent phases
4.15 Strain energies of conformations of uncomplexed poly(oxyethylene) in media of low dielectric constant (€=r;j), high dielectric constant (t=4rij) and infinite dielectric constant
4.16 Strain energies of metal complexes of poly(oxyethylene) in benzene (low polarity medj’-’ij € = r|j)
4.17 Strain energies of metal complexes of poly(oxyethylene) in nitrobenzene (high polarity medium? < = 4r;j)
5.1 Extraction of aurocyanide and sodium ions from aqueous solutions by polymeric adsorbents
5.2 Extraction of sodium and hydroxide ions from sodium hydroxide solution by activated carbon at 25°C
5.3 Comparison between observed and calculated values for k* and the intercept forEquations (5.19) and (5.20)
5.4 Gold concentrations on the carbon after 16 hours elution for simulated electrolytic
xx

292
306
308
316
322
326
332
335
337
348
350
350
extractions of differing single-pass efficiency
5.5 Elution of gold by organic solvents at 25®C(after Nicol efc al251)
5.6 Effect of acid treatment on the elution rate
5.7 Elution of gold, silver and copper withsodium cyanide at 20eC (after Fleming and Nicol68)
6.1 Gold adsorption activities of synthetic and commercial activated carbons
6.2 Structural properties of synthetic and commercial activated carbons
6.3 Conductivities of synthetic and commercial activated carbons
6.4 Microcrystallite dimensions of synthetic and commercial activated carbons, from XRD peak data
6.5 Chemical characte sties of synthetic and commercial activated carbons
6.6 The effect of surface oxidation on the gold adsc rption activity of Le Carbone G210 activated carbon
6.7 Structural properties of oxidized Le Carbone G210 activated carbon
6.8 The effect of surface oxidation on the conductivity and microcrystallite dimensions of Le Carbone G210 activated carbon

£.9 The effect of surface oxidation on thechemical characteristics of Le Carbone G210 activated carbon 352
6.10 Extraction of aurocyanide by powdered polyrars, adsorbents and activated carbons under various conditions 356
6.11 Extraction of aurocyanide by polyxantheneand polyquinone under various conditions 363
6.12 Structural properties of powdered polymers, adsorbents and activated carbons 365
6.13 Conductivities of powdered polymers, adsorbents and activated carbons 366
6.14 Chemical characteristics of powdered polymers, adsorbents and activated carbons 367

List of Figures
1.1 Typical flowsheet of a CIP plant for the recovery of gold (after McDougall andFleming11)
1.2 Simplified schematic diagram of the mixed potential model for the dissolution of gold in cyanide solutions (after Nicol, efc al15)
1.3a Schematic representation of the structure of graphite. The circles denote the positions of carbon atoms, whereas the horizontal lines represent carbon-to-carbon bonds
1.3b Schematic representation of the structure c f activated carbon. Oxygen-containing organic functional groups are located at the edges >£ broken graphitic ring systems (afterMattson and Mark24)
1.4 Acidic functional groups postulated to be present on the surface of activated carbon (after Cookson26)
1.5 Basic functional groups postulated to be present on the surface of activated carbon(after Cookson26)
2.1 Decay scheme for the 197Pt isotope used as a source for 1,?Au Mossbauer spectroscopy
2.2 1*7Au Mossbauer spectra of representative

gold cyanide compounds 29
2.3 Correlation of isomer shifts and quadrupole splittings for gcld(l) and gold(III) compounds, for different chemical environments. Isomer shift values are relative to Au in Pt source. On y atoms bonded to gold are indicated. (After Cashionet al3 9) 31
2.4 Plot of IS and QS for 197Au Mossbauer spectra of MAuCl4 salts against cationicradius 32
2.5 Laboratory eluti m apparatus 42
2.5 Simulation of the Zadra process by dilution 44
2.7 Apparatus for the measurement ofconductivity of carbons 50
3.1 Effect of duration of acid pre-treatment on the efficiency of the elution of gold from activated carbon with a sodium hydroxide solution. (Conditions: 4 per cent (m/m)hydrochloric acid pre-treatment at 95°C followed by elution with 0,1 mol/1 sodium hydroxide at 90°C) 63
3.2 SEM micrographs of activated carbon surfaces after(a) acid pre-treatment for 6 hours (4 per
cent hydrochloric acid at 95°C), and(b) acid pre-treatment for 6 hours followed
by elution with sodium hydroxide(0,1 sol/1) at 90°C 65
3.3 SEM micrographs of activated carbon surfaces
xxiv
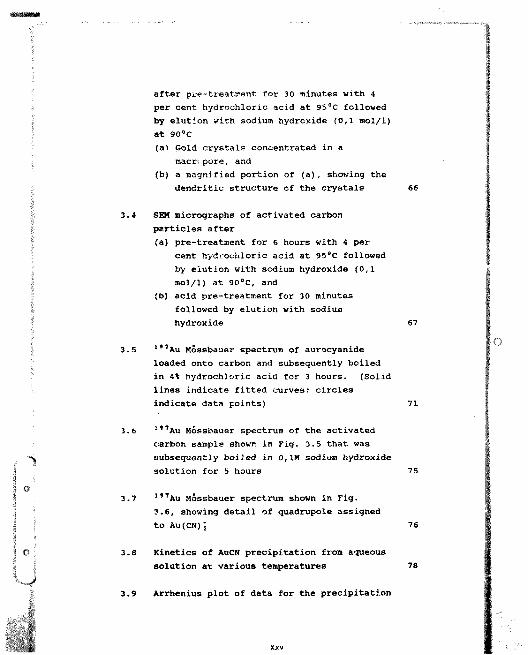
after pre-treatipent for 30 minutes with 4 per cent hydrochloric acid at 95°C followed by elution with sodium hydroxide (0,1 mol/1) at 90eC(a> Gold crystals concentrated in a
macr pore, and (b) a magnified portion of (a), showing the
dendritic structure of the crystals 66
3.4 SEM micrographs of activated carbon particles after(a) pre-treatment for 6 hours with 4 per
cent hydrochloric acid at 95*C followed by elution with sodium hydroxide (0,1 mol/1) at 90°C, and
(b) acid pre-treatment for 30 minutes followed by elution with sodiumhydroxide 67
3.5 |e?Au Mossbauer spectrum of aurocyanide loaded onto carbon and subsequently boiled in 4% hydrochloric acid for 3 hours. (Solid lines indicate fitted curves? circlesindicate data points) 71
3.6 l*1Au Mossbauer spectrum of the activated carbon sample shown in Fig. 3.5 that was subsequently boiled in 0,1M sodium hydroxide solution for 5 hours 75
3.7 i97Au Mossbauer spectrum shown in Fig.3.6, showing detail of quadrupole assignedto Au(CN)g 76
3.8 Kinetics of AuCN precipitation from aqueous solution at various temperatures 78
3.9 Arrhenius plot of data for the precipitation
xxv

of AuCN from aqueous solution 79
3.10 Ultraviolet spectra of aqueous solutions in contact with polymeric AuCN under various conditions 8 3
3.11 X-ray diffractograms of solid residues resulting from the contact of polymeric AuCN with aqueous solutions under various conditions. (Numbers on the 2 9 axisindicate peak position in degrees) 33
3.12 X-ray diffractograms of activated carbons loaded with aurocyanide .n the presence of 0 ,1M KC1, after heating at various temperatures 87
3.13 SEM micrograph of an activated carbon surface loaded with aurocyanide in the presence of 0,1M KC1, after heating at 340aC 89
3.14 SEM micrograph of an activated carbon surface loaded with aurocyanide in the presence of 0,1M KC1, after heating at 270°C 90
3.15 SEM micrograph of an activated carbon surface loaded with aurocyanide in thepresence of 0 ,1M KCl, after heating at 3OO0O 91
3.16 SEM micrograph of the activated carbon surface shown in fig. 3.15, showing the distribution of gold particles 92
3.17 X-ray diffractograms of activated carbons loaded with aurocyanide in the presence of 0,1M HCl, after heating at various temperatures 94

3.18 197Au KossXauer spectra of activated carbon loaded with aurocyanide in the presence of Q,?.M XC1, and f isequentlyheated to various temperatuies 95
3.19 Expanded view of ls?Au Mossbauer spectra shown in Fig. 3.18, showing detail of peaksdue to minor species 96
3.20 Effects of oxygen and nitrogen bubbling on the adsorption of aurocyanide onto activated carbon from solution containing no additives (Carbon mass l,0g; solution volume 250 ml; initial gold concentration in solution300 mg/1) 101
3.21 Effects of oxygen and nitrogen bubbling on the adsorption of aurocyanide onto activated carbon from 0,1M KCl solution. (Carbon mass l,0g; solution volume 250 ml; initial goldconcentration in solution 300 mg/1) 102
3.22 Effects of oxygen ari nitrogen bubbling on the adsorption of aurocyanide onto activated carbon from 0,1M KOH solution. (Carbon mass l,0g? solution volume 250 ml; initial goldconcentration in solution 300 mg/1) 103
3.23 Effects of oxygen and nitrogen bubbling on the adsorption of aurocyanide onto activated carbon from 0,1M HCl solution. (Carbon mass l,0g; solution volume 250 ml; initial goldconcentration in solution 300 mg/1) 104
3.24 Au(4f) photoelectron spectrum of gold species on activated carbon contacted with a solution of AuCi; ina) 1,OH HCl
xxvli
b) aqua regia 125
3.25 Au(4f) photoelactron spectrum of HAuC14 salt in physical contact with activated carbon 127
3.26 C(ls) photoelectron spectra ofa) n2X0 activated carbon,b) activated carbon contacted with a
solution of AuCi; in 1 ,0M HCl, andc) activated carbon in physical contact with
HAUC1, salt 129
3.27 0(ls) photoelectron spectri ofa) 6210 activated carbonb) activated carbon contacted with a
solution of AUCI4 in l,0M HCl, andc) activated carbon in physical contact with
HAuCl4 salt 130
3.28 Infrared spectra showing the CN stretch bands of KAu (CN) 2 on activated carbon at various concentrations. (Drying conditions:25°C, in vacuo) 132
3.29 Infrared spectra showing the CN stretchbands of CsAu(CN)? on activated carbonafter drying under various conditions.(18,9 per cent Au on carbon) 137
3.30 Infrared spectra showing the CN stretchbands of CsAu(CN) t on activated carbon atvarious concentrations.a) Dried at 25°C, in vacuo 138b) Dried at 120°C 139
O ;3.31 Infrared spectra showing the CN stretch
i bands of LiAu(CN)l on activated carbonafter drying with various conditions.
o
xxvili

(19,7 per cent Au on carbon) 140
3.33
3.34
3.35
3.36
3.37
3.38
Infrared spectrum showing the CN stretch bands of LlAu(CN), on activated carbon at various concentrations. (Drying conditions:25°C, in vacuo) 141
Infrared spectra showing the C?f stretch bands of LiAu(CN) 2 in methyl ethyl ketone at various concentrations 143
Infrared spectra showing the CN stretch bands of Ca[Au(CN) 2]2 on activated carbon after drying under various conditions.(21,3 per cent Au on carbon) 144
197Au Mossbauer spectrum of activated carbon loaded from Au(CN)5 solutioncontaining 0,1M KCl 151
197Au Mossbauer spectrum of activated carbon loaded from Au(CN); solutioncontaining 0,1M HCl 152
197Au Mossbauer spectrum of activated carbon loaded from Au(CN)J solution and subsequently boiled in 4% hydrochloric acid for four hours 153
Infrared spectra showing r(CN) for silver cyanide species adsorbed on activated carbons from 0,1M KCl solution after various drying treatments 158
Effect of cyanide concentration on theext.action efficiency of activated carbonfor silver 161
xxix

3.40 Distribution of silver species in cyanide solution with increasing total cyanide concentration. (pH - 11; unadjusted) 162
3.41 SEM micrograph of an activated carbon surface loaded with argentocyanide and subsequently boiled in 4% HCl for 5 h.(520k magnification) 165
3.42 SEM micrograph of the activated carbon surface in Fig. 3.41, subsequently boiledin 0,1 M NaOH for 5 h. <520x magnification) 167
3.43 SEM micrograph of a magnified portion of the activated carbon surface shown in Fig. 3.42, showing the agglomerated structure of asilver particle 168
3.44 Micrographs showing Ag metal (white) and AgCl precipitate (grey) adsorbed from AgN03 solution onto activated carbon 170
3.45 Micrographs showing fine detail of Ag metal (white) and AgCl precipitate (grey) adsorbed from AgN03 solution onto activated carbon.(a) fine structure within a macropore(b) fine structure of Ag metal filling pores 171
3.46 Effect of cyanide concentration on the extraction of mercury by activated carbon 175
3.47 Distribution of mercury species in aqueous so' ‘-ion with increasing cyanideconcentration 176
3.48 Infrared spectra showing r(CN) for mercuric cyanide species adsorbed on activated carbons from solutions of varying
xxx

stoich<ometry:
*3.49 Scanning•electron wlprograph of the surface
of aotiv#**do#*k«n coot acted with HgCl, oolutloa (540% mmgmifiomtion)
3.50 fUorogMphm ehnwln# tb# reduction of Auci; to a* metal opitW#mrticle edge ofactivatei carbon ^
#3.51 m&eahauer epegtrua of Auci;
adsorbed onto activated carbon from aqueous HAuCl, solution. (After Cashion et al3’)
3.52 ‘" A u Mossbauer speotrum of Auci; adsorbed onto activated carbon from aqua regia
4.1 Potentiometric titration of r a u (CH), with NaOH
4.2 Species distribution diagram for acidified aurocyanide solutions
4.3 Species distribution diagram for potassium and sodium aurocyanide with variation in cation concentration
4.4 Infrared spectre showing the CN stretch bands of LiAu(CN), in IHF at various concentrations
4.5 Infrared spectra spoiling the CN stretch bands of LiAu(CN), Ip MEK at various oonoentretloms 210

4.6 Infrared spectra showing the CN stretch bands of NBu4Au(CN)2 in THF at various concentrations
4.7 Infrared spectra showing the CN stretch bands of NBu4 *u (CN)2 in MEK at various concentrations
4.8 Infrared spectra showing the effect of water on the CN stretch bands of LiAu(CN), and NBu 4Au (CN)2 in THF
4.9 Infrared spectra showing the effect of water on the CN stretch bands of LiAu(CN)2 and NBu4Au(CN) 2 in MEK
4.10 Total gold concentration in the organic phase versus that in the aqueous phase for the distribution of KAu(CN)% between TBP and 0,1 M KCl solution
4.11 Total gold concentration in the organic phase versus that in the aqueous phase for the distribution of KAu(CN)2 between 1-pentanol and 0,1 M KCl solution
4.12 Total gold concentration in the organic phase versus that in the aqueous phase for the distribution of HAu(C>i)2 between 1-pentanol and 0,1 M HCl solution
4.13 Effect of water content of solvent on K* for KAu{CN)2 in water-saturated solvents
4.14 Effect of water content of solvent on K%%* for the distribution of KAu(CN)2 between various solvents and 0,1 M KCl solution
213
214
215
216
218
220
222
225
226

4.15 Effect of water content of solvent on k J®b for the distribution of KAu(CN)2 between various solvents and 0,1 M KCl solution 227
4.16 Effect of water content of solvent on for the distribution of KAu(CN)2 between various solvents and 0,1 M KCl solution 228
4.17 Plot of log Kr versus log t for KAu(CN)3 in water-saturated solvents. (Solid line is the theoretical Bjerrum relation (4.8) for 1:1 salts, after Bockris and Reddy11) 231
4.18 Total gold concenti cion in the organic phase versus that in the aqueous phase for the distribution of KAu(CN)2 oetween 1-pentanol/benzene mixtures (molar ratio1:1) and 0,1 M KCl solution 235
4.19 Total gold concentration in the organic phase versus that in the aqueous phase for the distribution of KAu(CH)2 between 1-pentanol/cyclohexane mixtures (molar ratio 1:1) and 0,1 M KCl solution 236
4.20 Effect of cationic radius on forthe distribution of MAu(CN)2 between various solvents and 0,1 M MCI solution 239
4 21 Effect of cationic radius or. K%%* forthe distribution of MAu(CN)8 between various solvents and 0,1 M MCI solution 240
4.22 Effect of cationic radius on xj{ forthe distribution of MAu(CN)2 between various solvents and 0,1 M MCI solution 241
xxxlii

4 . 2 4
4.25
4.26
4.27
4.28
4.29
4.30
Effect of cationic radius on Ke for MAu(CN)2 in various water-saturated solvents 242
Effect of water content of solvent on the distribution and association constants for HAu (CN)2 between various solvents and 0,1 MHCl solution 247
Effect of water content of solvent on the distribution and association constants for LiAu(CN)2 between various solvents and 0,1 M LiCl solution 248
Effect of water content of solvent on the distribution and association constants for CsAu(CN)2 between various solvents and 0,1 M CsCl solution 249
Effect of water content of solvent on the distribution and association constants for NEt4Au(CN) 2 between various solvents and 0,1 M NEt4Cl solution 250
Effect of concentration of potassium chloride on the extraction of M*Au(CN)5 ion pairs by solvents, polyethers and ion-exchangers 256
Minimum-energy structures ofCH3 (CH2OCH5):zCH3 and its Cs* complex.Dark atoms represent oxygen, light atomsrepresent carbon, and shaded atomsrepresent metals 260
Minimum-energy structures of the alkali- metal complexes of CH3 (CH2OCH2) i ahigh-dielectric environment. Dark atoms represent oxygen, light atoms represent
xxxiv

carbon, and shaded atoms represent metals 265
Extraction of sodium ions by activated carbon at 25eC in the presence of cyanide or hydroxide ions
Equilibrium isotherm for the distribution of aurocyanide between activated carbon and a solution containing 0,2M NaOH and 0,2M NaCN at 35°C
Rate of elution of gold from activated carbon at 95°C
Variation of the rate of elution with the mass of carbon and flowrate of the eluant
Rate of elution of gold from activated carbon by the AARL procedure
Effect of aurocyanide concentration in the eluant feed, on the rate of elution at 956C
Plot of mg gold eluted against time, for elutions with various constant aurocyanide concentrations in the eluant feed
Elution of aurocyanide from a 5ml carbon bed by the Zadra method, with a single-pass extraction efficiency of 0,42.(The solid line refers to the theoretical concentration profile calculated using Equations (5.20) to (5.22))a) Plot of gold concentration on the carbon
against timeb) Plot of gold concentration in the eluate
solution against time 294
280
283
284
285
287

295
297
299
300
302
304
305
310
312
Elution of aurocyanide from a 25m 1 carbon column with no pre-equilibration prior to elution. (The solid line n.fers to the theoretical concentration profile calculated according to the model)
Elution of aurocyanide from a 25 ml carbon column equilibrated with eluant solution prior to elution. (The solid line refers to the profile calculated according to themodel)
Elution of aurocyanide from a 5ml carbon column pre-equi1ibrated with eluant solution at various flowrates
Variation of the rate of elution with temperature
The effect of the ionic strength of the eluant on the rate of elutior at 956C
The effects of the concentration of cyanide or hydroxide on the rate of elution at 956C
Variation of the rate of elution with eluant concentration at a constant ionic strengthof 1,2 mol/kg at 956C
Effect of cyanide decomposition on the elution of aurocyanide from activated carbon at 956C in a batch reactor
Effect of cyanide concentration on the rate of elution at 95*C, in the presence of 0,2M NaOH
Distribution of copper species at pH 10 with

314
315
321
323
324
325
329
331
333
339
340
343
variation in cyanide concentration
Distribution of copper species at pH 7 with variation in cyanide concentraLion
Effect of pyrolysis temperature of S-761 polymeric adsorbent on aurocyanide capacity (after Adams et al*2)
Effect of pyrolysis temperature of S-761 polymeric adsorbent on skeletal density
Effect of pyrolysis temperature of S-761 polymeric adsorbent on micropore volume
Effect of pyrolysis temperature of 6-761 polymeric adsorbent on pore size distribution
Effect of pyrolysis temperature of S-761 polymeric adsorbent on surface area
Effect of pyrolysis temperature of S-761 polymeric adsorbent on conductivity
X-ray diffractogram of a typical activated carbon (Le Carbone G210)
Effect of pyrolysis temperature of S-761 polymeric adsorbent on reduction potential
Variation of measured reduction potential for R03515 activated carbon with time
Effect of pyrolysis temperature of S-761 polymeric adsorbent on phenol activity
Infrared spectra of pyrolysis products of
xxxvii

S-761 polymeric adsorbent after activation at different temperatures
6.12 Infrared spectra of commercial activated carbons studied
6.13 Infrared spectra of Le Carbone G210 activated carbon after different oxidation treatments:(a) None(b) Boiled in 1M Naocl, ih(c) Boiled in 1M HN03, ih(d) Boiled in 1:1 HN03:H2S0e, 2h(e) Soaked in 20% Ha02 for I week at 2f°C
6.14 X-ray diffractograms of grapnite before and after contact with an aurocyanide solution containing 0,1M HCl
6.15 Infra \ spectrum of graphite after contact with ar, aurocyanide solution containing0,1M HCl
6.16 Scanning electron micrograph of graphite after contact with an aurocyanide solution containing 0,1M HCl
6.17 Infrared spectrum of polyxanthene product(a) untreated(b) after contact with a 0,1M HCl solution
for 24 hours(c) after contact with a 0,1M NaOH solution
for 24 hours(d) after contact with a 0,1M NaCN solution
for 24 hours
6.18 Infrared spectrum of polycuinone product(a) untreated
xxxviii
o

(b) after contact with a 0,114 HCl solution for 24 hours
(c) after contact with a 0,1M NaOH solution for 24 hours
(d) after contact with a 0,1M NaCN solution for 24 hours 372
MX Is

CHAPTER 1 INTRODUCTION
The carbon-in-pulp (CIP) process for extraction of gold from cyanide leach liquors, which has undergone widespread application in recent years1 # 2, is generally the preferred method for recovery of gold in all new gold plants. However, many aspects of the chemistry involved at various stages of the process remain poorly understood. Even the mechanism of adsorption of the gold species onto activated carbon, the key step in the process, is not fully understood. The aim of this Thesis is to resolve these questions through a fundamental study of these unknown areas.
1.1 The Adsorption of Aurocyanide onto Activated Carbon - An Historical Perspective
Carbon has been used as an adrorbent throughout history, with the ancient Hindus using it for water purification2. Several centuries ago, it was used extensively in the removal of colours from solutions and for adsorption of gases. It was not until 1847 that its adsorptive properties fcr gold were first discovered3. In 1880, Davis4 patented a procsss for recovery of gold from chlorination leach liquors ueing wood charcoal.
Several years later, in 1890, MacArthur and the Forrest brothers discovered cyanide to be a good lixiviant for gold5, and soon thereafter, Johnson* in 1894 patented the use of wood charcoal for the recovery of gold from cyanide, solutions. Cya.'idation eventually became the standard technique for leaching gold, which was subsequently recovered by cementation onto zinc. This remained the

process of choice until the 1970's.
During this lengthy period, carbon was never used extensively for gold recovery, except for a brief period7 at the Yuanmi Mine, Australia, in 1917. The unpopularity of the process during these years is partly due to the poor adsorptive properties cf charcoals produced in those days, as compared with the properties of modern activated carbons. Another factor w»s lack of a suitable method for the elution of gold from the activated carbon after adsorption.
A viable elution process was developed by Zadra8 in 1952, that paved the way for the first large-scale implementation1 of carbon-in-pulp (CIP) , at the Homestake Mine, U.S.A., in 197: .
Carbon-in-pulp for gold recovery has greatly increased since that time, aided by the advances made1'10 by Mintek (Council for Mineral Technology) in engineering aspects of the process. Activated carbon has been used for several years for recovery of gold from clear solutions; however, the simplicity of CIP, in which carbon granules are added directly to the cyanided pulp and recovered by screening, has been the most popular new process over the last decade11.
CIP epitomises the type of innovative technology used in the extractive metallurgy of gold, evidenced by current variations on the conventional process, such as carbon-in leach11 (CIL), carbon-in-pulp-in-column12 (CIPIC), and other innovations, such as heap leaching1 and resin-in- pulp13'14 (RIP). Engineering and technological aspects of carbon adsorption processes for gold recovery have been successfully developed and, for the most part, commercialized. However, after a hundred years of development, the fundamental chemistry involved in many aspects of the process, remains largely unknown.
2
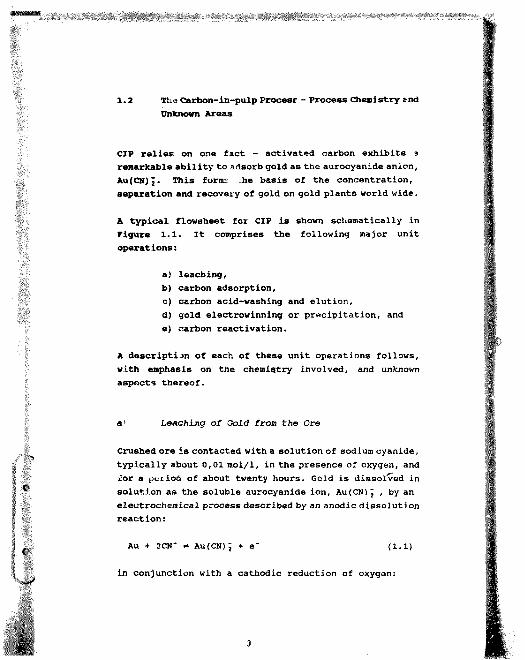
1.2 The Carbon-in-pulp Procesr - Process Chemistry and Unknown Areas
CIP relies on one fact - activated carbon exhibits a remarkable ability to adsorb gold as the aurocyanide anion.Au(CN): This forms he basis of the concentration,separation and recovery of gold on gold plants world wide.
A typical flowsheet for CIP is shown schematically in Figure 1.1. It comprises the following major unit operations:
a) leaching,b) carbon adsorption,c) carbon acid-washing and elution,d) gold electrowinning or precipitation, ande) carbon reactivation.
A description of each of these unit operations follows, with emphasis on the chemistry involved, and unknown aspects thereof.
a* Leaching of Gold from the Ore
Crushed ore is contacted with a solution of sodium cyanide, typically about 0,01 mol/1, in the presence of oxygen, and for a period of about twenty hours. Gold is dissolved in solution as the soluble aurocyanide ion, Au(CN)j , by an electrochemical process described by an anodic dissolution reaction:
Au + 2CN“ * Au(CN) 2 + e (l.l)
in conjunction with a cathodic reduction of oxygen:
3

Ore
Air Cyanide
{ " Leaching
Adsorption
CarbonC arbon
Loadedcarbon
Carbon
Carbon
Tailings to waste
CyanideCaustic
Elution j-
Carbon Eluate
Barrensolution
Fiectrowinning
-j ~ Screening j Gold and silver
Screening
Screening
A dsorption
Screening
Reactivation
torefinery
Fig. 1.1 Typical flowsheet of a CIP plant for the recovery of gold (after McDougall and Fleming21)
4

02 + 2H20 + 4e" * 40H' (1.2)
These reactions result in a "mixed potential", EB, at which leaching will occur, this is illustrated schematically in Figure 1.2.
Overall features of t 2 reactions involved here are well established15. However, certain details of the reaction mechanisms are uncertain, and the reaction rate can be slowed considerably by a diverse range of factors:
(i) In some instances, this slowing of the leaching rate can be directly attributed to the depletion of cyanide and oxygen in the pulp, due to reaction with various constituents of the pulp.
(ii) Carbonaceous material present in the pulp has been found to adsorb aurocyanide ions. This effect can be eradica id by oxidation with nitric acid16 or chlorine17'18; however, the reason for this effect is not yet clear.
(iii) It is generally accepted that dissolution of gold in cyanide solution occurs via the formation of an adsorbed AuCN species:
Au + CN"* = AuCNa 8 + e" (1.3)
AUCN,4,, t CN" * AU(CN); (1.4)
A passivating layer of AuCN has been found by several workers15 to occur at a potential of about -0,4 V, depending on the presence of heavy metal impurities in the solution. Passivation is not normally observed in practice? however, when sulphides are present, it has been postulated to occur. Ulm e r 19 suggests this to be due to an AuCN layer (Equations 1.3 and 1.4) . Fink and Putnam20 ascribe it to an Au 2S layer. The possibility also exists that sulphide
5

CurrentAu + 2CN" ^ Au ICN) - + e-
Anodic
Cathodic20H
Potential
Fig. 1.2 simplified schema ic diagram of the mixed potential model for the dissolution of gold in cyanide solutions (after Nicol, et al15)
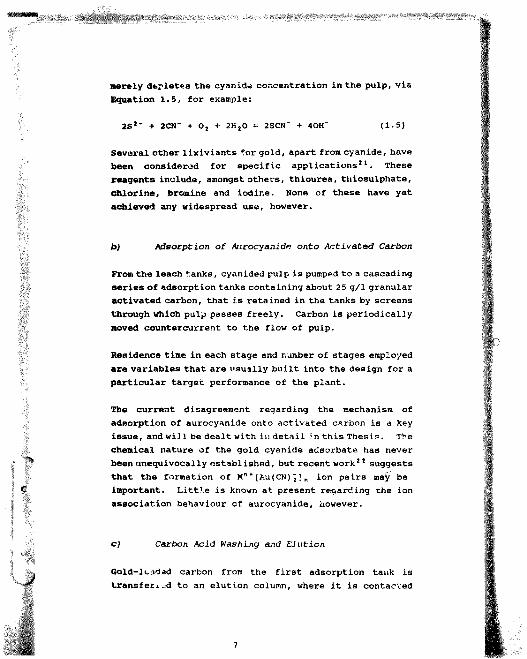
merely depletes the cyanide concentration in the pulp, via Equation 1.5, for example:
2S*- 4- 2CN" + 0 2 + 2H20 * 2SCN" + 40H" (1.5)
Several other lixiviants for gold, apart from cyanide, have been considered for specific applications21. These reagents include, amongst others, thiourea, thiosulphate, chlorine, bromine and iodine. Hone of these have yet achieved any widespread use, however.
to) Adsorption of Aiirocyanidp onto Activated Carbon
From the leach tanks, cyanided pulp is pumped to a cascading series of adsorption tanks containing about 25 g/1 granular activated carbon, that is retained in the tanks by screens through which pulp passes freely. Carbon is periodically moved countercurrent to the flow of pulp.
Residence time in each stage and number of stages employed are variables that are usually built into the design for a particular target performance of the plant.
The current disagreement regarding the mechanism of adsorption of aurocyanide onto activated carbon is a key issue, and will be dealt with in detail in this Thesis. The chemical nature of the gold cyanide adsorbate has never been unequivocally established, but recent work2 2 suggests that the formation of Mn +[Mi(CN) 2 ] n ion pairs may be important. Little is known at present regarding the ion association behaviour of aurocyanide, however.
c) Carbon Acid Washing and Elution
Gold-leadad carbon from the first adsorption tank is transferred to an elution column, where it is contacted
7

1
with a strong caustic cyanide eluant solution of variable composition, depending on the elution procedure employed. The temperature is also dependent on this factor, but in general, high temperatures (> 90°C) are employed. Prior to elution, loaded carbon is often contacted with a hot acid solution (c. 10% (m/m) HCl) to remove precipitated CaC03, fines and slimes from the carbon pores. The chemistry of the elution process has never been addressed in any detail, and no elution mechanism has yet been postulated that can satisfactorily account for all observed facts. Moreover, elution of gold from activated carbon by sodium sulphide solution has been demonstrated2 3 to be potentially efficient at room temperature, but a fundamental understanding of this procedure has yet to be reached.
d) Gold Electrovinning or Precipitation
Gold recovery from pregnant eluate solution can be achieved by electrowinning, either in a single-pass of eluate through the cell, or in a continuous circuit with the elution column. Alternative /, the gold can be recovered by zinc cementation. Both of these are well established procedures. The chemistry is well known; for example, the cementation of gold onto zinc proceeds via reactions (1.6) and (1.7):
Au (CN) j
Zn + 4CM"
= Au + 2 o r
Zn(CN)j
(1 6)
(1-7)
Carbon Reactivation
In practice, it has been found that activated carbon returning to the c.dsorption circuit after elution is a poorer adsorbent for gold than the fresh carbon. The reason for this is the poisoning of the carbon by various
8

organic compounds present in the pulp. Humates, fulvates, hydrocarbons and many other organic compounds exhibit strong adsorption onto activated carbon2 4, thereby blocking sites for gold adsorption.
This poisoning has necessitated a thermal reactivation treatment of the carbon when necessary, before being returned to the adsorption circuit. Typically, the carbon is heated to about 750®C in the presence of steam for half an hour, but once again, whe parameters used seem to vary depending on the whims of the individual operator. This treatment essentially involves vaporization of volatile adsorbates and burn-off of non-volatile adsorbates.
f) Other Features of the CIP Process
Apart from the aspects of the unit operations discussed above, there are various other features of CIP of which little is known regarding the fundamental chemistry involved. These include, amongst others, the chemistry of the decomposition of cyanide throughout the CIP flowsheet, the effect of hot acid treatment on the loaded carbon, and the mechanisms of adsorption of other complexes onto activated carbon, either present in the leach pulp, or useful for elucidation of the aurocyanide adsorption mechanism. The influence of activated carbon surface chemistry and structure on the process is another important aspect. The rurface chemistry of activated carbon is complex24 - even the identities of the surface functional groups are uncertain.
The current commercial success of the carbon-in-pulp process is largely due to decreased capital and operating costs. The improved efficiency of gold recovery by CIP over the zinc precipitation process is most marked when treating calcines and other materials that are difficult to filter. Carbon-in-pulp is by no means the ideal process.
9

however - the harsh conditions and relatively long times required to elute the gold from the carbon, the need for high-temperature thermal regeneration and the fouling of activated carbon by organic and inorganic materials in the pulp, are some of the more practical factors that could be drastically improved upon.
1.3 The structure and Chemistry of Activated Carbon
Activated carbon is a generic term that encompasses a family of highly porous, amorphous carbonaceous materials, none of which can be characterized by a structural formula or chemical analysis25. Modern activated carbons are far superior in terms of abrasion resistance and adsorption activities, as compared with the wood charcoals used in the past. They are used for the adsorption of a range of compounds2*'2*'22, both organic and inorganic, gaseous and in solution. Activated carbons also have numerous applications as vutalyst supports28.
a) Physical Structure of Activated Carbon
The single structural factor that results in the adsorptive properties of activated carbon is the extensive pore structure. Most commercial activated carbons have specific surface areas of about 800 to 1200 m 2/g, which is predominantly contained with? n micropores less than 2 nra in diameter. The material contains a complex pore networx that is normally categorized as follows:
macropores : 30 < Dp < 10 000 nmmesopores : 2 < Dp < 30 nramicropores : Dp < 2 nra,
where Dp is the pore diameter.
10

The pore size distribution depends on the type of raw material and the conditions of manufacture. Activated carbons can be made from virtually any carbonaceous material, such as coconut shells, peach pits, bituminous coals and peat. The raw material is first carbonized at a temperature not exceeding 700°c, and this charring process is followed by activation at temperatures between 800 and 110l °C in the presence of suitable oxidizing gases, such as steam, air or carbon dioxide. The activation process is responsible for creating the pore structure, by virtue of burn-off of more reactive components of th* char. The material also acquires a disordered structure of graphitic platelets known as microcrystallites, shown schematically in Figure 1.3. Also shown is the structure of pure graphite.
b) Chemical Structure of Activated Carbon
The edges Df the microcrystallites formed during the activation process contain unfilled carbon valencies, that react with the oxidizing gas to form a wide variety of oxygen-containirg functional groups. The basal plane of the microcrystallite is relatively inert, so the surface of activated carbon is heterogeneous in nature, with both hydrophilic and hydrophobic domains. This property explains the wide variety of compounds that are strongly adsorbed onto activated carbon.
Activated carbons used for gold recovery are generally prepared by the high-temperature process outlined above. Such carbons are basic in character, by virtue of their ability to strongly adsorb acids, and are popularly classified2f as H-carbons. Carbons prepared under low temperature conditions are acidic in character, and are classified as L-carbons. These acid-base properties of activated carbons result from the preponderance of functional groups of either acidic or basic character on

SFig. 1.3a Schematic representation of the structure of
graphite. The circles denote the positions of carbon atoms, whereas the horizontal lines represent carbon-to-carbon bonds
o--
,o~
o-
Fig. 1.3b Schematic representation of the structure of activated carbon. Oxygen-containing organic functional groups are locatad at the edges of broken graphitic ring systems (after Mattson and Mark2 4)
12

the surface. The fact that all carbons adsorb both acids and alkalis to some extent shows that both types of functional groups are normally present.
The precise identities of the functional groups present remain the topic of some debate, but ome of the most likely candidates are shown in Figures 1.4 and 1.5.
Activated carbons are known30 to be electrical conductors, and this property i s due to the relatively high degree of condensation of aromatic rings, resulting in an expensive delocalized electron cloud. Electron Spin Resonance (BSR) studies31 indicate the presence of free radicals. Thc.se properties, together with the presence of functional groups that can undergo electrochemical reactions, such as quinones, impart a reduction potential to the activated carbon. Different carbons art found32 to exhibit a range of different reduction potentials, betv. en +0,06 V and +0,40 V (relative to the Standard Hydrogen Electrode). Hence, activated carbon exhibits both electrochemical and catalytic properties. For example? it can readily effect reduction of AuCl% and Ag+ to the respective metal:;, and can also act as an oxidation catalyst for Fe2 * to Fe3*.
t The Chemistry of Gold - An Introduction
The key to the natural occurrence of gold in the metallic form, as well as its many practical uses in jewellery and in industry, is its nobility. It is the only metal that does not corrode in air in the presence o£ either oxygen orsulphur.
The aqueous chemistry of gold is of great importance co the extractive metallurgist, and an introduction to this is useful in this Thesis. The important oxidation states are the aurous (+1) and the auric (+3) . The free uncomplexed ions are thermodyn tically unstable in aqueous solution.
13

Carboxylic group Phenolic hydroxyl group
Quinone-type carbonyl group Normal lactone group
Fluorescein-type lactone group Carboxyl 1c acid anhydride group
Cyclic peroxide group
Fig. 1.4 Acidic functional groups postulated to be present on the surface of activated carbon (after Cookson26)

Chromene Renzopyrylium ion (Carbonium ion)
C O - “ o > - - a > -Benzopyr/Hum derivatives
0 --"-Pyrone-llke structures.
Fig. 1.5 Basic functional groups postulated to be present on the surface of activated carbon (after Cookson26)
15

and are reduced by water to metallic gold. There are several ligands that form stable complexes with gold, and a few of those of importance in gold metallurgy have already been mentioned. Table 1.1 lists the revelant stability constants of these complexes.
Table l.lStability Constants* for a Selection of Complexes of
Gold(I) and Gold(III)
Gold(I) Gold(III)
Complex 8 , Complex 64
Au (CN); 2 x lo3e Au(CN)4 10''Au(S 2O3 )|~ 5 X 10!8 a u i ; 5 X lO”Au(CS(NH2)3)2 2 x 1 0” Atl(SCN); 10*'A u I 2 4 x 1 0” AuBr,' 103 !a u (s c n ); 1 ,3 X 1C17 AUCI; 1 0,eAuBr; 1 0iaa u c i ; 1 0*
*Values are taken from Nicol, et al15.
Gold(I) complexes have the 4fl45d10 electronic configuration and are diamagnetic. The preferred coordination number of gold(I) is two, forming linear complexes. Vary stable complexes are formed33 with scft ligands', such as cyarfde (AufCN)^ -* 8; = 2xl038) 5- In Cwxoride solution, where a hard ligand is involved, the AuCl 2 species is somewhat unstable, tending to disproportionate according to the following reaction:
3AuCl g * AuCi; 4- 2Au° + 2 01" (1.8)
Gold(III) complexes have the 4fI45d8 electronic configuration, and are also diamagnetic. In this case.

more stable complexes are formed with hard ligands, -such as chloride (AuCl^ ; S4 - 1026)E. The preferredcoordination number for gold(III) is four, with squar? planar complexes usually being formed.
Other aspects of the cbenistry of gold, both well known and novel, will be discussed later in this Thesis. It will be shown how these features of the chemistry of gold are important in determining its extractive metallurgical characteristics, and in particular the remarkable selectivity of activated carbon for the adsorption of Au(CN) 2 over other metal cyanide anions.
1.5 Current Processes for the Recovery of Gold
In the past, gold has been collected from placer (surface) deposits by gravity techniques, due to its high specific gravity, sometimes aided by mercury amalgamation. Such processing techniques are relatively unimportant today - ii the United States in 1986, 94% of the 3,733 million ounces of gold produced was processed by cyanidation34.
The two most prevalent gold processes in use today are carbon-in-pulp and zinc cementation, and both of these have been discussed earlier in this chapter. GIF processes are the most popular on all new gold plants; hence the importance of a fundamental study of tha processes involved.
There are alternative configurations to the typical CIP process. Carbon-in-leach (CIL) and carbon-in-solution (CIS) are two versions that find many applications. The former involves the placing of carbon in the leach tanks to instil more efficient leaching, and this variation is most appropriate when the pulp contains carbonaceous ("preg- robbing") materials that also have an affinity for gold adsorption. The latter version involves passing a
17

clarified leach liquor through a /.ad or column of carbon? this version is most appropriate when treating leach liquors from heap leach operations.
Heap leaching is without doubt the most obvious and simple way to deal with certain lean ores and wastes, and involves the percolation of cyanide solution through a large heap of ceea. Pregnant solution is allowed to run out from the bottom of the heap, and the gold is then recovered.
Oeaqpite the current popularity of the CIP process, there is auch room "or improvement, and the search is on for alternative configurations, such as the carhon-in-pulp- in-coluar. (CIPIC) configuration proposed by Mintek researcherF12, and the horizontal flow variation, proposed by Davy-McKee workers35.
The search is also on for alternative adsorbents to activated carbon. The use of convention; 1 anion-exchange resins in a res in-in-pulp (RIP) variation are reported36 to be employed in full-scale plants in the Soviet Union. The first reports13'14 of such an innovation being operated successfully in the western world have recently been made. It is evident that for certain applications, res in-in-pulp is more viable a process than carbon-in-pulp.
The relatively recent advent of carbon-in-pulp on a commercial scale is probably the single most important innovation in gold metallurgy since the introduction of cyanidation in 1890. It is the aim of this Thesis to address the many unknown areas still associated with this process, in particular the mechanism of adsorption of aurocyaride onto activated carbon.

CHAPTER 2 EXPERIMENTAL PROCEDURE
2.1 Reagents and Chemicals
KAu(CN)2 and KAg(CN)2 were supplied by Johnson Matthey (Pty) Limited, NaAu(CN)2 by Engelhard Chemical Division and AgN03 by Synthon Ltd. All other chemicals were of AR, CP or Spectroscopic grade, and all solutions were made up with de-ionized water. A13 solvents were washed repeatedly with de-ionized water before use.
Solutions of HAu(ON)2 were prepared by passing a 10 ml aliquot of concentrated KAu(CN) 2 solution slowly through a 25 ml column of Dowex 50W-S8 cation exchange resin in the acid form. To convert the resin into this form, 250 ml of 1,0 M HC1 solution was slowly passed thi eugh the column and subsequently washed with de-ionized water until the conductivity of the solution was less than 1,5 x 10⁻⁶ S/cm. The LiAu(CN)2 salt was prepared by passing a KAu(CN)2 solution through a Dowex 50W-S8 column in the Li* form, as above, and evaporating the resultant solution to dryness. The Li* form of the resin was achieved by reacting resin in the H+ form with 1,0 M LiOH solution and washing to neutrality. NBu4Au(CN)2 was prepared by adding a concentrated solution of KAu(CN)2 to one of NBu40fl (20% w/w, supplied by Merck), and washing the resultant precipitate well with de-ionized water.
The activated carbon used was Le Carbone G210, which was purified by continual washing with cola de-ionized water. Additional treatments are described lat<>r in the text. Le Carbone G210 was selected because it is used extensively in CIP plants world wide. It is a granular activated carbon
19

derived from coconut shells, with an average particle diameter of about 2 mm. The surface area as determined by the N, BET method is 1100 to 1200 B !/g.
The polymeric adsorbents S-763 and S-862 were supplied by Duolite. S-761 is a phenol-formaldehyde matrix , and S- 862 a polystyrene matrix. The polymeric adsorbent XAD-8, which comprises an acrylic ester matrix, was supplied by Rohm and Haas. These adsorbents have surface areas of about 450 m 2/g.
The soluble poly(oxyethylene) used in this study was the non-ionic surfactant Triton X-100, which has the structure
(CH,),CCH;C(CH,),- -0-(CH2CH20)ioh .
2.2 Activated Carbon Adsorption studies
a) Equilibrium Adsorption
For the experiments in section 3.2a, 1,0 g of carbon was equilibrated in a rolling bottle for 3 days with 400 ml of a solution containing 50 to 700 mg of gold, and 0,1 mol of hydrochloric acid or potassium chloride, per litre. Samples of the solution were analysed for gold by atomic- absorption spectrophotometry (AAS). The carbon was analysed for gold by X-ray fluorescence spectroscopy (XRFS) , for potassium, by AAS, and for nitrogen by a Heraeus elemental analyser, as well as a LZCO nitrogen analyser. The estimated error in all analyses is about 5 per cent.

b) Elution of the Carbon
Prior to some elutions 3 ,0 g of loaded carbon was washed in a rolling bottle with 250 ml of a hydrochloric acid solution (0,1 mol/1) for 24 hours. No gold was detected in the wash solution. In other instances, 1,0 g of loaded carbon was boiled under reflux in 250 ml of solution containing 4 per cent hydrochloric acid (by mass) for varying periods of time. No gold was detected in the pre-treatment solution. The carbon was subsequently washed to neutrality with deionized water.
The carbon was then eluted as follows: approximately 1 g of loaded carbon was placed in an insulated, jacketed column that was heated by hot (906C) water circulating through the jacket. A fresh solution of sodium hydroxide (0,1 mol/1) was siphoned slowly through the carbon bed until analysis of the eluate solution showed the gold content to be below 0,1 mg/1. The carbon was analysed for gold k>y XRFS before and after the elution.
Eluates from reveral of the elutions were analysed for Au(CN) 2 by UV spectrophotometry. Absorbances were measured at 239,5 nm on a Beckman Acta MIV Spectrophotometer, and were found to follow Beers law, thus yielding a standard curve.
c) Precipitation of AuCN
Fresh 250 ml solutions of KAu(CN) 2 containing 1000 mg gold per litre, in 0,1 mol/1 hydrochloric acid were placed in a magnetically-stirred , round-bottomed flask with water- cooled condenser, and heated to the relevant temperature using an oil bath. The solution was analysed periodically for gold by atomic-absorption spectroscopy.

d) Decomposition of AuCN
AuCN that was produced in the previous experiment was washed well with ethanol and water and dried under vacuum for twenty four hours. AuCN (0, 05 g) was placed either in a rolling bottle or under reflux as above, and contacted with 20 ml of de-ionized water adjusted with hydrochloric acid or sodium hydroxide to pH values in the range 1,0 to 13,0. Solutions were then analysed for gold by atomic absorption spectroscopy, and for cyaniae and cyanate by ion chromatography. The solution was further characterized by ultraviolet (UV) spectrophotometry on a Beckman Acta MIV spectrophotometer, and the solid residue by X-ray diffractometry (XRD) using a Philips PW1050 X-ray diffractometer,
e) Oxygen Effect Experiments
Typically, l,0g of carbon was contacted with 250ml of solution containing the appropriate additive. High purity gas (oxygen or nitrogen) was bubbled through the solution vigorously enough to achieve efficient mixing. For each experiment, the temperature was kept at a constant o,5 ± 0,016C by means of a Hetotherm PFS23 thermostat in conjunction with a Grant cooling unit, to minimize evaporation losses. Samples of solution were analysed for gold by atomic absorption spectrophotometry (AAS), and the pH value was measured using a Labion Model 15 pH/mV meter in conjunction with an Orion combinatibn pH electrode. Carbon was analysed for gold by X-ray fluorescence spectroscopy (XRFS), for nitrogen using a Heraeus elemental analyser as well as a LEGO nitrogen analyser, ard for chloride using silver nitrate turbidity. Solutions were analysed for NH{, HCOj and CNO" by ion chromatography.
22

f) Gold (1X1) Cyanide ScparLmnntm
KAu(CN) 4 war, prepared by the method of Smith, et al37. KAu(CN) . was dissolved ?.»i water and reacted with a slight, excess of t roaine, with m e excess being re!F jvea by heating to 80‘C. lae y.Vj.'Nj Pr, lit the resultant solution was then reacted wi’.H » stclchionetric pr;tasf»iu» cyanide solution, to yieii KAu(C*! ( in solution. In the adsorption experiments, 0,25 g of carbon was equilibrated in a rollinc battik for twnty hours vith 100ml of solution containing JOrag of gold pe: litre 'is Kftu(CH), cr KAu(CN) 2), as well as patassim, ch’o -idu calcium chloride or hydrochloric acid. Samples of solution and car ban vere analyzed for gold, potassitn and nitrogen as inscribed above. A carbon that; was loaded with KAu(CK) , wan also boiled in 250ml of 4't hydrochloric acid for four bourr;, washed to neutrality and dried xr. a vacuum desiccator, tor subsequent investigation.
gj Silver and Myrci.ry Sxperiients
Carbon (1,0 g) was equilibrated in a rolling bottle for 72 hours with 400 ml of a solution containing 31.0 ec of silver per litre (as KAg(CN) ,), *8 well as 0,1 mcl oi potassium chloride or hydrochloric acid per litre. In the case of mercury, the solution contained 700 ag of mercury per litre (as Hg(CN) j) either alone, or with the molar equivalent of Ca(CNj. The carbon was analysed for silver, mercury, potassium and nitrogen as described above. In a SeconI series of experiments, 0,25 g of carbon was equilibrated in a rolling bottle for 24 hours with 100 ml of a solution containing either 150 mg of silver or 300 mg of mercury, as well as 0 to 1,0 mol of potassium cyanide per litre. The ionic strength was kept at a constant 1,0 mol/kg, by addition of the required amounts of potassium chloride. Samples of solution were analysed for silver by atonic- abisorption spectrophotometry ( M S ) . Silver was also

loaded onto the carbon (0,25 g) from silver nitrate solution (0, 0255 M AgM03 , 20 ml) in a rolling bottle for 24 hours, and mercury from a 0,01 M HgCl, solution.
In the investigation of the effects of acid and base treatment, loaded carbon (0,5 g) was boiled under reflux in 250 ml of solution containing 4 per cent hydrochloric acid (by mass) for five hours. The carbon was subsequently washed to neutrality with deionized water. A portion of the carbon was then boiled in 250 ml of 0,1 M sodium hydroxide for a further five hours. The carbon was then &nalyF»d for silver and nitrogen as above.
h) Miscall aiieous Techniques
(1) X-ray diffractometry
X-ray diffractograms of loaded and treated carbons were obtained using Cu Ktt radiation, on a Philips PW1050/25 X- ray diffractometer.
(iV Scanning electron microscopy
Scanning electron micrographs of loaded and treated carbons were obtained using a Hitachi scanning electron microscope (3EM), as well as a Jeol 840A SEM.
(lii) Fourier Transform infrared Spectrophotometry
Samples of activated carbon for infrared spectrophotometry were prepared by contacting 0,5 g of carbon with 25 ml of solution containing typically 0,003 moles of gold as KAu (CN) % and 0,03 moles of either LiCl, KC1, CsCl or CaCl2 in a rolling bottle for 24 hours. In the cases of Ag and Hg

a similar procedure was followed.
Samples were crushed using a mortar and pestle prior to drying. Approximately 0,8 mg of dried carbon powder was mixed with 200 mg of dry KBr by shaking manually. The mixture was made into a disk by placing it under 10 tonnes of pressure for about 10 seconds.
Infrared spectra were obtained using a Perkin-Elmer 1725X Fourier Transform Infrared Spectrophotometer. For each spectrum, 200 scans were made in the transmission mode, at a resolution of 4 cm- 1. No mathematical smoothing functions were performed on the spectra; however the ordinate of each spectrum was normalized to facilitate comparisons between spectra. All spectra were baseline-flattened to enhance spectral detail.
(iv) 197Au Mossbauer spectroscopy
This technique is not commonly used, which necessitates a more detailed discussion of the underlying principles. It is cnly in the last ten years38 that sufficient development has been made in the field of 1 * 7Au Mossbauer spectroscopy to facilitate application of the technique to practical problems. The technique is a powerful one, providing information both on oxidation state and chemical environment of the gold atom, provided suitable reference data are available. Recent applications have been some preliminary work39,40 on the nature of the auroc^anide adsorbate on activated carbon, and a study of the chemical state of gold in gold ores41.
The principle of the Mossbauer effect ir? essentially similar to the adsorption of infrared radiation in infrared (IR) spectrophotometry; however in the case of Mo$$sbauer spectroscopy, 'V-rays are used. These ir-rays are emitted during an isomeric transition of a nucleus in a radioactive
25

source, and are subsequently absorbed by a nucleus of the same isotope, causing it to undergo a transition from its ground state to the respective excited state, and this phenomenon is called whe Mossbauer effect.
To observe a Mossbauer effect in I,7Au, the radioactive source used is l,7Pt, prepared from isotopically enriched l96Pt that has been irradiated with neutrons in a nuclear reactor. The decay scheme for the l97Pt isotope is shown in Figure 2.1. The relatively short half-life of 18 hours necessitates prompt measurement of the Mossbauer effect, which may take several days to yield a statistically useful result, depending on the gold concentration in the sample. Some measurements may thus require two or three sources in order to provide a reasonable spectrum. Figure 2.1 shows that 90 percent of the 1’7Pt decays to the 77,3 keV excited state of 197Au, which decays to the ground state with emission of Tf-radiation of energy 77,3 keV. When this radiation reaches the gold sample of interest in the absorber holder, some of the radiation is absorbed by 1 ’ 7Au atoms in the samp la undergoing the transition to the excited state, and measurement of the intensity of the radiation exiting from the absorber yields the percentage transmission, which has a similar meaning to that for IR spectrophotometry.
The resonant absorption of 7-radiation by l97Au nuclei can only take place if they do not lose energy due to recoil during emission or absorption, i.e. the atoms must be embedded in a solid matrix. Moreover, the recoil-free fraction, f, decreases with increasing o ^aa energy and with increasing temperature. The relati Jy high 77,3 keV gamma energy of 1 9 7Au makes it necessary to jool both source and absorber down to about 4 K in a liquid helium cryostat.
The 7-radiation produced is very monochromatic42, ?nd in order to provide a spectrum, a variation in frequency, and hence energy, of the radiation passing through the sample.
26

18 h
1,89
Fig. 2 .
^ P tT T -90% 10%
ns
1 D"cy mch«. for th. :"pt l.otop. uwd .# asource for 1’7au Mossbauer spectroscopy
27

must be produced. This is achieved via the Doppler effect. The source is given a velocity that results in a slight change in energy of the radiation:
Ey - E 4 (1 + v/cliy>, (2.1)
whure E| is the energy of incident radiation, is theenergy of 7-radiation from the stationary source, v is the applied velocity, and chr is the velocity of light. Only a small energy range is required for this application. The data are normally plotted in units of velocity.
Mossbauer spectra of gold compounds normally consist of a doublet, or quadrupole, as shown in Figure 2.2, which shows the Mossbauer spectra for the gold cyanide compounds AuCN, KAu(CN) 2 and KAu(CN)4. The quadrupole splitting, QS, which is the separation between the two absorption peaks of the doublat, is a measure of the asymmetry of distribution of electronic charge about the gold nucleus, intermetallic systems usually show zero or very small values of QS, due to the high symmetry of their structures. An example, that of metallic gold, is also shown in Figure 2 . 2 .
Another important parameter in a Mossbauer spectrum is the isomer shift, IS, the position of the centroid of the doublet. The isomer shift is a measure of total electron density at the gold nucleus. An increase in IS is also characteristic of an increase in covalency in bonds to neighbouring atoms. Metallic gold has the lowest electron density of the Au nuclei, and hence exhibits the lowest isomer shift of all known gold compounds and alloys, viz. - 1,23 mm/s.
A comparison between the Mossbauer fcpectra of different gold compounds in Figure 2.2 suggests that identification of unknown gold species is possiole, since the IS and QS parameters vary significantly from one gold species to the
28

Fig. 2
QM
096
0,95
KAutCN).
Q90
1.00
0,98
0,96I 04 0 04 0.8D opp ler v e lo c i ty , c m /s
•2 1,7Au Mossbauer spectra of representativegold cyanide compounds. (After Faltens and Shirley4 3)
29

next. Figure 2.3 shows a QS-IS correlation diagram compiled from the spectra of a number of gold(I) and gold(III) compounds. Only a minimal amount of overlap between the Mossbauer parameters of golti(I) and gold(IIl) species occurs.
Figure* 2.4 shows plots of IS and QS against the crystallographic cationic radius for a series of MAu C14 salts. The data were collected from the literature and are summarized in Table 2.1.
Table 2.1Mossbauer parameters for MAuCl4 salts
Salt ISmm/s QSmrn/s
Ref. r \ A* Ref.
HAuC14.4H20 1,87 0,94 42 0,30 45KAu C14 2,05 1,26 42 1,33 452,02 1,11 441,65 1,27 44KAuC14.Ha0 2,08 1,4 44NH4AUC14.XH20 2,07 1,7 44 1,48 45CsAuCl4 2,16 1, 37 44 1,69 45Bu4NAuCl4 2,23 1,31 42 3,72 46Ph4AsAuCl6 2,30 1,88 42 4,26 461 Crystallographic cationic radius
The decrease in IS with decreasing cationic radius is attributable to the fact that smaller cations are more polarizing, resulting in a decrease in electron density around the gold atom, and hence a decrease in IS value. The effect of QS is non-linear, probably because change in
O crystal structure from one compound to the next has a largerinfluence on the asymmetry of electron density, and hence QS, than does change in cation.
Finally, the intensity of the peak in the Mossbauer < spectrum is not only proportional to concentration, i.e.
the number of gold atoms present in the cross-sectional -V area of absorber, but is also proportional to the recoil-
30

10-1
(a).
-8
-a V‘5.-10
-12
- 2 -1 0 1 2 3 4 S 0 7Isomer Shift (mm.s’-1)
Fig. 2.3 Correlation of isomer shifts and quadrupole splittings for gold(l) and gold(IH) compounds, with gold in different chemical environments. Isomer shift values are
j relative to Au in Pt source. (After Cashionj O , et al3 9)
!

Fig. 2.4 Plot of IS and QS for l17Au Mossbauerspectra of MAuCl„ salts against cationic radius

free fraction, f, which was mentioned earlier. It is only from a knowledge of the value of f for the relevant species under the experimental conditions, that any quantitative data can be obtained. For example, the value47 of f (which is sometimes also called the Debye-Waller factor) for metallic gold is 0,19 , whereas that for crystalline KAu(CN)2 is 0,015.
Samples for Mossbauer spectroscopy were prepared by contacting 20g of carbon with 200 ml of solution containing typically 2000 mg of gold per litre, rolling in a bottle for twenty hours and washing with cold de-ionized water. One sample was subsequently boiled for twenty hours in 250 ml of hydrochloric acid solution containing 40% HC1 (mm) and washed with cold de-ionized water. Half of this carbon was then boiled in 250 ml of 0,3M NaOH solution for five hours, cooled and washed with cold deionized water. Both fractions were then dried in a vacuum desiccator over silica gel. All MoFxibauer spectra were deconvoluted at the Technische Univc ^itat Hunchen, using computer methods.
(v) X-ray photoelectron spectroscopy (XPS)
In this technique, the surface of the sample is irradiated with X-rays, and the energy distribution of the ejected electrons is measured. The common acronyms for the technique are ESCA (Electron Spectroscopy for Chemical Analysis) and XPS (X-ray Photoelectron Spectroscopy). Analysis of the resultant spectrum of electron counts against photoelectron kinetic energy, can provide useful information regarding chemical and electronic environment of elements in the material, i.e. valence state, binding energies of electrons, etc.
The kinetic energy of the photoelectron produced, Ep, is related to the energy of the incident photon, hr, and the binding energy of the electron in its particular shell, Eb,
A 33

by the equation
Ep * hr - Eb - Ev f (2.2,
where Evf is the work function, which is the surface potential that each escaping electron must overcome, and is an instrumental constant.
The photoelectron spectrum is characteristic of the material, since the energies of the electronic levels, and hence the binding energies of the electrons, Bb, are different for different atoms. A chemical shift in Eb for a given level in an atom is well known3 2. Difficulties in referencing these chemical shifts are discussed in section 3.2f.
XPS measurements are generally performed under ultra-high vacuum (UHV) conditions, to eliminate contamination from stray particles. Electrons are detected with an electronmultiplier.
The fact that XPS is a surface technique, combined with its usefulness in determining the valence state and electronic environment of species, make it a suitable choice for studies of adsorbent species, one drawback being the requirement for UHr which may result in the generation of artifacts.
Carbons for investigation were prepared by contacting 0, 5 g carbon with a 25 ml solution of KAu(CN) 2 containing <000 mg gold as well as 0,5 moles of either LiCl, NaCl or KC1 per litre. One 0, 5 g sample of carbon loaded with KAu(CN) 2 was boiled in 275 ml of 4 per cent hydrochloric acid for 24 hours. Samples of aurichloride-loaded carbons were produced by contacting 0, 5 g carbon with 60 ml of a solution of HAuCl4 containing 1000 mg of gold and 1 mole of HC1 per litre. One such carbon was loaded from a similar solution that also contained 30 ml of aqua regia.
34
Surface analysis was performed in a multitechnique Vacuum Generators "Solar 300" UHV chamber, which was fitted with a VG "ctAM 100* (Combined Lens Analyser Module) comprising XPS and AES facilities. The main chamber was kept at a base pressure of 5 x 10" 10 mbar with an Edwards £04 oil diffusion pump frunning on polyphenyl ether fluid) with a water cooled baffle fitted with a VG CCT150 liquid nitrogen cryostat and an Edwards EDM12 rotary backing--pump. The X- ray source made use ot magnesium Ka radiation. Samples for XPS wrre mounted as powders on double-sided sticky tape. Samples of pure compounds were mixed with powdered activated carbcn by physical shaking, and binding energies were referenced against the carbon (Is) peak in activated carbon, which was assigned as 284,4eV. Deconvolution of spectral data was achieved by use of a modified version of PARAFIT4 8, a parametric least squares curve-fitting subroutine, on an Apple lie microcomputer.
2.3 Solution Studies
a> Potentiometric Titration
A 50 ml aliquot of 0,005 mol/1 HAu(CN) % which was prepared as described above, was titrated against 0,01062 mol/1 NaOH solution previously standardized against 0,0100 mol/1 HC1. The titration was monitored using a radiometer PHM 64 research pH meter with an Orion combination pH electrode. The solution was stirred magnetically throughout the titration
bj Ccnductivity Measurements
Measurements were made using a Wayne-Kerr B642 Autobalance bridge in conduction with a Radiometer CDC 344 Immersion

Conductivity cell comprising three non-platinized platinum ring electrodes with a cell constant of 3,318 cm. The temperature was kept at a constant 25,00 ± 0,019C by means of a Hetotherm 02PF 623 UO thermostat/bath combination in conjunction with a Grant cooling unit.
All solutions were made up using water of conductance lower than 1,5 x 10*® S/cm. Measurements were made by a serial concentration method, starting off with pure water andadding weighed aliquots of the relevant salt solution.
c) Infrared Spectrophotometry
samples of LiAu(CN)2 and NBu4(CN)2 were placed in pyrex containers and dried in a vacuum oven overnight at 85°C. The containers were subsequently stoppered and allowed to cool in a vacuum desiccator over dried silica gel. The methyl ethyl ketone (MEK) and tetrahydrofuran (THF) solvents used in this study were dried over molecular sieves (4 8), that had been dried for four days i t 140°C and cooled in vacuo. Infrared spectra of the dried solvents displayed no bands at ~ 3300 cm* : that would be attributable tr the presence of water. Solutions were made up rapidly to ensure the shortest possible exposure time to the atmosphere. Spectra were recorded within a few hours of making up the solutions. Solutions were stored in a desiccator when not in use. IR spectra were recorded on a Beckman IR4260 Research Infrared Spectrophotometer. A cell with CaF; windows and path-length adjustable to 0,221 mm, supplied by Research and Industrial Instruments Company, England, was used.
d) Distribution experiments
In these experiments, 20 ml of water-saturated organic phase was equilibrated with 20 ml of aqueous phase in a 100
36

ml separating funnel by shaking for 20 rain on a Voss automatic shaker. Efficient mixing was indicated by the milkiness of the solution. Test experiments showed that equilibrium was attained in 2-3 min. Experiments were carried out at 23 ± 1*C. Previous work*8 had showntemperature effects to be smal'. The aqueous phase in each case contained potassium aurocyanide as well as an excess (0,1 M) of the pertinent chloride salt. Goldconcentration in the aqueous phase before and afterequilibration was measured by atomic absorptionspectrophotometry, and corrected for the effects of the various organics on the absorbance. Appendix 1 shows some physical and chemical properties of the solvents used.
Determination of Chloride Concentration inOrganic Phases
The chloride concentration in the various organic phases was determined by titrating a 10 ml aliquot dissolved in 50 ml ethanol and 10 ml of 1 M HN03, against a 0,0255 M AgN03 solution. A 15 min pre-equilibration time was found to be necessary before carrying out the titration. The endpoint was determined potentiometrically with a Labion Model 15 potentiometer, using a platinum electrode in conjunction with a saturated calomel reference electrode.
f) Determination of Dielectric Constant
An indication of the dielectric constant of several organic mixtures was obtained by measuring the capacitance of the solution using the Wayne-Kerr bridge/Radiometer conductivity cell apparatus described earlier. A calibration curve was obtained using literature values for the dielectric constant of several pure organic solvents. The high capacitance of the leads connecting the cell to the bridge did not allow very accurate values to be obtained;
37

however, the results were considered sufficiently accurate for the present purposes.
g; Determination of Water Content by AutomaticKarl-Fischer Titration
The solubilities of water in several solvents, mixtures and solutions of Triton X-1C0 in the solvents, were determined by automatic Karl-Fischer titration. A radiometer TTA 80 automatic titration assembly was linked to an Apple lie microcomputer. The titration was checked by comparison of the measured soluble ity of water in nitrobenzene with that reported in the literature4 9 . Good agreement was obtained.
2.4 Molecular Mechanics Calculations
a) The Force Field
Molecular mechanics calculations on alkali metal complexes of poly(oxyethylene) ligands were implemented on a version of MOLBLD-3 due to Boyd50, modified to reproduce the united atom force-field AMBER5 1. AMBER has been used extensively to explain the properties of proteins52, nucleic at Ids83, the alkali metal complexes of spherands5 4 and, appropriate to the present application, the alkali metal complexes of 18C6, a cyclic poiyether55. AMBER uses a potential function of the form:
r *.(>->,)'->■ Z T il +»N- 2
” W 7)] * E I Ve " - -W* + — 1‘I Vv J

where the nonbonded terms are summed over all atom puirs separated by more than three bonds♦ A "united atom" approximation56 was used, In which aliphatic Cff2 groups are represented as single atoms. This has the advantage of substantially reducing the number of interactions, and speeding up computer refinement. Van der Waals tarms were input into the modified M0Lt)D3 as 12/6 Lennard Jones functions. Egg - A/rj j12 - r/r,} 6, where the coeffieents A and C were derived from group and atomic polarizabilities, effective united atom atomic numbers, and effective ionic radii by substitution into the Slater-KirJewood equations as described by Scott and Sheraga51, Nonbonded parameters for the CH, group, the 0 atcn* and the K* a?«d Cs* ions were taken from Wipff et a.ls 5, a..d those for Li* were taken from Kollman et al54. Ethereal torsion parameters were taken irom Wipff efc al55, and bond streching and angle banding parameters were taken from Kollman et 5 3. The partial atomic charge on complexed oxygen was taken by Wipff et al5 5 to be - 0,6. Carbon atoms bended to the oxygen had a compensating charge of +0.3 to mainte/n the ligand electrical neutrality. The cutoff distan' for nonbonded interactions was set to 7 8, as recommended by Brooks efc al58; electrostatic terms were omitted if aore than 9 8 separated the atoms51. All refinements were terminated when the nns shift in coordinates was less than 0,2 8. The attenuation factor in M0LBLD3 was set to 9 for all calculations. Structures were generated using the molecular modelling package AICHEMY (Tripos inc) and the refined structures were visualized using ALCHEMY.
b} Conformations cf Polyether in OrganicSolvents
warshel60 showed that the effective dielectric constant for short-range ionic interactions in water is considerably smaller than the ;>ulk dielectric constant and increases roughly linearly with charge separation. This

model has h :en used successfully in molecular dynamics studies on proteins61,
In the present study, a microscopic dinlectric constant of r, j was used for the polyether in the least polar solvent. Since increased polarity of the solvent should quench the effects of partial atomic charges over distance, a microscopic dielectric constant of 4r } was chosen for the most polar solvent.
The polyether of the formula CH3-(CH2-0-CH2)%2-CH3 was constructed using ALCHEMY with th? C-C-O-C-C-O units in the helical conformations adopted by the ligand in the crystal structure of complexes, and in a linear conformation.
Since the polar solvent is expected to quench the charges on the polyethor, with which it directly interacts, but not the metal, which is embedded in the polyether, it was decided to attenuate intrapolyether interactions with a dielectric constant of 4rlj, and polyether-metal interactions by 2rjj.
2.5 Activated Carbon Elution Studies
a) Elution Mechanism Experiments
For experiments on adsorption of sodium hydroxide and sodium cyanide onto carbon, 25,0 g of carbon was equilibrated in a magnetically-stirred vessel for 2 days with 250 ml of a solution containing sodium hydroxide at a concentration of 0,2 mol/1, or 0,1 mol/1 plus sodium cyanide (0,1 mol/1). Carbon and solution were sampled periodically, and carbon was analysed for sodium and nitrogen as described above. Solution was analysed for hydroxide by titration with a standardized solution of hydrochloric acid (0,1000 mol/1), using phenolphthalein as
40

the indicator. The cyanide content of the solution was determined fay titration with a solution of AgN03 (0,0255 mol/1), potassium iodide solution being added as indicator, and ammonia being added to solubilize the silver cyanide for a sharp end-point.
For rxperir ants in which polymeric adsorbent resins were used. 1,0 g of dry resin was equilibrated in a rolling bottle for 20 hours with 50 ml of a solution containing 100 mg of gold, as well as 0,1 mol of sodium chloride or sodi hydroxide per litre. Solution was analysed for gold and resin for sodium, as described above.
b) Kinetic Experiments
Le Carbone G210 AS granular activated carbon, sized to between 2,07 and 1,16mm, was used. Cold water was used to thoroughly wash the carbon free of fines and soluble impurities before it was loaded with gold from a solution of potassium aurocyanide. The initial gold concentration on the carbon was about 1000 g/t, and was measured accurately as described earlier.
The majority of elution experiments were perfor ned using the simple apparatus shown in Figure 2.5. A f luiUized bed of carbon was located in a round-bottomed flask with heating mantle and reflux condenser. Fresh eluant solution was pumped into the reactor, which contained a fixed mass of carbon and volume of boiling solution. Eluate was removed by pumping from the top of the solution level at the same rate. Eluate portions were collected and analysed for gold content by atomic-absorption spectrophotometry, and the gold mass balance was checked periodically by analysis of gold on carbon by X-ray fluorescence spectrometry. Unless stated otherwise, the eluant solution contained 0,2 mol of sodium cyanide and 0,2 mol of sodime hydroxide per litre.
41
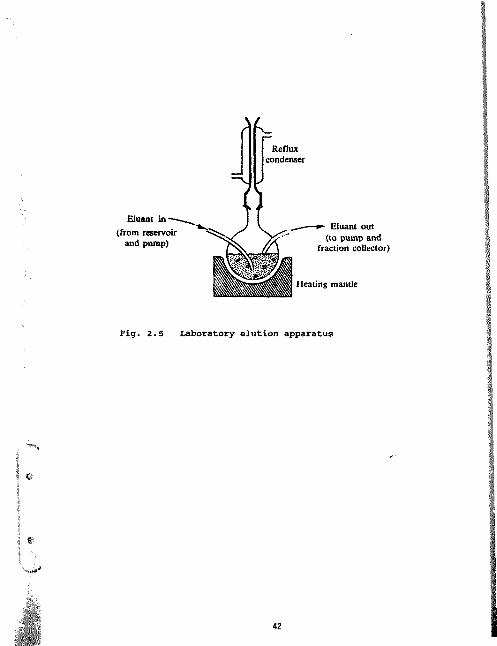
Refluxcondenser
Eluant in —~ (from reservoir and pump)
Eluant out (to pump and
fraction collector)
Heating mantle
Fig. 2.5 Laboratory elution apparatus

Extraction of gold by an electrowinning cell having a single-pass extraction efficiency E was simulated as shown in Fig. 2 6. Outflow from the carbon bed, with a flowxste V $ and gold concentration Seut, was diluted with fresh eluant pumped at a flowrate V2 . Both streams were mixed in a vessel, and the feed to the bed was pumped at the same flowrate (Vt) at which it was recovered from the b^d. Solution was pumped from the mixing vessel at a flowrate equal to V 2 to maintain a constant volume in the vessel. Fractions were collected from this stream, and analysed. The single-pass extraction efficiency can be calculated from the flowrates as follows:
The concentration cf gold in the feed to the carbon bed is then
Sin “ Sout (1 - E) (2.4)
It is necessary to use this elaborate simulated electrowinning cell because in the case of an actual cell, physical sampling of eluant solution for analysis would require a large eluant reservoir. To calculate gold concentration on carbon, samples would have to be collected from three points at a time, as opposed to one in the system incorporating a simulated cell. Analysis involving a nonsampling technique such as UV spectrophotometry, which would also eliminate this problem, was also attempted. However, at the appropriate wavelength region of 240 nm, both ‘ 'droxide and cyanide absorb strongly, rendering the measurement inaccurate.
In experiments that employed a column rather than the round-bottomed flask used in the apparatus described above, carbon was placed in a jacketed column stoppered
43

Flowrate Vt
Reservoir of
Carbonbed Constant
Fig. 2.6 Siauletixm of tile Zadra process by dilution

with glass wool. Hot water was pumped through the jacket to attain a column temperature of 858C. Eluant was pumped up through the carbon bed, and solution was removed from the top of the column at a rate equal to the inflow of solution. Fractions were collected and analysed for gold by atomic absorption spectrophotometry, as before.
2.6 Activated Carbon Surface Chemistry and Structure Studies
a) Carbors and Adsorbents Used
The sources of the various carbons and adsorbents appear in Table 2.2, together with activation conditions of synthesized products and designated names. All commercial products were washed with copious amounts of cold deionized water to remove soluble impurities and fine particles, then oven-dried at 100°C, before use. All products were kept sealed in a desiccator.
b) Synthesis of Activated Carbons
Samples of S-7 61 polymeric adsorbent were pyrolyzed under carefully controlled conditions similar to those described previously6 2. Samples of about 4 g were placed in porcelain boats and slid into a quartz tube, which in turn was inserted into a tubular furnace through which' air, nitrogen, oxygen, steam or carbon dioxide was passed at a flowrate of 2 1/h. Temperature was controlled at all times by a programmable thermostat, as was the rate of Lemperature change. A typical pyrolysis programme is outlined below:
rime (h) 0,5 0,5 4 final pyrolysisTemp (°C) 25 — > 200 — > 200 —> temperature
— > 25
45
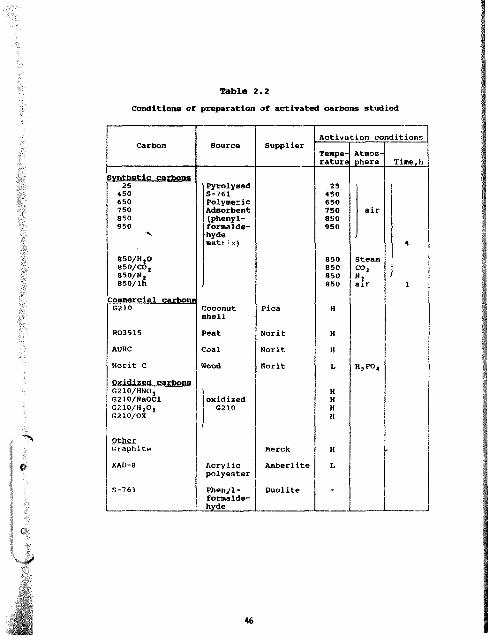
Table 2.2Conditions of preparation of activated carbons studied
Activation conditionsCarbon Source Supplier
Temperature
Atmosphere Time.h
450650750850950 V
Pyrolysed S-761 Polymeric Adsorbent (phenyl- formaldehyde matr'x)
25450650750850950
air
4
CO CO ® CD
850850850850
SteamCO;al. 1
jmercial carbonsCoconutshell
Pica H
R03515 Peat Norit HAURC Coal Norit HNorit C Wood Norit L h ,po4
G210/HNO 3 CartK>|!8 G2lO/NaOCl G210/H,0,G21C/OX
oxidizedG210
HHHH
OtherGraphite Merck HXAD-8 Acrylic
polyesterAmber1ite L
S-761 Phen/1-formalde-hyde
Duolite -
46

As soon as the final pyrolysis temperature had been reached, the tube was taken out of the furnace and allowed to cool to room temperature, with the gas still flowing through. Pyrolysis products were stored in a desiccator.
c) Oxidation of Activated Carbons
Samples of G210 activated carbon were oxidized by four different techniques, as follows:
(i) G2lO/HNOg. A 20 g sample of G210 was boiled for one hour in 250 ml of 1,0 M nitric acid, cooled and washed to neutrality with de-ionized water.
(ii) G2IG/NaOCl. A 20 g sample of G210 was boiled for one hour in 250 ml of 1,0 M NaOCl, cooled and washed to neutrality with de-ionized water.
(iii) G21Q/OX. A 20 g sample of G210 was boiled for twe hours in 250 ml of 1:1 HN03 (35%) :H2S04 (99%), cooled and washed to neutrality with de-ionized water.
(iv) G210/H202. A 20 g sample of G210 was allowed to stand in 250 ml of a solution containing 20% (by mass) hydrogen peroxide, at ambient tamperature (20°C) for one week.
d; Synthesis of Polyx^nthene and Polyquinone
Polyxanthene was prepared using a method similar to that of McNeill and Weiss63. Phthalic anhydride (10 g) , hydro- quinone (7,432 g) , pyromellitic dianhydride (14,723 g) and zinc chloride (9,199 g) were ground together to a fine powder and placed in a baffle furnace that was purged by nitrogen (2 1/h). The mixture was heated at 200°C for 48 hours and then at 250°C for 24 hours.
47
The product was ground and extracted with acetone in a Soxhlet extractor until the filtrate was colourless (10 days) . Zinc was then leached out with 250 ml of a solution containing 4% (by mass) of hydrochloric acid for 24 hours. This was followed by Soxhlet extraction with water for six days, and drying at 606C for 24 hours.
Polyquinone was prepared using a method similar to that of Pohl and Engelhardt64. Phthalic anhydride (10 g), anthracene (12,033 g) and zinc chloride (9,200 g) were ground together to a fine powder and placed in a baffle furnace that was purged with nitrogen (2 1/h) . The mixture was heated at 200°C for 24 hours and then at 250°C for 24 hours.
The product was ground and extracted with ethanol in a Soxhlet extractor until the filtrate was colourless (6 days). Zinc was then leached out with 250 ml of a solution containing 4% (by mass) of hydrochloric acid for 24 hours. This was followed by Soxhlet extraction with water for three days and benzene for three days. The product was dried at 60°C for 24 hours.
e; Adsorption of Aurocyanide
A 0,25 g sample of adsorbent was contacted with 100 ml of a solution containing 300 mg of gold per litre, and either 0,033M CaCl2, 0,1M HC1, or no additives. Adsorption took place in a rolling bottle for 20 hours. In the case of the acidic solutions for Norit R03515 AURC and G210 granular carbons, the range of pyrolyzed S-761 carbons, as well as powdered graphite, Norit C, G210 and XAD-8, a 0,1 g sampl% was used so that a measurable amount of geld in solution could be obtained. Extraction efficiencies are reported for 0,1 g adsorbent throughout. Gold in solution was determined by atomic-absorption spectrophotometry (AAS).
48

f) Techniques for the Characterization ofPhysical Properties
Surface areas were measured by the N2-BET method, and skeletal densities by helium pycnoiaetry. Pore size distributions were measured by mercury displacement.
Conductivities of carbons and adsorbents were measured using a Hewlett-Packard 3478A multimeter connected to a conductivity cell constructed as shown in Figure 2.7. The cell consisted of two teflon cylinders, with copper disc electrodes (6 mm diameter) placed on male and female ends, as shown. Carbon was placed between the electrodes and a constant, accurately measured pressure of 500 N was placed on the cell using an Instron model 1175 press. The gap between the electrodes was typically between 2 and 4 mm, and was determined by the measurement of the distance x between the male and female parts of the cell in Figure 2.7, using a set of Vernier calipers. Measurement of this distance was made at three different points around the cell. Reported conductivities are the ave-age of three separate determinations at different electrode gaps. The value obtained for graphite (603 S/cm) is somewhat lower than that reported in the literature65 (727,3 S/cm). This is probably due to the fact that the literature measurements were made under much higher pressures63 # 6 4, resulting in a greater degree of interparticle contact. Conductivities reported in this study are internally consistent and very reproducible, however, thereby allowing trends to be established. z
X-ray diffractograms were obtained using a Philips PW1050/25 X-ray diffractometer with Cu Ka radiation.

Fig. 2. 7 Apparatus for the measurement of conductivity of carbons
50

g) Techniques for the Characterization ofChemical Properties
Infrared spectra of activated carbons, polymers and adsorbents were obtained using a Perkin-Blmer 1725X Fourier Transform Infrared Spectrophotometer. For each spectrum, 200 scans were made, at a resolution of 4 cm"1.
Spectra of polymers and adsorbents were obtained using a diffuse reflectance (DRIFT) accessory. Vacuum-dried samples were pulverized for 5 minutes in a Spex 5100 Mixer/Mill before mixing 6 rag of adsorbent with 200 mg of dry KBr, by shaking manually for several seconds. Pure KBr was placed in the sample holder to obtain a background spectrum that was automatically subtracted, prior to obtaining spectra of the adsorbents.
Spectra r£ activated carbons were obtained using the instrx., t in the transmission mode, as described above. No mathd’.i^tical smoothing functions were performed on the spectra.
The adsorption activities of activated carbons, polymers and adsorbents for phenol were determined using the method of Weber and Van Vliet66. A 0,1 g sample of adsoroent was placed in a rolling bottle for 20 hours with 100 ml of solution containing 0,5077 mM phenol in 0,005N NaHCO*. Phenol was determined before and after contact by UV spectrophotometry at 268 nm, on a Beckman MIV Research ultraviolet-visible spectrophotometer.
Analysis of adsorbents for carbon and hydrogen were made using a Heraeus elemental analyser, and for oxygen using a Leco oxygen analyser.
Measurements of pH change in water were made using a Labion digital pH meter. A 0,1 g sample of adsorbent was contacted
51
with 10 ml of de-ionized water in a rolling bottle for twenty hours prior to rc-measurement of pH.
Reduction potentials of activated carbons, pol,ners and adsorbents were determined by the method of KcDougall et al.32. The carbon was immersed in a 0,01M HaCl solution which was kept at a pH of 5,0 for fifteen minutes. The potential was measured using a graphite rod electrode referenced against a saturated calomel electrode. The graphite rod electrode was contacted with the surface of a carbon particle and the potential measured. The average value for at least twenty particles was obtained in this manner.

CHAPTER 3 TOE MBCHAtflSM OF ADSORPTION OFAUROCYANIDE ONTO ACTIVATED CARBON
The chemistry of adsorption of aurocyanide onto activated carbon has been the topic of much attention for seventy- five years but, despite the commercial importance of the process, no consensus has yet been reached regarding the mechanism of adsorotion. These differences largely arise because activated carbon is not readily amenable to direct investigation by spectroscopic techniques. Thus, very little is known about surface properties of the adsorbent. For instance, identiti®- of oy^ytm-containing organic functional groups formed n carbon surface duringactivation remain uncertain, and the nature of the gold cyanide adsorbate has not been unequivocally established.
3.1 The Mechanism of Adsorption of Aurocyanide ontoActivated Carbon - A Literature Review
The intention here is not to discuss the results of each of the relevant studies, but rather to summarize (i) the »«in observations that need to be explained, (ii) various theories that have been proposed to account for these observations, and (iii) to identify major inconsistencies present in current understanding of the system.
a) Summary of Factors Influencing Adsorption ofAurocyanide onto Activated Carbon
(i) As discussed earlier, activated carbons are popularly divided24'29 into two groups : H or high- temperature carbons, formed at 700 to 1000°C, and L or low-
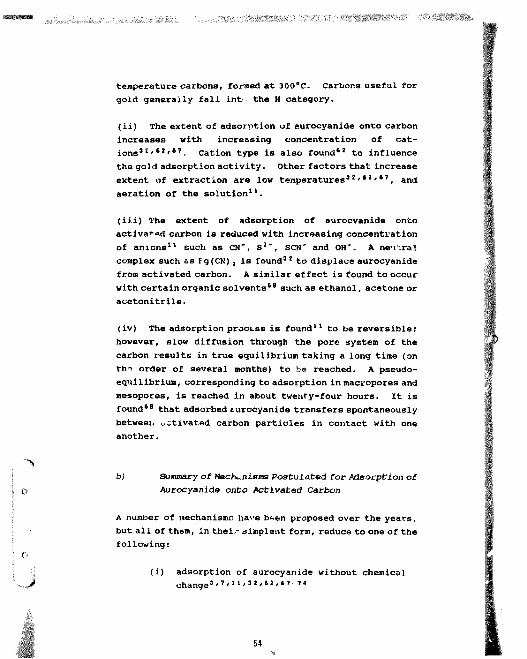
temperature carbons, formed at 300°C. Carbons useful forgold generally fall int- the H category.
(ii) The extent of adsorption of aurocyanide onto carbon increases with increasing concentration of cations3'4'62'67. Cation type is also found62 to influence the gold adsorption activity. Other factors that increase extent of extraction are low temperatures32'62'67, and aeration of the solution11.
(iii) The extent of adsorption of aurocvanide onto activated carbon is reduced with increasing concentration of anions11 such as CN~, S2", SCN' and OH*. A ne’V:ral complex such as ig(CK) 2 is found32 to displace aurocyanide from activated carbon. A similar effect is found to occur with certain organic solvents68 such as ethanol, acetone or acetonitrile.
(iv) The adsorption process is found11 to be reversible; however, slow diffusion through the pore system of the carbon results in true equilibrium taking a long time (on th"' order of several months) to be reached. A pseudoequilibrium, corresponding to adsorption in macropores and mesopores, is reached in about twenty-four hours. It is found68 that adsorbed aurocyanide transfers spontaneously between activated carbon particles in contact with one another.
b) Summary of Mechanisms Postulated for Adsorption ofAurocyanide onto Activated Carbon
A number of mechanismr, have b*-.en proposed over the years, but all of them, in their simplest form, reduce to one of the following:
(i) adsorption of aurocyanide without chemical change 62,677*
54

(ii) adsorption of aurocyanide with decomposition Of AU(CN)j to AUCN3'73"75, or
(iii) adsorption of aurocyanide with reduction of gold(l) either to gold metal or to a partially reduced state between gold(I) and gold 3 2 ' 7 6,
The first mechanism can be subdivided further into adsorption by simple coulombic ion exchange 6*/fO,7?-7S# or adsorption involving ion-pair forraa-tion3 #7#ii#32#62,67,7ii jn some cases a dual mechanism has been proposed, such as initial adsorption by ion- exchange interaction followed by decomposition to AUCN73/7 4.
The literature pertaining to the subject was critically reviewed by McDougall and Hancock77 in 1981 and, more recently, by McDougall and Fleming11, who concluded that the most likely mechanism of gold loading under typical CIP operating conditions is the adsorption of aurocyanide without chemical change. Moreover, they suggested that adsorption probably occurred by a mechanism first proposed by Kuzminykh and Tyurin7 1, which involved the extraction of ion pairs of the type M n + (Au(CN) 5 ] n, where M"* == Na+, K+, Caz*, Mga + , etc. at high pH values, and where Mnt = H+ in acidic solution. Further evidence for this mechanism was provided by Adams2 2 # 6 2.
c) Summary of Major Inconsistencies Present in ModernTheories of Adsorption of Aurocyanide onto Activated Carbon
A study of the relevant literature indicates that none of the theories proposed for the mechanism of adsorption of aurocyanide onto activated carbon are entirely consistent with all known facts. fhe nature of the adsorbed species has yet to be elucidated completely - for example, the
55
analysis of loaded carbons for cations, gold and nitrogen3 2,75 are not always consistent with the simple ion-pair species discussed above. The possibility also exists that studies on different carbons under different conditions could result in various adsorption mechanisms holding under various conditions. It is a major challenge to explain all the observations in terms of a reasonable mechanism. Direct evidence from instrumental techniques would undoubtedly aid this task considerably.
The bonding mechanism between the adsorbed gold species and the activated carbon surface has been studied by direct techniques such as X-ray Photoelectron Spectroscopy (XPS) 3 2 and Electron Spin Resonance (ESR) 6 2 spectroscopy. The conclusions arrived at in general indicate some form of charge-transfer interaction between the gold species and the carbon surface6 2 . This could be dependent on specific types of active sites being present. This aspect is important for an understanding of the process.
Other apoects of the chemistry involved in the adsorption process remain poorly understood, These include the effects of cations, oxygen bubbling, acid and base treatment, the various properties of the carbon, as well as the desorption of aurocyanide by various species.
The aim here is to provide a silf-consistent adsorption mechanism that accounts for all observations presented in the literature. Interpretation of results in terms of preconceived ideas, and neglect of observations of'other authors has greatly contributed to the current disagreement in the literature.
3.2 Novel Studies on the Nature of the Adsorbed Species
Recently, Adams and Fleming76 showed from elemental analyses that the ion-pair species K*(Au(CN)}} and

. ...
Ca,,[Au(CH);]i are loaded from 0,5 M KC1 and CaCl, solutions, respectively. Another experiment, by careful monitoring of K* , Au(CN), , H* and Cl" concentrations in solution and on the carbon, suggested that under slightly acidic conditions (pH 3) from low ionic strength solutions (i.e., no support] g electrolyte added), gold is extracted by the following ion-pair mechanism:
Au(CN); (ag) + H* (aq) « HAu(CH), (ads) (3.1)
Au(CN); (aq) + K* (aq) =« K* [Au(CN);] (ads) (3.2)
H+C1“ (ads) + AU(CN); (aq) « HAu(CN) 2 (aq) + Cl" (aq)(3.3)
the possibility that other mechanisms may be prevalent under different conditions will be examined in this Char sr.
a) Effect of Gold Concentration on the Citbon onthe Nature of the Adsorbed Species
McDougall et ai.3 2 based their suggestion that some decomposition of aurocyanide takes place at high loadings of gold on carbon, on nitrogen micro-analyses of carbons loaded in the presence of acid or cations. Table 3.1 presents results for potassium, gold, and nitrogen loaded onto carbons from 0,1 M potassium chloride, and 0,1 M hydrochloric acid solutions. '
The stoichiometry conforms to that of KAu(CN), for carbons loaded from 0,1 M potassium chloride solutions, even at high gold loadings. However, there is less nitrogen present on acid-loaded carbons, suggesting that decomposition of the Au(CN); occurs to some extent, particularly at high gold loadings:

H* + AU(CH); » AuCN + HCH(t) (3.4)
Evidence for the presence at partially polymerized AuCN species on acid-treated carbons was recently7’ invoked from XPS studies.
Table 3.1Analysis for potassium, gold, and nitrogen on carbons
loaded from 0,1m potassium chloride and 0,1m hydrochloric acid
CoMlMans Carbon mass 1,0 g solution volume 400 mlinitial gold in solution 50 to 700 mg/1 time 72 h
Gold on loaded Loading Elemental analysis,, mraol/gcarbon, wt % conditions K Au |Ne
2,02 0,1M KC1 0,107 0,103 0 ,1C03,47 0,146 0,176 0,1965,25 0,261 0,267 0,2998,15 0,488 0,414 0,4718,95 0,442 0,454 0,489
2,03 0,-lM HC1 0,103 0,0753,85 0,195 0,1256,93 0,352 0,275
13,5 0,685 0,48516,3 0,653 0,625
* Value for N is correct? for the nitrogen value of the non-loaded carbon (0,25 wt I; 0,178 mmol/g)
This explanation is substantiated by the strong smell of hydrocyanic acid exuded by the reaction bottles when gold was loaded to very high values from acid solution.
58

.-v, - .V.. T?-
Moreover, previous80 evidence obtained by X-Ray diffvactometiy (XRD) has shown that reaction (3.4) occurs to some extent when aurocyanide is adsorbed from acidic medium by polymeric adsorbent resins.
b) Elution of Aurocyanide from Activated Carbonwith Sodium Hydroxide
Hydroxide ion does not form a stable complex with gold, so a sodium hydroxide solution would not be expected to elute from the carbon any gold that was present in the form of Auc r or metallic gold (or gold in a partially reduced state). Experiments were therefore carried out in which fresh sodium hydroxide solution was pumped continuously through a heated (90°C) column of loaded carbon until the concentration of gold in the spent eluate decreased below the detection limit (less <:han 0,1 mg/1). The results are presented in Table 3.2, which shows that gold can be eluted almost completely from carbon with a sodium hydroxide solution containing no cyanide. Moreover, this can be achieved with carbons loaded under both acidic and alkaline conditions, and with carbons loaded to very high gold concentrations.
Elution efficiencies for the carbons Ion led from acidic solutions are somewnat lower than those loaded from potassium chloride solutions. This is consistent with the conclusions based on the micrc-analysis data presented in Table 3.1. (Note that under typical plant conditions of e gold loading of 0,5 to 2 per cent from solutions of pH 10,5, tne presence of AuCN on the carbon can be ruled out.)

Table 3.2Elution of aurocyanide from activated carbon with
0,1 M sodium hydroxide at 90°C
condltiPiw Carbon mass 1,Cg solution volume 400 mlinitial gold in solution 50 to 700 mg/1 time 72 h
Gold on loaded Loading Elution efficiencycarbon, % conditions %
0,925 0,1M KC1 97,63,71 99,35,25 98,58,15 98,4
0,925 0,1M HC1 96,86,93 90,5
13,5 37,316,8 83,8
Two further batch elution experiments were carried out with 0,1 M sodium hydroxide, and the spent eluates were analysed for gold (by AAS) and for aurocyanide (by UV spectrophotometry). The results are presented in Table3.3 and show that all the gold is present in the eluate as the aurocyanide ion, with the differences between the values obtained by the two methods being within the limits of accuracy of the techniques. Since there was no free cyanide present in the eluate, the eluted gold must have been loaded onto the carbon in the form of the aurocyanide ion. (The instance in which the loaded carbon was treated with boiling hydrochloric acid prior to elution will be discussed in detail in the following section.)
60

Table 3.3Analyses of sodium hydroxide eluates
for Au(CN) 2 and Au after elution
Plutign wnditians: 0,2M NaOH, 95eC, 2 h
Pre-treatment of Analysis of eluate, mol/1loaded carbon UV for Au(CN); AA for Au
None o X 4 , 1 5 X 1 0 - *
3 , 7 8 X 1 0 " 4 3 , 4 4 X 1 0 *
Washing with 1 M HC1 at95°C for 6 hours followed 5 , 1 0 X 1 0 " * 5 , 3 5 X 1 0 " *
by washing with water
These observations preclude the AuCN mechanism, but not the anion-exchange mechanism. Perhaps the most compelling evidence against the anion-exchange mechanism was the observation33'80 that, while the presence of excess perchlorate anions was severely detrimental to the distribution of aurocyanide in the anion-exchange resin IRA-400 (ac might be expected for the large, highly polarizable CIO4 anion), only a slightly decreased distribution of av~ocyanide was found for carbon62.
In addition, the well-known effect of ionic strer 'V on adsorption of aurocyanide onto activated carbon"2;87- and, in particular, the sensitivity of adsorption to type of cation in solution62, are phenomena that can be explained more convincingly by the ion-pair mechanism than by an ion-exchange mechanism.
61

c) Effect of the Treatment of Loaded Carbon withHot Acid oil fche N&ture of the Adsorbed GoldSpecies
Periodic treatment of loaded carbon with hot acid solutions has ceen suggested by several workers as a procedure that enhances the gold-loading capabilities of carbon. Davidson and Veronese8 1 proposed that, prior to elution, loaded carbon should be treated with acid to remove calcium carbonate, which is known to foul carbon in adsorption circuits, and which can have a deleterious effect on efficiency of elution. This procedure is currently in use on most CIP plants1. McDougall8 2 patented a process whereby carbon is periodically removed from the adsorption circuit, treated with hot acid, and then returned to the adsorption circuit. It is claimed8 2 that this treatment converts aurocyanide to the insoluble AuCN species, which is thereby excluded from the adsorption equilibrium, allowing the wurbon to be loaded to higher gold values.
(i) SEH and XRD studies of gold species on carbons subjected to acid and base treatments
In the previous section (Table 3.3) it was shown that treatment of loaded carbon with hot hydrochloric acid (prior to elution with hot sodium hydroxide) had virtually no effect on the forr. of the curocyanide complex eluted from the carbon. However, it can be seen from the results in Figure 3.1 that pre-treatment of the carbon with boiling hydrochloric acid for different lengths of time results in a progressive decrease in the efficiency of gold elution with hot sodium hydroxide, indicating that some of the gold on the carbon is converted to a species other than aurocyanide. Moreover, the loss in efficiency reaches a plateau after 2 hours, corresponding to 50 per cent elution efficiency. Even after prolonged treatment with boiling acid, it is still possible to elute BO per cent of the gold
62

90-
80-
70-
50-
40-
30-
20-
10“
Duration of acid pre-treatment, h
OFig. 3.1 Effect of duration of acid pre-treatment on the
efficiency of the elution of gold from activated carbon with a sodium hydroxide solution
^ (Conditions: 4 pet cent (m/m) hydrochloricarid pretreatment at 95°C followed by elution
— ^ with 0,1 mol/1 sodium hydroxide at 90GC)

with sodium hydroxide, and this appears in the eluate as the aurocyanide ion (Table 3.3).
These sampies of carbon were examined by XRD and SEM after being boiled in acid, and again after subsequent elution with a hot caustic solution. It was found that no discrete particles 01 crystals of AuCN or metallic grid could be detected on the carbon surface after treatment with hot acid (Figure 3.2a). However, after tne same carbon sample had been eluted with hot sodium hydroxide, metallic gold, in the form of large crystalline particles, was observed on the carbon surface (Figure 3.2b). The metallic nature of the particles was confirmed by XRD. Interestingly, many of the particles on the carbon that had been boiled in acid for only 30 were larger (5*m, Figure 3.3a), thanthose on the carbon vhat had been boiled for 6 hours (lam, Figure 3. 2b) . At even higher magnification (Figure 3. 3b), the remarkable dendritic structure of the crystals can be dearly seen.
Another interesting difference between these carbons is evident from the micrographs in Figure 3.4. Gold crystals of uniform size are distributed fairly evenly throughout the particle of carbon that was acid-boiled for 6 hours (Figure 3.4a), whereas a preponderance of gold crystals is situated along the particle edge (Figure 3.4b) and around he major features (Figure 3.3a) of carbon that was boiled in acid fov 30 minutes. Moreover, the crystals vary in size in this case.
These results can be rationalized by consideration of the values for standard reduction potentials, calculated from experimental equilibrium constants82-8 5 (see Appendix 1) :
AuCN + e" 4 Au° + CN‘ (E6 = -0,166V) (3.5)
2AdCN + e~ Au° + Au(CN); (E0 - 0,252V) (3.6)
64

Fig. 3.2 SEM m i e n graphs of activated carbon surfaces after(a) acid pre-treatment for 6 hours (4 per cent
hydrochloric acid at Q5°C), and(b) ? 3id pre-treatment for 6 hours followed hy
elution with sodium hydroxide (0,1 mol/1) at 90*C
65

Fig. 3.3 SEM micrographs of activated carbon surfaces after pre-treatment for 30 minutes with 4 per cent hydrochloric acid at 95*C followed by elution with sodium hydroxide (0,1 mol/1) at90°C(a) Gold crystals concentrated in a macropore, and(b) a magnified portion of (a), showing the
dendritic structure of the crystals
66

Fig. 3.4 SEM micrographs of activated carbon particles after(a) pre-treatment for 6 hours with 4 per cent
hydrochloric acid at 95GC followed by elution with sodium hydroxide (0,1 mol/1) at 90°C, and
(b) acid pre -treatment for 30 minutes followed by elu cion with sodium hydroxide

Activated carbons are known3 2 to have reduction potentials between 0,40 and 0 , 08 V (versus SHE), so AuCN molecules in close proximity to one another on the carbon surface could theoretically be reduced in accordance with Equation(3.6) . On that basis, it would be possible to strip only about 50 per cent of the gold from the carbon with sodium hydroxide (as confirmed by Figure 3.1), and the gold would appear in solution as the aurocyanide ion (as confirmed by Table 3.3). Moreover, the remaining 50 per cent of the gold would remain on the carbon in the form of the metal (as confirmed by Figure 3.2).
It is proposed, therefore, that aurocyanide on activated carbon is converted to AuCN (Equation 3.7) by boiling of the carbon in acid for about 2 hours.
Au(CN)j (ads) + H+ (aq) -» AuCN (ads) + HCN (g)(3.7)
The exact nature of the adsorbed AuCN is not clear at this stage, since no polymeric AuCN could be observed on the acid-boiled carbon by XRD or SEM (Figure 3.2a). This aspect will be addressed later i,t this Chapter.
When the carbon is subsequently treated with hot sodium hydroxide, the AuCN decomposes according to Equation(3.6). This reaction occurs only in alkaline solution and not after treatment with boiling acid, and moreover, the
> intensities of the X-ray diffraction peaks for metallicgold in carbon samples that had been boiled in Sodium
C hydroxide (0,1 mol/1 ) for 2 hours, were very similar tothose for carbon samples that had been washed at room temperature in sodium hydroxide solution overnight. In contrast, when the carbon was boiled in water instead of sodium hydroxide after the treatment with hot acid, no X- ray diffraction peaks for metallic gold were observed. This reaction is studied in more detail in the following
, ..V section.
66

Further proof of a mechanism involving Equation (3.6) is found in a study of the rate of elution. Elution kinetics have been modelled in this Thesis (see Chapter 5), the elution rate being proportional to the concentration on the carbon of gold that can be eluted. Since AuCN and metal) ic gold cannot be eluted by hydroxide, a decrease in the elution rate could be ascribed to the presence of one of these species. The results presented in Table 3.4 show that the rate of elution is enhanced slightly when the loaded carbon is treated with cold hydrochloric acid prior vO elution with sodium hydroxide. This gold, therefore, cannot be in the form of AuCN and must be present as HAu(CN) 2. However, the rate of elution is halved after the carbon has been boiled in acid prior to elution with sodium hydroxide, and this is consistent with the conversion of 50 per cent of the aurocyanide to the metal via reaction (3.6) .
Table 3.4Effect of pre-treatment of carbon with hydrochloric
acid on the rate of elution of gold with sodium hydroxide
0,2M NaOH, 95°C
Pre-treatment Rate of elution of goldmg/h
None0,1 M HC1, 25=0, 24h
1,471,6k

(ii) Mossbauer spectroscopic study of gold species on carbons subjected to acid and base treatments
Gold-197 Mossbauer spectroscopy can provide detailed information regarding the oxidation state, bonding and electronic environment of gold atoms in a sample. Parameters for a range of gold compounds are plotted in Figure 2.3, and separate correlation bands for gold(I) and gold (III) compounds are evident. Cashion and co- workers3 *'** have made Mossbauer measurements of aurocyanide loaded onto activated carbon and found the characteristic quadrupole due to Au(CN) , to be present, adding weight to the theory that aurocyanide adsorbs onto activated carbon without chemical change.
Figure 3.5 shows the Mossbauer spectrum of a carbon that was loaded with aurocyanide to 5% gold (m/m) and subsequently boiled in 4% hydrochloric acid for three hours. The spectrum shows two distinct quadrupoles, with isomer shifts and quadrupole splittings that can be readily assigned to Au(CN); and AuCN species (see Table 3.5).
Wj c a knowledge of the Debye-Waller factors for adsorbed species, it is impossible to arrive at a quantitative description of the system; however, this assignment is entirely consistent with the conclusions of the previous section, i.e. that reaction (3.4) is occurring.
Klauber7’ has suggested from XPS studies that Au,(CN); oligomers are present on the carbon surface after acid washing. This suggestion is consistent with the fact that XRD peaks due to polymeric AuCN are absent from such carbons, and it is likely that Au,(CN); represents an average chain length, rather than an isolated species. It is possible that the microporosity of the carbon plays an
70

o01to
in m-AuCN
I—
- 1 0 -5 0 5 t oV E L O C I T Y (MM/S)
Fig. 3.5 197Au Mossbauer spectrum of aurocyanideloaded onto carbon and subsequently boiled in 4% hydrochloric acid for 3 hours. Solid lines represent fitted curves "
71

Table 3.5Mossbauer spectral parameters for gold species on
activated carbons and gold compounds
Absorber Isomershift (IS)
mm/a
Quadrupolesplitting (QS)
mm/sRef.
Carbon loaded with aurocyanide and
3,37 10,40
subsequently boiled in 4% HC1 for 3 hours.
2,44 7,96
Above sample subsequently
3,49 10,40
boiled in 0,1H NaOH for 3 hours.
H1 0,00
KAu(CN), 3,05 9,80 443,23 10,21 443,10 10,21 443,12 10,21 44
AuCN 2,3 8,0 39
Au -1,23 0 39
HAuCl,.4H20 0,64 0,94 39
AuCl -1,4 4,5 39

important role in the reaction, by limiting the AuCN chain length within the Kicropore. The reaction could be represented thus:
(X+l) HAU(CN), # HAus+1{CN)x+2 + X HCN(f) (3.8)
The Mossbauer spectrum of the resultant species in Equation (3.8) would be indistinguishable from separate Au(Ctt) £ and AuCN species, since the NC-Au-CN and the CN- Au-CN electronic environments occur in both scenarios.
It is noteworthy that Mossbauer spectra of carbons loaded under acidic conditions and subjected to moderate drying, display an additional Mossbauer quadrupole that is attributed86 to Au(CN)2Ci;. The reaction that evidently occurs under these conditions is the oxidation reaction
Au(CN)j + 2C1" * AU(CN)2Ci: + 2e~ (3.9)
The standard reduction potential for this reaction can be calculated to be E° = +0,97V. The electrons could be provided by the reduction of oxygen (activated carbons contain both chemisorbed and physisorbed oxygen):
0 2 (g) + 2H+ (aq) + 2e' ^ 2H20 (3.10)
<EB = 1,23 V)
Activated carbons are known87 to act as oxidation catalysts, and this factor may also play a role. Moreover, carbons that have been loaded with gold in the presence of an acid sucn as HC1, retain some adsorbed HC178, providing the proton in Equation (3.10). Both half-reactions (3.3) and (3.10) would benefit from an increase in HC1 concentration i.t the carbon pores, such as would occur upon moderate drying. This could explain why the oxidation is only evident after some drying has occurred. The lack of such a species being evident in Figure 3.5 is probably a
73

manifestation of reaction (3.8) being drivan nearly to completion by the evolution of gaseous HCN.
The Mossbauer spectrum of the carbon shown in Figure 3.5, subsequently boiled in sodium hydroxide solution (0,1 mol/1) for three hours, is shown in Figure 3.6. The spectral parameters appear in Table 3.5, and can be uneguivocably assigned to metallic gold and Au(CN), one#* again in agreement with Equation 3.6. As discussed earlier, the peak intensities are proportional not only to concentrat ion of the particular species, but also to the Debye-Waller f- factor for the species. The Debye-Waller factors for several gold compounds appear in Table 3.6 below.
The f factor for metallic gold is an order of magnitude higher than that for KAu(CN) $ , suggesting that the ratio of Au to Au(CN) 2 is on the order of 1, as predicted by Equation(2.5). Figure 3.7 shows a scaled-up view of the Au(CN)g quadrupole in Figure 3.6, verifying the presence of this species.
Table 3.6Debye-Waller factors for some gold compounds
(after Cohen at al.ee)
Compound f
Au 0,19AuCN 0,095KAu(CN)2 0,015KAu(CN)4 0,059
74

TRAN
SMIS
SION
(%)
98.0
98.5
99.0
99.5
100.
0
Fig. 3
10-10 -5 0 5V E L O C I T Y (MM/S)
.6 l,7Au Mossbauer spectrum of the activated carbon sample shown in Pig. 3.5 that was subsequently boiled in 0,1M sodium hydroxide solution for 5 hours
75

TRAN
SMIS
SION
(%)
99.6
99.8
V E L O C I T Y (MM/S^
Fig. 3.7 ,,7Au Mossbauer spectrum shown in Fig. 3.6,showing detail of quadrupole assigned to Au (CN);
76

(ill) Kinetics of AuCN precipitation from aqueous solution
In the previous section, it was suggested that reaction(3.6) had occurred to completion after about two hours of reaction. The work presented in the present section serves as a comparison between the kinetics of precipitation on the carbon surface and in aqueous solution, rather than a definitive study of the reaction. Figure 3.8 shows that at 95°C, complete precipitation of AuCN from a solution containing 0,005 mol/1 KAu(CN)2 in 0,1 mol/1 HC1 is attained in a similar time interval, providing additional evidence for the proposed reaction scheme. The kinetics were found to be first order, and rate constants were obtained from the slope of plots of In [Au(CN);] against time. Figure 3.9 shows an Arrhenius plot of the data, from which an activation energy Ee ■ 72,5 kJ/mol can be calculated, via the Arrhenius equation
k = e"Ea/RT (3.11)
where R is the gas constant, and T is the temperature.
(iv) Decomposition of AuCN in aqueous solution
In section (ii), the observation was made that reaction(3.6) occurs not only on the carbon but also when solid polymeric AuCN is contacted with alkaline solution. This is interesting because, unlike the situation where activated carbon is present and acts as a reductant, there is no immediately obvious reducing agent present in the absence of carbon.
To explore this reaction further, AuCN was contacted with aqueous solutions varying in pK and temperature, that were analysed for gold, cyanide and cyanate. The results are
77

100
s5a!
25"C
Time, h
Fig. 3.8 Kinetics of AuCN precipitation from aqueous solution at various temperatures

Fig. 3
(
(
1
-2
1. 2.75 3.00, 3,25 3,50
.9 Arrhenius plot of data for the precipitation of AuCN from aqueous solution

shown in Table 3.7. AuCN was found to be staLte at 20°C at pH values of less than 12. Some gold was found to dissolve at a pH value of 13, and this amount increases dramatically at 95°C. The UV spectra of the resultant solutions are shown in Figure 3.10, which show the characteristic bands for Au(CN) 2 at 239 nm anl 229 nm, confirming the fact that aurocyanide is one of the products.
Table 3.7Decompositi on of AuCN in aqueous solution
pH Temperature°C
Concentration,
Au CN"
mmol/1
CNO"
1 20 0,003 <0,02 <0,023 20 0,001 <0,02 <0,025 20 0,004 <0,02 <0,027 20 0,005 <0,02 <0,029 20 0,005 <0,02 <0,02
11 20 0,010 <0,02 <0,0213 20 1,428 <0,02 <0,0213 95 2,215 <0,02 0,428
The fact that, as well as Au(CN) %, a substantial amount of cyanate was detected in the pH 13 solution that had been boiled is evidence that the oxidation half-reaction corresponding to the reduction reaction (3.6) is the oxidation of cyanide to cyanate:
CN" + 2OH” # CNO" + H20 + 2a" (3.12)(E° ~ -0,97V)
A comparison with the reduction potential for reaction (3.6) (i.e. E6 *-0,252V), shows that this reaction scheme is thermodynamically feasible. The fact, that the cyanate
80

Absorb
ance
200 240 , 280X . nm
Fig. 3.10 Ultraviolet spectra of aqueous solutions in contact with polymeric AuCN under various conditions
t
31

concentration is markedly smaller than the gold concentration in this solution is probably due to the catalytic oxidation of cyanate to ammonia and carbon dioxide81, particularly at high temperatures.
Further proof for these hypotheses is gained from an X-ray diffractometric examination of solid residues at the end of the reaction. Figure 3.11 shows the X-ray dif f ractograms of residues from the reactions at high pH values. At pH 11, the residue consists of AuCN, with only a negligible Au peak at a 20 value of 38°. The contribution due to metallic gold is somewhat higher at a pH value of 13, and upon boiling at pH 13, the majority of the AuCN is converted to the metallic form, with only a small AuCN peak remaining. From the solution gold concentration of 2,215 mmol/1, it can be calculated that 28 per cent of the gold, i.e. approximately one-third, had dissolved as Au(CN)j. All of these facts are consistent with the following reaction scheme:
2AuCN 4- 2e" * 2Au° + 2CN* (EG - -0,166V) (3.13)CN" + 20H~ * CNO" + H 20 + 2e" (E° = -0,97V) (3.14)
2AUCN + 20H" * 2Au° + CN" + CNO” + H 20 (3.15)AuCN + CN" - Au(CN)' (3.16)
3AuCN + 20H" * 2Au® + Au(CN); + CNO" + H20 (3.17)
From a knowledge (see Appendix 1) of K = 1,205 x 1 0 7 for reaction (3.16), the equilibrium constant for reaction(3.17) can be calculated to be K » 4,02 x 10 1 3 . Moreover, the equilibrium constant for the equivalent reaction in neutral solutions, i.e.
3AuCN + H 20 y 2AU° + Au(CN) 2 + CNO" + 2H+ (3.18)
can be calculated to be K = 0,402. These valuas are a reflection of the fact that an increase in hydroxide concentration will push the equilibrium to the right. The
82

AuCN
77 64 54 44 38 35 30 17 28
Fig. 3.11 X-ray diffractograms of solid residues resulting from the contact of polymeric AuCK with aqueous solutions under various conditions
83

calculated values of K indicate that the reaction should occur to a significant extent only in alkaline solutions, which is consistent with the experimental results shown inTable 3.7
The fact that about half of the gold could be eluted from the carbon as Au(CN) ] does not aeem to be consistent with the stoichiometry required for reaction (3.17), i.e. more Au(CN) 2 is forming than predicted. This observation is explicable in terras of the Mossbauer result (Figure 3.5), which indicated an apparent incomplete conversion of Au(CN) I to AuCN upon acid-boiling for three hours, due to the formation of short-chain oligomers such as Au, (CN) 5, as proposed by Klauber79. This average chain-length is also consistent with the N/Au ratios presented in the following section. It is noteworthy that this average stoichiometry, when taken in conjunction with Equation(3.17), results in a final stoichiometry for Au°/Au(CN)5 of 1 , which is the experimentally determined value. Therefore, the conclusion in the case of carbon is that Equation (3.6) is correct, but that the oxidation halfreaction is that of cyanide oxidation. No cyanate could be detected in the resultant alkaline solution after boiling the activated carbon? however, activated carbon is known89 to catalyze the further oxidation of cyanate, even at ambient temperatures, which may account for this observation.
d) Thermal Stability of Adsorbed Gold Specie^on Activated Carbon
A study of the thermal stability of the adsorbed gold species may provide useful information regarding the adsorption mechanism. Moreover, the influence of drying on the nature of the adsorbate is an aspect that has thus far been neglected in most mechanistic studies of this system. It will be shown in the following section that the source of
84

the disagreement between workers is the differing conditions of ionic strength employed in the various investigations. It is possible that the chemical nature of the adsorbate changes with variation in the drying procedure employed. Moreover, recent results86 indicate that a portion of the Au(CN) I is oxidized to Au(CN) 2C15 upon vacuum drying of carbon loaded with aurocyanide from acidic media.
Finally, an understanding of the system at somewhat higher temperatures is useful in consideration of non-eluted gold that accompanies the carbon to the regeneration kiln (normal plant practice involves thermal regeneration of activated carbon at >600®C to remove adsorbed organics, prior to reintroduction into the adsorption vessels).
In the present work, three carbon samples were loaded with up to five per cent gold (by mass) under various conditions. The carbons v-.-e dried at different temperatures for 24 hours and analysed for gold and nitrogen. Table 3.8 shows analytical values for N/Au ratios on the carbons.
The stoichiometry of the adsorbed gold conforms with that of Au(CN) 2, when loaded from 0,1 M KC1 or with nv additives present. Table 3.8 shows that the ratio of nitrogen to gold remains unchanged at 2,0 even after the loaded carbon has been heated to temperatures as high as 240°C. This suggests that the aurocyanide remains stable on the carbon surface, even at high temperatures, an issue that has raised doubts in the past39 regarding drying techniques. The ratio of nitrogen to gold is less than 2 when loaded from acidic solution, indicating that some decomposition to AuCN has occurred. It is significant that carbon loaded from aurocyanide solution containing no additives exhibited N/Au ratios of 2,0. This suggests that only a negligible amount of aurocyanide loaded under neutral conditions at low ionic strength is in a thermally unstable form such as HAu(CN)2.
95

The N/Au ratio remains approximately 2 even at 270®C, but drops to about 1,5 when the carbon is heated to 300°C, indicating that some decomposition has occurred. Figure 3.12 shows X-ray diffractograms of aurocyanide-loaded carbons that were heated to various temperatures. Large peaks corresponding to metallic gold were observed after heating to 300°C or higher. Smaller peaks were observed in carbons heated to 270°C, and none on those heated to 240eC.
Table 3.0N/Au ratios for activated carbons loaded with
aurocyanide under various conditions and dried atdifferent temperatures
Mass of carbon; 2 ,OgVolume of solution: 30 mlInitial gold in solution: 18000 mg/1Time of constant 24 hrsDrying time 24 hrs
Dryingtemperature
°cNo additives 0,1M KC1 0,1M HC1
60 2,17 2,08 1,4190 1,96 1,95 1,45
120 1,93 1,93 1,36140 2,61 2,17 1,66180 2,05 1,94 1,27240 1,96 2,02 1,32270 2,16 1,81 1,48300 1,58 1,46 1,54
These results suggest that alkaline aurocyanide-loaded carbons exhibit a reasonable stability to thermal treatment at temperatures less than 270°C, whereupon
86

Ati
Au
AU soo'-c
77 65
Fig. 3.12 X-ray diffractograms of activated carbons loaded with aurocyanide in the presence of 0,1M KC1, after heating at various temperatures
87

reductive decomposition to metallic gold begins to occur, being complete at about 300°c. These effects are confirmed by exam" nation of the scanning electron micrographs of the surfaces of the 240°C, 270®C and 300°C heat carbons, shown in Figures 3.13, 3.14 and 3.15 respectively. Metallic gold particles appear white in the micrographs. No gold particles are evident on the carbon heated to 240°C, whereas 2 am particles are observed on the carbon heated to 270*C, and 7am particles on the carbon heated to 300°C. Figure 3.16 shows that spherical particles are randomly distributed throughout the carbon heated to 30Qac. This is in contrast to the dendritic gold particles formed in the pores of activated carbons by the reduction of AuCN. (See Figure 3.3).
It is noteworthy that large quantities of HCN gas have been found** to evolve from a carbon loaded with aurocyanide from 0,1 M KC1 solution at a pH value of 10, upon heating to temperatures above about 300°C. This suggests that a reaction mechanism such as the following may be occurring at these temperatures:
Au(CN) 2 + e" * AU + 2CN’ (Ee - -0,611v) (3.19)
OH 0
-♦-0,286V) (v . 20)
+ AU + 2HCN(f) (3.21)
OH 0
Phenol and carbonyl type groups are known24 to be present on
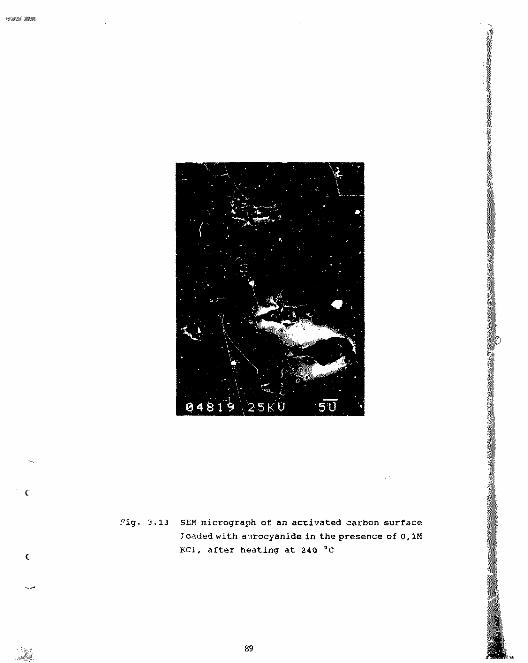
5U '
Fig. 3.13 SEM micrograph of an activated carbon surface Joaded with aurocyanide in the presence of 0,1M KC1, after heating at 240 °C
89

Fig. 3.14 SEM micrograph of an activated carbon surface loaded with aurocyanide in the presence of 0,1M KC1, after heating at 270 °C
90

Fig. 3.15 SEM micrograph of an activated carbon surface loaded with aurocyanide in the presence of 0,1M KC1, after heating at 300 °C
91

Fig. 3.16 SEM micrograph of the activated carbon surface shown in Fig. 3.15, showing the distribution of gold particles
92
activated carbon surfaces, and these would function as hydroquinone and quinone groups, due to the high dagree of conjugation present in the graphitic microcrystallite. Moreover, the standard reduction potential for reaction (3.20) in alkaline solution (E* - + 0,286V) conforms well to the typical value of about + 0,24V found for activated carbons.
The carbon that was loaded in the presence of 0,1 M HC1 showed N/Au ratios of about 1,5 (see Table 3.8), confirming that some degradation to AuCN occurs upon adsorption of aurocyanide from acidic solutions. No major changes in N/Au are observed upon heating. Figure 3.17 shows that similar changes in the X-ray diffractograms to the alkaline-loaded carbons occur, that are also consistent with the formation of metallic gold.
The large quantities of HCN gas that were found9 1 to evolve upon heating loaded carbons, were evident at much lower temperatures (170 °C) when the carbon was loaded with aurocyanide from 0,01M HC1 solution (pH 2), than when a neutral solution was used (300 °C) . Moreover, it was shown earlier that reaction (3.22) occurs at room temperature to 9ome extent:
Au(CN) 2 + H* -* AuCN(i) + HCN(f) {3.22)
The present results confirm this inherent instability of aurocyanide loaded onto activated carbon from acidic solution. The fact that the N/Au ratio remains at abdut 1, 3 even at 300°C indicates that the nitrogen is retained on the carbon. The marked increase in the intensity of the Au° XRD peaks for carbon heated to 300°C (Figures 3.12 and 3.17) , suggests that this nitrogen is not bound to the gold.
Mossbauer spectra of the heated activated carbons are shown in Figures 3.1C and 3.19. A summary c r the Mossbauer parameters for these spectra, along with
93

AU Au
77 65 44 38 26
Fig. 3.17 X-ray diffractograms of activated carbons loaded with aurocyanide in the presence of 0,111 HC1, after heating at various teuperatures
94

VELOCITY IMI/SI
1,7Au Mossbauer spectra of activated carbon 'ded with aurocyanide in the presence of 0, 1M
k c i , and subsequently heated to various temperatures

270 UC
sto10
5z
300 °C
100 55V E L O C I T Y (MM/5)
Fig. 3.19 Expanded view of 117Au Mossbauer spectra shown in Fig. 3.18, showing detail of peaks due to minor species
96

literature values for reference compounds, appears in Table 3.9.
The Mossbauer peaks indicate the presence of metallic gold, KAu(CH) 2 and an AuCN-type species, which is consistent with the occurrence of reaction (3.22). Equation (3.20) is a possible source of the acid that is requirad for this reaction.
Table 3.9Mossbauer spectral parameters for gold species
on activated carbons and gold compounds
Compound ISmm/s
QSmm/s
f Ref.
Aurocyan ide-loaded -1,43 0,00carbon heated to 3,76 9,76240eC 2,46 8,57Au -1,23 0 0,19 39
KAU(CN)2 3,05 9,80 0,015 443,25 10,21 443,10 10,21 443,12 10,21 44
AuCN 2,3 8,0 0,095 39
An indication of the relative amounts of these three species on the carbon is gained by consideration of the recoil-free fractions, or Debye-Waller factors, f, for the corresponding gold compounds (see Table 3.9). Assuming that no change in the f factors occurrs upon adsorption onto carbon, it can be calculated that roughly two per cent of the adsorbed gold is in the metallic form. This is consistent with the SEM and XRD results, which suggested that the adsorbed aurocyanide species is comparatively stable to temperatures as high as 240®C.

The Mossbauer spectra shown in Figure 3.18 are consistent with the other data, in showing that most of the gold is present in the metallic form after heating at 270 °C, and this proportion is farther increased when heated at 300 eC.
Figure 3.19 shows an expanded view of the minor components in the Mossbauer spectra of the carbons heated at higher temperatures. Further evidence for the proposed reaction mechanism is obtained by comparison of the relative ratios of Au(CN) 5 and AuCN-type species. At 270 °C and lower, Au(CN) 5 is predominant, whereas at 300 °C, AuCN is predominant. Reduction of AuCN to the metal is more favourable than reduction of Au(CN), to the metal:
AUCN + e" * AU + CN" (E° - - 0,166 V) (3.23)2AuCN + er * Au + Au(CN), (E° « 0,252 V) (3.24)Au(CN); + e" * AU + 2CN" (E° - - 0,57 V) (3.25)
The Mossbauer spectra provide strong evidence that reduction occurs via an intermediate AuCN-type species. The only other evidence for this type of species has been found when aurocyanide is loaded onto carbon under acidic conditions, am discussed earlier in this Chapter.
e) Relation Between the Effects of Oxygen andIonic Strength on the Adsorption of Aurocyanide onto Activated Carbon
It is useful here to review the twt schools of thought regarding the adsorption mechanism, evident from the most recent literature:
(1) adsorption of aurocyanide without chemical change11#39'62'78#79, and
(2) adsorption of aurocyanide withdecomposition of Au(CN), to AuCN73"7 5,11,92
98
The consensus of opinion of most proponents11 # 6 2 ' 78 '79 of mechanism (1) is that under normal plant conditions, aurocyanide is extracted in the form of an ion pair, M n+[Au(CN)g]n. These conditions typically entail solutions of relatively high ionic strength. It is apparent, however, that all the investigations carried out by the proponents73"75'91#92 of mechanism (2), without exception, employed conditions of low ionic strength, i.e. conditions atypical of those prevailing in a practical plant situation.
Results discussed earlier in this Chapter indicate that different adsorption mechanisms become operative under conditions of varying ionic strength. The present discussion aims to verify this hypothesis and explain this dichotomy in terms of one theory.
The influence of oxygen on the adsorption of aurocyanide onto activated carbon has been reported many times in the literature11'73"75'77#91#92 and several studies have focussed on this aspect alone7 4 ' 9 1. None of these studies have resulted in a complete understanding of all aspects of this effect, while all of them have contributed some useful observations. It is a further aim of the present work to explain this effect in terms of the above-mentioned theory, to explain its relationship to the ionic strength effect, and to demonstrate that oxygen has no effect under practical plant conditions.
The effect of oxygen on the system was first reported by Dixon, et al93, who observed a reduction in the adsorption capacity of the carbon when nitrogen was bubbled through the solution. The effect was enhanced at higher temperatures. No explanation for the observation was profferred. Boehme and Potter94 suggested that in the presence of oxygen an electrochemical reaction occurs, in which the carbon acquires a positive charge to which the
99

negativity-charged Au(CH)j ion is attracted. This is essentially the Frumkin* 6 reaction, originally postulated to account for adsorption of acids onto activated carbon.
Tsuchida and Muir74,75 /*6 proposed that the role of oxygen is to decompose some of the Au(CN); to AuCN by the oxidation of one CN" to CO|" and NH3- Cook’2 reported that the bubbling of oxygen through a solution containing gold-loaded carbon caused potassium ions to desorb and gold to adsorb, and postulated the same oxidative decomposition mechanism to account for the observations.
The most recent study, by Van der Merwe and Van Deventer’1 showed that oxygen is consumed during gold adsorption, but only a small amount cf oxygen is consumed in the absence of gold. Once again, the mechanism post tlated to account for these observations was the oxidative decomposition of Au(CN)g to AuCN.
(i) Adsorption of gold
Figure 3.20 shows the effects of bubbling oxygen and nitrogen through the solution, on the adsorption of aurocyanide onto activated carbon, from a low ionic strength solution (no additives) . The presence of oxygen results in an increase in the amount of gold adsorbed, corroborating the results of previous workers73#75#’2.
Figure 3.21 shows the effect of bubbling the gases through the solution in the presence of 0,1M KC1 (neutral solution). In this instance, there is only a slight enhancement in the rate of gold loading when oxygen is bubbled through the solution.
Figures 3.22 and 3.23 show the effects of bubbling the gases through the solution in the presence of 0,1M KOH and 0,1M HC1, respectively. In both cases, there is no enhancement
100

100 r
80
80
20
Time, h
Fig. 3.20 Effects of oxygen and nitrogen bubbling on the adsorption of aurocyanide onto activated carbon from solution containing no additives. (Carbon mass 1,Og; solution volume 250 ml; initial gold concentration in solution 300 mg/1)
101

100
0 1 2 3 4 20Time, h
Fig. 3.21 Effects of oxygen and nitrogen bubbling on the adsorption of aurocyanide onto activated carbon from 0,1M KC1 solution. (carbon mass 1,Og; solution volume 250 ml; initial gold concentration in solution 300 mg/1)
102

100
80
GO
40
20
Time, h
Pig. 3.22 Effects of oxygen and nitrogen bubbling on the adsorption of aurocyanide onto activated carbon from 0,IK KOH solution. (Carbon mass 1,Og; solution volume 250 ml; initial gold concentration in solution 300 mg/1)
103
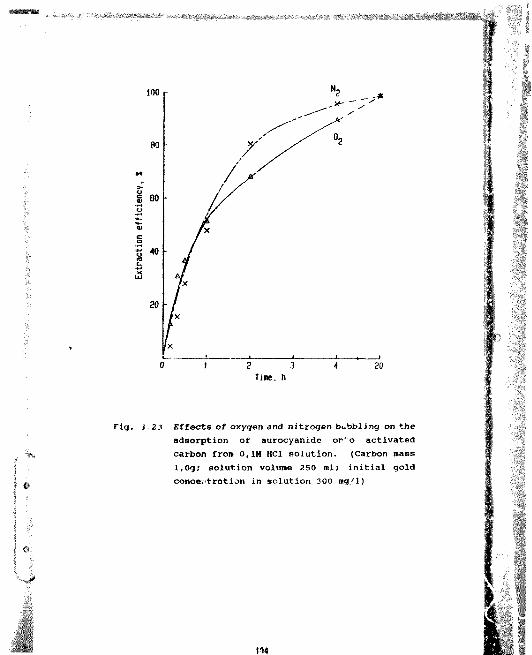
0 1 2 3 4 20Time, h
Fig. j 23 Effects of oxygen and nitrogen bubbling on the adsorption of aurocyanide or'o activated carbon from 0,1M HC1 solution. (Carbon mass l,0g; solution volume 250 ml; initial gold concentration in solution 300 mg/1)

of gold loading In the presence of either gas, and the adsorption rates are very similar;for both 0, and H, over the entire " our period,
(11) dolntlon pm dmmge#
Table 3.10 details the observed pH changes during the course of the above experiments. The pH values of the o, 1M HC1 (pH 1) and 0,1m KOH (pH 13) solutions were found to remain constant throughout the experiment. The pH values of the neutral solutions were found to vary quite substantially, however, larger Increases in pH were observed in the presence of oxygen than in the presence of nitrogen, for both low (no additives) and high (0, 1M KC1) ionic strength solution' Only r’ ight changes in pH (less than one pH unit) were obse. "Sd the 0,1M KC1 solution, whereas more marked pH changes were observed when no additives were present.
Table 3.10Changes in solution pH during the adsorption of aurocyanide onto activated carbon under various
conditions
Time SolutionConditions
pH in solution (apH)
0, N,
03,5
20,0
No additives 7,338,06 (tO,73)*
10.35 (+3,03)
7,277,988,80
(tO,71) (+1,53)
03,5
20,0
0,11$ KC1 5,255,70 (+0,54) 7,11 (+0,35)
6,296,736,75
(tO,44) (tO,46)
Bracketed figures refer to .changes in pH.

The observation that the oH of the solution increases upon adsorption of onions onto activated carbon is not restricted to aurocyanide ions, as shown in Table 3.11, for the adsorption of KCl onto activated carbon in the absence of aurocyanide. In the case of 0,1M KCl, the pH increases only in the presence of oxygen, and a slight decrease in pH was observed when nitrogen was bubbled through the solution.
Table 3.11Change in pH of a 0,1m KCl solution in contact with
activated carbon, in the absence of aurocyanide
Timeh
pH in solution (apH)
Of Nf
0 7,34 7,344 8,11 (tO,77)* 7,00 (-0,34)
24 8,99 (+1,65) 6,95 (-0,39)
* Bracketed figures refer to changes in pH.
(iii) The nature of the adsorbed species
The concentrations of gold and nitrogen on the carbons at the end of the experiments reported in the previous section, are shown in Table 3.12.
For neutral and alkaline solutions, the ratio of nitrogen to gold on the carbon is approximately 2, corresponding to Au(CN);, whereas for 0,1M H O solution, the ratio of nicrogen to gold is ab ut 1,3, whether oxygen or nitrogen are bubbled through the solution.
The various solutions were analysed for NHj, HCOg and
106

Concentrations of nitrogen and gold on carbons
Adsorptionsolutionconditions
Concentration on carbon, mmol/g
0 Z bubbling H 2 bubbling
Au jN Au }N
Ho additives 0,1!! HC1 0,1M KOH 0,1M KCl
0,171 0,174 0,291 0,196 0,232 0,206 0,268 0,263
0,150 0,142 0,295 0,189 0,237 0,210 0,272 0,272
Table 3.13 Concentrations of anions in gold adsorption solutions
Adsorption Concentrat ion in solution, mmol/1
conditions Before loading After loading
n h ; h c o ; CNO" NH; HC05 CN0"
0 ? bubbling No additive 0,1M KOH 0,1H KCl
0,50 0,36 0,10 -a 2,21
0,16 -
<0,06 0,39 0,08 2,56 0,25
#2 bubbling Ho additive 0,1H KOH 0,1M KCl
<0,06 0,26 0,10 1,67 0,20
1 Hot measurable due to high background electrolyte.

CHO" Ly ion chromatography both before and after qdtaorption. These results are presented in Table 3.13, and indicate that no build-up of oxidative decomposition products of Au(CH)} occurs in solution during the adsorption experiments.
<iv) Adsorption of chloride
% e concentrations of chloride on the carbons, after tfc» adsorption experiments, are shown in Table 3.14.
Table 3.14 Concentrations of chloride on carbons
Adsorption solution conditions
Cl concentration on carbon, mmol/g
O; bubbling N2 bubbling
Ho additives <0,0000 <0,00060,1M KCl 0,017 <0,00060,lit KCl? no gold 0,079 0, 051
In the presence of aurocyanide, chloride was found to adsorb onto the carbon only when the solution was oxygenated. A greater amount of chloride was found to adsorb in the absence of aurocyanide and this occurred whether oxygen or nitrogen were bubbled through the solution.
(v) Discussion
The above results corroborate the results presented earlier, which indicated that different reaction mechanisms prevail in regions of low and high ionic
108
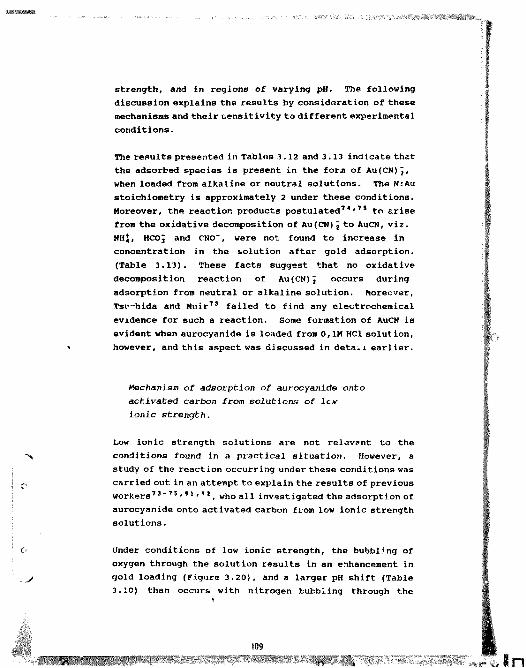
strength, and in regions of varying pH. The following discussion explains the results by consideration of these mechanisms and their sensitivity to different experimental conditions.
The results presented in Tables 3.12 and 3.13 indicate that the adsorbed species is present in the form of AuiCN);, when loaded from alkaline or neutral solutions. The N:Au stoichiometry is approximately 2 under these conditions. Moreover, the reaction products postulated7 4#75 to arise from the oxidative decomposition of Au(CN) , to AuCN, viz. NHj, HCOj and CNO~, were not found to increase in concentration in the solution after gold adsorption. (Table 3.13). These facts suggest that no oxidative decomposition reaction of Au(CN); occurs during adsorption from neutral or alkaline solution. Moreover, Tsv-hida and Muir73 failed to find any electrochemical evidence for such a reaction. Some formation of AuCN is evident when aurocyanide is loaded from 0,1M HC1 solution, however, and this aspect was discussed in detail earlier.
Mechanism of adsorption of aurocyanide onto activated carbon from solutions of lev ionic strength.
Low ionic strength solutions are not relevant to the conditions found in a practical situation. However, a study of the reaction occurring under these conditions was carried out in an attempt to explain the results of previous workers73 -75 '9 *'42, who all investigated the adsorption of aurocyanide onto activated carbon from low ionic strength solutions.
Under conditions of low ionic strength, the bubbling of oxygen through the solution results in an enhancement in gold loading (Figure 3.20), and a larger pH shift (Table 3.10) than occurs with nitrogen bubbling through the

solution. Moreover, the phenomenon is not specific for potassium aurocyanide - the results in Tables 3 .11 and 3.14 indicate that a significant amount of chloride adsorbs from a 0,1m KCl solution onto activated carbon, only in the presence of oxygen, and an upward shift in pH also occurs only in the presence of oxygen.
These observations are consistent with those reported24 for the adsorption of acid onto activated carbon from low acid concentrations (<0,01N) . In that study it was shown that no acid was adsorbed unless oxygen was purged through the system.
Bartel1 and Miller97 observed upward pH shifts upon adsorption of various salts onto sugar charcoal, and postulated a hydrolytic theory of adsorption, which w,. further developed by Steenherg27, who postulated the primary adsorption of protons, with secondary adsorption of anions.
More recently, Jankowska98 has observed pH increases upon adsorption of halogen anions onto activated carbon, in the order
I" > Br" > Cl" > F"
This is the same order as that observed for the extent ofloading of these species onto carbon.
The fact that oxygen and acid both play a role in hydrolytic adsorption of anions onto activated carbon is consistent with an electrochemical re ?tion of the type shown below, which involves reduction of oxygen at cathodic sites on carbon:
02 + 4e~ f 2H,0 * 4OH” (E° - 0,401V) (3.26)0, + 2e" + 2H20 * 20H" + H;0, (E° - -0,146V) (3.27)
110
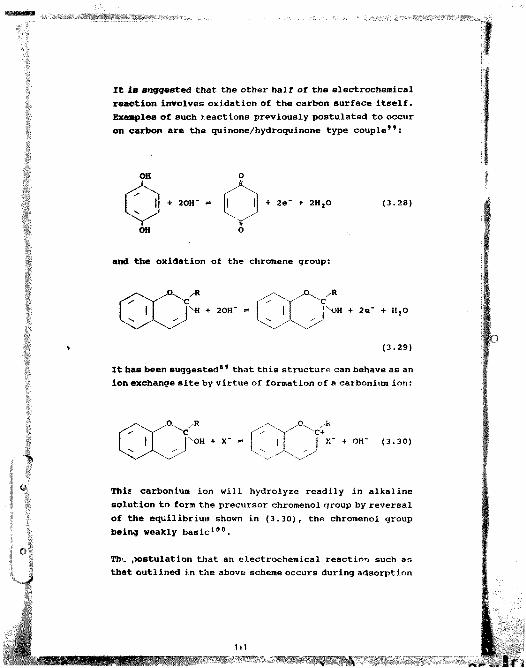
It is sieg^rested that the other half of the electrochemical reaction involves oxidation of the carbon surface itself. Examples of such reactions previously postulated to occur on carbon are the quinone/hydroquinone type couple” :
OH O
OH O
and the oxidation of the chromene group:
(3.29)
It has been suggested61 that this structure can behave as an ion exchange site by virtue of formation of a carbonium ion:
This carbonium ion will hydrolyze readily in alkaline solution to form the precursor chromenol group by reversal of the equilibrium shown in (3.30), the chromenol group being weakly basic*00.
The. postulation that an electrochemical reaction such as that outlined in the above scheme occurs during adsorption

of anions onto carbon from low ionic strength solutions, is consistent with changes in potential that tnke place during adsorption, observed by Hughes, efc al96.
The equilibrium constant for a reaction such as tl-at shown in Equation (3.30), i.e. formation of a carbonium ion from a precursor containing a chromenol group, has been reported101 for pelargonidin 3-monogluccside to be 955:
OH,0HHOHO
(3.31)
It is therefore propos ' that two mechanisms are operative in the adsorption of o^rocyanide from solutions of low ionic strength, and that relative contributions of the two pathways are influenced by the presence of oxygen in solution:
(1) adsorption of Mnt[Au(CN)^]n ion pairs, which occurs to a greater extent in the absence of oxygen, and
(2 ) formation of ion-exchange sites in the presence of oxygen, which coordinate aurocyanide by simple electrostatic ion-exchange.
This mechanism is consistent with several previously published observations: Tsuchida and Muir75 reported K/Au ratios of approximately 1 for deoxygenated carbons, and less than 1 when oxygen was present. Cook** observed desorption of K* ions from loaded carbon upon bubbling

oxygen through the solution. Van der herwe and Van Deventer’ 1 observed that the amount of oxygen consumed varies with oxygen concentration in solution, rather than amount of gold loaded. They observed that no oxygen was consumed in the absence of anions, and that pre-treatment of carbon with oxygen or nitrogen did not result in any enhancement in loading upon contact of pre-treated carbon with aurocyanide solution. Both of these observations are manifestations of the inherent instability of a functional group such as the chromenol product from reaction (3.29). Finally, the 3:1 correlation between oxygen and acid consumptions observed24 for adsorption of acids onto activated carbon from low ionic strength solutions, can be rationalized in terms of reactions (3.27), (3.29) and(3.30), which, upon addition, form tne overall reaction:
+ OH' + 0 2 (3.32)
MGchanism of adsorption of aurocyanide onto activated carbon from solutions of high ionic strength
High ioni - strength conditions are those typically found in practical plant situations; thus it is the adsorption mechanism pertinent to these conditions that holdr tue most practical significance.
In the presence of 0,1M KC1 (Figure 3.21) , the rate of gold adsorption is only slightly faster in the presence of oxygen than when nitrogen is bubbling, in contrast to the large oxygen effects observed in low ionic strength solution.

Small upward pH changes are evident, both in the presence (Table 3.10) and absence (Table 3.11) of aurocyanide. It is noteworthy that chloride was only found to adsorb **c a marked extent in the presence of oxygen, and to a much greater extent when no aurocyanide was present. These results suggest that, as for conventional ion-exchange processes16 2, there is a high selectivity for aurocyanide over chloride. The smaller shift in pH that accompanies gold adsorption from high ionic strength solution is consistent with the fact that a much smaller oxygen effect is evident, and is also consistent with the results presented in section 3.2a, where elemental analyses of carbons loaded from high ionic strength solutions correlated well with the stoichiometry expected for adsorbed KAu(CN) 2 ion pairs.
The results in Tables 3.10, 3.11 and 3.14 suggest that from high ioni strength solution, only a small amount of ion- exchange sites are formed in the presence of oxygen and that virtually no ion-exchange sites are formed in the absence of oxygen. This is a small effect, however, and does not detract from the fact that the mechanism of adsorption of aurocyanide from high ionic strength solution involves adsorption of Mn*[Au(CN)g]n ion pairs, with no significant contribution due to coordination by ion- exchange sites, and this is consistent with the mechanism proposed earlier.
In the presence of 0,1M KOH (Fit,, re 3.22) or 0,1M HC1 (Figure 3.23) , no oxygen effect on the gold adsorption was observed, and no pH shifts were discernible. Under alkaline conditions, a reversal of an equilibrium such as that represented in Equation (3.29) would occur, thereby eliminating any ion exchange sites.
The lack of an oxygen effect in the case of the acidic solution is consistent with the theory of adsorption of acids from high concentration solutions, which is
114

postulated24 to occur predominantly by adsorption, rather than ion-exchange. This is also consistent with the conclusions arrived at previously78, that aurdnyanide adsorbs primarily as HAu(CN) % from acidic solutions, with some decomposition to AuCN also occurring.
f) X-ray Photoelectron Spectroscopic Study ofAdsorbed Gold Species on Activated Carbon
In most previous work on the mechanism o: adsorption, little attention has been given to the nature of the interaction between adsorbed gold species and activated carbon substrate. Adams efc al6 2 provided evidence ftcm electron spin resonance (ESR) spectroscopy for a cha*-ge- transfer interaction between the highly delocalized carbon and vacant orbitals in the gold complex. The basis for this conclusion was reduction in total unpaired electron concencration with increasing gold loading. This postulation is consistent with the apparent reduction in oxidation state of the gold nucleus, as suggested from the results of X-ray photoelectron spectroscopic (XPS) studies32'79'103, and also with this slight increase in charge density around the gold nucleus, as measured by Mossbauer spectroscopy. (See sectim 3.2c).
The nature of the bonding interaction also plays a significant role in activated carbon - supported gold chloride catalysts104 for the hydrochlorination of acetylene. There is thus a need to establish the mechanism of bonding to carbon for each of the gold species Au(CH) j, AuCN and AuClj. The aim of the present study was firstly to clarify this aspect, and secondly to elucidate the sources of the many inconsistencies in previous XPS studies3 i-7S,io3 ,io5-iio of g0id species, whiC will be discussed in detail in this section.
115

(i) Inconsistencies in previous XPS investigations of gold compounds and adsorbed species
Table 3.15 shows results of previous XPS investigations of gold compounds and adsorbed species, together with the referencing method adopted by each group of researchers, ”here reported. In the majority of cases3 theobserved binding energy for adsorbed aurocyanide species is reported to lie between those of metallic gold (about 83,6 eV) and KAu(CM) 2 salt (about 85,3 eV) ; however. Cook efc al.110 report binding energies of between 85,6 and 86,0 eV for the adsorbed species, which lies outside the range mentioned above, indicating a gold oxidation state greater than 1 ,0 . Moic~-'er, the absolute values of binding energies in Table 3.'5 are spread over a range of 0,7 eV, even for the crystalline compounds. The results of McDougall, ec al32 lie far out of the range of the other results. The reason for these discrepancies lies in the variation of the choice of referencing system adopted by different researchers. It is evident from Table 3.15 that despite the fact that there is general consensus that the spectra are referenced against the carbon (Is) peak, there is no consistency in the choice of either the source of carbon or the absolute value that is to be assigned to this peak. Sources of carbon used include activated carbon110, eflon107, "hydrocatbcn oil contamination" 103'108 and the
cyanide ligand79. The latter choice was not used in the present study, because the electron density cround the cyanide carbon, and hence the binding energy (BE), is likely to be a ■ tered drastically upon adsorption by charge- transfer interaction, which is the adsorption mechanism advocated by sevetal researchers62#79.
The binding energy of the carbon (Is) peak is also dependent on the type of carbon present. For example, Konno11 2 cites the C(ls) binding energy for hydrocarbon oil as 284,8 eV, for methyl carbon as 285,1 eV and for methylene carbon as

M S
ilPi*jjoJo
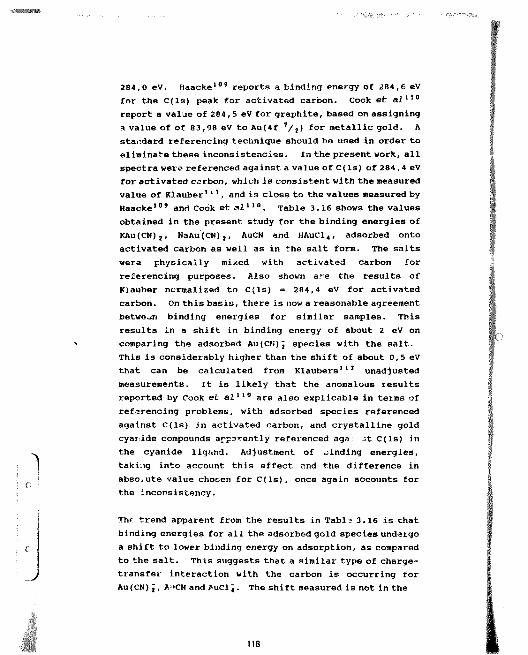
284,0 eV. Haacke109 reports a binding energy of 284,6 eV for the C(ls) peak for activated carbon. Cock et al 110 report a value of 284,5 eV for graphite, based on assigning a value of of 83,98 eV to Au(4f 7/ 2) for metallic gold. A standard referencing technique should be used in order to eliminate these inconsistencies. In the present work, all spectra were referenced against a value of C(ls) of 284,4 eV for activated carbon, which is consistent with the measured value of Klauber111, and is close to the values measured by Haacke109 and Cook efc al110 . Table 3.16 shows the values obtained in the present study for the binding energies of KAu(CN)2, NaAu(CN)2, AuCN and HAuCl4, adsorbed onto activated carbon as well as in the salt form. The salts were physically mixed with activated carbon for referencing purposes. Also shown are the results of Klauber normalized to C(ls) = 284,4 eV for activated carbon. On this basis, there is now a reasonable agreement between binding energies for similar samples. This results in a shift in binding energy of about 2 eV on comparing the adsorbed Au(CH) 2 species with the salt. This is considerably higher than the shift of about 0,5 eV that can be calculated from Klaubers113 unadjusted measurements. It is likely that the anomalous results reported by Cook efc al110 are also explicable in terms of referencing problems, with adsorbed species referenced against C(ls) in activated carbon, and crystalline gold cyaride compounds apparently referenced aga st C(ls) in the cyanide ligand. Adjustment of binding energies, taking into account this effect and the difference in absolute value chosen for C(Is), once again accounts for the inconsistency.
The trend apparent from the results in Tabl3 3.16 is that binding energies for all the adsorbed gold species undergo a shift to lower binding energy on adsorption, as compared to the salt. This suggests that a similar type of charge- transfer interaction with the carbon is occurring for Au(CN) 2 , A’tCN and AuCl j . The shift measured is not in the
118


C(ls) binding energy of the activated carbon that may be postulated to arise from a gold-carbon interaction, because such an effect would be enhanced with increasing gold loading. Ths consistent chemical shift evident at different gold loadings reaffirms the postulate that the point of reference is invariant.
It is noteworthy that shifts in binding energies of Zn and Ni have been observed114 on adsorption of their complex cyanides onto activated carbon. These results hav * also1 1 4 '11 5 been interpreted in terms of a charge-transf er interaction with the surface.
(ii) Mechanisms of adsorption of gold cyanides onto activated carbon
The binding energies for gold on carbors that were loaded from 0 ,1M cyanide solutions of lithium, sodium and potassium do not fall into a consistent trend, as shown in Table 3.16. However, previous work* 2 has demonstrated that the type of cation present has a significant influence on extent of gold loading, and moreover, the trends observed in the adsorption of Mn*[^(CN)g]n salts onto activated carbon were very similar to those observed in the extraction of aurocyanide by polymeric adsorbents and solvents. Moreover, adsorption of aurocyanide and cations from high ionic strength solution was shown in section 3.2a to be stoichiometric, indicating adsorption of species such as KAu(CN) 2 and Ca[Au(CN)2]2.
The presence of discrete ion pairs would be expected to result in shifts in the Au(4f 7/ 2) binding energies for different cations, which was not observed. Moreover, this configuration would result in an asymmetric surface binding state for nitrogen, which, as was pointed out by Jones efc a! 111, js not the case. It is possible that all of the above recruits can be explained in terms of the separate
120

adsorption of anion and cation, with the cation solvated by the oxygan - containing functional groups that lire the pore, in a manner akin to the strong solvation of cations by crown ethers116 and by poly(oxy^thylene) chains (See section 4.6), as shown in Scheme 1.
0.IK \ <)
N S C - AU - C E N ...... Ha*O'IIR - C 1
Scheme 1
It is also most likely that the Au (4f 7/ 2) binding energy is not sufficiently sensitive to establish such subtle differences, given the fact the adsorbed Au(CN) j and AuCN species have such similar binding energies. (See Table3.15).
The binding energy for gold on a carbon that had been boiled in hydrochloric acid (4 per cent by mass) for 5 hours had also decreased in relation to that of polymeric AuCN (Table3.15). The Mossbauer spectroscopic study presented in section 3. 2c suggested that much of the gold is in a N.. . Au - C electronic environment after this treatment, and the N binding energies of aurocyanide - loaded carbons subjected to room temperature acid treatment have shown71 an asymmetry. This is consistent with the postulate of Klauber7*, that short-chain AuCN oligomers also adsorb onto the carbon surface by a charge-transf er interaction, as depictud in scheme 2 .
N = C - Au ~ C = N ..... Au - C = N ...... - C B N— - - - ,- 1- - - - - - - - J _ _ _ _ _ fScheme 2
121

A comparison of K(2p), Na(2p) and N(ls) binding energies between the adsorbed KAu(CN) 2 and NaAu(CN)2, and their crystalline salts, appears in Table 3.17, together with data frotii the literature, corrected in a manner similar to that described earlier. The value of BE for K(2p) for adsorbed KAu(CN) 2 could not be obtained in the present work, due to its close proximity to the strong C(ls) peak.
It is evident from Tables 3.17 and 3.15 that all the atoms present in the adsorbed complexes, viz. Na, K, Au and N, undergo decreases in binding energy upon adsorption onto carbon, as compared with their crystalline salts. This is consistent with the mechanism schematically depicted above, with charge being transferred via the % orbitals of the Au(CN)j complex. Metal-to-ligand change-transfer transitions (Au 5d -» CN") have been shown to occur in Au(CN)2, by electronic and Mossbeuer spectroscopic measurements117. The bonding mechanism involves a d- orbital participation in Au-C <r-bonding, and in both w-donor and H-acceptor bonding with the CH~ ligand. Moreover, weak Au....Au bonding has been shown118 to occur between gold(I) atoms of d 10 configuration in certain mononuclear and polynuclear gold(I) compounds. The interaction
L — Au — L L - Au - L + L - Au - L «— » ;
L - AXi - Loccurs perpendicular to the principal axis of the linearly coordinated gold(I) atoms. It is postulated that a similar interaction is occurring between Au(CN)2 and activated carbon. It is also evident that sodium induces a greater shift in the N(ls) binding energy than does potassium, and this is consistent with the greater polarizing power of the smai.«t=r cation. The result is also consistent with the enhanced extraction62 of NaAu(CN) 2 onto carbon, as compared with KAu(CN)2. The fact that a cationic effect is observed on the N(ls) binding energy and
122


not the Au(4£ 1 /%) t is probably related to the fact that the interaction beteen cation and nitrogen is a direct one. The lack of asymmetry observed in the N(ls) spectrum could be due to the fact that the interaction is a weak one, as depicted yj the long N.. .Na bond in Scheme 1 above. It is also explicable in terms of a scheme whereby both ends of the aurocyanide ion, on average, are coordinated to cations, resulting in a symmetrical configuration. An example of such a system is that deduced from the crystal structure11 * of KAu (CM) 2, in which the potassium cation is coordinated by the nitrogens of the cyano groups. Finally, it should be noted that the measurements reported in this sectiin were all made under conditions of ultra- high vacuum, and it is uncertain whether this aspect has an effect on the results. The charge-transfer mechanism is independently supported, however, by the slight upward shift in the Mossbauer parameters of adsorbed aurocyanide species.
(jii) Mechanism of adsorption of gold chloride onto activated carbon
The Au(4f 7/f) binding energy for adsorbed AuCl, species on activated carbon is once again lower than that for the crystalline salt. A charge-tiansfer interaction between carbon surface and gold atom is possible because AuCl^ has a square planar conformation, and can therefore adsorb essentially flat on the surface.
An interesting difference arises when AuCl, is adsorbed from an oxidizing medium (aqua regia) , as opposed to a nonoxidizing medium (1,0M HCl), as is evident from a comparison of the Au(4f 1 / 1) X-ray photoelectron spectra, shown in Figure 3.24. The AuCl^ that was loaded under oxidizing conditions shows only one, well-defined, oxidation state, whereas that loaded from l,OMHCl solution shows two oxidation states, one of which is consistent with
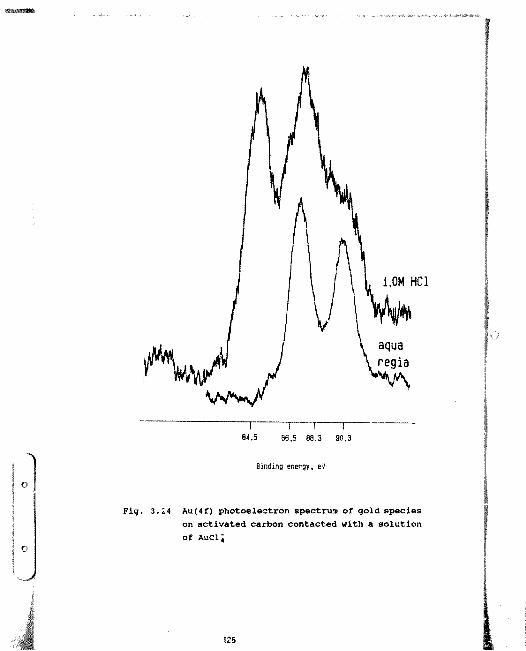
l.OM HCl
aquaregia
84,5 86,5 88,3 90,3
Binding energy, eV
Fig. 3.24 Au(4f) photoelectron spectrum of gold species on activated carbon contacted with a solution Of AUCI4

metallic gold.
J
The reduction of AuCl^ to metallic gold by activated carbon is t well known phenomenon12 0/*21. However, Mossbauer spectroscopic studies p esented later in this Thesis show the presence of some adsorbed AuCl j species. The fact that it is possible to adsorb AuCl 4 onto activated carbon with no reduction to the metal is a novel result that hms significance in the above-mentioned catalytic process, where it is the gold in the higher oxidation state that has been postulated104 to give rise to the active species. The relevant reduction half-reactions are shown below, and confirm that reduction to the metal, rather than to AuCl,, is likely to be effected by a typical activated carbon (E® -0,24 V, versus the standard hydrogen electrode)32:
AuCi; + 3e~ Au° + 4C1* (E9 = 1,0V) (3.33)AuCl4 + 2e~ * AuCi; + 2C1" (E° « 0,0V) (3.34)AuCl2 + e" ^ Au6 + 2C1“ (E° = 2,0V) (3.35)
It is of interest to compare the binding energy of gold foil reference material (84,2 eV) with that of the metallic gold component loaded onto carbon (84,6 eV). Fritsch108 hasnoted on increase in binding energy of metallic gold with decreasing particle size, and the present results are consistent with this explanation.
Finally, there are some interesting effects present in the spectrum of the HAuC14 salt. The salt was mixed physically with activated carbon for the purpose of referencing, as described earlier. The Au(4f 1/ 1) spectrum is shown in Figure 3.25, and shows that both HAuCl, (BE =88,2 eV) and metallic gold (BE = 84,6 eV) are present. The relatively high binding energy of the latter is consistent with the presence of very small gold particles108. The fact that the yellow salt was still visible confirms? that the higher binding energy peaks are attributable to the crystalline salt itself, rather than the adsorbed species. The sample
126
In

I o
85,2 18,8 90,0 82,5
Binding energy, eV
Fig. 3.25 Au(4f) photoelectron spectrum of HAuC14 salt in physical contact with activated carbon
127

appeared to be stable under the conditions of UHV as compared with a similar sample which when exposed to the atmosphere, rapidly blackened, indicating reduction to the metal.
Another aspect of the reduction reaction under conditions of UHV is evident from the XPS spectra shown in Figures 3.26 and 3.27. Figure 3.26 shows the C(lsi spectra for the physical mixture of HAuCl4 , the adsorbed AuCl 4/Au0, and an unreacted carbon sample. The physically mix'sd sample shows the presence of two types of carbon on the surface, whereas the adsorbed sample remains unchanged, as compared wiwi the blank carbon. Figure 3.27 shows that the concentration of oxygen peak on the surface of the carbon, as measured by the intensity of the 0 (ls) peak, is much depleted, whereas that of the adsorbed sample is much the same as . r the unreacted carbon. It is suggested that under UHV conditions, it is the chemisorbed oxygen on the carbon surface that reacts with the gold chloride, resulting in a reduced form of carbon also being evident from the XPS measurement.
g) Fourier Transform Infrared Spectroscopic Studyof Adsorbed Aurocyanide Species on Activated Carbon
The only other reported infrared spectroscopic study of gold-loaded carbons91 suffered from the fact that the spectrum of the virgin carbon12 2 was inconsistent and could thus not be used as a baseline. The assignments of r(CN) bands in that work to Au(CN) % and AuCN are therefore dubious, being lower in intensity than most of the background peaks.
Clark et al123 reported r(CN) for CuCN-loaded carbons at very high concentrations, and concluded that the species was present in the form of a surface-stabilized Cu*Cu(CN) 5
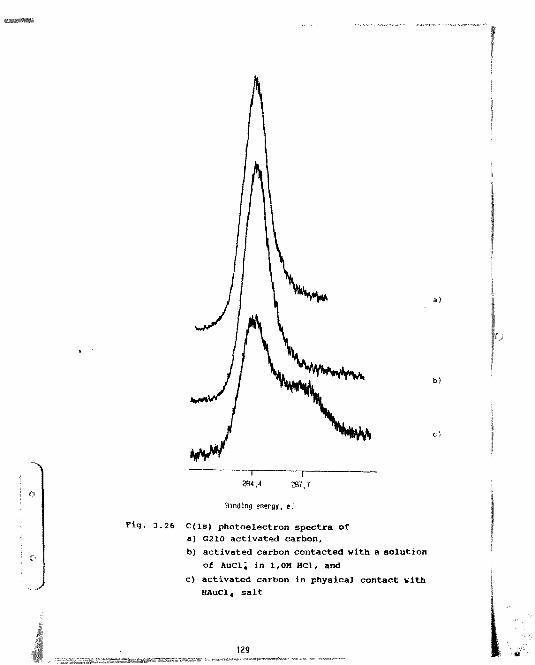
284,4 287,7
Binding energy, e.'
Fig. 3.26 C(ls) photoelectron spectra ofa) G210 activated carbon,b) activated carbon contacted with a solution
o f AuCl^ in 1,OM HCl, andc) activated carbon in physical contact with
HAuCl4 salt

''"‘N w V368 4 380^
Binding energy, eV
Fig. 3.27 O(ls) photoelectron spectra of
a) G210 activated carbonb) activated carbon contacted with a solution
of AuCl^ in l,OM HCl, andc) activated carbon in physical contact with
HAuCl,, salt
130

species.
This section aims at presenting the results of the first self-cons i stent infrared spectroscopic study of aurocyanide-loaded activated carbon, and at contributing to further clarification of the adsorption mechanism.
To obtain absorption bands with significantly high signal- to-noise ratios, it proved necessary to load carbons up to somewhat higher levels (10 to 20 per cent Au) than those normally achieved in practice (1 to 2 per cent Au). Jones efc al111 have shown that a consistent adsorption isotherm is obtained o\er a range of between 2 and 60 per cent Au, that covers both of these concentration ranges. This suggests that the present results have general application. Moreover, the XPS studies presented in the previous section and elsewhere79 have also examined this wide range of concentration, and it is of interest to compare the results of the two techniques.
(i) Effect of gold concentration on the carbon
The infrared peutra of carbors loaded from KAu(CN), solution in the presence of excess KC1, are shown in Figure 3.26. The background spectrum of virgin carbon is clearly evident in the spectra of the loaded carbons. The presence of c oand at about 2140 cm-1 provides unequivocal evidence for the presence of Au(CN) ~2, and the absence of any band in the 2250 to 2200 cm-1 region suggests that no AuCN is present, as shown by comparison of /(CN) bands in Tables 3.18, 3.19 and 3.20. Both spectra are consistent with the presence of two distinct species, that adsorb at about 2138 cm-1 and 2142 cm-1, respectively. Moreover, it is evident that similar spectra are obtained over this range of loading concentrations.

Wavenumbers,
Fig. 3.28 Infrared spectra showing the CN stretch bands of KAu(CN) 2 on activated carbon at various concentrations. (Drying conditions : 25#C, in vacuo)

Table 3.18Infrared spectral data for solid aurocyanide salts
salt r(CN), ere" 1 Ref.
KAu(CM), 2146 1242212 125
LiAu(CN), 2152 1262159 90
NaAu(CN) 2 2154 126,90KAu(CN)g 2140 126
2141 1272142 90
CsAu(CN) 2 2159 90
NH4AU(CN) 2 2134 902139 126
BU,AU(CN)* 2140 90
Be[Au(CN>2J2 2165 90Ca[Au(CN)232 2162 90
12142
AuCN 2239 128AgAu(CN) 2 2209 126
TlAu(CN) 2 Z21432136 12612125
133

Table 3.19Infrared spectral data for aurocyanide species in
solution and adsorbed on ion-exchange resins
Condition v (CN) , cnT1 Ref.
Agnews solution HAU(CN)% 2147 124KAu(CN) 2 2147 127
LiAu(CN); 2145215221722177
Chapter 4
NBu 4Au (CN) 2145 Chapter 4l-Methvl-2-PYrrolidinone solutionNaAu(CN) 1 2143 126KAu(CN) 2 2142 126
Dowex A-l + Au(CN); 2138 127IRA-400 + Au(CN); 2142 90DOW XF-4149 + Au(CN)2 2142 90

Table 3.20Infrared spectral data for aurocyanide species
adsorbed on activated carbon
Cation Gold on loaded carbon,
%Dryingconditions(24h)
r(CH) cm-'
K* 13,2 25*C, in vacuo (21422137
K* 8,6 25*C, in vacuo (21422138
Ca* 18,9 25"c
25°C, in vacuo 120°C
(2140215621402141 2156
9,2 25®c, in vacuo 120°C
21402142
Caz* 21,8 25*C (21562141
(S)(IB)
25°C, in vacuo f 2143 2162 2152 2167
(8)(sh)(sh)(sh)
1209C (2143216321512165
(s)(sh)(sh)(sh)
Li* 19,7 25»C (214221572168
(s)(s)(m)
250C, in vacuo 214221522168
(s)(sh)(sh)
120*C 214321512170
(s)(sh)(m)
9,3 25°C, in vacuo 214221602169
(s)(sh)(m)
135

(ii) Effects of cation and drying conditions
Infrared spectra of an activated carbon loaded with aurocyanide from Cs* solution and dried under various conditions are shown in Figure 3.29. The strong band at 2140 cm" 1 that is evident after drying at 25°c decreases in intensity with relation to the band at 2156 cm-1 as the carbon is dried at higher temperatures. The 2156 cm'1 band is assigned to the solid CsAu(CN)2 salt (see Table 3.18) . The reason why only one band is observed in the case of KAu(CN) 2 (Figure 3.28) is that the KAu (CN) 2 salt absorbs at a very similar frequency (2141 cm'1) to that of the free Au(CN); (2142-2147 cm-1) and to that of Au(CN); loaded onto anion-exchange resins (2142 cm-1).
Neither K* nor Cs* have sufficient polarizing power to significantly perturb the bonding within the aurocyanide anion. It is only small cations such as Li* that undergo a sufficiently high degree of orbital overlap with Au(CN)2 to result in shifts in y (CN) , as evidenced by the spectra of LiNCS in organic solvents129. The present results are thus also consistent with the presence of K+AufCN)* and Cs*Au(CN) g ion pairs on the wet activated carbon surface.
Figure 3.30 shows that at a somewhat lower concentration of gold on the carbon, only one band, at 2140 cm*1, is observed, even after drying the carbon at 1206C for 24 hours. This is consistent with the assignment of the 2156 cm-1 band to solid CsAu(CN)2 salt, which evidently only occurs at very high gold loadings, and only on dry carbons.
Infrared spectra of an activated carbon loaded with aurocyanide (19,7 per cent Au) from Li* solution and dried under various conditions are shown in Figure 3.31. A strong band at 2142 era"-1 is evident in ail of the spectra. However, under drier conditions, the additional bands at 2154 cm-1 and 2170 cm-1 become more evident. Figure 3.32 shows that a similar spectrum is obtained even at a much
136
25"%in vacuo
' W
Wavenumbers,
Fig. 3.29 Infrared spectra showing the CN stretch bands of CsAu(CN)2 on activated carbon after drying under various conditions. (18,9 per cent Au on carbon)
137
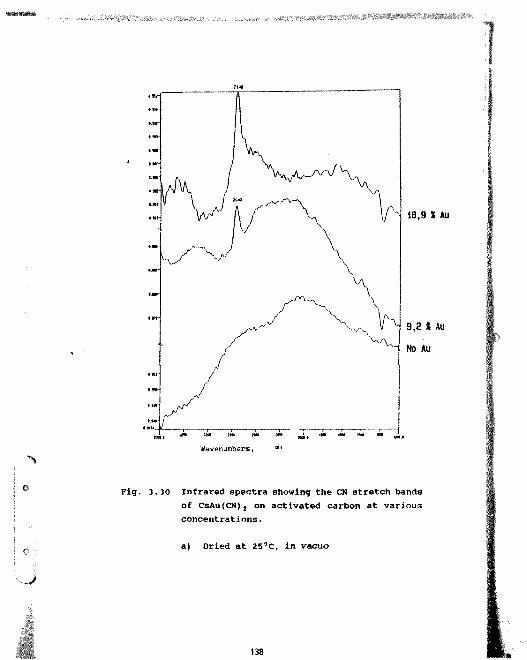
o
18,9 % AU
No Au
Wavenumbers,
Fig. 3.30 Infrared spectra showing the CN stretch bands of CsAu(CN)2 on activated carbon at various concentrations.
a) Dried at 25°C, in vacuo
138

Wavenumbers
Fig. 3.30 Infrared spectra showing the CN stretch bands of CsAu(CN) 2 on activated carbon at various; concentrations.
b) Dried at 120®C
139

c
25uc: in vacuo
25 C
No Au
Wavenumbers, *"t
Fig. 3.31 Infrared spectra showing the CN stretch bards of LiAu(CN) 2 on activated carbon after drying with various conditions. (19,7 per cent Au on carbon)
M O

1
19,7 % AU
9,3 X Au
Wavenumbers,
Fig. 3.32 Infrared spectrum showing the CN stretch bands of LiAu(CN)t on activated carbon at various concentrations. (Drying conditions : 25eC, in vacuo)
H I

lower loading of gold on the carbon (9,3 per cent Au) . Work to be presented in Chapter 4 shows that a similar pattern of r(CN) bands arise from solutions of LiAu(Cli)2 in certain organic solvents, as shown in Figure 3.33 for LiAu(CN), in methyl ethyl ketone. In this instance, the bands are assigned (see Chapter 4) to the free ion or solvent- sepaiated ion pair (2145 cm"1), contact ion pair (2152 and 2177 c b ~1) and contact dimer (2172 cm*1) . The spectra in Figure 3.30 for LiAu(CN)2 on activated carbon are not easily attributable to the formation of the solid LiAu(CN), salt, since this would not explain the marked enhancement in the 217n cm"1 peak intensity under drier conditions. Moreover, LiAu(CN) , is soluble130 to the order of 7 mol/1 in water, and ir very hygroscopic. The effect of drying on the spectrum is thus postulated to be due to more favourable conditions for ion association when less water is present, rather than to the precipitation of solid LiAu(CN)2 salt, and the fact that the spectrum remains unchanged at lower gold loadings, in contrast to the situation with CsAufCN) 2, is also consistent with this suggestion. Moreover, activated carbons tend to rapidly adsorb atmosphere moisture24. High-temperature activated carbons are well known24'131 to contain ,* preponderance of oxygen- containing functional groups such as phenols and carbonyls and these would undoubtedly be able to solvate species such as LiAu(CN)2 in a manner akin to that of solvents such as methyl ethyl ketone.
Infrared spectra of an activated carbon loaded with aurocyanide from Ca2t solution and dried under various conditions are shown in Figure 3.34. The spectra are complex, with bands at 2143, 2153, 2162 and 2168 cm™1 being present in the dried carbons. The binds at 2143 and 2162 cm' 1 are assigned to the solid Ca(Au(CN) 2] 2 sale, and those at 2ir>3 and 2168 cm"1 are possibly manifestations of ion association offects. The 2143 cm*1 band probably also contains a component due to free Au(CN) 2 ions. The fact that the 2162 and 2168 cm* 2 bands are absent in the spectrum

j 0.C29 N Jf " | U
M iI SolYMt {{;/( g M ll I I'"SWrffiHNi!'L j_ i: j_ L _ L _ L .u L L L U ii i l :J i iL
Wavenumbers,cm
Fig. 3.33 Infrared spectra showing the CN stretch bands of LiAu(CN)2 in methyl ethyl ketone at various concentrations

25 C; in vacuo
25 C
No Au
Wavenumbers,
Fig. 3.34 Infrared spectra showing the CN stretch bands of Ca[Au(CN)aj 2 on activated carbon after drying under various conditions. (21,8 per cent Au on carbon).
144

of the carbon dried at 25‘,C, is consistent with this assignment.
3.3 Mechanisms of Adsorption of Other ComplexMetal-ion Species onto Activated Carbon
An important t^st of the ion-pair mechanism of adsorption of aurocyanide species onto activated carbon is its applicability to other adsorption processes, as well as to the adsorption of other complex metal-ion species onto carbon. In previous work80'132'133 , aurocyanide was proposed to be adsorbed onto polymeric adsorbents by a similar mechanism, and more recently134 onto certain weak- base ion-exchange resins from alkaline solution by an ion- pair mechanism. In studies of adsorption of the complexes of gold with thiourea135 and thioc/anate1 36 onto activated carbon, the evidence indicates that both species are adsorbed as ion pairs. This conclusion is particularly interesting in the case of the gold thiourea complex, which is positively-charged, having the form Au<SC(NHi12)J.
3) The Mechanism of Adsorption of Au{CN)}onto Activated Carbon
The adsorption of the gold (III) cyanide species, Au(CN),, onto activated carbon, has thus far never baen reported. This species is not normally present in gold plant leach liquors, but a study of the adsorption of Au(CN) onto carbon was undertaken to obtain further insight into the mechanism of adsorption of Au(CN)g onto carbon, and to explain the high degree of selectivity of Au(CN); over other anions.
145

(i) Adsorption of An(CN); and Au(CN)\ ante activated carbon
Extraction efficiencies of the two species by activated carbon in the presence of various cations, are shown in Table 3.21.
Effects of cation type and ionic strength on extraction of AufCN) ̂ closel y parallel those for Au(CN) \, and are also consistent with the adsorption of an ion-pair species:
Mn* (aq) + n Au(CN); (aq) * M"‘[Au(CH);]„ (ads)(3.36)
Table 3.21 Extraction of Au(CN); and Au(CN); by
activated carbon
Conditions: Carbon mass 0,25gSolution volume 100 mlInitial gold in solution 300 mg/fIonic strength 0,1 mol/kg
LoadingConditions
Extraction Efficiency, % ( / o , i g)
After AufCN);
1 hourAu(CN);
After Au(CN) 2
20 hours Au(CN);
No Additives 8,3 8,8 16,4 26,80,1 M KC1 13,2 13,3 27,8 32,10,033 M CaCl, 17,4 15,9 32,7 35,80,1 M HCi 33,1 53,1 79,4 99,3
At increased Mn* concentrations, the equilibrium is shifted to ti,e right, resulting in enhanced adsorption. The trend of increasing adsorption in the sequence.
146

no additive < K* < Ca1* < H*
is also consistent with an ion-pair mechanism, as discussed previously6 3.
Extraction efficiencies for Au(CN) 4 are consistently higher than those for Au(CN)j, both after one hour and twenty hours. This is once again consistent with the ion- pair mechanism68, because larger ions, such as Au(CN)4, tend to be less hydrated and more polarizable, and both of these factors impart a greater affinity for ion-pair extraction into a hydrophobic phase. A similar enhancement of Au(CN)^ extraction over AufCN), extraction, as an ion pair of tetrahexylammonium into hexone, is demonstrated in Table 3.22. In fact, the sequence of extraction
AufCN) ; > Ag(CN) j > Zn(CN)V > NifCN)^
is also similar to that reported11 for the adsorption of these ions onto activated carbon.
Table 3.22Extraction constants for complex cyanides from aqueous solution at 25*C by tetrahexylammonium
erdmannate in hexone (After Irving and Damodaran137)
Anion, X~ Extraction constant Kx_
Au(CN); 165Au(CN)2 15,8Ag(CN); 0,38Zn(CN)V 4,5 X 10-*Ni(CN)V 0,11 X ID* 4
147

(11) Nature of the adsorbed species
The Au (CN) ̂ Ion has a formation constant fl4 - 10s6 and is thus exceedingly stable. From basic thermodynamic data, the following standard reduction potentials can be calculated!:
Au(CN); + 3e~ * AU + 4CN" (3.37)(E° = -1,81V)
AU(CN); + 2e~ * AU(CN); + 2CN" (3.38)(En ” -1,24V)
These values can be compared with that for tha Au(CN) I ion,
Au(CN); + e' * Au + 2CN~ (3.39)(E° - -0,61V)
as well as the value of E* - 0,24 V found32 for typical activated carbons. It is therefore unlikely that reduction of adsorbed Au(CN)^ species occurs.
Analyses of carbons loaded with Au(CN) \ under neutral and alkaline conditions for potassium, geld and nitrogen are shown in Table 3.23 below:
Table 3.23 Analyses of Au(CN)% loaded carbons
Loading Concentration, mmol/gConditions K Au N/4
0,1M KC1 0,307 0,219 0,2240, IK HCI - 0,194 0,183
148

Adsorption of chemically unchanged KAu(CN), and HAufCN)4 species is indicated from these results. This is consistent with the ion-pair mechanism, shown in Equation(3.36).
Table 3.24Values of isomer shift (IS) and guadrupole splitting
(QS) for Mossbauer spectra of gold samples
Absorber ISmm/s
QSmm/s
Ref.
Carbons
Carbon loaded withAu(CN); from 0,1M KCl 4,03 7,18 This workCarbon loaded withAu(CN>4 from 0,1M HCI 4,10 7,02 This workSample 1, boiled in 3,30 9,93 This work4% HCI for 4 hours 2,73 8,78
3,48 5,90Reference spectra
KAu(CW), 4,2 6,9 42f3,05 f 9,80 44
KAu (CN) 2 3,23 10,213,10 10,213,12 10,21
AuCN 2,3 8,0 39KAu(CN)2C12 2,56 5,26 42
2,05 Zl,26 42KAuCl, 2,02 1,11
1,65 U,27 44HAuCl4 .4H20 1,87 0,94 42Au 1,23 0 39
Mossbauer spectra of the samples appearing in Table 3.23, viz., loaded from 0,1M KCl and 0,1M HCI solutions, are shown
149
in Figures 3. 35 and 3.36 respectively. Values of IS and QS for these spectra, together with some relevant literature values, are shown in Table 3.24.
Comparison with literature values for the Mossbauer parameters of crystalline KAu(CN)4 provides further evidence that the only adsorbed species is in the form of A u ( C M ) w h e n loaded from both neutral and alkaline solution. The slight asymmetry can possibly be explained by the adsorption of the species over a range of active sites on the carbon surfaces.
Additional information can be obtained from the Mossbauer spectrum of a carbon loaded with Au(CN)4 that was subsequently boiled in 4'* HC (See Figure 3.37) . At least three sets of quadrupoles were required to fit the spectrum satisfactorily. The most intense guadrupole has values of IS and QS that lie between those for Au(CN), and Au(CN)2C15 (See Table 3.24) and it is likely that a better fit would be obtained if both of these quadrupoles were assigned to it. The two less intense guadrupole splittings have parameters that correlate well with those for crystalline KAu(CN)2 and AuCN. The acid treatment thus results in a complex mixture of gold(III) and gold(I) species, viz Au(CN)2Cl'2, Au(CN) AufCN); and AuCN, the relative amounts of which are uncertain, due to uncertainties in Debye-Waller factors of adsorbed species. The following set of reactions could account for this cb'-srvation:
AU(CN); + 2H* + 2C1~ -» Au(CN),Ci; + 2HCN(»)(3,40)
Au(CN),Ci; + 2e" * AU(CN); + 2C1~ (3.41)
AU(CN); + H* » AuCN + HCN (») (3.42)
The ratio of nitrogen to gold on the acid-boiled carbon was
150

TRAN
SMIS
SION
(%)
99.2
99.4
99.6
99.8
100.0
- 1 0 -5 0 5 10V E L O C I T Y (MM/S)
Fig. 3.36 Mossbauer spectrum of activated carbonloaded from Au(CN)4 solution containing 0,1M KCl
151

zo
01 O)z<cO ' to
V E L O C I T Y (MM/S)
Fig. 3.36 l,t*u Mossbauer spectrum of activated carbon loaded from Au(CN); solution cortaining o, 1M HCI
152

TRAN
SMIS
SION
(%)
99.4
99.6
99.8
100.0
-10 -5 0 5 10V E L O C I T Y (MM/S)
Fig. 3.37 1 97Au Mossbauer spectrum of activated carbonloaded from Au(CN) 4 solution and subsequently boiled in 4% hydrochloric acid for four hours
153

measured by elemental analysis, and found to be N/Au = 1,95. This is consistent with the reaction scheme presented above, assuming Au(CN)2Cl2 and Au(CN); to be the predominant species present.
b) The Mechanisms of Adsorption of Ag(CN)}and Ag* onto Activated Carbon
Adsorption of silver species onto activated carbons finds application in two main areas: (i) recovery of silver by adsorption of Ag(CN) j onto activated carbon from cyanide leach liquors and pulps, and (ii) preparation of carbon- supported metal catalysts. The recovery of silver by activated carbon normally occurs together with that of gold in the carbon-in-pulp process.
The mechanism of adsorption of silver onto activated carbon from cyanide solution is a topic that has not received much attention recently, unlike the preponderance of literature that has been published on the mechanism of adsorption of gold onto activated carbon from cyanide solution. The disagreement between researchers regarding this topic73 ' 7 4 ' ’ 1 is added incentive for the study of Ag (CN) * adsorption onto activated carbon, by affording a useful comparison with Au(CN)5 adsorption.
In the first studies of the adsorption of Ag(CN); onto activated carbon138'139, a parallel behaviour to the Au(CN) 2 adsorption was discovered, and this was subsequently confirmed more recently by Tsuchida and Muir73'74, who suggested adsorption by ion exchange onto oxygen-containing surface functional groups, followed by oxidative decomposition to AgCN. In the most recent work, iLrado and Fuerstenau1 40 postulate that silver adsorbs as the negatively-charged complex Ag(CN) 2 without being chemically bound to the co-adsorbed cation, without attempting to explain the adsorption mechanism per se.
154

Carbon-supported silver catalysts have been investigated1 41 as potential catalysts for the hydrochlorination of acetylene in the production of vinyl chloride monomer (VCM). Moreover, silver nitrate has been used in metal- impregnated activated carbons for the adsorption of toxic gases142'143 such as cyanogen chloride and hydrocyanic acid.
The mechanism of adsorption of silver onto activated carbon from nitrate144 or ammonia145'146 solutions is a less controversial topic than that from cyanide solutions. In these instances, the silver is postulated to be present as a mixture of silver metal and AgN03 or Ag(NH3)?M03. The nature of the adsorbates and of the reactions involved have not been dealt with in any detail, however.
The aim of the present section is to elucidate the mechanisms of adrjrption of silver onto activated carbon from cyanide nitrate solutions, so that an improved understanding o, all the above-mentioned processes can be att»i.ied.
(i) Mechanism of adsorption of Ag(CN); onto activated carbon
Silver was loaded onto activated carbon from KAg(CN)2 solutions of two different ionic strengths. The carbons were subseguently analysed for potassium, silver and nitrogen, and the results are shown in Table 3.25.
The stoichiometry of the adsorbed species corresponds to that required for the presence of KAg(CN)2, when loaded from both high and low ionic strength solutionsv Moreover, the increase in loading achieved at the higher potassium
155

concentration is consistent with a forward shift in the equilibrium
K+ (aq) + Ag(CN)j (aq) # K+Ag(CN)j (ads) (3.43)
These results parallel those for the adsorption of Au (CN) * orto activated carbon, and suggest that an ion-pair adsorption mechanism also prevails for Ag(CN)j adsorption. This is also consistent with previous work*2,138 on the effect of ionic strength on the adsorption of Ag (CN) ~2 onto carbon.
Table 3.25Analyses of K, Ag and N on activated carbon loaded
with silver from KAg(CN)2 solution.
Loading Concentration, mmol/gconditions
K Ag
No additives 0,102 0,138 0,1040,1 M KCl 0,192 0,210 0,255
A value of E° - -0,382 V can be calculated for the standard reduction potential (as measured against the Standard Hydrogen Electrodr (SHE), for the reduction of Ag(CN);:
Ag(CN) 2 + e- # Ag° + 2CN" (3.44)
(This value was calculated from the value1 47 of 32 = 1020 for Ag(CN)5 and the standard reduction potential of Ag* (0,800V)146), Reduction potentials of activated carbons have been found3 2 to lie between 0,40 and 0,08V, so argentocyani'ie would not be expected to be reduced by activated carbon, and this is consistent with the results shown in Table 3.25. It is also noteworthy that no metallic

silver, AgCN or AgCl could be detected on these carbons by XRD.
Infrared ipggtroph:. . etric atudv of adsorbedspecies
Infrared spectra showing the y (CN) stretching freipiencies for AgfCN) g loaded carbons that were dried under various conditions, are shown in Figure 3.38. Observed values for adsorbed species are compared with those for free species in Table 3.26.
Table 3.26r(CN) stretching frequencies for silver cyanide
species
Species Drying conditions y(CN),cm~ 1 Ref.
Carbon contacted 25°C; 24 h 2089 Thiswith KAg(CN); worksolution 120oC; 24 h 2090
2170
180eC; vacuum 2170dried 24h 2090
AgCN (s) 2164 1262178 148
KAg(CN), (s) 2139 126
K,Ag(CN), (s) 2097 126
Ag(CN); (ag) 2135 126
Ag(CN)’" (aq) 2105 126
Ag(CN)2 ~ (aq) 2092 126

ii mmfiniiTT
o-iWa '^numbero,
25°C
1B0°C
No AglO
Fig. 3-38 Infrared spectra showing y(CN) for silver cyanide species adsorbed on activated carbons from Q,IM KCl solution after various drying treatments
168

In the present work, a v (CN) band was observed at 2089 ca-1 on carbons loaded with KAg(CN) 2 solution and left to dry at room temperature. This band is attributable to the Ag (CN) 3 ~ species. Ho band due to Ag(CN); is evident. A possible explanation for this strange result is that the following reaction occurs on th carbon surface;
2Ag(CN); * Ag* + Ag(CN)}" (3.45)
Clark et ai123 provide IR spectroscopic evidence for a similar reaction occurring when CuCN is adsorbed onto activated carbons at high loadings:
2CuCN * CU+ + Cu(CN); (3.46)
They postulate the individual ions to be "trapped on the surface of the support where they are effectively individually complexed (and hence stabilized) by surface - OH groups*.
The driving force for reaction (3.45# is possibly surface complexation of Ag* ions or precipitation of AgCl. It is also possible that the driving force is reduction of Ag* to metallic i lv«ar, as occurs when AgN03 is contacted with carbon. It is not possible on the basis of the current results to unequivocally prove one of these reactions due to the absence of peeks in the X-ray diffractogram, which could be indicative of the presence of very small particles.
At increasingly high drying temperatures, an additional band at 2170 cm"1 species appears, that is attributable to solid AgCN. This species presumably results from the loss of cyanide as HCN,
aAg* + Ag (CN) | ~ + 2HgO -4 2AgCN( *) + 2#CN(t) 4 20H"
(3.47)
159

This reaction is similar to the one discussed in section 3.2d, in the case of Au(CN) j loaded carbons that are heated to somewhat higher temperatures of about 250°C, i.e.
4Au (CN) % + H20 -» AuCN (i) + HCN (t) + OH" (3.48)
The Au(CN) % species is more stable than the silver cyanide complexes, which explains its higher thermal stability.
The effect of increasing cyanide concentration on extraction of silver is shown in Figure 3.39.
Extraction of silver from the solution steadily drops from 86% when no extra cyanide is added, to only 5% in the presence of 1,0 mol/1 CN' . An explanation for this effect is obtained by a comparison of Figure 3.39 with Figure 3.40, which shows distribution of silver cyanide species with increasing cyanide concentration, calculated using the HALTAFALL1 4* program on an IBM PC II personal computer. The similarity between the curve for the AgfCN), species in Figure 3.40 and that for extraction of silver by activated carbon in Figure 3.39 is further evidence that silver is adsorbed as Ag(CN) % from cyanide solution, even when high concentrations of free cyanide are present. larado and Fuerstenau1 40 have previously postulated that Ag (CN) , is the adsorbed species, or. the basis that AgfCN); was calculated to be the predominant solution species in their experiment. The present work corroborates their work and moreover, provides a sounaer correlation, since the Ag(CN)|~ and AgfCN)3" complexes were also present in substantial proportions in the present experiments.
The fact that the doubly negatively-charged Ag(CN)|- and triply negatively-charged Ag(CN)3" species are not adsorbed onto activated carbon to any significant extent.
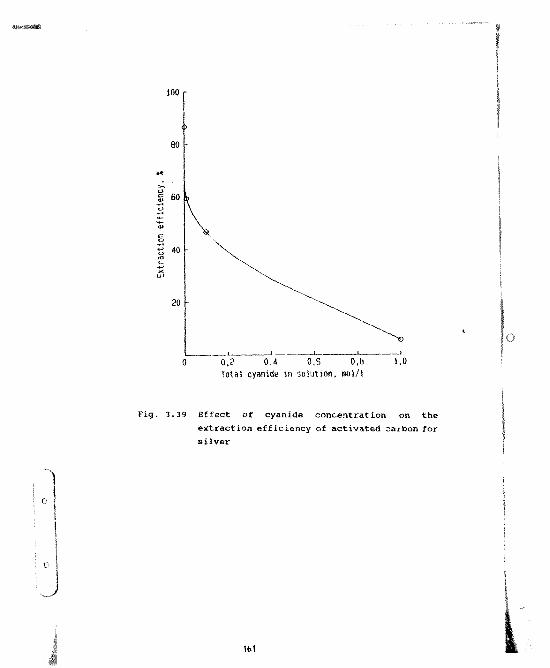
100
GO
40
20
1.00,8O.G0.20Total cyanide in solution, mo)/)
Fig. 3.39 Effect of cyanide concentration on the extraction efficiency of activated carbon for silver
161

Fra
ctio
n
of
Ag
sp
ecie
s
i
Pig.
08AglCNI
06
04
0.40
ToW cynik oonomkilai, mr:|
3.40 Distribution of silver species in cyanide solution with increasing t.tal cyanide concentration. (pH - 11: unadjusted)
10

'
is consistent with the current theory of ion-pair adsorption. Multiply-charged anions are hydrated to a much greater extent, resulting in a lower affinity for a hydrophobic phase such as activated carbon146'1*0.
These results are an apparent contradiction of the infrared ■pectrophotoBetrlc results, which suggested that Ag(CN) j anions may be adsorbed as Ag4 and Ag(Crf) \ ~ - the latter species has just been shown to be poorly adsorbed. This anomaly could be explained by the fact that Ag* ions are complexed far more strongly by oxygen donor ligands such as pcly(oxyethylene) groups151 than are K4 ions. This means that -turface-complaxed Ag4 ions provide effective anion- exchange sites for the Ag(CN) J', which will thus be strongly bound to the carbon in the presence of Ag4 ions, but not in their absence. Pcly(oxyethylene) ligands coordinate cations by wrapping around the ion in a helical fashion (see Section 4.6), and it is considered that a similar situation occurs within the micropores of activated carbon, which contain a preponderance of oxygen- containing functional groups. Alternatively, the effect may result from the drying process.
The results in Section 3.2c indicated that boiling aurocyanlde-loaded carbon in 4% HC1 for several hours resulted in the conversion of aurocyanide to the insoluble A 311 polymer in some or other form:
Au(CH); (ads) + H4 (ag) a AuCN (ads) + HCN(t) (3.49)
Subsequent treatment of this carbon with boiling 0,1 M sodium hydroxide solution resulted in the reduction of the AuCN, forming Au(CN), and metallic gold, e.g.:
2AuCN + e" -> Au + AU(CN) i (3.50)
A 163

Author Adams Michael DavidName of thesis The Chemistry Of The Carbon-in-pulp Process. 1989
PUBLISHER:University of the Witwatersrand, Johannesburg ©2013
LEGAL NOTICES:
Copyright Notice: All materials on the Un i ve r s i t y of t he W i t w a t e r s r an d , Johannesbu r g L i b r a r y website are protected by South African copyright law and may not be distributed, transmitted, displayed, or otherwise published in any format, without the prior written permission of the copyright owner.
Disclaimer and Terms of Use: Provided that you maintain all copyright and other notices contained therein, youmay download material (one machine readable copy and one print copy per page) for your personal and/or educational non-commercial use only.
The University o f the W itwatersrand, Johannesburg, is not responsible for any errors or omissions and excludes anyand all liability for any errors in or omissions from the information on the Library website.