the changing returns to private education - cee: centre for the
TRANSCRIPT
CEE DP 115
The Changing Economic Advantage From
Private School
Francis Green
Stephen Machin
Richard Murphy
Yu Zhu
April 2010
ISSN 2045-6557

Published by
Centre for the Economics of Education
London School of Economics
Houghton Street
London WC2A 2AE
© F. Green, S.J. Machin, R. Murphy and Y. Zhu, submitted April 2010
All rights reserved. No part of this publication may be reproduced, stored in a retrieval system
or transmitted in any form or by any means without the prior permission in writing of the
publisher nor be issued to the public or circulated in any form other than that in which it is
published.
Requests for permission to reproduce any article or part of the Working Paper should be sent
to the editor at the above address.
The Centre for the Economics of Education is an independent multidisciplinary research
centre. All errors and omissions remain the authors.
Executive Summary
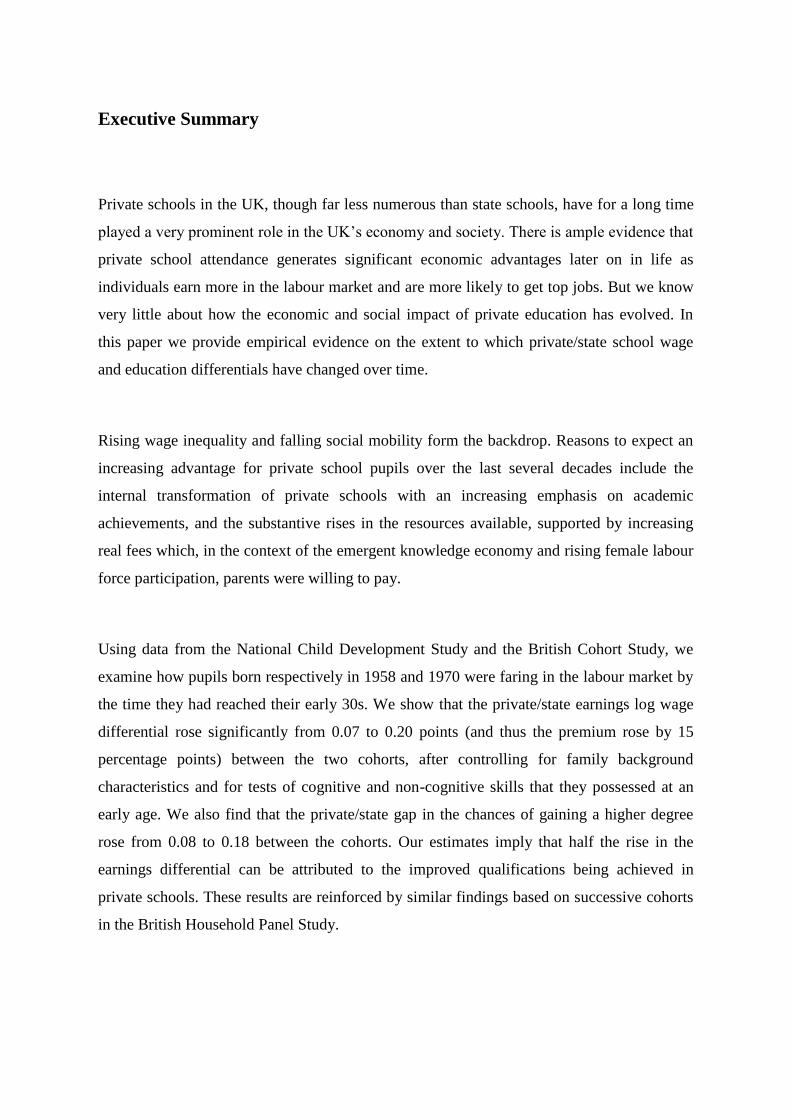
Private schools in the UK, though far less numerous than state schools, have for a long time
played a very prominent role in the UK‟s economy and society. There is ample evidence that
private school attendance generates significant economic advantages later on in life as
individuals earn more in the labour market and are more likely to get top jobs. But we know
very little about how the economic and social impact of private education has evolved. In
this paper we provide empirical evidence on the extent to which private/state school wage
and education differentials have changed over time.
Rising wage inequality and falling social mobility form the backdrop. Reasons to expect an
increasing advantage for private school pupils over the last several decades include the
internal transformation of private schools with an increasing emphasis on academic
achievements, and the substantive rises in the resources available, supported by increasing
real fees which, in the context of the emergent knowledge economy and rising female labour
force participation, parents were willing to pay.
Using data from the National Child Development Study and the British Cohort Study, we
examine how pupils born respectively in 1958 and 1970 were faring in the labour market by
the time they had reached their early 30s. We show that the private/state earnings log wage
differential rose significantly from 0.07 to 0.20 points (and thus the premium rose by 15
percentage points) between the two cohorts, after controlling for family background
characteristics and for tests of cognitive and non-cognitive skills that they possessed at an
early age. We also find that the private/state gap in the chances of gaining a higher degree
rose from 0.08 to 0.18 between the cohorts. Our estimates imply that half the rise in the
earnings differential can be attributed to the improved qualifications being achieved in
private schools. These results are reinforced by similar findings based on successive cohorts
in the British Household Panel Study.

Since the composition of private school participants – from the perspectives of parental
income, demographic characteristics and early-age test scores and non-cognitive skills –
remained steady between the cohorts, we think it unlikely that the increased differential
could be accounted for by any change in the selection of private school attendees.
As private/state earnings and education differentials have widened out at the same time as
rising wage inequality, we suggest that type of school attended is likely to have been a factor
at play. From this perspective, falling social mobility (as captured by the correlation between
own and parents' incomes, documented in previous studies) is more connected to rising
private/state earnings differentials than to any change in the social or economic composition
of private school participants.
Using an approximate calculation, the average net return to investment in a private school
education in 1980 was 7% for boarders and 13% for day students. Since these pecuniary
estimates exclude hard-to-measure consumption benefits during and after schooling, they
should be regarded as likely to be underestimates. In effect, private schools provided very
good value for money. However, since selection into the schools, despite some bursaries and
the Assisted Places Scheme, is primarily based on families‟ ability to pay, it is hard to escape
the conclusion that private schools during the period under examination also served to
reproduce inequalities in British society. Ongoing research is needed to investigate whether
more recent private school graduates are benefiting from still larger premiums to match the
rising fees.

The Changing Economic Advantage From
Private School
Francis Green
Stephen Machin
Richard Murphy
Yu Zhu
1. Introduction 1
2. The Changing Private Education Environment in Britain 3
Historical context 3
Recent changes 5
Existing evidence on the economic and education advantages of private school 9
3. Data and Initial Descriptive Analysis 10
Data 10
Initial descriptive analysis 11
4. Empirical Findings 12
Empirical modelling approach 12
Cross-cohort changes in private/state earnings differentials 13
Cross-cohort changes in private/state degree acquisitions differentials 14
The explanatory role of changes in degree acquisition in changes in earnings
differentials 15
5. Discussion and Interpretation 15
Connections to changing wage inequality 16
Connections to changes in social mobility 17
Changing sorting and selection 19
Estimates of the net return for parents 21
6. Conclusion 22
References 24
Figures 27
Tables 29
Appendices 34
Acknowledgments
The authors thankfully acknowledge the support of the Nuffield Foundation for this research.
Thanks also to the Independent Schools Council (ISC) for providing copies of aggregated
findings from their successive surveys of members. Material from the BHPS, the NCDS and
the BCS70 is Crown Copyright; it has been made available by the UK Office for National
Statistics through the Data Archive and has been used by permission. Final thanks also go to
participants in the 2007 EALE and WPEG conferences and in seminars at Kent and LSE for
helpful comments.
Francis Green is Honorary Professor of Economics at the University of Kent and an Associate
at the Centre for the Economics of Education (CEE). Stephen Machin is Director of the CEE,
Director of Research at the Centre for Economic Performance, London School of Economics
and a Professor at the Department of Economics, University College London Richard Murphy
is a Research Economist at the Centre for Economic Performance, London School of
Economics and CEE Associate. Yu Zhu is a Senior Lecturer at the Department of Economics,
University of Kent and CEE Associate.
1
1 Introduction
Private schooling, in its various guises, is an important feature of education systems across
the world. The existence of a private education sector generates the possibility for parents
to opt their children out of state provided education. In the case of the UK, private schools,
though far less numerous than state schools, have for a long time played a very prominent
role in the UK‟s economy and society.1 There is ample evidence that private school
attendance generates significant economic advantages later on in life as individuals earn
more in the labour market and are more likely to get top jobs.2 Indeed, the notion that
privilege and later success are conferred on those attending private school remains a
politically charged issue of debate.
Given this, it is surprising that we currently know very little about how the economic and
social impact of private education has evolved over time. We know next to nothing about
how the higher earnings of the privately educated and their ability to successfully access
jobs higher up the occupational ladder have shifted through time, nor what the drivers of
any observed shifts might be. This therefore forms the subject matter of this paper. We
provide a range of empirical evidence on the extent to which private/state school wage and
education differentials have changed over time, and discuss possible transmission
mechanisms that could underpin the observed trends.
1 For example, in the UK there is plenty of descriptive evidence showing that, relative to state schools, private
schools educate a significantly disproportionate number of those who find economic, political and social
success in later life (Sutton Trust, 2005a, 2005b, 2006; Boyd, 1973; Reid, 1986). 2 See, inter alia, Dolton and Vignoles (2000), Dearden et al. (2002) and Naylor et al. (2002).
2
The economic and social backdrop to this is important. Much has been made of the rises in
wage inequality and falls in social mobility that have occurred in the UK in the last thirty to
forty years (see Machin, 2010, or Blanden and Machin, 2008). Yet, we do not know
whether private versus state school attendance, and any change in the economic advantage
conferred on private school attendees, has contributed to these significant shifts.
In this paper we therefore investigate the changing association between attendance at a
private school and subsequent economic success in the labour market. We connect our
findings to the discussions of changing wage inequality and social mobility, and also to the
changing nature of the market for private schools. This is important as private school fees
have risen very sharply over time and, as school fees ration access according to family
wealth, the larger the economic advantage of private education needs to be to generate a
'payoff' for parents investing in such education for their children.
We document evidence that the private/state school wage differential has risen significantly
over time, alongside rising costs of sending children to private school. A significant factor
underpinning this has been faster rising educational attainment for privately educated
individuals. Despite these patterns of change, the proportion attending private school has
not altered much, nor have the characteristics of those children (and their parents) attending
private school. This is suggestive that the pattern of sorting into private schools may not
matter much in accounting for changes in wage and education differentials through time.
Taken together, our findings are consistent with the idea that the private school sector has
successfully used its increased resources to generate the academic outputs that are most in
demand in the modern economy. Moreover, because of the increased earnings advantage
3
private school remains a good investment for parents who want to opt out, but this increase
has also contributed to rising wage inequality and falling social mobility.
The rest of the paper is organized as follows. In Section II we briefly review the marked
changes that have taken place in private sector education provision over the last thirty years
or so, and discuss the small body of work studying the economic advantages associated
with private school attendance. Section III describes the data used in this study and presents
some initial descriptive statistics. Section IV presents the empirical results. Section V offers
an interpretation of the findings, connecting them to the wage inequality and social mobility
literatures, discussing sorting and selection into private school, and offering a calculation of
the net returns to private school investment implied by our gross wage return estimates and
information about average school fees. Section VI concludes.
2 The Changing Private Education Environment in Britain
Historical context
Private schools in Britain have a long history dating back at least to 597 AD. In any modern
economy with a fully-fledged education system, however, private schools have to contend
with the threat that the state will crowd out private investments in time-honoured fashion.
Private schools have, therefore, to offer their potential clients something in addition. Top of
the list for most schools come better teaching resources, and supportive peer effects through
selective admissions procedures. Private schools may also cater for pupils with specialised
4
needs or with religious preferences, the latter being a common hallmark of private
schooling in many countries.
From the parents' perspective, outcomes of the investment in private school education can
be academic (better qualifications, access to better universities) or non-academic (the
„rounded individual‟, the „confident leader‟, better „soft skills‟). Either the improved
qualifications, or the non-academic outcomes, or both would then deliver economic returns
to the investment as gauged by better pay or access to higher-ranking jobs (perhaps via
higher-ranking university education). Such schools might also be thought to provide access
to „old boys‟ networks‟ or „old girls‟ networks‟. To compete with state education, schools
can also deliver consumption services superior to those available in government schools or
elsewhere: sports facilities and tuition, music and other cultural goods, which are tied with
the academic education package.
This range of strategies affords room for a variety of private schools, with mixed offerings
and pricing structures. Indeed, private schools in Britain are quite heterogeneous. They
include the traditional „public schools‟, the ex-direct grant schools, other private secondary
schools, the prep schools, and a small number of pre-prep and specialist schools. Many are
for boarding, either exclusively or as a choice; almost all used to be single-sex, though
many are now co-educational. Schools vary also in their mix of emphasis on academic and
non-academic outcomes; and there is additional variation by religious affiliation.
Nonetheless, what all private schools share is the facility to offer something different from
state-maintained schools in return for a fee. To represent their common interests, most
private schools belong to one or more of ten associations, which in turn are members or
affiliates of the Independent Schools Council (ISC).
5
Recent changes
The emphases of private education have changed over recent decades. In Rae‟s (1981)
perspicacious insider account of the public schools in the 1960s and 1970s, he describes
how the schools were obliged to adapt to a new and uncertain environment, characterised
by changes in state education, associated political conflict over private schooling, and
changing social mores. During the 1950s and 1960s, there had been growing unrest about
the UK educational system, primarily surrounding the use of selection at age 11 and the
continued existence of the private educational sector, which was seen as a bastion of the
upper classes. In 1964 Harold Wilson became Prime Minister as leader of the Labour Party,
with commitments from the previous year‟s party conference to call for an end of the
selection system and tackle “the problem of public schools”. By 1965 the government had
asked Local Educational Authorities (LEAs) to draw up plans to convert to a
comprehensive system, and appointed a commission to review private education. One of
the recommendations (later accepted) from its second report was the abolition of Direct
Grant grammar schools, which were partly fee-paying, partly subsidised and academically
selective. These schools were given the option of joining the comprehensive system or
becoming fully private, which is what two thirds of them did. While the commission did
not broaden its attack on the rest of the private school system, political uncertainty
remained and in 1973 the Labour Party in opposition drew up a long-term strategy for
proscribing private education altogether. Only when these plans were abandoned once in
power (supported only by a thin majority) was the threat to private schools alleviated.
The need for political legitimacy in the face of ideological opposition is advanced by Rae as
one reason why private schools were starting to become more academic over this period.
6
Other pressures came from above – a decline in monopoly access to Oxford and Cambridge
universities, the rise of other universities – and from below in the form of growing parent
power. At the start of the 1970s private schools saw an opportunity in the closing of
grammar schools around the country, with groups of parents fearing the effect the new
comprehensive system would have on their children. These parents had only two options: to
band together and appeal to their Local Education Authority (LEA) to maintain the
selective schooling system or to send their child to a private school. The former was only
moderately successful, with 19 out of 138 LEAs remaining selective.3 For private schools
to take full advantage of grammar school closure they needed to attract parents by showing
them that they provided an educational product worth paying for. All these factors meant
that the private schools “became more ruthless and single minded in their pursuit of
academic success” (Rae, 1981: 155). The balance of the curriculum shifted away from the
traditional emphasis on classics towards the sciences (Sanderson, 1999: 102-3). More
entrance exams were introduced and pass marks were raised. Schools advertised their ever-
decreasing pupil-teacher ratios, the average A-level grades of their pupils, and the number
of leavers attending Oxbridge; and they became themselves more business-like in their
management.
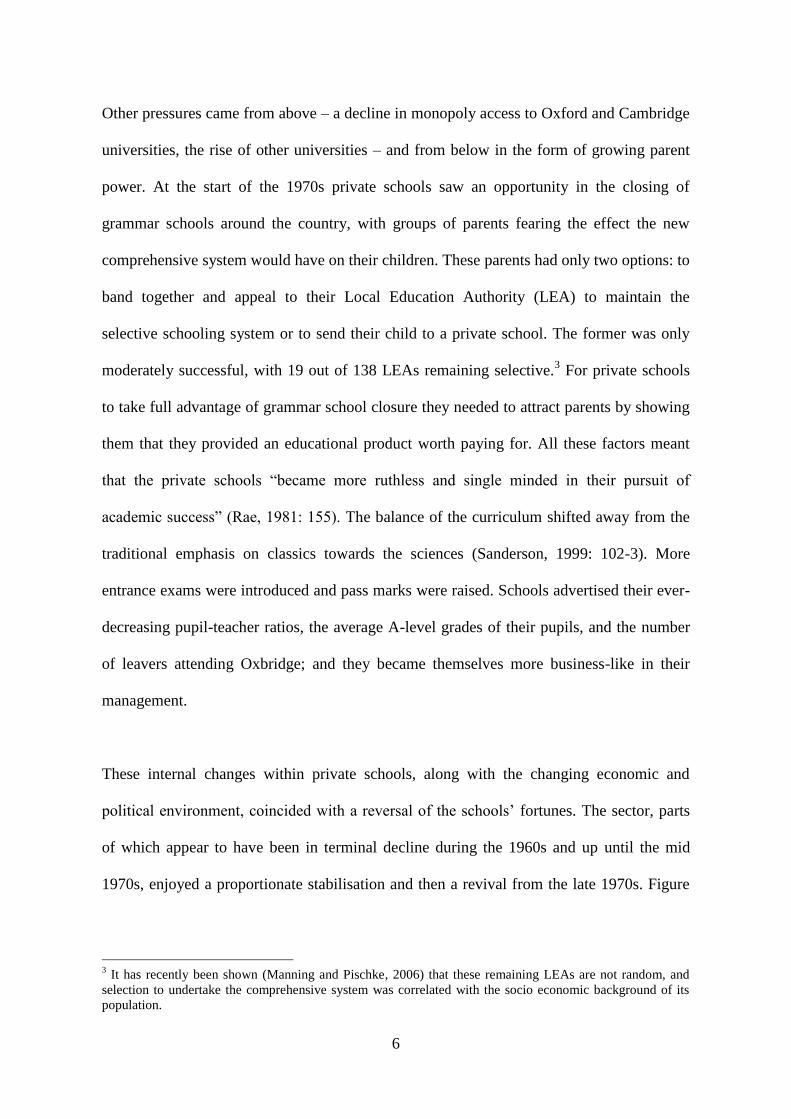
These internal changes within private schools, along with the changing economic and
political environment, coincided with a reversal of the schools‟ fortunes. The sector, parts
of which appear to have been in terminal decline during the 1960s and up until the mid
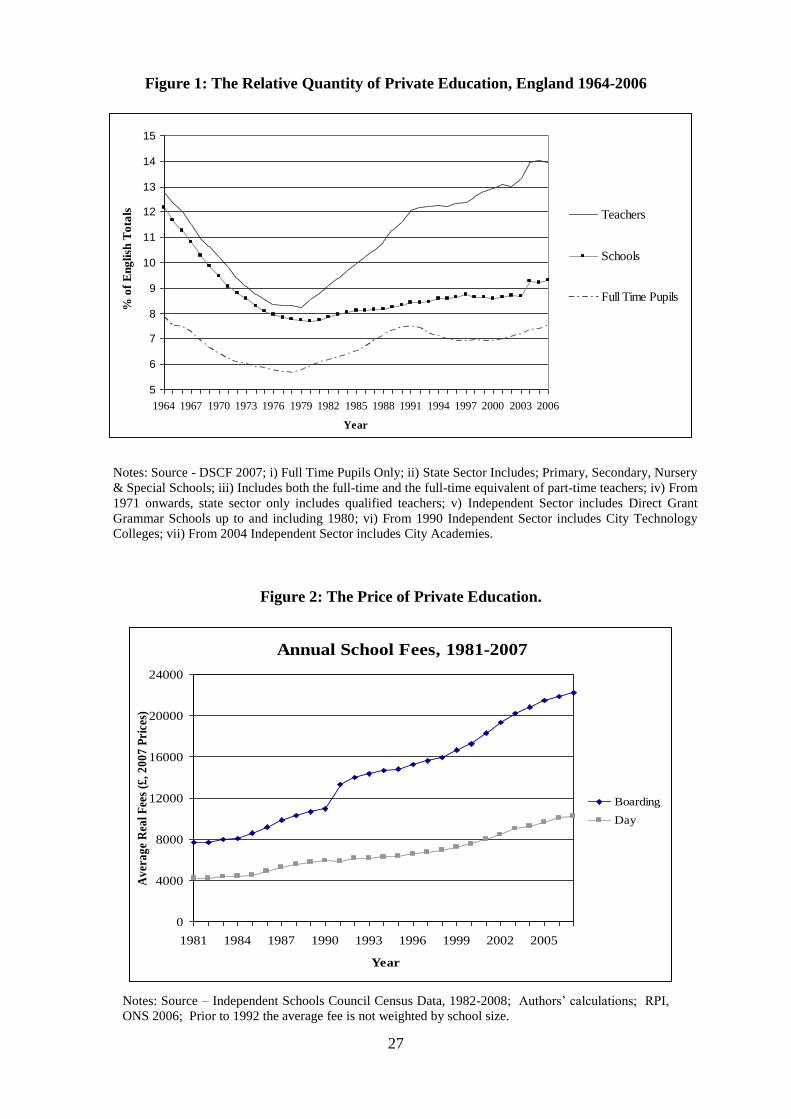
1970s, enjoyed a proportionate stabilisation and then a revival from the late 1970s. Figure
3 It has recently been shown (Manning and Pischke, 2006) that these remaining LEAs are not random, and
selection to undertake the comprehensive system was correlated with the socio economic background of its
population.
7
1, which shows the proportions of full time pupils, schools and teachers in the private
sector since the mid-1960s, very clearly shows this revival of fortunes.4
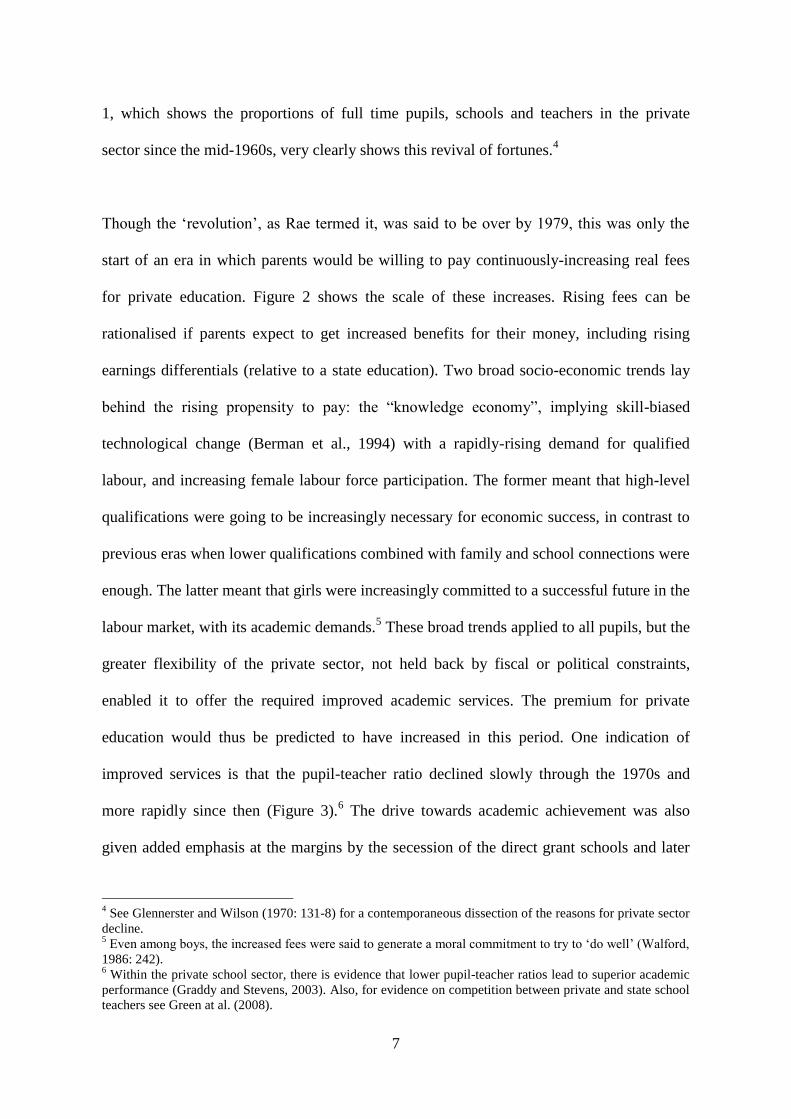
Though the „revolution‟, as Rae termed it, was said to be over by 1979, this was only the
start of an era in which parents would be willing to pay continuously-increasing real fees
for private education. Figure 2 shows the scale of these increases. Rising fees can be
rationalised if parents expect to get increased benefits for their money, including rising
earnings differentials (relative to a state education). Two broad socio-economic trends lay
behind the rising propensity to pay: the “knowledge economy”, implying skill-biased
technological change (Berman et al., 1994) with a rapidly-rising demand for qualified
labour, and increasing female labour force participation. The former meant that high-level
qualifications were going to be increasingly necessary for economic success, in contrast to
previous eras when lower qualifications combined with family and school connections were
enough. The latter meant that girls were increasingly committed to a successful future in the
labour market, with its academic demands.5 These broad trends applied to all pupils, but the
greater flexibility of the private sector, not held back by fiscal or political constraints,
enabled it to offer the required improved academic services. The premium for private
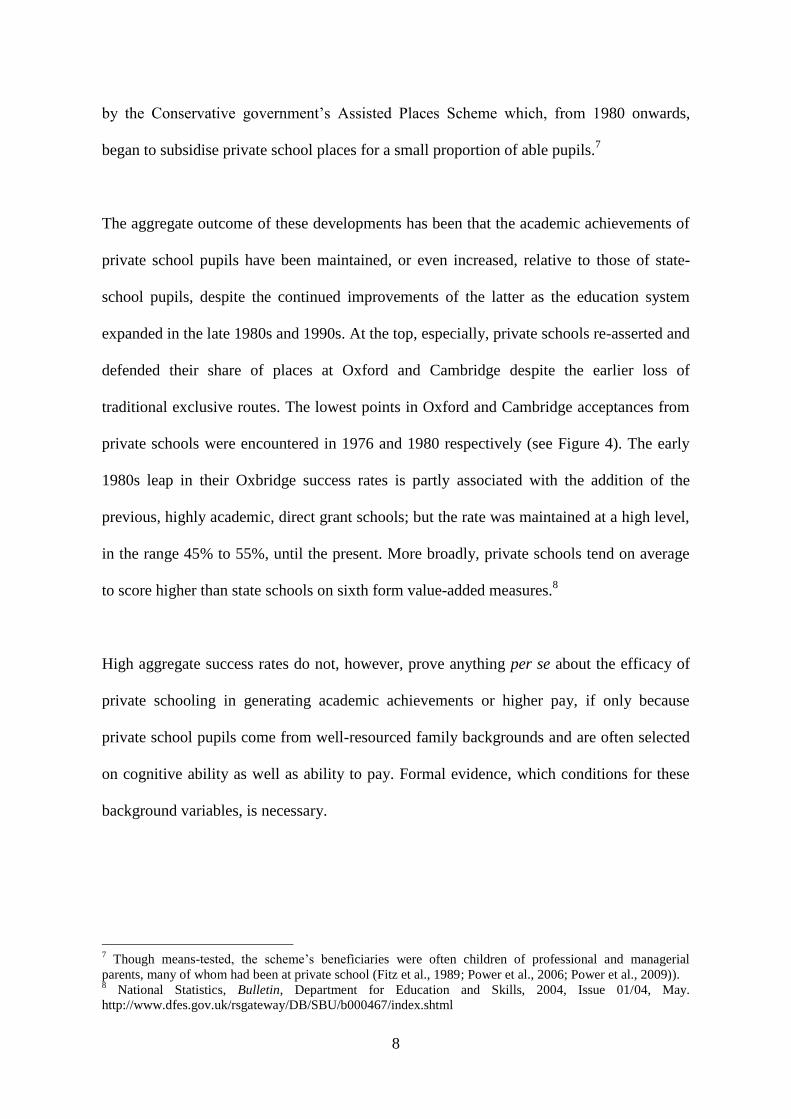
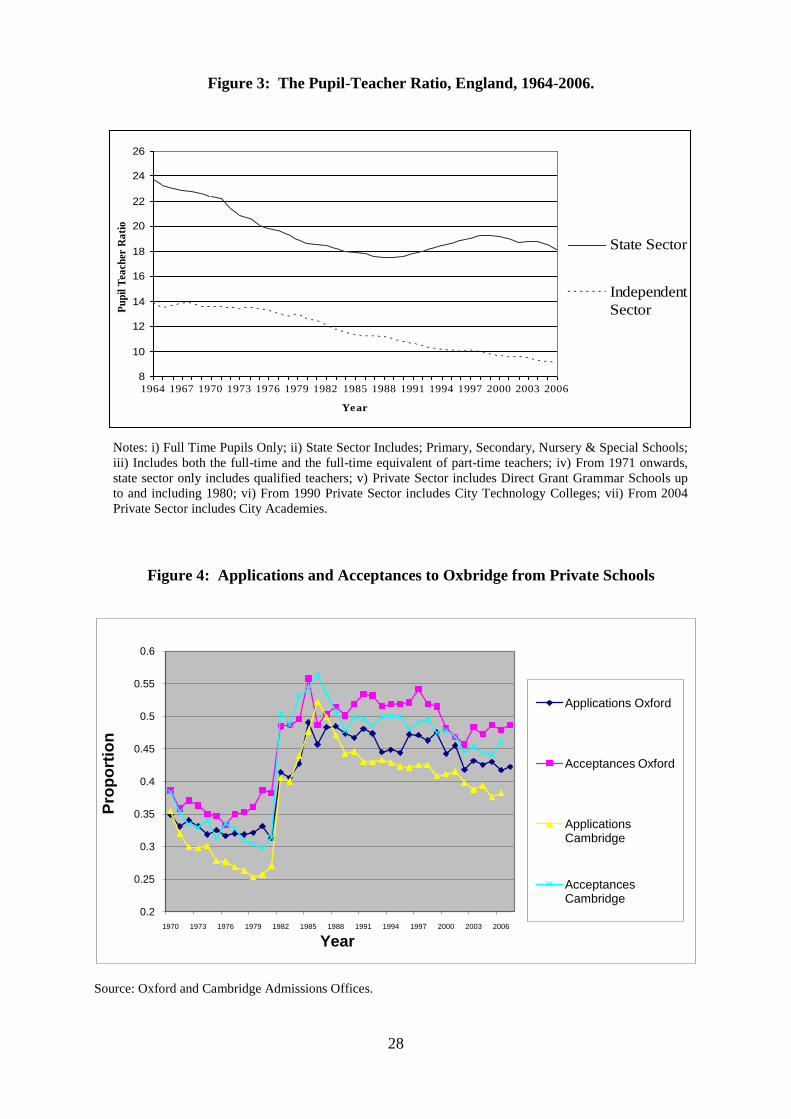
education would thus be predicted to have increased in this period. One indication of
improved services is that the pupil-teacher ratio declined slowly through the 1970s and
more rapidly since then (Figure 3).6 The drive towards academic achievement was also
given added emphasis at the margins by the secession of the direct grant schools and later
4 See Glennerster and Wilson (1970: 131-8) for a contemporaneous dissection of the reasons for private sector
decline. 5 Even among boys, the increased fees were said to generate a moral commitment to try to „do well‟ (Walford,
1986: 242). 6 Within the private school sector, there is evidence that lower pupil-teacher ratios lead to superior academic
performance (Graddy and Stevens, 2003). Also, for evidence on competition between private and state school
teachers see Green at al. (2008).
8
by the Conservative government‟s Assisted Places Scheme which, from 1980 onwards,
began to subsidise private school places for a small proportion of able pupils.7
The aggregate outcome of these developments has been that the academic achievements of
private school pupils have been maintained, or even increased, relative to those of state-
school pupils, despite the continued improvements of the latter as the education system
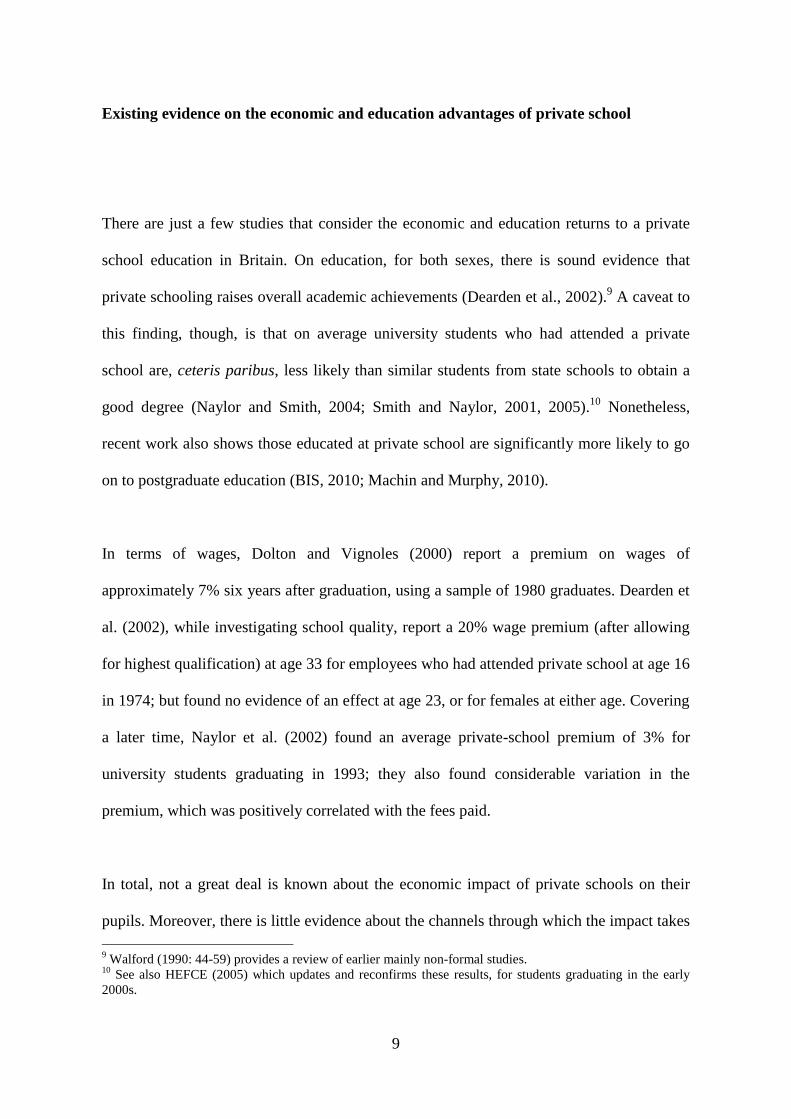
expanded in the late 1980s and 1990s. At the top, especially, private schools re-asserted and
defended their share of places at Oxford and Cambridge despite the earlier loss of
traditional exclusive routes. The lowest points in Oxford and Cambridge acceptances from
private schools were encountered in 1976 and 1980 respectively (see Figure 4). The early
1980s leap in their Oxbridge success rates is partly associated with the addition of the
previous, highly academic, direct grant schools; but the rate was maintained at a high level,
in the range 45% to 55%, until the present. More broadly, private schools tend on average
to score higher than state schools on sixth form value-added measures.8
High aggregate success rates do not, however, prove anything per se about the efficacy of
private schooling in generating academic achievements or higher pay, if only because
private school pupils come from well-resourced family backgrounds and are often selected
on cognitive ability as well as ability to pay. Formal evidence, which conditions for these
background variables, is necessary.
7 Though means-tested, the scheme‟s beneficiaries were often children of professional and managerial
parents, many of whom had been at private school (Fitz et al., 1989; Power et al., 2006; Power et al., 2009)). 8 National Statistics, Bulletin, Department for Education and Skills, 2004, Issue 01/04, May.
http://www.dfes.gov.uk/rsgateway/DB/SBU/b000467/index.shtml
9
Existing evidence on the economic and education advantages of private school
There are just a few studies that consider the economic and education returns to a private
school education in Britain. On education, for both sexes, there is sound evidence that
private schooling raises overall academic achievements (Dearden et al., 2002).9 A caveat to
this finding, though, is that on average university students who had attended a private
school are, ceteris paribus, less likely than similar students from state schools to obtain a
good degree (Naylor and Smith, 2004; Smith and Naylor, 2001, 2005).10
Nonetheless,
recent work also shows those educated at private school are significantly more likely to go
on to postgraduate education (BIS, 2010; Machin and Murphy, 2010).
In terms of wages, Dolton and Vignoles (2000) report a premium on wages of
approximately 7% six years after graduation, using a sample of 1980 graduates. Dearden et
al. (2002), while investigating school quality, report a 20% wage premium (after allowing
for highest qualification) at age 33 for employees who had attended private school at age 16
in 1974; but found no evidence of an effect at age 23, or for females at either age. Covering
a later time, Naylor et al. (2002) found an average private-school premium of 3% for
university students graduating in 1993; they also found considerable variation in the
premium, which was positively correlated with the fees paid.
In total, not a great deal is known about the economic impact of private schools on their
pupils. Moreover, there is little evidence about the channels through which the impact takes
9 Walford (1990: 44-59) provides a review of earlier mainly non-formal studies.
10 See also HEFCE (2005) which updates and reconfirms these results, for students graduating in the early
2000s.
10
effect and none at all about how the impact and the channels may have changed as the
schools have been modernised.
3 Data and Initial Descriptive Analysis
Data
The main data sources we use are two British cohort studies, the National Child
Development Study (NCDS), a cohort of individuals born in a week of March 1958, and
the British Cohort Study (BCS), a similarly structured cohort born in a week of April 1970.
Information is gathered about these cohort members and their immediate families at ages 7,
11, 16, 33 and 42 for NCDS, and at ages 5, 10, 16, 30 and 34 for BCS. The design of these
surveys allows analysis of a host of comparable characteristics before and after the major
educational choices made throughout a child‟s life. For the dependent variable used in our
earnings analysis, we use information at age 33 (NCDS) in 1991 and age 34 (BCS) in 2004,
where employees provide information on their usual pay, pay period and number of hours
worked. From this we have derived a figure of gross hourly earnings.11
We also look at
educational attainment as an outcome of interest, considering whether NCDS and BCS
cohort members obtain a degree by age 23 (in 1981 and 1993 respectively).
11
There is significant attrition and the useable number of observations is considerable smaller than the 17000
or so in the original samples. We have run validation checks to ensure that there are no significant biases
introduced in terms of the characteristics identified in the Birth Sweep, which by definition is representative.

11
One of the main benefits of using the NCDS and BCS is that it allows us to consider a rich
set of pre-school treatment characteristics, both cognitive and non-cognitive. On the former,
we look at a range of cognitive tests taken by the cohort members.12
On the latter, non-
cognitive attributes of the child are observed in the first sweep, where the mother is asked
to describe the child‟s characteristics through a series of 20 questions. We place these
questions into two categories similar to the Rutter Scales (Blanden et al., 2008) for
externalising behaviour such as: temper tantrums, hyper-activity, fights often; and for
internalising behaviour including: sleeping problems, being a solitary child, biting of nails
and experiencing headaches. This information is then combined into two scales using
principal component analysis and finally we ensured that the relationships between these
responses and the behavioural scales were the same across cohorts.
Initial descriptive analysis
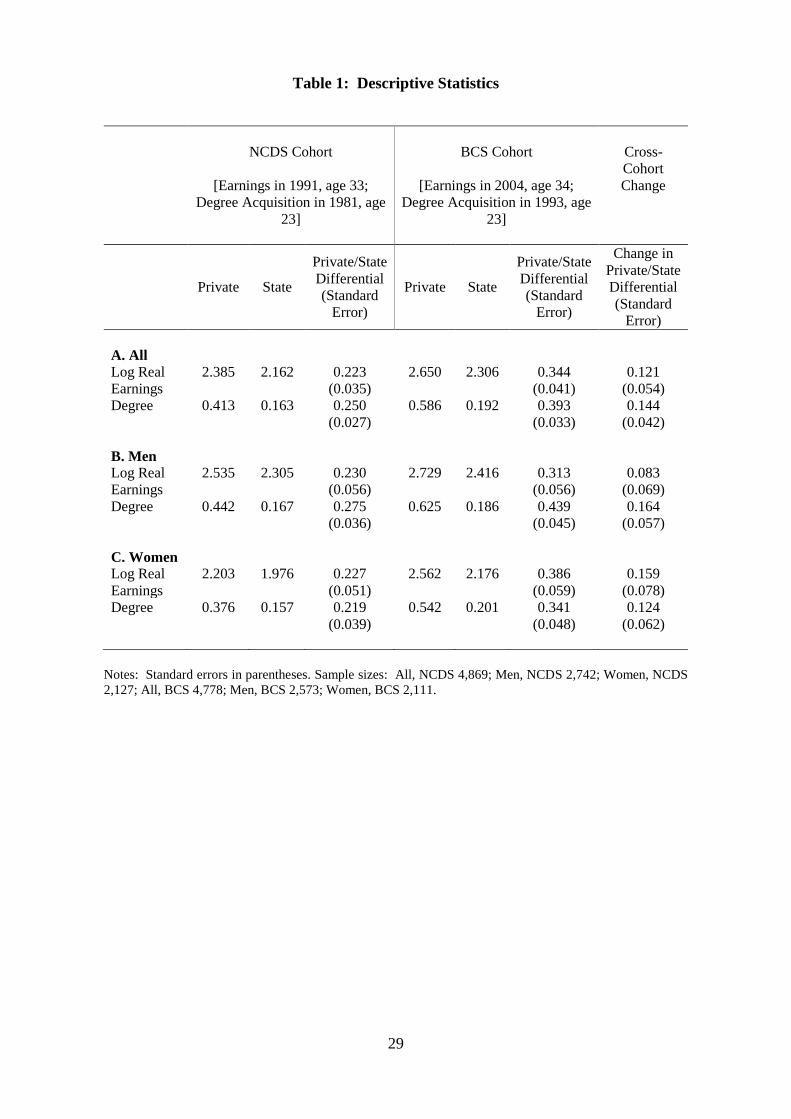
Table 1 shows some initial descriptive statistics on the average log real earnings and degree
acquisition of private and state educated individuals from the NCDS and BCS for all cohort
members and separately by gender, together with cross-cohort changes. The latter show the
change over time in the private/state earnings and education differential. These changes
move strongly in favour of the privately educated in all cases. For example, for all cohort
members the private/state earnings differential rises significantly from .22 log points to .34
12
We drew upon a range of similar tests the cohort members undertook, omitting tests that only one of the
cohorts experienced. In the first sweep standardised scores on vocabulary tests and Harris Figure drawing
exercises were used. Age 11/10 cognitive skills were derived from standardising reading comprehension, and
maths scores, as well as word and pattern recognition matrices. Although reading based tests were undertaken
at age 16, the NCDS used a comprehension based test and the BCS used a vocabulary base (this was the same
test as aged 11 and so there was a lot of clustering near the top of the distribution). In its place we used
English and Maths exam results taken at age 16, using two scales from 0-5, with 5 being an A grade or Grade
1, for O-levels and GCEs respectively.
12
log points, a rise of .12. Similarly, the proportion getting a degree rises from .25 higher for
private versus state up to .39 higher, corresponding to a 14 percentage point relative
improvement. Sharp rises in both private/state earnings and degree acquisition differentials
are seen for both men and women, with the cross-cohort change in the earnings differential
increasing by more for women (.16 as compared to .08) but the degree acquisition
differential increasing by more for men (.16 as compared to .12).
4 Empirical Findings
Empirical modelling approach
We begin by considering cross-cohort changes in the statistical associations between
economic and educational outcomes and private (versus state) school attendance. In a
general way, we can represent a statistical model for log earnings E of individual i in cohort
c as follows:
1icicc1ic
c1
c1ic εXδPβαE (1)
where P is a binary indicator of private school attendance, X contains a set of control
variables and ε is an error term.
In (1) the cohort-specific private/state school earnings gap is the estimated coefficient c1β̂ .
We model changes over time for our two cohorts and test the null hypothesis of no

13
temporal change, BCS1
NCDS1 β̂β̂ . We thus present estimates of the change over time,
NCDS1
BCS11 β̂β̂β̂Δ .
We also estimate an analogous model for degree acquisition, D, as:
2icicc2ic
c2
c2ic εXδPβαD (2)
where the change over time in the private/state school degree gap is NCDS2
BCS22 β̂β̂β̂Δ .
Finally, we are interested in how much of the changing earnings differential accruing to
private schools can be explained by changes in degree acquisition. To do so we control for
degree acquisition in (1) as
3icicc3ic
c3ic
c3
c3ic εDθXδPβαE (3)
and calculate the change in the earnings differential conditional upon degree acquisition as
NCDS3
BCS33 β̂β̂β̂Δ . Thus the share of the overall change 1β̂Δ attributable to changes in
degree acquisition is 131 β̂)/Δβ̂Δβ̂(Δ .
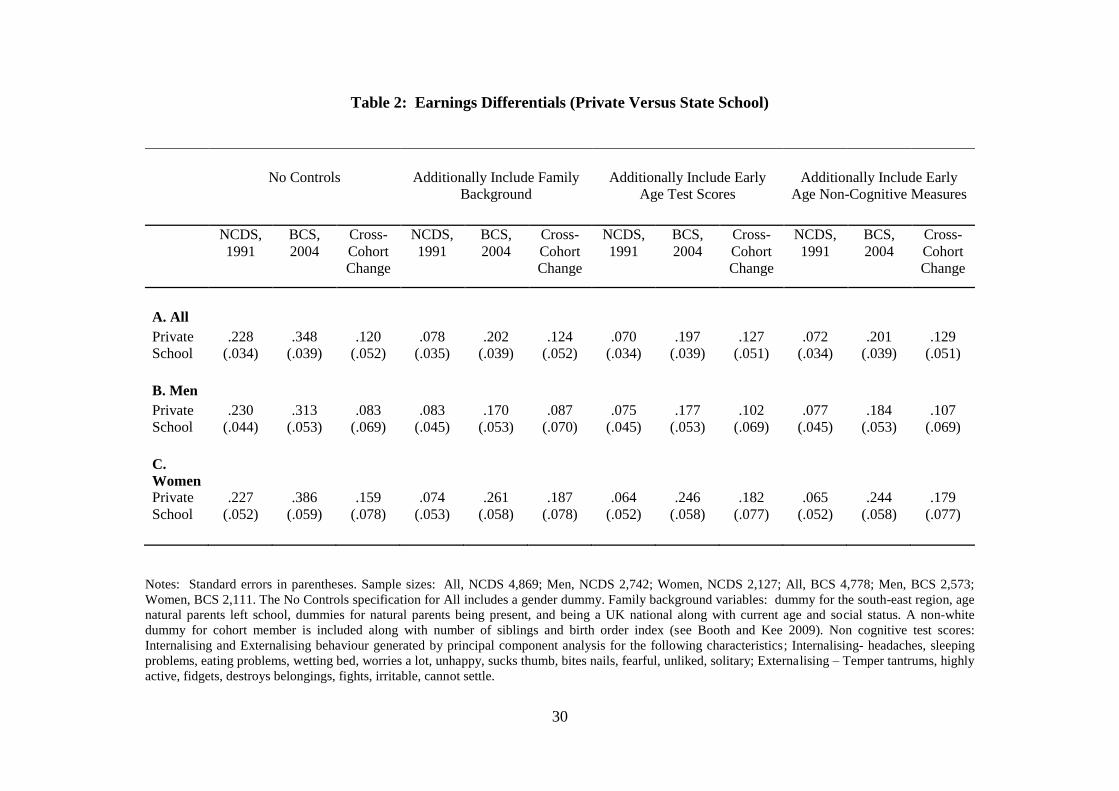
Cross-cohort changes in private/state earnings differentials
Table 2 shows estimates of cross-cohort changes in the private/state wage differential from
three models. The first shows the raw gaps (as per Table 1) with no controls (except for the
pooled sample which now includes a gender dummy), the second shows estimates from
regressions conditioning upon family background measures (detailed in the notes to the
Table), the third additionally includes early age test scores and the fourth adds the early age
non-cognitive, or behavioural, variables. It is evident that, in the cross-sectional cohort
models, the estimated private/state wage differentials fall on the inclusion of the controls
14
but, importantly, they fall by very much the same kind of magnitude in both cohorts. This
leaves the cross-cohort change essentially unchanged on their inclusion. In the full
specifications, the private/state earnings differential rises by a statistically significant .13
log points for all cohort members, and by .11 and .18 log points for men and women
respectively.
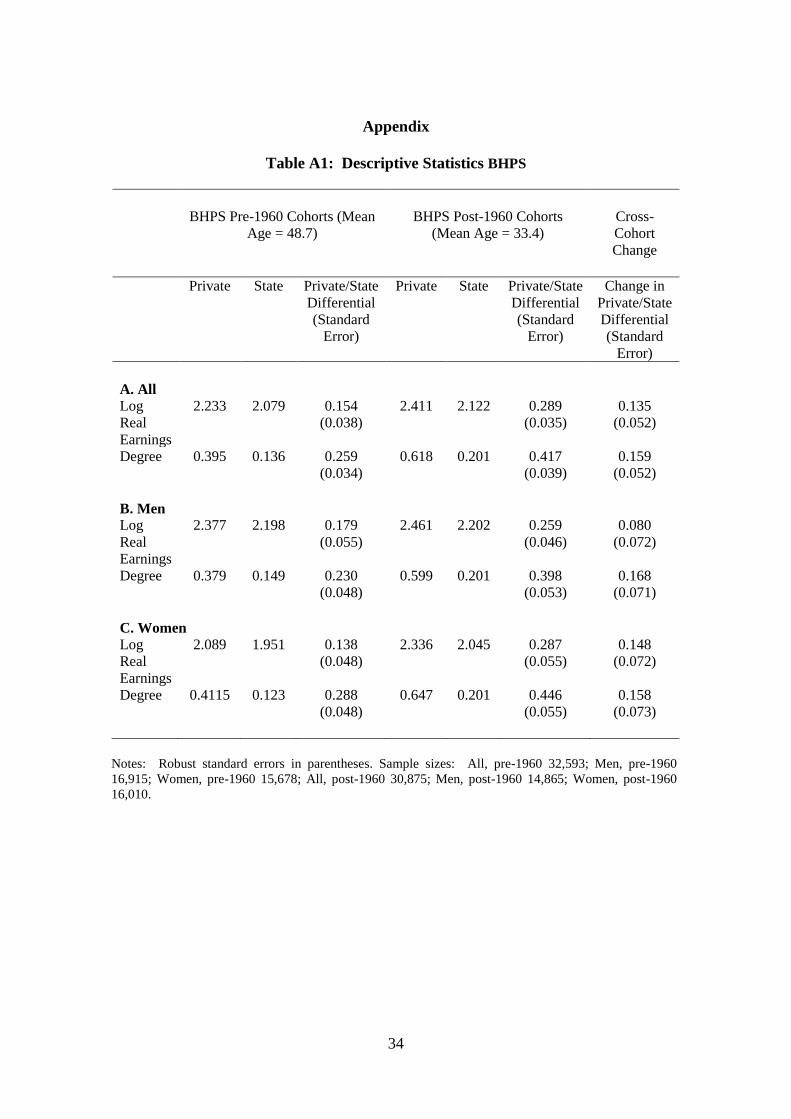
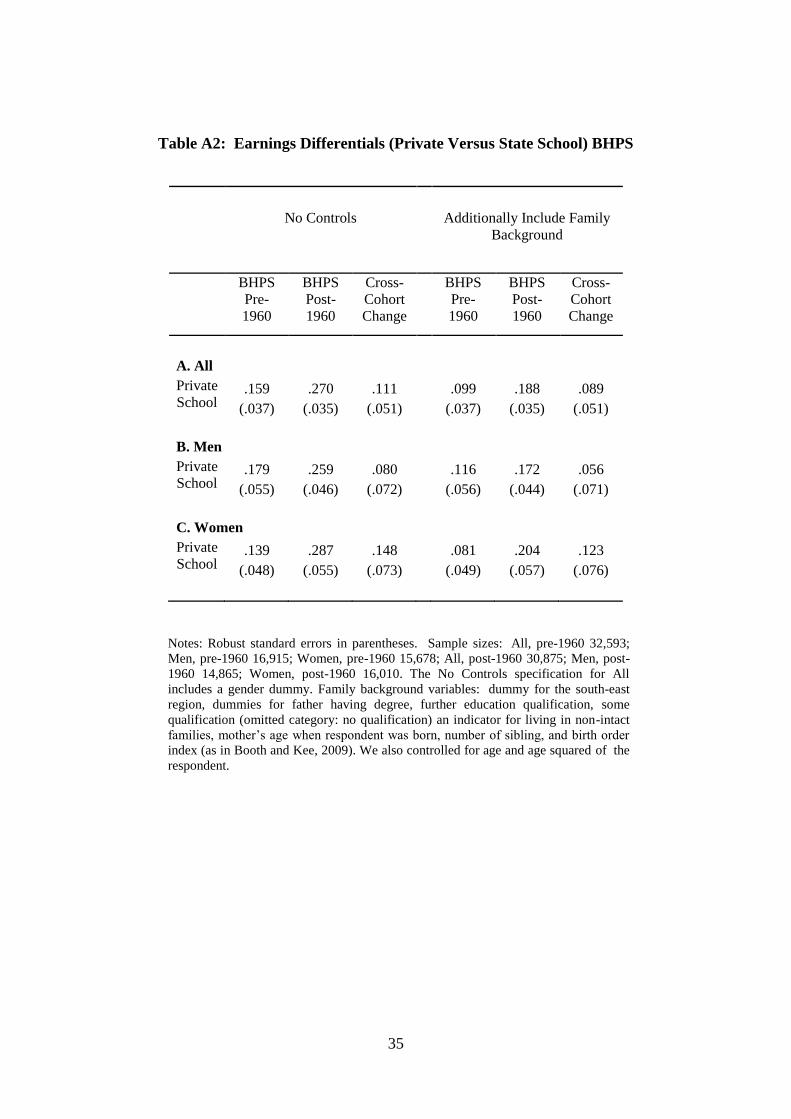
We have also cross-validated these findings (to the extent we can on a comparable basis)
with data from the British Household Panel Survey. Appendix Table A1 and A2 show
estimates analogous to Tables 1 and 2 for birth cohorts born before and after 1960 from the
BHPS (there are only two regression specifications in Table A2 as the BHPS data is not as
rich as the cohort data and does not include test score information). Reassuringly, the
pattern of results in the BHPS Tables very much confirm the findings from the cohorts and
the magnitude of the estimated premia are close. In the regression specification
conditioning on the same family background variables as the Table 2 middle specification,
the private/state wage earnings differential rises by .09 log points for all individuals, and by
.06 and .12 for men and women respectively.
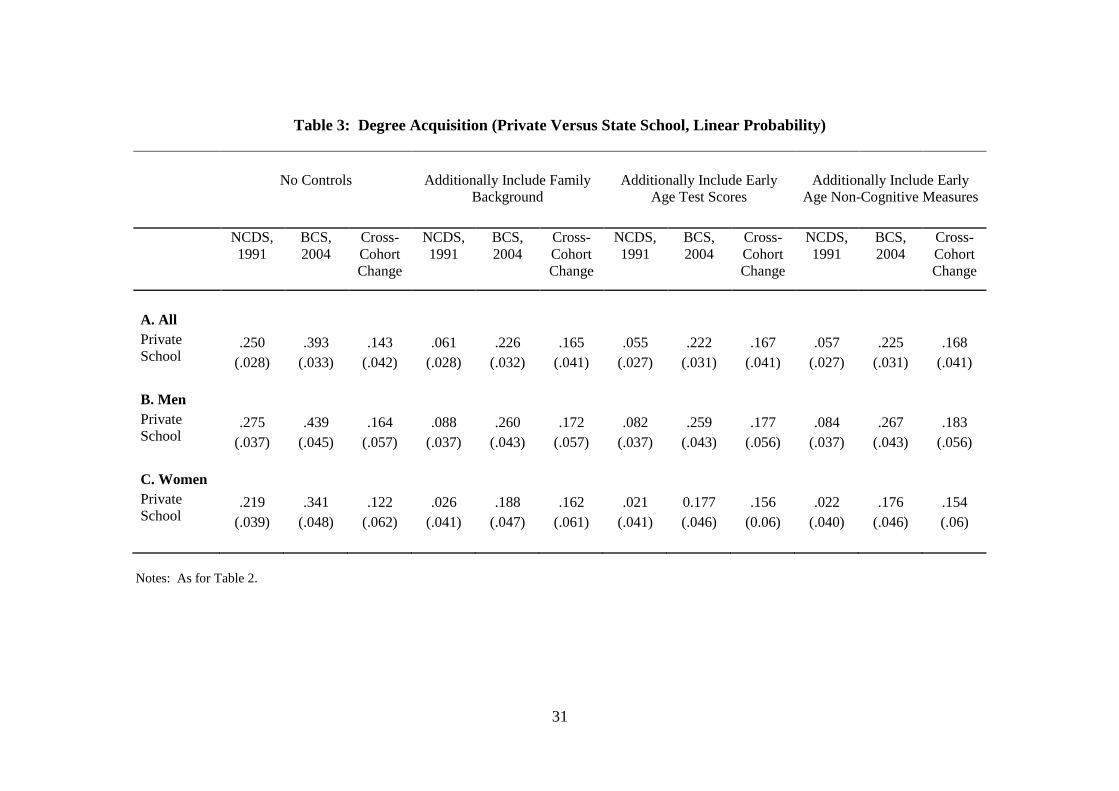
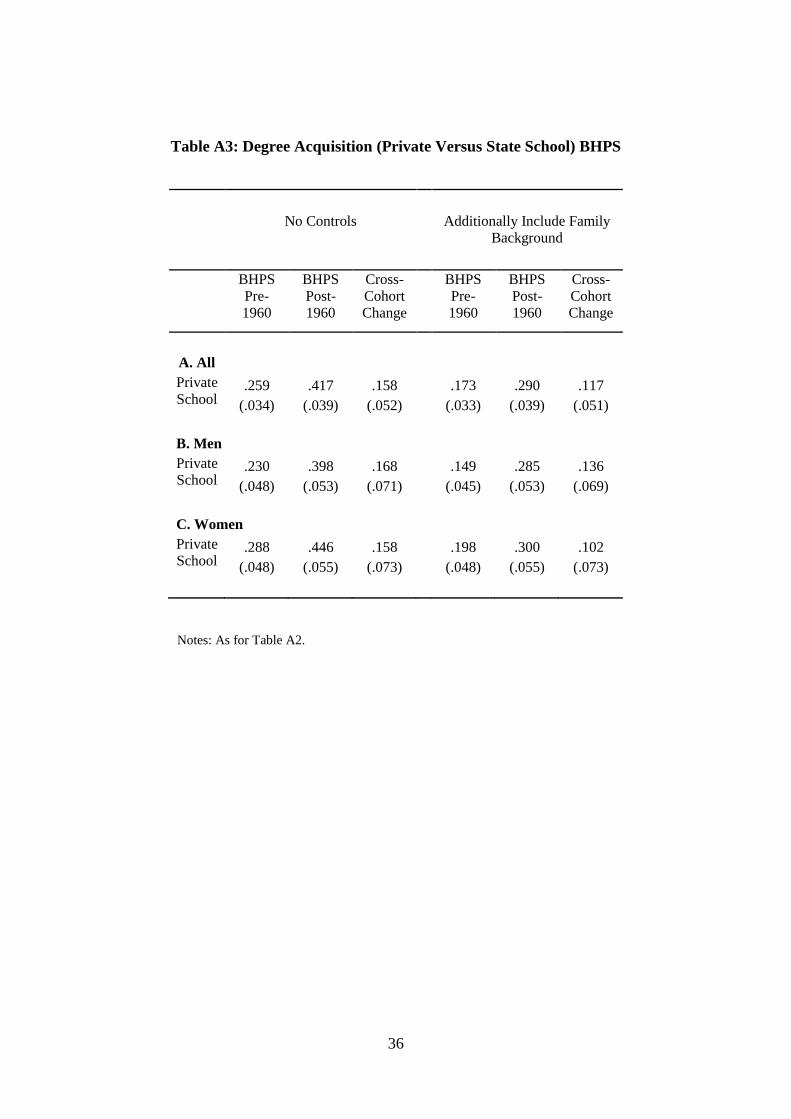
Cross-cohort changes in private/state degree acquisition differentials
Table 3 shows analogous models with degree acquisition by age 23 as the dependent
variable of interest. There are clear shifts in favour of the privately educated that occur over
time. In the full regression model there is a strongly significant rise in the private/state
degree acquisition proportion of .17. Increases are similar (and statistically significant) for
men and women at .18 and .15. Table A3 in the Appendix shows the same degree
15
acquisition equations for BHPS data and, again, a very similar set of results very much
corroborates the cross-cohort comparison of Table 3.
The explanatory role of changes in degree acquisition in changes in earnings
differentials
The analysis to date shows that earnings and educational attainment differentials have
moved sharply over time in favour of privately educated versus state educated individuals.
It is natural to ask how much of the rise in the earnings differential can be explained by
increased education. Table 4 shows a crude test of this by directly including highest
educational qualification in the Table 2 earnings equations. For all cohort members the .13
rise from the full specification from Table 2 falls to .06. Thus just over half (= [.13 -
.06]/.13) of the rise in the earnings differential can be attributed to differentially increased
education. The size of the education contribution from this naïve test is similar for men and
women when considered separately.
5 Discussion and Interpretation
The empirical results of the previous section make it clear that earnings and educational
attainment have improved at a faster rate for privately educated versus state educated
British individuals. So far this has been considered in isolation, but the findings have wider
relevance and also require some careful interpretation as to their meaning. This is what we
16
consider in this section, starting by linking the findings to the literatures on wage inequality
and social mobility, and then offering some discussion of how the findings should be
interpreted.
Connections to changing wage inequality
Wage inequality (i.e. the gap between the highest and lowest paid in society) has risen very
markedly in Britain since the late 1970s (see the recent analysis of four decades worth of
data in Machin, 2010). While the decade by decade evolution of wage gaps between the
rich and the poor have been different, a significant aspect of the inequality rise has been the
importance of changes in the wage returns to education (Katz and Autor, 1999; Machin and
Van Reenen, 2008). Indeed, the common perception is that education has become more
important as a determinant of labour market outcomes and that, as the average return to
education has risen, so has the variance of returns.13
Despite this, there is not much
evidence that connects information on schools attended to increased heterogeneity of wage
returns.
As private/state earnings and education differentials have widened out at the same time as
rising wage inequality, the findings we report suggest that type of school attended is likely
to have been a factor at play. This is both because of more rapid education acquisition and
rising relative wages for privately educated individuals in the labour market.
13
Indeed, evidence exists showing more variation in returns to observable indicators like degree
subject/college major (Machin and Puhani, 2003), to college quality (Black and Smith, 2006; Hussain,
McNally and Telhaj, 2009) and tilts in the wage structure by years of education (Lemieux, 2008; Angrist et
al., 2006; Green and Zhu, 2010).
17
Connections to changes in social mobility
On changing social mobility, one can see that the predominant economic and social
position of private school graduands can be seen alongside evidence of persistent class
separation in Britain (Goldthorpe and McKnight, 2004) and the period of decreased social
mobility (Blanden et al, 2004) that accompanied the general educational expansion of the
last quarter century. Argument over whether private education restricts mobility and
inculcates privilege, or whether it merely reflects the existing inequality, dates back at least
to the early 19th
century (Rae, 1981). Indeed, the presence of a significant earnings
premium attached to private school attendance underpins the argument that private schools
strengthen privilege, and tends to reinforce across generations the already existent
inequalities.
In the economic literature the extent of intergenerational income mobility is typically
measured by the coefficient in the following statistical regression for log earnings of
children (when of adult age), and parents:
child parents
i i iE = βE + e (4)
Evidence from Britain based upon a cross-cohort comparison shows that β has risen,
implying a fall in intergenerational mobility (Blanden et al, 2004). A literature exists which
tries to explore the reasons why (see Blanden and Machin, 2008) and it is straightforward to
decompose a change in β over time into earnings returns to given characteristics and the
connection between such characteristics and parental earnings. To see this, consider the
following two life cycle stages:
18
Stage 1, the relationship between earlier age/childhood factors, Z, and parental earnings:
parents
i i iZ = θE + u (5a)
Stage 2, the relationship between child earnings (as an adult) and these earlier age factors
child
i i iE = λZ + v (5b)
Here θ measures the sensitivity of Z to parental earnings and λ the income „returns‟
to Z, ( iu and iv are error terms). Substituting stage 1 into stage 2 yields the
intergenerational function child parents
i i iE = θλE + ω , making it evident that β = λθ.
To be more concrete for our interest, Z can be thought of as measuring private/state
education (the variable P above), so that θ measures the sensitivity of private/state
education to parental income (stylistically „how much more likely children from rich
backgrounds are likely to be privately educated‟) and λ the earnings differential between
private and state education („how much more the privately educated earn‟).
We have already demonstrated a significant rise in λ. What about θ? We consider this in
Table 5 where we report cross-cohort changes in the sensitivity of private versus state
school attendance to family income. It is evident from all specifications that people from
richer backgrounds are significantly more likely to attend private school. Importantly,
however, the empirical association with income is constant over time. Thus, on the
private/state school angle, falling social mobility is more connected to rising private/state
earnings differentials.
19
Changing sorting and selection
One obvious issue that arises in point-in-time cross-sectional studies that estimate the
private/state school earnings differential is a concern that either potentially high- earning or
potentially low-earning individuals may select or sort themselves into private school.14
To
the extent that either is the case, this would bias estimates of the earnings gap between
privately and state educated individuals.
Our analysis is different because the main interest is changes through time. Thus only if
any cross-sectional bias due to sorting/selection changes over time would our estimates of
the cross-cohort increase in the differential be biased. The richness of our cohort data,
however, helps us a lot here to (at least partly) appraise this issue. We can first see whether
private versus state school attendance differs on the usual kinds of observables that people
are able to look at. One example of this has already been considered in Table 5 where the
association with parental income is reasonably stable across cohorts.
However, there are many more typically unobservable variables available in our cohort data
that may result in individuals being differentially sorted into private school. Therefore one
strong point in our favour is our ability to include a lot of these prior controls as
observables, and we can consider many more than in most studies. We thus have looked at
the constancy (or otherwise) of associations between private school attendance and a range
of variables that can be consistently defined across the NCDS and BCS cohorts. To be
more specific, we have considered the following groups of variables:
14
The common perception is of children from high income backgrounds differentially sorting into private
schooling, though of course it is possible that some parents may choose private to compensate for perceived
problems (academic or non-academic) with their children.
20
i) parental income;
ii) demographic characteristics of children and their parents - these are the regression
controls contained in the X-vector in equations (1) to (3), detailed in the notes to Tables 2
to 4;
iii) early-age cognitive test scores;
iv) early-age non-cognitive skills;
The richness of these variables is an advantage over many of studies since we do have
variables that are usually thought of as unobservables (e.g. like the non-cognitive measures
available in the data). If these show similar cross-cohort associations with private school
attendance then it may be plausible that other variables that could cause differential sorting
may also do so.15
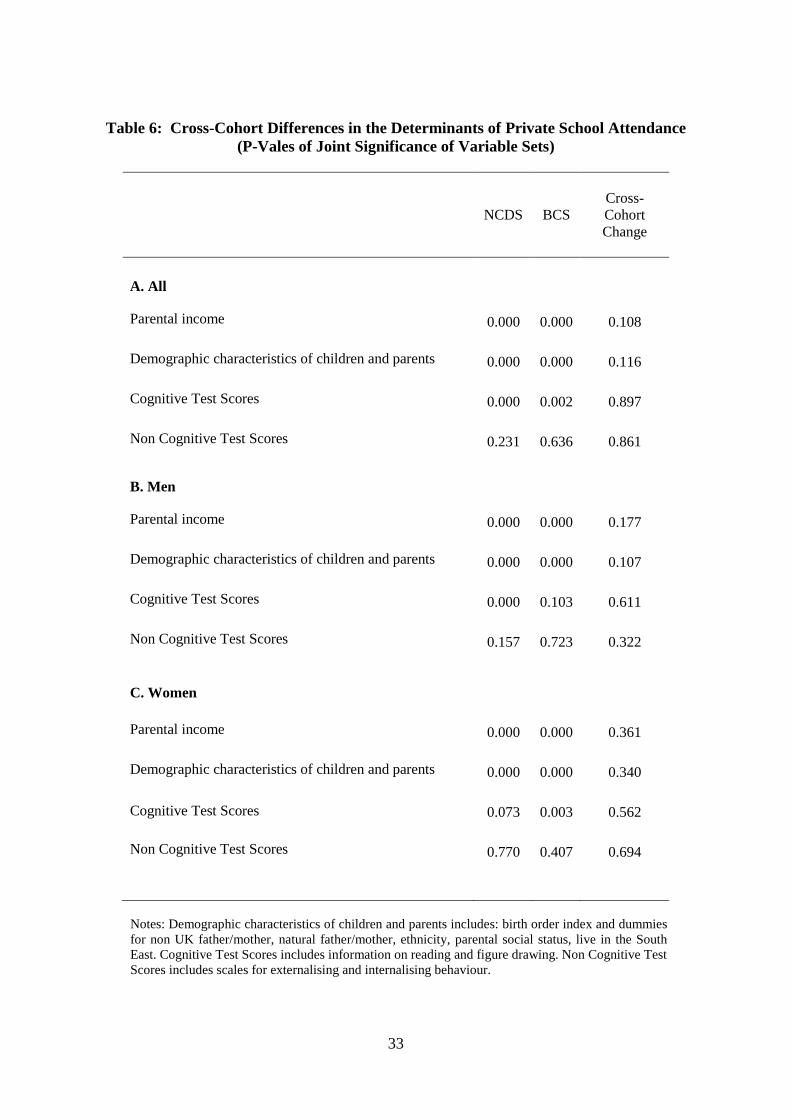
Table 6 provides tests of cross-cohort constancy of the estimated coefficients for the sets of
variables in i) to iv) above. Of course, within each cohort the factors contained in groups i)
to iv) are important predictors of private versus state school attendance as the significant p-
values in columns (1) and (2) of the Table show. However, and importantly for arguments
about differential sorting, the pattern shown in column (3) is striking in that private school
attendance seems to be correlated with these factors in very much the same way across
cohorts. All the p-values in column (3) show we cannot reject the null hypothesis of cross-
cohort neutrality in the associations between these groups of variables and attendance at
private school. Thus these factors do not cause any bias in the cross-cohort changes we
15
This is not unlike the Altonji, Elder and Taber (2005) argument on sorting on observables and
unobservables for US catholic schools, where they try to say how much bias due to unobservables would be
needed to offset their estimated effect of catholic schooling on test scores. As already noted, however, we are
able to model a number of the unobservables usually thought to matter.
21
report. It would need to be some other factor to start giving concerns that the rise in the
estimated private state earnings and education differentials may not be accurate. Even here,
given the size and significance of the rising private/state school wage differential, such
sorting bias would need to be large to overturn the temporal increase in the earnings
advantage accruing to private school attendance.
Estimates of the net return for parents
To obtain the increased earnings benefits from private school attendance, pupils‟ families
had to pay fees. A key question to ask is: did they get good value? While it is impossible to
provide a definitive answer to this question with available data, one can deduce an 'order of
magnitude' estimate for the average net return. Taking the private-school-educated
respondents in the BCS cohort, the average annual day fee was £1,500 (and the average
boarding fee £2,700) in 1980 prices. With an assumed 10-year private-school period, and
allowing for alternative cost reductions, this equates roughly to £43,000 for day students
(£75,000 for boarders) at 2000 prices. At this point in their lives our estimate (a 20%
premium) implies approximately an additional £5,000 extra pay received in 2000. While
this premium might alter over time it would extend into pension receipts. Using this figure
as a rough estimate of the annual gains over the course of a long post-school lifetime gives
an internal rate of return of approximately 13% (7%).
The estimates of the net return and the premium, however, are also subject to a few caveats.
Perhaps most importantly, the transformation of private schools changed considerably the
experience of children at private schools. Vastly improved facilities for diverse sporting and
22
cultural activities raised the quality of the experience over previous eras. These benefits,
which are widely known to be superior to those available in state schools, net out part of the
cost of private school investments. The estimated average net rate of return, 7-13%, is thus
likely to be an underestimate.
6 Conclusions
Despite its relatively small size, the private school sector plays a prominent role in British
society. A good understanding of the magnitude and source of the private school premium
and any trends over time is important from a public policy perspective. However, for
various reasons it seems that this subject has been almost entirely under-researched. In this
paper we provide a striking set of findings showing that earnings and education
differentials have risen significantly over time for privately educated versus state educated
individuals.
The implications of these findings are as follows. On average those paying for private
education in the 1970s and beyond were getting good value for their money. Above the fact
that private school pupils were spending their school lives enjoying facilities normally far
better than those available in state schools, these pupils benefited through improved pay
later in life, and the financial return is broadly comparable (and probably higher) than
returns on other capital.

23
It is also apparent that the chief means of delivering the labour market return is through the
better academic qualifications that are delivered by private schools using their rising
resources. If academic achievements are, therefore, to be a target for government policy,
emulation of the private schools would appear to be a policy worth considering.
Nevertheless the exclusiveness of the private schools is also shown in the fact that the
sector has not expanded beyond its roughly 7% of the total pupil base for many decades.
Our findings also imply that many others could have benefited from the boost given by the
resources available in private schooling, but did not do so. Since selection into the schools,
despite some bursaries and the Assisted Places Scheme, is primarily based on families‟
ability to pay, and given the substantial returns achieved, it is hard to escape the conclusion
that private schools during the period under examination also served to reproduce
inequalities in British society.16
Finally, it is worth noting that the NCDS/BCS cross-cohort comparison will not have
captured the more recent period of inflation-beating rises in school fees that occurred in the
recent decade. Therefore, the changes we have examined in this paper only cover the start
of a period of long-term transformation of the private school sector fuelled by rising
resources. There is an ongoing research need here, to examine whether very recent private
school graduands are getting still larger premiums to match the rising fees. We think that
research into these private returns should also be part of a broader plan for generating a
better understanding of the role of private schools in Britain, including their external effects
on other schools and within the labour market, with concomitant implications for both
education and taxation policies.
16
See Walford (1991: 103-121) for a balanced consideration of arguments for and against private schools in
the light of contemporaneous evidence.

24
References
Altonji, J., T. Elder and C. Taber (2005) Selection on Observed and Unobserved Variables:
Assessing the Effectiveness of Catholic Schools, Journal of Political Economy, 113,
151-84.
Angrist, J., V. Chernozhukov and I. Fernandez-Val (2006) Quantile Regression under
Misspecification, with an Application to the U.S. Wage Structure, Econometrica,
74, 569-83.
Berman, E., J. Bound and Z. Griliches (1994) Changes in the Demand for Skilled Labor
Within US Manufacturing: Evidence from the Annual Survey of Manufactures,
Quarterly Journal of Economics, 109, 367-397.
BIS (2010) One Step Beyond: Making the Most out of Postgraduate Education, Department
for Business, Innovation and Skills Postgraduate Review.
Black, D. and J. Smith (2006) Estimating the Returns to College Quality with Multiple
Proxies for Quality, Journal of Labor Economics, 24, 701-28.
Blanden J., A. Goodman, P. Gregg and S. Machin (2004) Changes in Intergenerational
Mobility in Britain, in M. Corak (ed.) Generational Income Mobility, Cambridge
University Press.
Blanden, J. P. Gregg and L. Macmillan (2008) Accounting for Intergenerational
Persistence: Non-Cognitive Skills, Ability and Education, Economic Journal, 117,
C43-C60.
Blanden, J. and S. Machin (2008) Up and Down the Generational Income Ladder: Past
Changes and Future Prospects, National Institute Economic Review, July: 101-116.
Booth, A. and H. Kee (2009) Birth Order Matters: The Effect of Family Size and Birth
Order on Educational Attainment, 22, 367-97.
Boyd, D. (1973) Elites and Their Education. The Educational and Social Backgrounds of
Eight Elite Groups, Slough, NFER.
Dearden, L., J. Ferri and C. Meghir (2002) The Effect of School Quality on Educational
Attainment and Wages, Review of Economics and Statistics, 84, 1-20
Dolton, P. and A. Vignoles (2000) The Incidence and Effects of Over-Education in the
U.K. Graduate Labour Market, Economics of Education Review, 19, 179-198
25
Fitz, J., T. Edwards and G. Whitty (1989) The Assisted Places Scheme: An Ambigous Case
of Privatization, British Journal of Educational Studies, 37, 222-234.
Glennerster, H. and G. Wilson (1970). Paying For Private Schools. London, Allen Lane.
Goldthorpe, J. and A. McKnight (2004) The Economic Basis of Social Class, Centre for
Analysis of Social Exclusion, Case Paper 80.
Graddy, K. and M. Stevens (2003) The Impact of School Inputs on Student Performance:
An Empirical Study of Private Schools in the United Kingdom, Industrial and Labor
Relations Review, 58, 435-51.
Green, F., S. Machin, R. Murphy and Y. Zhu (2008) Competition for Private and State
School Teachers, Journal of Education and Work, 21, 383-404.
Green, F. and Y. Zhu (2010) Overqualification, Job Dissatisfaction, and Increasing
Dispersion in the Returns to Graduate Education, Oxford Economic Papers 62 (2).
HEFCE (2005) Schooling Effects on Higher Education Achievement: Further Analysis –
Entry at 19, Higher Education Funding Council for England Issues Paper 2005/09.
Hussain, I., S. McNally and S. Telhaj (2009) University Quality and Graduate Wages in the
UK, Centre for the Economics of Education Discussion Paper 99.
ISC (2003) Good Neighbours, London: Independent Schools Council.
Katz, L. and D. Autor (1999) Changes in the Wage Structure and Earnings Inequality, in
O. Ashenfelter and D. Card (eds.) Handbook of Labor Economics, Volume 3, North
Holland.
Lemieux, T. (2008) The Changing Nature of Wage Inequality, Journal of Population
Economics, 21, 21-48.
Machin. S. (2010) Changes in UK Wage Inequality Over the Last Forty Years, CEP
mimeo.
Machin, S. and R. Murphy (2010) The Social Composition and Future Earnings of
Postgraduates, Sutton Trust report.
Machin, S. and P. Puhani (2003) Subject of Degree and the Gender Wage Differential:
Evidence from the UK and Germany, Economics Letters, 79, 393-400.
Machin, S. and J. Van Reenen (2008) Changes in Wage Inequality, in New Palgrave
Dictionary of Economics.
Manning, A. and S. Pischke (2006) Comprehensive Versus Selective Schooling in England
and Wales: What Do We Know?, Centre for the Economics of Education
Discussion Paper 66.
26
Naylor, R. and J. Smith (2004) Degree Performance of Economics Students in UK
Universities: Absolute and Relative Performance in Prior Qualifications, Scottish
Journal of Political Economy, 51, 250-265.
Naylor, R., J. Smith and A. McKnight (2002) Why is There a Graduate Earnings Premium
for Students From Independent Schools?, Bulletin of Economic Research, 54, 315-
339.
Power, S., T. Edwards, G. Whitty and V. Wigfall (2003) Education in the Middle Class,
Buckingham: Open University Press.
Power, S., G. Whitty and E. Wisby (2006). The Education and Career Trajectories of
Assisted Place Holders, The Sutton Trust.
Power, S., A. Curtis, G. Whitty, T. Edwards and S. Exley (2009). "Embers From The
Ashes”? The Experience Of Being An Assisted Place Holder, The Sutton Trust.
Rae, J. (1981) The Public School Revolution. Britain's Independent Schools 1964-1979,
London: Faber and Faber.
Reid, I. (1986) The Sociology of School and Education, London: Fontana.
Sanderson, M. (1999) Education and Economic Decline In Britain, 1870 to the 1990s.
Cambridge, Cambridge University Press.
Smith, J. and R. Naylor (2001) Determinants of Degree Performance in UK Universities: A
Statistical Analysis of the 1993 Cohort, Oxford Bulletin of Economics and
Statistics, 63, 29-60.
Smith, J. and R. Naylor (2005) Schooling Effects on Subsequent University Performance:
Evidence for the UK University Population, Economics of Education Review, 24,
549-562.
Sutton Trust, The (2005a) The Educational Backgrounds of Members of the House of the
UK‟s top Solicitors, Barristers, and Judges.
Sutton Trust, The (2005b) The Educational Backgrounds of Members of the House of
Commons and House of Lords.
Sutton Trust, The (2006) The Educational Backgrounds of Leading Journalists.
Walford, G. (1986) Life in Public Schools, Methuen.
Walford, G. (1990) Privatization and Privilege in Education. London, Routledge.
Walford, G. (1991) Private Schools: Tradition, Change and Diversity, Paul Chapman
Publishing.
27
Figure 1: The Relative Quantity of Private Education, England 1964-2006
Notes: Source - DSCF 2007; i) Full Time Pupils Only; ii) State Sector Includes; Primary, Secondary, Nursery
& Special Schools; iii) Includes both the full-time and the full-time equivalent of part-time teachers; iv) From
1971 onwards, state sector only includes qualified teachers; v) Independent Sector includes Direct Grant
Grammar Schools up to and including 1980; vi) From 1990 Independent Sector includes City Technology
Colleges; vii) From 2004 Independent Sector includes City Academies.
Figure 2: The Price of Private Education.
Notes: Source – Independent Schools Council Census Data, 1982-2008; Authors‟ calculations; RPI,
ONS 2006; Prior to 1992 the average fee is not weighted by school size.
5
6
7
8
9
10
11
12
13
14
15
1964 1967 1970 1973 1976 1979 1982 1985 1988 1991 1994 1997 2000 2003 2006
Year
% o
f E
ng
lish
To
tals Teachers
Schools
Full Time Pupils
Annual School Fees, 1981-2007
0
4000
8000
12000
16000
20000
24000
1981 1984 1987 1990 1993 1996 1999 2002 2005
Year
Av
era
ge
Rea
l F
ees
(£,
20
07
Pri
ces)
Boarding
Day
28
Figure 3: The Pupil-Teacher Ratio, England, 1964-2006.
Notes: i) Full Time Pupils Only; ii) State Sector Includes; Primary, Secondary, Nursery & Special Schools;
iii) Includes both the full-time and the full-time equivalent of part-time teachers; iv) From 1971 onwards,
state sector only includes qualified teachers; v) Private Sector includes Direct Grant Grammar Schools up
to and including 1980; vi) From 1990 Private Sector includes City Technology Colleges; vii) From 2004
Private Sector includes City Academies.
Figure 4: Applications and Acceptances to Oxbridge from Private Schools
Source: Oxford and Cambridge Admissions Offices.
8
10
12
14
16
18
20
22
24
26
1964 1967 1970 1973 1976 1979 1982 1985 1988 1991 1994 1997 2000 2003 2006
Year
Pu
pil
Tea
cher
Ra
tio
State Sector
Independent
Sector
0.2
0.25
0.3
0.35
0.4
0.45
0.5
0.55
0.6
1970 1973 1976 1979 1982 1985 1988 1991 1994 1997 2000 2003 2006
Pro
po
rtio
n
Year
Applications Oxford
Acceptances Oxford
Applications Cambridge
Acceptances Cambridge
29
Table 1: Descriptive Statistics
NCDS Cohort
[Earnings in 1991, age 33;
Degree Acquisition in 1981, age
23]
BCS Cohort
[Earnings in 2004, age 34;
Degree Acquisition in 1993, age
23]
Cross-
Cohort
Change
Private State
Private/State
Differential
(Standard
Error)
Private State
Private/State
Differential
(Standard
Error)
Change in
Private/State
Differential
(Standard
Error)
A. All
Log Real
Earnings
2.385 2.162 0.223
(0.035)
2.650 2.306 0.344
(0.041)
0.121
(0.054)
Degree 0.413 0.163 0.250
(0.027)
0.586 0.192 0.393
(0.033)
0.144
(0.042)
B. Men
Log Real
Earnings
2.535 2.305 0.230
(0.056)
2.729 2.416 0.313
(0.056)
0.083
(0.069)
Degree 0.442 0.167 0.275
(0.036)
0.625 0.186 0.439
(0.045)
0.164
(0.057)
C. Women
Log Real
Earnings
2.203 1.976 0.227
(0.051)
2.562 2.176 0.386
(0.059)
0.159
(0.078)
Degree 0.376 0.157 0.219
(0.039)
0.542 0.201 0.341
(0.048)
0.124
(0.062)
Notes: Standard errors in parentheses. Sample sizes: All, NCDS 4,869; Men, NCDS 2,742; Women, NCDS
2,127; All, BCS 4,778; Men, BCS 2,573; Women, BCS 2,111.
30
Table 2: Earnings Differentials (Private Versus State School)
No Controls Additionally Include Family
Background
Additionally Include Early
Age Test Scores
Additionally Include Early
Age Non-Cognitive Measures
NCDS,
1991
BCS,
2004
Cross-
Cohort
Change
NCDS,
1991
BCS,
2004
Cross-
Cohort
Change
NCDS,
1991
BCS,
2004
Cross-
Cohort
Change
NCDS,
1991
BCS,
2004
Cross-
Cohort
Change
A. All
Private
School
.228
(.034)
.348
(.039)
.120
(.052)
.078
(.035)
.202
(.039)
.124
(.052)
.070
(.034)
.197
(.039)
.127
(.051)
.072
(.034)
.201
(.039)
.129
(.051)
B. Men
Private
School
.230
(.044)
.313
(.053)
.083
(.069)
.083
(.045)
.170
(.053)
.087
(.070)
.075
(.045)
.177
(.053)
.102
(.069)
.077
(.045)
.184
(.053)
.107
(.069)
C.
Women
Private
School
.227
(.052)
.386
(.059)
.159
(.078)
.074
(.053)
.261
(.058)
.187
(.078)
.064
(.052)
.246
(.058)
.182
(.077)
.065
(.052)
.244
(.058)
.179
(.077)
Notes: Standard errors in parentheses. Sample sizes: All, NCDS 4,869; Men, NCDS 2,742; Women, NCDS 2,127; All, BCS 4,778; Men, BCS 2,573;
Women, BCS 2,111. The No Controls specification for All includes a gender dummy. Family background variables: dummy for the south-east region, age
natural parents left school, dummies for natural parents being present, and being a UK national along with current age and social status. A non-white
dummy for cohort member is included along with number of siblings and birth order index (see Booth and Kee 2009). Non cognitive test scores:
Internalising and Externalising behaviour generated by principal component analysis for the following characteristics; Internalising- headaches, sleeping
problems, eating problems, wetting bed, worries a lot, unhappy, sucks thumb, bites nails, fearful, unliked, solitary; Externalising – Temper tantrums, highly
active, fidgets, destroys belongings, fights, irritable, cannot settle.
31
Table 3: Degree Acquisition (Private Versus State School, Linear Probability)
No Controls Additionally Include Family
Background
Additionally Include Early
Age Test Scores
Additionally Include Early
Age Non-Cognitive Measures
NCDS,
1991
BCS,
2004
Cross-
Cohort
Change
NCDS,
1991
BCS,
2004
Cross-
Cohort
Change
NCDS,
1991
BCS,
2004
Cross-
Cohort
Change
NCDS,
1991
BCS,
2004
Cross-
Cohort
Change
A. All
Private
School .250 .393 .143 .061 .226 .165 .055 .222 .167 .057 .225 .168
(.028) (.033) (.042) (.028) (.032) (.041) (.027) (.031) (.041) (.027) (.031) (.041)
B. Men
Private
School .275 .439 .164 .088 .260 .172 .082 .259 .177 .084 .267 .183
(.037) (.045) (.057) (.037) (.043) (.057) (.037) (.043) (.056) (.037) (.043) (.056)
C. Women
Private
School .219 .341 .122 .026 .188 .162 .021 0.177 .156 .022 .176 .154
(.039) (.048) (.062) (.041) (.047) (.061) (.041) (.046) (0.06) (.040) (.046) (.06)
Notes: As for Table 2.

32
Table 4: Earnings Differentials (Private Versus State School)
Controlling For Highest Qualification
Full Specification From Table 2
(Including Family Background, Early
Age Test Scores and Early Age Non-
Cognitive Measures)
Additionally Control For Highest
Qualification
NCDS,
1991
BCS,
2004
Cross-
Cohort
Change
NCDS,
1991
BCS,
2004
Cross-
Cohort
Change
A. All
Private
School
.072 .201 .129 .042 .102 .060
(.034) (.039) (.051) (.032) (.037) (.049)
B.Men
Private
School
.077 .184 .107 .039 .084 .045
(.045) (.053) (.069) (.043) (.050) (.066)
C. Women
Private
School
.065 .244 .179 .043 .146 .103
(.052) (.057) (.077) (.049) (.054) (.072)
Notes: As for Tables 2 and 3.
Table 5: Private School Attendance and Standardised Family Income
(Linear Probability)
NCDS BCS Cross-Cohort Change
A. All
Log(Family Income) 0.017 0.025 0.007
(0.003) (0.003) (0.004)
B. Men
Log(Family Income) 0.015 0.023 0.008
(0.004) (0.004) (0.006)
C. Women
Log(Family Income) 0.02 0.027 0.007
(0.005) (0.004) (0.006)
Notes: Standard errors in parentheses. Sample sizes: All, NCDS 4,869; Men, NCDS 2,742; Women,
NCDS 2,127; All, BCS 4,780; Men, BCS 2,573; Women, BCS 2,111. Family income measured at age 16.
33
Table 6: Cross-Cohort Differences in the Determinants of Private School Attendance
(P-Vales of Joint Significance of Variable Sets)
NCDS BCS
Cross-
Cohort
Change
A. All
Parental income 0.000 0.000 0.108
Demographic characteristics of children and parents 0.000 0.000 0.116
Cognitive Test Scores 0.000 0.002 0.897
Non Cognitive Test Scores 0.231 0.636 0.861
B. Men
Parental income 0.000 0.000 0.177
Demographic characteristics of children and parents 0.000 0.000 0.107
Cognitive Test Scores 0.000 0.103 0.611
Non Cognitive Test Scores 0.157 0.723 0.322
C. Women
Parental income 0.000 0.000 0.361
Demographic characteristics of children and parents
0.000 0.000 0.340
Cognitive Test Scores 0.073 0.003 0.562
Non Cognitive Test Scores 0.770 0.407 0.694
Notes: Demographic characteristics of children and parents includes: birth order index and dummies
for non UK father/mother, natural father/mother, ethnicity, parental social status, live in the South
East. Cognitive Test Scores includes information on reading and figure drawing. Non Cognitive Test
Scores includes scales for externalising and internalising behaviour.
34
Appendix
Table A1: Descriptive Statistics BHPS
BHPS Pre-1960 Cohorts (Mean
Age = 48.7)
BHPS Post-1960 Cohorts
(Mean Age = 33.4)
Cross-
Cohort
Change
Private State Private/State
Differential
(Standard
Error)
Private State Private/State
Differential
(Standard
Error)
Change in
Private/State
Differential
(Standard
Error)
A. All Log
Real
Earnings
2.233 2.079 0.154
(0.038) 2.411 2.122 0.289
(0.035) 0.135
(0.052)
Degree 0.395 0.136 0.259
(0.034) 0.618 0.201 0.417
(0.039) 0.159
(0.052)
B. Men Log
Real
Earnings
2.377 2.198 0.179
(0.055) 2.461 2.202 0.259
(0.046) 0.080
(0.072)
Degree 0.379 0.149 0.230
(0.048) 0.599 0.201 0.398
(0.053) 0.168
(0.071)
C. Women Log
Real
Earnings
2.089 1.951 0.138
(0.048) 2.336 2.045 0.287
(0.055) 0.148
(0.072)
Degree 0.4115 0.123 0.288
(0.048) 0.647 0.201 0.446
(0.055) 0.158
(0.073)
Notes: Robust standard errors in parentheses. Sample sizes: All, pre-1960 32,593; Men, pre-1960
16,915; Women, pre-1960 15,678; All, post-1960 30,875; Men, post-1960 14,865; Women, post-1960
16,010.
35
Table A2: Earnings Differentials (Private Versus State School) BHPS
No Controls Additionally Include Family
Background
BHPS
Pre-
1960
BHPS
Post-
1960
Cross-
Cohort
Change
BHPS
Pre-
1960
BHPS
Post-
1960
Cross-
Cohort
Change
A. All
Private
School .159 .270 .111 .099 .188 .089
(.037) (.035) (.051) (.037) (.035) (.051)
B. Men
Private
School .179 .259 .080 .116 .172 .056
(.055) (.046) (.072) (.056) (.044) (.071)
C. Women
Private
School .139 .287 .148 .081 .204 .123
(.048) (.055) (.073) (.049) (.057) (.076)
Notes: Robust standard errors in parentheses. Sample sizes: All, pre-1960 32,593;
Men, pre-1960 16,915; Women, pre-1960 15,678; All, post-1960 30,875; Men, post-
1960 14,865; Women, post-1960 16,010. The No Controls specification for All
includes a gender dummy. Family background variables: dummy for the south-east
region, dummies for father having degree, further education qualification, some
qualification (omitted category: no qualification) an indicator for living in non-intact
families, mother‟s age when respondent was born, number of sibling, and birth order
index (as in Booth and Kee, 2009). We also controlled for age and age squared of the
respondent.
36
Table A3: Degree Acquisition (Private Versus State School) BHPS
No Controls Additionally Include Family
Background
BHPS
Pre-
1960
BHPS
Post-
1960
Cross-
Cohort
Change
BHPS
Pre-
1960
BHPS
Post-
1960
Cross-
Cohort
Change
A. All
Private
School .259 .417 .158 .173 .290 .117
(.034) (.039) (.052) (.033) (.039) (.051)
B. Men
Private
School .230 .398 .168 .149 .285 .136
(.048) (.053) (.071) (.045) (.053) (.069)
C. Women
Private
School .288 .446 .158 .198 .300 .102
(.048) (.055) (.073) (.048) (.055) (.073)
Notes: As for Table A2.