the challenge of reducing energy consumption of … · the challenge of reducing energy consumption...
TRANSCRIPT
Energy Policy, Volume 38: Issue 11. November 2010
1
The Challenge of Reducing Energy Consumption of the Top-1000 Largest Industrial Enterprises in China*
Lynn Price a, Xuejun Wang b and Jiang Yun c
a China Energy Group, Energy Analysis Department, Environmental Energy Technologies
Division, Ernest Orlando Lawrence Berkeley National Laboratory, 1 Cyclotron Road, MS
90R4000, Berkeley, CA 94720, United States
b
College of Environmental Sciences, Peking University, Beijing 100871, China
c
China Energy Conservation Association, No. 18, Bei San Huan Dong Lu, Beijing 100013,
China
Abstract
In 2005, the Chinese government announced an ambitious goal of reducing energy
consumption per unit of GDP by 20% between 2005 and 2010. One of the key initiatives for
realizing this goal is the Top-1000 Energy-Consuming Enterprises program. The energy
consumption of these 1000 enterprises accounted for 33% of national and 47% of industrial
energy usage in 2004. Under the Top-1000 program, 2010 energy consumption targets were
determined for each enterprise. The objective of this article is to evaluate the program design
and initial results, given limited information and data, in order to understand the possible
implications of its success in terms of energy and carbon dioxide emissions reductions and to
recommend future program modifications based on international experience with similar
target-setting agreement programs. Even though the Top-1000 Program was designed and
implemented rapidly, it appears that – depending upon the GDP growth rate -- it could
contribute to somewhere between approximately 10% and 25% of the savings required to
support China’s efforts to meet a 20% reduction in energy use per unit of GDP by 2010.
Key Words: Top-1000, industrial energy efficiency, China
*This manuscript has been authored by an author at Lawrence Berkeley National Laboratory under Contract No.
DE-AC02-05CH11231 with the U.S. Department of Energy. The U.S. Government retains, and the publisher, by
accepting the article for publication, acknowledges, that the U.S. Government retains a non-exclusive, paid-up,
irrevocable, world-wide license to publish or reproduce the published form of this manuscript, or allow others to
do so, for U.S. Government purposes.
Energy Policy, Volume 38: Issue 11. November 2010
2
Introduction
China’s 11th
Five Year Plan, announced in 2005, established an ambitious goal of reducing
energy intensity, defined as energy consumption per unit of gross domestic product (GDP),
by 20% between 2005 and 2010. Even though China’s GDP increased at an average annual
growth rate of 9.8% from 2000 to 2005, the current goal assumes an average GDP growth
rate of 7.5% from 2005 to 2010, which implies that energy use will only increase at an
average rate of 2.8%. However, both GDP and energy use have been growing much faster
recently. In 2006, total energy consumption reached 2,457 million tons of coal equivalent
(Mtce), equivalent to 72 exajoules (EJ), a 9.3% increase from 2005, while the GDP growth
rate was 10.7% (NBS, 2007).
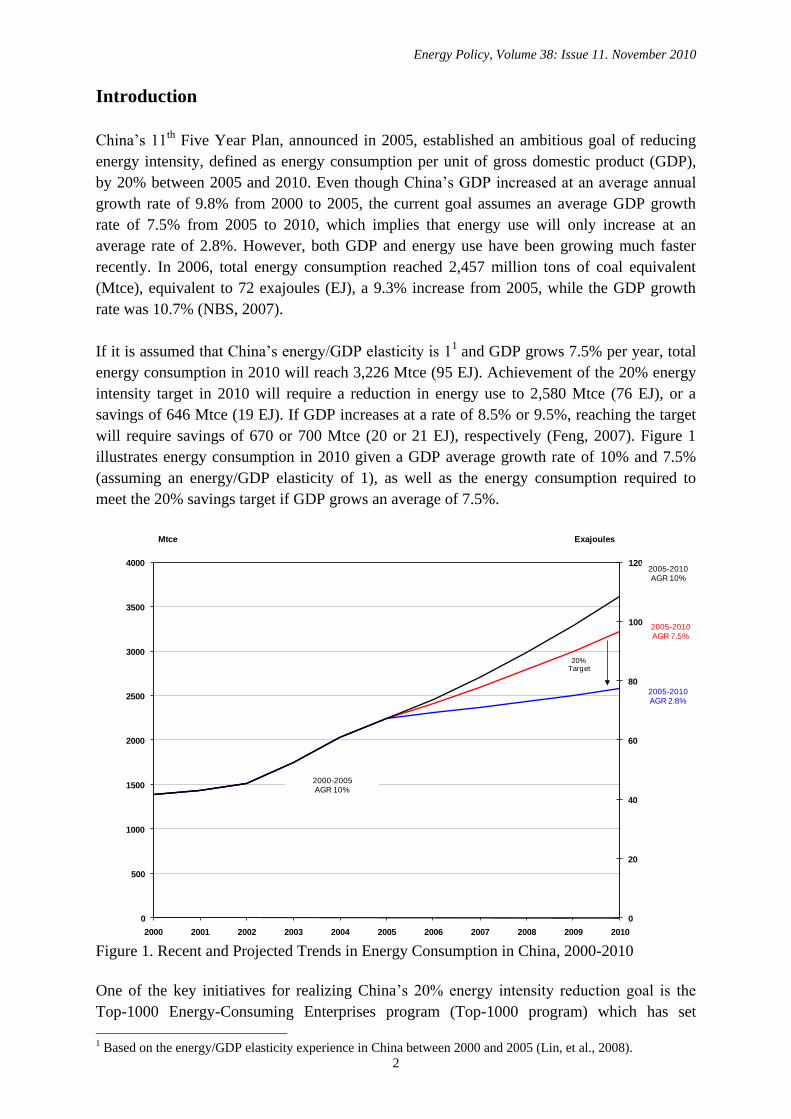
If it is assumed that China’s energy/GDP elasticity is 11 and GDP grows 7.5% per year, total
energy consumption in 2010 will reach 3,226 Mtce (95 EJ). Achievement of the 20% energy
intensity target in 2010 will require a reduction in energy use to 2,580 Mtce (76 EJ), or a
savings of 646 Mtce (19 EJ). If GDP increases at a rate of 8.5% or 9.5%, reaching the target
will require savings of 670 or 700 Mtce (20 or 21 EJ), respectively (Feng, 2007). Figure 1
illustrates energy consumption in 2010 given a GDP average growth rate of 10% and 7.5%
(assuming an energy/GDP elasticity of 1), as well as the energy consumption required to
meet the 20% savings target if GDP grows an average of 7.5%.
Figure 1. Recent and Projected Trends in Energy Consumption in China, 2000-2010
One of the key initiatives for realizing China’s 20% energy intensity reduction goal is the
Top-1000 Energy-Consuming Enterprises program (Top-1000 program) which has set
1 Based on the energy/GDP elasticity experience in China between 2000 and 2005 (Lin, et al., 2008).
0
20
40
60
80
100
120
0
500
1000
1500
2000
2500
3000
3500
4000
2000 2001 2002 2003 2004 2005 2006 2007 2008 2009 2010
ExajoulesMtce
2005-2010 AGR 2.8%
2005-2010 AGR 7.5%
20%Target
2000-2005 AGR 10%
2005-2010 AGR 10%
Energy Policy, Volume 38: Issue 11. November 2010
3
energy-saving targets for China’s 1000 highest energy-consuming enterprises. The Top-1000
program was launched by the Department of Resource Conservation and Environmental
Protection of the National Development and Reform Commission (NDRC), the National
Bureau of Statistics (NBS), the State-owned Assets Supervision and Administration
Commission, the Office of National Energy Leading Group, and the General Administration
of Quality Supervision, Inspection and Quarantine in April 2006 (NDRC, 2006a). The
government provided guidance to the enterprises, calling on them to significantly improve
their energy efficiency with the goal that energy intensity (energy used per unit of
production) reach the level of advanced domestic production and that some enterprises attain
either international or industry advanced levels of energy intensity. The implementation plan
further stipulated that the enterprises within the Top-1000 program should realize savings of
100 Mtce (2.9 EJ) between 2006 and 2010 from the expected 2010 energy consumption of
these 1000 enterprises (NDRC, 2006a).
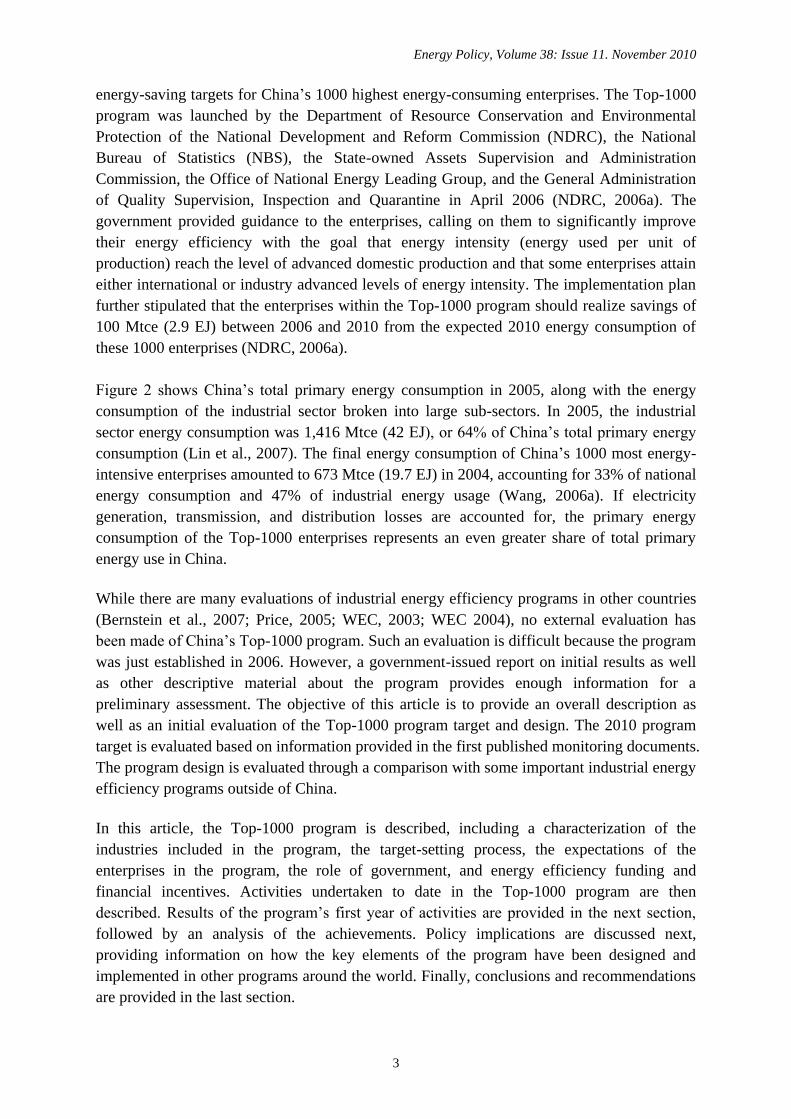
Figure 2 shows China’s total primary energy consumption in 2005, along with the energy
consumption of the industrial sector broken into large sub-sectors. In 2005, the industrial
sector energy consumption was 1,416 Mtce (42 EJ), or 64% of China’s total primary energy
consumption (Lin et al., 2007). The final energy consumption of China’s 1000 most energy-
intensive enterprises amounted to 673 Mtce (19.7 EJ) in 2004, accounting for 33% of national
energy consumption and 47% of industrial energy usage (Wang, 2006a). If electricity
generation, transmission, and distribution losses are accounted for, the primary energy
consumption of the Top-1000 enterprises represents an even greater share of total primary
energy use in China.
While there are many evaluations of industrial energy efficiency programs in other countries
(Bernstein et al., 2007; Price, 2005; WEC, 2003; WEC 2004), no external evaluation has
been made of China’s Top-1000 program. Such an evaluation is difficult because the program
was just established in 2006. However, a government-issued report on initial results as well
as other descriptive material about the program provides enough information for a
preliminary assessment. The objective of this article is to provide an overall description as
well as an initial evaluation of the Top-1000 program target and design. The 2010 program
target is evaluated based on information provided in the first published monitoring documents.
The program design is evaluated through a comparison with some important industrial energy
efficiency programs outside of China.
In this article, the Top-1000 program is described, including a characterization of the
industries included in the program, the target-setting process, the expectations of the
enterprises in the program, the role of government, and energy efficiency funding and
financial incentives. Activities undertaken to date in the Top-1000 program are then
described. Results of the program’s first year of activities are provided in the next section,
followed by an analysis of the achievements. Policy implications are discussed next,
providing information on how the key elements of the program have been designed and
implemented in other programs around the world. Finally, conclusions and recommendations
are provided in the last section.
Energy Policy, Volume 38: Issue 11. November 2010
4
Figure 2. Energy Consumption of China, China’s Industrial Sector, and the Top-1000
Energy-Consuming Enterprises, 2005
Note: Top-1000 program energy consumption is typically reported in final energy units (dark blue box). The
shaded area provides the Mtce equivalent of electricity generation, transmission, and distribution losses so that
the Top-1000 program can be compared in primary energy terms with the other two bars. Industry sub-sector
breakdown based on LBNL LEAP model, not Chinese statistics.
Description of the Top-1000 Energy-Consuming Enterprise Program
Background
China’s Top-1000 program is modeled on international target-setting programs (also called
voluntary or negotiated agreement programs). These types of target-setting programs that
focus on energy efficiency improvement and reduction of energy-related greenhouse gas
(GHG) emissions by industry have been implemented in industrialized countries since the
1990s. Such agreement programs typically include a contract between the government and
industry with negotiated targets and have a long-term outlook, covering a period of five to ten
years, so that strategic energy-efficiency investments can be planned and implemented. A key
element is that they focus the attention of all actors on energy efficiency or emission
reduction goals. Such programs include the assessment of the energy-efficiency potential of
the industrial facility as well as target-setting through a negotiated process. Supporting
programs and policies, such as facility audits, assessments, benchmarking, monitoring,
information dissemination, and financial incentives all play an important role in assisting the
participants in understanding and managing their energy use and GHG emissions in order to
meet the target goals (Price, 2005).
-
500
1,000
1,500
2,000
2,500
Total Industry Top-1000 Enterprises
Pri
ma
ry E
ne
rgy C
on
su
mp
tio
n 2
00
5 (m
illio
n tce
)
Commercial
Residential
Transport
Industry
Agriculture
Other Industry
Ethylene
Paper
Cement
Iron and Steel
Aluminium
Ammonia
Glass
Energy Policy, Volume 38: Issue 11. November 2010
5
The Economic and Trade Commission of Shandong Province undertook a target-setting
energy efficiency agreement pilot project with two iron and steel enterprises in 2003 which
was modeled after successful international industrial voluntary agreement programs, taking
China-specific conditions into consideration (Price et al., 2003). The main participants in the
pilot project were two iron and steel enterprises in Shandong Province – Jinan Iron and Steel
(Jigang) and Laiwu Iron and Steel (Laigang), the Shandong Economic and Trade
Commission (ETC), the State Economic and Trade Commission (SETC), and the China
Energy Conservation Association (CECA).2 The agreements had a base year of 2002 and set
performance targets for 2005 (Price et al., 2003). Over this period, Jinan Iron and Steel saved
292,000 tce (8.6 PJ) and reduced energy consumption per ton of steel by 9.5% while Laiwu
saved 130,000 tce (3.8 PJ) and reduced its energy intensity by 9% (Wang, 2007). The pilot
was considered a success due to the achievement of the targets along with the knowledge
gained related to establishing targets, energy management within the companies, making
energy-efficiency investments, and establishing energy efficiency policies at the provincial
level (Hu, 2007). The pilot was used as a model for the Top-1000 program.
Characterization of the Top-1000 Industries
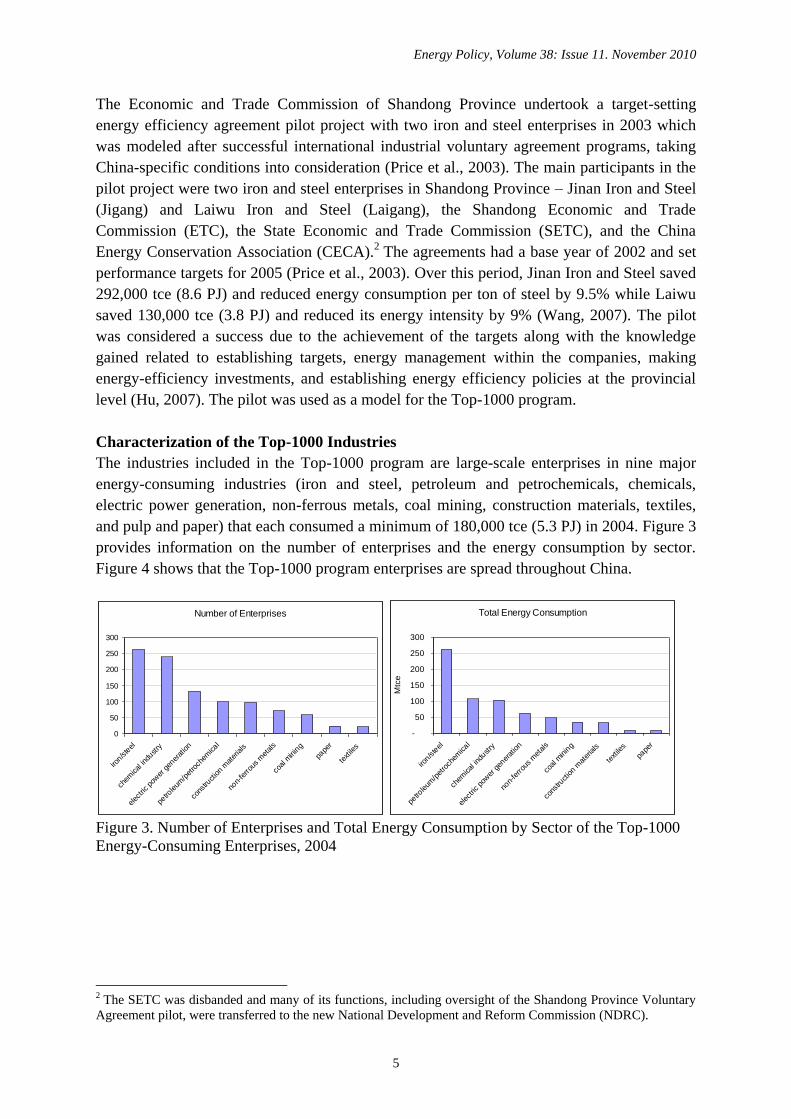
The industries included in the Top-1000 program are large-scale enterprises in nine major
energy-consuming industries (iron and steel, petroleum and petrochemicals, chemicals,
electric power generation, non-ferrous metals, coal mining, construction materials, textiles,
and pulp and paper) that each consumed a minimum of 180,000 tce (5.3 PJ) in 2004. Figure 3
provides information on the number of enterprises and the energy consumption by sector.
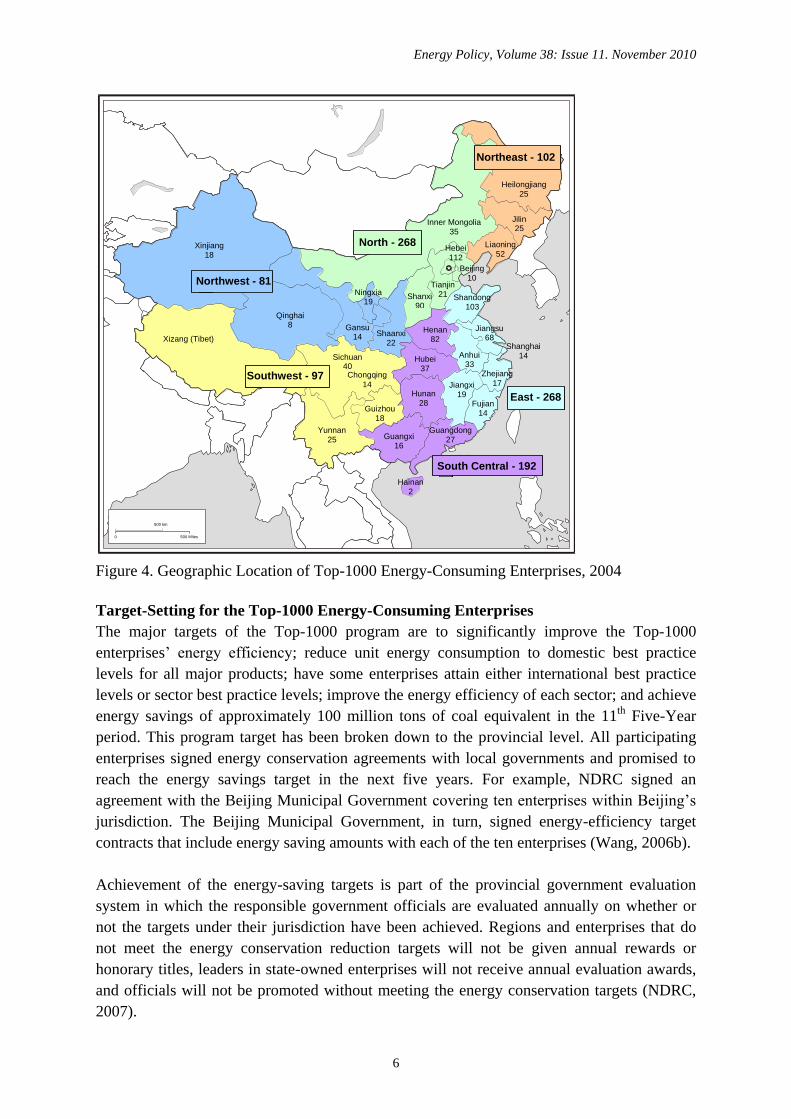
Figure 4 shows that the Top-1000 program enterprises are spread throughout China.
Figure 3. Number of Enterprises and Total Energy Consumption by Sector of the Top-1000
Energy-Consuming Enterprises, 2004
2 The SETC was disbanded and many of its functions, including oversight of the Shandong Province Voluntary
Agreement pilot, were transferred to the new National Development and Reform Commission (NDRC).
Number of Enterprises
0
50
100
150
200
250
300
iron/s
teel
chem
ical in
dustry
elec
tric po
wer
gen
erat
ion
petro
leum
/pet
roch
emical
cons
truction
mat
erials
non-
ferrou
s m
etals
coal m
inin
g
pape
r
textile
s
Total Energy Consumption
-
50
100
150
200
250
300
iron/s
teel
petro
leum
/pet
roch
emical
chem
ical in
dustry
elec
tric po
wer
gen
erat
ion
non-
ferrou
s m
etals
coal m
inin
g
cons
truction
mat
erials
textile
s
pape
r
Mtc
e
Energy Policy, Volume 38: Issue 11. November 2010
6
Figure 4. Geographic Location of Top-1000 Energy-Consuming Enterprises, 2004
Target-Setting for the Top-1000 Energy-Consuming Enterprises
The major targets of the Top-1000 program are to significantly improve the Top-1000
enterprises’ energy efficiency; reduce unit energy consumption to domestic best practice
levels for all major products; have some enterprises attain either international best practice
levels or sector best practice levels; improve the energy efficiency of each sector; and achieve
energy savings of approximately 100 million tons of coal equivalent in the 11th
Five-Year
period. This program target has been broken down to the provincial level. All participating
enterprises signed energy conservation agreements with local governments and promised to
reach the energy savings target in the next five years. For example, NDRC signed an
agreement with the Beijing Municipal Government covering ten enterprises within Beijing’s
jurisdiction. The Beijing Municipal Government, in turn, signed energy-efficiency target
contracts that include energy saving amounts with each of the ten enterprises (Wang, 2006b).
Achievement of the energy-saving targets is part of the provincial government evaluation
system in which the responsible government officials are evaluated annually on whether or
not the targets under their jurisdiction have been achieved. Regions and enterprises that do
not meet the energy conservation reduction targets will not be given annual rewards or
honorary titles, leaders in state-owned enterprises will not receive annual evaluation awards,
and officials will not be promoted without meeting the energy conservation targets (NDRC,
2007).
Beijing 10
Tianjin 21
Shanghai
14
Chongqing
14
Xinjiang 18
Qinghai 8
Xizang (Tibet)
Yunnan 25
Sichuan 40
Gansu 14
Ningxia 19
Shaanxi 22
Shanxi 90
Henan 82
Hubei 37
Guizhou 18
Guangxi 16
Hainan 2
Guangdong 27
Jiangxi 19
Fujian 14
Zhejiang
17
Anhui 33
Jiangsu
68
Shandong 103
Hebei 112
Inner Mongolia 35
Liaoning 52
Jilin 25
Heilongjiang 25
Hunan 28
(U.K.)
0 500 Miles
500 km
Northwest - 81
North - 268
Northeast - 102
East - 268
South Central - 192
Southwest - 97
Energy Policy, Volume 38: Issue 11. November 2010
7
Expectations of the Top-1000 Energy-Consuming Enterprises
The Top-1000 enterprises are expected to establish an energy conservation organization,
formulate energy efficiency goals, establish an energy utilization reporting system, conduct
energy audits, conduct training, formulate an energy conservation plan, adopt energy
conservation incentives, and invest in energy efficiency improvement options. The
enterprises are required to report their energy consumption by fuel quarterly to NBS (NDRC,
2006a).
Role of the National, Provincial, and Local Governments
A number of national government departments and entities are involved in the Top-1000
program, including the Department of Resource Conservation and Environmental Protection
of NDRC (China’s macroeconomic management agency under the State Council which
promotes energy saving), the National Bureau of Statistics (which collects and manages
statistical information of enterprises), the State-owned Assets Supervision and Administration
Commission (which manages major state-owned enterprises), the Office of National Energy
Leading Group, and the General Administration of Quality Supervision, Inspection and
Quarantine.
The national government has established and publicized the guiding principles and goals of
the program and published a list of the Top-1000 enterprises. The energy saving authorities
of the province, district, or city are directed to collaborate with related organizations to lead
and implement the Top-1000 program, including the tracking, supervision, and management
of the energy-saving activities of the enterprises. The local authorities are directed to oversee
and “urge” the enterprises in their energy management, energy auditing, and energy reporting
requirements. They are directed to improve their monitoring of the enterprises through audits
and sampling and to promote the use of new mechanisms such as target-setting agreements
and encourage enterprises to meet energy saving targets and attain international advanced
levels ahead of schedule (NDRC, 2006a).
Energy Efficiency Funding and Financial Incentives3
Enterprises in the Top-1000 program can take advantage of a number of energy efficiency
funding opportunities. In 2007, the Chinese central government allocated a total of 23.5
billion (B) RMB¥ ($3.4B) to improve energy efficiency and abate pollution (MOF, 2008).
The funding supported the launching of the Ten Key Projects, elimination of inefficient
facilities, and environmental protection measures. The Ministry of Finance and NDRC will
use a portion of this funding to award enterprises at a rate of 200 RMB¥ ($29) for every tce
saved per year for enterprises in East China to 250 RMB¥ ($36) for every tce saved per year
for enterprises in Mid or West China (Lu, 2007; MOF and NDRC, 2007). The rewards and
rebates are paid to enterprises that have energy metering and measuring systems that can
document proven savings of at least 10,000 tce (0.29 PJ) from “energy saving technical
transformation” projects. Assuming an average emissions factor for China of 2.42 tons
3 Some of the information in this section is based on Zhou et al., 2009. Currency conversions based on an
exchange rate of 1RMB¥ = 0.146 $US.
Energy Policy, Volume 38: Issue 11. November 2010
8
carbon dioxide (CO2) per ton coal equivalent, this funding is equivalent to $12 to $15 per ton
of CO2 emissions reduced. In 2008, the central government allocated even greater funding of
41.8B RMB¥ ($6B) to promote saving energy and reducing emissions. This funding consists
of 27B RMB¥ ($3.9B) to promote saving energy and reduce pollutant emissions from the
Ministry of Finance and 14.8B RMB¥ ($2.1B) from the Central Construction Investment
(Sha and Jie, 2008).
Provincial governments have encouraged enterprises to use the national-level funds as well as
established provincial-level funds in support of energy efficiency investments. In 2006,
enterprises implemented 18 projects in Shandong Province and overall investment was 3.14B
RMB¥ ($450M) including national bond funds of about 139M RMB¥ ($120M) (Wang,
2007). In 2007, Shandong Province began to use the existing National Bond for energy
conservation award funds. Shandong Province also initiated a special provincial fund of
2.13B RMB¥ ($304M) to encourage local enterprises to implement energy efficiency projects
(Jiang, 2008). In 2007, the enterprises planned 12 projects of 1.49B RMB¥ ($213M),
including 80.6M RMB¥ ($11.5M) from the national bond (Wang, 2007).
Twenty provincial energy conservation centers have received financial support from the
central government in support of the 20% energy/GDP reduction target, including nine
(Xinjiang, Ningxia, Qinghai, Gansu, Yunnan, Guizhou, Sichuan, Shanxi, Guangxi) that
received 4M RMB¥ ($571,000), two (Jiangxi and Neimeng) that received 3M RMB¥
($429,000) and nine (Liaoning, Helongjiang, Jilin, Hubei, Henan, Shannxi, Hunan, Anhui,
Chongqing) that received 2.4 million RMB¥ ($343,000). At the same time, local
governments will allocate at least the same amount of money as received from the central
government as support funds to local energy conservation centers (Jiang, 2006).
Tax rebates for exports of energy-intensive products runs counter to stated government
policies to reduce energy use from these industries and to promote structural shift to less
energy-intensive products. As a result, on September 15, 2006, China’s Ministry of Finance
(MOF) reduced export tax rebates for many low-value-added but high energy-consuming
products. The rebate was reduced from 11% to 8% for steel, from 13% to 8% for cement,
from 13% to 11% for glass, and from 13% to 5%, 8% or 11% for some nonferrous metal
products (MOF, 2006). On April 11, 2007, the government announced a further reduction of
the tax rebate for steel products (MOF, 2007). During 2007, export rebates were eliminated
on 553 energy-intensive and highly-polluting products (MOF, 2008).
A differentiated electricity pricing policy was initiated in 2004 in which electricity prices can
be set based on the enterprise energy intensity level for eight high energy-consuming
industries (electrolytic aluminum, ferroalloy, calcium carbide, caustic soda, cement, and
steel). Enterprises fall into one of four categories based on their level of energy efficiency -
encouraged, permitted, restricted, and eliminated – and are charged increasingly higher
electricity rates in order to phase out inefficient enterprises (Moskovitz, 2007). Encouraged
and permitted enterprises pay the normal price for electricity while enterprises in the
restricted and eliminated categories pay surcharges of 5 fen and 20 fen per kWh ($0.007/kWh
Energy Policy, Volume 38: Issue 11. November 2010
9
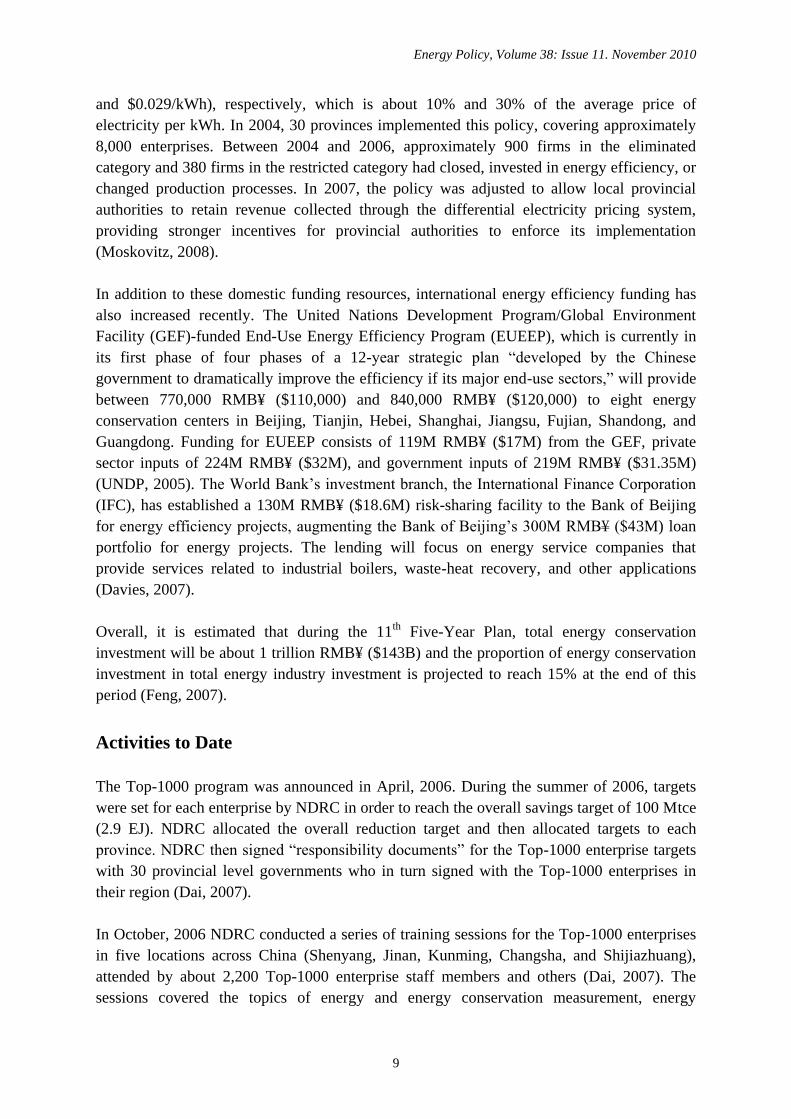
and $0.029/kWh), respectively, which is about 10% and 30% of the average price of
electricity per kWh. In 2004, 30 provinces implemented this policy, covering approximately
8,000 enterprises. Between 2004 and 2006, approximately 900 firms in the eliminated
category and 380 firms in the restricted category had closed, invested in energy efficiency, or
changed production processes. In 2007, the policy was adjusted to allow local provincial
authorities to retain revenue collected through the differential electricity pricing system,
providing stronger incentives for provincial authorities to enforce its implementation
(Moskovitz, 2008).
In addition to these domestic funding resources, international energy efficiency funding has
also increased recently. The United Nations Development Program/Global Environment
Facility (GEF)-funded End-Use Energy Efficiency Program (EUEEP), which is currently in
its first phase of four phases of a 12-year strategic plan “developed by the Chinese
government to dramatically improve the efficiency if its major end-use sectors,” will provide
between 770,000 RMB¥ ($110,000) and 840,000 RMB¥ ($120,000) to eight energy
conservation centers in Beijing, Tianjin, Hebei, Shanghai, Jiangsu, Fujian, Shandong, and
Guangdong. Funding for EUEEP consists of 119M RMB¥ ($17M) from the GEF, private
sector inputs of 224M RMB¥ ($32M), and government inputs of 219M RMB¥ ($31.35M)
(UNDP, 2005). The World Bank’s investment branch, the International Finance Corporation
(IFC), has established a 130M RMB¥ ($18.6M) risk-sharing facility to the Bank of Beijing
for energy efficiency projects, augmenting the Bank of Beijing’s 300M RMB¥ ($43M) loan
portfolio for energy projects. The lending will focus on energy service companies that
provide services related to industrial boilers, waste-heat recovery, and other applications
(Davies, 2007).
Overall, it is estimated that during the 11th
Five-Year Plan, total energy conservation
investment will be about 1 trillion RMB¥ ($143B) and the proportion of energy conservation
investment in total energy industry investment is projected to reach 15% at the end of this
period (Feng, 2007).
Activities to Date
The Top-1000 program was announced in April, 2006. During the summer of 2006, targets
were set for each enterprise by NDRC in order to reach the overall savings target of 100 Mtce
(2.9 EJ). NDRC allocated the overall reduction target and then allocated targets to each
province. NDRC then signed “responsibility documents” for the Top-1000 enterprise targets
with 30 provincial level governments who in turn signed with the Top-1000 enterprises in
their region (Dai, 2007).
In October, 2006 NDRC conducted a series of training sessions for the Top-1000 enterprises
in five locations across China (Shenyang, Jinan, Kunming, Changsha, and Shijiazhuang),
attended by about 2,200 Top-1000 enterprise staff members and others (Dai, 2007). The
sessions covered the topics of energy and energy conservation measurement, energy
Energy Policy, Volume 38: Issue 11. November 2010
10
statistics, enterprise energy auditing, an example of energy audits in a power plant, the ten
major energy conservation projects in the 11th Five Year Plan, major energy saving
technologies in nine energy-consuming industries, guidelines for energy conservation plans
for enterprises, application of benchmarking in large scale power plants, an introduction to
the Kyoto Protocol Clean Development Mechanism, and energy performance contracting and
the Energy Conservation Service Industry Committee of China Energy Conservation
Association (NDRC, 2006b).4
Guidance given to the enterprises regarding energy audits for the Top-1000 program
consisted of the information provided in the NDRC training as well as energy auditing
guidelines that were issued by NDRC to every province. Guidelines and training materials
related to undertaking an energy audit (e.g. how to do an energy balance, which energy
indicators to use, how to use energy measuring equipment, etc.) were provided. The China
National Institute of Standardization (CNIS) is in the process of developing an energy
auditing standard. In addition, NBS held a series of energy statistics training sessions for the
Top-1000 enterprises (Dai, 2007).
In 2007, the Top-1000 enterprises undertook energy audits that documented the current
energy consumption situation at the enterprise and identified energy efficiency opportunities.
The enterprises then developed energy action plans outlining how they expect to meet their
energy-saving targets. While some Top-1000 enterprises have the expertise to conduct energy
audits and identify energy efficiency opportunities, a number of enterprises found this task
difficult due to the lack of qualified auditing personnel and needed to hire outside experts for
assistance (Lu, 2006). There are a variety of outside experts that can provide energy auditing
services including private consulting firms, energy service companies, provincial energy
conservation centers, and the China Energy Conservation Association (CECA). The technical
expertise and abilities of these organizations varies widely, with some highly skilled in
energy auditing and others in need of significant training.
Energy audits typically cost about 200,000 RMB¥ ($28,600) and NDRC did not provide
funding for this effort (Jiang, 2007). By August 31, 2007 a total of 967 energy audit reports
and 836 energy conservation plans had been completed and submitted to NDRC by the 30
provincial level governments (Dai, 2007). In October and November, 2007, two energy
auditing workshops were held in Beijing for the Top-1000 enterprises to undergo training in
energy auditing, writing energy audit reports, and using energy management software.
Documents, including a report on Basic Knowledge of Energy Auditing and Analysis of
Energy Conservation Potential and Manual of Energy Management Software for Enterprises
along with a series of textbooks and published energy auditing reports templates for nine
major industries, were distributed. The China Energy Conservation and Monitoring
Information website provides an energy auditing software to assist enterprises in undertaking
energy auditing (CECS, 2008).
4 The training materials are available at: http://hzs.ndrc.gov.cn/jnxd/t20061108_92567.htm
Energy Policy, Volume 38: Issue 11. November 2010
11
Results
In September 2007, NDRC and NBS held a workshop in Shenyang, China to release the Top-
1000 Enterprises Energy Use Report 2007 (NDRC and NBS, 2007). The report documents
the energy consumption, energy intensity, energy management activities, and the energy-
efficient technology and equipment used based on statistics submitted to NBS by 954
enterprises and information from the energy audit reports of 942 enterprises. The data
indicated that the final energy consumption (not accounting for losses from electricity
generation, transmission, and distribution) of the Top-1000 enterprises had increased from
733 Mtce (21.5 EJ) in 2005 to 797 Mtce (23.4 EJ) in 2006. Shandong, Hebei, Liaoning,
Shanxi, Jiangsu, and Henan Provinces accounted for 50% of the total energy consumption of
the Top-1000 enterprises.
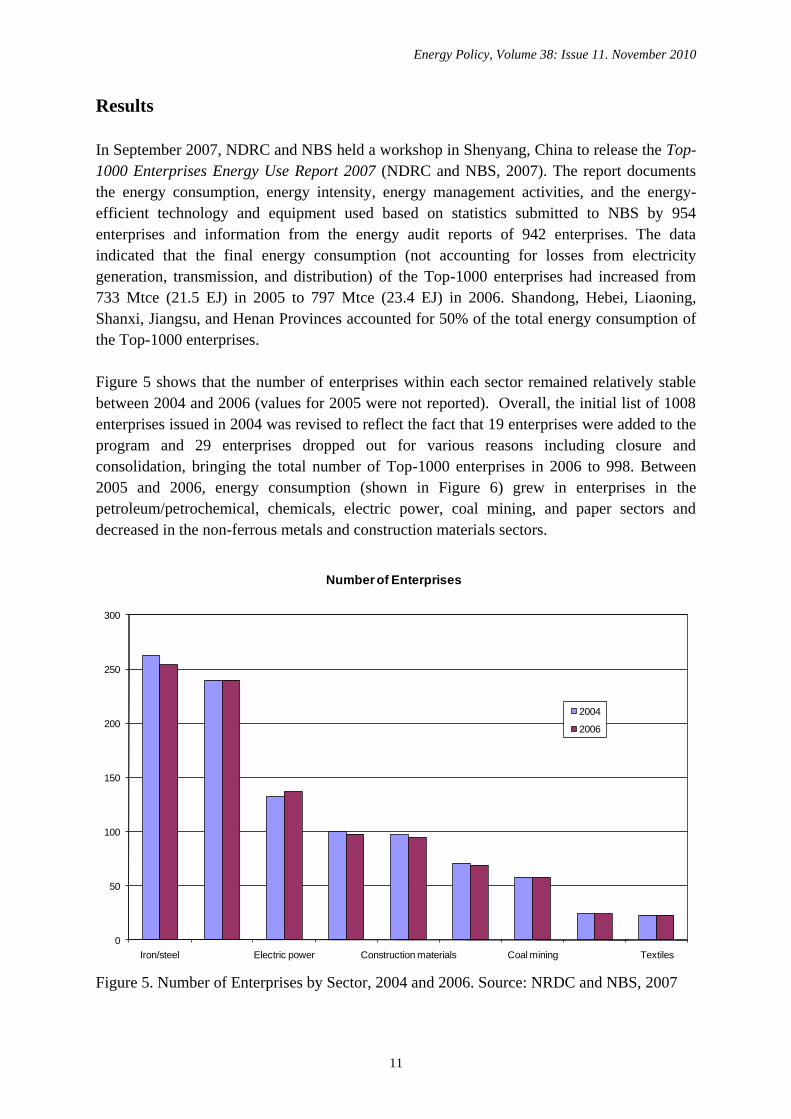
Figure 5 shows that the number of enterprises within each sector remained relatively stable
between 2004 and 2006 (values for 2005 were not reported). Overall, the initial list of 1008
enterprises issued in 2004 was revised to reflect the fact that 19 enterprises were added to the
program and 29 enterprises dropped out for various reasons including closure and
consolidation, bringing the total number of Top-1000 enterprises in 2006 to 998. Between
2005 and 2006, energy consumption (shown in Figure 6) grew in enterprises in the
petroleum/petrochemical, chemicals, electric power, coal mining, and paper sectors and
decreased in the non-ferrous metals and construction materials sectors.
Figure 5. Number of Enterprises by Sector, 2004 and 2006. Source: NRDC and NBS, 2007
0
50
100
150
200
250
300
Iron/steel Electric power Construction materials Coal mining Textiles
Number of Enterprises
2004
2006
Energy Policy, Volume 38: Issue 11. November 2010
12
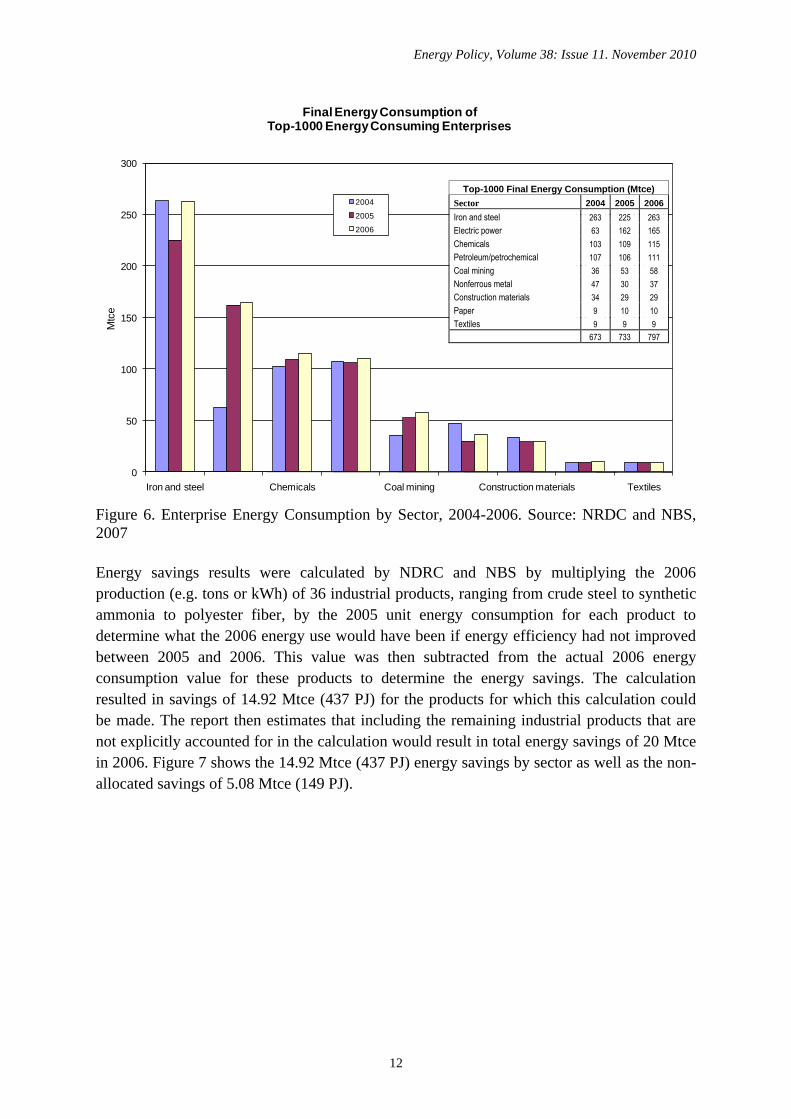
Figure 6. Enterprise Energy Consumption by Sector, 2004-2006. Source: NRDC and NBS,
2007
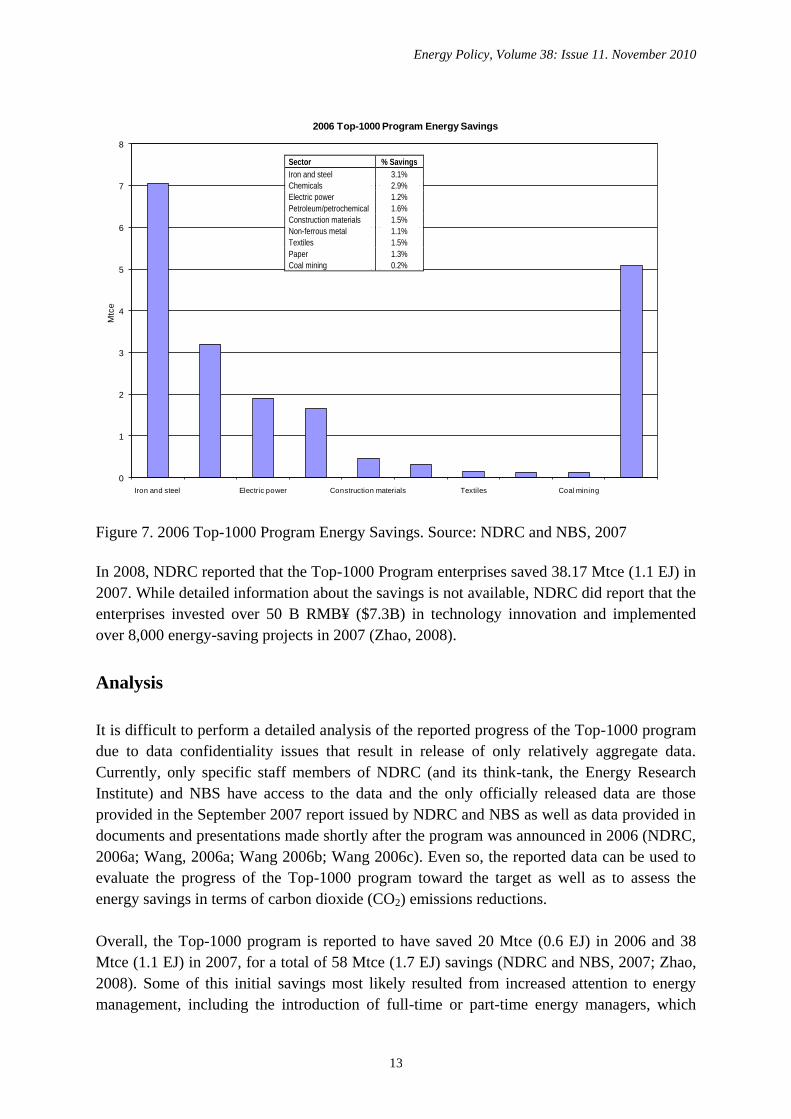
Energy savings results were calculated by NDRC and NBS by multiplying the 2006
production (e.g. tons or kWh) of 36 industrial products, ranging from crude steel to synthetic
ammonia to polyester fiber, by the 2005 unit energy consumption for each product to
determine what the 2006 energy use would have been if energy efficiency had not improved
between 2005 and 2006. This value was then subtracted from the actual 2006 energy
consumption value for these products to determine the energy savings. The calculation
resulted in savings of 14.92 Mtce (437 PJ) for the products for which this calculation could
be made. The report then estimates that including the remaining industrial products that are
not explicitly accounted for in the calculation would result in total energy savings of 20 Mtce
in 2006. Figure 7 shows the 14.92 Mtce (437 PJ) energy savings by sector as well as the non-
allocated savings of 5.08 Mtce (149 PJ).
0
50
100
150
200
250
300
Iron and steel Chemicals Coal mining Construction materials Textiles
Mtc
eFinal Energy Consumption of
Top-1000 Energy Consuming Enterprises
2004
2005
2006
Top-1000 Final Energy Consumption (Mtce)
Sector 2004 2005 2006
Iron and steel 263 225 263
Electric power 63 162 165
Chemicals 103 109 115
Petroleum/petrochemical 107 106 111
Coal mining 36 53 58
Nonferrous metal 47 30 37
Construction materials 34 29 29
Paper 9 10 10
Textiles 9 9 9
673 733 797
Energy Policy, Volume 38: Issue 11. November 2010
13
Figure 7. 2006 Top-1000 Program Energy Savings. Source: NDRC and NBS, 2007
In 2008, NDRC reported that the Top-1000 Program enterprises saved 38.17 Mtce (1.1 EJ) in
2007. While detailed information about the savings is not available, NDRC did report that the
enterprises invested over 50 B RMB¥ ($7.3B) in technology innovation and implemented
over 8,000 energy-saving projects in 2007 (Zhao, 2008).
Analysis
It is difficult to perform a detailed analysis of the reported progress of the Top-1000 program
due to data confidentiality issues that result in release of only relatively aggregate data.
Currently, only specific staff members of NDRC (and its think-tank, the Energy Research
Institute) and NBS have access to the data and the only officially released data are those
provided in the September 2007 report issued by NDRC and NBS as well as data provided in
documents and presentations made shortly after the program was announced in 2006 (NDRC,
2006a; Wang, 2006a; Wang 2006b; Wang 2006c). Even so, the reported data can be used to
evaluate the progress of the Top-1000 program toward the target as well as to assess the
energy savings in terms of carbon dioxide (CO2) emissions reductions.
Overall, the Top-1000 program is reported to have saved 20 Mtce (0.6 EJ) in 2006 and 38
Mtce (1.1 EJ) in 2007, for a total of 58 Mtce (1.7 EJ) savings (NDRC and NBS, 2007; Zhao,
2008). Some of this initial savings most likely resulted from increased attention to energy
management, including the introduction of full-time or part-time energy managers, which
0
1
2
3
4
5
6
7
8
Iron and steel Electric power Construction materials Textiles Coal mining
Mtc
e
2006 Top-1000 Program Energy Savings
Sector % Savings
Iron and steel 3.1%
Chemicals 2.9%
Electric power 1.2%
Petroleum/petrochemical 1.6%
Construction materials 1.5%
Non-ferrous metal 1.1%
Textiles 1.5%
Paper 1.3%
Coal mining 0.2%
Energy Policy, Volume 38: Issue 11. November 2010
14
were established in more than 95% of the Top-1000 enterprises. Energy management includes
an energy purchase management system, energy use management system, an assessment of
each production process, etc. Energy management guidelines that are being followed by the
Top-1000 enterprises have been recently published in a report titled Evaluation Guide for the
Enterprise Energy Auditing Report and the Enterprise Energy Conservation Plan Report.
Other savings during the first year came from closure of small, inefficient production
processes within enterprises. For example, in the iron and steel sector small sinter machines
and casting converters were almost completely phased out and small-scale production lines in
the paper industry are being rapidly phased out. Finally, small retrofit projects, such as
renovation of fans and pumps in the coal mining industry, were reported (NDRC and NBS,
2007). Larger retrofit projects that require significant planning and financing will most likely
be used to improve energy efficiency in Top-1000 enterprises during the coming years, in
combination with continued energy management, smaller retrofits, and elimination of
inefficient facilities.
In order to assess the Top-1000 program goal of 100 Mtce (2.9 EJ) savings by the end of
2010, as well as to make projections of other possible outcomes, a baseline energy use
scenario for the Top-1000 program must first be developed since there is no official 2010
"business-as-usual" energy consumption value from which the energy savings of the Top-
1000 enterprises will be measured. The national-level 20% target for 2010 assumes an
average GDP growth rate of 7.5% from 2005 to 2010, which implies that energy use will only
increase at an average rate of 2.8%. However, both GDP and energy use have been growing
much faster recently. In 2006, total energy consumption reached 2,463 Mtce (72.2 EJ), a
9.6% increase from 2005, while the GDP growth rate was 10.7% (NBS, 2007). However,
energy use of the Top-1000 program enterprises only grew at a rate of 6.7% per year between
2004 and 2006.5 Assuming this rate continues, energy consumption of the Top-1000 program
enterprises would grow from 733 Mtce (21.5 EJ) in 2005 to 1016 Mtce (30 EJ) in 2010 under
a baseline, business-as-usual scenario.
If energy savings continue to be realized at the rate experienced in 2006 – 20 Mtce/year (0.6
EJ/year) -- the Top-1000 program will be able to meet the overall program goal of 100 Mtce
(2.9 EJ) savings by the end of 2010. Given the baseline scenario projected above, meeting the
program goal in this “Target” scenario means that the Top-1000 enterprises would consume
916 Mtce (27 EJ) in 2010. Another possible “Current Trends” scenario is based upon the
combined reported 2006 and 2007 savings of 58 Mtce (1.7 EJ) in which the enterprises were
already more than half-way to the 2010 goal at the end of 2007. Continuation of annual
savings of 38 Mtce (1.1 EJ) for 2008, 2009, and 2010 would lead to cumulative savings for
the Top-1000 program of 172 Mtce (5 EJ), reducing total energy use in 2010 to 844 Mtce
(24.7 EJ). Figure 8 illustrates these scenarios.
5 Calculated based on 2004 and 2005 actual energy use and 2006 actual energy use plus reported savings. Note
that there were 1008 enterprises in the program in 2004. By 2006, 19 enterprises were added and 29 enterprises
dropped out of the program, resulting in a total of 998 enterprises.

Energy Policy, Volume 38: Issue 11. November 2010
15
Figure 8. Actual (2004 to 2006) and Projected 2010 Energy Consumption for the Top-1000
Energy-Consuming Enterprises Program Under Baseline, Target, and Current Trends
Scenarios
Top-1000 program 2006 energy-related CO2 emissions are estimated to be 2,432 MtCO2
based on the data provided in the 2007 evaluation report that explains that the 2006 energy
consumption of 797 Mtce (23.4 EJ) was made up of the following fuel shares: 36.1% coal,
21.3% crude oil, 12.97% electricity, 8.91% coke, 1.91% heat, 1.48% natural gas, and 17.33%
other energy sources such as petroleum diesel, fuel oil, LPG, washed coal, coal gas from blast
furnace, and coke oven gas. (NDRC and NBS, 2007). Table 1 provides the details of the
calculation of energy-related CO2 emissions.
Assuming 2006 total energy-related CO2 emissions for China are 5,650 MtCO2 (Netherlands
Environmental Assessment Agency, 2007), the estimated emissions from Top-1000 program
enterprises represent 43% of China’s total emissions. The share of Top-1000 program CO2
emissions is higher than the share of Top-1000 Program energy use in China’s total energy
use (32%) because these industrial facilities rely heavily on carbon-intensive fuels such as
coal, coke, and electricity (which is predominately coal-based) and use relatively small
amounts of lower carbon fuels such as natural gas and renewables.
Table 1. Estimated Top-1000 Program 2006 Energy-Related CO2 Emissions.
Coal Coke Crude
Oil Natural
Gas Heat Electricity Other Total
Fuel Share (%) 36.1 8.91 21.3 1.48 1.91 12.97 17.33
Energy (Mtce) 288 71 170 12 15 103 138 797
Emissions (MtCO2) 812 193 361 19 34 718 294 2432
0
200
400
600
800
1000
1200
2004 2005 2006 2007 2008 2009 2010 Baseline 2010Target
2010 Current Trends
Energ
y C
onsu
mptio
n (
Mtc
e)
Top-1000 Enterprises Program Actual and Projected Energy Consumption
Baseline Scenario = annual energy growth based on 2004-2006 actual (6.7% per year)Target Scenario = 20 Mtce savings per year 2006-2010 to achieve 100 Mtce targetCurrent Trends Scenario = 20 Mtce savings in 2006, 38 Mtce savings per year 2007-2010
projection based on 2004-2006 actual energy growth
(6.7% per year)
Energy Policy, Volume 38: Issue 11. November 2010
16
Notes: Fuel emission factors from IPCC, 1996. Electricity emission factor = 0.853 kgCO2/kWh. Emission factor
for “other” assumed to be the same as for crude oil (2.15 tCO2/tce), since it falls between coal (2.88 tCO2/tce)
and natural gas 1.64 tCO2/tce).
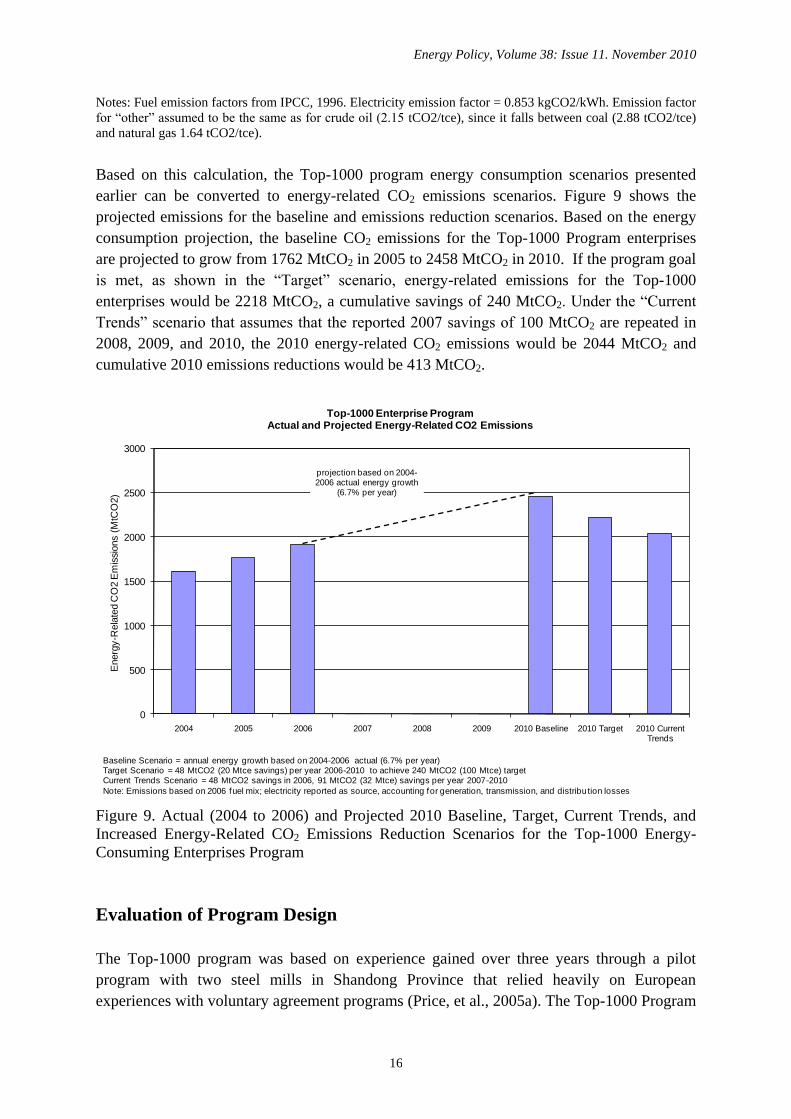
Based on this calculation, the Top-1000 program energy consumption scenarios presented
earlier can be converted to energy-related CO2 emissions scenarios. Figure 9 shows the
projected emissions for the baseline and emissions reduction scenarios. Based on the energy
consumption projection, the baseline CO2 emissions for the Top-1000 Program enterprises
are projected to grow from 1762 MtCO2 in 2005 to 2458 MtCO2 in 2010. If the program goal
is met, as shown in the “Target” scenario, energy-related emissions for the Top-1000
enterprises would be 2218 MtCO2, a cumulative savings of 240 MtCO2. Under the “Current
Trends” scenario that assumes that the reported 2007 savings of 100 MtCO2 are repeated in
2008, 2009, and 2010, the 2010 energy-related CO2 emissions would be 2044 MtCO2 and
cumulative 2010 emissions reductions would be 413 MtCO2.
Figure 9. Actual (2004 to 2006) and Projected 2010 Baseline, Target, Current Trends, and
Increased Energy-Related CO2 Emissions Reduction Scenarios for the Top-1000 Energy-
Consuming Enterprises Program
Evaluation of Program Design
The Top-1000 program was based on experience gained over three years through a pilot
program with two steel mills in Shandong Province that relied heavily on European
experiences with voluntary agreement programs (Price, et al., 2005a). The Top-1000 Program
0
500
1000
1500
2000
2500
3000
2004 2005 2006 2007 2008 2009 2010 Baseline 2010 Target 2010 Current Trends
Energ
y-R
ela
ted C
O2 E
mis
sions
(MtC
O2)
Top-1000 Enterprise Program Actual and Projected Energy-Related CO2 Emissions
Baseline Scenario = annual energy growth based on 2004-2006 actual (6.7% per year)Target Scenario = 48 MtCO2 (20 Mtce savings) per year 2006-2010 to achieve 240 MtCO2 (100 Mtce) targetCurrent Trends Scenario = 48 MtCO2 savings in 2006, 91 MtCO2 (32 Mtce) savings per year 2007-2010
Note: Emissions based on 2006 fuel mix; electricity reported as source, accounting for generation, transmission, and distribu tion losses
projection based on 2004-2006 actual energy growth
(6.7% per year)
Energy Policy, Volume 38: Issue 11. November 2010
17
was designed quickly in 2006 in support of China’s 20% energy/GDP reduction goals. As
such, some elements of the program have been designed or implemented differently than in
similar programs in other countries. In addition, as discussed below, the Top-1000 Program is
generally less structured than similar national-level programs in other countries.
In this section, international experience in the areas of target-setting, supporting policies,
information dissemination, and monitoring, is first discussed and then the experience with
these key program components in the Top-1000 program is described. Suggestions are made
for improvements that may be implemented during the remaining years of the program or that
can be seen as lessons learned for any possible follow-on programs.6
Target-Setting
The process for establishing energy efficiency or GHG emission reduction targets begins with
an assessment – by the company or an independent third party – of the energy efficiency or
GHG mitigation potential of each industrial facility. Assessment results are then provided to
the government as the basis for target-setting negotiations.
In the UK’s Climate Change Agreement program, the government obtained information
regarding energy efficiency potential in energy-intensive industries through guides and case
studies produced within the Energy Efficiency Best Practices Program (Shock, 2000) as well
as through scenarios of industrial sector carbon dioxide emissions (ETSU, 1999). In addition,
individual companies estimated their energy efficiency potential and provided this
information to their trade associations who then negotiated with the government to set a
target for the entire sector.
In the Netherlands, Long-Term Agreements (LTAs) between the Dutch Ministries and
industrial sectors were established in support of the overall national energy-efficiency
improvement target of a 20% reduction in energy efficiency between 1989 and 2000. Sector-
specific energy-efficiency potential studies were the basis for distributing the targets among
the various industrial sectors. Following the studies, NOVEM,7 the Dutch Agency for Energy
and Environment, established an inventory of economically-viable measures that could be
implemented by the companies in each industrial sector and based on this inventory set a
target for energy efficiency improvement for each sector (Nuijen and Booij, 2002). While
most industries adopted a target of 20% reduction, some negotiated different levels due to the
particular circumstances of their industrial sector.
The Dutch Benchmarking Covenants, which began in 2001, use a benchmarking approach for
target-setting in which an expert third party undertakes a study of the international best
practice in terms of energy efficiency for each participating company’s processing plants.
The results of the international best practice benchmarking study are then sent to the
6 Some of this discussion is based on material presented in McKane et al., 2007 and Price et al., 2008. 7 Now SenterNovem.
Energy Policy, Volume 38: Issue 11. November 2010
18
Benchmarking Commission to verify the accuracy and completeness of the expert third
party’s methods and results of the study (Commissie Benchmarking, 1999).
In Japan’s Keidanren Voluntary Action Plan on the Environment, which commits to
stabilizing greenhouse gas emissions of Keidanren members at 1990 levels by 2010,
numerical savings targets were set voluntarily by 38 sectors in 1997. The number of sectors
has since grown to 58, including 35 from industrial and energy-converting sectors. Individual
targets are set following technical and economic analyses of energy-saving technologies and
potential. Of the 35 industrial sectors, 12 committed to absolute CO2 emissions reduction
targets, 9 to CO2 intensity reduction targets, 5 to absolute energy use reduction targets, and 15
to energy intensity targets (Wakabayashi and Sugiyama, 2007).
In the Top-1000 program, targets were set by NDRC for each enterprise in order to support
the provincial-level targets and to reach the overall savings target of 100 Mtce (2.9 EJ) for the
Top-1000 program. Initially, NDRC set preliminary targets for each enterprise taking into
consideration their general situation such as which industrial sector they belonged to since the
potential energy savings vary by sector, as well as the general technology level of the
enterprise, if known. The targets were not based on detailed assessments of energy-savings
potential of each enterprise or each industrial sector. This approach was taken due to time
constraints. Since the Top-1000 program was designed in support of the 11th
Five Year Plan
which began in 2006, it would have been necessary to start the target-setting process three or
four years prior to follow international practice, which was impossible given both the time
pressure and the large number of participating enterprises. The resulting target of 100 Mtce
(2.9 EJ) only represents 15% or less of the required savings of 646 to 700 Mtce (19 to 20.5
EJ) (depending upon the assumed growth rates) to meet the 2010 goal of reducing energy use
per unit of GDP. Given the energy-intensity of these industries, more detailed assessments
may have identified higher potential energy savings for these industries and a more ambitious
goal could have been set for the Top-1000 program based on the potential savings identified.
Supporting Policies
Target-setting programs also typically establish a harmonized set of supporting programs for
participating enterprises. Ideally, such policies and programs should be in place at the
commencement of the program so that enterprises have a full understanding of the type and
range of support they will receive as they set out to achieve their targets. Such policies
typically include financial incentives, technical assistance, rewards and publicity for
enterprises that reach targets, and sometimes penalties for failure to reach targets. Financial
incentives for investing in energy-efficiency technologies and measures include targeted
grants or subsidies, tax relief, and loans for investments in energy efficiency. Tax relief for
purchase of energy-efficient technologies can be granted through tax exemptions, tax
reductions, and accelerated depreciation. A common approach is to provide a list of
technologies for special tax treatment (Price et al., 2005b). In countries such as Denmark, the
Netherlands, Sweden, and the U.S., funding covering 40% to 100% of the cost of energy-
savings assessments is provided, often as a benefit of participating in target-setting programs

Energy Policy, Volume 38: Issue 11. November 2010
19
(WEC, 2004).8 In the Climate Change Agreements in the UK (DEFRA, 2004) and the Danish
energy efficiency agreements (Togeby et al., 1999), incentives for meeting agreed-upon
targets are provided in the form of a reduction of the required energy tax.
Supporting policies and programs for the Top-1000 program were not established prior to the
announcement of the program. Instead, the 1,000 Enterprise Energy Conservation Action
Implementation Plan (NDRC, 2006a), which was issued in April 2006, outlined that that
government would begin efforts to “strengthen energy saving supervision management
according to the law, implement strengthened energy savings tax and fiscal policy, increase
support level of energy saving improvement projects, establish energy saving technology
dissemination new mechanism, and honor and award advanced models”.
Although given the time constraints for developing and implementing the Top-1000 Program,
it is understandable that the full program was not established at the time it was announced,
this did weaken the initial impact of the program due to lack of clarity regarding what the
central government would offer to the enterprises and how the program should be
implemented at the provincial level. For example, in November, 2006, a number of provincial
government officials who were given provincial level energy/GDP reduction targets in
addition to responsibility for overseeing successful implementation of the Top-1000 program
for those enterprises located in their province, expressed concern and confusion over the
establishment of both provincial and national level policies and programs in support of the
Top-1000 Program at the Energy Foundation’s Forum on Implementing China’s 2010 20-
Percent Energy Efficiency Target. As described earlier, a number of these supporting policies
and programs have subsequently been developed and put in place during 2006 and 2007,
while others are still in discussion or have not yet been established.
Information Dissemination
Internationally, information dissemination is an important component of target-setting and
other industrial energy efficiency programs. Technical information sources such as energy
efficiency guidebooks, databases, software tools, and industry- or technology-specific energy
efficiency reports are produced in many countries (Galitsky et al., 2004). The U.S.
Department of Energy’s (US DOE’s) Industrial Technologies Program provides many
software tools for assessing energy efficiency of motors, pumps, compressed air systems,
process heating and steam systems.9 The USDOE also provides case studies that describe
energy-efficiency demonstration projects in operating industrial facilities in many industrial
sectors and sourcebooks, tip sheets, technical fact sheets and handbooks, and market
assessments. Case studies providing information on commercial energy-saving technologies
for a number of industrial sectors are also provided by the Centre for Analysis and
Dissemination of Demonstrated Energy Technologies (CADDET). 8 The exception to this approach is the European Union’s Emissions Trading Scheme where the EU countries
allocated emissions targets on the basis of past emissions while only small efforts are being made to account for
a company’s ability to abate its emissions, but with a complex trading market in place to enable enterprises to
sell excess emissions credits or purchase emissions credits to cover gaps between their actual performance and
their target. 9 See http://www1.eere.energy.gov/industry/bestpractices/software.html

Energy Policy, Volume 38: Issue 11. November 2010
20
Energy efficiency reports or guidebooks provide information on existing and new
technologies and measures as well as energy management practices. The Canadian Industry
Program for Energy Conservation’s sector-wide energy efficiency guides provide information
on energy efficiency measures for many sectors. The U.S. ENERGY STAR for Industry
Energy Guides include both process-specific and utility energy efficiency measures for
breweries, cement, corn refining, fruit and vegetable processing, glass, motor vehicle
assembly, petroleum refining, and pharmaceuticals. As part of the Dutch Long-term
Agreements 2 (LTA2), SenterNovem and representatives of the sector develop and maintain
a “measurement list” of possible efficiency improvements that consists of a detailed
description of the measure, investment costs, energy savings, returns on investment and if
financial support is available for the measure.10
The Top-1000 program currently has not developed a systematic means for gathering or
disseminating energy efficiency information sources to the participating enterprises.11
As
previously mentioned, the Top-1000 program did develop materials for a 2-day workshop
that was held for the Top-1000 enterprises in five cities throughout China in October 2006.12
The Top-1000 web page on NDRC’s website, however, simply provides short news articles
reporting on related notices, meetings, and Provincial activities.
Monitoring
International experience indicates that is extremely important to establish effective
monitoring guidelines at the beginning of an energy-efficiency or target-setting program.
Clear and transparent monitoring guidelines should be outlined that give enterprises an
overview of what needs to be reported, when it should be reported, how it should be reported
and to whom. Enough detail should be provided at the beginning of the project about how the
project’s savings will be documented and what level of accuracy is desired. Ideally,
monitoring also includes verification by an independent third party that will validate the
submitted information and oversee the monitoring procedures. It is important to clearly
define the monitoring process, outline the format and requirements of monitoring reports, and
provide clear definitions regarding energy use and energy saving measures. According to the
U.S. National Action Plan for Energy Efficiency, a monitoring and verification (M&V) plan
should include the project description, inventories (where appropriate), description of the
proposed measure(s), estimates of energy savings, a budget for M&V, and proposed
construction and M&V schedules (Schiller, 2007).
10 SenterNovem presents lists with energy efficiency improvements for more than 20 sectors on their website:
http://www.senternovem.nl/mja/tools/maatregellijsten/index.asp. To determine the return on investment (ROI),
SenterNovem developed a tool to determine ROIs of measures. This Excel tool can be downloaded from:
http://www.senternovem.nl/mmfiles/tvt_ncw_tcm24-111964.xls (in Dutch). 11 The Energy Foundation has funded Lawrence Berkeley National Laboratory to develop energy efficiency
guides, which are being translated by ERI, that identify international energy-efficiency technologies for a
number of energy-intensive industries. 12 The presentations from that workshop are posted on the NDRC website:
http://hzs.ndrc.gov.cn/jnxd/t20061108_92567.htm
Energy Policy, Volume 38: Issue 11. November 2010
21
The monitoring requirements of the Dutch LTAs, which were outlined in a handbook
(Novem, 1999), involved annual reporting on the energy-efficiency improvement achieved,
including data on total energy use, the Energy Efficiency Index level achieved, and progress
on the projects carried out to reach the Energy Efficiency Index for that year. Corrections
were allowed for changes in the mix of products, extra energy use as a result of stricter
environmental regulations, and the degree of capacity utilization of existing product
installations (Hoogovens Technical Services, 1992; NIJSI and MEA, 1992). The annual
reports were submitted to an independent third party to check the reported values for
accuracy (Nuijen, 2002).
Companies that take part in the Dutch LTA2 are required to submit annual monitoring reports
to SenterNovem on the progress they have made implementing their energy conservation plan
(ECP). SenterNovem uses the corporate monitoring report to assess whether a company is
making enough effort to realize its ECP by evaluating the company’s energy efficiency goals,
the measures intended to be employed, and the schedule for reaching the goals. The report
provides data on the improvement in energy efficiency in the relevant facility/facilities
compared to 1998 (the reference year), and the realized emissions reduction of CO2.
SenterNovem presents the LTA branch reports in a yearly brochure, thus providing an
overview of the energy-saving measures taken by Dutch companies and the results they have
achieved (SenterNovem, 2005; Novem, 1999). For the Dutch Benchmarking Covenants, an
independent Benchmarking Verification Bureau monitors the covenant, verifying that each
company has completed the different stages in the benchmark process, ensuring that the
definition of the world lead is adequate, determining that the energy efficiency plan has been
properly developed, and providing feedback on this to the company and to the competent
authority (Commissie Benchmarking, n.d.).
Each entity participating in the UK Climate Change Agreements is required to report primary
energy used for each type of fuel, carbon emissions, throughput, product mix adjustments,
and emission trading adjustments for the target period. The UK Department for Environment,
Food, and Rural Affairs provides detailed guidance, including spreadsheets, related to a
number of issues such as changes in corporate ownership, accounting for combined heat and
power, and use of emissions trading (DEFRA, 2008).
Companies participating in the Japanese Keidanren Voluntary Action Plan perform annual
surveys of their achievements, which are made public. In addition, the Advisory Committee
on Natural Resources and Energy and the Industrial Structure Council also annually review
the surveys submitted by the industries. Within Keidanren, there is also an Evaluation
Committee that evaluates and provides feedback on the industry reports (Wakabayashi and
Sugiyama, 2007).
The National Bureau of Statistics (NBS) is in charge of collecting data from the enterprises
for the Top-1000 program. There is a generic spreadsheet that can be used for all Top-1000
plants to report their energy consumption by fuel quarterly on-line. The Top-1000 reporting is
directly to NBS online via a website, not through regional statistical bureaus. The data
Energy Policy, Volume 38: Issue 11. November 2010
22
collection is done in this manner to improve accuracy and reliability, to make it easier for the
enterprises, and to reduce work for regional statistical bureau staff members. NBS will
release information on average or total energy use or energy use by industry, but not by
specific enterprise. Enterprise-specific data is, however, provided to NDRC. Capacity
building is needed for training for enterprises to operate the on-line reporting system, for
development of an indicator system, for development of standards for boundary setting, and
for data analysis. As currently structured, there is little transparency in the data reporting for
the Top-1000 Program. To date, there has only been one officially-released summary report
on the progress of the program (NDRC and NBS, 2007). In addition, there is no 3rd
party
review or verification of the reported results at the enterprise, sector, provincial, or national
level.
Conclusions and Recommendations
The Top-1000 program is an ambitious effort to reduce energy consumption of China’s
largest energy-consuming enterprises between 2005 and 2010. The reported energy savings
for the first year of the program (2006) indicate that it is on target to reach the program goal
of saving 100 Mtce in 2010. Based on preliminary reports of progress in 2007, the program
may even surpass this goal if current savings trends are maintained. A “Current Trends”
scenario found that energy savings in 2010 would be 148 Mtce (4.3 EJ). When calculated in
terms of saved CO2 emissions, the potential impact of the Top-1000 program on reducing
future growth of emissions from the Chinese industrial sector is enormous. Meeting the 2010
energy-savings target will result in energy-related CO2 emissions reductions of 300 MtCO2,
an amount equivalent to the 2005 annual emissions of Poland. Emissions reductions of 450
MtCO2 will be realized under a “Current Trends” scenario, saving the equivalent of South
Korea’s 2005 annual energy-related CO2 emissions.
Recommendations for improvement to the Top-1000 program, or to any similar subsequent
programs in the 12th
Five Year Plan that address industrial energy efficiency, are to carefully
evaluate the potential for energy-savings at the enterprise level in order to establish
ambitious, yet realistic energy-saving targets, improve energy auditing capacity, increase
information dissemination through establishment of a central information depository that can
collect and distribute reports, tools, case studies, and other materials to Provincial-level
energy conservation centers as well as to the enterprises themselves, and strengthen the
monitoring and reporting so that annual reports can clearly explain what has worked and what
needs improvement in terms of the implementation of the program.
A number of specific recommendations that were previously provided in Price and Wang
(2007) have since been partially or fully implemented. Some recommendations that have not
yet been fully implemented include:
Develop supporting policies at the provincial level that can supplement national-
level supporting policies by offering increased or supplemental incentives, further
technical support, and additional publicity
Energy Policy, Volume 38: Issue 11. November 2010
23
Direct energy efficiency investment incentives – such as subsidies, grants, loans,
and tax relief – towards expensive yet high energy-saving investments that may be
otherwise disregarded by enterprises due to the high initial investment costs
Produce a Shandong Province case study describing the policies and energy
management systems implemented in the Energy Efficiency Agreement Pilot
Project in order to understand and disseminate lessons learned
Assess the possible application of energy taxes or other fiscal mechanisms within
the Top-1000 program
Evaluate establishment of a system of awards for enterprises that meet their targets
– and possibly a system of penalties for those that fail to meet their targets – in
terms of how the award funding would be generated and whether such awards
could be offered at a level that would provide motivation to enterprises
Have sector associations or other sector-specific experts develop energy efficiency
information sources for identifying energy-savings technologies and measures for
the Top-1000 enterprise sectors
Develop benchmarking tools in conjunction with sector associations or other
sector-specific experts to assist with evaluation of each enterprise’s energy
efficiency potential, to provide a simplified energy auditing tool, and to assist in
development of each enterprise’s energy action plan
Develop detailed energy management guidance documentation based on
international best practice, including a framework to standardize, measure and
recognize industrial system optimization efforts
Review a sample of the enterprise audit reports to determine whether they are
comprehensive and high-quality and to identify areas where further training
related to specific elements of energy auditing could improve audit quality
Establish a database or directory of energy auditing entities, identifying their
areas of expertise
Review a sample of the enterprise energy action plans to determine whether they
are comprehensive and high-quality and to identify areas where further training
related to specific elements of development and use of energy action plans could
improve their quality
Develop enterprise-level monitoring and reporting guidelines that include not
only reporting on annual energy use, but also information on annual production
levels, enterprise organizational changes, and on progress on the specific energy-
saving activities outlined in the enterprise action plan be developed.
Explore the potential for development of an energy and greenhouse gas
management tool based on the World Resources Institute/World Business Council
for Sustainable Development’s Greenhouse Gas Protocol and testing of the use of
this protocol in specific Top-1000 industrial sectors
Ensure that an evaluation system is in place that is capable of providing feedback
on program and policy design so that the Top-1000 program can be adjusted
during the 2005 to 2010 period if such adjustments are indicated by the evaluation

Energy Policy, Volume 38: Issue 11. November 2010
24
and so that the evaluation results from the Top-1000 program can be effectively
used to design any similar post-2010 programs
Engage key sector-focused industrial associations and research institutions to
develop and deliver sector-specific information for energy audits, energy
benchmarking, and identification of energy-efficient technologies and measures,
working with provincial-level energy conservation centers and technical
universities to build their sector-specific capabilities
Establish the National Energy Conservation Center and/or another national-level
energy information dissemination and training center as soon as possible to play a
coordination role for many elements of the Top-1000 program
Conduct a limited number of study tours to countries in Europe and other
countries with strong target-setting programs for enterprise representatives from
enterprises that are playing a leading role within the Top-1000 program
Evaluate the possibility of holding an industrial energy efficiency conference
similar to the American Council for an Energy Efficiency Economy’s Summer
Study on Energy Efficiency in Industry in China in order to expose more Chinese
to the latest developments in industrial sector research on energy-efficient
technologies, measures, policies, and programs
Establish a Chinese/English language website that provides information on
international experience with supporting policies, program elements, program
development and design, and program delivery for target-setting programs to
compliment and link to NDRC’s Top-1000 Program website
Coordinate with international programs that can contribute to key Top-1000
program elements such as the United Nations Development Program/Global
Environmental Facility End-Use Energy Efficiency Program and the EU-China
Energy and Environment Programme for Promotion of Benchmarking Tools for
Energy Conservation in Energy Intensive Industries, in order to ensure that
advantage is taken of overlapping activities and that collaborative efforts are
undertaken whenever possible
Coordinate with international programs that have a Chinese industrial energy
efficiency component such as the Asia Pacific Partnership for Clean Development
and Climate and the International Energy Agency – World Bank Energy
Efficiency Indicators Project in order to ensure that advantage is taken of
overlapping activities with the Top-1000 program and that collaborative efforts
are undertaken whenever possible
Even though the Top-1000 program was designed and implemented rapidly and did not fully
implement best practices regarding establishment of targets, development of supporting
policies and programs, information dissemination, and monitoring and evaluation, it appears
that – depending upon the GDP growth rate -- it could contribute to somewhere between
approximately 10% and 25% of the savings required to support China’s efforts to meet a 20%
reduction in energy use per unit of GDP by 2010. China has not yet succeeded in realizing the
annual savings needed to meet the 20% reduction goal. In 2006, energy consumption per unit

Energy Policy, Volume 38: Issue 11. November 2010
25
of GDP declined 1.33% compared with 2005 and in 2007 energy consumption per unit of
GDP declined 3.27% compared with 2006 (NDRC, 2008). Although the annual target of 4%
reduction in energy intensity was not reached, these two years represent the first drop in this
metric since it began to increase in 2002.
Acknowledgments
We would like to thank the Energy Foundation’s China Sustainable Energy Program for
support for our efforts related to providing technical and policy support for the Top-1000
program. The China Sustainable Energy Program provides support to Lawrence Berkeley
National Laboratory through the Department of Energy under contract No. DE-AC02-
05CH11231. We would also like to thank Dow Chemical Company for its support related to
information collection and analysis for this paper. In addition, we would like to thank Mark
Levine, Zhou Nan, Ernst Worrell, and Kornelis Blok for their helpful review and comments.
References
Bernstein, L., Roy, J., Delhotal, K.C., Harnisch, J., Matsuhashi, R., Price, L., Tanako, K.,
Worrell, E., Yamba, F., and Fenqi, Z., 2007. Industry, in Climate Change 2007:
Mitigation. Contribution of Working Group III to the Fourth Assessment Report of the
Intergovernmental Panel on Climate Change [B. Metz, O.R. Davidson, P.R. Bosch, R.
Dave, L.A. Meyer (eds)], Cambridge University Press, Cambridge, United Kingdom and
New York, NY, USA.
China Energy Conservation and Supervision (CECS), 2008.
http://jilin.cecs.gov.cn/index.php?option=com_content&task=view&id=3085&Itemid=37
&PHPSESSID=92741149c63d50a2adf87ad450bee8c8
Commissie Benchmarking, 1999. Energy efficiency benchmarking covenant.
http://www.benchmarking-energie.nl/pdf_files/covteng.pdf
Commissie Benchmarking, n.d., Summary benchmarking covenant
http://www.benchmarking-energie.nl/standaard.php3?pagid=326
Dai, Y., 2007. Implementation progress and next steps of the top-1000 enterprises energy
efficiency program. Proceedings of the Tenth Senior Policy Advisory Council Meeting on
Enhancing Implementation of China’s 2010 20-Percent Energy Efficiency Target,
Tianjin, China, November 16, 2007.
Davies, W., 2007. Bank of Beijing obtains 130 mln yuan IFC facility for energy efficiency
projects, Forbes.com, May 31, 2007.
http://www.forbes.com/markets/feeds/afx/2007/05/31/afx3777298.html
Department of Environment, Food, and Rural Affairs (DEFRA), 2004. Climate change
agreements: the climate change levy. http://www.defra.gov.uk/environment/ccl/intro.htm
Department of Environment, Food, and Rural Affairs (DEFRA), 2008. Climate change
agreements: papers and documents.
http://www.defra.gov.uk/environment/climatechange/uk/business/ccl/papers.htm#CCA
ETSU, 1999. Industrial sector carbon dioxide emissions: projections and indications for the
UK, 1990 – 2020. See discussion of this report in ETSU, AEA Technology, 2001.
Climate Change Agreements – Sectoral Energy Efficiency Targets (version 2).
http://www.defra.gov.uk/environment/ccl/pdf/etsu-analysis.pdf
Energy Policy, Volume 38: Issue 11. November 2010
26
Feng, F., 2007. Policy proposals for realization of energy conservation targets in the 11th
five-
year plan period. Proceedings of the Tenth Senior Policy Advisory Council Meeting on
Enhancing Implementation of China’s 2010 20-Percent Energy Efficiency Target,
Tianjin, China, November 16, 2007.
Galitsky, C., Price, L., and Worrell, E., 2004. Energy efficiency programs and policies in the
industrial sector in industrialized countries. LBNL Report, Lawrence Berkeley National
Laboratory, Berkeley, CA. LBNL-54068.
Hoogovens Technical Services, June 1992. Energy Monitoring Hoogovens Ijmuiden:
Calculation of the Energy Efficiency Index.
Hu, Y., 2007. Implementation of voluntary agreements for energy efficiency in China.
Energy Policy 35 (2007): 5541-5548.
Intergovernmental Panel on Climate Change, 1996. Revised 1996 IPCC Guidelines for
National Greenhouse Gas Inventories Reference Manual (Volume 3). http://www.ipcc-
nggip.iges.or.jp/public/gl/invs6.htm
Jiang, Y., 2006. Personal communication with Jiang Yun, China Energy Conservation
Association, November 6, 2006.
Jiang, Y., 2007. Personal communication with Jiang Yun, China Energy Conservation
Association, November 13, 2007.
Jiang, Y., 2008. Personal communication with Jiang Yun, China Energy Conservation
Association, April 11 and 15, 2008.
Lin, J., Zhou, N., Levine, M., and Fridley, D., 2007. Achieving China’s target for energy
intensity reduction in 2010: an exploration of recent trends and possible future scenarios.
Lawrence Berkeley National Laboratory, LBNL Report, Berkeley, CA. LBNL-61800.
Lin, J., Zhou, N., Levine, M.D., and Fridley, D., 2008. Taking out 1 billion tons of CO2: The
magic of China’s 11th Five-Year Plan? Energy Policy 36 (2008): 954-970.
Lu, W., 2007. Personal communication with Lu Wenbin, National Development and Reform
Commission, September 11, 2007.
Lu, X., 2006. Personal communication with Lu Xinming, Director, Department of
Environment & Resources Conservation, National Development and Reform
Commission, 9 September.
McKane, A., Price, L., and de la Rue du Can, S., 2007. Policies for promoting industrial
energy efficiency in developing countries and transition economies. Geneva: United
Nations Industrial Development Organization.
http://ies.lbl.gov/iespubs/63134.pdf
Ministry of Finance (MOF), 2006. Notice of the Ministry of Finance, National Development
and Reform Commission, Ministry of Commerce, General Administration of Customs,
State Administration of taxation on adjusting the tax refund rates of certain commodities
and supplementing the catalogue of prohibited commodities in processing trade. No.139
[2006], September 2006.
Ministry of Finance (MOF), 2007. Notice of the Ministry of Finance, and State
Administration of Taxation on adjusting the tax refund rates of iron & steel products for
export. No.64 [2007], April 2007.
Ministry of Finance (MOF), 2008. Report on the implementation of the central and local
budgets for 2007 and on the draft central and cocal budgets for 2008. First Session of the
Eleventh National People’s Congress, March 5, 2008.
Ministry of Finance (MOF) and National Development and Reform Commission (NDRC),
2007. Notice on the issuance of “energy saving technological transformation of financial
incentives” interim procedures for fund management.
http://www.mof.gov.cn/news/20071219_3460_29945.htm
Energy Policy, Volume 38: Issue 11. November 2010
27
Moskovitz, D., Lin, J., Weston, F., Zhou, F, Liu, S., Hu, Z., Bai, J., and Yu, C., 2007. Draft
Part A Final Report TA 4706-PRC: Energy Conservation and Resource Management
Project.
Moskovitz, D., 2008. Climate change policy options for China's power sector. Regulatory
Assistance Project.
National Bureau of Statistics, 2007. China Statistical Yearbook. NBS, Beijing.
National Development and Reform Commission, 2006a. Notice of issuance of the thousand
enterprise energy saving action implementation plan, NDRC Environmental and Resource
Planning Office #571.
National Development and Reform Commission, 2006b. The National 1000 Enterprises
Energy Conservation Workshop Materials.
http://hzs.ndrc.gov.cn/jnxd/t20061108_92567.htm
National Development and Reform Commission, 2007. Notice of implementation scheme and
methods of statistic, monitoring and evaluation of energy intensity reduction work and
pollution reduction work, November 2007.
National Development and Reform Commission, 2008. Report on the implementation of the
2007 plan for national economic and social development and on the 2008 draft plan for
national economic and social development. Presented at the First Session of the 11th
National People’s Congress, March 5, 2008.
National Development and Reform Commission and National Bureau of Statistics, 2007.
Report on the state of the energy use of the top-1000 enterprises (Year 2007).
Netherlands Environmental Assessment Agency, 2007. China now No. 1 in CO2 emissions;
USA in second position. MNP: Bilthoven, The Netherlands.
http://www.mnp.nl/en/dossiers/Climatechange/moreinfo/Chinanowno1inCO2emissionsU
SAinsecondposition.html
Novem, 1999. Handbook Energy Efficiency Monitoring of Direct Energy Consumption in
Long-Term Agreements. Novem: Utrecht, The Netherlands.
http://www.senternovem.nl/mmfiles/hb_monitoring_tcm24-171841.pdf
Nuijen, W., 2002. Energy efficiency monitoring in Dutch industry. Presentation at the
Workshop on Voluntary Agreements for China’s Industrial Sector: Integrating
International Experiences into Designing a Pilot Program, February 25-27, 2002.
Nuijen, W. and Booij, M., 2002. Experiences with long-term agreements on energy efficiency
and an outlook to policy for the next 10 years. NOVEM: Utrecht, The Netherlands.
http://www.senternovem.nl/mmfiles/lta_experiences_report_tcm24-171835.pdf
Price, L., 2005. Voluntary agreements for energy efficiency or greenhouse gas emissions
reduction in industry: an assessment of programs around the world. Proceedings of the
2005 ACEEE Summer Study on Energy Efficiency in Industry. American Council for an
Energy-Efficient Economy: Washington, DC. http://ies.lbl.gov/iespubs/58138.pdf
Price, L., and Wang, X., 2007. Constraining energy consumption of China’s largest industrial
enterprises through the top-1000 energy-consuming enterprises program. Proceedings of
the 2007 ACEEE Summer Study on Energy Efficiency in Industry. American Council for
an Energy Efficient Economy: Washington, DC. http://ies.lbl.gov/iespubs/LBNL-
62874.pdf
Price, L, Worrell, E., Sinton, J., and Jiang, Y., 2003. Voluntary agreements for increasing
energy-efficiency in industry: case study of a pilot project with the steel industry in
Shandong Province, China. Proceedings of the 2003 ACEEE Summer Study on Energy
Efficiency in Industry. American Council for an Energy-Efficient Economy: Washington,
DC. LBNL-52715.
Price, L., Worrell, E., and Sinton, J., 2005a. Designing energy conservation voluntary
agreements for the industrial sector in China: experience from a pilot project with two
Energy Policy, Volume 38: Issue 11. November 2010
28
steel mills, in: Croci, E. (Ed.), The Handbook of Environmental Voluntary Agreements.
Kluwer Academic Publishers. (Also available at: http://ies.lbl.gov/iespubs/54712.pdf).
Price, L., Galitsky, C., Sinton, J., Worrell, E., Graus, W., 2005b. Tax and fiscal policies for
promotion of industrial energy efficiency: a survey of international experience. LBNL
Report, Lawrence Berkeley National Laboratory, Berkeley, CA. LBNL-58128.
Price, L., Galitsky, C., Kramer, K.J., and McKane, A., 2008. International experience with
key program elements of industrial energy efficiency or greenhouse gas emissions
reduction target-eetting programs. LBNL Report, Lawrence Berkeley National
Laboratory, Berkeley, CA. LBNL-63807. http://ies.lbl.gov/iespubs/LBNL-63807.pdf. See
also associated website that provides links to most of the reports reference in this
document: http://industrial-energy.lbl.gov/resources
Schiller, S. 2007. National action plan for energy efficiency: model energy-efficiency
program impact evaluation guide. U.S. EPA: Washington, DC.
http://www.epa.gov/solar/documents/evaluation_guide.pdf
SenterNovem, 2005. Long term agreements on energy efficiency in the Netherlands: results
from 2004. SenterNovem: Utrecht, The Netherlands.
www.senternovem.nl/mmfiles/3MJAF05%2E03%20LTA%20Results%20for%202004_tc
m24-175780.pdf
Sha and Jie, 2008. In 2008 Ministry of Finance arranges 27 billion RMB as special financial
support in order to promote energy reduction. Xinhua News Agency, March 24, 2008.
Shock, R., 2000. The UK energy efficiency best practice programme.
http://www.un.org/events/energy2000/speaker/shock/shock.ppt.
Togeby, M., Johannsen, K., Ingrslev, C., Thingvad, K., and Madsen, J., 1999. Evaluations of
the Danish agreement system. Proceedings of the 1999 American Council for an Energy-
Efficient Economy Summer Study on Energy Efficiency in Industry. ACEEE:
Washington, DC.
United Nations Development Program (UNDP), 2005. China: End Use Energy Efficiency
Programme.
http://www.undp.org.cn/modules.php?op=modload&name=News&file=article&catid=7&
topic=21&sid=40&mode=thread&order=0&thold=0
Wakabayashi, M. and Sugiyama, T., 2007. Japan’s Keidanren voluntary action plan for the
environment, in: Morgenstern, R.D. and Pizer, W.A. (Eds.), Reality Check: The Nature
and Performance of Voluntary Environmental Programs in the United States, Europe, and
Japan. Resources for the Future: Washington DC.
Wang L., 2007. Shandong Economic and Trade Commission, Energy Saving Office of
Shandong Provincial Government. Implementation of energy-saving agreements in
Shandong Province. Presentation at the Benchmarking Workshop, Jinan, September 7.
http://ies.lbl.gov/iespubs/Wang_Liting_Presentation_VAs_Jinan.ppt
Wang X., 2006a. Top-1000 enterprises energy efficiency program: policy design and
implementation. Supporting documentation for the Energy Foundation’s Forum on
Implementing China’s 2010 20-Percent Energy Efficiency Target, November 9-10, 2006.
Wang X., 2006b. Top-1000 enterprises energy efficiency program: policy design and
implementation. Presentation at the Energy Foundation Forum on Implementing China’s
2010 20-Percent Energy Efficiency Target, 9 November 2006.
Wang X., 2006c. Top-1000 enterprises energy conservation action in China: an introduction.
Presentation at the International Energy Agency, April.
World Energy Council, 2003. Survey on Energy Efficiency Policy Measures. WEC: London.
World Energy Council, 2004. Energy Efficiency: A Worldwide Review – Indicators,
Policies, Evaluation. WEC: London.
Energy Policy, Volume 38: Issue 11. November 2010
29
Yan Liang (Ed.), 2007. 1,000 leading enterprises ordered to meet global energy standards.
http://english.gov.cn/2007-09/21/content_758407.htm
Zhao, T., 2008. High-energy-consuming firms save 38.17m tons of coal. China Daily. 2008-
09-04.
Zhou, N., Levine, M.D., Price, L., 2009. Overview of current energy efficiency policies in
China. Energy Policy.