the business case for workers age 50+: planning for ... business case for workers age 50+: ... in...
TRANSCRIPT

Planning for Tomorrow’s Talent Needsin Today’s Competitive EnvironmentA Report for AARP Prepared by Towers Perrin | December 2005
The Business Case for
WorkersAge 50+
©2005 AARP. All rights reserved. Reprinting with permission only. 601 E Street, NW, Washington DC 20049www.aarp.org/employerresourcecenter
D18540 (1205)
The B
usin
ess Case fo
r Wo
rkers Ag
e 50+Plan
nin
g fo
r Tom
orro
w’s Talen
t Need
s in To
day’s C
om
petitive En
viron
men
t | Decem
ber 2005

Acknowledgements: This report was pre-pared by Roselyn Feinsod, Tom Davenportand Rich Arthurs of Towers Perrin’s HRServices business, with assistance fromNubia Alexander, Nick Blitterswyk, EllenFuccella, Nicholas Fox and Amy Sung. The study was made possible by AARP’sEconomic Security Department. Specialthanks go to the following members ofAARP’s staff who served on the project
advisory team: Deborah Russell, EconomicSecurity; Jon Dauphiné, Social Impact;Sara Rix, Public Policy Institute; and S. Kathi Brown, Strategic Issues Research.
For additional information, please contactDeborah Russell at 202-434-2067, Sara Rix at202-434-2416, Kathi Brown at 202-434-6296or Roselyn Feinsod at 203-326-5464.
©2005 AARP. All rights reserved.Reprinting with permission only. AARP Knowledge Management601 E Street, NW, Washington DC 20049http://research.aarp.org
The Business Case for Workers Age 50+:Planning for Tomorrow’s Talent Needs in Today’s Competitive EnvironmentA Report for AARP Prepared by Towers Perrin | December 2005

1
Contents3 Foreword
8 Executive Summary
25 I. Business Implications of Changing
Workforce Demographics
33 II. The Value Side of the Equation:
Advantages of Experience
45 III. The Cost Side of the Equation:
Understanding the Key Drivers
67 IV. The Employee Perspective: What
50+ Workers Are Looking For
75 V. Managing Opportunities and
Challenges: Strategies for the
50+ Workforce
93 About This Study
94 Endnotes
50+The Business Case for Workers Age 50+:Planning for Tomorrow’s Talent Needs inToday’s Competitive Environment

2
Figures and Exhibits
13 Figure 1: Current Workforce
Profile for Large U.S. Employers
With Pension Plans
20 Figure 2: Value and Cost
Comparisons: Summary of
Analysis of Focused Retention
and Attraction
25 Exhibit I-1: Projected Change in
Civilian Labor Force by Age
Group, 2002 to 2012
26 Exhibit I-2: Dominant Business
Strategy
27 Exhibit I-3: Labor Force
Participation Rates of Workers
55+ Needed to Support 2%
Annual Productivity Growth
30 Exhibit I-4: Varying Workforce
Age Profiles by Industry in 2003
36 Exhibit II-1: Engagement and
Revenue Growth
36 Exhibit II-2: Engagement and
Cost of Goods Sold
37 Exhibit II-3: Employee Motivation
in All Industries, by Age
38 Exhibit II-4: Employee Motivation
in All Industries, by Service Level
39 Exhibit II-5: Employee Motivation,
by Industry and Age
40 Exhibit II-6: Turnover Patterns,
by Age and Industry
41 Exhibit II-7: Engagement and
Turnover: Likelihood of
Leaving Current Employer
by Engagement Level
46 Exhibit III-1: Breakdown of
Typical Reward Costs in Large
U.S. Companies
47 Exhibit III-2: Average
Compensation Levels by Age
and Service for Selected
Industries
48 Exhibit III-3: Major Components
of Employee Benefit Costs
49 Exhibit III-4: Average Employer-
Provided Benefit Values, by
Industry
50 Exhibit III-5: Annual Aggregate
Medical Claim Costs for
Employees and Dependents,
by Age of Employee
51 Exhibit III-6: Annual Medical
Costs, by Health Risk Levels
and Age
52 Exhibit III-7: Percent of Large
Companies Offering Defined
Benefit Pension Plans
53 Exhibit III-8: Percent of Large
Companies Offering Retiree
Medical Coverage
54 Exhibit III-9: Retirement Income
Plans Offered, by Industry
55 Exhibit III-10: Average Monthly
Retiree Medical Costs and
Retiree Contributions, by
Industry
56 Exhibit III-11: Typical Vacation
Policies in Large U.S. Companies,
by Industry
57 Exhibit III-12: One-Time Costs of
Hiring and Replacing Workers
59 Exhibit III-13: Value and Average
Cost: Comparisons for an
Engineer (Energy Industry)
60 Exhibit III-14: Value and Average
Cost: Comparisons for Sales
Manager (Financial Services)
63 Exhibit III-15: Value and
Average Cost: Comparisons for
Registered Nurse (Health Care)
64 Exhibit III-16: Value and
Average Cost: Comparisons for
Store Manager (Retail Industry)
68 Exhibit IV-1: Plans for
Retirement Among Workers
Ages 50 to 70
69 Exhibit IV-2: Major Factors in
the Decision to Work in
Retirement
70 Exhibit IV-3: One Major Factor
in the Decision to Work in
Retirement
70 Exhibit IV-4: When Today's
Workers Ages 50 to 70 WIll Stop
Working Completely
71 Exhibit IV-5: When Today's 50+
Employees in Large Companies
Expect to Stop Working
Completely
72 Exhibit IV-6: Expectations About
Working in Retirement Among
50+ Employees in Large
Companies
73 Exhibit IV-7: Top Five Factors
Employees 50+ in Large
Companies Consider in Deciding
to Join a Company
73 Exhibit IV-8: Top Five Factors
Employees 50+ in Large
Companies Consider in Deciding
to Stay With a Company
74 Exhibit IV-9: Importance of
Selected Benefits and Employer
Characteristics in Retirement
Work
75 Exhibit V-1: How Organizations
Are Preparing for the Possibility
of a Shortage of Workers Due
to the Retiring Baby Boom
Generation
76 Exhibit V-2: Incentives Offered
by Employers to Help Retain
Workers 50+

3
Foreword
Three important trends are converging
that are having a dramatic impact on
the American workforce:
e The workforce, and the population
as a whole, are aging,
r Labor shortages are projected in a
growing number of sectors of the
economy,
tMany workers intend to continue
to work beyond the traditional
retirement age.
AARP has for many years educated
employers and policymakers about
practices that address the needs of a
changing and maturing workforce.
50+“In light of the declining proportionof younger workers and projected
shortages, many employers will need toturn to mature, experienced workers
in order to gain and maintain acompetitive advantage.”

4
The Business Case for Workers Age 50+ | Foreword
It provides documentation to the
business community that attracting
and retaining mature, experienced
workers will become increasingly
critical to maintaining a competitive
advantage in the new labor market. In
other words—it’s a business imperative.
The demographic projections are
clear. By 2012, nearly 20% of the total
U.S. workforce will be age 55 or older,
up from just under 13% in 2000.1 This
growth in the number of older workers
reflects the fact that the population as
a whole is getting older due to several
factors, including the aging of the
large Baby Boom Generation, lower
birth rates and longer life expectancies.
With the pending retirement of the
baby boomers—the first of whom will be
eligible for early Social Security benefits
in 2008—many analysts are predicting
growing labor shortages in tomorrow’s
workforce. In fact, some employers are
facing that problem now. In addition to
the widely publicized shortages of nurses
and other health care professionals,
organizations that rely on such specially
trained individuals as teachers, engineers,
and many other skilled people are
feeling the pressure of labor shortages.
As a testament to the challenges on
the horizon, 58% of HR managers
responding to a 2005 AARP survey said
that it is more difficult today than it
was five years ago to find qualified job
applicants. More than half of the HR
Now, this study breaks newground on why employers shouldview 50+ workers as valuablecontributors to their workforceneeds.
Foreword

5
The Business Case for Workers Age 50+ | Foreword
managers believe that their companies
are likely to face a shortage of qualified
workers within the next five years.2
Fortunately, many of today’s workers
want to work and want viable work
options later in life. AARP research
found that 69% of individuals between
the ages of 45 and 74 who are either
working or are looking for work plan
to work in some capacity during so-
called retirement.3 In another study,
68% of workers between the ages of
50 and 70 who have not yet retired
reported that they plan to work in
some capacity into their retirement
years or never retire.4
In light of the declining proportion of
younger workers and projected short-
ages, many employers will need to turn
to mature, experienced workers in order
to gain and maintain a competitive
advantage. HR managers who may
have once thought that older workers
could be replaced by those fresh out of
school will find themselves creating
flexible work schedules, telecommuting
options, training and education,
phased retirement and “bridge jobs,”
expressly designed to encourage
workers ages 50+ to remain on the job
beyond the age at which they might
otherwise retire.
Many companies, some of which are
mentioned in this report, have already
started to implement innovative
practices to attract and retain mature
workers. However, evidence shows that
other employers are slow to accommo-
date and adapt to the changing work-
force, no doubt because of negative
stereotypes and outdated notions about
the value of older workers.
In light of the decliningproportion of youngerworkers and projectedshortages, many employerswill need to turn to mature,experienced workers in order to gain and maintaina competitive advantage.

6
The Business Case for Workers Age 50+ | Foreword
However, this study presents the case
that traits exhibited by midlife and older
workers take on renewed value in today’s
economy—traits such as experience,
loyalty, attention to task, perseverance,
work habits and emotional maturity.
The negative stereotypes about age are
eroding as today’s 50+ population
redefines aging and demonstrates that
they expect to continue being produc-
tive, engaged and active well into their
70s and beyond.
As the 76-million Baby Boom
Generation nears traditional retirement
age, many U.S. companies are facing a
potentially significant loss of talent and
institutional knowledge across key areas,
including leadership, sales, and technical
disciplines. While the impact of this
undeniable trend will vary from industry
to industry and among different job
categories—many companies will be
able to avoid the drain by encouraging
today’s 50+ workers to stay in the
workforce longer.
In today’s business environment, the
most important value capital a company
possesses is its human capital. Employers
who recognize that fact and are
prepared to meet the workplace needs
of their people stay ahead of the curve.
Studies have shown that companies that
invest in their human capital realize a
return on investment through an
increase in their market value.
What has been missing until now is a
thorough examination of the recruitment
and retention of workers ages 50+
within a business case framework. Can
a business case be made for attracting
Foreword

7
The Business Case for Workers Age 50+ | Foreword
and retaining these workers? This study
affirms that, in fact, a case can be made.
The Business Case for Workers Age 50+:
Planning for Tomorrow’s Talent Needs
in Today’s Competitive Environment
debunks many of the widely held misper-
ceptions about the costs of older workers
and demonstrates that companies
should view 50+ workers as an essential
part of the plan to meet their workforce
needs. This study, prepared for AARP
by Towers Perrin, highlights the need
for employers to consider costs with a
broader lens and demonstrates that
hiring 50+ workers is a solid and sound
investment proposition.
It also shows, through documented
best practices and case studies, how to
develop and implement an effective
strategy for retaining and recruiting
workers 50+. By understanding how
the changing demographics of the
workforce impact business and by
viewing workers 50+ as a solution to
meeting workforce needs, companies
can compete and win in the changing
global marketplace.
Sincerely,
William D. Novelli
Chief Executive Officer, AARP

8
The Business Case for Workers Age 50+ | Executive Summary
12
34
What will happen within our employeepopulation—and our business—as the
demographics of the labor force change?
What are the economics of retaining and hiring 50+ workers?
What are the best approaches forretaining critical knowledge and
making the most of the available talent?
What are the leading companiesdoing to address these issues?
For many companies in the United States,
the changing demographics of the labor force
and looming exodus of retirement-eligible
employees pose significant challenges and
opportunities in terms of talent retention,
acquisition and management. While many
50+ workers may exit the workforce, others
will be looking to stay, some in new
occupations and roles. This presents an
opportunity for companies that take
advantage of this evolving talent pool, and
a challenge for those same companies to
manage generational diversity effectively.
Some organizations are already
struggling with talent shortages in certain
positions (e.g., nursing, engineering, sales,
leadership). Others are just beginning to
wrestle with a host of talent issues that are
frequently complex and may be critical to
their ability to grow and innovate, serve an
increasingly demanding customer base and,
ultimately, achieve their strategic business
and financial goals. Their leaders are
beginning to ask difficult questions about
an uncertain future, including:
Although the maturing of theworkforce has been extensively studiedand documented over the years, U.S.employers as a group have only recentlybegun to take a hard look at today’schanging workforce realities.

9
The Business Case for Workers Age 50+ | Executive Summary
Clearly, these questions have both economic
and human resource policy implications for
U.S. employers. It is one thing for an organi-
zation to recognize that programs to retain
and hire workers 50+ may be needed to
respond to evolving workforce demographics.
It is quite another challenge for an employer
to take effective action to retain, hire and
manage today’s changing workforce.
Implementing human resource policies
and practices that successfully address
workforce demographics by explicitly
encouraging and supporting the retention
and hiring of 50+ workers remains an
elusive goal for many organizations.
To promote a better understanding of
mature workforce issues among major
companies and to guide businesses in
responding to those issues, AARP engaged
Towers Perrin to study the financial and
programmatic implications of responding
to the changing demographics of the U.S.
workforce. Specifically, AARP wanted to
assemble evidence, derived from the best
available data, to assess the strength of the
business case for investing an employer’s
resources to attract and retain workers 50+.
The analysis required Towers Perrin to
distill evidence of the benefits of employing
older workers, assess the costs associated
with employing 50+ workers and challenge
conventional assumptions about the
financial and productivity implications
of workers age 50 and older.
The study also focused on current views
of work and retirement within the 50+
workforce and the kinds of employer
investments in rewards and other workplace
programs that may be needed to retain and
attract 50+ talent. Finally, the study explored
how employers have responded thus far to
issues related to changing labor force
demographics and the emerging practices
taking shape in the areas of workforce
planning and talent management. To
understand how employers are responding,
Towers Perrin conducted an extensive review
of the available research and previously
published studies on this issue. And to gain
up-to-date insights, in-depth telephone
interviews were conducted with senior
human resource executives in 10 major
organizations across the United States.
An overview of the study findings follows.
For details of how the study was conducted,
see page 89.
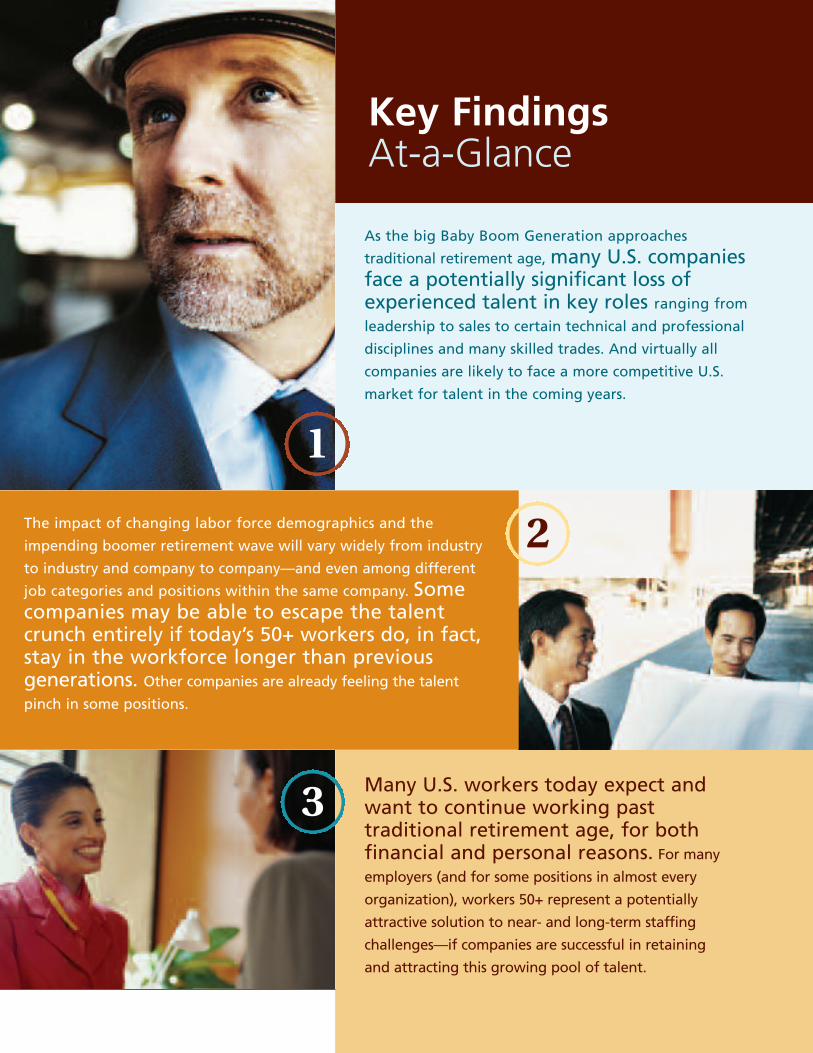
As the big Baby Boom Generation approaches
traditional retirement age, many U.S. companiesface a potentially significant loss ofexperienced talent in key roles ranging from
leadership to sales to certain technical and professional
disciplines and many skilled trades. And virtually all
companies are likely to face a more competitive U.S.
market for talent in the coming years.
Many U.S. workers today expect andwant to continue working pasttraditional retirement age, for bothfinancial and personal reasons. For many
employers (and for some positions in almost every
organization), workers 50+ represent a potentially
attractive solution to near- and long-term staffing
challenges—if companies are successful in retaining
and attracting this growing pool of talent.
1
Key Findings At-a-Glance
The impact of changing labor force demographics and the
impending boomer retirement wave will vary widely from industry
to industry and company to company—and even among different
job categories and positions within the same company. Somecompanies may be able to escape the talentcrunch entirely if today’s 50+ workers do, in fact,stay in the workforce longer than previousgenerations. Other companies are already feeling the talent
pinch in some positions.
2
3
The Business Case for Workers Age 50+ | Executive Summary
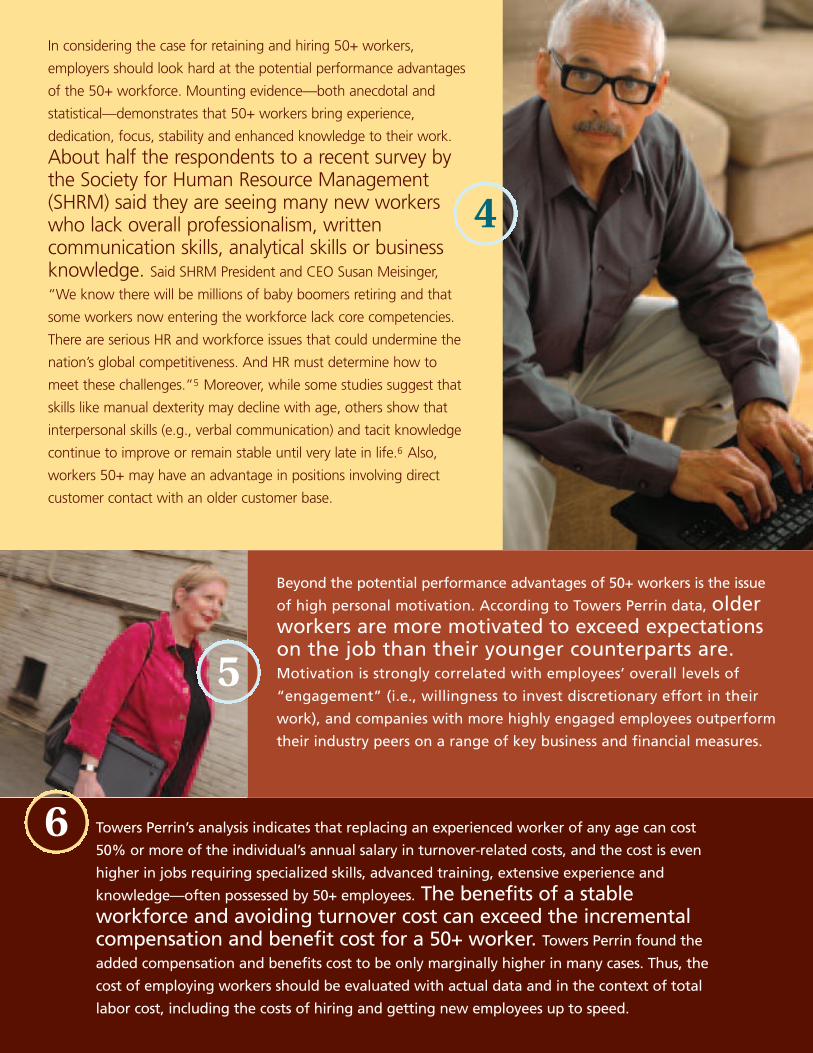
Towers Perrin’s analysis indicates that replacing an experienced worker of any age can cost
50% or more of the individual’s annual salary in turnover-related costs, and the cost is even
higher in jobs requiring specialized skills, advanced training, extensive experience and
knowledge—often possessed by 50+ employees. The benefits of a stableworkforce and avoiding turnover cost can exceed the incrementalcompensation and benefit cost for a 50+ worker. Towers Perrin found the
added compensation and benefits cost to be only marginally higher in many cases. Thus, the
cost of employing workers should be evaluated with actual data and in the context of total
labor cost, including the costs of hiring and getting new employees up to speed.
In considering the case for retaining and hiring 50+ workers,
employers should look hard at the potential performance advantages
of the 50+ workforce. Mounting evidence—both anecdotal and
statistical—demonstrates that 50+ workers bring experience,
dedication, focus, stability and enhanced knowledge to their work.
About half the respondents to a recent survey bythe Society for Human Resource Management(SHRM) said they are seeing many new workerswho lack overall professionalism, writtencommunication skills, analytical skills or businessknowledge. Said SHRM President and CEO Susan Meisinger,
“We know there will be millions of baby boomers retiring and that
some workers now entering the workforce lack core competencies.
There are serious HR and workforce issues that could undermine the
nation’s global competitiveness. And HR must determine how to
meet these challenges.”5 Moreover, while some studies suggest that
skills like manual dexterity may decline with age, others show that
interpersonal skills (e.g., verbal communication) and tacit knowledge
continue to improve or remain stable until very late in life.6 Also,
workers 50+ may have an advantage in positions involving direct
customer contact with an older customer base.
4
Beyond the potential performance advantages of 50+ workers is the issue
of high personal motivation. According to Towers Perrin data, olderworkers are more motivated to exceed expectationson the job than their younger counterparts are.Motivation is strongly correlated with employees’ overall levels of
“engagement” (i.e., willingness to invest discretionary effort in their
work), and companies with more highly engaged employees outperform
their industry peers on a range of key business and financial measures.
5
6
12
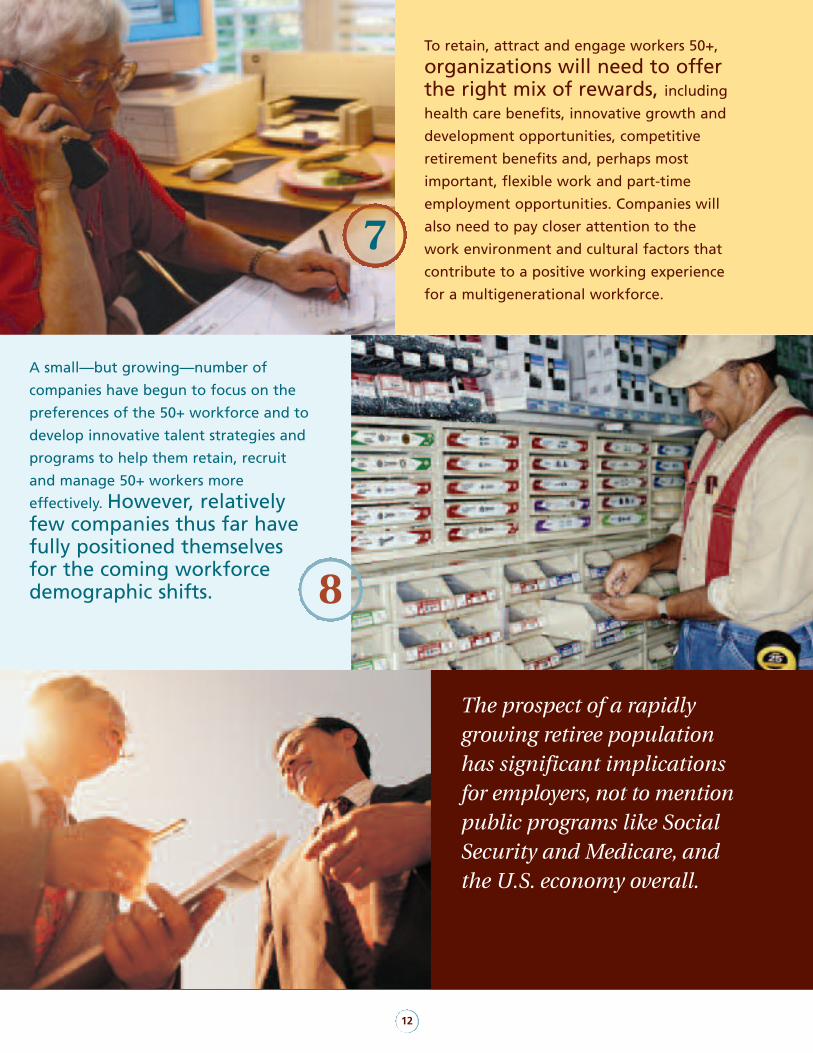
To retain, attract and engage workers 50+,
organizations will need to offerthe right mix of rewards, including
health care benefits, innovative growth and
development opportunities, competitive
retirement benefits and, perhaps most
important, flexible work and part-time
employment opportunities. Companies will
also need to pay closer attention to the
work environment and cultural factors that
contribute to a positive working experience
for a multigenerational workforce.
7
The prospect of a rapidlygrowing retiree populationhas significant implicationsfor employers, not to mentionpublic programs like SocialSecurity and Medicare, andthe U.S. economy overall.
A small—but growing—number of
companies have begun to focus on the
preferences of the 50+ workforce and to
develop innovative talent strategies and
programs to help them retain, recruit
and manage 50+ workers more
effectively. However, relativelyfew companies thus far havefully positioned themselvesfor the coming workforcedemographic shifts. 8

?
13
The Business Case for Workers Age 50+ | Executive Summary
What will happen within your employeepopulation—and your business—as the
demographics of the labor force change?This is a good question—and one that is
attracting more and more attention from
economists, academics, the news media and
employers themselves. One thing is clear:
a significant demographic bubble known
as the baby boom, which consists of about
76 million Americans born between 1946
and 1964, represents a large part of today’s
workforce. The leading edge of the baby
boom is now approaching the age at which
Americans have typically been retiring over
the past few decades. The prospect of a
rapidly growing retiree population has
significant implications for employers, not to
mention public programs like Social Security
and Medicare, and the U.S. economy overall.
What is unknown, of course, is how the
boomers themselves will behave. Experts
predict that the boomers will stay in the
workforce longer than the generations that
immediately preceded them. If so, the
pressures on government programs and
potential talent gaps facing employers will
be reduced, allowing for a smoother
transition for the labor market and the
economy as demographics shift. Others
believe that defined benefit pension plans
offering attractive retirement benefits and
company-subsidized retiree medical coverage
will create an incentive for employees to
retire early, and perhaps seek employment
with a different organization. Although the
prevalence of defined benefit plans has
gradually declined in recent years, they
continue to be offered by about two-thirds
of the large U.S. employers in Towers Perrin’s
Employee Benefit Information Center
database (which contains information on
more than 700 U.S. Fortune 1000 companies
and organizations of similar size not
included in the Fortune listing, such as
privately held companies, nonprofit
organizations and large U.S. subsidiaries
of companies headquartered overseas).
Towers Perrin’s workforce demographic
data for large employers sponsoring U.S.
pension plans show that almost one in five
workers in these companies is retirement-
eligible today—and another third of these
workers will become retirement-eligible
over the next five to 10 years. (See Figure 1.)
Age:
n Under 30
n 30 to 39
n 40 to 49
n 50 to 54
n 55 to 59
n 60+
11%11%
7%
25%
33%
14%
Figure 1Current Workforce Profile for LargeU.S. Employers with Pension Plans
Source: Towers Perrin 2003 workforce data for 335 large U.S. employers(i.e., Fortune 1000 companies and equivalents), covering more than threemillion employees. ©2005 Towers Perrin.

14
The Business Case for Workers Age 50+ | Executive Summary
Virtually all companies will face a more
competitive U.S. market for talent in coming
years, along with the challenge of managing
an increasingly cross-generational workforce,
especially if significant numbers of boomers
do, in fact, prolong their careers. Continuing
productivity gains, immigration, off-shoring
and new labor-saving technologies may help
mitigate the staffing crunch for some
companies. Current data and projections
suggest that the U.S. workforce will grow at a
considerably slower rate during the first half
of this century than it did during the last 50
years.7 This slowdown in labor force growth
will occur at a time when many major
companies are shifting their focus from
business strategies geared to cost-reduction
toward growth models that emphasize
innovation and excellence in customer
service. Such strategies depend on having
the right number of engaged, service-focused
employees—and therein lies the opportunity,
as demographics evolve, for companies to
gain a competitive advantage by effectively
deploying the skills and talents of all age groups.
When the predicted labor crunch comes,
the nation’s largest corporations are likely to
feel the impact most profoundly, partly because
of their hiring patterns over the past 30 to 40
years. Although each company’s situation is
different, those in mature industries are
clearly most at risk. The energy industry is a
prime example, with its history of rapid
growth in the 1960s and 1970s, followed by
periods of downsizing in which relatively few
new entry-level employees were hired. The
result in some job categories is a workforce
made up of large numbers of long-service
workers, a smaller group of more recent hires
and relatively few mid-career employees
ready to step into the shoes of retirement-
eligible boomers.
When the predicted labor crunch comes, the nation’s largestcorporations are likely to feel the impact most profoundly, partly
because of their hiring patterns over the past 30 to 40 years.
Current data and
projections suggest that
the U.S. workforcewill grow at aconsiderably slowerrate during the firsthalf of this centurythan it did during the last
50 years.7

15
The Business Case for Workers Age 50+ | Executive Summary
?While it is impossible to generalize about all
the cost-value tradeoffs associated with 50+
talent, a compelling business case can be
made for retaining or hiring 50+ workers for
a wide range of jobs in corporate America
today. In a nutshell, the added total labor
cost of 50+ talent is only marginally higher
in many cases, while the cost of replacing
experienced workers is often significant.
Talented experienced workers have distinct
performance advantages in roles that require
advanced skills, training, experience and
knowledge of a company’s business
processes, people or customers. Without
exception, the select group of 10 major U.S.
employers interviewed for this study said
that the experience, maturity and positive
attitudes of their 50+ workers provide
enormous value to their businesses.
These observations are consistent with the
findings of two AARP surveys of human
resource managers. In these studies, older
employees were rated highly by the survey
respondents on almost all qualities that
employers consider most desirable.8
This does not mean, however, that firms
should not take a close look at the cost of
labor across all segments of the employee
population. Some employers still believe that
50+ workers are more costly to employ than
their younger counterparts. Few, however,
have analyzed the drivers of total labor costs.
Delving into these issues reveals a picture that
is often very different from the one assumed.
Towers Perrin’s data show that four
components—cash compensation, health care
benefits, retirement benefits and paid time off—
make up 97% of average total compensation
costs in large U.S. companies. The relative level
and mix of the components vary by industry.
Depending on how the programs are structured,
the cost of the components will increase with a
combination of factors:
What are theeconomics of
retaining and hiring50+ talent?

16
eCash compensation costs. Since companies
typically calibrate pay levels to approximate
the market median for each position,
these costs depend more on individual
ability, experience and performance than
on age. Employees performing the same
jobs at roughly the same productivity level
would expect to receive about the same
cash compensation. Increases over time
depend on employees demonstrating
increased productivity, developing new
competencies and capabilities, or taking
on added responsibility. There should be
no significant age-related differences in
pay levels for employees doing the same
jobs at the same level of performance.
rRetirement benefit costs. 401(k) plans,
which are provided by virtually all large
employers, are age-neutral, as the sponsoring
employers contribute a set percentage of
covered compensation for all eligible
employees, either automatically or on a
matching basis. Traditional defined
benefit pension plans, on the other hand,
are structured to reward long-service, career
employees. For employers that sponsor
defined benefit pension plans, costs are
higher for older workers because of the
time value of money and for long-service
workers because of the fundamental
decision to reward career employees. As
some firms move away from classic defined
benefit pensions, however, the cost focus
will shift to defined contribution savings
plans and become directly related to pay.
Towers Perrin’s data show that four components—cashcompensation, health care benefits, retirement benefitsand paid time off—make up 97% of average totalcompensation costs in large U.S. companies. 1
2

17
The Business Case for Workers Age 50+ | Executive Summary
tPaid time-off costs. Time-off costs are
not directly related to age. The cost of
vacation and other paid time off increases
with years of service because employers
typically offer more vacation time to
employees with longer tenure. As a result,
the cost of paid time off for the average
employee with 20 years of service is
typically double the cost for newly hired
workers in large U.S. companies. However,
a newly hired 50+ worker’s vacation cost
is equivalent to that of new hires at any age.
uHealth care costs. A number of factors
drive differences in employer-paid health
care costs. The incidence of specific
health risks (e.g., high blood pressure,
obesity, smoking) has a major impact in
driving up health care costs. These factors,
which vary from person to person
regardless of age, can have a more
profound effect than age alone on total
health care cost. Towers Perrin’s analysis
of company-paid medical claim costs
shows that employees age 50 to 65 use
on average from 1.4 to 2.2 times as much
health care as workers in their 30s and
40s. Note, however, that these compari-
sons are based on average costs. Some
workers will have costs that are below the
average and some will have costs that are
higher. Another offsetting factor to
consider is that Towers Perrin’s research
establishes that older workers may be
more effective partners in employer
efforts to promote better consumer
behaviors in health care purchasing.9
3
4
18
The Business Case for Workers Age 50+ | Executive Summary
To sum it all up, the largest component of
total compensation (cash compensation) is
driven chiefly by the employee’s skills,
responsibilities and individual contribution,
rather than by age. Paid time off is a service-
based reward and retirement costs are
influenced by a combination of tenure and
age. Health care costs are driven by a wide
range of factors, including individual health
risks, age, dependent coverage and health
care utilization.
eRetaining 50+ workers. This first
scenario assumes a large, mature
organization with a relatively modest and
predictable growth strategy. The
organization has a group of incumbent
employees age 55 with 20 years of service;
these employees could potentially retire,
leaving jobs that would need to be filled
with replacement employees. This
analysis focuses on the economics of two
alternative approaches for filling the
vacant jobs:
1. Allow natural retirement trends to
evolve with limited efforts to keep
incumbents, so that the employer
succeeds in retaining 20% of the
experienced incumbent staff and fills
the resulting vacancies from the broad
labor pool; or alternatively,
2. Mount a focused effort to double
retention to 40% of the experienced
workers, reducing the need to hire from
outside labor sources and increasing
such benefits as knowledge retention
and mentoring, and avoiding some
turnover costs.
Average per-employee costs for the mix of
all employees filling the jobs in question—
retained incumbent employees and new
hires—were analyzed. The results show
Because the economicconsiderations identified aredriven by a combination of plandesign, tenure, age, health risksand one-time costs, it is useful toassess two hypothetical businesscase scenarios:
19
The Business Case for Workers Age 50+ | Executive Summary
how average per-employee costs can
change as a result of this effort to retain
more 50+ workers.
rAttracting new 50+ workers. The second
scenario focuses on a fast-growing company
that finds itself needing to fill a number of
newly created jobs. Retirement trends typical
for the industry also contribute to the
number of open job slots. The analysis
again focuses on the economics of two
ways of responding to the staffing need:
1. From the current applicant pool, hire a
set of workers consistent with the
applicant demographics, 80% of whom
are age 40 and 20% of whom are age 55;
or alternatively,
2. Via increased outreach to the 50+ talent
pool (e.g., through implementation of
extended work hour and location
flexibility), fill the open slots by doubling
the percentage of age-55 hires to 40%,
with the age-40 group at 60%.
Average per-employee costs for the mix of
all new hires who fill the jobs were analyzed.
In this scenario, the results show how average
per-employee costs can change as a result of
the effort to hire more 50+ workers. (Figure 2
summarizes the results of these analyses.)
Whether in the context of
retaining a larger segment of
the 50+ workforce or targeting
additional hiring of 50+
workers, the comparativecost differences arebalanced—if notoutweighed—by otherfactors.

20
The Business Case for Workers Age 50+ | Executive Summary
In the hypothetical analyses in the exhibit
below, all new hires for the jobs in question
were assumed to either be age 40 or age 55,
and all retained incumbent workers used to
fill those jobs were assumed to be age 55. In
reality, of course, the age mix of employees in
a particular position within any organization
will be more diverse as it is unlikely that
either all new hires will be the same age or all
incumbent workers will be the same age.
As described below and summarized in
the estimates in Figure 2, by increasing
retention significantly, the employer would
avoid a portion of the one-time costs of
turnover. The annual difference in average
per-employee cost associated with enhanced
retention ranges from 1% to 3% and is
modest if the experienced worker is well
suited for the position. If the new hire departs
soon after being hired, the effective turnover
costs would be greater than those estimated
and would enhance the retention case.
The last row of Figure 2 demonstrates that,
if the mix of new hires shifts using focused
outreach and doubles the percentage of new
55-year-old workers from 20% to 40%, the
organization would experience only a
minimal cost impact—roughly 1% of the
average cost per new employee. Given this
negligible difference, the hiring decision is
likely to be overshadowed by differences in
other worker characteristics, such as
experience, training and job performance.
The actual numbers will differ from the
estimated averages shown here depending on
the actual characteristics of the compensation
Position: Engineer Sales Manager Nurse Store Manager (Industry) (Energy) (Financial Services) (Health Care) (Retail)
Key value differentiators • Higher motivation • Higher motivation • Higher motivation • Lower turnover• Skilled talent shortages • Lower turnover • Skilled talent shortages • Alignment with • Experience and • Experience and • Experience and customer base
knowledge premium knowledge premium knowledge premium • Scheduling• Knowledge transfer • Alignment with • Alignment with flexibility
customer base customer base
One-time turnover cost as a 38% 33% 29% 39%percent of total annual compensation cost
Estimated difference in average 3% 1% 2% 2%per-employee total compensationcosts associated with doubling the retention of workers age 55 with 20 years of service from 20% to 40%
Estimated difference in average 1% <1% 1% 1%per-employee total compensation costs associated with doubling the percentage of new hires age 55 from 20% to 40%
Source: Towers Perrin data for large U.S. employers (i.e., Fortune 1000 companies and equivalents) and analysis of data from the Saratoga Institute and othersources; for more data, methodology and assumptions, see Section III. ©2005 Towers Perrin.
Figure 2 Value and Cost Comparisons: Summary of Analysis of Focused Retention and Attraction

21
The Business Case for Workers Age 50+ | Executive Summary
and benefit programs the company sponsors,
health risks, as well as on the actual data for
the mix of the long-service older workers and
the new hires in question.
In short, whether in the context of retaining
a larger segment of the 50+ workforce or
targeting additional hiring of 50+ workers, the
comparative cost differences are balanced—if
not outweighed—by other factors. In the case
of retention, the offsetting factors are the
turnover-related costs of replacing veteran
employees with deep institutional knowledge
and job-related know-how and the time it
takes to select and train new workers to be
fully productive. In the case of hiring, the
age-based compensation cost differences
are negligible relative to total labor cost and,
thus, make a strong business case for
recruiting at all ages to maximize business
performance and the organization’s return
on the available talent.
And what about the productivity side of
the equation? The impact of aging on worker
productivity is highly dependent on the
specific job and work performed. In most
cases, employers can expect that a 50+ worker
will be more productive than someone
younger and with less on-the-job experience.
Academic studies of physical attributes like
strength and manual dexterity have found
that workers’ abilities tend to decline with
age. But, increasingly, due to the growth of
the knowledge economy, the proportion of
jobs requiring relatively little physical effort
has increased considerably over the past few
decades. Moreover, research on cognitive
functioning and skills that are learned over
time (e.g., verbal communication) shows that
abilities in these areas improve with age.10
The myth that older workers are inflexible
and uncreative is not grounded in fact.
Economist David Galenson of the University
of Chicago suggested that creativity comes
in two forms: conceptual innovation (bolt-
from-the-blue, mold-breaking new ideas)
and experimental innovation (new ideas that
are extensions of current practice). The former
comes from perspectives unfettered by
conventional ways of doing things, while the
latter comes from a lifetime of observation
and learning. Older workers are better at
experimental innovation, and organizations
clearly need both kinds.11
The myth that older workers areinflexible and uncreative is notgrounded in fact.

?The Business Case for Workers Age 50+ | Executive Summary
22
The age 50+ worker also has a strong sense
of personal motivation to succeed on the job.
According to a major study Towers Perrin
conducted in 2003 among roughly 35,000
employees working for midsize and large U.S.
companies, employees over age 50 were more
motivated to exceed expectations on the job
than were younger workers. This finding
refutes the myth that the 50+ worker is inclined
to “check out” after decades in the workforce.
The same 2003 study explored the related
concept of “employee engagement,” which
Towers Perrin defines as employees’
willingness and ability to contribute to
company success, or put discretionary effort
into their work, in the form of extra time,
dedication and energy.
Through the study, Towers Perrin
investigated the link between employee
engagement and business performance. By
analyzing reported financial data on the more
than 1,000 U.S. companies for which many of
the 35,000 survey respondents work, the
study concluded that companies with higher
levels of employee engagement outperform
those with lower engagement on a number of
key financial benchmarks, including revenue
growth and cost management. In short,
employee engagement and superior business
performance are strongly intertwined.
The study also found a strong inverse
relationship between employee engagement
and turnover. Not surprisingly, employees
who are more engaged are less inclined to
leave their employers. Given the high cost of
turnover, this is an important consideration
for companies thinking about how to
maximize the business value of their
workforce investments.
The age 50+ worker also has a strong sense of personal
motivation to succeed on the job.

?
23
The Business Case for Workers Age 50+ | Executive Summary
This is likely to be the billion-dollar question
for many companies. Surveys by AARP, Towers
Perrin and other organizations show that
most of today’s 50+ workers plan to continue
working in some capacity in retirement, many
of them well beyond traditional retirement
age.12 With the decline in both prevalence and
typical benefit level of defined benefit
pensions and retiree medical coverage over
the past several decades and the losses in
401(k) accounts and other savings that many
employees suffered when the stock market
sank early in this decade, many working
Americans are concluding that they can’t afford
to retire as early as previous generations. And,
with today’s longer life expectancies, many
others want to continue working, at least
part time, for the personal fulfillment and
involvement that working brings.
What is also clear is that employers
seeking to tap this pool of talent are certain
to have a lot of competition for these
workers and will need to offer the rewards
and other workplace programs that 50+
workers want and expect. At the top of this
list, according to a recent Towers Perrin
survey of 1,500 workers 50+ employed by
large U.S. companies, are key financial
rewards—specifically, health care coverage
and competitive retirement benefits.
Close behind are important intangibles,
including work-life balance, respect for their
skills and recognition for individual
contributions. Given the widespread desire
among 50+ workers for flexible working
arrangements and part-time employment,
companies that offer such opportunities will
have a leg up in attracting and retaining this
growing talent pool. AARP research yielded
similar findings. In a survey of 2,001 workers
ages 50 to 70, respect from employers, flexible
work options, opportunities for training and
new experiences, competitive health care
benefits and competitive retirement benefits
were issues identified as important to most
50+ workers.13
These considerations have obvious
implications for companies’ talent strategies.
From our interviews with leading employers
in various industries, it is clear that some are
making the most of their scheduling flexibility
to aggressively recruit 50+ workers and retirees.
For other organizations, meeting tomorrow’s
workforce needs will depend more on their
ability to rebuild the talent pipeline from the
ground up.
Employers seeking to tap this poolof talent are certain to have a lot ofcompetition for these workers andwill need to offer the rewards andother workplace programs that 50+workers want and expect.
What are the bestapproaches for
retaining criticalknowledge and
making the most ofthe available talent?

24
?1
2
What are the leadingcompanies doing to
address these issues?
The Business Case for Workers Age 50+ | Executive Summary
3
4
5
6
As in all areas of business, careful planning
and execution are paramount. In a changing
world, it is critical to set aside assumptions
and preconceptions that are not supported
by fact. Companies that take well thought-
out action today to address tomorrow’s
workforce realities will be in a better position
to compete for talent and stay ahead of the
curve as workforce demographics shift.
Surprisingly, relatively few major employers
thus far have taken a close look at how
current demographic trends are likely to
affect their future talent needs. In a 2002
Conference Board survey of 150 senior
human resource executives, for example,
roughly two-thirds of the companies
surveyed had not yet developed an age
profile of their workforces.14
However, this appears to be changing.
Interviews conducted for this study with
leading employers (and Towers Perrin’s
consulting experience) show that a growing
number of companies today are starting to
analyze their workforce demographics and
implement targeted strategies and programs
to recruit and retain 50+ talent and capture
the knowledge of workers nearing retirement.
There is also growing employer interest in
phased retirement programs designed to
enable employees to withdraw from the
workforce gradually. At present, pension
rules and other legal concerns pose a barrier
to formal programs of this sort in companies
offering defined benefit pension plans.15
Although successful approaches are as
varied as the organizations that use them,
here are some of the key steps that are
critical to any company’s efforts:
Inventory your current talent and define your future needs, based on an analysis of
your organization’s near- and long-term
business plans.
Model your cost trends to understand thebusiness case for investments needed toattract or retain 50+ workers, focusing on
total compensation costs for the various
talent pools and taking into account one-
time turnover costs.
Pay equal attention to revenue andperformance considerations, including the
impact of employee engagement on
company performance and turnover risk.
Study the available labor pool and define your talent strategies, keeping in mind the
specific requirements (physical, mental and
scheduling flexibility) of each job.
Align reward programs to support
your business and talent objectives.
Align workplace policies and culture, as all
of the available research points to the work
environment as a key consideration for 50+
workers in deciding whether to join or stay
with an organization.

25
The Business Case for Workers Age 50+ | I. Business Implications of Changing Workforce Demographics
I.l. Business Implications of Changing
Workforce Demographics
The changing demographics of the workforce
have been well chronicled over the past few
decades. It is hardly news that population
changes will have significant social, economic
and political implications. In particular, these
demographic trends present both a formidable
challenge and a major opportunity for large
U.S. companies. Many organizations are just
beginning to recognize that their longer-term
growth strategies could be compromised by a
shortage of available talent—a shortfall that
could be felt both in specific critical skill areas
and in sheer numbers of people to do the work.
The issue in a nutshell is this: Within the
next few years, there will likely not be enough
new workforce entrants to replace the people
who are (and will be) able, by virtue of their
age, to exit the workforce via retirement. Exhibit
I-1 highlights the dilemma clearly, showing
the projected changes in the various age
segments of the U.S. labor pool between 2002
and 2012. While the U.S. labor force overall is
projected to grow by 12% during this period,
according to the U.S. Bureau of Labor
Statistics, that growth will not be evenly
distributed across the population. Growth
in the workers age 16 to 54 is expected to be
modest or declining for ages 35 to 44, while
the number of workers age 55 and older is
projected to increase by almost 50%.
The business implication of these
demographic trends is clear: Companies
cannot afford to see the 50+ segment of the
workforce retire en masse without facing
potentially significant labor force or
16–19
% change by age of workers
-10 0 10 20 30 40 50
20–24
25–34
35–44
45–54
55–64
65+
%
Exhibit l-1Projected Change in Civilian Labor Force by Age Group, 2002 to 2012
Source: Mitra Toosi, Monthly Labor Review, February 2004.

26
The Business Case for Workers Age 50+ | I. Business Implications of Changing Workforce Demographics
knowledge gaps. Fortunately, as we will
discover later, many older workers hope to
remain employed in some capacity. The real
opportunity for major organizations,
therefore, becomes ensuring that they match
their needs for talent with the available skills
and capabilities of a changing workforce.
This, in turn, means an increasingly intense
focus on the potential contribution of workers
in the 50+ segment.
The growing importance of organizational
strategies focused on growth and innovation
makes the potential skill shortage particularly
acute. In the coming years, we can expect
many companies to increase recruiting to
meet growth needs, rather than cutting back
on staff as they have done in the recent past.
Responses from a 2003 Towers Perrin
survey of almost 1,300 midsize and large
employers in the United States and other
parts of the world indicate that companies
already see and are preparing for a shift in
strategic focus—from operational excellence
(characterized chiefly by cost cutting to
increase efficiency) to leadership in innovation
and customer service. (See Exhibit I-2.) Most
companies have been through belt-tightening
processes and have streamlined their
organizations. They now have the resources
and opportunity to expand—into new
markets, new service or product areas, or
both. This strategic shift is likely to produce
added tension for many organizations in
the very near future as the need to grow
and innovate intensifies at a time when the
supply of labor available (and qualified) to
support that growth is in question.
Estimates of future growth in per capita
GDP and the U.S. labor supply bear this out.
For example, research by Janemarie Mulvey
and Steven Nyce for the Pension Research
Council concluded that U.S. employers may
face a shortfall of more than four million
full-time employees by 2010, assuming the
need to support 2% annual productivity
growth.16 This research suggests that older
segments of the workforce will need to play a
growing role if the gap is to be closed.
Specifically, the research suggests that the
labor force participation rate of men and
women ages 55+ will need to grow considerably
to help contribute to sustained GDP growth.
For example, the labor force participation
rate of men ages 55 to 59 may need to
Within the next few years, there will likely not be enough new workforce entrants to replace the people who are (and will be) able,
by virtue of their age, to exit the workforce via retirement.
11%
Recent Years Near-Term Future
20%
11%19%
39%
8%
35%
5%22%
30%
n Customer Service
n Other/Don’t Know
n Operational Excellence
n Innovation Leadership
n Cost Leadership
Exhibit I-2 Dominant Business Strategy
Source: Reward and Performance Management Challenges: LinkingPeople and Results, a 2003 Towers Perrin survey of human resourceexecutives in 1,300 midsize and large organizations in Asia, Europe,North America and Latin America. ©2005 Towers Perrin.

27
The Business Case for Workers Age 50+ | I. Business Implications of Changing Workforce Demographics
Exhibit I-3 Labor Force Participation Rates of Workers 55+ Needed to Support 2% Annual Productivity Growth
2003
Males
0% 20 60 80 10040
77.657.2
90.4
32.8
2010
2020
8.3
21.9
91.6
9.7
18.8
66.6
67.538.7
22.29.8
38.2
2003
Females
0% 20 60 80 10040
65.545.3
76.3
22.7
2010
2020
4.1
13.0
77.3
4.8
11.2
52.8
53.526.8
13.24.8
26.4
n 55–59 n 60–64 n 65–69 n 70–74 n 75+Ages:
Source: Strategies to Retain Older Workers, Janemarie Mulvey and Steven Nyce, Pension Research Council Working Paper, The Wharton School, 2004.
grow from 78% in 2003 to 90% by 2010.
(See Exhibit I-3.)
The demographic picture is likely to look
even more challenging for many of the largest
U.S. companies—at least those that offer
traditional pension benefits that include
attractive early-retirement subsidies (see “Why
Focus on Larger Companies?” on page 28).
A review of Towers Perrin’s workforce
demographic data for 335 large employers
sponsoring U.S. pension plans shows that
almost one in five workers in these companies
is retirement-eligible today—and another one
in three will become retirement-eligible in the
next five to 10 years. (The Towers Perrin
database covers more than three million U.S.
employees, a representative cross-section of
the workforce in large U.S. companies in a
wide range of industries.)
Of course, the picture varies greatly from
industry to industry and company to
company, and even among different jobs
and locations within each industry or
organization. For example, the Nuclear
Energy Institute projects that the nuclear
power industry may need to replace almost
half its current workforce in the next five
years, primarily because of retirements.17
28
The Business Case for Workers Age 50+ | I. Business Implications of Changing Workforce Demographics
Why Focus on Larger Companies?
Except where otherwise noted, the data presented in this report are drawn
from Towers Perrin databases and surveys that focus primarily on large
employers and employees who work for these organizations. In general,
these are primarily Fortune 1000 companies headquartered in the United
States and similarly sized organizations not included in the Fortune listing,
such as large privately owned companies, nonprofit organizations (e.g., health
care organizations) and large U.S. subsidiaries of companies headquartered
outside the United States.
Although the universe of these organizations is fairly small in sheer
numbers, their importance to the overall economy far outweighs their
numerical proportion. For example, the total employment of the Fortune
1000 companies (29 million workers worldwide) is equal to about 20%
of the U.S. civilian labor force of 141 million in 2005, according to
Bureau of Labor Statistics data. What’s more, the Fortune1000 companies tend to define the leading edge ofhuman resource practices and, thus, have policiesand programs that many smaller organizations try to emulate in order to compete for talent.
The growing shortage of nurses in some
markets has also been well documented, as
half of all nurses working today in the United
States will be retirement-eligible by 2015.
(See “Industry Focus” on page 30 for a closer
look at the range of challenges facing four
major industries.)
Entering a New Era: Building aBusiness Case for ChangeAre employers prepared to meet this
changing environment? The available
research suggests a mixed answer at best.
In a 2002 online survey that elicited
responses from 150 senior human resource
executives across a wide range of industries,
the Conference Board found relatively few
employers actively planning for the coming
changes in workforce demographic
patterns.18 The survey respondents were
primarily larger U.S. companies, about
evenly divided between the manufacturing
and service sectors. Specifically, the
Conference Board study found that:
• Roughly two-thirds (66%) of the
companies surveyed had not developed
an age profile of their workforces;
• Almost two-thirds (63%) had not assem-
bled inventories of their available skills;
• Almost half (49%) had not assessed their
staff training and development needs.

29
The Business Case for Workers Age 50+ | I. Business Implications of Changing Workforce Demographics
These findings illustrate that many—if not
most—U.S. companies have yet to wake up
to the coming realities of demographic
changes in the labor market broadly and in
their employee populations specifically.
Similarly, a 2003 survey of more than 400
human resource professionals conducted by
the Society for Human Resource Management
(SHRM) found that only about one-third of
U.S. companies were pursuing or expected
to pursue strategies to retain workers
interested in working past traditional
retirement age.19 The strategies SHRM
looked at include targeted training, phased
retirement programs, job transfers and
alternative career tracks, among others.
In other words, despite the prospect of
major demographic shifts, many companies
have not seriously delved into this issue—
either to fully understand the implications
for their businesses or to begin identifying
appropriate solutions for the near and
longer terms.
Responding to workforce change calls for a
well thought-out business case approach—to
gauge the magnitude of the changes, under-
stand the implications for strategic focus, cost
and operations, and begin identifying
strategies to address critical talent needs over
the coming years. Companies typically use a
business case framework to evaluate specific
investments and opportunities; this discipline
is particularly appropriate for coming to terms
with decisions about talent needs. To date,
however, few companies have used that kind
of analysis for any staffing decisions and
human resource investments, especially those
focusing on the 50+ segment of the workforce.
This report is designed to guide employers
in identifying future workforce needs, to help
them understand how 50+ workers can help
meet those needs, and to provide a starting
point for thinking about the value and costs
of 50+ workers. This document defines the key
elements involved in building a business case
Responding to workforce change calls for a well thought-out business case approach—to gauge the magnitude of the changes,
understand the implications for strategic focus, cost and operations,and begin identifying strategies to address critical talent needs
over the coming years.

30
Industry Focus
While virtually all sectors of the economy stand
to be affected by the coming wave of baby
boomers approaching the traditional retirement
zone (ages 55 to 65), different industries face
somewhat different challenges as today’s labor
force demographics evolve. To highlight some of
the differences between industries and to aid in
quantifying the business case for workers 50+
with respect to specific jobs, we will focusthroughout this report on four majorindustries: energy, financial services,health care and retail. These industries
were chosen for a number of reasons, including
their size and importance to the economy, number
of current and anticipated jobs and the current
demographic profile of the workforce, including
the percentage of workers who will be retirement
eligible within the next few years.
Energy
0% 10 20 30 40
5.917.1
16.3
38.6
Financial Services
Health Care
Retail
Large Employers Overall
14.1
11.1
11.6
8.56.1
18.9
29.1
23.832.0
14.49.8
8.4
17.124.1
28.311.4
9.010.0
10.67.3
25.032.6
13.8
10.7
28.9
5.4
n Under 30
n 30–39
Ages: n 40–49
n 50–54
n 55–59
n 60+
Exhibit I-4Varying Workforce Age Profilesby Industry in 2003
The Business Case for Workers Age 50+ | I. Business Implications of Changing Workforce Demographics
Source: Towers Perrin 2003 workforce data for 335 large U.S.employers (i.e., Fortune 1000 companies and equivalents), including26 companies in the energy industry, 42 companies in financialservices, 38 companies in health care and 16 companies in the retailindustry. ©2005 Towers Perrin.

31
The Business Case for Workers Age 50+ | I. Business Implications of Changing Workforce Demographics
and offers a disciplined approach for analyzing
possible workforce investments in the context
of specific jobs in major U.S. industries.
The analysis starts by examining the value
side of the equation, focusing on attitudes
and characteristics that make 50+ workers a
productive (and therefore attractive) segment
of the workforce. Next, the report examines
the drivers of labor costs, looking at how
(and whether) these drivers vary by age,
tenure or other factors, and examining
some of the myths about workers 50+.
The report also reviews the key drivers
of attraction, retention, and engagement
among 50+ workers to provide additional
insights into the kinds of policy changes
and workplace investments companies may
need to make to realize optimal value from
the 50+ workforce.
This report should help companies formulate
their thinking about the very real workforce
changes ahead and provide new tools and
frameworks to foster more rigorous workforce
planning and decision-making processes.
Among these industries, energy and health care tend to have the largest percentages of
employees at or near the age of traditional retirement eligibility today. (See Exhibit I-4.)
Financial services and retail have somewhat younger workforce profiles.
However, the overall demographic profile for a given industry (or company) may not fully
reflect the workforce issues with regard to specific jobs or skills. For example, the number
of sales positions in the U.S. economy is expected to grow by one quarter over the
coming decade, according to Bureau of Labor Statistics data—while almost one-third
of today’s sales professionals in all industries nationwide are age 55 or older. Tighter
competition for experienced sales talent could have a notable impact on an industry like
financial services, which counts on its sales force to cross-sell a growing range of complex
financial products to generate a significant portion of its future growth.
Ultimately, the business case for investments to help retain andattract workers 50+ will vary from company to company andeven position to position, depending on such key factors as the current and
available workforce demographic profile, projected business growth, rewards considerations
(e.g., current and future programs employers sponsor and the impact on associated
labor costs) and geographic differences.

32
50+ workers bring experience,dedication, focus, stability, andenhanced knowledge to theirwork, in many cases to a greaterdegree than younger workers.

33
The Business Case for Workers Age 50+ | II. The Value Side of the Equation
II.II. The Value Side of the Equation:
Advantages of Experience
Understanding the business case for workers
50+ requires a careful examination of both
the value and cost sides of the equation.
Employers look for a return on their
investment in people, as they do from any
major allocation of enterprise resources. In
some instances, the return is easy to track, as
in the case of front-line sales people who
contribute directly to revenue generation.
In other cases, the return on investments in
employees is more difficult to calculate.
Creating a link from employee behavior to
organizational performance to business
results is, at heart, what every company tries
to do, with greater or lesser success, through
its human resource strategies and related
workplace practices and programs. As with
any investment, the organization must
understand both the value derived and the
cost incurred. Our analysis begins by
focusing on the value side of the equation
for the 50+ employee.
Mounting evidence—both anecdotal and
statistical—demonstrates that 50+ workers
bring experience, dedication, focus,
stability and enhanced knowledge to their
work, in many cases to a greater degree
than younger workers. One widely held
myth is that the performance of 50+
workers begins to suffer over time. In fact,
the overwhelming economic trend is toward
work that requires extensive knowledge and
exceptional service delivery. The era in
which productivity demands strong backs
has largely passed, replaced by a world in
which (for most organizations) employee
commitment and the knowledge that comes
with experience are far more important
drivers of workplace contribution.
The Creativity FactorTo people who study the relationship
between age and creativity, the list of historic
figures who achieved creative prominence in
their late working years is familiar:
• Giuseppe Verdi composed his Ave Maria
at age 85;
• Martha Graham performed until she
was 75 and choreographed for another
20 years;
• Benjamin Franklin invented bifocal
glasses at 78 (to help correct his own
poor vision);

34
The Business Case for Workers Age 50+ | II. The Value Side of the Equation
• Frank Lloyd Wright was working on his
design for the Guggenheim Museum
when he died at 91.
Are the accomplishments of these prominent
figures truly indicative of the creativity that can
continue—or even emerge—later in life?
Research shows that they are.
Economist David Galenson of the University
of Chicago identified two types of creativity.
One he calls conceptual innovation—a new
idea that breaks the mold established by
current practice. The other is experimental
innovation (new ideas that build and extend
current ways of doing things). Although the first
form of creativity can occur at any time, it is
most common early in an individual’s working
life.20 Creative accomplishments in lyric
poetry, pure mathematics and theoretical
physics, for example, have often been
accomplished by people in their 20s and 30s.
In contrast, endeavors that require the
individual to build on current practice in
innovative ways tend to produce fruit later
in life, in a person’s 40s, 50s and beyond.
Social scientists put accomplishments in
philosophy, medicine and general
scholarship into this category.21
The human brain continues to develop
even as people age. “Over time, and especially
with challenge, brain cells sprout new
projections called dendrites,” says Dr. Gene
Cohen, director of the Center on Aging, Health
and Humanities at George Washington
University. Dendrites flourish in the brain’s
critical information-processing areas
throughout our 50s, 60s and 70s. Particularly
in the case of what Dean Keith Simonton
(a psychology professor at the University of
California, Davis) calls “practical creativity”—
the solving of everyday problems—the
capacity for developing creative solutions
peaks late in life. In other words, late-life
creativity focuses less on pure novelty and
more on synthesis, reflection, wisdom and
restructuring of existing patterns.22
Organizations clearly benefit from pure
novelty. But just as clearly, they need
people who can reconfigure existing
patterns, transfer experience from one
realm to another and use current practice
as a springboard to new ways of doing
things. This latter form of creativity is the
province of workers who can draw on
decades of experience.
The Engagement Factor“Employee engagement” is a phrase that has
moved rapidly into the corporate lexicon as
more and more companies have come to
understand its significance. Towers Perrin
has used the term since 2000 when it
launched the first of a series of studies on
the nature of engagement, what it takes to
build it and how it links to company
performance. In those studies, engagement
was defined as employees’ willingness and
ability to contribute to company success.
Put another way, engagement is the extent to
which employees put discretionary effort into
their work, in the form of extra time,
dedication and energy.
Within the next few years, there will likely not be enough new workforce entrants to replace the people who are (and will be) able,
by virtue of their age, to exit the workforce via retirement.

35
The Business Case for Workers Age 50+ | II. The Value Side of the Equation
To quantify engagement, Towers Perrin
surveys employees using a set of questions
designed to measure emotional aspects of
work, including employees’ sense of
personal pride and accomplishment and
their willingness to “go the distance” on the
job (dedication and energy). Other questions
focus on understanding how one’s work team
or unit contributes to company performance,
how one’s role relates to company goals—
linking individual work to the bigger picture—
and how “inspiring” the company itself is in
its dealings with employees (through its culture,
leadership, communication and the like).
Engagement is important to the analysis of
the 50+ workforce because it helps define the
value side of the equation. As Towers Perrin’s
research has consistently confirmed,
companies with more highly engaged
employees tend to outperform those with less
highly engaged employees relative to defined
business and industry metrics. In addition,
higher levels of engagement also correlate
with lower turnover. Thus, when evaluating
workforce staffing and value for cost,
engagement is a key element in the analysis.
Linking Engagement to ResultsA key part of Towers Perrin’s 2003
engagement study aimed to assess the
hypothesis that engagement matters. The
analysis incorporated financial data on the
major U.S. companies for which many of the
35,000 U.S. employees surveyed work. The
survey used a random sample of employees,
although respondents were screened to
ensure that the vast majority worked for
large organizations (i.e., Fortune 1000
companies and equivalents).
The 2003 study first examined how
engagement affects the way a company’s
employees treat its customers. Not
surprisingly, Towers Perrin’s survey data
showed a strong link here. Put simply,
employees with higher engagement are
more likely than their less-engaged
counterparts to put customers’ interests at
the heart of what they do and how they
think about their jobs. In addition, more
engaged employees are more likely to
manage company resources carefully and
less likely to be thinking about leaving the
company, as noted above.
The 2003 study then dug more deeply,
using statistical techniques to correlate the
relationship between employees’ level of
engagement and two reported financial
measures for their companies: annual
revenue growth and cost of goods sold
(COGS). In both cases, performance was
evaluated in the context of the difference
between a company’s results and the average
results for its industry.

36
The Business Case for Workers Age 50+ | II. The Value Side of the Equation
Exhibits II-1 and II-2 show the findings. In
the case of revenue growth, the study found
a strong relationship between employee
engagement and the company’s one-year
revenue growth. Employees who express
more engagement are more likely to work
hard to produce high-quality products and
services and meet customers’ needs.
Consequently, the companies that employ
them are more likely to exceed the average
one-year revenue growth for their industries.
Exhibit II-2 illustrates the inverse relationship
between employee engagement and the cost of
goods sold. What the study found, in short, was
that highly engaged employees tend to work for
companies with below-average COGS for the
industry, while the least engaged employees
tend to work for companies with higher-than-
average COGS. The likely explanation:
engaged employees husband their firms’
resources, acting conscientiously with
company assets and avoiding costly waste.
These analyses paint a clear picture:
companies with higher employee engage-
ment outperform those with lower employee
engagement on a number of key financial
benchmarks. No doubt there’s a virtuous
circle at work here—superior performance
enables companies to attract more highly
engaged people, and an engaged workforce
delivers better performance. What is
important is that employee engagement and
superior business performance are strongly
intertwined. Thus, from an employer’s
perspective, finding and keeping highly
engaged employees (and adopting programs
to sustain that engagement) have a clear and
measurable value that can yield benefits far
beyond the costs involved.
For this analysis, then, the next question
becomes: what is the relationship between
age and employee engagement?
LowEngagement Index Score
Rev
enu
e G
row
th*
High
1.0
-1.0
-2.0
0.0
Exhibit II-1Engagement and Revenue Growth23
Engagement Index ScoreLow
Co
st o
f G
oo
ds
Sold
(C
OG
S)*
High
5.0
4.0
0.0
-1.0
-3.0
-2.0
2.0
3.0
1.0
Exhibit II-2Engagement and Cost of Goods Sold24
*Incremental percentage point difference between one-year company revenuegrowth and market sector average.
Source: 2003 Towers Perrin Talent Report, based on a random survey of morethan 35,000 employees working for large U.S. companies (i.e., Fortune 1000companies and equivalents). ©2005 Towers Perrin.
*Incremental percentage point difference between company COGS asa percent of revenue and market sector average.
Source: 2003 Towers Perrin Talent Report, based on a random surveyof more than 35,000 employees working for large U.S. companies (i.e., Fortune 1000 companies and equivalents). ©2005 Towers Perrin.
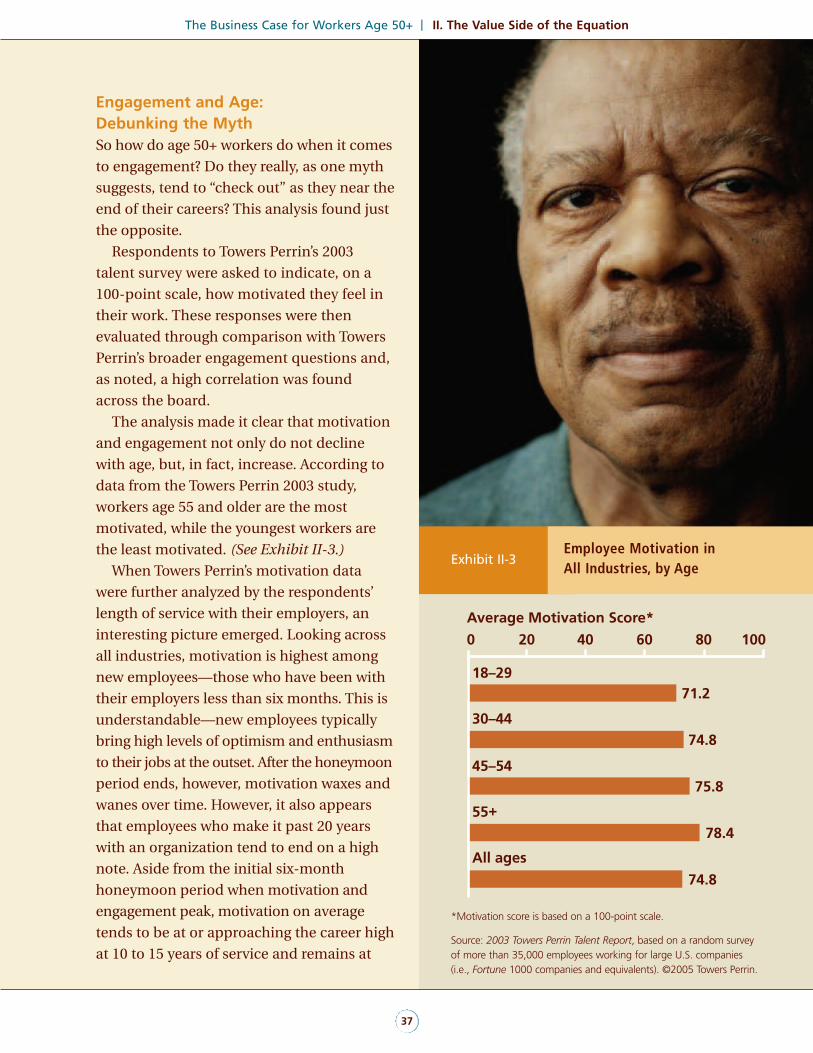
37
The Business Case for Workers Age 50+ | II. The Value Side of the Equation
Engagement and Age: Debunking the MythSo how do age 50+ workers do when it comes
to engagement? Do they really, as one myth
suggests, tend to “check out” as they near the
end of their careers? This analysis found just
the opposite.
Respondents to Towers Perrin’s 2003
talent survey were asked to indicate, on a
100-point scale, how motivated they feel in
their work. These responses were then
evaluated through comparison with Towers
Perrin’s broader engagement questions and,
as noted, a high correlation was found
across the board.
The analysis made it clear that motivation
and engagement not only do not decline
with age, but, in fact, increase. According to
data from the Towers Perrin 2003 study,
workers age 55 and older are the most
motivated, while the youngest workers are
the least motivated. (See Exhibit II-3.)
When Towers Perrin’s motivation data
were further analyzed by the respondents’
length of service with their employers, an
interesting picture emerged. Looking across
all industries, motivation is highest among
new employees—those who have been with
their employers less than six months. This is
understandable—new employees typically
bring high levels of optimism and enthusiasm
to their jobs at the outset. After the honeymoon
period ends, however, motivation waxes and
wanes over time. However, it also appears
that employees who make it past 20 years
with an organization tend to end on a high
note. Aside from the initial six-month
honeymoon period when motivation and
engagement peak, motivation on average
tends to be at or approaching the career high
at 10 to 15 years of service and remains at
18–2971.2
74.8
74.8
75.8
78.4
Average Motivation Score*
30–44
45–54
55+
All ages
0 20 40 60 80 100
Exhibit II-3Employee Motivation in All Industries, by Age
*Motivation score is based on a 100-point scale.
Source: 2003 Towers Perrin Talent Report, based on a random surveyof more than 35,000 employees working for large U.S. companies (i.e., Fortune 1000 companies and equivalents). ©2005 Towers Perrin.

38
The Business Case for Workers Age 50+ | II. The Value Side of the Equation
that level through 20 or more years of
service. (See Exhibit II-4.)
The general correlation between motivation
and age holds true for each of our four
industry sectors except retail. (See Exhibit II-5.)
Among retail employees, motivation appears
to peak between ages 45 and 54, and then
declines. This pattern of declining motivation
at later ages may merit closer attention from
retail employers targeting the 50+ workforce
to help meet their staffing needs.
It is not possible to quantify the impact of
motivation and engagement in dollar terms
for specific jobs or age groups, given the
broad-based focus of Towers Perrin’s 2003
engagement research. Nonetheless, the
overall relationship between engagement
and business performance should hold
across the board. In other words, all other
things being equal, an employer may well
be able to improve motivation and
engagement levels—and, ultimately,
company financial performance—merely
by focusing on 50+ workers. This may mean
hiring new workers with substantial
professional experience, or working to retain
those who might otherwise retire. For this
reason, it’s an important factor for
companies to consider in evaluating
workforce strategies and investments—
especially for companies that are sharpening
their focus on customers, while reducing
their emphasis on costs.
The customer angle is, in fact, another
key factor here. As the general population
ages, more and more companies’ customer
populations are aging as well. Although the
characteristics of target customer segments
differ widely by industry and nature of the
Less than 6 months78.9
74.2
73.7
75.0
74.7
75.6
75.5
75.5
73.3
73.3
Average Motivation Score*
6 months to less than 1 year
1 year to less than 2 years
2 years to less than 3 years
3 years to less than 5 years
5 years to less than 7 years
7 years to less than 10 years
10 years to less than 15 years
15 years to less than 20 years
More than 20 years
0 20 40 60 80 100
Exhibit II-4Employee Motivation in AllIndustries, by Service Level
Within the next few years, therewill likely not be enough newworkforce entrants to replace thepeople who are (and will be) able,by virtue of their age, to exit theworkforce via retirement.
*Motivation score is based on a 100-point scale.
Source: 2003 Towers Perrin Talent Report, based on a random surveyof more than 35,000 employees working for large U.S. companies (i.e., Fortune 1000 companies and equivalents). ©2005 Towers Perrin.

39
The Business Case for Workers Age 50+ | II. The Value Side of the Equation
business, companies with older customer
populations might find advantages in
having a greater number of employees who
share the perspectives, needs and views of
their customers. Companies specifically
targeting the 50+ market are likely to have
an even stronger case for attracting and
retaining workers who reflect the age profile
of their customers.
Reducing Turnover RiskThe risk of employee turnover is another
consideration for employers thinking about
how to maximize the business value of their
workforce investments. Employees become
more proficient in their jobs over time and, in
general, create more economic value the
longer they are employed by a company
because they have a better understanding of
the organization’s processes, customers and
competitive environment. Given this increasing
value, high rates of employee turnover can be
destructive from a business standpoint,
reducing overall productivity and diverting
corporate resources to recruit, hire and train
the new employees.
Every employee, of course, represents an
implicit turnover risk. From the day of hire
through the last day of a career, any individual
may leave his or her employer at any time.
Data show that the highest probability of
turnover occurs in the first years of
employment, with the first year bringing the
greatest risk, and remains high until after
three years of service. According to Bureau of
Labor Statistics data on tenure patterns by
age group, the average tenure among all U.S.
workers is 3.7 years. However, median job
tenure for workers in the 55 to 64 age range
is about 3.3 times that of workers 25 to 34
years old.25 In large companies, average
employee tenure is much longer than the
average for all U.S. workers. According to
data from the Saratoga Institute, median
Energy 71.9 74.0
74.7
75.3 77.4
Financial Services 72.5 74.9
75.3
77.6 77.8
Health Care 70.2
77.4
77.1
78.2 80.8
Retail 69.5
75.9
74.4
76.7 73.3
Average Motivation Score*
0 20 40 60 80 100
Ages:
n18–29n 30–44
n 45–54
n 55+
n All ages
Exhibit II-5Employee Motivation,by Industry and Age
*Motivation score is based on a 100-point scale
Source: 2003 Towers Perrin Talent Report, based on a random surveyof more than 35,000 employees working for large U.S. companies (i.e., Fortune 1000 companies and equivalents), includingapproximately 1,400 respondents in the energy industry, 3,500respondents in financial services, 4,600 respondents in health care,and 3,200 respondents in the retail industry. ©2005 Towers Perrin.

40
The Business Case for Workers Age 50+ | II. The Value Side of the Equation
tenure in companies with more than 1,000
employees ranges from eight to 10 years. For
large companies with defined benefit plans,
average service is 12 years.
Exhibit II-6 shows annual turnover rates by
age for the four industries examined and for
all industries included in the Towers Perrin
database of more than 3 million employees
working for large U.S. employers that sponsor
defined benefit pension plans. These data
confirm that turnover decreases with age
until employees reach their mid- to late-50s
and then increases sharply because of
retirements. This pattern holds true in each
of the four industries studied, although there
are significant industry differences in
turnover levels. Turnover tends to be highest
in retail and financial services, and below
average in the health care and energy sectors.
Employers concerned about the risk of
turnover should keep in mind the correlation
between turnover and age. Mid-career
employees, having navigated job changes
and career redirections, can be more likely to
40%
35%
15%
10%
0%25 30 35 40 45 50 55 60 65 70 75+
5%
25%
An
nu
al T
urn
ove
r
Age
Turnover Patterns, by Age and Industry
30%
20%
n Energy n Financial Services n Health Care n Retail n Overall
Exhibit II-6 Turnover Patterns, by Age and Industry*
*Percentage of employees by age who terminated employment during the year.
Source: Towers Perrin 2002 workforce data for 335 large U.S. employers with defined pension benefit plans (i.e., Fortune 1000 companies andequivalents ), encompassing approximately 130,000 employees in the energy industry, 470,000 employees in financial services, 280,000 employees inhealth care and 140,000 employees in the retail industry. ©2005 Towers Perrin.
Mid-career employees, having navigated job changes andcareer redirections, can be more likely to stay with a job than their
younger colleagues, who are often still experimenting with job,company and career choices.

41
The Business Case for Workers Age 50+ | II. The Value Side of the Equation
stay with a job than their younger colleagues,
who are often still experimenting with job,
company and career choices.
The downward turnover trend that begins in
the 20s and continues to the 50s may link as
well to the slightly higher motivation scores
for 50+ workers in Towers Perrin’s 2003 engage-
ment research. Assuming that an employee
does not want to retire, the combination of
age and engagement should produce a double
benefit—a cadre of workers both engaged in
their work and committed to their organizations.
Towers Perrin’s research supports this
explanation, which shows a strong negative
correlation between engagement and
turnover risk. Among the employees
surveyed as part of Towers Perrin’s 2003
talent study, fully two thirds of those highly
engaged had no plans to leave their employer,
compared with just 12% of disengaged
employees and a little over one third of
moderately engaged employees. (See
Exhibit II-7.)
For employers, the implications of the
risk and cost elements of turnover are fairly
straightforward: hold onto highly motivated
and high-performing 50+ workers. These
workers represent a relatively reduced turnover
risk until they approach retirement. Moreover,
many 50+ workers expect to work in retirement,
as will be discussed in Section IV of this report.
Later in the report, examples of practices for
retaining 50+ workers in today’s labor market
will be examined.
While the cost items may be clear, the value
side of the equation for individual employees
is far more complex. In building the business
case, companies should try to quantify the
financial value of engagement, experience,
stability, and enhanced knowledge.
Highly Engaged
Percents may not add to 100 due to rounding.
ModeratelyEngaged
Disengaged
n I have no plans to leave.
n I am not looking for a new job, but would consider the right opportunity.
n I am actively looking for another job.
n I have made plans to leave my current job.
n I plan to retire in the next few years.
6%
7%3%
8%
66%
47%
51%
25%
36%
12%
23%
8%6%
2%1%
Exhibit II-7
Engagement and Turnover:Likelihood of Leaving Current Employer by Engagement Level
Source: 2003 Towers Perrin Talent Report, based on a randomsurvey of more than 35,000 employees working for large U.S.companies (i.e., Fortune 1000 companies and equivalents); of theserespondents, approximately 6,000 were highly engaged, 22,000were moderately engaged, and 7,000 were disengaged. ©2005Towers Perrin.

Productivity and Performance
As defined by the U.S. Bureau of Labor Statistics, productivity is the ratio
of the output of goods and services to the hours of work required to
produce that output. One of the challenges in assessing productivity by
age is the lack of data that captures productivity by both job and age.
While the government and individual companies track output broadly
(e.g., gross domestic product, revenue per employee, sales per
employee), allocating that output to specific employees or groups can be
difficult at best. Even in organizations that track productivity by specific
business segments, work units or locations, the data are generally not
broken down by job family or any demographic segment of the
population, except in the sales function.
There is a rich academic archive on the relationship between productivity
and aging. Some studies—primarily those focusing on manual dexterity
and work-and-motion observations—concluded that worker productivity
begins to decline between the ages of 30 and 40. Others found no
significant relationship between productivity and age, as measured by
work output and supervisory ratings.26 Researcher Neil Charness, for
example, studied whether acquired knowledge can compensate for the
age-related effects of declines in mental efficiency. Using the example of
chess players, he notes that experienced players are able to remember
more detail about familiar, structured chess positions than are players
with less experience and skill.
Extending his conclusions to the kinds of information processing tasks
employees commonly face in a knowledge-intensive workplace, Charness
says that “Knowledge can compensate, at least partially, for age-related
declines in cognitive efficiency. It does so more successfully when the task
is one for which fact retrieval can substitute for computation of answers.
A knowledgeable older adult will outperform a computationally swift but
less knowledgeable young adult.”27
42
The Business Case for Workers Age 50+ | II. The Value Side of the Equation

43
The Business Case for Workers Age 50+ | II. The Value Side of the Equation
Indeed, researchers studying theproductivity implications of aginghave discovered that, in a wide rangeof fields, experience in a domain canoffset the cognitive declines thatmay occur with age. In one study of
attitudes toward older workers, employers provided
a likely rationale for this phenomenon by reporting
that workers age 45 to 59 show higher levels of a
variety of experience-related characteristics than
workers in any other age bracket. The characteristics
more strongly associated with the 45 to 59 age
group included communication skills, business
knowledge, credibility and judgment.28
Older workers also are often viewed as ill-suited to
fast-paced jobs that require speed of execution.
Here, too, there are two sides to the story.
Communication skills and decision-making skills, which continue tosharpen with age, can more thanmake up for any declines in manualdexterity that may occur with age. For instance, a study of hotel reservation clerks
concluded that older clerks more than made up for
handling calls more slowly by achieving a higher
success rate (i.e., more bookings).29 Furthermore,
any physical limitations that workers 50+ may
face represent less of an impediment today
than in the past due to the growth of the
knowledge economy.

44
Researchers studying theproductivity implications of aging have discoveredthat, in a wide range offields, experience in adomain can offset thecognitive declines thatmay occur with age.

45
The Business Case for Workers Age 50+ | III. The Cost Side of the Equation
III.III. The Cost Side of the Equation:
Understanding the Key Drivers
The prior section of this report documented
the potentially significant economic
contribution attributable to the 50+ segment
of the workforce. In order to analyze the
business case, organizations also need to
understand the total reward costs associated
with attracting and retaining 50+ workers.
Some employers may discount the value of
engagement and experience, focusing
instead on the belief that 50+ workers cost
more than younger employees. Towers Perrin
evaluated the key drivers of labor cost in
large U.S. companies to test this belief.
The analysis indicates that, while there are
cost differentials across various groups of
workers, the labor cost equation is not as
clear-cut as many employers may assume.
Following is an analysis of the key drivers of
labor cost in large organizations, with
particular focus on key positions in the
four industries identified previously.
The Range of Cost DriversTo develop meaningful analyses of the
business case for 50+ workers in specific
industries and positions, data on average
compensation, benefits and other labor
costs for large U.S. employers were compiled
from Towers Perrin’s proprietary databases
and other sources. (Note that this analysis
did not include the cost of company-provided
equipment, facilities, utilities and other
expenses typically included in “overhead.”
Although these costs clearly make a difference
in evaluating how employees can be most
cost-effectively deployed across multiple
business locations, these costs are generally
fixed and do not vary by the age of the
employee.) Costs examined included both
annual and one-time costs:
Annual (Recurring) Reward CostsThe analysis focused primarily on four
components that make up approximately
97% of total compensation cost in large U.S.
companies (see Exhibit III-1 on page 46):
eCash compensation, including bonuses
where typical for the position (but not
including pay-related costs such as FICA,
unemployment insurance or workers
compensation that generally do not vary
with age or service);

46
The Business Case for Workers Age 50+ | III. The Cost Side of the Equation
rEmployer-paid health benefit costs
(primarily medical coverage, which
represents the vast bulk of these costs);
tEmployer-paid retirement benefit costs
(defined benefit pension and company
contributions to defined contribution
savings plans);
uEmployer-paid work/life benefit costs
(specifically, paid time off).
The cost of certain other benefits, such as
short- and long-term disability and company-
provided life insurance, tend to vary with age.
However, because these costs represent such
a small part of most companies’ total compen-
sation spending, they were excluded from
Towers Perrin’s analysis.
One-Time CostsEmployers need to keep in mind the significant
costs and risks associated with replacing
workers. For example, new employees have
higher rates of turnover than longer-service
employees and their future performance is
difficult to assess before they join an organi-
zation. On average, turnover for employees
with less than one year of service represents
about a quarter of all voluntary turnover,
according to 2003 Saratoga Institute data
based on an analysis of turnover patterns at
166 companies.30 The data show that more
than two-thirds (68%) of all voluntary
turnover occurs among employees with five
or fewer years of service.
Therefore, to ensure that employers have a
complete picture of the cost of 50+ workers,
the business case analysis also looked at key
one-time, turnover-related costs that are
typically incurred when employees leave or
join an organization:
• The cost of departure, including exit cost
(time associated with exit interviewing
and expense of processing terminations),
departing employee inefficiency (reduced
productivity of departing employees in
their final months of service with an
organization), out-of-pocket costs for
finding replacements (search fees, for
instance) and vacancy cost (lost produc-
tivity during the average time required to
fill the position);
• New employee costs, including the cost
of hiring (i.e., recruiting, advertising,
travel for job interviews and relocation
costs), orientation cost (initial training
and onboarding) and incoming employee
inefficiency (i.e., reduced productivity
until a new employee gains proficiency
in the job).
Here’s a closer look at the costs of rewards
and the drivers of cost variation.
n Cash Compensation
n Health Care
n Paid Time Off
n Retirement
n Other
74%
10%8% 5%
3%
Exhibit III-1Breakdown of Typical RewardCosts in Large U.S. Companies
Source: Towers Perrin 2005 Benval data for 225 Fortune 500companies in a range of industries. ©2005 Towers Perrin.
Employers need to keep in mindthe significant costs and risksassociated with replacing workers.

47
The Business Case for Workers Age 50+ | III. The Cost Side of the Equation
Cash CompensationIn the compensation arena, most major
companies try to calibrate pay with
reference to the 50th percentile for the
market. They may target pay ranges above or
below the market median depending on
their specific pay philosophies and
competitive positions in attracting and
retaining needed talent. For collectively
bargained groups, of course, annual wage
increases are established by contract.
Although average pay tends to increase
initially with both service and age as
suggested by Exhibit III-2, this increase in
pay can be attributed to gains in employee
competence or movement up the career
ladder in an organization. In short, pay
differences are driven by service, position
and performance, rather than age per se.
A new employee in any given job would
typically be paid according to the company’s
market rate positioning regardless of age.
Thus, a 55-year-old worker who has been
with a company for 25 years would be expected
to earn more than either a 30-year-old worker
or a 55-year-old worker who has been in a
comparable job with the same company for
only five years. The veteran worker would
also assume greater responsibilities or achieve
higher levels of performance over time,
justifying the higher compensation. However,
no significant difference in pay would be
expected for, say, a 55-year-old and 45-year-
old performing the same job at an equal level
of performance.
n Energy n Financial Services n Health Care n Retail n Large Employers Overall
200
20
40
60
80
$100
30 40Age
Average Pay by Age
Tho
usa
nd
s
50 60 70 0 10 20 30 400
20
40
60
80
$100
Years of Service
Average Pay by Years of Service
Tho
usa
nd
s
Source: Towers Perrin 2003 workforce data for 335 large U.S. employers (i.e. Fortune 1000 companies and equivalents), including 26 companies in the energyindustry, 42 companies in financial services, 38 companies in health care and 16 in the retail industry. ©2005 Towers Perrin.
Exhibit III-2 Average Compensation Levels by Age and Service for Selected Industries

48
The Business Case for Workers Age 50+ | III. The Cost Side of the Equation
Interestingly, an analysis of compensation
trends in Towers Perrin’s workforce data
found some notable differences in age- and
service-based growth patterns among
industries—along with a flattening and even
reversal of the overall growth trend for the
oldest age groups. As Exhibit III-2 shows,
average pay tends to peak for many workers
in their mid-to-late 50s and then declines
gradually thereafter, presumably the result of
reduced work schedules.
Aggregate Benefit CostsCompany-provided benefits make up a
significant and growing share of total
compensation costs in the nation’s largest
organizations. Although benefit costs have
increased sharply in recent years, coverage
patterns in the aggregate (e.g., percentage
and categories of workers covered) have
remained relatively constant for most types
of benefits. Today, major companies deliver
26% of the average employee’s total compen-
sation and benefit cost via the benefit
package—about $22,400 per employee on
average. (See Exhibit III-3.) This includes the
employer’s cost for medical benefits (active
and retiree coverage), dental, vision, life
insurance, short- and long-term disability,
pension, 401(k) and paid time off. The
level and mix of these programs will affect
the economics of retaining and attracting
50+ workers.
The data for our four industry sectors show
significant variation in aggregate benefit costs
and in the cost of the various components
from industry to industry. In the industries
examined, the total employer-provided
benefit cost for the average company ranges
from a low of less than $18,000 annually in
retail to a high of almost $24,000 in the energy
sector. (See Exhibit III-4.)
n Health Care
n Paid Time Off
n Retirement
n Other
$2,900
$6,600
$4,600
$8,300
37%
29%
21%
13%
Exhibit III-3 Major Components of Employee Benefit Costs
Source: Towers Perrin Employee Benefit Information Center 2005 dataon more than 700 large U.S. employers (i.e., Fortune 1000 companiesand equivalents). ©2005 Towers Perrin.

49
The Business Case for Workers Age 50+ | III. The Cost Side of the Equation
Exhibit III-4 Average Employer-Provided Benefit Values, by Industry
Health Care CostsHealth care costs are a critical component of
both the employer cost and the employee
value associated with the rewards package.
Rising health care costs therefore represent a
concern for both employers and workers.
Research by AARP shows that more than eight
in 10 workers ages 45 to 74 identify health
benefits as an essential part of their ideal
job,31 and research by Towers Perrin shows
that a competitive health benefits package is a
top consideration for workers when selecting
an employer.
As employees age, they are likely to use
more medical services. As Exhibit III-5
illustrates, company-paid claims for
employees age 50 to 64 and their covered
dependents are 1.4 to 2.2 times as much as
claims for workers in their 30s and 40s,
measured by average annual medical claim
costs compiled by Medstat.32 Note that these
represent average costs and that individual
workers will have costs that are lower or
higher than the average.
The Medstat data include the company-
paid cost for hospital, outpatient and drug
charges after plan copays, deductibles and
out-of-pocket costs for both employees and
dependents.
A key consideration with regard to health
care costs, however, is that actual costs vary
widely among individuals—even people
within the same age group—because of
factors such as health risks and health care
utilization. In fact, studies by the University of
Michigan Health Management Research
Center found that age alone may be less
important than the incidence of specific
Energy
$0 5,000 10,000 15,000 20,000 25,000
Financial Services
Health Care
Retail
Large Employers Overall
$6,981 $2,991 $5,900 $1,873
$8,300 $4,600 $6,600 $2,900
$3,359$8,419 $7,016 $2,277
$7,855 $5,236 $6,828 $2,711
$8,813 $5,131 $6,681 $3,242
n Health Care n Retirement n Paid Time Off n Other
Source: Towers Perrin Employee Benefit Information Center 2005 data on more than 700 large U.S. employers (i.e., Fortune 1000 companies and equivalents),including 75 companies in the energy industry, 45 companies in financial services, 25 companies in health care and 27 companies in the retail industry. ©2005 Towers Perrin.

50
The Business Case for Workers Age 50+ | III. The Cost Side of the Equation
health risks in driving up health care costs.
Common risk factors examined in one study
included high blood pressure, obesity, high
cholesterol, smoking and alcohol use, among
others. The study found that annual medical
claim costs for individuals with five or more
risk factors were typically at least double the
costs incurred by healthier individuals with
two or fewer risk factors at virtually all age
levels examined. (See Exhibit III-6.)
Many employers, including many of the
companies recognized as AARP Best Employers
for Workers Over 50, have implemented
wellness programs to mitigate health risk
factors among their employees—such as
stress, smoking, obesity and high blood
pressure. Such efforts have the potential to
produce significant health care cost savings
for both the employer and employee.33
Other recent research also suggests that
older workers may be more effective partners
in employer efforts to promote better consumer
behaviors in health care purchasing. Their
efforts to manage their own health and
related health care costs may in turn help
mitigate age-related cost differences in some
organizations. For example, Towers Perrin’s
2004 health care consumerism survey of more
than 1,000 employees in large companies
nationwide34 found that workers 50+ are:
• More likely than younger workers to view
themselves as effective health care
consumers (81% vs. 73%);
25–29$2,148
$3,206
$3,759
$4,130
$4,789
$5,685
$6,617
$7,622
30–34
35–39
40–44
45–49
50–54
55–59
60–64
$0 2,000 4,000 6,000 8,000
Exhibit III-5 Annual Aggregate Medical Claim Costs for Employees and Dependents, by Age of Employee
Source: Towers Perrin analysis of 2003 Medstat claims data covering over 7.5 million medical plan participants (employees and dependents); costs shown include total company-paid medical claim costs per employee for the employee plus all covered dependents. ©2005 Towers Perrin.

51
The Business Case for Workers Age 50+ | III. The Cost Side of the Equation
• More likely than younger workers to say
they get regular health screenings (76% vs.
65%) and use generic drugs when available
(82% vs. 76%);
• More likely than younger workers to agree
that they should pay a larger share of the
cost when they use more expensive health
care services (50% vs. 43%).
The bottom line is that, while health
benefit costs on average tend to be higher for
50+ employees, a variety of factors affect
actual cost levels for any given employee or
group of employees. Health plan initiatives
that emphasize appropriate investments in
wellness, preventive care and effective care
and management of disease will help
employers better manage these costs over
time. In addition, cost-management
approaches, such as making employees of all
ages more conscious of costs when seeking
care, may also help reduce the growth in
health benefit costs.
Under Age 35 $1,122
$1,550 $2,098
$1,523
$4,530 $2,667
$2,081 $3,364
$5,813
$2,941 $4,718
$7,123
35–44
45–54
55–64
$0 2,000 4,000 6,000 8,000
n 0–2 Risks* n 3–4 Risks* n 5 or More Risks*
Exhibit III-6 Annual Medical Costs, by Health Risk Levels and Age
*Risks examined in the study included high blood pressure, obesity, high cholesterol, smoking, alcohol use and others.
Source: Dee W. Edington, University of Michigan Health Management Research Center, American Journal of Health Promotion, 2001.
Other recent research also suggeststhat older workers may be moreeffective partners in employerefforts to promote better consumerbehaviors in health care purchasing.
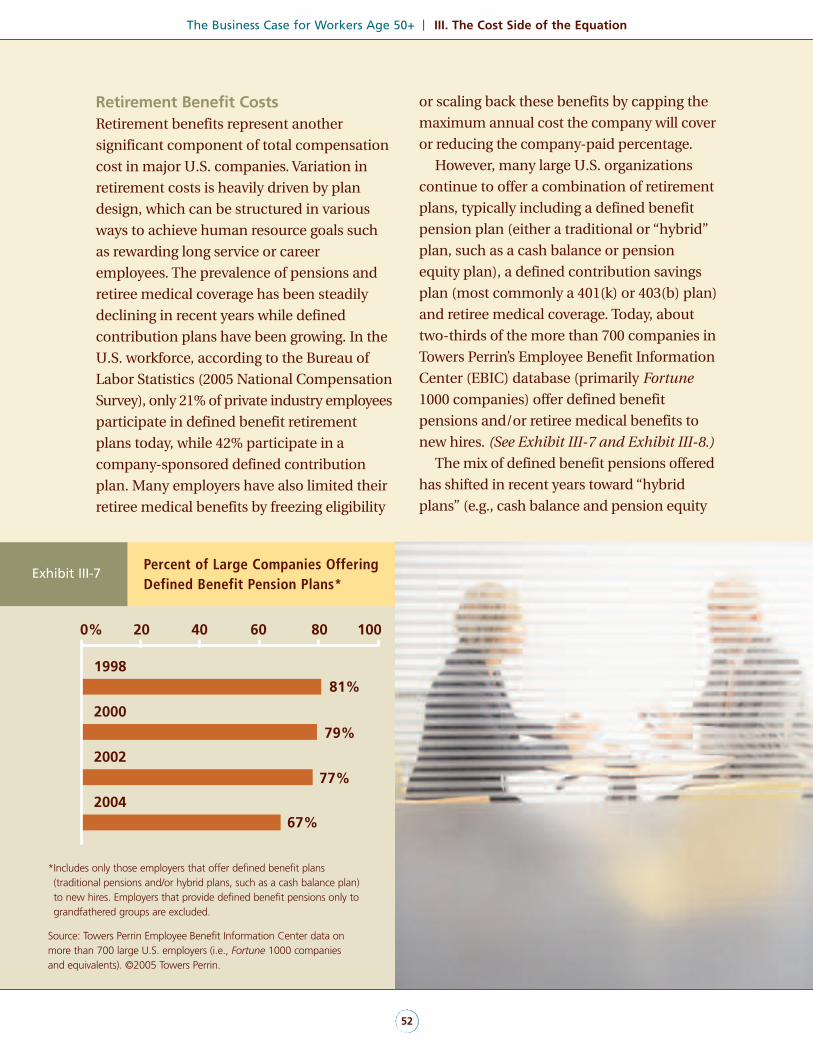
52
The Business Case for Workers Age 50+ | III. The Cost Side of the Equation
Retirement Benefit CostsRetirement benefits represent another
significant component of total compensation
cost in major U.S. companies. Variation in
retirement costs is heavily driven by plan
design, which can be structured in various
ways to achieve human resource goals such
as rewarding long service or career
employees. The prevalence of pensions and
retiree medical coverage has been steadily
declining in recent years while defined
contribution plans have been growing. In the
U.S. workforce, according to the Bureau of
Labor Statistics (2005 National Compensation
Survey), only 21% of private industry employees
participate in defined benefit retirement
plans today, while 42% participate in a
company-sponsored defined contribution
plan. Many employers have also limited their
retiree medical benefits by freezing eligibility
or scaling back these benefits by capping the
maximum annual cost the company will cover
or reducing the company-paid percentage.
However, many large U.S. organizations
continue to offer a combination of retirement
plans, typically including a defined benefit
pension plan (either a traditional or “hybrid”
plan, such as a cash balance or pension
equity plan), a defined contribution savings
plan (most commonly a 401(k) or 403(b) plan)
and retiree medical coverage. Today, about
two-thirds of the more than 700 companies in
Towers Perrin’s Employee Benefit Information
Center (EBIC) database (primarily Fortune
1000 companies) offer defined benefit
pensions and/or retiree medical benefits to
new hires. (See Exhibit III-7 and Exhibit III-8.)
The mix of defined benefit pensions offered
has shifted in recent years toward “hybrid
plans” (e.g., cash balance and pension equity
199881%
79%
77%
67%
2000
2002
2004
0% 20 40 60 80 100
Exhibit III-7Percent of Large Companies OfferingDefined Benefit Pension Plans*
*Includes only those employers that offer defined benefit plans(traditional pensions and/or hybrid plans, such as a cash balance plan)to new hires. Employers that provide defined benefit pensions only tograndfathered groups are excluded.
Source: Towers Perrin Employee Benefit Information Center data onmore than 700 large U.S. employers (i.e., Fortune 1000 companies and equivalents). ©2005 Towers Perrin.

53
The Business Case for Workers Age 50+ | III. The Cost Side of the Equation
plans). From the employee perspective, these
plans resemble defined contribution plans.
Hybrid plans typically are structured to look
like individual accounts that increase each
year with credits based on compensation and
interest. Some companies offering hybrid plans
offer traditional pensions for “grandfathered”
employee groups and hybrid plans for new
and recent hires.
The cost of providing defined benefit
pension plans is strongly correlated with the
service levels and age of the plan participants
because plan sponsors structure benefits to
reward longer service. Such plans often include
the following features:
• Benefits are usually forfeited if employees
fail to work long enough to vest under the
plan’s provisions (typically five years);
• Benefits typically are not payable until age
55 or later, with the normal retirement
benefit payable at age 65;
• Many pension benefit formulas provide
early retirement incentives or increased
levels of benefits based on age and service.
These elements may appear both in
traditional plan designs (e.g., final-average-
pay plans) and in many hybrid plans that
offer larger annual benefit credits based on
age (i.e., age-weighted plan designs); the
goal is to reward career employees and
sometimes to address legal requirements
such as nondiscrimination or rules about
plan accruals. (Legal questions associated
with certain hybrid plan designs are outside
the scope of this study.)
Savings plan costs are generally influenced
more directly by pay than by age because
sponsoring employers typically contribute a
set percentage of covered compensation for
all eligible employees, either automatically or
on a matching basis.
199877%
68%
65%
62%
76%
71%
65%54%
2000
2002
2004
0% 20 40 60 80 100
n Before Age 65 n Age 65 and Older
Exhibit III-8Percent of Large Companies Offering Retiree Medical Coverage*
*Includes only those employers that offer retiree medical coverageto new hires. Employers that provide retiree medical benefits onlyto grandfathered groups are excluded.
Source: Towers Perrin Employee Benefit Information Center dataon more than 700 large U.S. employers (i.e., Fortune 1000companies and equivalents). ©2005 Towers Perrin.
The cost of providing defined benefit pension plans is stronglycorrelated with the service levels and age of the plan participants
because plan sponsors structure benefits to reward longer service.

54
The Business Case for Workers Age 50+ | III. The Cost Side of the Equation
The specific components of the total
retirement program (e.g., types of plans
offered and level of benefits provided) have
an important impact both on costs and on
the organization’s ability to retain employees
once they meet the service and age
requirements for full benefits. For example,
traditional pension plans provide strong
incentives for employees to stay with the
company until key age and service
requirements are met. Defined contribution
plans tend to be more cost-neutral with
regard to age and are more portable. These
considerations take on varying importance
for employers in different industries because
of the wide variations in retirement plans and
plan features from industry to industry and
company to company. (See “Industry Focus:
Retirement Benefits” above.)
Industry Focus: Retirement Benefits
Among the four industries studied, energy companies are themost likely to offer defined benefit pension plans(which tend to have liberal early retirement provisions), while retail
companies are least likely. (See Exhibit III-9.) Similarly, energy companies
on average require smaller retiree contributions for retiree medical
coverage than companies in retail and other industries. (See Exhibit III-10.)
The prevalence of these benefits is likely to play an important role with
respect to retirement patterns by industry over the coming years.
Energy99%
96%
Financial Services
Health Care
Retail
65%Large Employers Overall
0% 20 40 60 80 100
n Defined Contribution
n Defined Benefit (including both traditional and “hybrid” pension plans)
100%
100%
99%
59%
72%84%
26%
66%
Exhibit III-9Retirement Income Plans Offered, by Industry
Source: Towers Perrin Employee Benefit Information Center 2005data on more than 700 large U.S. employers (i.e., Fortune 1000companies and equivalents), including 75 in the energy industry, 45 in financial services, 25 in health care and 27 in the retailindustry. ©2005 Towers Perrin.

55
The Business Case for Workers Age 50+ | III. The Cost Side of the Equation
Paid Time Off Representing about 8% of total compensation
cost, paid time off (e.g., vacation, holidays,
personal days) depends on length of service
in major companies. Typical vacation policies
in large U.S. companies provide two to three
weeks of paid vacation for new and short-
service employees and an additional two to
three weeks for longer-service employees.
Because long-service employees receive
more paid time off, the cost of this benefit
for the average employee with 20 years of
service is typically double the cost for newly
hired workers. Exhibit III-11 on page 56
provides examples of the typical vacation
policies offered by companies in the four
industries studied.
One-Time Costs In thinking about the cost of recruiting or
retaining workers, a cost that is often not fully
and explicitly calculated is turnover. Turnover
costs can be substantial in many cases.
Accurately quantifying these costs is difficult
for many companies, in part because the cost
of turnover varies widely, not only by position,
but also according to the performance level of
the incumbent employee. Some companies
have concluded that the cost of turnover for
high-performing managers can be as high as
a multiple of annual salary. Of course, the
ultimate cost of turnover also depends on
how long an employee stays with the
organization. As the length of an employee’s
service increases, the cost of hiring that
employee becomes less significant. As
mentioned earlier, younger employees and
employees with short tenure typically account
for most of a company’s voluntary turnover.
More than two-thirds (68%) of all voluntary
turnover occurs among employees with five
or fewer years of service.
For the analysis that follows, the one-time
turnover costs associated with departures and
new hires were estimated using Towers Perrin’s
proprietary turnover cost model and Saratoga
Energy$568
$120
$152
$147$668
$148
Financial Services
Health Care
Retail
$587$137
Large Employers Overall
$0 200 400 600 800
n Average Total Plan Cost
n Average Retiree Contribution
$579
$642
Exhibit III-10
Average Monthly Retiree Medical Costs and Retiree Contributions,by Industry
Source: 2005 Towers Perrin Health Care Cost Survey of 385 large U.S.employers (i.e., Fortune 1000 and equivalents), including 28 companies in the energy industry, 63 companies in financial services, 28 companies in health care and 23 companies in the retail industry. ©2005 Towers Perrin.
In thinking about the cost ofrecruiting or retaining workers,a cost that is often not fully andexplicitly calculated is turnover.Turnover costs can be substantialin many cases.

56
The Business Case for Workers Age 50+ | III. The Cost Side of the Equation
Institute data on hiring costs and time required
to fill vacant positions, along with some
assumptions about the productivity impact.
Exhibit III-12 summarizes what is included in
the estimates and the specific assumptions
used in estimating one-time turnover costs for
positions in the four industries studied.
The analysis also assumes that ongoing
training costs would be the same for workers
across all age groups. As a result, no attempt
was made to estimate training costs, other
than the inclusion of new hire orientation
expenses and costs associated with
processing the new-hire transaction.
Although Bureau of Labor Statistics
research35 suggests that workers age 55 and
older receive fewer hours of training than
younger workers, AARP’s research suggests
that older workers are by no means finished
learning. In fact, in one AARP survey, 73% of
workers ages 45 to 74 said that on-the-job
training would be an essential part of their
ideal job, and 88% said that “the opportunity to
learn something new” would be an essential
part.36 According to Saratoga Institute data,
average annual training costs represent almost
$700 per employee in major U.S. companies.
Evaluating Cost Differences for Specific JobsTo evaluate the business case for workers 50+
in the context of specific jobs, one position was
selected in each of our four industry sectors for
a detailed cost analysis. These positions were
chosen because of their relative importance
in their industries and the significant numbers
of people working in these positions. The same
analysis could be applied to every position in
an organization, although companies will
probably want to focus their attention primarily
on business-critical positions or jobs in which
retention or attraction of talent raises particular
concerns (e.g., high turnover, customer rela-
tionships, difficulty of recruiting or significant
training requirements).
Because the economic considerations
identified above are driven by a combination
of plan design, tenure, age, health risks and
one-time costs, it is useful to assess two
hypothetical business case scenarios:
eRetaining 50+ workers. This first scenario
assumes a large, mature organization
with a relatively modest and predictable
growth strategy. The organization has a
group of incumbent employees age 55
with 20 years of service; these employees
could potentially retire, leaving jobs that
would need to be filled with replacement
employees. This analysis focuses on the
economics of two alternative approaches
for filling the vacant jobs:
Exhibit III-11Typical Vacation Policies in LargeU.S. Companies, by Industry
Source: Towers Perrin Employee Benefit Information Center 2005 data on more than 700 large U.S. employers (i.e., Fortune 1000 companiesand equivalents), including 75 companies in the energy industry, 45 companies in financial services, 25 companies in health care and 27 companies in the retail industry. ©2005 Towers Perrin.
Type of Cost EnergyFinancialServices
Health Care Retail
Vacation days per year for new hire
10 10 17 10
Maximum days per year
30 20 32 20
Years of servicerequired formaximum vacationeligibility
30 5 20 10

57
The Business Case for Workers Age 50+ | III. The Cost Side of the Equation
Exhibit III-12 One-Time Costs of Hiring and Replacing Workers
Type of Cost What Is Included Source of Data or Assumptions
Cost of termination Lost productivity of the departing employeeand vacancy cost for the average length oftime it takes to fill the position
l To estimate the cost of the departing employee’s inefficiency, it wasassumed departing employees would be 15% inefficient during theperiod of time they are actively looking for other jobs. The length ofjob search in each industry was estimated using various sources,including 2003 data from Drake Beam and Morrisson, 2004 data fromChallenger, Gray and Christmas, 2004 data from the Academy HealthAnnual Research Meeting in San Diego and 2000 data from RetailIndustry Executive Search. For each industry, the departing employeeinefficiency equals 15% times the number of months of job searchtimes the average compensation and benefit cost for each position(using Towers Perrin data shown in Exhibits III-13 through III-16).
l To estimate the cost of lost productivity while the position is vacant,it was assumed that each position would be 75% inefficient. Thiscost was calculated using 2003 Saratoga Institute data on averagedays required to fill each position times 75% times the average dailycompensation and benefit cost (using Towers Perrin data shown inExhibits III-13 through III-16).
Cost of hire Cost of advertising, employment agency,referral bonus, candidate travel andrelocation, recruiter costs and orientationcosts for the new employee
l Hiring costs (advertising, agency, recruiter, travel, relocation, bonus,etc.) are based on 2003 Saratoga Institute data for each industry.
l To estimate the cost of orientation, it was assumed that the newemployee spends two days in orientation times the average dailycompensation and benefit cost for each position (using Towers Perrin data shown in Exhibits III-13 through III-16).
Cost of new employee New hire’s reduced productivity over thelength of time it takes to become proficientin the job
l To estimate cost of the new employee’s inefficiency, it was assumedthat professional employees require 12 weeks on average to becomefully proficient and are 40% less productive during that period. Thiscost was calculated as 40% times 12 weeks times the averageweekly compensation and benefit cost for each position (usingTowers Perrin data shown in Exhibits III-13 through III-16).
©2005 Towers Perrin.
• Allow natural retirement trends to
evolve with limited efforts to keep
incumbents, so that the employer
succeeds in retaining 20% of the
experienced incumbent staff and fills
the resulting vacancies from the broad
labor pool; or alternatively;
• Mount a focused effort to double
retention to 40% of the experienced
workers, reducing the need to hire from
outside labor sources and increasing
such benefits as knowledge retention
and mentoring.
Average per-employee costs for the mix of
all employees filling the jobs in question—
retained incumbent employees and new
hires—were analyzed. The results show
how average per-employee costs can
change as a result of this effort to retain
more 50+ workers.

58
The Business Case for Workers Age 50+ | III. The Cost Side of the Equation
rAttracting new 50+ workers. The second
scenario focuses on a fast-growing company
that finds itself needing to fill a number of
newly created jobs. Retirement trends
typical for the industry also contribute to
the number of open job slots. The analysis
again focuses on the economics of two
ways of responding to the staffing need:
• From the current applicant pool, hire
a set of workers consistent with the
applicant demographics, 80% of whom
are age 40 and 20% of whom are age 55;
or alternatively;
• Via increased outreach to the 50+ talent
pool (e.g., through implementation of
extended work hour and location
flexibility), fill the open slots by
doubling the percentage of hires age
55 to 40%, with the age 40 hires
making up 60%.
Average per-employee costs for the mix of all
new hires who fill the jobs were analyzed. In
this scenario, the results show how average per-
employee costs can change as a result of the
effort to hire more 50+ workers.
In developing these reward comparisons,
2005 data from Towers Perrin’s compensation
benchmarking database and the firm’s EBIC
data on more than 700 large U.S. employers
were used to determine average cash
compensation for the positions studied and
the average benefit cost in each industry. The
analysis encompassed the three benefit
programs that together make up almost 90%
of total benefit costs in the typical company:
• Retirement programs, including defined
benefit pension (if typically offered in the
industry) and defined contribution savings
plan (e.g., 401(k) or 403(b) plan);
• Medical plan for active employees;
• Paid time off (vacation, holidays, and
personal days).
One-time turnover costs are estimated as
explained in Exhibit III-12 using the available
benchmark data for each of the four
industries examined.
Exhibits III-13 through III-16 summarize
the key value drivers identified in Section II as
well as the cost drivers. For each of the four
positions identified, these exhibits show
average annual cash compensation and the
typical benefits offered to employees in those
positions, based on information in Towers
Perrin’s EBIC database. For each position,
these exhibits also show how the average cost

59
The Business Case for Workers Age 50+ | III. The Cost Side of the Equation
Exhibit III-13 Value and Average Cost: Comparisons for an Engineer (Energy Industry)
*Data shown in each scenario is based on assumed average annual cash compensation of $82,300 regardless of age and service; average annual company-paid health care claim costs of $6,000 at age 40 and $8,900 at age 55; average annual paid time off costs of $6,300 for new hires and $9,500 for employeeswith 20 years of service; and average annual retirement plan costs of $6,400 for new hires at age 40, $8,800 for new hires at age 55 and $12,600 foremployees at age 55 with 20 years of service.
Source: 2005 Towers Perrin benchmarking data for 102 companies in the energy industry and Towers Perrin Employee Benefit Information Center 2005 dataon 75 large U.S. energy companies (i.e., Fortune 1000 companies and equivalents); one-time costs based on Towers Perrin estimates and analysis of SaratogaInstitute data on average costs by industry. ©2005 Towers Perrin.
Position and Description Average Salary and Benefit Programs Typically Offered
Engineer Schedules and coordinates complex projects;reviews design and documentation to ensurecompliance with design criteria
l Median annual salary: $82,300
l Pension: 1.5% of final average earnings times years of service
l Savings: 50% company match on first 6% of pay employee contributes
l Active medical plan: company pays 85% of cost
l Paid time off: 10 days initially to 30 days at 30 years of service
Value Considerations (see Section II)
l 55+ group most highly engaged
l Clear decline in turnover from age 30 to age 50
l Continuing shortage of new engineering talent requires emphasis on hiring and retaining talent
l Complex job tasks place premium on experience, knowledge and practical creativity
l Industry staffing patterns over last two decades place premium on capturing and transferring knowledge of experienced engineers
Scenarios
Scenario 1: Increase retention of 50+ workersMix A: 80% new hires age 40, 20% retention of employees age 55 with 20 years of serviceMix B: 60% new hires age 40, 40% retention of employees age 55 with 20 years of service
Scenario 2: Increase hiring of 50+ workersMix C: 80% new hires age 40, 20% new hires age 55Mix D: 60% new hires age 40, 40% new hires age 55
Mix A Mix B Mix C Mix D
Cash $ 82,300 $ 82,300 $ 82,300 $ 82,300
Average company-paid health care claims (assumes the employer is self insured; actual costs will be higher or lower)
6,600 7,200 6,600 7,200
Paid time off 6,900 7,600 6,300 6,300
Retirement 7,600 8,900 6,900 7,400
Total average annual cost per employee 103,400 106,000 102,100 103,200
Dollar difference per average employee 2,600 1,100
Percent difference per average employee 3% 1%
One-time cost of replacement: $38,700
Average Per-Employee Costs* for Alternative Staffing Scenarios
Scenario 1 Scenario 2

60
The Business Case for Workers Age 50+ | III. The Cost Side of the Equation
Exhibit III-14 Value and Average Cost: Comparisons for Sales Manager (Financial Services)
*Data shown in each scenario is based on assumed average annual cash compensation of $112,700 regardless of age and service; average annual company-paid health care claim costs of $5,600 at age 40 and $8,500 at age 55; average annual paid time off costs of $8,700 for new hires and $13,000 foremployees with 20 years of service; and average annual retirement plan costs of $8,500 regardless of age and service (assumed defined contribution planonly, representing a typical level of retirement benefits in the financial services industry).
Source: 2005 Towers Perrin benchmarking data for 118 companies in financial services and Towers Perrin Employee Benefit Information Center 2005 data on45 large U.S. financial services companies (i.e., Fortune 1000 companies and equivalents); one-time costs based on Towers Perrin estimates and analysis ofSaratoga Institute data on average costs by industry. ©2005 Towers Perrin.
Position and Description Average Salary and Benefit Programs Typically Offered
Sales manager Sells financial products and services; implementslocal marketing plans and strategies; overseessales reps and provides technical training
l Median annual salary: $112,700
l Pension: none
l Savings: company contributes 3% of pay automatically and matches 50% of first 6% of payemployee contributes; company also may make annual profit-sharing contribution up to 3% of pay
l Active medical plan: company pays 80% of cost
l Paid time off: 10 days initially to 20 days at five years of service
Value Considerations (see Section II)
l 55+ group most highly engaged
l Clear decline in turnover from age 30 to age 50+
l Complex job tasks place premium on experience and knowledge
l Effectiveness of 50+ workers in serving the critical baby boomer customer base
Scenarios
Scenario 1: Increase retention of 50+ workersMix A: 80% new hires age 40, 20% retention of employees age 55 with 20 years of serviceMix B: 60% new hires age 40, 40% retention of employees age 55 with 20 years of service
Scenario 2: Increase hiring of 50+ workersMix C: 80% new hires age 40, 20% new hires age 55Mix D: 60% new hires age 40, 40% new hires age 55
Mix A Mix B Mix C Mix D
Cash $112,700 $112,700 $112,700 $112,700
Average company-paid health care claims (assumes the employer is self insured; actual costs will be higher or lower)
6,200 6,800 6,200 6,800
Paid time off 9,600 10,400 8,700 8,700
Retirement 8,500 8,500 8,500 8,500
Total average annual cost per employee 137,000 138,400 136,100 136,700
Dollar difference per average employee 1,400 600
Percent difference per average employee 1% <1%
One-time cost of replacement: $44,300
Average Per-Employee Costs* for Alternative Staffing Scenarios
Scenario 1 Scenario 2

61
The Business Case for Workers Age 50+ | III. The Cost Side of the Equation
per employee changes as a result of retaining
more experienced 50+ workers (scenario 1)
and attracting new 50+ workers (scenario 2) .
The same cash compensation levels were used
for employees regardless of age, assuming that
all employees would be equally qualified and,
thus, would be paid the median market rate
for their positions.
In the hypothetical analyses in the
exhibits, all new hires for the jobs in question
were assumed to either be age 40 or age 55
and all retained incumbent workers used to
fill those jobs were assumed to be age 55. In
reality, of course, the age mix of employees in a
particular position within any organization will
be more diverse as it is unlikely that either all
new hires will be the same age or all incumbent
workers will be the same age. Results would
vary depending on the actual ages selected and
the specifics of the program design.
Costs of Retaining Workers 50+As shown in the last row of each of the tables
above, there are significant one-time costs
associated with replacing workers. Depending
on the specifics, an employer would not
necessarily need to focus on retaining
employees if new hires were equally skilled
and certain to stay for a significant number of
years. (Note that, if the new hire departs soon
after being hired, the effective turnover costs
of losing the age-55 worker would be greater
than those estimated.)
The actual numbers will also differ from the
estimated averages shown here depending on
the actual characteristics of the compensation
and benefit programs the company sponsors,
health care risks, as well as on the actual data
for the mix of the long-service older workers
and the new hires in question.37
The cost involved in increasing retention
of experienced workers is larger than in the
context of attraction because of the higher
cost of retirement benefits and paid time off
associated with increased length of service.
However, the difference in average per-
employee cost associated with enhanced
retention—ranging from 1% to 3% of initial
total annual compensation cost for the four
positions studied—is still relatively modest.
Considering cost alone, many companies
should find themselves with a solid business
case for increasing retention of 50+ workers in
many positions. This conclusion depends on
the specific positions and experience required,
the company’s particular reward programs
and costs as well as on the cost and availability
One other advantage that should not be overlooked is the “knownquantity” premium. Given the imperfect nature of selection processes
in many organizations, a worker whose skills and performance areknown commodities within the company may be worth far more than
a slightly lower-cost replacement with no track record and thereforea higher risk of poor performance or early departure.

62
The Business Case for Workers Age 50+ | III. The Cost Side of the Equation
of suitable replacement workers (and how
long they ultimately remain with the company).
Even where the cost differential might
nominally favor hiring new employees,
companies need to keep in mind the business
advantages that experienced, long-service
employees often offer (e.g., enhanced
engagement, higher productivity, affinity
with older or long-term customers).
One other advantage that should not be
overlooked is the “known quantity”
premium. Given the imperfect nature of
selection processes in many organizations,
a worker whose skills and performance are
known commodities within the company
may be worth far more than a slightly lower-
cost replacement with no track record and
therefore a higher risk of poor performance
or early departure.
Costs of Attracting Workers 50+When one looks at total compensation
costs, using the sample ages and programs
shown, if the mix of new hires shifts and
doubles the percentage of new 50+ workers,
the organization would experience only a
minimal impact—roughly 1% of the average
cost per new employee. This conclusion holds
even given that the average health care claims
cost may be higher for the older group and
that the cost of retirement benefits can be
greater if the organization offers a traditional
pension plan. The overall cost differential
could be greater in companies that offer final
average pay or age-weighted cash balance
pension plans and subsidize more of the cost
of employees’ health care—or smaller in
companies that provide less of a subsidy for
health care and no defined benefit pension.
The age-based cost differential also may be
greater for lower-paid positions where the
cost of benefits as a percent of total
compensation is more significant.

63
The Business Case for Workers Age 50+ | III. The Cost Side of the Equation
Exhibit III-15 Value and Average Cost: Comparisons for Registered Nurse (Health Care)
*Data shown in each scenario is based on assumed average annual cash compensation of $48,000 regardless of age and service; average annual company-paid health care claim costs of $6,000 at age 40 and $8,900 at age 55; average annual paid time off costs of $5,400 for new hires and $8,100 for employeeswith 20 years of service; and average annual retirement plan costs of $2,600 for new hires at age 40, $3,300 for new hires at age 55 and $4,000 foremployees age 55 with 20 years of service
Source: 2005 Towers Perrin benchmarking data for 10 companies in health care and Towers Perrin Employee Benefit Information Center 2005 data on 25 largeU.S. health care companies (i.e., Fortune 1000 companies and equivalents); one-time costs based on Towers Perrin estimates and analysis of Saratoga Institutedata on average costs by industry. ©2005 Towers Perrin.
Position and Description Average Salary and Benefit Programs Typically Offered
Registered nurse Provides direct patient care in hospital setting, including monitoring patient’s condition, administering medications andassisting with treatments
l Median annual salary: $48,000
l Pension: age-weighted cash balance plan providing annual credits of 5% of pay at age 40 and8.5% of pay at age 55
l Savings: company matches 100% of first 2% of pay employee contributes
l Active medical plan: company pays 85% of cost
l Paid time off: 17 days initially to 32 days at 20 years of service
Value Considerations (see Section II)
l 55+ group most highly engaged
l Clear decline in turnover from age 30 to age 50+
l Acute shortage of nursing professionals requires emphasis on hiring and retaining talent
l Complex and diverse job tasks place premium on experience with patient care
l Effectiveness of 50+ nurses in servicing baby boomer population
Scenarios
Scenario 1: Increase retention of 50+ workersMix A: 80% new hires age 40, 20% retention of employees age 55 with 20 years of serviceMix B: 60% new hires age 40, 40% retention of employees age 55 with 20 years of service
Scenario 2: Increase hiring of 50+ workersMix C: 80% new hires age 40, 20% new hires age 55Mix D: 60% new hires age 40, 40% new hires age 55
Mix A Mix B Mix C Mix D
Cash $48,000 $48,000 $48,000 $48,000
Average company-paid health care claims (assumes the employer is self insured; actual costs will be higher or lower)
6,600 7,200 6,600 7,200
Paid time off 5,900 6,500 5,400 5,400
Retirement 2,900 3,200 2,700 2,900
Total average annual cost per employee 63,400 64,900 62,700 63,500
Dollar difference per average employee 1,500 800
Percent difference per average employee 2% 1%
One-time cost of replacement: $18,100
Average Per-Employee Costs* for Alternative Staffing Scenarios
Scenario 1 Scenario 2

64
The Business Case for Workers Age 50+ | III. The Cost Side of the Equation
Exhibit III-16 Value and Average Cost: Comparisons for Store Manager (Retail Industry)
*Data shown in each scenario is based on assumed average annual cash compensation of $39,700 regardless of age and service; average annual company-paid health care claim costs of $5,200 at age 40 and $8,000 at age 55; average annual paid time off costs of $3,100 for new hires and $4,600 for employeeswith 20 years of service; and average annual retirement plan costs of $1,200 regardless of age and service (assumed defined contribution plan only,representing a typical level of retirement benefits in the retail industry).
Source: 2005 Towers Perrin benchmarking data for 38 companies in the retail industry and Towers Perrin Employee Benefit Information Center 2005 data on27 large U.S. retail companies (i.e., Fortune 1000 companies and equivalents); one-time costs based on Towers Perrin estimates and analysis of SaratogaInstitute data on average costs by industry. ©2005 Towers Perrin.
Position and Description Average Salary and Benefit Programs Typically Offered
Store Manager Manages day-to-day operations, including sales,expense control, inventory, customer service,hiring, training and scheduling
l Median annual salary: $39,700
l Pension: none
l Savings: 50% company match on first 6% of pay employee contributes
l Active medical plan: company pays 75% of cost
l Paid time off: 10 days initially to 20 days at 20 years of service
Value Considerations (see Section II)
l 55+ group relatively highly engaged
l Clear decline in turnover from age 30 to age 50+
l Effectiveness of 50+ workers in serving the critical baby boomer customer base
l Scheduling flexibility of 50+ workers makes them an attractive staffing solution (see Section IV)
Scenarios
Scenario 1: Increase retention of 50+ workersMix A: 80% new hires age 40, 20% retention of employees age 55 with 20 years of serviceMix B: 60% new hires age 40, 40% retention of employees age 55 with 20 years of service
Scenario 2: Increase hiring of 50+ workersMix C: 80% new hires age 40, 20% new hires age 55Mix D: 60% new hires age 40, 40% new hires age 55
Mix A Mix B Mix C Mix D
Cash $ 39,700 $ 39,700 $ 39,700 $ 39,700
Average company-paid health care claims (assumes the employer is self insured; actual costs will be higher or lower)
5,800 6,300 5,800 6,300
Paid time off 3,400 3,700 3,100 3,100
Retirement 1,200 1,200 1,200 1,200
Total average annual cost per employee 50,100 50,900 49,800 50,300
Dollar difference per average employee 800 500
Percent difference per average employee 2% 1%
One-time cost of replacement: $19,000
Average Per-Employee Costs* for Alternative Staffing Scenarios
Scenario 1 Scenario 2

65
The Business Case for Workers Age 50+ | III. The Cost Side of the Equation
At the end of the day, the cost differential
for leveraging 50+ talent can be overcome by
the advantages of added experience,
knowledge, skills and engagement (which
were discussed in the prior section). Workers
50+ may also contribute to higher productivity
among other workers by transferring the
knowledge gained over their careers and by
mentoring new employees. The modest
differences in annual compensation costs
could easily be dwarfed by considerations
such as these in many organizations.
To help inform their staffing and recruiting
strategies, companies need to have a command
of productivity, total labor costs and talent
supply consistent with the foregoing
analysis. This information is critical in the
design of strategies to retain and attract the
talent required to execute business strategy.
Although the cost aspect of the equation is
complex, the ultimate conclusion often will
be that investment in 50+ workers is an
attractive opportunity.

66
Many of today’s 50+employees do, indeed,expect to work beyondtraditional retirement age.

67
The Business Case for Workers Age 50+ | IV. The Employee Perspective
IV.lV. The Employee Perspective:
What 50+ Workers Are Looking For
If the analyses of productivity and costs
demonstrate that workers 50+ offer solid
value as part of an organization’s workforce,
the key questions for companies in the
years ahead become:
• Will today’s 50+ workers be interested in
staying in the workforce longer than their
predecessors?
• If so, in what roles and capacity—their
current jobs, part-time employment or
perhaps totally new careers?
• What will it take to attract or retain those
interested in continuing employment?
Research by AARP, Towers Perrin and other
organizations offers some preliminary answers
to these important questions. Taken as a whole,
the recent studies show that many of today’s
50+ employees do, indeed, expect to work
beyond traditional retirement age. How well-
positioned companies are to effectively tap
this pool of experienced talent remains to be
seen, however.
Changing Views of “Retirement”It has been well documented that the
average age of retirement has been
gradually declining in the United States
over the past 50 years. For example, research
by Georgetown University professor Murray
Gendell found that the median U.S.
retirement age in the late-1990s had
dropped by about five years since the
1950s, to age 62 for men and slightly
younger (61.4 years) for women.38
However, recent research suggests that
the trend toward ever earlier retirement
may be reversing itself, and that the average
retirement age may actually rise as the baby
boomers approach retirement. Among the
factors contributing to this shift are longer
life expectancies and Americans’ desire to
stay involved and active in their later years.
Moreover, economic issues such as the
declining prevalence of traditional pension
plans and rising health care costs also
contribute to the likely trend toward
delayed retirements.
Working Americans’ growing reliance on
401(k) plans and other savings to provide for

68
The Business Case for Workers Age 50+ | IV. The Employee Perspective
retirement may increase the financial need to
extend working life. The sharp stock market
drop has fueled projections that many baby
boomers will need to stay on the job longer
than they had previously planned to make up
their lost savings. In fact, in a December 2002
AARP survey of investors 50 to 70 years old, one
in five investors (21%) who lost money in stocks
between 2001 and 2002 and had not yet retired
reported that they had already postponed their
retirement as a result of their losses.39
Working in “Retirement”Other AARP research offers further insights
into views of retirement among 50+ workers
and baby boomers. In a 2003 survey of 2,001
U.S. workers between the ages of 50 and 70,
more than two-thirds (68%) of the respondents
said that they plan to work in retirement or
never retire.40 (See Exhibit IV-1.) In another
2003 AARP survey of 1,200 baby boomers
(adults between the ages of 38 and 57 at the
time of the survey), almost four out of five
(79%) indicated that they expect to work in
some capacity during their retirement years.41
When asked why they expect to work in
retirement, workers ages 50 to 70 are initially
more likely to identify nonfinancial reasons
than financial considerations. (See Exhibit IV-2.)
Not work for pay at all29%
68%
24%
22%
5%
5%
5%
Work/never expect to retire
Work part-time doing the same type of work you do now
Start your own business/work for yourself, doing the same type of work you do now
Start your own business/work for yourself, doing something different
Work full-time, doing the same type of work you do now
Work part-time doing something different
5%Never expect to retire (not read)
2%
Work full-time, doing something different
3%Don’t know (not read)
0% 20 40 60 80 100
n 100%
n Makes up the 68% who plan to continue working
Exhibit IV-1Plans for Retirement Among Workers Ages 50 to 70
Source: Staying Ahead of the Curve 2003: The AARP Working inRetirement Study, a nationally representative telephone survey of2,001workers ages 50-70 (data shown here is based on how the1,637 respondents who have never retired from a job responded tothe question,“Which of the following, if any, best represents whatyou plan to do during your retirement?”; “not read” indicates thatthe response was volunteered by the respondent and was not partof the survey script), AARP, 2003.
Clearly, the “three-legged stool”(Social Security benefits, privatepensions and personal savings)underlying common retirementplanning notions in the late 20thcentury is rapidly giving way to adifferent model.

69
The Business Case for Workers Age 50+ | IV. The Employee Perspective
For example, more than three in four
identified nonfinancial reasons, such as the
desire to stay mentally active (87%), the
desire to stay physically active (85%) and
the desire to be productive or useful (77%).
Fewer—but still a majority—identified
financial reasons for wanting to continue
working, such as the need for health care
benefits (66%) or money to live on (54%).
However, when workers between the ages
of 50 and 70 are forced to select only one
major reason for planning to work in
retirement, it becomes clear that financial
considerations are the primary motivators.
(See Exhibit IV-3 on page 70.) Specifically,
when asked to choose only one major
influence in their decision to continue
working in retirement, these workers are
most likely to cite the need for money (22%).
Second in importance to the need for money
is the need for health benefits (17%), followed
closely by nonfinancial considerations such as
the desire to stay mentally active (15%) and
the desire to be productive and useful (14%).
These findings confirm that a dramatic
shift is taking place in worker attitudes about
retirement today. Clearly, the “three-legged
stool” (Social Security benefits, private
pensions and personal savings) underlying
common retirement planning notions in the
late 20th century is rapidly giving way to a
different model. It may be more accurate to
think of retirement security today as a structure
Stay mentally active87%
85%
77%
71%
Stay physically active
Be productive or useful
Do something fun
66%Need health benefits
59%Help other people
58%Be around people
54%Need money
50%Learn new things
32%Pursue a dream
0% 20 40 60 80 100
Exhibit IV-2Major Factors in the Decision to Work in Retirement
Source: Staying Ahead of the Curve 2003: The AARP Working inRetirement Study, a nationally representative telephone survey of2,001 workers ages 50 to 70; chart is based on how 1,020 workersages 50 to 70 who reported that they planned to work in retirementbut had not yet retired responded to the following question: “Now,I’m going to read you several reasons why some people continue towork in retirement. For each one, I’d like you to tell me whether it isa major factor, a minor factor, or no factor at all in your decision towork in retirement.” For each item, chart shows % of respondentswho identified the item as a “major factor.”

70
The Business Case for Workers Age 50+ | IV. The Employee Perspective
supported by four pillars, encompassing
Social Security, pensions and savings, health
insurance and, for many, continuing earnings
from employment.
While the median age at which workers in
the U.S. stopped working in the 1990s was
approximately 62, three in four (75%) of the
workers ages 50 to 70 that AARP surveyed
expect to continue working until the age of
65 or older, with many expecting to work
into their 70s, 80s, or as long as they are able.
(See Exhibit IV-4.)
Offering Attractive Employment OpportunitiesWhile financial rewards will play an
important role in 50+ workers’ decisions
about where they work in coming years,
intangibles like work experience and
organizational culture will also loom large
for many people. To compete successfully
for talent as the coming demographic
Need Money22%
17%
15%
14%
Need health benefits
Stay mentally active
Be productive or useful
9%Stay physically active
6%Help other people
5%Do something fun
4%Be around people
3%Learn new things
3%Pursue a dream
3%Don’t know/Refused
0% 5 10 15 20 25 30
Exhibit IV-3One Major Factor in the Decision to Work in Retirement
Source: Staying Ahead of the Curve 2003: The AARP Working in RetirementStudy, a nationally representative telephone survey of 2,001 workers ages 50 to 70; chart is based on how 1,020 workers ages 50 to 70 who reportedthat they planned to work in retirement but had not yet retired responded to the following question: “Which of the things we just talked about is theONE major factor in your decision to work in retirement?”
Exhibit IV-4When Today’s Workers Ages 50 to 70Will Stop Working Completely
Source: AARP, Staying Ahead of the Curve 2003: The AARP Working inRetirement Study, a nationwide survey of 2,001 workers between theages of 50 and 70; table is based on 1,954 respondents and excludesworkers who did not know whether they would work in retirement.
Between the ages of... Percentage
50–54
55–59
60–64
*
5%
18%
50–64 23%
65–69
70–74
75–79
80 or older
Never expect to stop working/retire (not read)
As long as I am able to (not read)
30%
19%
8%
11%
4%
3%
65+/never/as long as able
Don’t know (not read)
75%
2%
Total 100%

71
The Business Case for Workers Age 50+ | IV. The Employee Perspective
shift unfolds, employers will need to create
a work environment that is both welcoming
and stimulating for employees of all ages. And
they will need to offer the kinds of flexible job
opportunities that respond to a broad range
of employee preferences and needs.
AARP’s 2003 survey of more than 2,000
workers age 50 to 70 sheds light on some of the
specific attributes workers 50+ are looking for
in the workplace.42 (See Exhibit IV-9 on page
74.) Among those interested in working in
retirement, the most important aspects include:
Views of 50+ Workers at Large Companies
Fully half of the 50+ workers at large companies (Fortune 1000 companies
and equivalents) that Towers Perrin surveyed in 2005 expect to continue
some level of employment after leaving their primary careers. Onaverage, these 50+ workers at large companies do notexpect to stop working altogether until age 671/2.Almost one in five (18%) expects to work at least part-time after age 75.
(See Exhibit IV-5).
Moreover, consistent with other research, Towers Perrin’s surveys show
that many of today’s 50+ workers at large companies will be seeking
a change of pace or new challenges in their work after reaching
retirement age. Many who say they plan to keep working also say they
want to work less than a conventional schedule or move to a different
occupation. Only 17% of today’s 50+ workers at large companies want
to work full-time in retirement, and less than a third (31%) want to
remain in their current occupations. (See Exhibit IV-6 on page 72.) The
obvious implication is that employers who seek to attract orretain these employees will need to rethink theirworking arrangements and career structures if they
hope to tap into this pool of talent.
n 55–60
n 61–62
n 63–65
n 66–69
n 70–74
n 75+
n Never
n Not Sure
4%
7%
8%
10%
14%15%
18%
23%
Exhibit IV-5When Today’s 50+ Employees in Large Companies Expect to Stop Working Completely
Source: 2005 Towers Perrin online survey of approximately 1,500randomly selected employees age 50+ working for large U.S.companies (i.e., Fortune 1000 companies and equivalents).©2005 Towers Perrin.

Competing for 50+ Talent: Defining the Right Mix of Rewards
Given the prospect of intensifying competition for talent in coming years as the baby boomers begin to
retire, employers will need a thorough understanding of the rewards most important to workers 50+ if they
hope to develop effective recruiting and retention strategies. Exhibit IV-7 examines the rewards most
important to workers ages 50+ at large companies (Fortune 1000 and equivalents).
As Exhibit IV-7 shows, employees ages 50+ at large companies indicate that competitive health care benefits
are the most important factor in their decision to join a company. Competitive retirement benefits, however,
are a close second in importance. Work/life balance is also important—and likely to take on added
importance for the 50+ population as those workers reach the end of their primary careers and look for
continuing work opportunities that allow them to scale back their hours, work more flexible schedules and
tackle new challenges.
Health care and retirement benefits also top the list of what 50+ workers at large companies look for in
deciding whether to stay with an organization, although intangibles like work/life balance, the opportunity
to work with high-caliber colleagues and on-the-job recognition also play significant roles. (See Exhibit IV-8).
72
The Business Case for Workers Age 50+ | IV. The Employee Perspective
• An environment in which their opinions
are valued and in which they can gain
new skills and experiences;
• The ability to choose their own hours,
take time off to care for relatives and
work from home;
• An organization that allows people 50+ to
remain employed for as long as they want
to continue working;
• The opportunity to have new experiences
and learn new skills;
• Access to good health benefits;
• The opportunity to work a reduced
schedule prior to full retirement.
n Work full-time in my current occupation
n Work full-time, but not in my current occupation
n Work part-time in my current occupation
n Work part-time, but not in my current occupation
n Not work after reaching retirement age
48%
10%13%
21%
7%
Exhibit IV-6Expectations About Working inRetirement Among 50+ Employees in Large Companies
Source: 2005 Towers Perrin online survey of approximately 1,500randomly selected employees ages 50+ working for large U.S. companies(i.e., Fortune 1000 companies and equivalents). Data shown is based onhow the respondents answered the question, “If you expect to work afterreaching retirement age, which of the following situations is most likely?”©2005 Towers Perrin.

73
The Business Case for Workers Age 50+ | IV. The Employee Perspective
The 2003 AARP survey also underscores
that the need for personal fulfillment and
the desire to stay mentally and physically
active are key motivators for many workers
50+. More than 70% of both the pre-retirees
and working retirees surveyed cited keeping
mentally active as very important to them.
And more than half said it is very important
for their work to make them feel useful, keep
them physically active and provide
opportunities to help and interact with other
people. Also important, the survey found,
workers 50+ are looking for work that they
view as fun and enjoyable.
Organizations that offer the right mix of
rewards and can structure or redesign jobs to
closely match what 50+ workers are looking
for will likely have a large—and growing—
pool of talent available to them for the
foreseeable future.
Competitive health care benefits package67%
61%
43%
31%
Competitive retirement benefits package
Competitive base pay
Work/Life balance
26%Reputation of the company
0% 20 40 60 80
Exhibit IV-7
Top Five Factors Employees 50+ in Large Companies Consider inDeciding to Join a Company
Competitive health care benefits package61%
54%
35%
28%
Competitive retirement benefits package
Work/Life balance
The caliber of people with whom I work
27%Recognition for work
0% 20 40 60 80
Exhibit IV-8
Top Five Factors Employees 50+ in Large Companies Consider inDeciding to Stay With a Company
Source: 2005 Towers Perrin online survey of approximately 1,500 randomlyselected employees age 50+ working for large U.S. companies (i.e., Fortune1000 companies and equivalents). ©2005 Towers Perrin.
Source: 2005 Towers Perrin online survey of approximately 1,500randomly selected employees age 50+ working for large U.S. companies(i.e., Fortune 1000 companies and equivalents). ©2005 Towers Perrin.

Exhibit IV-9
74
Importance of Selected Benefits and Employer Characteristics in Retirement Work
Working in an environment where employee opinions are valued
0% 20 40 60 80 100
Being able to take time off to care for grandchildren, parents, or other relatives
Being able to set your own hours
Working for a company that lets its older employees remain as long as they wish to work
Having new experiences
Being able to learn new skills
Working for a company that offers employment opportunities to retirees
Working for a company that offers good health benefits
Working for a company that offers health benefits to retirees
Working for a company that offers a good pension plan
Being able to work from home
Working for yourself or starting your own business
Being able to work a reduced schedule for a period of time before you retire completely
58 25 17
41 41 18
3056 14
57 29 14
66 21 13
n Very Important n Somewhat Important n Not Important
41
52
56
55
39
44
31
30 20 50
4227
19 37
33 28
18 27
18 26
24
39 20
24
Source: Staying Ahead of the Curve 2003: The AARP Working in Retirement Study, an AARP telephone survey of 2,001 workers ages 50 to 70; table is based on the 1,020 workers who expected to work in retirement and had not yet retired.
The Business Case for Workers Age 50+ | IV. The Employee Perspective

75
The Business Case for Workers Age 50+ | V. Managing Opportunities and Challenges
V.V. Managing Opportunities and
Challenges: Strategies for the 50+ Workforce
So, how are major employers responding
to the emerging talent challenges and oppor-
tunities posed by shifting demographics?
Exhibit V-1 shows the most common
approaches in use among U.S. employers,
based on a 2003 survey of more than 400
human resource executives conducted by
the Society for Human Resource Manage-
ment. Although the majority are taking some
action, almost a third of these employers are
not yet addressing the issue.
Increased training 36%
29%
21%
20%
Succession plans/replacement charts
Flexible scheduling
Created bridge employment
16% Increased recruiting
18%
Capture institutional memory/ organizational knowledge
On radar screen
32% Doing nothing
10% Phased/gradual retirement
0% 20 10 30 40 50
15%
% of respondents
Exhibit V-1How Organizations Are Preparing for thePossibility of a Shortage of Workers Due to the Retiring Baby Boom Generation
Source: Olders Workers Survey of more than 400 human resource executivesin U.S. companies, Society for Human Resource Management, 2003.
“Policies promoting longer working life could
ameliorate some of the potential demographic
stresses.” –Alan Greenspan, Federal Reserve
Chairman, speaking at a 2004 economics conference
in Jackson Hole, Wyoming
“Education, innovation and flexibility are the
keys to increasing the labor market participation
of older workers.” –Elaine L. Chao, Secretary of
Labor, addressing the 2005 G8 Conference in London

76
The Business Case for Workers Age 50+ | V. Managing Opportunities and Challenges
Everything we’ve considered so far in this
report suggests that these firms are in for
surprises—and a potentially serious loss of
key talent and knowledge—if they continue
to do nothing. Among the organizations that
are taking action, the response has focused
largely on one or both of two key fronts:
eExpanding the 50+ workforce. Smart
organizations are making a concerted effort
to recruit and retain 50+ workers. Exhibit
V-2 shows the prevalence of programs or
incentives commonly offered to retain
workers 50+, according to a 2002 Conference
Board survey of human resource executives
in the United States and abroad. From
these data, it appears that many employers
are moving in the direction suggested by
Labor Secretary Chao’s comment at the
beginning of this section—emphasizing
flexible work arrangements, training and
creative HR programs as primary
components of their efforts.
rRebuilding the talent pool and capturing
key knowledge. For job categories that
seem likely to lose significant numbers of
incumbents to retirement in the relatively
near term, companies are focusing on
rebuilding the talent pipeline by
aggressively recruiting new employees
and investing in succession planning,
leadership development and initiatives
designed to capture departing workers’
knowledge. Based on the interviews with
10 major employers that were conducted
for this study, these approaches are
especially common in cases where the
organization has difficulty convincing
today’s 50+ workers to extend their
careers. The rebuilding strategy seems
most appropriate for positions where the
nature of the work (e.g., highly stressful or
Incentives Offered by Employers to Help Retain Workers 50+
Exhibit V-2
Flexible work arrangements41%
34%
15%
14%
Training to upgrade skills
Time off for volunteerism
Phased retirement
12%Job rotation
14%Reduced shiftwork
Sabbaticals
5%Mentoring as a primary job responsibility
8%Reduced responsibility
0% 2010 30 40 50
11%
% of respondents
Source: Valuing Experience: How to Motivate and Retain MatureWorkers, based on a 2002 survey of 150 senior human resourceexecutives, The Conference Board, 2003.
Everything we’ve considered so far in this report suggests thatthese firms are in for surprises—and a potentially serious loss ofkey talent and knowledge—if they continue to do nothing.

77
The Business Case for Workers Age 50+ | V. Managing Opportunities and Challenges
physically demanding) and the incumbent
employees’ access to pension benefits
and/or subsidized retiree medical coverage
tend to encourage early retirement.
Following is a closer look at some programs
and innovative approaches employers may be
considering to help them make the most of
the 50+ workforce, along with an overview of
emerging best practices in this area and
selected case studies profiling the efforts of
specific companies in a range of industries.
Phased Retirement ArrangementsPhased retirement programs have been
mentioned often as a possible approach for
companies seeking to retain retirement-eligible
employees who might otherwise leave the
organization. Conceptually, these arrange-
ments are designed to allow employees to
move into retirement gradually by reducing
their work schedules while continuing to
receive a portion of their salaries as well as
employer-provided benefits, typically
including health care and retirement benefits.
Although a few companies have already
implemented such programs on a formal
basis, their prevalence remains relatively low
today among large U.S. corporations—in
part because of impediments posed by
federal pension rules. In effect, those rules
require employees to separate from service
before they can begin receiving benefits
from qualified employer pension plans
(defined benefit and money purchase plans).
In late 2004, the Treasury Department
proposed regulations designed to facilitate
the use of phased retirement programs by
permitting qualified pension plans to begin
paying benefits to plan participants who
continue to be employed part time by the
sponsoring company. (See “Making Phased
Retirement Workable” on page 78.)
Employer interest in these programs has
remained relatively modest until recently.
Only about one in 10 employerssurveyed by the Society for HumanResource Management in 2003reported offering formal phasedretirement programs.

78
The Business Case for Workers Age 50+ | V. Managing Opportunities and Challenges
78
The Business Case for Workers Age 50+ | V. Managing Opportunities and Challenges
For example, only about one in ten employers
surveyed by the Society for Human Resource
Management in 2003 reported offering
formal phased retirement programs.43 And
less than one in five (16%) of the more than
340 major U.S. companies surveyed for
Towers Perrin’s 2003 Retirement Study
identified supporting phased retirement as a
priority for their organizations at that time.
However, another 40% recognized the issue
as a future concern, which suggests that the
coming demographic shifts and potential
boomer retirements may increase employer
interest in phased retirement programs.
Far more common are informal phased
retirement arrangements, especially among
smaller organizations (probably because many
do not offer qualified pension plans). In 2003,
Cornell University professor Robert Hutchens
conducted a survey of almost 1,000 workplaces
and found that almost three-quarters (73%)
permit at least some older employees to cut
Making Phased Retirement Workable
Private pension policy was originally designed to provide income
once a worker has left the labor force. For this reason, employees
had to either retire from a company or reach the plan’s normal
retirement age to receive benefits from a traditional defined benefit
pension plan. The proposed Treasury Department regulations issued
late in 2004 mark a welcome first step in the government’s effort
to remove a significant regulatory barrier to formal phased
retirement programs for companies offering defined benefit and
money purchase pension plans.
Under the proposed regulations:
• Employees would be eligible for phased retirement beginning
at age 591/2, the same age at which penalty-free withdrawals
generally may be taken from 401(k) plans;
• Employees would need to reduce their working hours by at
least 20% to be eligible for phased retirement benefits;
• Phased retirement benefits would be payable in the optional
benefit forms available at full retirement, except for lump sums;
• Employers would be required to monitor the hours worked by
“phased retirees” and make adjustments in benefits, if necessary.

79
The Business Case for Workers Age 50+ | V. Managing Opportunities and Challenges
79
The Business Case for Workers Age 50+ | V. Managing Opportunities and Challenges
back their hours of work prior to retirement.44
Such arrangements are more common in
smaller companies and in service industries,
the study found.
Clearly, there’s considerable interest in
phased retirement in today’s 50+ workforce.
In a recent AARP survey of more than 2,100
Americans age 50 and older, nearly two in
five 50+ workers (38%) expressed interest in
the concept.45 Furthermore, the vast majority
(78%) of those workers interested in phased
retirement said that the availability of
such programs would encourage them to
continue working beyond their anticipated
retirement age.
Not surprisingly, how pension benefits are
handled plays a large role in terms of the
attractiveness of phased retirement programs
to workers 50+. Fully 87% of the AARP survey
respondents view continuing pension benefit
accruals as an important ingredient in any
phased retirement arrangement. Additionally,
almost two-thirds (63%) said that phased
retirement would be less attractive if it meant
their final pension benefits would be reduced,
although the proposed Treasury regulations
may help address these concerns.
Reemploying Retirees Because of the current regulatory impediments
to formal phased retirement programs, a
growing number of companies are imple-
menting innovative strategies for bringing
recent retirees with needed skills back into the
workplace. Examples that have been profiled
recently in various news reports include:
• Monsanto offers part-time reemployment
opportunities—with no loss of retiree bene-
fits—to workers who have been retired
from the company at least six months;
• SSM Health Care, a large Catholic hospital
system, is addressing its nursing shortage
by offering retired workers the opportunity
to return to work with full pension benefits
as soon as one day after retirement. The
program, permitted under an exemption
from the IRS, allows workers to retire as
early as age 60 while continuing to work
in the system.
• A program called YourEncore is helping
companies hire highly skilled retirees—
including scientists, engineers, product
developers and others—on a contract
basis. Founded by Proctor & Gamble and
Eli Lilly in 2003, YourEncore serves much
like an employment agency for retirees
with specialized skills. An independent
business, YourEncore recruits retirees,
contracts with employers and sends the
retirees out on short-term assignments
with the participating companies. Retirees
are paid based on their salaries at the time
of retirement.
• Charles Stark Draper Laboratories, a
research organization based in Cambridge,
Massachusetts, offers recent retirees highly
flexible reemployment opportunities,
including extended leaves (e.g., six months
per year) and fully customized work
schedules for employees with critical
knowledge and specialties.
In a recent AARP survey of morethan 2,100 Americans age 50 andolder, nearly two in five 50+workers (38%) expressed interestin phased retirement.

80
Enhanced Knowledge Management EffortsIn addition to focused recruiting and retention
initiatives aimed at 50+ workers, more and
more companies today are pursuing expanded
knowledge management efforts to help
capture and leverage the business acumen
poised to walk out the door as the baby
boomers retire. Such efforts typically focus
on two types of knowledge:
eExplicit. Technical and process information
(e.g., rule-based knowledge), which can
be gathered, stored and disseminated
relatively easily;
rTacit. The knowledge gleaned from a
lifetime of experience, including facts,
perceptions, insights, instinct, personal
relationships and the ability to devise
creative solutions (which, compared
with explicit knowledge, is less easily
captured and communicated).
Some companies are using increasingly
innovative mentoring and related programs
to help retain a portion of this tacit
knowledge. Reported examples include:
• Dow Chemical uses a formal mentoring
program that’s been in place for a decade.
Mentors in the program are assigned a
small group of protégés with whom they
meet regularly to share insights and
experiences and check progress. Mentors
also serve as a sounding board for the
younger employees;
• Northrop Grumman has established a
number of “communities of practice” to
facilitate knowledge sharing, both via
regular in-person meetings and online.
The communities often cut across
disciplines and divisions to encourage
breakthrough thinking.
Putting It All Together: Emerging Successful PracticesPhased retirement, retiree reemployment
and other programs to support attraction
and retention can make a big difference in
The Business Case for Workers Age 50+ | V. Managing Opportunities and Challenges
More and more companies today are pursuing expanded knowledgemanagement efforts to help capture and leverage the business
acumen poised to walk out the door as the baby boomers retire.

81
The Business Case for Workers Age 50+ | V. Managing Opportunities and Challenges
helping companies make the most of 50+
talent. It is worth noting, however, that none
of these programs in isolation will deliver
the desired results for every company. Far
more effective are holistic, systemic
approaches to talent management that
begin with a thorough understanding of
each organization’s specific needs and
combine an array of targeted recruitment,
retention and reward programs to keep the
talent pipeline full. Such programs focus
broadly on optimizing the abilities,
knowledge, skills and experience of all
workers, regardless of age.
Although successful approaches are as
varied as the organizations that use them,
the following are some of the key ingredients
that are critical to any company’s efforts:
eDefine your needs and inventory your
talent. The first step is to analyze your
organization’s near- and longer-term
business plans to gain an understanding
of your critical talent needs over the next
5 to 10 years. Be as specific as possible
about the kinds of skills and number of
people that will be needed to execute
your business plans. As part of this
analysis, examine your workforce data to
understand the current state of your
talent pipeline and identify possible
future gaps. Analyze your current
population by length of service,
retirement opportunities and work
location for each key job category
identified in your needs analysis.

82
The Business Case for Workers Age 50+ | V. Managing Opportunities and Challenges
rPay attention to revenue and
performance. Remember the value side of
the equation. Determine how investments
needed to attract or retain 50+ workers
could pay added dividends in terms of lower
turnover, enhanced customer service,
stronger customer loyalty and, ultimately,
increased revenue and efficiency. These
elements may be more difficult to quantify
than the cost side of the equation, but they
can outweigh the marginally higher dollar
costs associated with hiring and retaining
50+ workers.
tModel cost trends to understand the
business case for investments. Since
cost management plays such an important
role in almost every organization’s talent
strategy, it is critical to understand the key
cost differences—and drivers—for the
various segments of your workforce.
This is especially true for support
functions (e.g., call centers, back office
functions) that can be located almost
anywhere. Most large organizations
maintain the data needed to perform
the kind of cost analysis outlined in this
report. This information will help you
decide how strong a business case can
be made for investments needed to
attract/retain workers 50+.
uStudy the labor pool and define your
talent strategies. Once you have a sense
of your talent needs, consider where
tomorrow’s employees will come from.
Look first at your internal talent pool,
taking into account expected turnover
from retirement and other causes. Then
do some research on the external labor

83
The Business Case for Workers Age 50+ | V. Managing Opportunities and Challenges
markets in the areas where you operate
by gathering data from government
agencies, local economic development
groups, relevant industry and labor
organizations, and other sources.
Identifying the gaps between your
projected talent needs and the available
supply of people with the requisite skills
and experience enables you to develop
targeted talent strategies—possibly
including new recruiting initiatives,
creative retention programs, enhanced
training/knowledge management
processes and reward programs—to help
ensure that your organization can attract
and retain the right people, in the right
locations, at the right cost, to support
your business goals.
iAlign reward programs to support your
objectives. If workers 50+ will be an
important element of your talent strategy,
it is critical to review your reward strategy
and underlying pay, benefits and other
programs to ensure that all programs are
closely aligned with company and
employee needs. Remember that health
care and retirement benefits rank one
and two as drivers of both attraction and
retention for workers 50+. And, if you do
not already offer them, you may want to
consider a range of programs that tend
to be highly valued by this segment of
the workforce. Examples include access
to medical coverage for part-time
workers, the option to buy long-term
care coverage, elder care referral and
related programs, phased retirement
Building a Culture of Inclusion: Some Thoughts to Consider
• Start off right. Make sure that the process for orienting new employees and bringing
them into the organization emphasizes organizational connection, creates sustainable
links among employees and provides momentum for all types of hires—entry-level, mid-
career, late-career.
• Build supporting systems. Ensure that ongoing processes for job rotation, skills
acquisition, organizational mobility and cross-functional team-building are in place.
• Put managers at the center. Hold leaders at all levels accountable for helping people
foster organizational connections and span boundaries. Make sure your managers and
supervisors have the right competencies for this role.
• Measure and monitor. Assess changes in your culture at both the enterprise and
business unit levels. Most important, evaluate individual managers on how well they
retain key players and foster employee engagement, growth and development.

84
The Business Case for Workers Age 50+ | V. Managing Opportunities and Challenges
opportunities, vacation buy/sell, paid
time-off banks, product discounts and
others. In some cases, it may be helpful to
conduct research among your employees
(e.g., surveys, focus groups) to gain a
clearer picture of the specific programs
and reward elements that would make
them want to continue working for your
organization. Such research also can give
you insights into whether your 50+
workforce is interested in staying on in
your organization, either full- or part-
time, past normal retirement age.
oAlign workplace policies and culture.
Also keep in mind that all of the available
research points to the work experience as
a key consideration for 50+ workers as
they decide whether to join or stay with
an organization. Beginning with how you
recruit and orient new employees, your
organization sends a host of messages
about what you value and how things are
done day to day. Is yours an inclusive
organization that values differences,
respects individual ideas and recognizes
individual contributions? Do leaders and
supervisors send implicit or explicit
signals about how 50+ workers are
regarded? Do you offer ongoing training
and development opportunities that
encourage employees to grow, tackle new
challenges and explore new directions,
regardless of their age and tenure? Do you
offer the flexible work schedules that
appeal to many 50+ workers? Is the
culture collegial? (See “Building a Culture
of Inclusion” on page 83 for ideas on
building a more inclusive culture to better
support the 50+ workforce.)
Case Studies: How Some LargeEmployers areMaximizing the 50+ Workforce
The following case studies highlight how
some large U.S. companies are using 50+
talent to enhance their business performance.
Except where otherwise noted, these examples
come from interviews the Towers Perrin
research team conducted with senior human
resource professionals in the companies
profiled. (For additional examples of innovative
approaches that employers are using to attract
and retain 50+ talent, see Staying Ahead of the
Curve 2004: Employer Best Practices for Mature
Workers, published by AARP.)

85
The Business Case for Workers Age 50+ | V. Managing Opportunities and Challenges
Borders Group Aims to Mirror the MarketplaceThe Borders Group, the parent company of
Borders Books and Music and Waldenbooks,
embarked on a strategy to optimize the
mature workforce in many of its stores as
part of a broader diversity effort launched in
the late 1990s. Following the release of 2000
U.S. Census data, “we made a strong business
case for this effort because we took a hard
look at the shifting demographics and
concluded that we needed to get out in front
of this curve,” Suzann Trevisan, the company’s
manager of specialty recruiting and retention,
said in an interview.
The effort took on added importance when a
market analysis found a strong correlation
between workforce demographics and the
financial performance of the company’s
stores. Stores at which the workforce most
closely mirrors the customer base are the
most successful, Borders found. Although
the company’s local markets vary widely,
customers age 45 and older make up an
important segment of its target market
nationwide, generating half of all book
purchases made in the United States.
Market demographics play a large role in
the company’s decisions about store location,
and local store managers are provided with
extensive demographic data to help inform
their staffing decisions. As a result of this
emphasis, the 50+ workforce now represents
16% of the company’s 34,000 employees, up
from just 6% a few years ago.
Optimizing the 50+ workforce also supports
the company’s market strategy of differentiating
its stores by offering a broad selection of
merchandise and an outstanding customer
experience. “The older workforce tends to be
stable, knowledgeable and knows our business,”
Trevisan said, adding that “the longer you
work for a company, the better educated you
“The older workforce tends to bestable, knowledgeable and knowsour business,” Trevisan said,adding that “the longer you workfor a company, the better educatedyou are about what the companyoffers and how you can providethe best service to customers.

86
The Business Case for Workers Age 50+ | V. Managing Opportunities and Challenges
are about what the company offers and how
you can provide the best service to customers.
All of these things add up to more sales, and if
we can hold onto an experienced employee
for a couple of extra years, even on a part-time
basis, that’s a plus.”
Another benefit Borders has realized from
targeting the 50+ workforce is lower turnover
costs. “It’s really hard to come up with an
accurate measure of the total cost of turnover,
but we know it’s significant,” Trevisan said.
Borders tracks turnover at the store level on a
monthly basis, and the turnover rate among
50+ workers is less than half of that for
younger groups, she added.
Also notable is that the company has seen
no significant increase in health care costs
from the growth of its 50+ workforce, despite
its decision several years ago to restore
health care benefits for part-time workers
after previously phasing out this coverage.
“The things that really drive up health care
costs are catastrophic illnesses that can
happen at any age,” Trevisan said.
The decision to offer health benefits to part-
time employees grew out of the company’s
broader HR philosophy, which Borders calls
Value of Employment. The company surveys
employees every other year to find out what’s
important to them and gauge how well Borders
is meeting employee needs. These surveys
suggested that 50+ workers are drawn by flexible
work schedules, medical coverage and the
opportunity Borders offers to stay connected
with the community.
To help attract and retain experienced
workers, Borders offers scheduling flexibility
and medical coverage at group rates without
regard to the number of hours worked.
Merchandise discounts are also popular with
50+ workers, as is the intellectual stimulation
that comes from staying current on the latest
books, music and video releases.
Despite the physical requirements of
positions that involve moving heavy cartons
of merchandise and stocking shelves,
Borders has seen no measurable differences
in productivity or injury rates between older
and younger workers. Nor has the company
found 50+ workers to be less technology-
savvy than younger workers. The company’s
applicant screening and selection processes
are designed to ensure that the people
Borders hires can succeed in the jobs they’re
expected to perform.
“What it comes down to is that you try to
hire the best qualified people, regardless of
age,” Trevisan said. “Both older and younger
employees need to come prepared for the job.”

87
The Business Case for Workers Age 50+ | V. Managing Opportunities and Challenges
Home Depot Puts out the Welcome Mat for SnowbirdsWorkers 50+ are only one talent pool in
The Home Depot’s sights—but they are an
important one for the fast-growing home
improvement retailer that has ballooned
from 200,000 to 325,000 employees over
the last five years. This year alone, the
organization will process more than
17 million employment applications.
“In 2005, we will hire 20,000 net new
associates to fill a variety of positions as we
continue to grow,” said Gretchen Lumsden,
The Home Depot’s staffing manager for
national hiring partnerships. “We’re
strategically looking at innovative ways to
meet our immense needs for skilled,
knowledgeable, and passionate employees.”
Workers 50+ are attractive to the retailer
because The Home Depot’s experience
suggests that “mature workers often come
with a great deal of past work experience and
a strong sense of leadership, which are
tremendous benefits for the company.” In
addition, they tend to have lower attrition and
better attendance, according to Lumsden.
The Home Depot involves all of its associates
in an annual Employer of Choice survey to
measure employee perceptions of the company
and monitor trends in employee engagement.
Results of the survey are not broken down
by age, although the lower turnover among
workers 50+ suggests a higher level of
engagement in this segment of the workforce.
The Home Depot has launched a number of
initiatives to help attract and retain its growing
50+ workforce, including its much-publicized
collaboration with AARP. Also receiving
widespread attention is The Home Depot’s
so-called “snowbird special.” Depending on
business needs, high-performing associates
who reside in different parts of the country
at different times of the year may be able to
transfer between different Home Depot
locations near their homes. Although this
option is made available to employees of all
ages, it tends to be most popular among
retirees who divide their time between
homes in northern and sunbelt states.
The ability to transfer within the company
“is a win/win for The Home Depot and for
our associates,” Lumsden said, because it
offers snowbirds continuing employment in
their winter and summer homes while
helping the company meet peak staffing
demands. “Spring is the busiest time of year
in our stores, and spring comes later in the
north. Therefore, we typically will have job
openings in northern markets when
snowbirds are ready to return to their
summer homes.”
Other ways in which The Home Depot
competes for 50+ workers include offering
flexible part-time schedules and health care
Workers 50+ are attractive to the retailer because The Home Depot’sexperience suggests that “mature workers often come with a great deal
of past work experience and a strong sense of leadership, which aretremendous benefits for the company.”

88
The Business Case for Workers Age 50+ | V. Managing Opportunities and Challenges
benefits for part-time workers. “The fact that
we offer medical benefits to part-time
associates gives us a competitive advantage
versus some other retailers,” Lumsden said.
“Our older associates tell us that health care
coverage, flexible scheduling and a dynamic
work environment are major draws for them.
Plus, we work hard to let them know we
really value their experience and want them
to consider employment opportunities at
The Home Depot.”
A catchy recruiting campaign targeted to
the 50+ population also helps. The tagline:
Passion never retires.
Bon Secours Health System SeesExperienced Talent as Key Part of ItsEffort to Address the Nursing ShortageWith more than 10,000 nursing staff among
its 25,000 employees, Bon Secours Health
System knows well the challenges caused by
the nationwide nursing shortage.
“The graying of the workforce is clearly
affecting us,” said David D. Jones, senior
vice president of human resources for the
24-hospital health system spanning nine
eastern states. “The average age of our
nurses is beyond 45 and we are well aware
that retirements will be affecting our staffing
needs over the next five to 15 years. And,
looking at the relatively low numbers of new
workforce entrants in the nursing field, we
see a significant gap ahead.”
In response, Bon Secours is pursuing a
range of strategies to help attract more
people to nursing, including targeted
recruiting efforts as well as partnerships with
nursing and educational organizations. “But
the number one thing we want to do is keep
the people we have now,” Jones said. “We’re
trying to find new ways to appeal to people
as they move along in their careers.
Retention of our current workforce is the
biggest priority.”
Reason: “There’s a huge financial,
productivity and patient safety advantage to
retaining our more experienced nurses,”
according to Jones. “When we look at the cost
of turnover, the differential in salary and
benefit costs for older, long-service workers is
inconsequential. The direct cost of replacing a
nurse is 20% to 30% of salary and the indirect
cost of lost productivity and patient revenue
can be well over 150% of salary.”

89
The Business Case for Workers Age 50+ | V. Managing Opportunities and Challenges
Offering experienced nurses extensive
scheduling flexibility is an important part of
Bon Secours’ retention effort. “We offer
unbelievable flexibility,” said Jones, “Any
schedule people come up with, we’ll
accommodate.” That includes allowing
employees to take weeks or months off as
well as more traditional part-time schedules.
“If we can only get a person to work half
time, half a nurse is better than no nurse,”
Jones said.
Among the biggest barriers to the
organization’s efforts to retain older nurses
are the daunting physical demands of the
work. To help nurses lift heavy patients, Bon
Secours has been introducing new lifting
devices and technology. The organization
has also taken a close look at how other staff
are deployed, with the goal of having other
personnel take on some of the more
physically demanding tasks traditionally
performed by nurses. “We’re also doing a lot
to teach lifting techniques and safety
processes,” Jones added.
“Part of being a 24/7 operation is you have
to be creative to stay staffed,” he noted.
“Necessity is the mother of invention.”
MITRE’s Full-Court PressA 50-year-old nonprofit that manages federally
funded R&D centers for a trio of government
agencies, the MITRE Corporation recognizes
that its workforce of experienced systems
engineers and other technical experts is the key
to its success as a business. As a result, MITRE
recruits seasoned talent aggressively using a
wide range of initiatives. One of the most
effective, according to company HR

90
The Business Case for Workers Age 50+ | V. Managing Opportunities and Challenges
professionals, was MITRE’s decision to
emphasize employee referrals—instead of
traditional approaches, such as advertising
and employment agencies—as a primary
recruiting tool.
The company offers employees referral
bonuses ranging from $500 to $2,000,
depending on the job level. MITRE reports
that referrals now make up more than half of
all new hires, while also helping to streamline
the selection process and reduce its recruiting
costs (from an average of more than $14,000
per hire in 2001 to $8,700 in 2004). Rehires
make up almost 10% of the company’s total
annual hiring—and reflect MITRE’s success in
creating an attractive work environment for
seasoned professionals. Company recruiters
are sensitive to older worker issues and look
for candidates who have established strong
track records over their careers.
MITRE’s success appears to lie in offering
a combination of programs that are closely
aligned to the needs of a mature workforce,
including:
• A highly attractive retirement savings
program, with generous company match;
• A formal phased retirement program
providing ongoing health coverage,
retirement contributions and other
benefits to employees who want to scale
back to part time;
• A formal reemployment program (“Reserves
at the Ready”) that allows retirees to work
for the company as part-time experts on
call—at their former pay rates;
• Company-supported retiree associations
that help MITRE stay connected with
former employees;
• A broad range of continuing education
opportunities;
• Highly flexible work schedules, including
flextime, compressed work weeks, part-
time schedules, telecommuting, job
sharing and more;
• Extensive wellness programs, which help
MITRE keep its medical costs close to
average levels—despite its high
percentage of 50+ workers;
• A range of formal and informal mentoring
opportunities and structures
Ultimately, company officials believe that
“the ability to both retain and recruit older
workers with valuable experience and
critical skills that are in short supply could
become a source of competitive advantage
in the near future.”46
Preparing for the Changes Ahead Many employers have their work cut out for
them over the coming years with today’s
changing demographics. Despite the initial
success some companies have had in
attracting and leveraging 50+ talent, the
challenge of effectively realigning rewards,
recruiting strategies, knowledge management
programs and organizational cultures to
support an increasingly cross-generational
workforce in what is sure to be a more
competitive market for talent will be an
ongoing challenge.
For many companies thinking about how to
keep the talent pipeline full for key positions—
especially those requiring significant experi-
ence, a wealth of tacit knowledge and personal
contact with customers—the business case for
investing in workers 50+ will be clear and
compelling. To support companies’ decision-

91
The Business Case for Workers Age 50+ | V. Managing Opportunities and Challenges
making processes, we believe the kind of cost
analysis and workforce planning approaches
outlined in this report can add significant value.
Unfortunately, research suggests that
many companies currently do not track
some of the key information necessary to
perform a sound business case analysis.
There is a clear need for more analysis and
employer attention to such areas as:
• Measuring productivity and performance;
• Quantifying training costs and the
financial return on investments in
training;
• Determining the costs and drivers of
turnover;
• Measuring labor costs generally;
• Challenging unfounded assumptions
about 50+ workers.
What is also clear is that some employers
are already beginning to experiment with
new approaches to managing today’s
demographic shifts and changing workplace
dynamics. As the 50+ workforce grows and
takes on added importance in the labor force
and national economy over the next few
decades, we expect to see the evolution of
more well-defined best practices across a
broad spectrum of human resource
management issues, including:

92
The Business Case for Workers Age 50+ | V. Managing Opportunities and Challenges
• Recruitment, selection, development and
retention practices for late-career workers;
• Full-time to part-time transitioning models;
• More cost-effective total reward programs
for late-career workers;
• Management training and counseling
programs to foster more older-friendly
work environments;
• Lifelong learning programs for employees
of all ages.
For corporate leaders who are not yet able to
see the business case, it is worth remembering
that those organizations that are beginning
to tackle these issues today will be better
positioned to compete for tomorrow’s talent
when the projected demographic shifts become
reality. Following are some resources that
may be helpful to companies in this regard.
Resources for Employers Help with recruiting and hiring: AARP offers
a number of programs to identify companies
with exemplary workforce practices or to
help companies publicize their employment
opportunities for 50+ workers and match
workers with prospective employers.
Examples include:
• AARP Best Employers for Workers Over
50. Each year since 2001, AARP has
selected a group of employers that offer
leading-edge practices for recruiting and
managing 50+ workers, based on a
rigorous analysis of their workplace
programs. These organizations are
profiled on AARP’s web site and featured
in the news media. For details, go to
www.aarp.org/employerresourcecenter.
• Featured Employers Program. Launched
in 2005 as part of the AARP Workforce
Initiative, this effort is designed to help
workers 50+ connect with specific job
opportunities, assessment tools and
training opportunities by featuring
companies that have adopted aggressive
programs for recruiting, hiring and
retaining the 50+ workforce on AARP’s web
site. Descriptions of the featured companies
and links to job applications are available at
www.aarp.org/featuredemployers.

93
The Business Case for Workers Age 50+ | V. Managing Opportunities and Challenges
About the Study
Compiled in the winter and spring of 2005 by a team of consultants and associates in
Towers Perrin’s HR Services business, the findings presented in this report were drawn
primarily from the following sources:
AARP research. Much of the information
about the attitudes of 50+ workers toward
work and working in retirement comes from
recent nationally representative surveys
conducted by AARP. AARP’s 2002 survey
(Staying Ahead of the Curve: The AARP Work
and Career Study) included more than 2,500
workers ages 45 to 74, while its 2003 survey
(Staying Ahead of the Curve 2003: The AARP
Working in Retirement Study) included 2,001
workers ages 50 to 70. Information about
employer attitudes toward 50+ workers
comes from AARP’s 2000 survey entitled
American Business and Older Employees and
its 2005 survey American Business and Older
Employees: A Focus on Midwest Employers.
Information about employer best practices
for an aging workforce comes from Staying
Ahead of the Curve 2004: Employer Best
Practices for Mature Workers, which spotlights
innovative practices used by recent and
former AARP Best Employers for Workers
Over 50 and other companies.
Towers Perrin’s proprietary data.
Information on current workforce demo-
graphics, compensation and benefit programs
and costs in large U.S. companies and one-
time hiring and turnover costs comes primarily
from an analysis of several Towers Perrin
databases, supplemented by data from
Medstat, the Saratoga Institute and other
sources. Much of the workforce analysis is
based on Towers Perrin’s 2003 data for 335
large U.S. companies (i.e., Fortune 1000 and
equivalents) sponsoring defined benefit
pension plans in the United States. This
database, covering approximately three million
employees, is representative of large employers
and the workers employed by them in a wide
range of industries. Information on benefit
prevalence and costs is drawn primarily from
Towers Perrin’s 2005 Employee Benefit
Information Center database covering more
than 700 large U.S. employers (i.e., Fortune
1000 and equivalents) in a range of industries.
The detailed cost analysis focuses largely on
positions in four industries: energy, financial
services, health care and retail. (See Section
III for details.) Information on employee
engagement and some of the information on
employees’ views on rewards, retirement and
working in retirement are based on various
Towers Perrin surveys of employees working in
large U.S. companies. (See Sections II and IV.)
Other previously published research.
Information on broad U.S. workforce
demographic trends, work and aging, labor
productivity and prevalent employment
practices among U.S. companies comes from
an extensive review of the available academic
and technical studies and published research
by U.S. government agencies and other
organizations, including the Conference
Board, Society for Human Resource
Management and others. (See Sections I,
II and V for much of this information.)

The Business Case for Workers Age 50+ | V. Managing Opportunities and Challenges
Employer interviews. To gain a deeper
understanding of the range of challenges
and issues facing major U.S. employers in
relation to the aging workforce—and how
specific companies are addressing these
issues today—the research team interviewed
representatives of 10 leading organizations
in the energy, financial services, health care,
retail and other industries. (Highlights of
some of these interviews can be found in the
case studies presented in Section V.) AARP and
Towers Perrin would like to express their
appreciation to these individuals who gave
so generously of their time and insights.
Except in cases where the employers
interviewed asked that their companies not
be identified in this report, all sources of
information are noted in the body of the
report, exhibits or footnotes.
Endnotes1Mitra Toossi, “Labor Force Projections to
2012: The Graying of the U.S. Workforce,”
Monthly Labor Review, February 2004.
Mitra Toossi, “A Century of Change: The
U.S. Labor Force, 1950–2050,” Monthly
Labor Review, May 2002.
2American Business and Older Employees:
A Focus on Midwest Employers, AARP, 2005.
3Staying Ahead of the Curve: The AARP Work
and Career Study, AARP, 2002.
4Staying Ahead of the Curve 2003: The AARP
Working in Retirement Study, AARP, 2003.
5Society for Human Resource Management
press release, June 20, 2005.
6See Section II of the full report for an
overview of this research.
7Mitra Toossi, “A Century of Change: The
U.S. Labor Force, 1950–2050,” Monthly
Labor Review, May 2002.
8American Business and Older Employees,
AARP, 2000, and American Business and
Older Employees: A Focus on Midwest
Employers, AARP, 2005.
9Making Health Care Consumerism Work—
Aligning Employer and Employee Interests,
Towers Perrin, 2004.
10William McNaught and Michael Barth,
“The Human Resource Potential of
Americans Over 50,” Human Resource
Management, 1992.
94

The Business Case for Workers Age 50+ | V. Managing Opportunities and Challenges
11David Galenson, A Portrait of the Artist as a
Very Young or Very Old Innovator: Creativity
at the Extremes of the Life Cycle, National
Bureau of Economic Research, 2004.
12Staying Ahead of the Curve 2003: The AARP
Working in Retirement Study, AARP, 2003.
13Staying Ahead of the Curve 2003: The AARP
Working in Retirement Study, AARP, 2003.
14Valuing Experience: How to Motivate and
Retain Mature Workers, The Conference
Board, 2003.
15But see IRS Proposed Regulations,
REG-114726, December 2004, providing
parameters for formal phased retirement
programs.
16JaneMarie Mulvey and Steven Nyce,
“Strategies to Retain Older Workers”,
Pension Research Council Paper, The
Wharton School, 2004.
17Keeping the Talent Pipeline Filled in
the Energy and Utility Industries, The
Conference Board, 2004.
18Valuing Experience: How to Motivate and
Retain Mature Workers, The Conference
Board, 2003.
19Older Workers Survey, Society for Human
Resource Management, 2003.
20David Galenson, A Portrait of the Artist as a
Very Young or Very Old Innovator: Creativity
at the Extremes of the Life Cycle, National
Bureau of Economic Research, 2004.
21Dean Keith Simonton, “Age and Outstanding
Achievement: What Do We Know After
a Century of Research?” Psychological
Bulletin, 1988, Vol. 104, No. 2, p. 252.
22Karen Springen and Sam Seibert, “Artful
Aging” Newsweek, January 17, 2005, p. 56
citing research from both Dr. Gene Cohen
and Dean Keith Simonton (The Simonton
research is also referenced in note 21.)
23This graph plots the linear regression
equation that explains the correlation
between two variables: respondents’
engagement scores and their companies’
revenue growth, as measured by the
percentage point difference between
company revenue growth and the overall
Dow Jones market sector growth average
for the relevant industry.
24This graph plots the linear regression
equation that explains the correlation
between two variables: respondents’
engagement scores and their companies’
cost of goods sold, as measured by the
percentage point difference between
company COGS and the overall Dow Jones
market sector COGS average for the
relevant industry.
25Occupational Outlook Quarterly, January
2002.
26Glen McEvoy and Wayne Casio, “Cumulative
Evidence of the Relationship Between
Employee Age and Job Performance,”
Journal of Applied Psychology, 1989.
27Neil Charness, “Can Acquired Knowledge
Compensate for Age-Related Declines in
Cognitive Efficiency?” In Sara Honn Qualls
(Ed); Norman Abeles (Ed), Psychology and
the Aging Revolution: How We Adapt to
Longer Life, American Psychological
Association, 2000, pp. 112, 113.
95

The Business Case for Workers Age 50+ | V. Managing Opportunities and Challenges
28Judy McGregor and Lance Gray, “Stereotypes
and Older Workers: The New Zealand
Experience,” Social Policy Journal of New
Zealand, Issue 18, June 2002, p. 173; for a
broad discussion of experience and domain
expertise, see, for example, David E. Miles
and Neil Charness, “Computational
Explorations of the Influence of Structured
Knowledge on Age-Related Cognitive
Decline,” Psychology & Aging, 17(2), June
2002, pp. 245–259.
29William McNaught and Michael Barth,
“The Human Resource Potential of
Americans Over 50,” Human Resource
Management, 1992.
30The Saratoga Institute collects a wide array of
information on human resources practices,
benchmarks and costs.
31Staying Ahead of the Curve: The AARP Work
and Career Study, AARP, 2002.
32Medstat is a Thomson Corporation database
that includes claims data covering over 3.5
million employees and 7.5 million plan
participants.
33Staying Ahead of the Curve 2004: Employer
Best Practices for Mature Workers, AARP, 2004.
34Making Health Care Consumerism Work—
Aligning Employer and Employee Interests,
Towers Perrin, 2004.
35H. Frazis, M. Gittleman, M. Horrigan and M.
Joyce, “Results from the 1995 Survey of
Employer-Provided Training,” BLS Monthly
Labor Review Online, U.S. Bureau of Labor
Statistics, June 1998.
36Staying Ahead of the Curve: The AARP Work
and Career Study, AARP, 2002.
37This report was designed to quantify the
business case for large employers for a select
number of jobs. The report’s analyses
therefore use aggregate data from a variety of
sources on positions at large employers.
Individual company data may vary from the
aggregated totals, particularly if different age
groups are compared. Also because the data
are not representative of small employers,
generalizations about such employers cannot
be drawn.
38Murray Gendell, “Retirement Age Declines
Again in the 1990s,” Monthly Labor Review,
October 2001.
39Impact of Stock Market Decline on
50–70-Year-Old Investors, AARP, 2002.
40Staying Ahead of the Curve 2003: The AARP
Working in Retirement Study, AARP, 2003.
41Baby Boomers Envision Retirement II:
Survey of Baby Boomers’ Expectations for
Retirement, AARP, 2004.
42Staying Ahead of the Curve 2003: The AARP
Working in Retirement Study, AARP, 2003.
43Older Workers Survey, Society for Human
Resource Management, 2003.
44Robert Hutchens,The Cornell Study of
Employer Phased Retirement Policies: A
Report on Key Findings, Cornell University
School of Industrial and Labor Relations,
October 2003.
45Attitudes of Individuals 50 and Older Toward
Phased Retirement, AARP, March 2005.
46William D. Albright Jr. and Gary A. Cluff,
“Ahead of the Curve: How MITRE Recruits
and Retains Older Workers,” Journal of
Organizational Excellence, Spring 2005.
96

Acknowledgements: This report was pre-pared by Roselyn Feinsod, Tom Davenportand Rich Arthurs of Towers Perrin’s HRServices business, with assistance fromNubia Alexander, Nick Blitterswyk, EllenFuccella, Nicholas Fox and Amy Sung. The study was made possible by AARP’sEconomic Security Department. Specialthanks go to the following members ofAARP’s staff who served on the project
advisory team: Deborah Russell, EconomicSecurity; Jon Dauphiné, Social Impact;Sara Rix, Public Policy Institute; and S. Kathi Brown, Strategic Issues Research.
For additional information, please contactDeborah Russell at 202-434-2067, Sara Rix at202-434-2416, Kathi Brown at 202-434-6296or Roselyn Feinsod at 203-326-5464.
©2005 AARP. All rights reserved.Reprinting with permission only. AARP Knowledge Management601 E Street, NW, Washington DC 20049http://research.aarp.org
The Business Case for Workers Age 50+:Planning for Tomorrow’s Talent Needs in Today’s Competitive EnvironmentA Report for AARP Prepared by Towers Perrin | December 2005

Planning for Tomorrow’s Talent Needsin Today’s Competitive EnvironmentA Report for AARP Prepared by Towers Perrin | December 2005
The Business Case for
WorkersAge 50+
©2005 AARP. All rights reserved. Reprinting with permission only. 601 E Street, NW, Washington DC 20049www.aarp.org/employerresourcecenter
D18540 (1205)
The B
usin
ess Case fo
r Wo
rkers Ag
e 50+Plan
nin
g fo
r Tom
orro
w’s Talen
t Need
s in To
day’s C
om
petitive En
viron
men
t | Decem
ber 2005