a business case for workers age 50+ - aarp states … · rebecca perron, laura mehegan, tanya...
TRANSCRIPT

A Business Case for Workers Age 50+:A Look at the Value of Experience
A report prepared for AARP by Aon Hewitt
2015

A Business Case for Workers Age 50+:
A Look at the Value of Experience
2015
A report prepared for AARP by Aon Hewitt
Copyright 2015 AARP, All rights reserved.
Reprinting with permission only.
AARP Research.
601 E Street, NW,
Washington DC 20049
www.aarp.org/research

ii
A Business Case for Workers Age 50+: A Look at the Value of Experience 2015
AARP is a nonprofit, nonpartisan organization, with a membership of nearly 38 million, thathelps people turn their goals and dreams into real possibilities, strengthens communities andfights for the issues that matter most to families such as healthcare, employment and incomesecurity, retirement planning, affordable utilities and protection from financial abuse. Weadvocate for individuals in the marketplace by selecting products and services of high qualityand value to carry the AARP name as well as help our members obtain discounts on a widerange of products, travel, and services. A trusted source for lifestyle tips, news and educationalinformation, AARP produces AARP The Magazine, the world's largest circulation magazine;AARP Bulletin; www.aarp.org; AARP TV & Radio; AARP Books; and AARP en Español, aSpanish-language website addressing the interests and needs of Hispanics. AARP does notendorse candidates for public office or make contributions to political campaigns or candidates.The AARP Foundation is an affiliated charity that provides security, protection, andempowerment to older persons in need with support from thousands of volunteers, donors, andsponsors. AARP has staffed offices in all 50 states, the District of Columbia, Puerto Rico, andthe U.S. Virgin Islands. Learn more at www.aarp.org.
About AonAon plc (NYSE:AON) is the leading global provider of risk management, insuranceand reinsurance brokerage, and human resources solutions and outsourcing services. Throughits more than 66,000 colleagues worldwide, Aon unites to empower results for clients in over120 countries via innovative and effective risk and people solutions and through industry-leadingglobal resources and technical expertise. Aon has been named repeatedly as the world'sbest broker, best insurance intermediary, best reinsurance intermediary, best captives manager,and best employee benefits consulting firm by multiple industry sources. Visit aon.com for moreinformation on Aon and aon.com/manchesterunited to learn about Aon's global partnershipwith Manchester United.
Acknowledgements
This report was prepared by Roselyn Feinsod and Erika Illiano of Aon Hewitt with assistancefrom David Fairburn, Jennifer Gislason, Tomeka Hill, Derek Kruizenga, Jane Kwon, CoriMcCormick, Ian Stark, and Joseph Usher. The study was made possible by AARP. Specialthanks go to the following members of AARP’s staff who served on the project advisory team:Debbie Banda, Laura Bos, Mary Liz Burns, Debbie Chalfie, Christina Fitzpatrick, LaurieMcCann, Ed Redfern, Sara Rix, Mary Ellen Signorille, Gerry Smolka, Jane Sung, and LoriTrawinski. The project was managed by Kathi Brown, AARP Research, with assistance fromRebecca Perron, Laura Mehegan, Tanya Mitchell, and Karen Turner.
For additional information, please contact S. Kathi Brown at [email protected]; or Laura Bos [email protected]. Members of the media should contact AARP’s Media Relations Office [email protected].

iii
A Business Case for Workers Age 50+: A Look at the Value of Experience 2015
Table of Contents
Foreword……………………………………………………………………………………………. vii
Executive Summary……………………………………………………………………………….. 1
Introduction………………………………………………………………………………………….. 5
Chapter 1: Labor Force Supply and Demand………………………………………………….. 9
Chapter 2: Workers Age 50+ Bring Value to Business………………………………………... 15
Chapter 3: Experienced Talent Costs Less than You Think…………………………………. 28
Chapter 4: Workers Age 50+: What Are They Looking For?............................................... 52
Chapter 5: Employer Strategies to Attract, Retain, and Engage Workers Age 50+……….. 62
Appendix……………………………………………………………………………………………. 85
Endnotes……………………………………………………………………………………………. 88

iv
A Business Case for Workers Age 50+: A Look at the Value of Experience 2015
List of Exhibits
Exhibit I-1: Ten Year Labor Force Projections………………………………………………… 10
Exhibit I-2: Recent Trends in Average Retirement Age……………………………………… 10
Exhibit I-3: Remaining Life Expectancies, Males and Females, 2005 vs. 2014………….. 11
Exhibit I-4: Percentage of Employers Having Difficulty Filling Jobs……………………….. 12
Exhibit I-5: Top 10 Jobs U.S. Employers Are Having Difficulty Filling…………………….. 13
Exhibit II-1: Understanding Engagement: The Notions of Say, Stay, and Strive………… 15
Exhibit II-2a: Average Workforce Engagement Levels by Age Group…………………….. 17
Exhibit II-2b: Average Workforce Motivation Levels by Age Group………………………… 17
Exhibit II-3: Job Growth and Satisfaction Among Workers 45-74…………………………… 18
Exhibit II-4: Employee Reported Intention to Stay……………………………………………… 20
Exhibit II-5a: How Avoiding Turnover Creates Value………………………………………….. 22
Exhibit II-5b: Value Created by Avoiding Turnover of a Single Employee by Industry…… 22
Exhibit II-6: Organizations’ Limited Use of Longer-Term Workforce Planning……………. 26
Exhibit III-1: Key Drivers of Labor Cost……………………………………………………….. 29
Exhibit III-2: Allocation of Reward Costs in Large U.S. Companies Remains Largely
Unchanged………………………………………………………………………………………… 30
Exhibit III-3: Cash Compensation by Age and Industry Across Large Employers………… 31
Exhibit III-4: Cash Compensation by Years of Service and Industry Across Large
Employers………………………………………………………………………………………….. 32
Exhibit III-5: Percent of Large Organizations with Performance-Based Pay………………… 33

v
A Business Case for Workers Age 50+: A Look at the Value of Experience 2015
Exhibit III-6: Breakdown of Employee Benefits Costs Paid by Large Employers: 2006 vs.
2013………………………………………………………………………………………………… 34
Exhibit III-7: Costs of Average Employer-Provided Benefits for Large Employers: 2006 vs
2013………………………………………………………………………………………………… 35
Exhibit III-8: Average Annual Health Care Claims Cost Increases for Large Employers by
Age of Employee………………………………………………………………………………… 37
Exhibit III-9: Average Cost of Health Care Claims Paid by Large Employers, Per
Employee by Age of Covered Employee………………………………………………………. 38
Exhibit III-10: Percentage of Large Employers Offering Retirement Programs by Type... 40
Exhibit III-11: Current Percentage of Large Employers Offering Retirement Programs to
Salaried New Hires……………………………………………………………………………….. 41
Exhibit III-12: Typical Vacation Benefits in Large Companies……………………………… 41
Exhibit III-13: Compensation and Benefits Assumptions…………………………………… 45
Exhibit III-14: Value and Average Cost Scenarios-Energy (Engineer)……………………. 47
Exhibit III-15: Value and Average Cost Scenarios-Financial Services (Sales Manager)… 48
Exhibit III-16: Value and Average Cost Scenarios-Health Care (Registered Nurse)…….. 49
Exhibit III-17: Value and Average Cost Scenarios-Retail (Store Manager)………………. 50
Exhibit IV-1: Expected Retirement Age for Workers Age 45+ is on the Rise……………… 52
Exhibit IV-2a: Reasons for Working or Looking for Work: 2012 vs. 2002…………………. 54
Exhibit IV-2b: Reasons for Working or Looking Work: Ages 45-59 vs. Ages 60-74……….. 54
Exhibit IV-3: Which of the following, if any, best represents what you plan to do during
your retirement?..................................................................................................................... 55
Exhibit IV-4a: Reasons to Work in Retirement: 2012 vs. 2002……………………………… 57
Exhibit IV-4b: Reasons to Work in Retirement: Ages 45-59 vs. Ages 60-74………………. 57
Exhibit IV-5: Job Essentials for Workers Age 45-74…………………………………………… 59
Exhibit V-1: Steps Taken to Recruit and/or Retain Older Workers………………………….. 63

vi
A Business Case for Workers Age 50+: A Look at the Value of Experience 2015
Exhibit V-2: 2013 WorldatWork Survey on Workplace Flexibility: Prevalence of Flexibility
Programs…………………………………………………………………………………………… 66
Exhibit V-3: WellStar Engagement Levels by Age……………………………………………. 75
Exhibit V-4: S&T New Hires in 2013 by Age…………………………………………………… 77
Exhibit V-5a: NIH Workforce by Age (as of October 1, 2014)……………………………….. 78
Exhibit V-5b: NIH Hires by Age (FY12-FY14)………………………………………………… 78
Exhibit V-5c: NIH Years of Service (Age 50+ Employees) Data as October 1, 2014……… 79

vii
A Business Case for Workers Age 50+: A Look at the Value of Experience 2015
Foreword
In 2005, AARP and Towers Perrin released a landmark report on The Business Case for
Workers Age 50+: Planning for Tomorrow’s Talent Needs in Today’s Competitive Environment.
That study documented for the first time why attracting and retaining experienced workers 50+
is critical for businesses seeking an advantage in the labor market.
This current study, A Business Case for Workers Age 50+: A Look at the Value of Experience
2015, commissioned by AARP and conducted by Aon Hewitt, demonstrates that 10 years later,
the business case for workers age 50+ has grown stronger and that recruiting and retaining
workers age 50+ is critical to the success of high performing businesses.
It’s no secret that as our population ages, the workforce is aging right along with it. U.S.
employees 65+ now outnumber teenagers in the workforce for the first time since 1948. In
2002, workers 50+ made up 24.6 percent of the workforce. By 2012, they were 32.3 percent.
And by 2022, they are projected to be 35.4 percent of the total workforce. During the past
decade alone, the number of workers ages 40 to 49 decreased by 6 percent, while the number
of workers ages 50 to 59 and 60 to 69 grew by 28 percent and 72 percent, respectively. This
trend isn’t likely to change anytime soon. As the data in this report indicate, in 2014, over one in
three workers age 45+ expects to retire at age 66 or older, compared to just over one in five 10
years ago. Moreover, 72 percent of workers ages 45 to 74 envision working in retirement either
out of choice or necessity.
This is good news for employers. While the 50+ workforce is growing, many employers report
having trouble recruiting and retaining qualified workers. Even though this was not the case
during the recession years, the Manpower Group 2014 Talent Shortage Survey found that 40
percent of U.S. employers reported difficulty in filling jobs.
Fortunately, many of today’s workers want to work and want viable work options later in life. So,
in light of the declining proportion of younger workers and the projected shortages of talent in
many areas, many employers are turning to experienced, 50+ workers in order to gain and
maintain a competitive edge.
HR managers who once may have assumed that older workers could be replaced by those
fresh out of school are having to rethink those assumptions. Instead, they are looking for
innovative ways to encourage workers 50+ to remain on the job beyond their traditional
retirement age. They are learning that although 50+ workers are motivated by current and
future financial needs (e.g., pay and benefits), psychological and social fulfillment also play a
significant role in decisions to keep working. As such, 50+ workers highly value non-financial
offerings by employers, such as flexible work schedules, telecommuting options, training and
education opportunities, phased retirement programs, and bridge jobs that allow them to
transition into some other kind of work.
viii
A Business Case for Workers Age 50+: A Look at the Value of Experience 2015
Many employers have already begun implementing innovative practices to attract and retain
workers 50+. Others, however, are slow to adapt to the changing workforce, largely because of
negative stereotypes and outdated notions about the value of older workers. For example, one
misconception is that workers 50+ cost significantly more than younger workers because of
older workers’ experience and additional benefit costs. While costs still tend to increase with
age (particularly health care costs), the impact on the employer is minimal. In fact, recent
trends in compensation and benefits have diminished the relationship between age and labor
costs to the point that age is no longer a significant factor in the costs of hiring and retaining
workers.
Leading employers across all industries value the expertise and experience of workers 50+ and
believe that recruiting, retaining and engaging them will improve their business results. Just as
today’s 50+ population is redefining aging and eroding negative stereotypes, today’s 50+
workforce is adding value by exhibiting traits that are highly sought after in today’s economy,
including experience, maturity and professionalism, a strong work ethic, loyalty, reliability,
knowledge and understanding, and the ability to serve as mentors. Moreover, because workers
50+ are less likely than younger workers to leave their jobs unexpectedly, they create value by
allowing dollars and time that might otherwise be spent on workforce churn to be more
effectively invested in productive measures that impact the bottom line.
In today’s business environment, the most important capital a company possesses is its human
capital. Employers who are prepared to meet the workplace needs of their people can stay
ahead of the curve. Companies that invest in their human capital realize a return on investment
through an increase in their market value. At AARP, we are committed to helping organizations
realize that age adds value. We believe that anyone 50+ who wants or needs to work should be
able to work. It’s not only essential to achieving financial security but also benefits our economy
and our society.
A Business Case for Workers Age 50+: A Look at the Value of Experience 2015 debunks many
of the widely held misperceptions about the costs of 50+ workers and demonstrates that
employers should view workers 50+ as an essential part of the plan to meet their workforce
needs. It also highlights the need for employers to consider costs with a broader lens and
demonstrates that recruiting and retaining workers 50+ is a sound business strategy. Finally, it
shows how to develop and implement an effective strategy for retaining and recruiting workers
50+. By understanding how the changing demographics of the workforce impact business and
by viewing workers 50+ as a solution to meeting workforce needs, companies can compete and
win in the evolving global marketplace.
Sincerely,
Jo Ann Jenkins, CEO AARP

1
A Business Case for Workers Age 50+: A Look at the Value of Experience 2015
Executive Summary
In an era of changing workforce demographics, economic pressures, and mounting talent
needs, employers may struggle with finding and keeping the talent that they need and wonder
whether the growing pool of older workers will be a positive or a negative for their organization.
In order to help employers examine these issues, AARP commissioned Aon Hewitt to develop
this study as an update to a 2005 report on the business case for workers age 50+, also
commissioned by AARP.1 Using the most current data available, the study quantifies the cost
and examines the value of the age 50+ workforce and evaluates the business case for the
recruitment, retention, and engagement of these workers. While economic and demographic
circumstances have changed since 2005, the findings reveal that the business case for workers
age 50+ has strengthened and confirms that recruiting and retaining this cohort is a critical
component of a high performance business.
A Framework for Employer Evaluation
As employers create and refine their talent strategies for today and into the future, it is important
for their leaders to understand:
1. The business impact of changing labor force demographics
2. The value of workers age 50+ to the organization
3. The economics of retaining and hiring workers age 50+
4. What age 50+ workers seek in an employer
5. How leading employers are addressing these issues
This report focuses on this framework to allow employers to evaluate the impact of recruiting
and retaining workers age 50+.
Key Findings and Implications
Workforce demographics and talent needs underscore the importance of workers age50+
The age 50+ workforce segment is growing in size at a time when 40% of U.S. employers report
difficulty filling jobs.2 In a recent survey by the Society for Human Resource Management
(SHRM), nearly four in 10 HR professionals predicted that the loss of talent resulting from
retirements or departures of workers age 55+ would be either a problem or a crisis for their
organization over the next 11-20 years.3 Retaining valuable workers who are close to retirement
represents one method for mitigating further shortfalls.

2
A Business Case for Workers Age 50+: A Look at the Value of Experience 2015
Key implications for employers: A focus on the attraction and retention of workers age 50+
will play a significant role in addressing talent shortfalls in the coming years.
50+ talent Is a key ingredient in a high-performing workforce
The 50+ segment of the workforce continues to be the most engaged age cohort across all
generations. Sixty-five percent of employees age 55+ are considered engaged based on survey
data, while younger employee engagement averages 58% to 60%.4 The level of employee
engagement has implications for both retention and business results. It takes only a 5%
increase in engagement to achieve 3% incremental revenue growth.5 This means a Fortune
1000 company with $5 billion in revenue could achieve a $150 million revenue increase with a
5% increase in employee engagement.
A SHRM survey of HR professionals cites many advantages of older workers, including greater
professionalism, a stronger work ethic, greater reliability and lower turnover, in addition to their
commitment/engagement.6
Studies also identify older workers as productive and essential to U.S. employers. As an
example, a recent study reviewing the number and severity of production errors on an assembly
line over four years found no decline in productivity as individual workers aged.7 Instead,
employee productivity increased until age 65 simply due to a minimal number of severe errors
made on the assembly line. While the physical capabilities were a strong point of younger
workers, older workers’ strengths were their experience, knowledge, and quick decision-making
skills.
Key implications for employers: An engaged older workforce can influence and enhance
organizational productivity and generate improved business outcomes.
Experienced talent costs less than you think
Contrary to common perception, workers age 50+ do not cost significantly more than younger
workers. Shifting trends in reward and benefit programs mean that adding more age 50+ talent
to a workforce results in only minimal increases in hard dollar total labor costs. These trends
include a broad move by large employers to performance-based vs. tenure-based
compensation, the decline in traditional defined benefit pension plans, and the fact that health
care costs have increased more slowly for older workers than for younger workers over the past
decade.
A key objective of this study was to examine the incremental labor force costs associated with
hiring or retaining more workers age 50+ and comparing these costs to the value
considerations. To simplify the analysis, we focused on costs associated with four separate
positions in the energy, financial services, health care, and retail industries.

3
A Business Case for Workers Age 50+: A Look at the Value of Experience 2015
The first step in the cost analysis involved quantifying age- and service-related costs. The
second step involved quantifying the incremental costs associated with two different strategies
to fill vacant jobs: (1) a focused effort to retain more workers age 50+, and (2) a focused effort to
hire more workers age 50+.
For both recruitment and retention approaches, the following table shows the estimated impact
on total employee compensation. The impact of doubling the percentage of older workers in an
individual employer’s population is shown to have only a minimal impact on the total
compensation spend. Further, these minimal incremental costs may be more than offset by the
value that age 50+ workers bring to the table in the form of higher engagement, more
predictable turnover, and other key value differentiators.
Incremental Costs of Retaining and Recruiting More 50+ Workers
Estimated change in averagetotal compensation costs as aresult of:
Engineer(Energy)
SalesManager
(FinancialServices)
Nurse(HealthCare)
StoreManager(Retail)
Doubling the retention of workersage 55 with 20 years of service(from 20% to 40% of thecompany’s workforce)
2% 1% 1% 2%
Doubling the percentage of newhires age 55 (from 20% of newhires to 40% of new hires)
1% <1% <1% 1%
Source: Saratoga Institute, Bureau of Labor Statistics, and Aon Hewitt analysis. See Chapters 2 and 3 for moredetail.
Key implications for employers: Reward program trends have weakened the relationship
between age and labor costs in such a way that the costs of hiring and retaining workers can be
virtually age neutral.
Workers age 50+ expect to be in the workforce for some time and value both financialand non-financial offerings
One in three workers age 45+ expects to retire at age 66 or older, compared to just over one in
five 10 years ago.
Although current and future financial needs are a top reason that employees stay in the
workforce past age 50, psychological and social fulfillment also play a role. Workers age 50 and
older specifically state that they are driven by career aspiration and career opportunities.8 They
also value such non-financial offerings as flexible work arrangements.9
Key implications for employers: Employers that are able to present rewards and flexibility that
meet the needs of 50+ workers increase their ability to both recruit and retain this valuable
segment of the workforce.

4
A Business Case for Workers Age 50+: A Look at the Value of Experience 2015
Leading employers focus on the recruitment, retention, and engagement of employeesage 50+
Interviews conducted for this report with a select group of leading employers revealed three key
strategies that these organizations use to recruit and retain age 50+ workers: creating flexible
workplaces, focusing on options for transition to retirement, and fostering generational diversity
and inclusion.
Key implications for employers: Many large employers are finding that strategies aimed atretaining age 50+ employees are effective and worthwhile for their entire workforce.
Conclusion
Each chapter of this report presents compelling findings that support the business case for
attracting, engaging, and retaining age 50+ workers as a critical component of a multi-
generational workforce. In summary:
The rapid growth of the older workforce relative to younger workers will impact talent supply;
workers age 50+ can help employers address current and future talent shortages.
Workers age 50+ add value to organizations due to their high levels of engagement,
stability, productivity, and experience.
The market evolution in compensation and reward design over the past decade has created
a more age-neutral distribution of labor costs, meaning that the incremental costs
associated with retaining and recruiting more 50+ workers are minimal to nonexistent and
may be far outweighed by the value that these workers add.
Workers age 50+ want to be in the workforce and anticipate a longer working career, making
it critical for employers to understand the preferences of this group.
Best practices to recruit, retain, and engage workers age 50+ can be replicated by
employers of all sizes and across all industries.

5
A Business Case for Workers Age 50+: A Look at the Value of Experience 2015
Introduction
The Business Case for Workers Age 50+
The current business and talent environment is changing rapidly. With multiple generations in
the workforce, organizations need a fact-based approach to assess the value and cost of their
workforce strategies.
This study focuses on the business case for workers age 50+, also referred to throughout this
report as older workers and 50+ workers. It examines the financial and programmatic
implications of today’s multi-generational U.S. workforce, including the value of older workers as
part of an overall talent management strategy. Specifically, this material presents a quantitative
and qualitative business case for employers’ continued focus and investment in the attraction,
engagement and retention of workers age 50+ as an integral component of their workforce.
The first AARP-sponsored study on this topic was published in 2005. Because the economic
and demographic environments have changed significantly during the past 10 years, AARP
engaged Aon Hewitt to produce this new report and determine the strength of the business case
today. The report findings are clear: the business case for workers age 50+ remains strong,
and is even more compelling than in the past.
The findings counter misperceptions that older workers are significantly more costly and
establish that companies will benefit from the recruitment, engagement and retention of
older workers. Although the value and cost of an individual will vary based on factors other
than age, the report demonstrates that leveraging this segment of the workforce is a solution to
competing and excelling in a changing global environment.
Report Overview
Chapter 1 assesses the impact of demographics on labor force changes, with a review of which
factors are presently influencing the talent supply. These include age profiles, life expectancy
and the size of each generation in today’s population. As people are retiring later and living
longer, employers have new opportunities to leverage the skills and experience of older
workers.
Chapter 2 examines the value workers age 50+ bring to their employers, including higher levels
of engagement, increased workforce stability and lower rates of turnover. As these factors all
contribute to increased productivity and business performance, employers have concrete
measures to determine the incremental value of their older workers. Chapter 2 also highlights
compelling research on sustained productivity with age.
Chapter 3 outlines the economics of retaining and hiring workers age 50+ through an analysis
of labor costs by age, tenure and other factors. A detailed review of compensation and benefits,

6
A Business Case for Workers Age 50+: A Look at the Value of Experience 2015
including health care and retirement programs, illustrates cost differentials by program design.
Several examples help define the actual cost of both hiring and losing employees.
Chapter 4 reviews what workers age 50+ seek in an employer. The chapter addresses the
motivations of older workers for remaining in the workforce and the drivers of attraction and
engagement for this segment of employees. The data provide employers with the information to
help them offer the right programs to attract, engage and retain workers age 50+.
Chapter 5 describes how leading employers are effectively managing their multi-generational
workforces, including specific examples of practices and policies. All employers can learn from
these examples and implement practices of their own that are appropriate for their culture,
industry and size.
The Audience for This Business Case
This report was prepared primarily for business leaders, including CEOs, human resources
executives, and talent management executives of large Fortune 1000 U.S. companies,
employing 500 or more employees, as well as privately owned companies of a similar size, such
as large non-profit organizations and large U.S. subsidiaries of companies headquartered
outside of the U.S.
Although the primary audience is large employers, many mid-sized and smaller employers—
whether public or private— should also find the report relevant to their needs as they often face
the same pressures, obstacles and opportunities as large employers.
Why Focus on Larger Employers?
Large employers are leaders in the development of best practices in talent management
because they tend to have more resources to devote to developing and implementing new HR
policies and practices. Many smaller employers seek to emulate the HR programs established
by large employers. Although the number of large organizations with more than 500 employees
is fairly small, these organizations employ over half (52%) of all U.S. workers and, therefore,
have a significant influence on the U.S. workforce.10
Industry Focus
While virtually all sectors of the economy stand to be affected by demographic shifts in the
workforce, each industry faces its own set of challenges. To highlight some of the differences
between industries and to help quantify the business case for workers age 50+ with respect to
specific jobs, examples focus on four major industries: energy, financial services, health care
and retail.
These industries were chosen for their diverse set of business environments and workforce
challenges, including their size and importance to the economy, number of current and
anticipated jobs, and the share of workers who will be retirement-eligible within the next few
years. Health care is one of the fastest growing industries and is experiencing shortages of

7
A Business Case for Workers Age 50+: A Look at the Value of Experience 2015
talent. The energy industry typically has a long-service workforce and is facing the need to build
on existing infrastructure while implementing new technology solutions. Retail represents a
large proportion of the U.S. workforce, with a significant percentage of part-time workers and
above-average rates of turnover. The financial services sector represents a significant
percentage of gross domestic product, with business challenges that include slower growth and
fragmentation that requires a wide range of talent needs, from investment bankers to tellers and
call center employees.
Among these industries, energy and health care tend to have the largest percentages of
employees at or near the age of traditional retirement eligibility today (typically between ages 55
and 65). Financial services and retail have somewhat younger workforce profiles. However, the
overall demographic profile for a given industry (or company) does not solely determine the
workforce issues that the industry may face with regard to specific jobs or skills.
Despite the use of industry examples, the concepts discussed in this report apply to
organizations across a multitude of sectors. Employers in other industries can use the examples
of applying the business case as models for their own analysis. They may need to modify the
model; however, the approach described in this report should be a useful starting point for any
organization interested in exploring the business case for older workers.
Ultimately, the business case for investments to help attract, engage and retain workers age
50+ will vary between organizations and even positions, depending on such key factors as the
demographic profile of the organization’s current and available workforce, projected business
growth, rewards considerations (e.g., current and future programs sponsored by employers and
the impact on associated labor costs) and geographic differences.
Data Approach and References
This report leveraged a variety of data sources to conduct analysis on the financial and
programmatic implications of older workers. Except where otherwise noted, the research and
analyses are concentrated on evaluating available data from large organizations of 500 or more
employees. These analyses rely primarily on data from Aon Hewitt databases that include
thousands of employers and millions of U.S. workers. The employers in these databases are
primarily Fortune 1000 companies headquartered in the U.S. and similarly sized organizations
not included in the Fortune listing, such as large privately owned companies, nonprofit
organizations and large subsidiaries of companies headquartered outside the U.S.
In addition to analyzing data on large employers from Aon Hewitt databases, researchers
involved in this study also conducted interviews with 18 large employers to obtain anecdotal
accounts, scenarios and case studies regarding how they approach older workers.
Although many of the analyses and examples in the report focus on large employers in four
industries, researchers also conducted a literature review to draw on information from a broader
cross-section of U.S. workers and employers. The literature review examined findings from

8
A Business Case for Workers Age 50+: A Look at the Value of Experience 2015
AARP Staying Ahead of the Curve reports through the years, Aon Hewitt studies and research,
Current Population Survey (CPS) and Bureau of Labor Statistics data, and research and studies
from various well-respected institutions and journals, including Gallup, the Center for Retirement
Research at Boston College, the Society for Human Resource Management, and the Harvard
Business Review, among many others. All of these sources provided critical data in evaluating
the business case.

9
A Business Case for Workers Age 50+: A Look at the Value of Experience 2015
Chapter 1
Labor Force Supply and Demand
The age 50+ workforce is growing in both size and importance. This chapter explores the
impact of changing demographics on the labor force, and the opportunities it creates to leverage
the skills and experience of older workers. Specifically, this chapter addresses:
1. The aging of the U.S. population and its impact on the supply of talent.
2. Whether employers are finding the talent they need for current and future staffing
requirements.
The Changing Talent Supply
The number of Americans age 50+ who are working or looking for work (“labor force
participants”) has grown significantly over the past decade, and is expected to continue to
increase.
Exhibit 1-1 reflects the shift in the age of the workforce, which has coincided with the last of the
baby boomers turning age 50 in 2014. The shift reflects the overall aging of the U.S. population,
and the increases in the share of age 50+ adults who are remaining in the labor force.
The number of labor force participants ages 40 to 49 decreased by 6% from 2002 to 2012, while
those ages 50 to 59 and 60 to 69 grew by 28% and 72%, respectively.11 In fact, 35% of U.S.
labor force participants will be age 50+ in 2022. This compares to 25% in 2002. From 2002 to
2022, the number of workers under age 50 is projected to decrease by 3%, while the number of
workers age 50+ is expected to increase by 62%.
These data suggest that the number of workers age 50+ in the labor force may eventually
approach the number of younger workers. For example, in 2002, there were just four workers
age 50+ for every 10 workers ages 25 to 49. It is predicted that, in 2022, there will be nearly
seven age 50+ workers for every 10 workers ages 25 to 49.12

10
A Business Case for Workers Age 50+: A Look at the Value of Experience 2015
People Are Retiring Later and Living Longer
Retirement ages have increased over the past decade, which will support the continued
availability of the 50+ workforce. According to a 2015 analysis by the Center for Retirement
Research at Boston College, the average retirement ages among both men and women
increased from 2005 to 2013 despite occasional downturns. This includes an increase of one
year for men (from age 62.9 to 63.9) and approximately half a year for women (from age 61.2 to
61.9).13 (See Exhibit I-2.)
60.0
61.0
62.0
63.0
64.0
65.0
2005 2006 2007 2008 2009 2010 2011 2012 2013
Exhibit I-2Recent Trends in Average Retirement Age
Men
Women
Source: Alicia H. Munnell. 2015 "The Average Retirement Age - An Update," Issue in Brief 15-4. Chestnut Hill, MA:Center for Retirement Research at Boston College. ( "Average retirement age" is defined as the age at which thelabor force participation rate drops below 50%. Chart displays only part of the time period covered in the source.)
Ten Year Actual Change and Projected Ten Year Forecast of Labor Force Participants
Age
Growth
2002-2012
(Actual)
Growth
2012-2022
(Projected)
Total Labor
Force in
2012 (mill)
16-39 -3% 4% 70.4
40-49 -6% -6% 34.5
50-59 28% -2% 32.5
60-69 72% 40% 14.2
70+ 65% 89% 3.3
Labor Force Projections
Exhibit I-1
Source: Aon Hewitt analysis of Bureau of Labor Statistics (BLS) data, andMitra Toosi, Monthly Labor Review, December 2013.

11
A Business Case for Workers Age 50+: A Look at the Value of Experience 2015
The continued increase in average retirement age over the past decade is likely a reflection of
various dynamics, both financial and non-financial. Potential financial drivers include increases
in the Social Security full retirement age for individuals born after 193714 and changes in
employer-provided retirement benefits. (See Chapter 3 for a detailed discussion of these
changes.) Financial setbacks resulting from the recession represent another possible reason.
Another factor that may be influencing the continued increase in the average retirement age is
improved longevity. Life expectancy projections by the Society of Actuaries show that both men
and women retiring at age 65 in 2014 now need to plan for an additional three years of
retirement on average, compared to 2005.15 (See Exhibit I-3.) By staying employed longer,
workers age 50+ can save more and minimize the length of time over which they will need to
draw on their retirement assets.
Source: Aon Hewitt analysis based on Society of Actuaries Mortality Tables. 2005 life expectancy calculated using
RP-2000 table projected fully generational using scale AA; 2014 calculated using RP-2014 table projected fully generational using scale MP-2014
Regardless of the reasons why 50+ workers will remain in the labor force, they represent a
significant talent pool that can support employers’ long-term growth strategies, especially when
it comes to filling talent gaps.
Exhibit I-3
Remaining Life Expectancies, Males and Females, 2005 vs. 2014
Males 2005 2014 Increase
Age 55 29 32 9%
Age 65 19 22 15%
Age 75 11 14 22%
Females 2005 2014 Increase
Age 55 31 36 15%
Age 65 21 24 14%
Age 75 13 15 16%
Remaining Life Expectancies (in Years)

12
A Business Case for Workers Age 50+: A Look at the Value of Experience 2015
Employers Are Still Having Difficulties Filling Jobs
Talent supply and filling key roles is an ongoing challenge for employers. Although talent
shortfalls dropped during the Great Recession and for a time afterward, recent surveys of
employers suggest that many are facing talent shortages.
The 2014 ManpowerGroup Talent Shortage Survey, which included more than 1,000 U.S.
employers, found that 40% reported having difficulty filling jobs due to a lack of available talent.
(See Exhibit I-4.)
U.S. employers cited the lack of necessary skills as a key driver of the difficulty filling jobs.
Specifically, they report a talent gap due to:16
Candidates lacking technical competencies/hard skills (47%);
Candidates lacking workplace competencies/soft skills (39%); and
A lack of available candidates (36%).
Given that a lack of technical competencies is the top challenge, it is not surprising that many of
the most difficult-to-fill jobs require specialized skills. (See Exhibit 1-5.)
44%41%
22%19%
14%
52%49%
39%40%
0%
20%
40%
60%
2006 2007 2008 2009 2010 2011 2012 2013 2014
Exhibit I-4Percentage of Employers Having Difficulty Filling Jobs
Source: ManpowerGroup 2014 Talent Shortage Survey of 1,013 U. S. employers. For the 2014 survey, 40% ofU.S. employers on average reported having difficulty filling jobs due to a lack of available talent

13
A Business Case for Workers Age 50+: A Look at the Value of Experience 2015
Exhibit I-5Top 10 Jobs U.S. Employers Are Having Difficulty Filling
1. Skilled trades
2. Restaurant and hotel staff
3. Sales representatives
4. Teachers
5. Drivers
6. Accounting and finance staff
7. Laborers
8. IT staff
9. Engineers
10. Nurses
Source: ManpowerGroup 2014 Talent Shortage Survey of 1,013 U.S. employers.
Other recent surveys also highlight employers’ concerns related to skills shortages. For
example, in a survey of CEOs conducted in 2014, PricewaterhouseCoopers (PwC) found that
78% of U.S. CEOs expressed concern about the availability of key skills, up from 70% in the
prior year.17 Certain industries, such as manufacturing, are especially affected by shortages. In
fact, according to a 2014 study by Accenture, over 75 percent of manufacturing executives
stated that they are facing a moderate to severe shortage of skilled resources.18
Data suggest that the loss of age 50+ workers to retirement may be one reason for the skill
shortages. Certain industries, such as energy and health care, are experiencing more profound
talent shortages than others.
For example, according to 2013 Current Population Survey data, 22% (or 447,000) of engineers
in the U.S. are age 55+.19 As these workers approach retirement age, there may not be enough
new workforce entrants to replace their loss in key roles. Focused efforts to retain and recruit
older workers can mitigate these gaps.
Similarly, the health care industry is facing projected shortages of nurses and physicians.
According to projections released by Georgetown University in 2015, the U.S. faces a shortage
of 193,000 nursing professionals by 2020.20 Additionally, a 2015 report from The Association of
American Medical Colleges estimates that, by 2025, the U.S. will experience a shortfall of
anywhere from 46,100 to 90,400 physicians.21 Here again, recruitment and retention efforts
aimed at the 50+ workforce can help address this shortage.
14
A Business Case for Workers Age 50+: A Look at the Value of Experience 2015
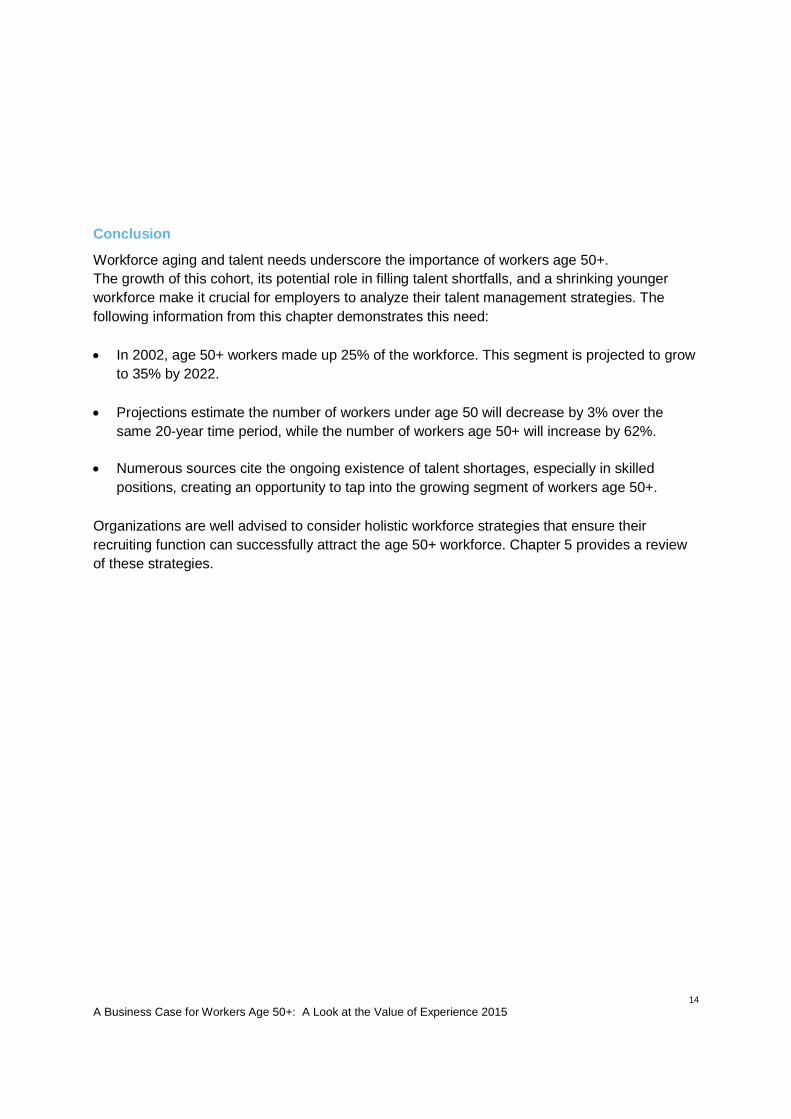
Conclusion
Workforce aging and talent needs underscore the importance of workers age 50+.
The growth of this cohort, its potential role in filling talent shortfalls, and a shrinking younger
workforce make it crucial for employers to analyze their talent management strategies. The
following information from this chapter demonstrates this need:
In 2002, age 50+ workers made up 25% of the workforce. This segment is projected to grow
to 35% by 2022.
Projections estimate the number of workers under age 50 will decrease by 3% over the
same 20-year time period, while the number of workers age 50+ will increase by 62%.
Numerous sources cite the ongoing existence of talent shortages, especially in skilled
positions, creating an opportunity to tap into the growing segment of workers age 50+.
Organizations are well advised to consider holistic workforce strategies that ensure their
recruiting function can successfully attract the age 50+ workforce. Chapter 5 provides a review
of these strategies.
15
A Business Case for Workers Age 50+: A Look at the Value of Experience 2015
Chapter 2
Workers Age 50+ Bring Value to Business
A workforce that includes engaged age 50+ workers can influence and enhance organizational
productivity and generate improved business outcomes. To demonstrate how capitalizing on the
engagement of age 50+ workers can benefit an entire organization, this chapter explores the
following:
1. The link between engagement, motivation, and age
2. The impact of engagement on business outcomes
3. The impact of workforce stability and turnover on the value equation
4. The link between productivity and age
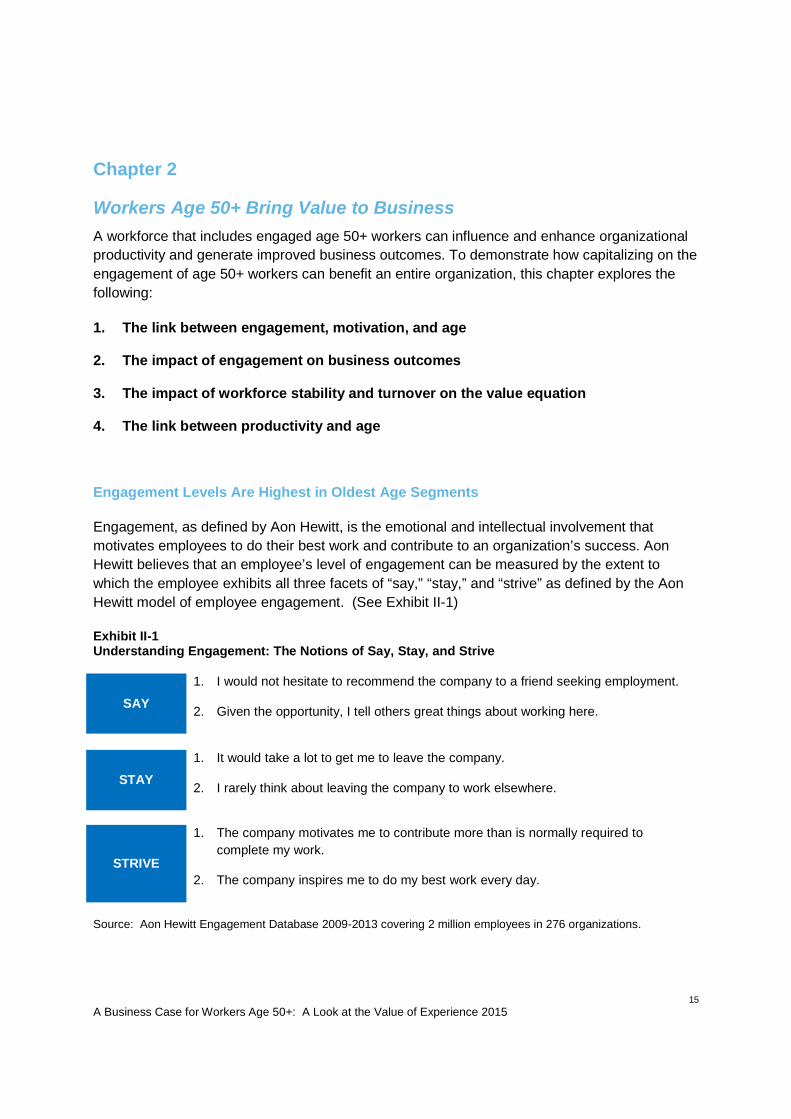
Engagement Levels Are Highest in Oldest Age Segments
Engagement, as defined by Aon Hewitt, is the emotional and intellectual involvement that
motivates employees to do their best work and contribute to an organization’s success. Aon
Hewitt believes that an employee’s level of engagement can be measured by the extent to
which the employee exhibits all three facets of “say,” “stay,” and “strive” as defined by the Aon
Hewitt model of employee engagement. (See Exhibit II-1)
Exhibit II-1Understanding Engagement: The Notions of Say, Stay, and Strive
SAY
1. I would not hesitate to recommend the company to a friend seeking employment.
2. Given the opportunity, I tell others great things about working here.
STAY
1. It would take a lot to get me to leave the company.
2. I rarely think about leaving the company to work elsewhere.
STRIVE
1. The company motivates me to contribute more than is normally required to
complete my work.
2. The company inspires me to do my best work every day.
Source: Aon Hewitt Engagement Database 2009-2013 covering 2 million employees in 276 organizations.

16
A Business Case for Workers Age 50+: A Look at the Value of Experience 2015
Engaged employees are inspired, proud of their employer, and emotionally connected to their
work. They:
Say: Consistently speak positively about the organization to coworkers, potential
candidates, and customers
Stay: Have an intense desire to be part of the organization
Strive: Exert extra effort and engage in behaviors that contribute to business success
Organizations that offer the benefits and culture that workers value and that monitor employee
engagement levels retain the most valuable and experienced talent. In addition to monitoring
engagement itself, these organizations use the results to identify talent problems and make
adjustments to policies and programs.
Engagement levels are important measurement tools for employers. Multiple studies, including
those by Aon Hewitt and Gallup, show that higher employee engagement correlates with
favorable movement in a range of financial, customer, and operational results.22
Aon Hewitt data show that the oldest age segments of the workforce are more likely to be
engaged than younger workers. For example, 65% of employees ages 55+ in large companies
are engaged, compared to less than 60% of employees under age 45.23 (See Exhibit II-2a.)
Although this gap may seem small, it represents a statistically significant difference in
engagement that can have a noticeable impact on business outcomes.

17
A Business Case for Workers Age 50+: A Look at the Value of Experience 2015
60%
58%
59%
60%
65%
54% 56% 58% 60% 62% 64% 66%
US Overall 25-34 35-44 45-54 55+
Exhibit ll-2aAverage Workforce Engagement Levels by Age Group
Source: Aon Hewitt Engagement Database 2009-2013 covering 2M employees in 276organizations.
78%
76%
77%
77%
81%
72% 74% 76% 78% 80% 82%
US Overall 25-34 35-44 45-54 55+
Source: Aon Hewitt Engagement Database 2009-2013 covering 2M employees in 276organizations
Exhibit ll-2bAverage Workforce Motivation Levels by Age Group

18
A Business Case for Workers Age 50+: A Look at the Value of Experience 2015
In addition to being the most highly engaged age cohort in the labor force, workers age 55+ are
also the most motivated. As Exhibit II-2b reflects, 81% of workers age 55+ are “motivated”—
meaning they say that they exert extra effort and contribute more than is normally required in
their job—compared to 76% of their age 25-34 peers.24
What’s driving these higher levels of engagement and motivation? Workers age 45 -74
generally feel that they are continuing to grow in their careers and derive personal satisfaction
from their work. For example, AARP research shows that 83% feel their jobs are an important
part of who they are.25 (See Exhibit II-3.)
Furthermore, a Pew Research Center survey found that working for non-financial reasons, such
as job enjoyment or the desire to be productive, also increases with age. Although financial
motivations are certainly a factor in workers staying in the workforce longer today, 54% of
workers ages 65+ said they currently work because they want to and not because they need the
money. This is compared to only 20% of workers age 16-64 responding that they currently work
for non-financial reaons.26
Engagement Is Positively Correlated with Business Results
Organizations look for a return on their investment in their people—just like with any investment
they make—and examine how it corresponds to their bottom line. The fact that employee
engagement increases for the oldest age segments remains an important factor in the business
case for employers, and links productivity to age.
66%
57%
48%
54%
25%
26%
31%
33%
0% 50% 100%
I am proud to work for the company thatemploys me
My job is an important part of who I am
There is a lot I still plan to accomplish in mywork
I am continuing to grow in my work
Exhibit ll-3Job Growth and Satisfaction Among Workers 45-74
Strongly Agree Somewhat Agree
Source: Staying Ahead of the Curve 2013: The AARP Work and Career Study; National survey of adults age45-74 who were working or looking for work. 1,315 employed adults responded to the questions above.

19
A Business Case for Workers Age 50+: A Look at the Value of Experience 2015
Specifically, employers with the highest employee engagement results have been shown to
outperform employers with average engagement results by 6% in sales growth, 4% in operating
margin, and 6% in total shareholder return.27 Even changes of 3% to 5% in employee
engagement make a difference. For example, a 5% increase in engagement levels has been
shown to increase revenue within organizations by 3%.28
To understand the actual financial impact of higher employee engagement, consider this
example:
A company with average engagement that has $5 billion in sales, $800 million in operating
margin, and $400 million in total shareholder return, may be able to achieve a $300 million
increase in sales, a $32 million improvement in operating margin, and a $24 million
improvement in total shareholder return—if the company improves engagement to best-
employer levels.
Research by Gallup also identified a positive correlation between employee engagement and
improved financial outcomes, regardless of the economic climate.29 They found that business or
work units that scored in the top quartile on employee engagement are 21% more productive,
have 22% higher profitability, and experience 37% less absenteeism when compared to those in
the bottom quartile.30 This means a highly engaged workforce often creates sustained
productivity and innovation that leads to stronger business results.
The Value of Stability and Lower Turnover
Organizations with top-quartile engagement levels in the U.S. experience 50% lower turnover
than those with average engagement levels. These same employers also receive twice as many
job applications. This likely reflects the fact that engaged employees are more likely to speak
highly of their employer and refer job seekers.31 High engagement among existing employees
not only helps attract candidates but also creates a desirable place to work. It makes it possible
for employers to build engagement with employees from before they are hired through the end
of their career.
Predictable Turnover
Highly engaged employees are 36% more likely to stay with their current employer. This means
turnover for older workers tends to be more planned and predictable.32
Turnover is often categorized in one of two ways—turnover for which employers are able to plan
(“planned” turnover) or turnover for which employers are unable to plan (“unplanned” turnover).
The primary “planned” turnover employers experience is when employees retire. In planned
turnover, employees often give at least three to six months’ notice—and sometimes a year or
more. This provides organizations with the time to plan for who will take on the role, transfer the
knowledge, and hire and onboard the new person before the employee leaves. Effective

20
A Business Case for Workers Age 50+: A Look at the Value of Experience 2015
knowledge transfer and appropriate training maximize productivity and facilitate business
continuity.
With “unplanned” turnover, the employee resigns typically with no more than two weeks notice.
This creates a storm of activity to figure out how the work will be completed and who will take it
on. It does not allow for proper overlap and onboarding of the successor.
The Aon Hewitt Engagement data illustrate that 50+ workers value stability and are less likely
than younger workers to be in the market looking for other jobs. This presents less of a risk for
employers in the form of unplanned turnover.
Nearly half of employees (49%) under age 50 may pose a risk of unplanned turnover to their
employers: 39% say they would consider other jobs and another 10% are actively looking for a
job. For workers age 50+, only 29% represent a risk of unplanned turnover, with 24% as
passive job seekers who say they would consider other jobs and only 5% actively looking for
new work. (See Exhibit II-4.) Overall, these data suggest that workers ages 50+ are 40% less
likely than younger workers to engage in unplanned turnover (29% vs. 49%).
0%
20%
40%
60%
No plans toleave
Not looking butwould consideranother offer
Activelylooking
Made plans toleave
Plan to retire innext few years
Exhibit ll-4Employee Reported Intention to Stay
Less than 50
50 or Older
Source: Aon Hewitt Engagement Database 2009-2013; 2014 analysis of Aon Hewittnormative survey data covering 2 million employees in 276 organizations

21
A Business Case for Workers Age 50+: A Look at the Value of Experience 2015
The Value of Minimizing Unplanned Turnover
The cost of hiring a new employee can include advertising, employment agency or recruiting
agency fees, referral bonuses offered to current employees, and travel and relocation packages,
in addition to the cost of internal recruiting functions. The cost to onboard a new employee can
include orientation, training, and reduced productivity during the first several weeks of
employment.
Losing an employee can have an additional impact beyond hard dollar costs. Often, employee
productivity drops within the last weeks or months on the job. Productivity loss also occurs
during the time an employer is trying to fill the position. This reflects not only the direct loss in
productivity stemming from the vacant position but also a decline in the productivity of others
who relied on that individual for support in their roles. The remaining employees, who may not
have the requisite experience to handle the additional tasks with proficiency, often take longer to
do the work and ultimately deliver inferior results. While employers incur some of these costs for
retirees, advance notice minimizes them. This allows for the use of optimal recruiting channels
and better training.
It is difficult to accurately quantify the value of avoiding unplanned turnover, especially given the
variability across industries, positions, and in individual performance. Nevertheless, many
organizations will conclude that avoiding unwanted attrition creates value that exceeds the
incremental cost of retaining an experienced, high-performing employee.
The analysis in Exhibits II-5a and 5b illustrates the value of avoiding the replacement of a single
employee in the energy, financial services, health care, and retail industries. The most
significant drivers of turnover costs are training and onboarding new employees as well as the
inefficiencies from the vacant position.
Retaining older workers reduces the one-time costs of turnover that range from $7,400-$31,700
or more per employee. Planned turnover from retirements minimizes these costs because the
employer can use the most efficient sourcing channels and better onboarding processes, and
avoid the position vacancy. Therefore, planned turnover typically results in costs at the lower
end of this range. This allows employers to invest in greater value-add activities and not in
undesired workforce churn. In fact, unplanned turnover may cost 1.5 to 2 times more than
planned turnover.33

22
A Business Case for Workers Age 50+: A Look at the Value of Experience 2015
Exhibit II-5a
How Avoiding Turnover Creates Value
Source ofSavings/Value
Description Source of Data or Assumptions
Avoided HiringExpenses
Advertising costs, agencycosts, travel and interviewcosts, relocation costs,referral bonus costs, andrecruiter compensation
Saratoga Institute benchmark data byindustry. If industry-specific benchmarkdata was not available, this wasestimated using Saratoga Institute’soverall benchmark data.
Avoided Costs ofNew Employee*
Orientation costs andreduced productivity of newemployee
Orientation costs estimated at two daysof compensation. Reduced productivityof 40% assumed for first 12 weeks onjob.
AvoidedInefficiency ofDepartingEmployee
Inefficiencies while departingemployee searches for a newjob
Inefficiency estimated at 15% ofcompensation during time spentsearching for new job. Time searchingfor new job from Saratoga Institutebenchmark data.
AvoidedInefficiency ofVacant Position
Inefficiencies while position isvacant
Inefficiency estimated at 75% ofcompensation during time job is vacant.Time position left vacant from SaratogaInstitute benchmark data.
*The analysis assumes that ongoing training costs would be the same for workers across all age groups. As a result,no attempt was made to estimate training costs, other than the inclusion of new hire orientation expenses.
Exhibit II-5b
Value Created by Avoiding Turnover of a Single Employee by Industry
Type of Savings/Value Energy Financial Health Care Retail
Avoided HiringExpenses
$1,900 $3,200 $900 $500
Avoided Cost of NewEmployee
$11,000 $11,000 $6,600 $3,700
Avoided Inefficiencyof DepartingEmployee
$1,900 $2,000 $1,200 $700
Avoided Inefficiencyof Vacant Position
$16,900 $12,300 $9,100 $2,500
Total Potential Valueof Avoiding Turnover
$31,700 $28,500 $17,800 $7,400
Sources: Compensation used is median salary from Bureau of Labor Statistics May 2012 Occupational OutlookHandbook – salary brought forward to 2013 assuming 3% increase from May 2012. Hiring dollars for energy andretail industries were estimated using Saratoga Institute’s overall benchmark data.

23
A Business Case for Workers Age 50+: A Look at the Value of Experience 2015
50+ Workers Increasingly Embrace Technology
A common misperception about age 50+ workers is that they are unable to use or learn new
technology. However, the number using computers and online technology is high and continues
to grow. For example, a 2014 AARP survey found that 91% of workers ages 50+ have a
computer, tablet, or smartphone and that the share of workers ages 50+ who use such devices
has grown considerably over the past three years. For example, in 2014, 64% of workers ages
50+ had a smartphone and 41% had a tablet, compared to 29% and 11%, respectively in
2011.34
Additionally, workers age 50+ are increasingly using their devices to surf the Web and access
social media. For example, in 2014, 85% of workers ages 50+ said that they surf the Web using
their computer, tablet, or smartphone (up from 79% in 2011); while 66% access social
networking sites such as Facebook, Twitter, or LinkedIn using their devices (up from 44% in
2011).35
Further, authors of an article, “Is Programming Knowledge Related to Age?” found a positive
relationship between age and reputation as measured by scores assigned to computer
programmers in an online forum. On average, computer programmers in their 50s who used an
online programmers’ discussion forum had higher “reputation” scores than younger users.
Based on peer feedback, each user’s reputation score reflected subject matter expertise,
respect from peers, and familiarity with the site. Higher scores of older programmers support the
idea that older employees can be just as knowledgeable, if not more so, than younger ones in
technical areas such as computer programming.36
Moreover, interest by adults age 50+ in learning new skills and in growing their careers presents
opportunities for greater exposure to—and willingness to try—new technology. For example, out
of the 12,000 U.S. students who enrolled and completed a full lecture in a Massive Online Open
Course (MOOC) offered by the University of Pennsylvania, 39% were over age 50.37 In fact,
according to an AARP survey, the majority of workers age 50+ are interested in training
opportunities to stay abreast of technological advances and do not feel that they have trouble
keeping up with the new technology needed for their job. Specifically, 79% of workers age 50+
indicated that they would be interested in taking training related to computers and information/
communication technology. Just 19% of 50+ workers feel that they are having trouble keeping
up with new technology required to do their jobs.38 Additionally, a survey of lower-wage workers
by The Associated Press-NORC Center for Public Affairs Research reveals that, of lower-wage
workers over age 50 whose employers offer online training opportunities, over half (60%) have
taken advantage of this online training.39
Productivity Can Increase with Age
Research shows worker productivity can increase through experience and job tenure, meaning
that workers over 50 are likely to be at least as productive, if not more so, than less
experienced, younger workers. This holds true even in relatively physical jobs.

24
A Business Case for Workers Age 50+: A Look at the Value of Experience 2015
As an example, researchers in a recent study reviewed the number and severity of production
errors on an assembly line over four years.40 Despite the work requiring physical strength,
dexterity, and agility (all of which generally biometrically deteriorate with age), there was no
decline in productivity as individual workers aged. Instead, employee productivity increased until
age 65 simply due to a minimal number of severe errors made on the assembly line. While the
physical capabilities were a strong point of younger workers, older workers’ strengths were their
experience, knowledge, and quick decision-making skills.
In addition, a University of Michigan study on older workers’ contributions to the economy and
technological progress found that an aging workforce results in net gains in the efficiency of the
total labor force. In other words, as the average age of the workforce increases, the overall
workforce is more productive.41
An “Employer Attitudes Towards Older Workers Survey” by the Center for Retirement Research
at Boston College supports the idea that older workers are generally perceived in the workplace
as at least as productive, if not more productive, than younger workers. In the survey, 56% of
respondents characterized white-collar older workers as more productive, while only 6%
characterized them as less productive.42 While the research found perceived added costs of
older workers in the workplace, the vast majority of respondents stated that older workers are
“as attractive” or “more attractive” than younger workers, acknowledging the value of older
workers’ contributions.
50+ Talent Is a Key Ingredient in a High-Performing Workforce
Value from employees can come in many forms, including innovation, business savvy,
management skills, knowledge, and maturity. These are many of the ways in which older
workers have a positive impact in the workplace.
A Wall Street Journal article, “There’s No Age Requirement for Innovation,” discussed the need
for balance in a multi-generational workforce, as “we need both old and young working together”
for innovation. The article pointed to younger workers as well-equipped to drive technologies,
and older workers as bringing maturity, real-world knowledge, and business skills.43
Another value of workers age 50+ comes from their impact on the rest of the employee
population. For example the high engagement, motivation, and experience of older workers can
help cultivate a more positive and effective work environment, enhancing organizational
productivity and business outcomes.44
Some analysts have expressed concern that the increase in workers age 50+ remaining in the
workforce could usurp or jeopardize opportunities for younger workers. However, empirical
evidence does not support this “lump of labor” theory. Instead, in analyzing data from the
Current Population Survey from 1977 to 2011, the Center for Retirement Research at Boston
College found that increased employment of older workers is associated with gains for younger

25
A Business Case for Workers Age 50+: A Look at the Value of Experience 2015
workers, including increased employment, declining unemployment, and increased wages.45
Previous studies, including one by the National Bureau of Economic Research, have been
unable to find clear evidence that increased employment of older workers leads to less
employment of younger workers.46
Employers Recognize the Value of Workers 50+ and the Risks of Lost Knowledge
According to a 2014 SHRM survey, the majority of HR professionals indicated that the main
advantages of older workers include:47
More work experience (77%)
Greater maturity/professionalism (71%)
Stronger work ethic (70%)
Ability to serve as mentors (63%)
Greater reliability (59%)
Greater loyalty (52%)
Lower turnover (52%)
Tacit knowledge that is not easily recorded or disseminated (51%)
Commitment/engagement (51%)
Furthermore, in a 2014 Transamerica survey of more than 700 employers, respondents
overwhelmingly refer to older workers as valuable resources, citing their knowledge and
experience. The employers most commonly note the following perceptions of older workers:48
Valuable resource for training and mentoring (87%)
Important source of institutional knowledge (86%)
More knowledge, wisdom, and life experience (82%)
More responsible, reliable, and dependable (69%)
More adept at problem solving (59%)
A mere 4% of employers surveyed consider workers age 50+ to be “less productive” than
younger workers.49 Although 57% of the employers surveyed believe that health care costs are
higher for workers in this age group, the large share of employers associating these positive
attributes with older workers suggests that their value is nevertheless widely acknowledged.
In fact, 88% of the employers surveyed by Transamerica are supportive of employees working
past age 65 and delaying retirement.50 And a 2010 AARP survey of over 1,000 HR directors at
companies with at least 20 employees found that nearly two-thirds are concerned about losing
knowledge and critical experience as older workers retire. This includes 24% who are very
concerned and 39% who are somewhat concerned. 51
Furthermore, the 2014 SHRM survey of HR professionals suggests that the majority recognize
the risks to their business over the long term of not having a plan to manage an older workforce,
including lost knowledge and potential loss of productivity as older workers retire, which could

26
A Business Case for Workers Age 50+: A Look at the Value of Experience 2015
affect the bottom line. However, HR professionals are somewhat less likely to view the
departure of older workers as a short-term risk. For example, 39% of HR professionals think that
the potential loss of talent resulting from the retirement or departure of older workers over the
next 11-20 years represents either a “crisis” or a “problem” for their organization and another
34% describe it as a “potential problem.” In contrast, over the next 3-5 years, just over a quarter
(27%) of HR professionals expect that the departure of older workers will be a “crisis” or a
“problem” while another 38% describe it as a “potential problem.” Just 28% describe loss of
talent as “not a problem” for their organization in the next 11-20 years, while 35% describe it as
“not a problem” in the next 3-5 years.
Even though the majority of HR professionals acknowledge that older worker departures pose
organizational risks over the long term, few have analyzed the impact of older workers leaving.
For example, only 31% have analyzed the impact of older worker departures over the next 3-5
years and just 17% have examined this over the next 6-10 years. Although more general
workforce planning to identify “potential skills gaps” and “future workforce needs” is more
common than efforts to analyze the impact of older worker departures, general planning beyond
the next 1-2 years is still fairly uncommon. Only about one in five HR professionals indicated
that their organization has conducted a strategic workforce planning assessment to identify their
future workforce needs or potential skills gaps in the next 6-10 years. (See Exhibit II-6.)52
Percentages represent the percent of HR professionals who indicated their organization has conducted a strategicworkforce planning assessment for each of the above purposes.Source: Society for Human Resource Management. The Aging Workforce -- State of Older Workers in U.S.Organizations. (Reflects results from SHRM’s 2014 Older Workers Survey, which included responses of more than1,900 randomly selected HR professionals from SHRM’s membership.)
35%
58%52%
31%
44%39%
17%21% 20%
Analyze the impact of workersage 55+ leaving your
organization
Identify your future workforceneeds
Identify your potential skills gaps
1-2 years 3-5 years 6-10 years
n=1,551-1,651 n=1,542-1,691 n=1,529-1,666
Exhibit II-6: Organizations’ Limited Use of Longer-Term Workforce Planning

27
A Business Case for Workers Age 50+: A Look at the Value of Experience 2015
Although many employers have not taken concrete steps to prepare for the aging of theworkforce, some have made relatively small investments that have created work environmentsconducive to older workers, ultimately enhancing workforce productivity and businessoutcomes. (See Chapter 5 for more information.)
Conclusion
The data and analysis presented in this chapter lead to the conclusion that workers age 50+add value to organizations due to high levels of engagement, stability, productivity, andinnovation. These key findings support this conclusion:
Older worker engagement levels are higher than other cohorts.
Engagement is positively correlated with improved business results.
50+ worker turnover tends to be planned and is more predictable, generating savings andvalue to employers.
Unplanned turnover—more common among younger employees—is more costly thanplanned turnover.
Research suggests that productivity does not decline with age and may even increase.
28
A Business Case for Workers Age 50+: A Look at the Value of Experience 2015
Chapter 3
Experienced Talent Costs Less than You Think
To evaluate the business case for workers age 50+, organizations must examine not only the
economic value but also the associated costs of employing this cohort. To address whether
costs are age-related and whether workers age 50+ are universally more expensive, this
chapter outlines the drivers of labor cost and examines the impact of age.53
Specifically, this chapter focuses on:
1. How labor costs (compensation and benefits) vary by age, tenure or other factors and
trends over time.
2. How trends in health care affect the business case economics.
3. The financial impact of hiring or retaining older workers.

29
A Business Case for Workers Age 50+: A Look at the Value of Experience 2015
A Review of Overall Labor Costs for a Multi-Generational Workforce
The key drivers of labor costs include both annual costs associated with rewards programs and
one-time costs associated with employee turnover. (See Exhibit III-1.)
Exhibit III-1: Key Drivers of Labor Cost
Annual rewards continue to be the biggest drivers of labor costs. Specifically, cash
compensation, health care, retirement and paid time off benefits comprise 98% of total
compensation costs in large U.S. companies.54 This amount has remained consistent,
increasing only slightly from 97% eight years ago.55 Further, although increasing health care
costs have made national headlines, the share of large employers’ annual rewards costs
allocated to employee benefits has remained fairly similar over time. (See Exhibit III-2.)
While the overall allocation of compensation costs has remained steady, compensation and
reward design have evolved toward a more age-neutral distribution of costs.
Cash compensation: 90% of large companies now use performance-based variable
compensation rather than only tenure-based compensation, an increase from 78% in
2005.56 This creates a linkage between individual performance and compensation rather
than length of service and compensation.
Retirement benefits: Only 22% of large companies currently offer a defined benefit
pension plan, down from 68% in 2004.57 Defined contribution plans such as 401(k)s, which
have largely replaced defined benefit plans, provide employer contributions based on a
percentage of salary and are rarely tied to age or tenure.58
Health care coverage: Cost increases over roughly the same time period have risen more
slowly for workers age 50+ than for younger workers. According to the most recent data
available on large employers’ health care costs, average annual medical claims costs
increased at a rate of 4% to 7% for 50- to 64-year-olds from 2003 to 2011, less than the
7% to 8% cost increase for 25- to 49-year-olds.59 The slower pace of health care cost
increases for older workers and other changes in health care are diminishing some of the
effects of workforce age on employer-paid health care costs.
These three trends have weakened the relationship between age and labor costs over the past
decade. The result is that an experienced professional age 50+ won’t necessarily cost more
than a younger employee.
Key Drivers of Labor Cost
Annual Costs
Cash Compensation
Retirement
Health Care
Paid Time Off
One-Time Costs
New Employee Costs
Departing EmployeeCosts

30
A Business Case for Workers Age 50+: A Look at the Value of Experience 2015
The remainder of this chapter explores each of these cost shifts in more detail and then
presents an analysis of the costs associated with recruiting and retaining more workers age
50+.
Cash Compensation Is Increasingly Age-Neutral
Cash compensation remains the single largest driver of total rewards cost, comprising 74% of
the total rewards spend.60 However, while the perception is that older workers automatically
command higher levels of pay, data show that compensation is not directly correlated to age
alone.
Cross-sectional data indicate that certain elements of cash compensation, primarily base pay,
do generally increase with age until employees reach between 45 and 50 years old. For workers
age 50 and older in the health care, retail, and financial services industries, overall cash
compensation begins to flatten or trend downward rather than continue on an upward path. The
energy industry bucks this trend, with a continued rise in cash compensation into retirement.
(See Exhibit III-3.) This is likely due to the fact that the energy industry pays a premium for
company-specific skills and knowledge when compared with other industries.
74% 74%
10% 10%
9% 8%5% 5%2% 3%
0%
20%
40%
60%
80%
100%
2013 2005
Cash Compensation Health Care Paid Time Off Retirement Other
Source: 2013: Aon Hewitt Benefit Index Database and Aon Hewitt Analysis. The 2013 database containssalaried benefit information for 689 major U.S. organizations, including 28 in the energy/oil/mining industry, 98in financial services, 23 in health care, and 37 in retail. 2005: 2005 Towers Perrin Benval database, as shownin the 2005 AARP Business Case for Workers Age 50+ report.
Exhibit lll-2Allocation of Reward Costs in Large U.S. Companies Remains Largely Unchanged

31
A Business Case for Workers Age 50+: A Look at the Value of Experience 2015
The downward trend in cash compensation for older workers in retail, health care, and financial
services may be a reflection of changes in roles or schedules (such as shifts to part-time
employment or roles with less responsibility, or transitioning into retirement) or the achievement
of certain milestones (such as reaching maximums in salary ranges). A more thorough analysis,
though, reveals that compensation and length of service are more closely correlated than are
compensation and age. The more experience an individual has in a role, generally speaking, the
greater the level of competency and proficiency and the higher the compensation.
Among large employers overall, cash compensation generally increases with service until about
30 years of service. (See Exhibit III-4.) The financial and health care industries see gradual
drop-offs in cash compensation starting after 15 to 19 years of service with steeper drop offs
after 25 to 30 years of service.
$0
$20,000
$40,000
$60,000
$80,000
$100,000
$120,000
<20 20-24 25-29 30-34 35-39 40-44 45-49 50-54 55-59 60-64 65-69 70+
Banking/Finance
Healthcare/MedicalServicesRetail
Utilities/Energy
AllEmployers
Exhibit III-3Cash Compensation by Age and Industry Across Large Employers
Source: 2013 Aon Hewitt Universe Benchmark data, which covers 104 companies (with a total of 3.5 million employees)that are Human Resources Outsourcing clients of Aon Hewitt. This includes 1.8M employees in the four industries (100Kenergy, 370K financial, 125K health care, 1.2M retail).

32
A Business Case for Workers Age 50+: A Look at the Value of Experience 2015
The Shift to Variable Compensation Continues to Level the Playing Field
Over the past two decades, an increasing number of large employers have shifted to
compensation structures that are based in part on performance. In 1992, 61% of large
employers surveyed offered such performance-based, or variable, pay. A decade later, this
increased to 80%. By 2012, nine out of10 large employers maintained such performance-based
compensation structures. (See Exhibit III-5.)
$0
$20,000
$40,000
$60,000
$80,000
$100,000
$120,000
0-4 5-9 10-14 15-19 20-24 25-29 30-34 35-39 40+
Banking/Finance
Healthcare/MedicalServices
Retail
Utilities/Energy
All Employers
Exhibit III-4
Cash Compensation by Years of Service and Industry Across Large Employers
Source: 2013 Aon Hewitt Universe Benchmarking data, which covers 104 companies (with a total of 3.5 millionemployees) that are Human Resources Outsourcing clients of Aon Hewitt. This includes 1.8M employees in the fourindustries (100K energy, 370K financial, 125K health care, 1.2M retail).

33
A Business Case for Workers Age 50+: A Look at the Value of Experience 2015
While variable pay programs differ by industry and role (e.g., a sales representative for a
pharmaceutical company might receive variable pay as a percentage of individual sales,
whereas a sales manager may receive variable pay as a percentage of the company’s total
sales), they are generally designed for a single purpose: to reward employees for actual
performance against set goals and measures. These programs enable employers to
differentiate pay and reward top performers regardless of age or tenure.
This trend toward variable pay tends to level the playing field for workers across all ages.
Employee Benefit Costs Reflect Weaker Correlation with Age over Time
As in the case of cash compensation, the annual cost of employee benefit programs also is
becoming more age-neutral. To understand this dynamic, it is important to first review actual
total costs for employee benefits. (See Exhibit III-6.)
61%
80%
90%
1992 2002 2012
Source: Aon Hewitt U.S. Salary Increase Survey 1992-2012. 36th annual survey focuses on overall changes inemployee compensation for the calendar year 2012. Information was collected during June and July from 1,306organizations. Participants included 788 service organizations, 508 manufacturing organizations, and 10 multi-industry organizations.
Exhibit lll-5Percent of Large Organizations with Performance-Based Pay

34
A Business Case for Workers Age 50+: A Look at the Value of Experience 2015
While the share of benefit costs attributable to health care coverage for employees and their
covered family members has risen somewhat—from 33% in 2006 to 36% of total annual benefit
cost currently—the cost of retirement benefits has noticeably declined from 26% to 20% of total
benefit spend during that same period. (See Exhibit III-6.) Paid time off continues to represent
more than a third of total benefit spend. (Note that shifts in the share of total benefit spend
attributable to health benefits and retirement benefits are more evident in Exhibit III-6 than in
Exhibit III-2. This is because Exhibit III-6 focuses only on benefits and excludes cash
compensation.)
33%
26%
34%
7%
2006
Health Care
Retirement
Paid Time Off
Other
Exhibit lll-6Breakdown Of Employee Benefits Costs Paid by Large Employers:
2006 vs. 2013
36%
20%
36%
8%
2013
Health Care
Retirement
Paid Time Off
Other
Source: Aon Hewitt Benefit Index Database. The 2013 (2006 “n” sizes in parenthesis) databasecontains salaried benefit information for 689 (609) major U.S. organizations, including 28 (24) in theenergy/oil/ mining industry, 98 (88) in financial services, 23 (23) in health care, and 37 (39) in theretail industry. Health care percent shown includes a small amount of retiree health based or theexpected value of the benefits earned in a year.

35
A Business Case for Workers Age 50+: A Look at the Value of Experience 2015
Although the distribution of total benefit costs has shifted over time, the total combined dollar
value of health care, retirement, paid time off and other benefit programs has increased overall
and varies considerably by industry. For example, in 2013, employer costs for these benefits
ranged from an average of $20,279 (in the retail industry) to $28,403 (in the energy industry).
These same costs in 2006 were $17,992 and $23,111, respectively. (See Exhibit III-7.)
$6,980
$7,069
$7,301
$6,404
$7,246
$7,741
$6,020
$4,145
$3,467
$5,728
$7,150
$7,656
$7,361
$6,525
$7,395
$1,240
$1,498
$1,526
$1,596
$1,520
$0 $5,000 $10,000 $15,000 $20,000 $25,000
Energy
Financial Services
Health Care
Retail
Large ER Overall
2006 Benefit Costs
Healthcare Retirement Paid Time Off Other
Exhibit lll-7Costs of Average Employer-Provided Benefits for Large Employers:
2006 vs. 2013
$9,849
$9,036
$8,429
$7,686
$9,386
$7,675
$5,429
$3,795
$2,800
$5,229
$8,801
$9,571
$9,301
$8,159
$9,190
$2,078
$1,977
$1,682
$1,634
$1,924
$0 $5,000 $10,000 $15,000 $20,000 $25,000 $30,000
Energy
Financial Services
Health Care
Retail
Large ER Overall
2013 Benefit Costs
Healthcare Retirement Paid Time Off Other
Source: Aon Hewitt Benefit Index Database. The 2013 (2006 “n” sizes in parenthesis) database contains salaried benefitinformation for 689 (609) major U.S. organizations, including 28 (24) in the energy/oil/ mining industry, 98 (88) in financialservices, 23 (23) in health care, and 37 (39) in the retail industry.

36
A Business Case for Workers Age 50+: A Look at the Value of Experience 2015
Of the four industries focused on in this report, the energy sector generally has the richest
employee benefit programs—and in particular, significantly higher-value retirement benefits.
The value of employee benefit programs in the finance industry follows, with health care and
retail lagging behind.
This review of benefit cost shifts since 2006 shows that health care costs, paid time off costs,
and the costs of other benefits increased across all industries, while retirement benefits actually
decreased. This decline in retirement benefit costs took place across large employers overall
and within each of the four industries despite the considerable difference in the value of
retirement benefits by industry. The reduction in retirement benefit costs partially offset the cost
increases of the other key benefits.
Health Care Costs Increased Steadily,Though Workers Age 50+ Saw Slower Rates of IncreaseHealth care costs for both employers and employees have increased steadily in the last decade
across all age groups. While the Consumer Price Index, the most common measure of inflation,
increased by 2.3% per year during this time period, total medical expenses per employee grew
at a rate of 6.2% per year.61 The employer-paid portion of health care coverage grew at an
average of 5.3% per year, which would seem to indicate that employers are shifting more of the
cost to employees, a hypothesis borne out by the fact that the annual increase in the employee-
paid portion was even greater, at an average of 8.3%.62
Despite the rapid increase in employee-paid costs, employers continue to pay the majority of
the total cost of health care.63
Although health care costs are increasing for all age groups, the latest data show that the rate of
health care cost increases for workers age 50+ is slower than for their younger counterparts.
(See Exhibit III-8.) While cost increases per year averaged 8% for employees ages 30-39, the
annual increase dropped to 6.6% for workers ages 50-54. The increase was even smaller for
employees ages 55-64. This is due to a fall in the prevalence of certain high cost diseases—in
particular, cardiac conditions—among those ages 50-65. Better diagnostic care, drug solutions,
and better general health are also contributing to the shrinkage in cost.64

37
A Business Case for Workers Age 50+: A Look at the Value of Experience 2015
This analysis demonstrates a weakening of the correlation between age and health care costs.
Claims data from 2011 show that actual company-paid claims for employees age 50 to 65 were
1.1 to 1.8 times the dollar value of claims for workers in their 30s and 40s.65 (See Exhibit III-9.)
In contrast, in 2003, company-paid claims for employees age 50 to 65 were 1.2 to 2.4 times the
dollar value of claims for workers in their 30s and 40s.66 So while the absolute level of cost for
workers age 50+ is higher than for younger workers, the difference in health care costs for older
vs. younger employees is shrinking.
7.3%
8.0% 8.0% 7.9%7.5%
6.6%
5.7%
4.1%
0%
1%
2%
3%
4%
5%
6%
7%
8%
9%
25-29 30-34 35-39 40-44 45-49 50-54 55-59 60-64
Age of Covered Employee
Average Annual Increase 2003-2011
Exhibit lll-8Average Annual Health Care Claims Cost Increases for Large Employers
by Age of Employee
Source: Aon Hewitt analysis of 2003 and 2011 Truven claims data covering over 14.6 million medicalplan participants (employees and dependents); costs shown include total company-paid medical claimcosts per employee for the employee plus all covered dependents.

38
A Business Case for Workers Age 50+: A Look at the Value of Experience 2015
Although average health care costs differ by age, it is important to note that age is only one
factor affecting an individual’s utilization of health care. The number of health risks, the use of
preventive care services, and other behavioral factors can have a greater influence than age
alone on health care cost.67
The Affordable Care Act and Potential Implications
Although the analysis of employer-paid health care costs presented up to this point suggests
that these costs are moving in a direction that supports the business case for 50+ workers,
employers may wonder how the Patient Protection and Affordable Care Act (ACA) will affect the
relationship between age and employer health benefit costs.
The ACA, enacted in 2010, includes reforms in many areas of health care. It put policies in
place to expand coverage and improve health care delivery and management throughout the
entire health care system. It created both an individual responsibility to obtain health coverage
and an employer responsibility to provide health insurance to employees within certain
parameters. The law creates a framework for expanding coverage to nearly all Americans
through expansion of public coverage for low-income adults previously ineligible for Medicaid,
changes in rules for private health insurance markets to make them more accessible, and
subsidies for those without access to employer-sponsored coverage that may otherwise have
trouble affording insurance.
$3,781
$5,926
$6,949
$7,600
$8,530
$9,501
$10,273
$10,497
$0 $2,000 $4,000 $6,000 $8,000 $10,000 $12,000
25-29
30-34
35-39
40-44
45-49
50-54
55-59
60-64
2011 Data
Source: Aon Hewitt analysis of September, 2011 Truven claims data covering over 14.6 million medical planparticipants (employees and dependents); costs shown include total company-paid medical claim costs peremployee for the employee plus all covered dependents
Exhibit III-9Average Cost of Health Care Claims Paid by Large Employers,Per Employee by Age of Covered Employee
Average Employer-Paid Claims Cost For 2011, By Age of Covered Employee

39
A Business Case for Workers Age 50+: A Look at the Value of Experience 2015
Because the ACA’s requirements relating to employers are phasing in through 2018, it is still too
early to know their full implications for employers in general, and for the business case for
workers age 50+. However, many employers have or are considering making changes to their
health benefits strategy in light of the new requirements and changing environment and some
have begun to take action. The pace of change in employer-paid health coverage will depend, in
part, on
whether there are delays or modifications by policymakers to key provisions of the ACA
(such as the employer responsibility requirement, and the excise tax on high cost health
plans); and
the success experienced by employers who adopt new health benefits strategies.
Employers should be aware of some emerging developments in health benefits.68 These
developments, which stem from ACA provisions and other factors, include:
Reducing overall plan costs, including strategies to avoid the anticipated excise tax on high-
cost plans through such tactics as:
− Emphasizing wellness
− Providing employees tools to help them compare treatment options, provider quality and
provider costs
− Increasing employee cost sharing (including higher deductibles, copays, and
coinsurance)
Offering health benefits through private health care exchanges to help mitigate employer
risk related to health care inflation by moving away from a self-funded model to a fully
insured model while providing greater choice to employees
Changing strategies for calculating contributions to employee health care costs, such as
moving to a defined contribution approach that can limit employer cost
To the extent that some of these emerging developments either further reduce employer-paid
claims costs among 50+ workers relative to younger workers, or result in employers basing their
contribution on something other than actual worker claims costs, these developments may have
a positive impact on the business case to hire and retain workers age 50+. However, these
developments are likely to shift more costs and risks to workers of all ages. (See Appendix for
more information about the potential implications of the ACA on employer health care costs.)
Retirement Benefit Spend Is on the Decline
Employer costs for retirement benefits are declining and becoming more age neutral because of
two key trends in the retirement system:
1. A significant decline in the prevalence of defined benefit (DB) pension plans offered by
employers.
2. An increase in the share of employers that offer defined contribution (DC) plans as the
only retirement vehicle.

40
A Business Case for Workers Age 50+: A Look at the Value of Experience 2015
The cost of retirement benefits has decreased from 26% of total benefit costs to 20% today.
(See Exhibits III-6 and III-7.)
Exhibit III-10 illustrates the evolution of the types of retirement programs offered by large
employers since 2004. The share of large employers offering DB pension plans has declined
from 68% (44% with traditional plans and 24% with hybrid plans), to only 22% today (10%
traditional plans and 12% cash balance or pension equity plans). Conversely, 78% of employers
offer DC plans as their primary retirement vehicle today, compared to just 32% in 2004.
This dramatic and continuous shift over time has nearly eliminated the age-related costs of
offering retirement plans, which were historically tied to the age and service calculations in DB
plan formulas. Today’s DC plans generally do not have age-based formulas or age-based
employer contributions. In fact, 82% of large employers have no age-related contributions in
their DC plans.69 As with trends in health benefits, the trend toward DC retirement plans may
have neutralized the difference between employer-paid retirement costs for older and younger
employees, but at the expense of shifting more risk to employees and diminishing retirement
security for workers of all ages.
As retirement plan design shifted, the levels of company spend decreased. Plan sponsors that
provide a mix of DB and DC plans spend on average 7.5% to 10.5% of salary each year for an
employees’ retirement. This compares to just below 6.7% for plan sponsors with only DC
plans.70
Of the four industries featured in this report, energy and financial services employers are themost likely to maintain open DB plans—where current and new employees are able to accruebenefits. In contrast, open DB plans are rare for retail organizations. (See Exhibit III-11.)
44%33%
21% 15% 13% 10%
24%
22%
18%16% 14%
12%
32%45%
61%69% 73% 78%
0%
10%
20%
30%
40%
50%
60%
70%
80%
90%
100%
2004 2006 2008 2010 2012 2013
Traditional Pension Cash Balance + Pension Equity Defined Contribution Only
Source: Aon Hewitt's 2013 Benefit SpecSelect™, containing salaried benefit information for 1,093 major U.S.organizations, including 50 in the energy/oil/mining industry, 173 in financial services, 81 in health care, and 103 in retail.1,089 of these organizations offer a defined contribution (DC) plan.
Exhibit III-10Percentage of Large Employers Offering Retirement Programs by Type

41
A Business Case for Workers Age 50+: A Look at the Value of Experience 2015
Paid Time Off Benefits Increase With Tenure, Not Age
Paid Time Off (PTO) is a significant component of an employer’s benefit spend (See Exhibit III-
6). Whether a traditional service-based schedule or a new PTO approach (blending a mix of
vacation, sick and personal days), time off benefits are typically based on length of service. For
example, an employee starting off at a large employer may receive 11 days of vacation the first
year. However, this amount may double by the time he or she reaches 30 years with the
company. (See Exhibit III-12.)
Source: Aon Hewitt's Benefit SpecSelect™. The 2013 Benefit SpecSelect contains salaried
benefit information for 1,093 major U.S. organizations, including 50 in the energy/oil/mining
industry, 173 in financial services, 81 in health care, and 103 in the retail industry.
In most cases, employer costs for paid time off will be the same for any new hire, regardless of
age. PTO costs may be more of a factor in the decision regarding whether to retain existing
workers. However, even in that decision, costs will vary by length of service rather than age.
40%35%
8%19% 22%
100% 100% 100% 100% 100%
0%
20%
40%
60%
80%
100%
Energy Financial Services Retail Health Care All LargeEmployer
DB DC
Source: Aon Hewitt's 2013 Benefit SpecSelect™, containing salaried benefit information for 1,093 major U.S. organizations,including 50 in the energy/oil/mining industry, 173 in financial services, 81 in health care, and 103 in retail. 1,089 of theseorganizations offer a defined contribution (DC) plan.
Exhibit lll-11Current Percentage of Large Employers Offering Retirement Programs to Salaried New Hires
Exhibit III-12
Typical Vacation Benefits in Large Companies
Vacation
DaysEnergy Financial Healthcare Retail Overall
At hire 11.5 13.5 17.9 10.4 11.8
At 10 years 19.2 19 25 18.6 18.6
At 30 years 27 24.1 29 22.5 24.5

42
A Business Case for Workers Age 50+: A Look at the Value of Experience 2015
Evaluating Age-Related Labor Cost Differences for Specific Jobs
The following scenarios show hypothetical costs related to retaining and hiring a varying mix of
older and younger employees. Each scenario covers the key elements of total rewards costs
presented earlier in this chapter: cash compensation, health benefits, retirement benefits, and
paid time off benefits. Four positions, one in each of the four industries, demonstrate the
calculations for specific jobs: an engineer in the energy industry, a sales manager in the
financial services industry, a registered nurse in the health care industry, and a store manager
in the retail industry. These positions represent key roles in their respective industries, with large
numbers of employees in those positions. These are business-critical jobs for which retention or
recruitment of talent raises particular concerns (such as high turnover, importance to
maintaining customer relationships, difficulty of recruiting, or significant training requirements).
Even though the examples focus on only four positions, the same analysis is applicable to other
positions in each industry.
While employers do not typically analyze cost scenarios based on age, these scenarios
specifically address the stereotypical notion that workers age 50+ present a significantly higher
cost that may not be commensurate with their value. The findings in this analysis, as in the prior
2005 report, not only refute this misperception, but confirm that employers could significantly
increase their efforts to retain workers age 50+ or hire workers age 50+ without materially
affecting their total labor cost.
The business cases for retention and recruiting are not the same. Some cost increases are
driven by tenure, and are therefore more relevant to the case for retention than for recruiting.
Others, such as costs driven by benefit plan design or one-time costs, are equally relevant to
both the business case for retention and recruitment. Because of this, the following analysis
reflects an assessment of two hypothetical business case scenarios—one for retaining workers
age 50+ and the other for hiring new workers age 50+.
Evaluating the Cost of Retaining Workers Age 50+
This first set of scenarios assumes a large, mature organization with a stable business model
and ongoing need for a consistent workforce from a headcount and talent mix perspective. The
organization has a group of incumbent employees age 55 with 20 years of service. These
employees could potentially retire, leaving jobs that would need to be filled. This analysis
focuses on the economics of two alternative approaches for filling the vacant jobs:
Allow retirement trends to evolve with limited efforts to retain incumbents, so that the
employer succeeds in retaining 20% of the experienced incumbent staff and fills the
resulting vacancies from the broad labor pool; or alternatively,
Mount a focused effort to double retention to 40% of the experienced workers, reducing
the need to hire from outside labor sources and increasing knowledge retention and
mentoring capabilities.

43
A Business Case for Workers Age 50+: A Look at the Value of Experience 2015
The analysis examined average per-employee rewards costs for the mix of all employees filling
the jobs in question—retained incumbent employees and new hires. The results show how
average per-employee rewards costs can change as a result of this effort to retain more
workers age 50+. (These examples use workers age 55 as a representative age for workers
age 50+.)
The results show that the incremental costs resulting from retaining more 50+ workers are not
only minimal, but are also lower than in 2005. For example, in the energy industry, the
incremental cost of this retention strategy amounts to just 2% of total rewards compensation
today compared to 3% in the prior report.
The incremental per-employee costs in the retention scenarios are modest across all four
industries, and range from 1% to 2% as a percentage of total rewards compensation. This has
decreased from the 1% to 3% in the prior report because the retirement costs in the retention
scenarios primarily include the costs of DC plans rather than DB plans, due to the increasing
prevalence of DC plans as the main retirement vehicle offered by large employers. Of the four
industries highlighted, the energy industry has the largest percent of companies (40% of large
energy companies) that still offer DB plans to new hires (another 8% still offer them to only a
closed, grandfathered group of employees).
Currently, in the retention scenarios for three of the four industries, the incremental costs of
retaining more 50+ employees stem from the higher PTO costs associated with the faster
accrual rates enjoyed by longer-service employees (many of whom are older workers) and
higher health care costs for older workers. In the energy industry scenario, the age-related costs
of DB plans are also a factor. Yet, across all four industries, the combined result is a modest 1%
to 2% cost differential for retaining these older employees. This cost differential appears modest
and manageable when weighed against the potentially significant one-time costs associated
with replacing workers. (See Exhibit II-5b.)
Even in cases where the cost differential might nominally favor hiring new employees,
employers need to keep in mind the business advantages that experienced employees offer,
such as enhanced engagement, higher productivity, and affinity with older or long-term
customers. These business advantages are often difficult to quantify in dollars but are relevant
to a company’s performance.
One additional advantage that should not be overlooked is the “known quantity” premium. A
worker whose skills and performance are known within the company may be worth far more
than a slightly lower cost replacement with no track record who poses a higher risk of poor
performance or early departure.

44
A Business Case for Workers Age 50+: A Look at the Value of Experience 2015
Hiring New Workers Age 50+
The second set of scenarios focuses on growing companies that need to fill a significant number
of jobs each year. This can be due to a combination of organizational growth plus voluntary
attrition or retirement that creates vacant positions each year. The analysis evaluates the
potential ways these companies could respond to the staffing need:
From the current applicant pool, hire a set of workers consistent with the applicant
demographics, 80% of whom are age 40 and 20% of whom are age 55; or alternatively,
Through targeted recruiting of the 50+ employee segment, fill the open slots by doubling
the percentage of hires age 55 to 40%, with the age 40 hires making up 60%.
In reality, employers would be looking across many different ages, but these were chosen as
representative examples.
Average per-employee costs for the mix of all new hires that fill the jobs were analyzed. In this
second set of scenarios, the results show how average per-employee costs can change as a
result of hiring more workers age 50+. The results show that the average per-employee costs as
a result of targeted hiring of older employees are modest, and, like the retention scenarios, have
actually decreased since 2005. For example, in the health care industry, the targeted
recruitment strategy increased per-employee costs by less than 1% of total rewards
compensation, slightly lower than the per-employee cost of 1% in the original business case
report.
The per-employee costs in the hiring scenarios are modest across all four industries, at 1% or
less of average total rewards compensation. This has decreased from up to 2% in the first
business case study for similar reasons as the retention scenario. That is, retirement benefit
costs in the hiring scenarios for three of the four industries (all except energy) are based
exclusively on DC plans.
In the increased hiring scenario, the results now show health care costs as the only cost
differentiator between older and younger employees in three of the four industries. If the mix of
new hires shifts and doubles the percentage of new 50+ workers as described in this hiring
scenario, the organization would experience only a minimal impact—1% or less of the average
cost per new employee. This conclusion holds even given that the average health care claims
cost can typically be higher for the older group.
The overall cost differential will vary by company. For example, the cost differential could be
greater in the limited number of companies that continue to offer DB pension plans, such as
final average pay or age-weighted cash balance plans, and in companies that subsidize more of
the cost of employees’ health care. It could be smaller in companies that provide less of a
subsidy for health care. The cost differential also may be greater for lower-paid positions where
the cost of health care benefits as a percent of total compensation is more significant.

45
A Business Case for Workers Age 50+: A Look at the Value of Experience 2015
Development of the Retention and Hiring Scenarios
These cost comparisons focus on the key components of annual rewards costs presented in
this chapter, which together represent 98% of total compensation costs in the typical large
company:71
Cash compensation;
Retirement programs, including DC savings plans [e.g., 401(k) or 403(b) plans] for three of
the industries and a combination of DB and DC in the energy industry;
Health benefits for active employees; and
Paid time off (vacation, holidays, and personal days).
See Exhibit III-13 for the cost assumptions for each of these components.
Exhibit III-13: Compensation and Benefits Assumptions
Industry Energy Financial Services Health Care Retail
Position Engineer Sales Manager Registered Nurse Store Manager
Median Cash
Compensation$112,900 $113,000 $67,400 $37,900
Employer
Health Care
Subsidy
(percent of
premium)
82% 77% 79% 68%
RetirementCash balance
defined benefit,
Plus
50% company
match on first 6% of
pay employee
contributes
2% noncontributory
benefit,
Plus
100% company
match on first 5% of
pay employee
contributes
1%
noncontributory
benefit,
Plus
50% company
match on first 6%
of pay employee
contributes
50% company
match on first 6%
of pay employee
contributes
Paid Time Off New Hire: 10 days
>20 Years: 25 days
New Hire: 15 days
>20 Years: 20 days
New Hire: 17 days
>20 Years:
30 days
New Hire: 10 days
>20 Years: 20 days
Notes: In Exhibit III-13, noncontributory retirement contributions represent automatic contributions made by theemployer not dependent on employee contributions. For example, the employee in the financial services industrywould automatically get a company contribution equal to 2% of pay deposited to his/her 401(k) account, plus, theemployer would match 100% of any contributions made by the employee up to the first 5% of pay. In the energyindustry example, the cash balance defined benefit provides new hires a 4% allocation when age + service is lessthan 50, 6% when age + service is between 50 and 70, and 8% when age + service is 70+. This cash balancebenefit is in addition to the 50% company match on the first 6% of pay contributed by the employee into the definedcontribution plan.

46
A Business Case for Workers Age 50+: A Look at the Value of Experience 2015
Exhibits III-14 to III-17 summarize the key cost drivers for each scenario. For each of the four
positions identified, the exhibits show typical, average annual cash compensation and the costs
of the benefits offered. These exhibits also show how the average cost per employee changes
as a result of retaining workers age 50+ (Scenario 1) and recruiting new workers age 50+
(Scenario 2).
As mentioned previously, the retirement costs depicted in these scenarios are based on DC
rather than DB plans in three of the four industry scenarios. Since DB plans are still prevalent
among larger energy companies, the example reflects a typical DB plan formula in this industry.
In each of the scenarios, cash compensation levels for employees do not vary by age. The
assumption is that all employees would be equally qualified, regardless of age, and would be
paid the median market rate for their positions. This is supported by the continued focus of
employers on paying for performance and role, rather than age or tenure, as described earlier in
this chapter.
In the hypothetical analyses in the exhibits, all new hires for the jobs in question were assumed
to be age 40 or age 55, and all retained incumbent workers used to fill those jobs were assumed
to be age 55.
Bottom line: Additional hard dollar costs of workers age 50+ are minimal and incremental
cost is declining.
The analysis reveals limited additional costs for leveraging significantly more age 50+ talent.
However, it is important to weigh these limited differences in cost against the value of workers
age 50+. Many employers will find that the value they bring in the form of added experience,
knowledge, skills, and engagement will offset the slightly higher costs. Through their informal
and formal roles as leaders, managers, role models, and mentors, these older workers also
contribute to the higher productivity of other workers.
To help inform staffing and recruiting strategies, organizations need to have a command of
productivity, total labor costs and talent supply consistent with the foregoing analysis. This
information continues to be critical in the design of strategies to recruit and retain talent.
Most employers will conclude that the added cost of experienced talent is minimal when
evaluated on the basis of total labor cost for a pool of workers, and should always be
considered in the context of the value these workers offer.

47
A Business Case for Workers Age 50+: A Look at the Value of Experience 2015
Exhibit III-14 – Value and Average Cost Scenarios – Energy (Engineer)
Value Considerations*
Age 55+ workers are the most highly engaged.
More predictable turnover patterns for older workers create value by reducing one-time
turnover costs (turnover costs can be $31,700 or higher per employee; see Exhibit II-5b).
High number of engineers in retirement zone requires emphasis on retaining and hiring.
Complex job places importance on experience and knowledge retention.
Scenario 1 – Retaining older employees
Mix A: 20% retention of employees age 55 with 20 years of service, 80% new hires age 40
Mix B: 40% retention of employees age 55 with 20 years of service, 60% new hires age 40
Scenario 2 – Hire older employees
Mix C: 20% new hires age 55, 80% new hires age 40
Mix D: 40% new hires age 55, 60% new hires age 40
Scenario 1** Scenario 2**
Mix A Mix B Mix C Mix D
Cash $ 112,900 $ 112,900 $ 112,900 $ 112,900
Average company-paid health care claims
(assumes the employer is self-insured)6,400 6,800 6,400 6,800
Paid Time Off 5,600 6,900 4,300 4,300
Retirement 8,800 9,700 8,400 8,800
Total average annual cost per employee $133,700 $136,300 $132,000 $132,800
Dollar difference per average employee $2,600 $800
Percent difference per average employee 2% 1%
* Chapter 2 provides more detail on the value considerations.**Costs presented in the scenarios are based on the assumptions described in Exhibit III-13.Source: Aon Hewitt's Benefit SpecSelect™. The 2013 Benefit SpecSelect contains salaried benefitinformation for 1,093 major U.S. organizations, including 50 in the energy/oil/mining industry. Mediansalary from 2012 Bureau of Labor Statistics May 2012 Occupational Outlook Handbook – salary broughtforward to 2013 assuming 3% increase from May 2012.

48
A Business Case for Workers Age 50+: A Look at the Value of Experience 2015
Exhibit III-15 – Value and Average Cost Scenarios – Financial Services (Sales Manager)
Value Considerations*
Age 55+ workers are the most highly engaged.
More predictable turnover patterns for older workers create value by reducing one-time
turnover costs (turnover costs can be $28,500 or higher per employee; see Exhibit II-5b).
Effectiveness of older workers in serving an older customer base.
Complex job places importance on experience and knowledge retention.
Scenario 1 – Retaining older employees
Mix A: 20% retention of employees age 55 with 20 years of service, 80% age 40 new hires
Mix B: 40% retention of employees age 55 with 20 years of service, 60% age 40 new hires
Scenario 2 – Hire older employees
Mix C: 20% age 55 new hires, 80% age 40 new hires
Mix D: 40% age 55 new hires, 60% age 40 new hires
Scenario 1** Scenario 2**
Mix A Mix B Mix C Mix D
Cash $ 113,000 $ 113,000 $ 113,000 $ 113,000
Average company-paid health care claims
(assumes the employer is self-insured)6,000 6,400 6,000 6,400
Paid Time Off 7,000 7,400 6,500 6,500
Retirement 7,900 7,900 7,900 7,900
Total average annual cost per employee $ 133,900 $ 134,700 $ 133,400 $ 133,800
Dollar difference per average employee $800 $400
Percent difference per average employee 1% <1%
*Chapter 2 provides more detail on the value considerations.
**Costs presented in the scenarios are based on the assumptions described in Exhibit III-13.
Source: Aon Hewitt's Benefit SpecSelect™. The 2013 Benefit SpecSelect contains salaried benefitinformation for 1,093 major U.S. organizations, including 173 in financial services. Median salary from2012 Bureau of Labor Statistics May 2012 Occupational Outlook Handbook – salary brought forward to2013 assuming 3% increase from May 2012.
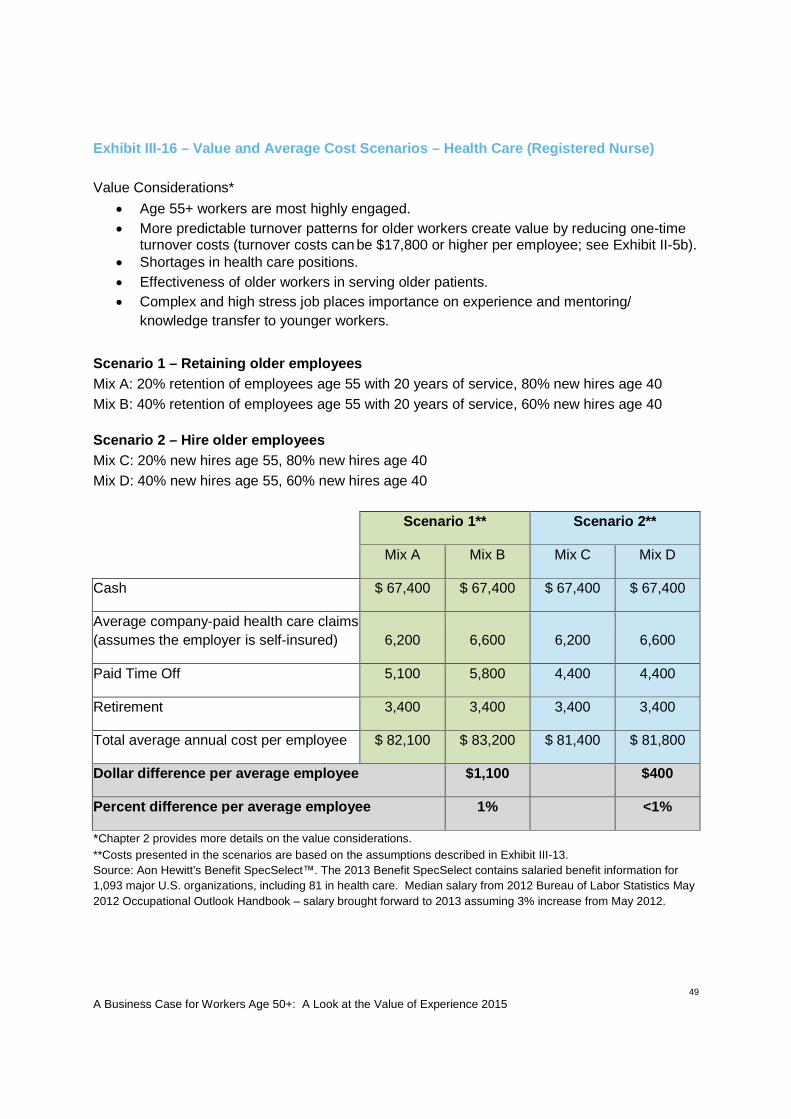
49
A Business Case for Workers Age 50+: A Look at the Value of Experience 2015
Exhibit III-16 – Value and Average Cost Scenarios – Health Care (Registered Nurse)
Value Considerations*
Age 55+ workers are most highly engaged.
More predictable turnover patterns for older workers create value by reducing one-timeturnover costs (turnover costs can be $17,800 or higher per employee; see Exhibit II-5b).
Shortages in health care positions.
Effectiveness of older workers in serving older patients.
Complex and high stress job places importance on experience and mentoring/
knowledge transfer to younger workers.
Scenario 1 – Retaining older employees
Mix A: 20% retention of employees age 55 with 20 years of service, 80% new hires age 40
Mix B: 40% retention of employees age 55 with 20 years of service, 60% new hires age 40
Scenario 2 – Hire older employees
Mix C: 20% new hires age 55, 80% new hires age 40
Mix D: 40% new hires age 55, 60% new hires age 40
Scenario 1** Scenario 2**
Mix A Mix B Mix C Mix D
Cash $ 67,400 $ 67,400 $ 67,400 $ 67,400
Average company-paid health care claims
(assumes the employer is self-insured) 6,200 6,600 6,200 6,600
Paid Time Off 5,100 5,800 4,400 4,400
Retirement 3,400 3,400 3,400 3,400
Total average annual cost per employee $ 82,100 $ 83,200 $ 81,400 $ 81,800
Dollar difference per average employee $1,100 $400
Percent difference per average employee 1% <1%
*Chapter 2 provides more details on the value considerations.
**Costs presented in the scenarios are based on the assumptions described in Exhibit III-13.
Source: Aon Hewitt's Benefit SpecSelect™. The 2013 Benefit SpecSelect contains salaried benefit information for
1,093 major U.S. organizations, including 81 in health care. Median salary from 2012 Bureau of Labor Statistics May
2012 Occupational Outlook Handbook – salary brought forward to 2013 assuming 3% increase from May 2012.
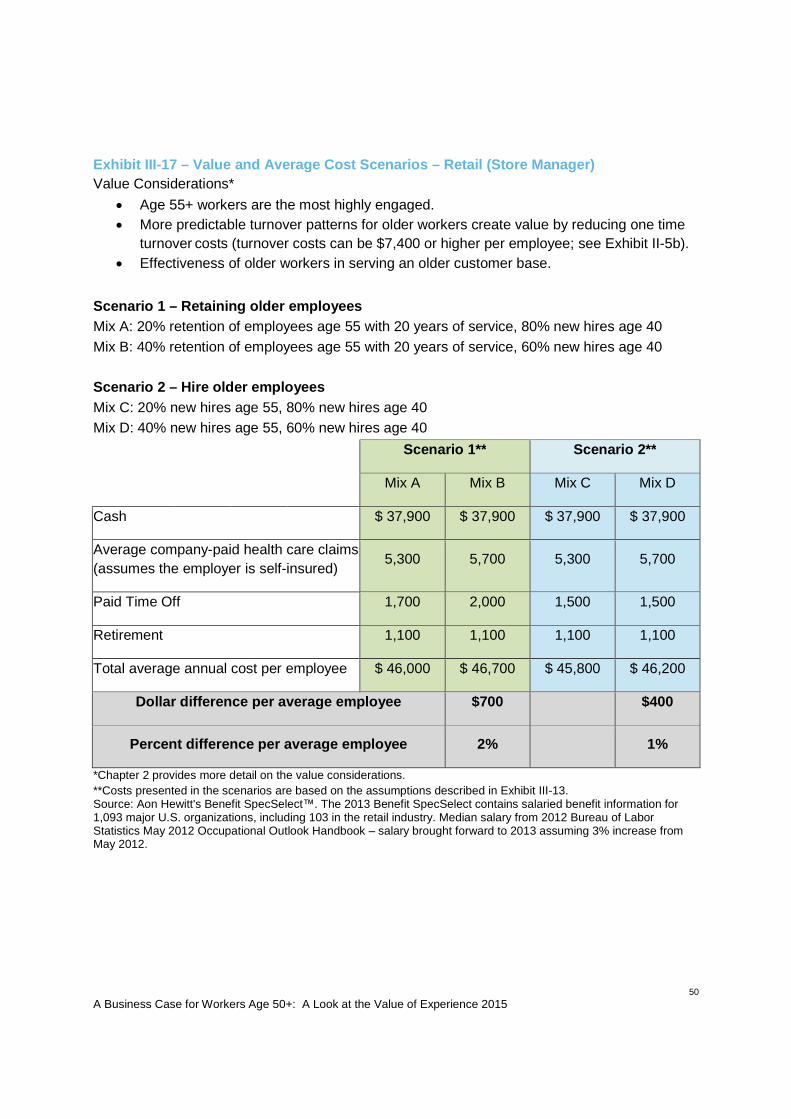
50
A Business Case for Workers Age 50+: A Look at the Value of Experience 2015
Exhibit III-17 – Value and Average Cost Scenarios – Retail (Store Manager)
Value Considerations*
Age 55+ workers are the most highly engaged.
More predictable turnover patterns for older workers create value by reducing one time
turnover costs (turnover costs can be $7,400 or higher per employee; see Exhibit II-5b).
Effectiveness of older workers in serving an older customer base.
Scenario 1 – Retaining older employees
Mix A: 20% retention of employees age 55 with 20 years of service, 80% new hires age 40
Mix B: 40% retention of employees age 55 with 20 years of service, 60% new hires age 40
Scenario 2 – Hire older employees
Mix C: 20% new hires age 55, 80% new hires age 40
Mix D: 40% new hires age 55, 60% new hires age 40
Scenario 1** Scenario 2**
Mix A Mix B Mix C Mix D
Cash $ 37,900 $ 37,900 $ 37,900 $ 37,900
Average company-paid health care claims
(assumes the employer is self-insured)5,300 5,700 5,300 5,700
Paid Time Off 1,700 2,000 1,500 1,500
Retirement 1,100 1,100 1,100 1,100
Total average annual cost per employee $ 46,000 $ 46,700 $ 45,800 $ 46,200
Dollar difference per average employee $700 $400
Percent difference per average employee 2% 1%
*Chapter 2 provides more detail on the value considerations.
**Costs presented in the scenarios are based on the assumptions described in Exhibit III-13.Source: Aon Hewitt's Benefit SpecSelect™. The 2013 Benefit SpecSelect contains salaried benefit information for1,093 major U.S. organizations, including 103 in the retail industry. Median salary from 2012 Bureau of LaborStatistics May 2012 Occupational Outlook Handbook – salary brought forward to 2013 assuming 3% increase fromMay 2012.

A Business Case for Workers Age 50+: A Look at the Value of Experience 2015
51
Conclusion
The data presented in this chapter demonstrate that changes in compensation and benefits over
the past decade have created a more age-neutral distribution of labor costs, and that employer
responses to health care reform could potentially add to this shift.
The changes have resulted from:
An increasing reliance on performance-based variable compensation
A decline in DB retirement plans
Slowed growth in employer health care costs for older workers
Because age-related costs are limited, employers could retain or hire significantly more
50+ workers with a minimal impact on total labor cost.
Comparing these small incremental costs to the value of higher engagement, knowledge
and skills accumulated over a career, and the attrition costs saved through lower
unplanned turnover will often yield a “net positive” business case for having a focused
strategy to retain and hire more workers age 50+.

A Business Case for Workers Age 50+: A Look at the Value of Experience 2015
52
Chapter 4
Workers Age 50+: What Are They Looking For?
There is no shortage of data illustrating that workers age 50+ expect to stay in the workforce
longer than prior generations, are drawn to specific employer attributes, and are the most
engaged cohort in the workforce. Employers with a clear line of sight into what keeps older
workers engaged at their jobs can develop mutually beneficial relationships.
To provide a comprehensive view of the mindset of workers age 50+, this chapter addresses:
1. How long they expect to work.
2. The reasons they work.
3. The drivers of attraction, retention, and engagement.
Older Workers Expect to Continue to Work
When older workers are asked when they will retire, their responses reveal expectations of
remaining in the workforce longer than in the past. The Employee Benefit Research Institute’s
(EBRI) Retirement Confidence Survey found that the share of workers age 45+ who expect to
retire before age 60 declined from 14% in 2004 to just 5% in 2014.72 At the same time, the
share expecting to retire at age 66 or older grew considerably, from 21% in 2004 to 36% in
2014. (See Exhibit IV-1.)
5%
2%
7%
14%
8%
18%
20%
21%
20%
26%
24%
26%
20%
19%
20%
22%
22%
22%
36%
38%
34%
21%
28%
17%
10%
14%
8%
7%
4%
9%
8%
6%
11%
10%
15%
8%
2014 All 45+
2014 55+
2014 45-54
2004 All 45+
2004 55+
2004 45-54
<60 60-64 65 66+ Never Don’t Know / Refused
Exhibit lV-1Expected Retirement Age for Workers Age 45+ is on the RiseQuestion asked in survey: Realistically, at what age do you expect toretire?
Source: Employee Benefit Research Institute and Greenwald & Associates, 2004 and 2014 RetirementConfidence Surveys. National survey of 1,501 individuals age 25 and over in 2014 (1,000 workers and 501retirees) and 1,002 individuals in 2004 (783 workers and 219 retirees). Chart shows results among workersages 45+, including 539 in 2014 and 330 in 2004.

A Business Case for Workers Age 50+: A Look at the Value of Experience 201553
The increase in expected retirement age over the past decade is most likely a reaction to the
various dynamics mentioned in Chapter 1, including the aging of the population and changes in
employer benefits, and reflects an overall decline in retirement confidence since the Great
Recession. For example, in 2014, just over half (57%) of workers age 50+ expressed
confidence that they will have enough money to live comfortably in retirement, a clear drop from
the 66% who expressed such confidence in 2004.73
It is important to keep in mind that some workers will retire earlier than planned. Reasons vary
for leaving the workforce early. For example, according to the EBRI 2014 Retirement
Confidence Survey, 49% of retirees said they retired earlier than planned, with the most
common reason being illness or disability. Other reasons included being able to afford to retire
earlier; company changes, such as downsizing or closure; wanting to do something else; and
caregiving responsibilities.74 So, although some older workers may leave the workforce earlier
than expected, data show that more and more older workers expect to continue to work—and
employers can benefit by employing them.
Even though many older workers expect to keep working for some time, not all of them expect
to stay at their current job. According to a 2012 AARP/SHRM survey, about 20% of employed
workers ages 50+ expect to change jobs before they stop working completely. This includes 9%
who plan to change jobs but remain in the same field, 6% who plan to find a job in a different
field, and another 6% who plan to start their own business. (This does not include those who
may find themselves looking for a new job if they unexpectedly lose theirs in the future.)
However, 77% of employed workers age 50+ do plan to remain in their current job until they
stop working completely.75
Why Workers Age 50+ Work
Today’s changing business and economic environment brings current and future financial needs
of older workers to the forefront of reasons why they are working. This is evident in the findings
of AARP’s Staying Ahead of the Curve 2013 survey, which revealed that 82% of workers ages
45 to 74 identify “need the money” as a major factor in their decision to work or look for work, up
from 76% a decade prior.76 (See Exhibits IV-2a and IV-2b.)
Several non-financial factors also influence the decision to work. For example, the majority of
older workers also state that they enjoy their jobs and their jobs make them feel useful. These
psychological drivers can be just as significant as financial needs in decisions related to whether
and where to work. Employment offers older workers opportunities to make a meaningful
contribution, interact with people, and stay productive. In fact, enjoying working was a primary
factor in the decision to work among workers ages 45-59 as well as workers ages 60-74 in
2012, although somewhat less important than it was in 2002. (See Exhibits IV-2a and IV-2b.)
According to the 2012 AARP/SHRM survey, the tendency to work (or look for work) primarily for
non-financial reasons increases with age. Forty-one percent of workers ages 70+ cite non-
financial reasons as the primary reason that they are working or looking for work. This
compares with 23% of workers ages 60-69 and 14% of workers ages 50-59.77

A Business Case for Workers Age 50+: A Look at the Value of Experience 201554
46%
48%
49%
56%
65%
66%
67%
76%
76%
44%
42%
51%
43%
37%
59%
61%
60%
67%
82%
71%
0% 50% 100%
To be able to interact with people
Gives me something to do, keeps me busy
To support other family members
To qualify for Social Security
To fulfill pension requirements
To pay for health costs for self or others
To maintain health insurance coverage
It makes me feel useful
To save more for retirement
Need the money
Enjoy the job or enjoy working
2012 (n=1502) 2002 (n=1500)
Exhibit IV-2aReasons for Working or Looking for Work: 2012 vs. 2002Which of the Following is a Major Factor in Your Decision to Work or Look for Work?
Source: Staying Ahead of the Curve 2013: The AARP Work and Career Study. National survey of 1502 adults age 45-74who were working or looking for work. Fielded in Nov-Dec 2012. Note: The 2002 survey was fielded in May-June 2002."Gives me something to do, keeps me busy" and "To be able to interact with people" were not included as options in 2002.
48%
42%
35%
37%
27%
53%
55%
58%
57%
69%
71%
42%
41%
56%
44%
40%
60%
63%
60%
70%
86%
71%
0% 20% 40% 60% 80% 100%
To be able to interact with people
Gives me something to do, keeps me busy
To support other family members
To qualify for Social Security
To fulfill pension requirements
To pay for health costs for self or others
To maintain health insurance coverage
It makes me feel useful
To save more for retirement
Need the money
Enjoy the job or enjoy working
Age 45-59 (n=993) Age 60-74 (n=465)
Exhibit IV-2bReasons for Working or Looking for Work: Ages 45-59 vs. Ages 60-74Which of the Following is a Major Factor in Your Decision to Work or Look for Work?
Source: Staying Ahead of the Curve 2013: The AARP Work and Career Study. National survey of 1502 adults age 45-74 whowere working or looking for work. Fielded in November and December 2012.

A Business Case for Workers Age 50+: A Look at the Value of Experience 201555
Working in “Retirement”The definition of retirement is evolving. For most employees, retirement does not mean a full
exit from the workforce. For example, AARP’s Staying Ahead of the Curve 2013 survey found
that 72% of workers age 45 to 74 viewed work as part of their retirement plans.78 (See Exhibit
IV-3.)
6%
10%
19%
34%
69%
1%
1%
5%
13%
23%
29%
72%
0% 20% 40% 60% 80%
Work - something else
I do not plan to retire
Retire from current job or career, butwork full-time doing something else
Start your own business or work foryourself
Work part-time mainly for the neededincome it provides
Work part-time for interest or enjoymentsake
Total who expect to work in retirement
2012 2002
Exhibit IV-3Which of the following, if any, best represents what you plan to do during yourretirement? – Details of those who expect to work in retirement
Source: Staying Ahead of the Curve 2013: The AARP Work and Career Study.National survey of 1502 adults age 45-74 who were working or looking for work. Fielded in November andDecember 2012.Note: The 2002 survey was fielded in May and June 2002. In 2002, interviewers were not instructed toseparately record responses for "I do not plan to retire" and "Work - something else".

A Business Case for Workers Age 50+: A Look at the Value of Experience 201556
Understanding the Retirement Savings Gap
One factor that will impact the supply of age 50+ workers is the retirement savings gap. Aon Hewitt’s2012 Real Deal Study on Retirement Income Adequacy studied 78 large companies, including 2.2 millioncovered employees, representing a segment of Aon Hewitt’s defined contribution outsourcing clients. Thecompanies are also a representative cross-section of the Fortune 500.
Among the findings was that projected retirement needs for full-career contributors (those who have thepotential to work at least 30 years at a company) could equal 15.9 times pay at retirement, with 11 timespay coming from either company plans or private sources.
Across industries, based on savings to date, the projected shortfall for the average worker was 2.2 timespay—specifically ranging from 1.1 times pay in the energy industry to 5.8 times pay in the retail industry.However, retiring at age 67 rather than 65 could completely eliminate the gap for many workers.
This shortfall is meaningful because it increases the likelihood that employees are likely to work longerprior to retirement, or return to work after retiring, to close the gap—creating a supply of experiencedtalent.
Financial need as well as psychological and social fulfillment all play a role in decisions to work
in retirement. As shown in Exhibits IV-4a and IV-4b, older workers who expect to work in
retirement mention the need for extra money, the fact that they enjoy working, and the desire “to
have something interesting to do.” The share mentioning the need for extra money (30%) has
increased significantly since 2002 (22%).79

A Business Case for Workers Age 50+: A Look at the Value of Experience 201557
3%
4%
6%
4%
8%
16%
20%
24%
22%
27%
3%
4%
6%
7%
10%
11%
14%
21%
30%
31%
0% 10% 20% 30% 40%
For medical benefits
To stay productive
To be around people
To suppport your family
To support yourself
To stay mentally active
To stay physically active
To have something interesting to do
For extra money
I want to work / I enjoy working
2012 (n=1087) 2002 (n=1036)
Exhibit IV-4aReasons to Work in Retirement: 2012 vs. 2002Why Do You Plan to Work During Your Retirement?
Source: Staying Ahead of the Curve 2013: The AARP Work and Career Study. National survey of 1502 adults age45-74 who were working or looking for work. Fielded in Nov. and Dec. 2012. Note: The 2002 survey was fieldedin May-June 2002. Base for Chart: Respondents who plan to work in retirement. (Open-ended question)
4%
4%
9%
6%
10%
13%
12%
25%
33%
31%
3%
4%
6%
7%
10%
11%
15%
21%
29%
30%
0% 10% 20% 30% 40%
For medical benefits
To stay productive
To be around people
To suppport your family
To support yourself
To stay mentally active
To stay physically active
To have something interesting to do
For extra money
I want to work / I enjoy working
Age 45 - 59 (n=729) Age 60-74 (n=329)
Exhibit IV-4b
Reasons to Work in Retirement: Ages 45-59 vs. Ages 60-74Why Do You Plan to Work During Your Retirement?
Source: Staying Ahead of the Curve 2013: The AARP Work and Career Study. National survey of 1502 adultsage 45-74 who were working or looking for work. Fielded in Nov. and Dec. 2012.Base for Chart: Respondents who plan to work in retirement. (Open-ended question)

A Business Case for Workers Age 50+: A Look at the Value of Experience 201558
Attraction, Retention, and Engagement of Workers Age 50+
With research showing older workers expecting to continue to work for many reasons,
employers have an opportunity to benefit by attracting, retaining, and engaging this skilled and
experienced segment of workforce talent.
A 2012 AARP/SHRM survey of workers age 50+ suggested older workers place significance on
having competitive benefits and flexible work arrangements.80 When workers age 50+ consider
staying at a job or accepting a job offer, health insurance, retirement savings plans, and paid
time off benefits play an important role in their decisions. For example, approximately 8 in 10
workers age 50+ consider the availability of benefits such as health insurance (82%); a pension,
401(k), or other retirement plan (77%); and paid time off (80%) to be “very” or “somewhat”
important considerations in the decision to stay at their job (or the decision to accept a job).
Along with these traditional employer benefits, more than half agree that flexible work
arrangements, such as flex time, a compressed work schedule, and a formal phased retirement
program, are all at least somewhat important.81
Psychological and social fulfillment are also important. For example, when workers age 45 to 74
in AARP’s Staying Ahead of the Curve 2013 survey were asked about the essential parts of
their ideal job, they selected the following job features most often:82
The chance to use their skills and talents (92%)
A friendly work environment (91%)
The chance to do something worthwhile (88%) (See Exhibit IV-5.)
In fact, 50+ workers’ appreciation of opportunities for learning and the impact of new skills was
one of the findings in a 2014 survey by USA Today and AARP’s Life Reimagined. Nearly half
(47%) of workers age 50-59 indicated that they anticipate new work-related opportunities as a
result of skills that they have developed. Furthermore, among the 30% of workers age 50-59
who expect to make a career change in the next 5 years, 70% attribute their anticipated career
change at least in part to a desire “to learn more.”83
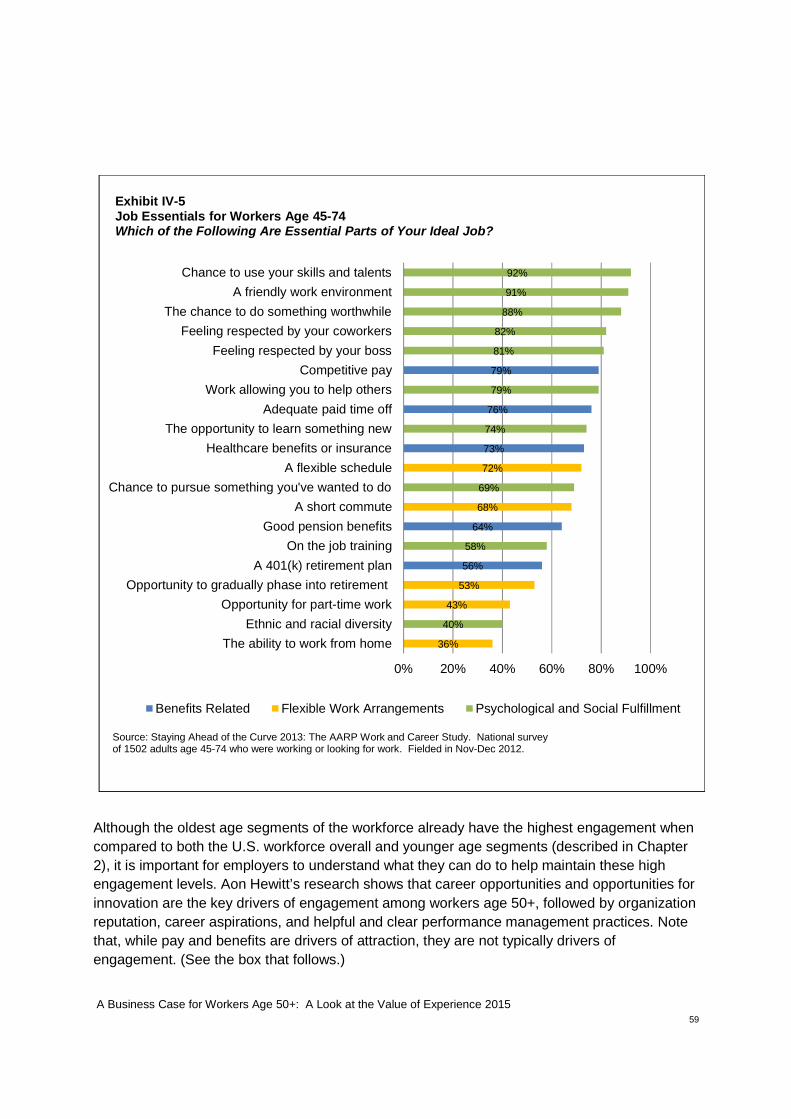
A Business Case for Workers Age 50+: A Look at the Value of Experience 201559
Although the oldest age segments of the workforce already have the highest engagement when
compared to both the U.S. workforce overall and younger age segments (described in Chapter
2), it is important for employers to understand what they can do to help maintain these high
engagement levels. Aon Hewitt’s research shows that career opportunities and opportunities for
innovation are the key drivers of engagement among workers age 50+, followed by organization
reputation, career aspirations, and helpful and clear performance management practices. Note
that, while pay and benefits are drivers of attraction, they are not typically drivers of
engagement. (See the box that follows.)
56%
64%
73%
76%
79%
36%
43%
53%
68%
72%
40%
58%
69%
74%
79%
81%
82%
88%
91%
92%
0% 20% 40% 60% 80% 100%
The ability to work from home
Ethnic and racial diversity
Opportunity for part-time work
Opportunity to gradually phase into retirement
A 401(k) retirement plan
On the job training
Good pension benefits
A short commute
Chance to pursue something you've wanted to do
A flexible schedule
Healthcare benefits or insurance
The opportunity to learn something new
Adequate paid time off
Work allowing you to help others
Competitive pay
Feeling respected by your boss
Feeling respected by your coworkers
The chance to do something worthwhile
A friendly work environment
Chance to use your skills and talents
Benefits Related Flexible Work Arrangements Psychological and Social Fulfillment
Exhibit IV-5Job Essentials for Workers Age 45-74Which of the Following Are Essential Parts of Your Ideal Job?
Source: Staying Ahead of the Curve 2013: The AARP Work and Career Study. National surveyof 1502 adults age 45-74 who were working or looking for work. Fielded in Nov-Dec 2012.

A Business Case for Workers Age 50+: A Look at the Value of Experience 201560
Top 5 Engagement Drivers for Workers Age 50+
1. Career Opportunities Employees believe future career opportunities look good at thecompany, are aware of opportunities available to them, andunderstand how to grow their careers.
2. Opportunities for Innovation Employees are encouraged to bring new ideas forward thatimprove products, solutions, or processes.
3. Organization Reputation The employer has an excellent reputation in the community andadds value to society. Employees are proud to be part of thecompany.
4. Career Aspirations Employees can achieve personal long-term career aspirations atthe organization. Employees can envision working at the samecompany for at least 1 year.
5. Performance Management The performance management process provides anunderstanding of skills and behaviors expected for success.Managers provide feedback to help improve employeeperformance.
Note: For the energy and health care industries, work process is also an engagement driver. Recognition and seniorleadership are engagement drivers in the financial services industry.Source: Aon Hewitt Engagement Database, 2009-2013. 2014 analysis of Aon Hewitt normative survey datacovering 2 million employees in 276 organizations.
According to the Aon Hewitt Engagement Database, these top five drivers of engagement for
workers age 50+ generally mirror the top drivers for younger workers—meaning employers who
already focus on talent planning that engages younger workers likely have an existing
foundation to leverage for engaging workers age 50+.

A Business Case for Workers Age 50+: A Look at the Value of Experience 201561
Conclusion
The experience, skills, and talents of workers age 50+ make them a valuable resource to
employers faced with current and future skills shortages. This segment of the labor force is
engaged and motivated to stay loyal to their employers, and will continue contributing to their
organizations’ success when presented with rewards and flexibility that meets their needs.
The data demonstrate that workers age 50+ want to be in the workforce and anticipate a longer
working career, making it critical for employers to understand the preferences of this group.
Designing programs that appeal to a multi-generational workforce can increase an employer’s
ability to both attract and retain these committed and loyal experienced older workers.
Employers should keep in mind the following when designing programs to appeal to workers
age 50+:
The decision to stay employed is influenced by a mix of financial and non-financial factors.
For many, “retirement” is being redefined to include some form of work.
Flexibility, along with competitive pay and benefit packages, are important factors in
attracting and retaining workers age 50+.
Training and development opportunities may also be of interest to 50+ workers since many
are interested in opportunities to learn new things and grow their careers.
The drivers of engagement for workers age 50+ mirror those of all workers.

A Business Case for Workers Age 50+: A Look at the Value of Experience 201562
Chapter 5
Employer Strategies to Attract, Retain and Engage Workers Age 50+
This report provides considerable quantitative analysis to illustrate that workers age 50+ are an
integral part of the workforce. Furthermore, it demonstrates that these workers add value with
minimal, if any, added costs.
This chapter focuses on workplace policies and practices that appeal to older workers.
Specifically, it:
1. Identifies programs and policies that employers have found effective in managing agenerationally diverse workforce.
2. Provides examples of companies that successfully manage generational diversity.
Information for this chapter is drawn from two primary sources. First, data on employer
strategies come from a 2014 Society for Human Resources Management (SHRM) survey of
more than 1,900 HR professionals from SHRM’s membership. Second, Aon Hewitt conducted a
series of interviews with HR leaders from 18 organizations in the spring of 2014. These
organizations are seen as leaders in developing holistic workforce strategies for workers age
50+. Many were selected based on their identification by AARP as a 2013 Best Employer for
Workers Over 50 and/or Life Reimagined for Work Pledge signer (see box below). The
organizations also include a selection of Aon Hewitt clients concentrated in (but not limited to)
the four industries featured in this report. In addition to these two primary sources, other
examples of noteworthy employer practices were identified through a review of business
publications.
Employer Strategies
Findings from the 2014 SHRM Older Workers Survey
SHRM’s 2014 survey of HR professionals on the aging workforce suggests that many are still in
the early stages of evaluating their workforce strategies. Nineteen percent of HR professionals
indicated that their organizations are “just becoming aware of this potential change” and another
36% are “beginning to examine internal policies and management practices” to address this
change. Only 6% of respondents indicated that their organizations have actually implemented
policies and management practices, while another 7% have proposed policy and management
practice changes or agreed on a plan to make changes. Yet as noted in Chapter 2, many HR
professionals see the potential loss of talent as a result of older worker retirements as a crisis, a
problem, or a potential problem for their organization over the next 11-20 years.84

A Business Case for Workers Age 50+: A Look at the Value of Experience 201563
When asked what steps their organizations have taken to recruit and/or retain older workers,
HR professionals most commonly noted strategies such as offering reduced hours, hiring
retirees as consultants or temporary workers, implementing flexible scheduling, and/or offering
phased or gradual retirement. (See Exhibit V-1.)
Exhibit V-1: Steps Taken to Recruit and/or Retain Older Workers
StrategyPercent of HR Professionals Whose
Organization Implemented Each Strategy toRecruit/Retain Older Workers
Offered reduced hours or part-time positions to olderworkers
48%
Hired retired employees as consultants or temporaryworkers
40%
Started flexible scheduling (e.g., telework, alternativework schedules)
37%
Created positions/redesigned positions that allow
bridge employment1 30%
Offered phased/gradual retirement 30%
1Opportunities that allow near-retirees to ease into retirement while allowing the organization to retain good
employees.
Source: Society for Human Resource Management. The Aging Workforce – Recruitment and Retention. (Reflectsresults from SHRM’s 2014 Older Workers Survey, which included responses of more than 1,900 randomly selectedHR professionals from SHRM’s membership.)
A Business Case for Workers Age 50+: A Look at the Value of Experience 201564
Life Reimagined for WorkAARP’s Life Reimagined for Work Pledge program is a national initiative to helpemployers solve their current and future staffing challenges and direct job seekers toemployers that value and are hiring experienced workers. Employers who sign thePledge agree that they:
• Recognize the value of experienced workers;
• Believe in equal opportunities, regardless of age; and
• Have immediate hiring needs.
Over 275 employers have signed the Pledge demonstrating their commitment to recruit
across diverse age groups and consider all job applicants on an equal basis including
AlliedBarton, AT&T, Charles Schwab, CVS Caremark, General Mills, Google, Kimberly
Clark, Manpower, National Institutes of Health (NIH), New York Life, Scripps Health,
S&T Bancorp, Toys “R” Us, Walgreens, and WellStar Health Systems.
For more information, visit www.lifereimagined.org/work or email [email protected].
Aon Hewitt Interviews
Aon Hewitt’s employer interviews focused on organizations that are “ahead of the curve” in
evaluating the issues and developing a holistic workforce strategy for workers age 50+. The
findings from these interviews reveal that many large employers value the expertise and
maturity of older workers, and believe that attracting, retaining, and engaging the age 50+
segment of the workforce will lead to improved business results.
The three key efforts on which the majority of these 18 employers focus are:
Creating flexible workplaces;
Managing transitions to retirement; and
Fostering generational diversity and inclusion.
Creating Flexible Workplaces
Flexible workplaces and job structures, broadly speaking, are about working differently—when,
where, and how work gets done. This can include measuring results rather than hours spent in
the office; providing alternative work arrangements like flex time, part-time, and telecommuting;
and designing flexible workspaces with the assistance of technology. It can also include
temporary assignments or contract arrangements.
While workplace flexibility is appealing to older workers, employees across age cohorts and life
circumstances benefit from these programs as they help employees balance work and life
demands. Employers that offer flexible workplace practices are better positioned to
attract and retain desired talent. Data show that employees with access to these
arrangements are more satisfied, committed, and engaged with their jobs.85

A Business Case for Workers Age 50+: A Look at the Value of Experience 201565
For example, findings from Corporate Voices for Working Families indicate that companies that
offer flexible work arrangements improve retention and recruitment; foster greater employee
satisfaction, commitment, and engagement; and experience increased productivity and revenue
generation. These employers also experience positive impacts on cycle time and client
service.86
Consider these examples:
National Institutes of Health (NIH), a multi-year AARP Best Employer winner and a Life
Reimagined for Work Pledge signer, is part of the U.S. Department of Health and Human
Services. Headquartered in Bethesda, Maryland, NIH has 19,000 employees across 27
Institutes and Centers. Its suite of flexible work programs has proven to be one of the most
popular recruiting and retention tools for the organization. As of 2014, more than 10,000 of
its employees telecommute.
SAP North America is a software services company that employs 13,000 employees and
has its U.S. headquarters in Newtown Square, Pennsylvania. It also offers flexible work
arrangements, such as adjustable work hours, sabbaticals and telecommuting that appeal to
all workers. As a result, SAP has experienced high retention rates over the last several
years and is also regarded as a great place to work, with recognition by Philly.com, The
Atlanta-Journal Constitution, and the Bay Area News Group as one of the Top Workplaces
2014 in these respective cities. SAP North America also earned recognition as one of the
Top 100 Companies for Remote Jobs in 2014 by Flexjobs.com.87
A WorldatWork report shows the prevalence of different types of flexible work arrangements
across all industries. (See Exhibit V-2.) Data include responses from 566 employers, including
public, private, and non-profit organizations. Employer sizes ranged from fewer than 100
employees to more than 100,000.88

A Business Case for Workers Age 50+: A Look at the Value of Experience 201566
Managing Transitions to Retirement
Perhaps the newest form of workplace flexibility
involves managing the transition to retirement. This
represents a broad range of employment arrangements
that allow an employee who is approaching traditional
retirement age to continue working with a reduced
workload, and gradually transition from active
employment to retirement. These arrangements can
also allow recently retired employees to transition back
from retirement into a different temporary, project-
oriented role. These arrangements may entail a gradual
reduction in hours of work before retirement or part-time
work after retirement.
83%
82%
81%
60%
56%
52%
51%
48%
43%
34%
31%
24%
22%
17%
18%
19%
40%
44%
48%
49%
52%
57%
66%
69%
76%
78%
Telework on an ad hoc basis
Flextime
Part-time schedules
Phased return from leave
Telework on a regular monthly basis
Telework on a regular weekly basis
Shift flexibility
Combination of programs tailored to fit employee'sneeds
Compressed work week
Telework full-time
Phased-retirement
Job share
Career on/off ramps
We offer this program to all or some employees We do not offer this program to any employee
Exhibit V-2
2013 WorldatWork Survey on Workplace Flexibility: Prevalence of Flexibility Programs
Source: October 2013 WorldatWork report
Employees Seek Flexibility 79% of employees today are
seeking greater flexibility in theirjobs
87% of full-time professionals arelooking for flexibility in a new job
85% of employees under age 30expect flexibility
47% of Boomers would delayretirement if they could flex hours
62% of employees feel they aremost productive working remotely
87% of mobile workers feelpositive about workingcollaboratively in theirorganizations
Source: FlexPaths research studies 2009, 2011; KnollWorkforce Research (2005), “Time as a new currency: flexibleand mobile work strategies to manage people and profits”

A Business Case for Workers Age 50+: A Look at the Value of Experience 201567
Examples of employers using a “Retire and Rehire” approach come from Beth Israel Deaconess
Medical Center, S&T Bancorp, and Michelin North America.
Beth Israel Deaconess Medical Center, in Boston, Massachusetts, a major teaching
hospital of Harvard Medical School, accepts many full-time, part-time, and per diem retirees
back to work after a six-month termination of employment. In an industry where years of
experience in various clinical disciplines has a direct impact on patient outcomes,
experienced older workers are an invaluable asset for quality of care and informal
mentoring.
S&T Bancorp, Inc., which has grown from a single location to a $5 billion financial holding
company headquartered in Indiana, Pennsylvania, with roughly 1,000 employees, has seen
a consistent trend of retirees asking to come back to work with reduced hours. The
company, a multi-year AARP Best Employer winner and a Life Reimagined for Work Pledge
signer, realizes so many benefits from this opportunity to leverage older workers as mentors
to younger staff, facilitating necessary knowledge transfer and providing valuable
institutional knowledge, that S&T created an ongoing contract with a local temp agency to
manage the applications and inflow of former employees.
Michelin North America, a multi-year AARP Best Employer winner, is a company that
manufactures and sells tires for airplanes, automobiles, farm equipment, and other vehicles.
With more than 22,000 employees, the company relies on its mature workforce for
knowledge sharing, mentoring and experience. Michelin also has a program in place for
retirees, who after a period of time, can return to work with reduced hours. That program is
called the Returning Retiree Employee (RRE) program.

A Business Case for Workers Age 50+: A Look at the Value of Experience 201568
Fostering Generational Diversity and Inclusion
To understand the importance of generational diversity and inclusion in the workplace, it’s
essential to first understand the definition of these terms. In a Profiles in Diversity Journal article
published in March 2011, T. Hudson Jordan, the Director of Global Diversity & Talent Strategies
at Pitney Bowes, Inc., a past AARP Best Employer winner, wrote:
“Diversity means all the ways we differ. Some of these differences we are born with and cannot
change. Anything that makes us unique is part of this definition of diversity. Inclusion involves
bringing together and harnessing these diverse forces and resources, in a way that is beneficial.
Inclusion puts the concept and practice of diversity into action by creating an environment of
involvement, respect, and connection—where the richness of ideas, backgrounds, and
perspectives are harnessed to create business value. Organizations need both diversity and
inclusion to be successful.”
A workplace with Millennials, Generation Xers, Baby Boomers, and the Silent Generation offers
a unique opportunity for varied perspectives and approaches to day-to-day work. A Forbes
global survey of executives at 321 large corporations found that 72% of those polled reported
that they have diversity and inclusion programs focused on age.89 According to a MetLife study
of employee benefit trends, 61% of employers said they make an effort to “understand and meet
employees’ different generational needs” when making decisions about benefits, programs, and
services.90
Managing Productivity by Accommodating Older WorkersSpurred to take action based on demographic forecasts of their aging workforce, BMW, apast AARP International Best Employer winner, tested productivity and performance ofassembly lines staffed by an older and a younger group of workers. It found that, with minoradjustments in ergonomics, the productivity of the assembly line staffed by the older group ofworkers rose to a level that equaled the productivity of the lines staffed by the younger group.Absenteeism also dropped below the plant average.
To conduct the experiment, and with an investment of approximately $50,000, BMW made70 small ergonomic design and equipment changes at a BMW assembly line plant to helpolder workers. These changes included new wooden floors, special barbershop-type chairsso employees could sit while working, installation of magnifying glasses to reduce eyestrainand mistakes, and physiotherapist-designed daily stretching exercises to do while on the job.
Based on the success of the testing, BMW implemented similar projects and equipmentchanges at plants around the globe to help their current older workers—and maintain orimprove productivity results.
Source: Harvard Business Review, March 2010, “How BMW is Defusing the Demographic Time Bomb.”(Although BMW’s recognition as a past AARP International Best Employer was not mentioned in the article, thisinformation has been added here as another example of BMW’s demonstrated efforts in the area of olderworkers.)

A Business Case for Workers Age 50+: A Look at the Value of Experience 201569
Consider the benefits realized by these employers:
Scripps Health, a private, nonprofit health delivery system in San Diego, California, a multi-
year AARP Best Employer winner and a Life Reimagined for Work Pledge signer, offers
employees generation-specific, targeted educational programs. These include sessions for
employees who are expectant parents
and sessions for managing the challenges
unique to “sandwich generation”
employees who are juggling the needs of
both children and aging parents.
GlaxoSmithKline, a global health care
company and past AARP Best Employer
winner, supports intergenerational
understanding and cooperation through
formal networking, mentoring programs,
and cross-training opportunities. These
programs give late-stage talent workers
an opportunity to feel connected to their
younger peers, who in turn benefit from
the late-stage talent workers’ knowledge
and experiences.
DTE Energy, a diversified energy
company, has a formal network for
Boomers in the workplace, giving them a
sanctioned environment to discuss issues
related to wellness, eldercare and other
topics relevant to older workers. Younger
workers are welcome to join the network
as well. In addition, the company funds
outside speakers to provide the network
with additional counsel and advice on the
issues most relevant to their generation.
These efforts in the area of generational
diversity and inclusion create a welcoming
environment for workers age 50+, which in
turn supports greater engagement and
commitment of this segment of the workforce.
Making a Statement
In a May 15, 2014, New York Times article, Steven
Greenhouse explains that leading employers aren’t
subtly pushing out older workers, but rather “go the
extra mile to assure experienced employees that
they are valued and that management is eager for
them to stay.” He goes on to describe how some
employers “promote innovative programs to show
that they appreciate their older employees and
don't want to lose their experience, their rapport
with customers or their ability to mentor younger
workers.”
The article cites several examples of such
innovative programs, including CVS Caremark and
The Home Depot:
CVS Caremark, a Life Reimagined for WorkPledge signer, offers a “snowbird” program inwhich several hundred pharmacists and otheremployees from northern states are transferredeach winter to pharmacies in Florida and otherwarmer states. This program not only appeals toolder workers, but helps CVS keep up with thesurge in the southern business that it experiencesduring the colder months and creates training andmentorship for newer employees.
The Home Depot, known for hiring thousands ofolder workers, considers their experience to be abig advantage. Specifically, the company valuesolder workers’ flexibility and knowledge. Theirflexibility makes it easier for managers to fill weeklystore schedules. Many of The Home Depot's olderworkers are so knowledgeable that the companyhas designated thousands of them “associatecoaches” to train and mentor younger workers.
Source: Steven Greenhouse. “The Age Premium:Retaining Older Workers,” May 14, 2014. The NewYork Times. (Although the article did not mention thatCVS is a Life Reimagined for Work Pledge signer, thisinformation has been inserted here as another exampleof CVS’s demonstrated efforts to appeal to olderworkers.)

A Business Case for Workers Age 50+: A Look at the Value of Experience 201570
Examples of Successful Employer Strategies That Leverage Age 50+ Talent
The remainder of this chapter highlights organizations that utilize robust strategies to leverage
the age 50+ workforce. Many of these employers are Life Reimagined for Work Pledge signers
or AARP Best Employers for Workers Over 50. Except where otherwise noted, these examples
come from interviews the Aon Hewitt research team conducted with senior human resource
professionals in the companies profiled.
For additional examples, see best practices of the winners of the AARP Best Employers for
Workers Over 50 award, published on the AARP Employer Resource Center,
www.aarp.org/employers. The AARP Best Employers program, which ran from 2001-2013,
recognized leading employers that have outstanding practices and programs to attract, retain,
and engage older workers.

A Business Case for Workers Age 50+: A Look at the Value of Experience 201571
AlliedBarton Focuses on Age 50+ Hiring to Deliver Stability and Mentoring Opportunities
AlliedBarton Security Services, a Life Reimagined for Work Pledge signer, is the largest
American-owned security officer services company. Established in 1957 and headquartered in
Conshohocken, Pennsylvania, AlliedBarton has more than 55,000 employees across the United
States and provides services to 200 Fortune 500 companies as well as other smaller
organizations.
As part of its efforts to attract and retain employees, AlliedBarton offers a full range of benefits,
including health care benefits, wellness programs, and an Employee Assistance Program. In
addition, the company reports that it is proud to be the only security company that offers a
401(k) plan with company contributions.
Tenure Brings StabilityFor AlliedBarton, workers age 50 and older are a truly valued resource. The company analyzes
its workforce demographics and retention statistics extensively and has found that workers in
older age segments have longer tenure, and therefore add an element of stability to the
organization. AlliedBarton’s other largest hiring cohort, military recruits, tends to stay only
around five years.
Targeted RecruitingThe company’s focus on workers age 50 and older is most pronounced in its recruiting
practices. Jerold Ramos, director of strategic recruiting for AlliedBarton, cites its collaboration
with AARP to hold job fairs and find candidates, along with the company’s participation in the
Department of Labor’s “Older Workers Week” to attract more senior talent. In 2013, its recruiting
department published the Top Ten Reasons to Hire Experienced Workers—a testament to its
hiring philosophy and practices. Senior HR leaders use the publication during conference
presentations and public speaking events, as well as internally to educate recruiters on the
value of hiring experienced workers.
While the company encourages hiring managers to look at the advantages of older workers, it is
important to note that they do not encourage those hiring managers to avoid hiring younger
workers.
A Culture of Mentoring
AlliedBarton has both formal and informal mentorship policies and programs. Formal programs
are used for the company’s security operator roles, while the rest of the company fosters an
open environment of what they call “organic mentoring,” where experienced workers partner
with and train younger workers as part of the onboarding process. For example, the company’s
Security Academy In Leadership (SAIL) pairs mentors who provide their expertise to less
experienced individuals to help them advance their careers, enhance their education and build
their networks.

A Business Case for Workers Age 50+: A Look at the Value of Experience 201572

A Business Case for Workers Age 50+: A Look at the Value of Experience 201573
WellStar Health System “Encourages People to Stay”
WellStar Health System, a multi-year AARP Best Employer winner and a Life Reimagined for
Work Pledge signer, is a not-for-profit integrated health care delivery system that includes
hospitals, urgent care facilities, physician offices, home health, hospice, and health parks. It is
headquartered in Marietta, Georgia, and employs nearly 14,000 people.
Nine years ago, WellStar embarked on a board-approved strategy to become an “employer of
choice,” recognizing that a highly trusting, highly engaging environment that values longer-
service employees was required to attract and retain critical talent. WellStar has used these
tactics to recruit and retain talent. Health care is a very competitive field, particularly with
shortages in critical areas such as specialty nurses, physicians and IT professionals skilled with
health care technology.
Rewards and RecognitionAlong with comprehensive health care coverage, WellStar offers both a defined contribution
plan and a traditional employer-sponsored pension plan—which permits in-service distributions
beginning at age 62 ½ while an individual is still actively employed. This pension plan enables
employees to continue working while receiving a benefit and has encouraged older workers to
remain in the workplace longer.
WellStar’s new wellness initiative, HealthStart, is designed to help employees of all ages stay
healthy. As part of this program, WellStar has opened or is currently building fitness centers in
each of its locations—many with on-site coaches. To further support employee wellness, food
services has color-coded items to indicate the nutritional value of food choices available in its
hospitals and help employees make better choices, with subsidies for healthier items.
Beyond competitive benefits, WellStar recognizes employees based on years of service.
Specifically, it recognizes service milestones in five-year intervals, from 5 years up to 45 or
more years of tenure, through large-scale on-site events—complete with live music—that
publicly celebrate employees. During and after these events, employees receive gifts, checks,
and have their photo taken with the CEO. Three team members will be recognized for 50 years
of service in 2015.
Right People, Right Place, Right TimeToday, the average age of WellStar’s employees is 43. A third of its current workforce is age 50
and older, and more than 80% of its employees are female. As a result, the company has
focused its efforts on being a great place for working mothers and a benchmark for older
workers. As part of this effort, WellStar introduced FlexWorks, a program designed around a
simple philosophy—get the right people, at the right place, at the right time.
FlexWorks enables managers and team members to consider alternative ways to work, and
includes a variety of elements such as telework, job sharing, and unique shifts and schedules.

A Business Case for Workers Age 50+: A Look at the Value of Experience 201574
In addition to the variety of work arrangements available through FlexWorks, WellStar offers
numerous additional programs to allow people to work longer, including back-up care for aging
parents through Bright Horizons (in addition to the back-up child care more frequently offered by
employers), and a free on-site concierge service to help employees with errands and car
maintenance. Through WellStar’s employee assistance program, employees can talk with an
attorney and an accountant, access counseling services, and more.
Employee Engagement MeasurementOlder workers at WellStar are actively involved in designing new hospitals, directing efficient
renovations in the flagship hospital, and redesigning patient care areas and work processes to
influence the way day-to-day work gets done. WellStar’s efforts to create a work environment
that appeals to workers of all ages have resulted in significantly increased employee
engagement since 2009, when the majority of the programs described above were
implemented. Although engagement has increased within all employee age groups, workers
age 50 and older have the highest levels of engagement. (See Exhibit V-2.) In addition to the
programs described above, other major initiatives implemented by WellStar may have
contributed to the growth in engagement scores.
High employee engagement across all age groups has helped WellStar receive the Gallup
designation as a Great Place to Work, as well as its ranking of 39 on the 2014 Fortune 100 BestCompanies to Work For list.
According to WellStar, its treatment of employees has created a strong culture of trust and
respect. Its zero lay-off policy means that, even if the organization finds itself having to eliminate
positions, it will help the affected employees find other jobs, either in other parts of the
organization or externally. The fact that it receives more than 200,000 job applications each
year suggests that it is well regarded by job seekers.

A Business Case for Workers Age 50+: A Look at the Value of Experience 201575
Exhibit V-3
WellStar Engagement Levels by Age

A Business Case for Workers Age 50+: A Look at the Value of Experience 201576
S&T Bancorp Hires from All Stages of Life
The mission of S&T Bancorp, Inc. is to become the financial services provider of choice in
western Pennsylvania by delivering exceptional service and value “One Customer at a Time.”
Community-Driven
S&T strives to create a “true community bank environment” in which employees are recognized
as its most valuable asset. While S&T is known for its customer service, the company is equally
focused on replicating that service culture for its own employees.
A variety of programs and activities enable this environment—from events to support new
product rollouts that bring employees together, to announcements of births, promotions and
transfers, and an internal calendar with employee birthdays and anniversary dates. The
organization stays connected with its retirees by communicating on a regular basis, inviting
retirees to organization events, providing them with ongoing access to retirement planning
workshops and information, and by formally acknowledging employees on their retirement.
Retirees can work for S&T Bank in part-time or temporary positions, and by doing consulting or
contract work.
Progressive Recruiting and Rehiring
Like other leading organizations, S&T embraces a variety of flexible work arrangements,
including flex-time, part-time, and telecommuting that benefit younger and older workers alike.
However, in addition to these more traditional flexible arrangements, the company leverages
two innovative approaches to attract and retain older, more experienced workers:
Hiring Retirees via Temp Agency: S&T partners with a local temp agency that specializes in
retirees returning to work on a part-time basis. The company has found this mutually beneficial,
as the returning older employees enjoy the opportunity to mentor younger staff, and S&T is able
to leverage their expertise to improve performance and productivity as younger employees learn
about the business.
New Choices, New Options Referral Program: S&T also works with New Choices, New
Options, a local non-profit employment referral service for people 40 years of age or older. This
enables the company to hire older workers with specialized skills by re-employing many of its
own retirees on a part-time basis, as well as hiring retirees of other local companies.
Through its own internal employee referral program, S&T has also found that many applications
for open positions come from referrals by active employees who encourage retired friends and
family members to apply. As a result of all of these recruiting practices, S&T reports that nearly
20 percent of its new hires in 2013 were age 50 or older. (See Exhibit V-3.)

A Business Case for Workers Age 50+: A Look at the Value of Experience 201577
Encouraging Health and Wellness
S&T believes that its health care benefits and wellness program support the physical well-being
of all employees. With nearly 70% of employees participating in biometric screenings this past
year, S&T reports that employee participation in its wellness programs is above average and
has likely contributed to the health of its workforce and, therefore, the ability of workers to
remain active longer.
The Benefits of Tenure
While S&T’s pension plan was closed to new entrants in 2008, many older workers remain
eligible for the plan, and all employees are eligible for the company’s 401(k) plan. In addition, it
offers an attractive “pre-paid” vacation program, where employees with 15 or more years of
service can purchase up to an extra five days of vacation (all other employees can purchase up
to three extra days). Discounts on financial products (free check re-orders, waived service fees
and discounts on wealth and insurance services) round out the array of benefits and perks S&T
offers employees.
With 43% of its employees over the age of 50, and the average tenure of these workers equal to
13 years of service, S&T believes that the environment it has created appeals to older workers
and contributes to the organization’s success in the marketplace. In fact, S&T Bank was
recently named to the 2014 Bank & Thrift Sm-All Stars list by Sandler O’Neill + Partners. The
annual list recognizes the top performing small-cap banks and thrifts across the nation based on
growth, profitability, asset quality, and capital.
81%
19%
Exhibit V-4S&T New Hires in 2013 by Age
Younger than Age 50
Age 50 or older

A Business Case for Workers Age 50+: A Look at the Value of Experience 201578
National Institutes of Health Mission Transcends Age
Given its role as the nation’s primary medical research agency, the National Institutes of Health
(NIH) actively recruits experienced workers, including scientists, researchers, and grant
reviewers. Most candidates qualified for these jobs aren’t even able to enter the workforce until
their mid-30s due to extensive post-graduate education requirements. This has resulted in an
employee population that skews older—51% of its 19,000 employees are age 50 and older, and
19% of its employees are age 60 and older.
46
775
3455
5121
6035
3186
48534 1
0
1000
2000
3000
4000
5000
6000
7000
16-19 20-29 30-39 40-49 50-59 60-69 70-79 80-89 90-100
Co
un
to
fN
IHE
mp
loye
es
Age Range
Exhibit V-5aNIH Workforce by Age (as of October 1, 2014)
230
1015
1902
1145
846
367
58 30
200
400
600
800
1000
1200
1400
1600
1800
2000
16-19 20-29 30-39 40-49 50-59 60-69 70-79 80+
Co
un
to
fN
IHE
mp
loye
es
Age Range
Exhibit V-5bNIH Hires by Age (FY12-FY14)

A Business Case for Workers Age 50+: A Look at the Value of Experience 201579
The average tenure of NIH employees age 50 and older is 15 years. It is common for both
scientists and administrators to remain actively employed five or more years after retirement
eligibility, despite the financial incentive to retire. In fact, over the past three years, nearly one in
five employees waited more than 10 years past retirement eligibility to retire.
Administrative Fellows Program
Mentoring is an essential component of the work experience at NIH. Every junior scientist in the
organization is assigned an experienced scientist as a mentor. And through the Administrative
Fellows Program, younger non-scientist employees are assigned to more experienced mentors
to formally develop a talent pipeline. This provides continuity of expertise as older workers
approach retirement.
According to NIH, these programs consistently receive accolades from employees. The younger
workers appreciate the coaching and guidance, and the older, more experienced workers feel
energized by the ability to teach and train the next wave of talent to fulfill the NIH mission.
A Mix of Traditional and Progressive Benefits
In addition to competitive medical benefits for active employees, NIH offers retiree medical
coverage at the same cost to participants as the active employee premium rates—a rare
offering in 2014. NIH also offers both a defined contribution 401(k) plan and a defined benefit
pension plan to employees.
1896
1663
1911
1241 1287
834
524
241101 32 9 2
0
500
1000
1500
2000
2500
0-4 5-9 10-14 15-19 20-24 25-29 30-34 35-39 40-44 45-49 50-54 55+
Co
un
to
fN
IHE
mp
loyee
s
NIH Years of Service
Exhibit V-5cNIH Years of Service (Age 50+ Employees)
Data as of October 1, 2014

A Business Case for Workers Age 50+: A Look at the Value of Experience 201580
While NIH’s formal flexible work options and paid time off for caregiving are popular across all
age groups, the organization has several programs specifically designed to appeal to older
workers. They include Fit Plus, a low-impact fitness program designed for older individuals, and
on-site and back-up childcare that includes eligibility for employees’ grandchildren.
An Appealing Cause
The NIH mission serves as a great recruiting tool for older talent, especially for experienced
workers looking to contribute to a cause. With high engagement and multiple employer
recognition awards (including 1st place on both the 2013 AARP Best Employers for Workers
Over 50 list and the 2014 Universum America’s Ideal Employers list), NIH is clearly doing
something right to appeal to its workforce, especially to older workers.

A Business Case for Workers Age 50+: A Look at the Value of Experience 201581
Michelin Believes Experienced Workers Are the Backbone of the Company
Michelin is in year seven of a health program called “Choose Well–Live Well.” Cited by the U.S.
Department of Health and Human Services as an example of innovation, and awarded an
Honorable Mention in the C. Everett Koop National Health Award competition, this award-
winning wellness program helps employees achieve physical, emotional, and financial health.
By viewing health as a shared responsibility between the company and its people, Michelin
realizes the benefits of healthier and happier employees who can concentrate on their jobs and
deliver productivity.
An Ergonomic Advantage
The company is continuously evaluating and redesigning workplaces and processes to be
increasingly ergonomic, especially given the evolution of the automobile industry and the
resulting need for ever-larger (and heavier) tires. Michelin, for example, continues to invest in
automation systems for employees who have heavy lifting and/or repeated motions in their job
responsibilities in its manufacturing plants.
The Part-Time Return of Retirees
For retirees who return to work, Michelin offers part-time work as well as the opportunity to have
flexible hours for certain job positions. In addition, as briefly referenced elsewhere in this report,
the company established a formal Returning Retiree Employee program (RRE) that allows
former employees to return to Michelin on a reduced schedule if they want to continue working.
Michelin’s Human Resources department manages the Returning Retiree Employee program
and connects with retirees who express interest in returning to work. Retirees who participate in
this program return to work for a number of hours that is dependent upon their interest and the
needs of the business.
The retirees who return appreciate the social aspects of their continued working years, and
Michelin appreciates the mentoring and advice that they offer to younger employees. These
programs reflect the value Michelin places on a multi-generational workforce.
Experience = Results
As Barry Cross, senior director of compensation and benefits for Michelin notes, “Nearly 40
years ago, Michelin began its tire operations in Greenville, S.C, with a group of talented,
dedicated employees who helped build our presence in the U.S. from the ground up. In large
part because of that experienced workforce, Michelin is a leading four-generation company that
designs, manufactures and sells tires for every type of vehicle. Our longer-service employees
are the backbone that has helped the Company grow and have consistent performance year
over year.”
A Business Case for Workers Age 50+: A Look at the Value of Experience 201582
Leading Organizations Focus on the Attraction, Retention, and Engagement of Workers
Age 50+
The market reality is that most employers still have not developed their own approach to a
cohesive workforce plan including workers age 50+. The insights shared by these leading
employers present valuable and replicable practices that employers of all sizes and across all
industries can leverage.
Specific examples to create an attractive environment and culture include:
Offering flexible work arrangements Focusing on diversity and inclusion Recognizing employee service Fostering retiree communications and involvement Creating formal mentoring and knowledge transfer programs Establishing and promoting affinity groups Offering ergonomic changes and job redesign.
As the employers featured in this chapter have illustrated, creating and nurturing a corporate
environment that champions generational diversity and inclusion often delivers tangible results
to the corporate bottom line.
A Business Case for Workers Age 50+: A Look at the Value of Experience 201583
Conclusion
Each chapter of this report has presented compelling findings that support the business case for
attracting, engaging, and retaining age 50+ workers as a critical component of a multi-
generational workforce. In summary:
The rapid growth of the older workforce relative to younger workers will impact talent supply;
workers age 50+ can help employers address current and future talent shortages.
Workers age 50+ add value to organizations due to their high levels of engagement,
stability, productivity, and innovation.
The market evolution in compensation and reward design over the past decade has created
a more age-neutral distribution of labor costs, meaning that the incremental costs
associated with retaining and recruiting more 50+ workers are minimal to nonexistent and
may be far outweighed by the value that these workers add.
Workers age 50+ want to be in the workforce and anticipate a longer working career, making
it critical for employers to understand the preferences of this group.
Best practices to recruit, retain, and engage workers age 50+ can be replicated by
employers of all sizes and across all industries.
The findings in this Business Case for Workers Age 50+ report have several implications for
employers. Those who wish to capitalize on the value these workers can bring to the bottom line
and reduce the risks of current and future skills gaps should embrace the following tactics in
their employment and program development strategies:
Skills and Career Development Opportunities: Older workers want the opportunity to
use and expand their skills in order to remain productive and expand their career options.
They consider on-the-job training to be an important part of an ideal job. Therefore,
employers who want to recruit and retain older workers should be sure to offer them skills
development, including work-based learning, tuition reimbursement, scholarship programs,
and other opportunities for continuous learning. While a large percentage of learning will be
“on the job,” the ability to provide rotational opportunities and, where needed, access to
supplemental structured learning, will be critical for employers and their employees to keep
up with evolving business practices and technologies.
Mentoring and Knowledge Transfer: As employees transition to retirement, organizations
need a process to transfer key knowledge to the next generation of employees. Leveraging
older employees to facilitate knowledge transfer and mentoring and to provide advice
regarding succession planning is engaging to older workers and benefits the next
generation taking on new responsibilities.

A Business Case for Workers Age 50+: A Look at the Value of Experience 201584
New Career Models: Many older workers want the ability to “dial up or down” their career
trajectories and work schedules. Current career models and career paths in many
organizations remain linear. One notable exception is the health care industry, which for
many decades has embraced flexibility in work arrangements, with alternative shifts, per
diem arrangements, and a variety of full-time, part-time, and contract employment options.
Other industries can learn from the health care industry, as its model promotes the
retention of valuable experienced talent.
Benchmarking and Best Practices: Employers stand to learn a great deal by
benchmarking against successful practices of leading companies, and adopting those
practices that are an appropriate fit for their workforce, desired culture, and business
needs. Much in the same way that employers benchmark the value of their total rewards,
they can also measure and compare their practices of attracting, engaging, and retaining
an older workforce.
Fostering Connections: Maintaining strong connections with retirees—whether through
social media, in-person events or other channels—makes it easier to tap this talent for
temporary or project-based assignments.
This report demonstrates the value of older workers to businesses today and in the future. It
also shows that the cost to employ older workers is minimally higher—if at all—than employing
younger workers.
Labor trends are clear: working Americans will remain in the workforce longer than in the past.
This represents a significant opportunity for businesses to benefit from recruiting, retaining, and
engaging workers age 50+.

A Business Case for Workers Age 50+: A Look at the Value of Experience 201585
Appendix
A Look at the Affordable Care Act (ACA), Related Trends, and Their Impact on the
Business Case
As noted in Chapter 3, multiple changes in the health care landscape, the implementation of the
Affordable Care Act (ACA), and emerging trends in employer-provided health benefits affect
employer health benefit costs. Some emerging trends that are directly related to the ACA, which
may be relevant to the business case, are as follows:
Managing health benefit costs in order to avoid the Affordable Care Act excise tax;
and
The emergence of private health care exchanges and defined contribution models of
health care.
Employers Design Plans to Manage the Excise Tax
The ACA’s excise tax (also known as the “Cadillac Tax”), which takes effect in 2018, is a 40%
levy on high-cost health plans. The financial impact of the excise tax is a significant incentive for
employers to keep health benefit costs under the threshold that triggers the tax. Most large
employers have already determined where their health benefit plans will stand relative to the
excise tax threshold in 2018, and those who are in danger of being above the threshold have
begun to make adjustments to reduce plan cost and avoid paying the tax.
The adjustments that employers are making to reduce overall plan costs fall into three main
categories:
Emphasizing wellness,
Providing employees tools to help them compare treatment options, provider quality and
provider costs, and
Increasing employee cost sharing (including higher deductibles, copays, and coinsurance),
and otherwise reconfiguring health benefit designs.
By deploying some or all of these tactics, employers hope to reduce the cost of their health
benefits and avoid reaching the excise tax threshold. However, the excise tax threshold
increases at a rate tied to the Consumer Price Index (CPI) while health care costs are expected
to continue to increase faster than CPI. As a result, many employers expect to reach the excise
tax threshold at some point between 2018 and 2023.
It is expected that, as costs reach the excise tax threshold, many employers will define the
excise tax dollar limit as the maximum (cost effective) amount that should be spent on health
care benefits. When this happens, the employer’s health benefit cost is determined by this limit

A Business Case for Workers Age 50+: A Look at the Value of Experience 201586
instead of by their employees’ use of health care. This change could in effect minimize any
concerns about hiring older workers due to a potential higher cost to the health plan.
Growing Number of Employers Moving Towards Defined Contribution Health Care
Delivered Through Private Exchanges
One growing trend is employers moving towards a defined contribution health benefit strategy
where the employer provides a fixed amount to employees to purchase a health insurance plan.
In implementing this approach, the health plan the employee purchases must be insured (either
on a group or individual basis) so that the impact of actual claims (higher or lower than
expected) does not impact the employer’s cost. Most large employers currently offer self-
insured plans where their costs depend on their workers’ actual claims.
With the advent of the ACA, some entities have begun increasingly offering private health care
exchanges. Private exchanges contract with health plans to provide ACA compliant plan options
and with employers who offer these health plans to their employees. Under this approach,
employees may be able to choose from a wider selection of health plans than their employer
may have otherwise been able to offer. And the employer is able to reduce their administrative
burden and limit their financial exposure.
The employer may vary the employee subsidy based on the employee’s pay level, geographic
location or family status. But under a fully insured arrangement, once the employer’s subsidy is
determined, the fixed amount represents the employer’s defined contribution towards that
employee’s health care benefits. This is because when a plan is fully insured, the employer’s
costs are not subject to any variation due to actual claims experience.
Similar to the excise tax discussion, the expectation is that a defined contribution approach will
also remove the health care cost age factor from the hiring decision.
Some Employers May Choose to Eliminate Employer-Provided Health Coverage
One additional longer-term trend, affected by the ACA, is that some employers may ultimately
elect to not offer health insurance at all, but rather will pay the ACA penalties and direct
employees to the public exchanges. When surveyed, only 6% of large employers say they are
considering this approach.91
The ACA public health care exchanges offer guaranteed access to coverage. Eligibility for a
subsidy to help with the cost of the premium is determined by an individual’s income relative to
federal poverty limits. In the public exchange health plan, premiums are based on age, so older
workers who do not receive employer-sponsored health benefits bear some impact of age-
related health costs. If they are eligible for subsidies, the older worker’s subsidy reflects the age-
adjusted premium cost. The effect of this response to ACA would remove the cost of health care
from the employer’s hiring decision.

A Business Case for Workers Age 50+: A Look at the Value of Experience 201587
Conclusion
Although it is still too early to know the full implications of ACA for employers in general, and
more specifically for the business case for workers age 50+, many employers have or are
considering altering their health benefits strategy. Further, the emerging trends seem to suggest
that the changes may reduce rather than increase employer’s concerns over the health care
costs of older workers when making hiring decisions. However, these same trends are likely to
shift more risk to employees, which may in turn make it more important that they continue to
work to pay for their health care coverage and costs.

A Business Case for Workers Age 50+: A Look at the Value of Experience 201588
Endnotes
1Towers Perrin and AARP. The Business Case for Workers Age 50+: Planning for Tomorrow’s Talent
Needs in Today’s Competitive Environment. 2005. AARP.2
Manpower Group 2014 Talent Shortage Survey of 1,013 U.S. employers, and over 37,000 employersglobally.3
Society for Human Resource Management. “The Aging Workforce -- State of Older Workers in U.S.Organizations.” 2014 Older Workers Survey. (Reflects responses of more than 1,900 randomly selectedHR professionals from SHRM’s membership. Survey was fielded from May through July 2014.)4 Aon Hewitt Engagement Database 2009- 2013, covering 2M employees in 276 organizations.5
Aon Hewitt 2014 Trends in Global Employee Engagement report. Analysis included 284 global companiesin the Aon Hewitt database, with correlation of 2010–2012 employee perceptions with 2012 financialperformance in sales growth, operating margin and total shareholder return (TSR). Aon Hewitt comparedthree groups of companies against companies with average engagement: bottom quartile engagementcompanies (those with roughly half or less of their employees engaged), top quartile engagementcompanies (those that have greater than 7 out of 10 employees engaged) and those considered bestemployer companies (all of which are top quartile engagement companies but also have top quartile levelsof leadership, performance and brand).6
Society for Human Resource Management. “The Aging Workforce --Basic and Applied Skills.” 2014 OlderWorkers Survey. (Reflects responses of more than 1,900 randomly selected HR professionals from SHRM’smembership. Survey was fielded from May through July 2014.)7
Borsch-Supan, Axel and Matthias Weiss. Productivity and Age: Evidence From Work Teams at theAssembly Line. Munich Center for the Economics of Aging. 2013.8
Aon Hewitt Engagement Database 2009-2013; 2014 analysis of Aon Hewitt normative survey datacovering 2M employees in 276 organizations.9
AARP and SHRM. What Are Older Workers Seeking?: An AARP/ SHRM Survey of 50+ Workers. June2012. (This nationally representative survey of 1,004 adults ages 50+ who were working or looking for workwas conducted in May 2012.)10
U.S. Census Bureau, 2011 County Business Patterns. Data file entitled “Number of Firms, Number ofEstablishments, Employment, and Annual Payroll by Large Enterprise Employment Sizes for the UnitedStates, NAICS Sectors”:http://www2.census.gov/econ/susb/data/2011/us_naicssector_large_emplsize_2011.xls11
Aon Hewitt analysis of Bureau of Labor Statistics data and Mitra Toosi, Monthly Labor Review, December2013, utilizing Bureau of Labor Statistics (BLS) data12
Ibid.13
Alicia H. Munnell. "The Average Retirement Age - An Update," Issue in Brief 15-4. 2015. Chestnut Hill,MA: Center for Retirement Research at Boston College. ( "Average retirement age" is defined as the age atwhich the labor force participation rate drops below 50%.)14
Individuals born between 1938 and 1942 must wait a certain number of months after turning age 65 toreceive full Social Security retirement benefits, while those born between 1943 and 1954 (that is, thosecurrently likely to be considering retirement) must until age 66 to receive full Social Security benefits. Forthose born after 1954, the full retirement age increases gradually until reaching age 67 for those born in1960 or later (www.socialsecurity.gov/planners/retire/retirechart.html)15
Aon Hewitt analysis of Society of Actuaries (SOA) mortality table and mortality improvement scaleapplicable in 2014 (RP-2014 table and MP-2014 improvement scale from year 2014 study) compared tothose applicable in 2005 (RP-2000 table and AA improvement scale from year 2000 study). SOA periodicallyreviews life expectancy assumptions and publishes mortality tables used by actuaries for employeepopulations consistent with a Fortune 1000 workforce. The studies represent life expectancies indicative oflarge employer populations covered by private retirement plans and more broadly explore mortalityimprovement from Social Security mortality experience. 2005 life expectancy was calculated using RP-2000table projected fully generational using scale AA. 2014 life expectancy was calculated using RP-2014 tableprojected fully generational using scale MP-2014. Life expectancy for those age 55 uses employee mortalityrates; life expectancy for those age 65 and 75 use healthy annuitant mortality rates. The 2014 studyreflected plan experience from 2004-2008 including 10.5 million life years of exposure. Mortalityimprovement scale MP 2014 was developed using Social Security mortality data.16
ManpowerGroup 2014 Talent Shortage Survey of 1,013 U.S. employers and over 37,000 employersglobally

A Business Case for Workers Age 50+: A Look at the Value of Experience 201589
17Pricewaterhouse Coopers. “Leading in Extraordinary Times: The 2015 U.S. CEO Survey Essay,” 18
th
Annual Global CEO Survey. 2015. (The survey, which was fielded from September through December2014, included 1,322 CEOs from 77 countries, including 103 CEOs in the U.S. Findings published in thisreport are for U.S. CEOs only.)18
Accenture 2014 Manufacturing Skills and Training Study: Out of Inventory – Skills Shortage ThreatensGrowth for U.S. Manufacturing. Accenture and The Manufacturing Institute.19 U.S. Bureau of Labor Statistics. “Employed persons by detailed occupation and age, 2013 annualaverages” data table. http://www.bls.gov/cps/occupation_age.htm20
Carnevale, Anthony, Nicole Smith, and Artem Gulish. Nursing Supply and Demand Through 2020.Georgetown University Center on Education and the Workforce. McCourt School of Public Policy. 2015.21
The Complexities of Physician Supply and Demand: Projections from 2013 to 2025. AmericanAssociation of Medical Colleges, and IHS, Inc. March 2015.22 Aon Hewitt 2014 Trends in Global Employee Engagement report. Also, see Gallup. “Engagement atWork: Its Effect on Performance Continues in Tough Economic Times” Key findings from Gallup’s Q
12meta-
analysis of 1.4 million employees. Gallup, Inc., 2013.23
Aon Hewitt Engagement Database 2009- 2013, covering 2M employees in 276 organizations.24
Ibid.25 AARP. Staying Ahead of the Curve 2013: The AARP Work and Career Study, National survey of 1502adults age 45-74 who were working or looking for work.26
Taylor, Paul, Rakesh Kochhar, Rich Morin, Wendy Wang, Daniel Dockterman, and Jennifer Medina.America’s Changing Workforce: Recession Turns a Graying Office Grayer. Pew Research Center.September 2009. (2009 survey of 1,140 respondents employed full-time or part-time who were askedwhether they currently work because they need the money, want to work, or both.)27
Aon Hewitt 2014 Trends in Global Employee Engagement report . Analysis included 284 globalcompanies in the Aon Hewitt database, with correlation of 2010–2012 employee perceptions with 2012financial performance in sales growth, operating margin and total shareholder return (TSR). Aon Hewittcompared three groups of companies against companies with average engagement: bottom quartileengagement companies (those with roughly half or less of their employees engaged), top quartileengagement companies (those that have greater than 7 out of 10 employees engaged) and thoseconsidered best employer companies (all of which are top quartile engagement companies but also have topquartile levels of leadership, performance and brand).28
Ibid.29
Gallup. “Engagement at Work: Its Effect on Performance Continues in Tough Economic Times” Keyfindings from Gallup’s Q
12meta-analysis of 1.4 million employees. Gallup, Inc., 2013.
30Ibid.
31Aon Hewitt Engagement Database 2009-2013, covering 2M employees in 276 organizations
32Ibid.
33Aon Hewitt estimates.
34AARP Trend and Opinion Monitor Survey – Technology Insert (July 2014 and August 2011). Nationally
representative telephone survey. In July 2014, the technology questions were fielded to a sample of 1,520adults ages 50+. In August 2011, the technology questions were fielded to a sample of 1,172 adults ages50+. Findings cited in this paragraph refer to findings from the subset of respondents ages 50+ who wereeither employed or looking for work at the time of the survey (622 in July 2014, and 485 in August 2011).35
Ibid.36 Morrison, Patrick and Emerson Murphy-Hill. “Is Programming Knowledge Related to Age?” (February2013). North Carolina State University.37 Alcorn, Brandon, Gayle Christensen, and Ezekiel Emanuel. “Who Takes MOOCs? For Online HigherEducation, the Devil Is In the Details”; survey results published in New Republic, January 4, 2014.38
Towers Perrin and AARP. Investing in Training 50+ Workers: A Talent Management Strategy. 2008.Survey results are based on a nationally representative survey of 1,048 workers age 50+ who wereemployed at companies with at least 10 employees. Survey was fielded in December 2006.39
Tompson, Benz, Agiesta, and Junius. America’s Lower-Wage Workforce: Employer and WorkerPerspectives. 2013. The Associated-Press-NORC Center for Public Affairs Research. (Survey of workers,which was conducted in 2012, included 1,606 adults ages 18-74 who were currently employed—excludingself-employed-- or on temporary layoff and earning $35,000 or less, full-time equivalent, per year. Resultsfor workers over the age of 50 shown in this report were obtained from the survey’s data file available atwww.apnorc.org.)40
Borsch-Supan, Axel and Matthias Weiss. Productivity and Age: Evidence From Work Teams at theAssembly Line. Munich Center for the Economics of Aging. 2013

A Business Case for Workers Age 50+: A Look at the Value of Experience 201590
41Gorodnichenko, Yuriy, John Laitner, Jae Song, and Dmitriy Stolyarov. Technological Progress and the
Earnings of Older Workers. October 2013. The University of Michigan Retirement Research Center. Utilizinghistorical data from the Social Security Administration’s Continuous Work History Sample (CWHS) and theBureau of Labor Statistics (BLS). (This study examined how older workers were affected by technologicalprogress by tracking increases in Total Factor Productivity (TFP) in relation to earnings of workers. TFP is amacro-level measure of the joint effects of many factors including research and development, newtechnologies, economies of scale, managerial skill, and organizational changes. The authors found that theearnings of workers over age 60 increase with TFP growth about 90% as well as workers age 25-30, butthat an older workforce leads to net “efficiency gains with age from accumulated human capital.” Theyconcluded that an aging labor force is a more productive labor force.)42
Munnell, Alicia, Steven Sass, and Mauricio Soto. Employer Attitudes Towards Older Workers Survey.Center for Retirement Research at Boston College. June 2006 survey of 400 private-sector employers.43
Wadhwa, Vivek. “There’s No Age Requirement for Innovation.” Wall Street Journal. October 28, 2013.http://blogs.wsj.com/accelerators/2013/10/28/vivek-wadhwa-theres-no-age-requirement-for-innovation/44
Peterson, Suzanne J. and Barry K. Spiker. “Establishing the Positive Contributory Value of Older Workers:A Positive Psychology Perspective,” Organizational Dynamics, Vol. 34, No. 2. (2005).45
Munnell, Alicia and April Yanyuan Wu. “Are Aging Baby Boomers Squeezing Young Workers Out ofJobs?” Center for Retirement Research at Boston College (October 2012)46
Gruber, Jonathan and David A. Wise, editors. 2010. Social Security Programs and Retirement around theWorld: The Relationship to Youth Employment. Chicago, IL and London: The University of Chicago Press.(Chapter 12: “Do Elderly Workers Substitute for Younger Workers in the United States?” Gruber, Jonathanand Kevin Milligan. Paper was prepared as part of the National Bureau of Economic Research’sInternational Social Security Project.)47
Society for Human Resource Management. “The Aging Workforce -- Basic and Applied Skills.” 2014Older Workers Survey. January 2015. (Reflects responses of more than 1,900 randomly selected HRprofessionals from SHRM’s membership. Survey was fielded from May through July 2014. Survey questionwas worded as follows: “In your professional opinion, what are the main advantages workers age 55 andolder bring to your organization compared to other workers?”)48
Transamerica. Baby Boomer Workers Are Revolutionalizing Retirement: Are They and Their EmployersReady? December 2014. (Survey was fielded by phone from July 31-September 17, 2014 among anationally representative sample of 751 employers.)49
Ibid.50
Ibid.51
AARP. Employer Experiences and Expectations: Finding, Training, and Keeping Qualified Workers. AnAARP/AARP Foundation survey of 1,003 HR directors at employers with at least 20 employees. Fieldedfrom May through July 2010.52
Society for Human Resource Management. “The Aging Workforce -- State of Older Workers in U.S.Organizations.” 2014 Older Workers Survey. (Reflects responses of more than 1,900 randomly selectedHR professionals from SHRM’s membership. Survey was fielded from May through July 2014.)53
The analysis of cost drivers relies on the best available sources of “current” data (generally from 2012-2014) on labor costs in large companies. In order to demonstrate the changes since the original AARPbusiness case study was published, the comparisons to costs in previous years utilizes as much relevantdata as possible starting from around 2005. The timeframes used to analyze changes in particular laborcosts vary depending on the timeframes covered by the best available data sources for each type of laborcost.54
Aon Hewitt's Benefit SpecSelect™. The 2013 Benefit SpecSelect contains salaried benefit information for1,093 major U.S. organizations, including 50 in the energy/oil/mining industry, 173 in financial services, 81 inhealth care, and 103 in the retail industry.55
Towers Perrin and AARP. The Business Case for Workers Age 50+: Planning for Tomorrow’s TalentNeeds in Today’s Competitive Environment, December 2005; pages 45-46. (Calculated from Towers Perrin2005 Benval data for 225 Fortune 500 companies in a range of industries).56
Aon Hewitt U.S. Salary Increase Survey 1990–2013. 36th annual survey focuses on overall changes inemployee compensation for the calendar year 2012, and on projections for 2013. Information was collectedduring June and July from 1,306 organizations. Participants included 788 service organizations, 508manufacturing organizations, and 10 multi-industry organizations.57
Aon Hewitt's Benefit SpecSelect™. The 2004 Benefit SpecSelect data contains salaried benefitinformation for 936 major U.S. organizations.58
Aon Hewitt's Benefit SpecSelect™. The 2013 Benefit SpecSelect contains salaried benefit information for1,093 major U.S. organizations, including 50 in the energy/oil/mining industry, 173 in financial services, 81 inhealth care, and 103 in the retail industry.
A Business Case for Workers Age 50+: A Look at the Value of Experience 201591
59Truven Health Analytics, September 2013. Calculations of the increases in employer claims costs are
based on a comparison of medical claims paid by large employers in 2011 and in 2003. Includes claimsexperience of more than 341 employers representing 14.6 million covered lives and crossing the fullspectrum of industry types, health plans, and pharmacy benefit managers. Data is aggregated at theemployer level, rather than claim or member level. This means results for each employer included in a normreceive equal weight, so that a single large employer does not skew the results.60
2013 Aon Hewitt Universe Benchmark data, which covers 104 companies (with a total of 3.5 millionemployees) that are Human Resources Outsourcing clients of Aon Hewitt. This includes 59 companies(with1.8M employees) in the four industries of focus: 12 companies in the energy industry (100Kemployees), 20 companies in the financial industry (370K employees), 9 companies in the health careindustry (125K employees), and 18 companies in the retail industry (1.2M employees).61
Aon Hewitt Health Value Initiative (HHVI)™ database. Launched in 1996, this database captures healthcare cost and benefit data for 13 million health plan participants, across 550 organizations and 1,260 healthplans. Database includes $64.8 billion in health care expenditures. (Statistics current as of July 24, 2014;data updated weekly.)62
Ibid.63
Truven Health Analytics, September 2013.64
Ibid.65
Ibid.66
Towers Perrin and AARP. The Business Case for Workers Age 50+: Planning for Tomorrow’s TalentNeeds in Today’s Competitive Environment, December 2005; page 50.67
Hill, Rhonda K., Joseph W. Thompson, Jennifer L. Shaw, Sathiska D. Pinidiya, Paula CardHigginson“Self Reported Health Risks Linked to Health Plan Cost and Age Group,” American Journal of PreventiveMedicine, Volume 36, Issue 6. June 2009. Also, see Dee W. Edington, University of Michigan HealthManagement Research Center, “Emerging Research: A View from One Research Center,” AmericanJournal of Health Promotion, 2001.68
Aon Hewitt 2014 Health Care Survey of 1,234 employers.69
Aon Hewitt 2013 Benefit SpecSelect™, containing salaried benefit information for 1,093 major U.S.organizations, including 50 in the energy/oil/mining industry, 173 in financial services, 81 in health care, and103 in the retail industry. (Just 18% of large employers make age-based contributions to their DC plans,meaning that the employer’s contribution under the DC plan is based at least in part on the employee’sage. For example, the employer contribution under the DC plan may be based on age + service (oftenreferred to as “points”). The employer may give participants with under 60 points a fixed 4% DCcontribution, while participants with 60 points or more receive a fixed 5% DC contribution.)70
Based on average values from Aon Hewitt Benefit Index™. Five-year average contributions were usedwhen level is variable. Estimated long-term costs for pension plans range from 3.0% to 6.0% (4.5% midpointgraphed).71
The median salary data in the hiring and retention scenarios relied on compensation data from the Bureauof Labor Statistics Occupational Outlook Handbook to determine average cash compensation for thepositions studied. The average benefit costs in each industry came from a current snapshot of Aon Hewitt’sBenefit SpecSelect database containing benefit information for over 1,000 major U.S. organizations. Under“value considerations,” the potential value of avoiding turnover (shown as the average one-time turnovercosts) are estimated as explained in Chapter 2 (Exhibits II-5a and 22-5b) using the available benchmarkdata from Saratoga Institute for each of the four industries examined.72
Employee Benefit Research Institute and Greenwald & Associates, 2004 and 2014 RetirementConfidence Surveys. National survey of 1,501 individuals age 25 and over in 2014 (1,000 workers and 501retirees) and 1,002 individuals in 2004 (783 workers and 219 retirees). AARP used the survey data filesfrom 2014 and 2004 to calculate the 2014 and 2004 results for workers ages 45+.73
Employee Benefit Research Institute and Greenwald & Associates, 2004 and 2014 RetirementConfidence Surveys. AARP used the survey data files from 2014 and 2004 to calculate the 2014 and 2004results for workers ages 50+.74
Helman, Ruth, Nevin Adams, Craig Copeland and Jack VanDerhei, “The 2014 Retirement ConfidenceSurvey: Confidence Rebounds—for Those With Retirement Plans,” EBRI Issue Brief, no. 397, March 2014.National survey of 1,000 1,501 individuals age 25 and over in 2014 (1,000 workers and 501 retirees).75
AARP and SHRM. What Are Older Workers Seeking?: An AARP/ SHRM Survey of 50+ Workers. June2012. (This nationally representative survey of 1,004 adults ages 50+ who were working or looking for workwas conducted in May 2012.)76
AARP. Staying Ahead of the Curve 2013: The AARP Work and Career Study. National survey of 1502adults age 45-74 who were working or looking for work.
A Business Case for Workers Age 50+: A Look at the Value of Experience 201592
77AARP and SHRM. What Are Older Workers Seeking?: An AARP/ SHRM Survey of 50+ Workers. June
2012. (This nationally representative survey of 1,004 adults ages 50+ who were working or looking for workwas conducted in May 2012.)78
AARP. Staying Ahead of the Curve 2013: The AARP Work and Career Study. National survey of 1502adults age 45-74 who were working or looking for work.79
AARP. Staying Ahead of the Curve 2013: The AARP Work and Career Study. National survey of 1502adults age 45-74. It is worth noting that the results in Exhibit IV-4a and 4b related to reasons for working inretirement were gathered through an open-ended question. This means that the responses are not directlycomparable to the results in Exhibit IV-2a and 2b related to reasons for working as the IV-2a and 2bresponses were gathered through a closed-ended question.80
AARP and SHRM. What Are Older Workers Seeking?: An AARP/ SHRM Survey of 50+ Workers. June2012. (This nationally representative survey of 1,004 adults ages 50+ who were working or looking for workwas conducted in May 2012.)81
Ibid.82
AARP. Staying Ahead of the Curve 2013: The AARP Work and Career Study. National survey of 1502adults age 45-74 who were working or looking for work.83
AARP’s Life Reimagined and USA Today. Reflections on Life & Career. June 2014. This telephonesurvey of 1,006 adults ages 40-59 was conducted in May 2014. Results discussed in this report are for the476 respondents ages 50-59 who were employed or looking for work at the time of the survey. (Launchedby AARP in 2013, Life Reimagined is a first-of-its kind single source of online and offline experiences thatguide people through life transitions by helping them discover new possibilities and connect with acommunity of people pursuing similar passions and goals. For more information about Life Reimagined, seewww.lifereimagined.org.)84
Society for Human Resource Management. “The Aging Workforce -- State of Older Workers in U.S.Organizations.” 2014 Older Workers Survey. January 2015. (Reflects responses of more than 1,900randomly selected HR professionals from SHRM’s membership. Survey was fielded from May through July2014.)85
See, e.g., Galinsky, E., Bond, J.T., and Hill, E.J. (2004); Landauer, J. (1997). Bottom-line benefits ofwork/life programs. HR Focus (July): 3-4; Lineberry, J. & Trumble, S. (2000, Winter). The role of employeebenefits in enhancing employee commitment. Compensation and Benefits Management 16(10), 9-14.86
Corporate Voices for Working Families (2005, November). Business impacts of flexibility: An imperativefor expansion. Washington, D.C.; See also Galinsky, E. Bond, J.T., and Hill, E.J. (2004), When work works:A status report on workplace flexibility. Who has it? Who wants it? What difference does it make? New York,NY: Families and Work Institute.87
Top Workplaces 2014 lists can be found at www.topworkplaces.com. For SAP America’s recognition as aTop Workplace in the Philadelphia area, Atlanta, and the Bay area, see the following three links:http://www.topworkplaces.com/frontend.php/regional-list/list/philly.http://www.topworkplaces.com/frontend.php/regional-list/list/ajc.http://www.topworkplaces.com/frontend.php/regional-list/list/bayarea. Top 100 Companies with RemoteJobs in 2014 can be found at http://www.flexjobs.com/blog/post/100-top-companies-for-remote-jobs/#sthash.8WTI01eo.dpbs.88
WorldatWork. Survey on Workplace Flexibility 2013. (Survey of 566 WorldatWork members, randomlyselected from WorldatWork members with responsibility for total rewards, benefits, work-life, and HRgeneralists. Survey was conducted from July 17 – August 2, 2013.)89
Forbes Insights. Fostering Innovation Through a Diverse Workforce, July 2011. (Report findings based onthe results of a survey and one-on-one interviews conducted by Forbes Insights. Forbes Insights surveyed321 executives with direct responsibility or oversight for their companies’ diversity and inclusion programs.All respondents worked for large global enterprises with annual revenues of more than $500 million. Morethan 40% worked for companies with annual revenues of $5 billion or more. Nearly half (44%) ofrespondents had C-level titles or were board members. The remainder had titles of director or above.90
Metlife. (2014). “Benefits Breakthrough: How Employees and Their Employers Are Navigating an EvolvingEnvironment.” 12th Annual U.S. Employee Benefits Trends Study (Findings published in this report wereprovided by MetLife via email but were not published in the report cited here. The 12
thannual U.S.
Employee Benefit Trends Study included both an employee and an employer survey. The employer surveyfindings were based on completed interviews with 1,510 benefits decision-makers at companies with at leasttwo employees. The survey was fielded in October and November 2013.)91
Aon Hewitt 2014 Health Care Survey of 1,234 employers