mature age women aged care workers: summary of stayers ... · pdf filemature age women aged...
TRANSCRIPT
Mature Age Women Aged Care Workers: Summary of Stayers’ Survey Data (Wave2) ARC Discovery Grant Project (DP110102728): Missing Workers: Retaining Mature Age Women Workers to Ensure Future Labour Security
Siobhan Austen, Therese Jefferson, Gill Lewin, Rachel Ong, and Rhonda Sharp Curtin University and University of South Australia
February, 2014
Suggested citation: Austen, S., Jefferson, T., Lewin, G., Ong, R., and Sharp, R. (2014). ‘Mature Age Women Aged Care Workers: Summary of Stayers’ Survey Data (Wave2)’, Curtin University, Perth.

i
Contents
List of tables ............................................................................................................................. iii
Introduction ................................................................................................................................ 1
Structure of survey and overview of results .............................................................................. 1
Section 1: Current activities .............................................................................................. 3
1.1. Currently work in aged care .................................................................................... 3
1.2 Current working conditions as compared with a year ago ...................................... 4
1.3. Positive changes to the stayers’ working conditions in the past 12 months ............ 4
1.4. Negative changes to the stayers’ working conditions in the past 12 months .......... 5
1.5. Studies for formal qualification in the last year ...................................................... 6
1.6. Thoughts about leaving the aged care sector ........................................................... 8
Section 2. Health ............................................................................................................. 10
2.1. Stayers’ rating of their general health .................................................................... 10
2.2. Illnesses or injuries that have been a hindrance at work in the past 12 months .... 10
Section 3. The physical, mental and emotional demands of the job ............................... 13
3.1. Overall ability to meet the demands of the job ...................................................... 13
3.2. Ability to meet the physical, mental and emotional demands of the job ............... 13
3.3. “Dirty work” .......................................................................................................... 14
Section 4. Family and caring roles at home .................................................................... 15
4.1. Partners .................................................................................................................. 15
4.2. Dependent children ................................................................................................ 16
4.3. Time spent on informal care .................................................................................. 17
4.4. Changes in informal care roles in past year ........................................................... 18
4.5. The effects of informal care roles .......................................................................... 19
Part 5. Working time arrangements .................................................................................. 20
5.1. Current contract of employment ............................................................................ 20
5.2. Current schedule .................................................................................................... 20
5.3. Influence in planning work hours .......................................................................... 21
5.4. Working hours that change at short notice ............................................................ 21

ii
5.5. Weekend shifts ...................................................................................................... 21
5.6. Preferred amount of work per week ...................................................................... 22
5.7. Number of unpaid hours worked each week ......................................................... 22
5.8. Ability to take time off from the job...................................................................... 23
Part 6. Other paid jobs....................................................................................................... 25
6.1. Working in more than one job ............................................................................... 25
Part 7. Working relationships............................................................................................ 26
Part 8. Pay and economic situation ................................................................................... 29
8.1. Usual hourly rate of pay ........................................................................................ 29
8.2. Pay satisfaction ...................................................................................................... 29
8.3. Ability to easily find another job .............................................................................. 31
8.4. Current economic situation .................................................................................... 33
8.5. Changes in economic situation in last year ........................................................... 33
Part 9. Retirement ............................................................................................................. 34
9.1. Thinking about retirement ..................................................................................... 34
9.2. Financial preparation for retirement ...................................................................... 34
9.4. Retirement savings and thoughts about staying in aged care ................................ 35

iii
List of tables
Table 1: Current role in aged care.............................................................................................. 3
Table 2: Current working conditions as compared with a year ago .......................................... 4
Table 3: Positive changes to the stayers’ working conditions in the past 12 months ................ 5
Table 4: Negative changes to the stayers’ working conditions in the last 12 months ............... 6
Table 5: Study for formal qualifications in the last 12 months.................................................. 6
Table 6: Reasons for studying for a formal qualification .......................................................... 7
Table 7: Organisational support for study ................................................................................. 7
Table 8: Whether the stayers had thought about leaving aged care ........................................... 8
Table 9: Frequency of thoughts about leaving aged care .......................................................... 8
Table 10: Reasons for thinking about leaving aged care ........................................................... 9
Table 11: Stayers' rating of their general health ...................................................................... 10
Table 12: Illnesses or injuries that have been a hindrance at work in the past 12 months ...... 10
Table 13: The degree of hindrance caused by illness or injury ............................................... 11
Table 14: Whether the illness or injury was sustained in the last 12 months .......................... 11
Table 15: Number of days off work in the last 12 months because of illness or injury .......... 12
Table 16: Stayers' overall ability to meet the demands of the job ........................................... 13
Table 17: Current ability to meet the physical demands of the job ......................................... 13
Table 18: Stayers' ability to meet the mental demands of the job ........................................... 14
Table 19: Stayers' ability to meet the emotional demands of the job ...................................... 14
Table 20: Stayers' who did dirty work ..................................................................................... 14
Table 21: Stayers who did not live with a partner ................................................................... 15
Table 22: The current situation of stayers who did not live with a partner ............................. 15
Table 23: Partners' current work status .................................................................................... 16
Table 24: Partner's health status ............................................................................................... 16
Table 25: Stayers who had dependent children ....................................................................... 16
Table 26: Number of dependent children ................................................................................ 17

iv
Table 27: Stayers who spent 7 or more hours caring for children each week ......................... 17
Table 28: Stayers who spent 7 or more hours caring for an ill or disabled partner per week . 17
Table 29: Stayers who spent 7 or more hours caring for an ill or disabled family member per week ......................................................................................................................................... 18
Table 30: Stayers who spent 7 or more hours caring for children or an ill or disabled partner or family member each week ................................................................................................... 18
Table 31: Stayers' informal care role compared with 12 months ago ...................................... 18
Table 32: The effect of stayers' informal care roles on their job in aged care ......................... 19
Table 33: Current contract of employment .............................................................................. 20
Table 34: Stayers' current schedule ......................................................................................... 20
Table 35: Influence in planning work hours ............................................................................ 21
Table 36: Whether working hours change at short notice ....................................................... 21
Table 37: Whether stayers' worked weekend shifts ................................................................. 22
Table 38: Unpaid hours spent travelling between clients each week ...................................... 23
Table 39: Unpaid time per week spent on other tasks ............................................................. 23
Table 40: Able to take time off when unwell? ......................................................................... 23
Table 41: Able to take time off for family's needs? ................................................................. 24
Table 42: Stayers who worked in more than one job ............................................................... 25
Table 43: Number of jobs worked in per week ........................................................................ 25
Table 44: Other jobs in aged care? .......................................................................................... 25
Table 45: Stayers’ perceptions of the valuation of their work by their immediate supervisor 26
Table 46: Stayers’ perceptions of the valuation of their work by high level management ..... 26
Table 47: Stayers’ perceptions of the valuation of their work by their family ........................ 27
Table 48: Stayers’ perceptions of the valuation of their work by their local community ....... 27
Table 49: Stayers’ perceptions of the valuation of their work by their clients/residents ......... 27
Table 50: Whether stayers' work was valued by their clients/residents' families .................... 28
Table 51: Stayers' current rate of pay ...................................................................................... 29
Table 52: Pay satisfaction in relation to stayers' need for income ........................................... 30
Table 53: Pay satisfaction in relation to the importance of the work for society .................... 30
Table 54: Pay satisfaction in relation to the demands of the job ............................................. 30

v
Table 55: Pay satisfaction considering the skills needed to perform the job well ................... 31
Table 56: Pay satisfaction in relation to job security ............................................................... 31
Table 57: Overall pay satisfaction ........................................................................................... 31
Table 58: Perceived ability to easily find another job ............................................................. 32
Table 59: Stayers' current economic situation ......................................................................... 33
Table 60: Current economic situation compared with 12 months ago .................................... 33
Table 61: Retirement preference .............................................................................................. 34
Table 62: Stayers' financial preparation for retirement ........................................................... 34
Table 63: Thoughts about staying in aged care and retirement savings .................................. 35

1
Introduction
The Mature Age Women in Aged Care (MAWAC) survey was conducted nationally in two waves from 2011 to 2012 as part of an ARC Discovery Grant Project (DP110102728): Missing Workers: Retaining Mature Age Women Workers to Ensure Future Labour Security. The project was conducted by researchers at Curtin University in Perth and the University of South Australia in Adelaide. The two waves of data collection were designed to address the need for longitudinal data to analyse the workforce decision-making of mature age women. The survey focused on the aged care sector as it represents an important employment sector for mature age women.
With assistance from Aged and Community Services Australia, survey forms were distributed via to employees of nineteen aged care providers to in all states of Australia. Nineteen aged care providers identified appropriate study participants from their personnel data and mailed survey documents to their employees on behalf of the research team. The survey was sent out to 6,867 women aged 45 or over, working in aged care. Electronic versions of the survey were also available via the Australian Nursing Federation website. 3,945 aged care workers responded to this survey (2,850 paper and 1,095 electronic responses). The results are reported in Mature Age Women Aged Care Workers: Summary of Survey Data (Wave 1) (http://www.curtin.edu.au/research/crae/projects/index.cfm#ARC Grants). In the second wave of the MAWAC Survey (approximately one year later), new surveys were sent to the 6,867 women included in the Wave 1 sample. We sent a ‘leavers’ and a ‘stayers’ questionnaire and asked the women to complete the relevant document. There were 2,138 ‘stayers’ (who were still working in the aged care sector) and 211 ‘leavers’ who responded to these surveys.
This paper reports the results of the Stayers’ Survey.
Structure of survey and overview of results
The Stayers’ Survey was comprised of nine sections. Part A asked the respondents about their current position in aged care: where they worked in aged care; and how their current working conditions compared with a year ago. Respondents were also asked for the most positive and negative changes to their working conditions in the past 12 months, whether they were currently studying for a formal qualification; and if they had thought about leaving the aged care sector in the past year.
Part B asked the respondents about their health: how they rated their general health and if they had experienced any illness or injury that was a hindrance at work in the past year.
Part C asked respondents about the physical, mental and emotional demands of their job; how they rated their ability to meet these demands; and whether their job entailed doing “dirty work”.
Part D asked the respondents about their family and caring role at home: whether they lived with a partner; whether they had any dependent children; how much time they spent in an average week providing informal care at home; how their informal care role compared with 12 months ago; and the effect of their caring roles at home on their work in aged care.
Part E asked the respondents about their working time arrangements: whether they had casual, fixed term contract, or permanent work; what shift they worked; and how much

2
influence they had in planning the hours they worked. Respondents were also asked how many hours they worked each week; how many hours they would like to work; the number of unpaid hours they worked; and if they felt able to take time off from their job.
Part F asked the respondents if they worked in more than one paid job each week.
Part G asked the respondents about their working relationships: how much they felt that their work in aged care was valued by their immediate supervisor, high level management, their family, their local community, their clients or residents, and the families of their clients and residents.
Part H asked the respondents about their economic situation; their usual rate of pay; how satisfied they were with their pay; and whether they thought they could easily find another job.
Part I asked the respondents about retirement: if they were thinking about retirement; if they considered themselves to be partially retired; how they rated their financial preparation for retirement; and if concerns about retirement savings affected their thoughts about staying in aged care.

3
Section 1: Current activities
In this section the respondents were asked whether they worked in a residential aged care facility, community care, or transitional and respite care; how their current working conditions compared with a year ago; and the most positive and negative changes to their working conditions in the past 12 months. They were also asked if they had studied for any formal qualifications in the past 12 months and, if so, what their reason for studying was, and whether they had received support from their aged care organisation for their studies. Section A concluded with a question on whether the stayers had thought about leaving aged care in the past 12 months and, if so, how often they had this thought and the main reason why they thought about leaving.
1.1. Currently work in aged care
Over half the stayers (1,051 or 53.6%) were working in long-term residential aged care facilities and 784 (40%) were working in community care. There were 106 stayers (5.4%) working in transitional and respite care and 19 (1%) in disability services or administration.
Table 1: Current role in aged care
Frequency Valid Percent
In a residential aged care facility/long-term care
1051 53.6
In a residential aged care facility/transitional and respite care
106 5.4
In community care 784 40 admin or disability 19 1 Total 1960 100 Missing 80

4
1.2 Current working conditions as compared with a year ago
Nearly half the stayers (895 or 44.9%) had working conditions that had stayed the same. There were 426 stayers (21.4%) whose working conditions had slightly improved and 190 (9.5%) whose working conditions were much improved compared to a year ago. For 373 stayers (18.7%) working conditions were slightly worse and 111 stayers (5.6%) had working conditions that were much worse than a year ago.
Table 2: Current working conditions as compared with a year ago
Frequency Valid Percent
Current conditions are:
Much worse 111 5.6 Slightly worse 373 18.7 Stayed the same 895 44.9 Slightly improved 426 21.4 Much improved 190 9.5 Total 1995 100
Missing 45
1.3. Positive changes to the stayers’ working conditions in the past 12 months
Participants were asked to write a text response about the positive changes to their working conditions in the past 12 months. There were 552 stayers (25.5%) who did not answer the question. Of the 1,586 stayers who responded, the most common responses were improved management, including having a new employer (280 or 17.4%) and no positive changes including negative changes (267 or 16.6%)1.
1 The responses to the question were coded using NVivo software.
5
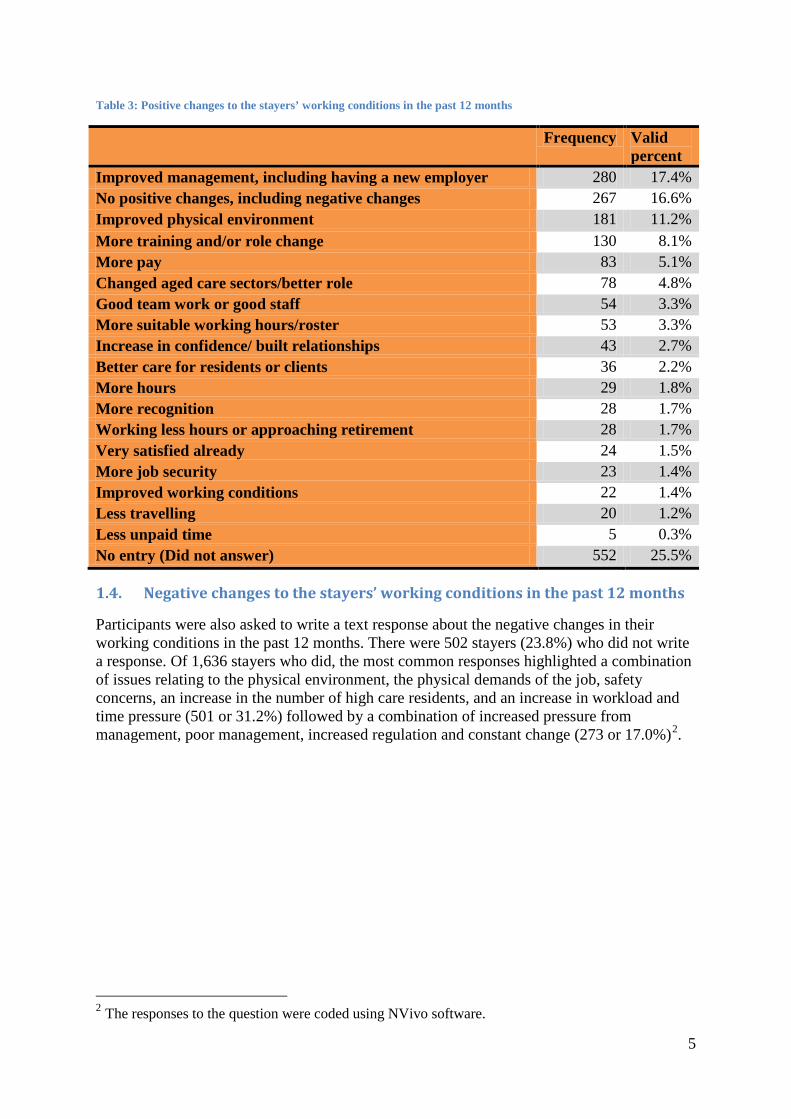
Table 3: Positive changes to the stayers’ working conditions in the past 12 months
Frequency Valid percent
Improved management, including having a new employer 280 17.4% No positive changes, including negative changes 267 16.6% Improved physical environment 181 11.2% More training and/or role change 130 8.1% More pay 83 5.1% Changed aged care sectors/better role 78 4.8% Good team work or good staff 54 3.3% More suitable working hours/roster 53 3.3% Increase in confidence/ built relationships 43 2.7% Better care for residents or clients 36 2.2% More hours 29 1.8% More recognition 28 1.7% Working less hours or approaching retirement 28 1.7% Very satisfied already 24 1.5% More job security 23 1.4% Improved working conditions 22 1.4% Less travelling 20 1.2% Less unpaid time 5 0.3% No entry (Did not answer) 552 25.5%
1.4. Negative changes to the stayers’ working conditions in the past 12 months
Participants were also asked to write a text response about the negative changes in their working conditions in the past 12 months. There were 502 stayers (23.8%) who did not write a response. Of 1,636 stayers who did, the most common responses highlighted a combination of issues relating to the physical environment, the physical demands of the job, safety concerns, an increase in the number of high care residents, and an increase in workload and time pressure (501 or 31.2%) followed by a combination of increased pressure from management, poor management, increased regulation and constant change (273 or 17.0%)2.
2 The responses to the question were coded using NVivo software.

6
Table 4: Negative changes to the stayers’ working conditions in the last 12 months
Frequency Valid percent
Physical environment/physical demands/safety concerns/ increase in the number of high care residents/increase in workload & time pressure
501 31.2%
Increased pressure from management/poor management/increased regulation/constant change
273 17.0%
No negative changes 223 13.9%
Poor care for clients/lack of quality/ concerns about other staff &/or management priorities
99 6.2%
Decrease in income or hours or insecure work 93 5.8% Staff turnover/inexperienced staff 72 4.5% Poor arrangement of shifts or rosters, including lack of consultation &/or use of agency staff, inability to take leave
65 4.0%
Deteriorating work relationships including bullying 58 3.6%
Poor pay/lack of pay increase/pay increase too small 55 3.4% Office or workplace relocation/increased travel time/increased other unpaid time
52 3.2%
Dissatisfied with change in role or employer 27 1.7% Dissatisfied, angry or aggressive clients, families 26 1.6% Lack of training/ cost 22 1.4% Increased hours/too long 12 0.7% Lack of recognition 12 0.7%
Injuries or sickness or ageing 10 0.6% Clients? palliative care/ miss old clients 8 0.5% No entry on negative changes 502 23.8%
1.5. Studies for formal qualification in the last year
There were 656 stayers (32.7%) who had studied for formal qualifications in the past 12 months.
Table 5: Study for formal qualifications in the last 12 months
Frequency Valid Percent
No 1353 67.3 Yes 656 32.7 Total 2009 100 Missing 31

7
Of the 580 stayers who gave their reason for studying for a formal qualification, over two-thirds (374 or 64.5%) were studying to improve their skills in aged care and 88 stayers (15.2%) wanted to change to another role in aged care. There were 92 stayers (15.9%) who were studying for their own interest or development and 26 (4.5%) who were studying to enable them to leave aged care.
Table 6: Reasons for studying for a formal qualification
Frequency Valid Percent
To improve skills in aged care 374 64.5 To change to another role in aged care
88 15.2
To leave aged care 26 4.5 For own interest/development 92 15.9 Total 580 100 Missing 1460
Of 728 respondents, over two-thirds (487 or 66.9%) had received organisational support to study.
Table 7: Organisational support for study
Frequency Valid Percent
Support provided?
No 241 33.1 Yes 487 66.9 Total 728 100
Missing 1312

8
1.6. Thoughts about leaving the aged care sector
Nearly half of the stayers (954 or 47.4%) had thought about leaving aged care.
Table 8: Whether the stayers had thought about leaving aged care
Frequency Valid Percent
Thought about leaving?
No 986 49 Can’t say
73 3.6
Yes 954 47.4 Total 2013 100
Missing 27
The stayers who said they had thought about leaving aged care were asked how often they thought about leaving. Of 929 respondents, almost half (419 or 45.4%) thought about leaving aged care at least once a month while one-fifth (191 or 20.7%) thought about leaving at least once a week. There were 249 stayers (27%) who thought about leaving at least once a year and 64 stayers (6.9%) thought about leaving aged care every day.
Table 9: Frequency of thoughts about leaving aged care
Frequency Valid Percent
How frequently do you think about leaving?
At least once a year
249 27
At least once a month
419 45.4
At least once a week
191 20.7
Every day 64 6.9 Total 923 100
Missing 1117
The stayers who thought about leaving aged care were also asked for their reasons for thinking of leaving the sector. Of 958 respondents, the most common reasons for thinking about leaving the aged care sector were a combination of the physical demands of the work are too high, age, the driving, and work environment (284 or 29.6%), dissatisfaction with the current rate of pay (120 or 12.5%), and because they planned to completely retire (99 or 10.3%).

9
Table 10: Reasons for thinking about leaving aged care
Frequency Valid Percent Need to care for a family member or friend 44 4.6 Plan to completely retire 99 10.3 Want an extended break from working 55 5.7 Current contract is due to end 1 0.1 Physical demands of the work are too high, age, driving, work environment
284 29.6
Mental demands of the work are too high 74 7.7 Emotional demands of the work are too high 28 2.9 Dissatisfied with the current rate of pay 120 12.5 No opportunities for improved pay or training 28 2.9 Need to improve your financial situation 25 2.6 Dissatisfied with the hours or shifts available including changing shifts, cancellations
35 3.7
Feel that your work in aged care is not valued, disillusioned, skills not used
67 7
Lost interest in the work 15 1.6 Dissatisfied with the direction in which aged care is going
62 6.5
Other 1 0.1 All of the above 1 0.1 Moving to another job or activity including want change
7 0.7
Ill health or change in life circumstance 3 0.3 Conflicts or dissatisfaction with other staff including lack of care
1 0.1
Poor management, poor communication, unfair practice
8 0.8
Total 958 100 Missing 1082

10
Section 2. Health
This section reports on the stayers’ health and if they had experienced any illness or injuries during the past 12 months that have been a hindrance at work and how many days in the past year they had been off work because of an illness or injury.
2.1. Stayers’ rating of their general health
The vast majority of stayers rated their health as good (829 or 41.1%), very good (713 or 35.4%), or excellent (234 or 11.6%). There were 223 stayers (11.1%) with fair health and 16 stayers (0.8%) with poor health.
Table 11: Stayers' rating of their general health
Frequency Valid Percent
General health is:
Poor 16 0.8 Fair 223 11.1 Good 829 41.1 Very good
713 35.4
Excellent 234 11.6 Total 2015 100
Missing 25
2.2. Illnesses or injuries that have been a hindrance at work in the past 12 months
Just under one-third of stayers (658 or 32.9%) had an illness or injury that had been a hindrance at work in the past 12 months.
Table 12: Illnesses or injuries that have been a hindrance at work in the past 12 months
Frequency Valid Percent
Illness or injury?
No 1343 67.1 Yes 658 32.9 Total 2001 100
Missing 39 2040

11
Of the 582 stayers who had an illness or injury that was a hindrance at work, over half (302 or 51.9%) were able to do their job but it caused some symptoms. Nearly one-quarter (144 or 24.7%) had to sometimes slow down their work pace or change methods. There were 45 stayers (7.7%) who had to often slow down or change methods, 63 stayers (10.8%) who were only able to work part-time and 28 stayers (4.8%) who were unable to work because of their illness or injury.
Table 13: The degree of hindrance caused by illness or injury
Frequency Valid Percent
Due to the illness or injury, You are able to do your job, but it causes some symptoms
302 51.9
You must sometimes slow down your pace of work or change methods
144 24.7
You must often slow down your pace of work or change methods
45 7.7
Because of your condition, you feel you are only able to work part-time
63 10.8
In your opinion you are entirely unable to work 28 4.8 Total 582 100
Missing 1458
Over half of the stayers (383 or 53.2%) who had an illness or injury that was a hindrance at work had sustained that illness or injury in the last 12 months.
Table 14: Whether the illness or injury was sustained in the last 12 months
Frequency Valid percent
Illness or injury sustained in last 12 months?
No 337 46.8 Yes 383 53.2 Total 720 100
Missing 1320

12
Most stayers (922 or 82.4%) had only one to two days off in the last 12 months because of illness or injury and 193 stayers (17.2%) had no time off in the past 12 months.
Table 15: Number of days off work in the last 12 months because of illness or injury
Frequency Valid Percent
1-2days 922 82.4 3-4 days 2 0.2 5-10 days 2 0.2 None 193 17.2 Total 1119 100 Missing 921

13
Section 3. The physical, mental and emotional demands of the job
Stayers were asked how they rated their current ability to meet the demands of the job overall; how they rated their ability to meet the physical demands, mental demands, and emotional demands of the job; and whether they did “dirty work”.
3.1. Overall ability to meet the demands of the job
On a scale of one to ten, most stayers rated their overall workability as seven or above.
Table 16: Stayers' overall ability to meet the demands of the job
Frequency Valid Percent
No ability to work at all 6 0.3 2 10 0.5 3 10 0.5 4 40 2 5 88 4.4 6 101 5 7 250 12.5 8 582 29.1 9 562 28.1
Workability at its best 354 17.7 Total 2003 100 Missing 37
3.2. Ability to meet the physical, mental and emotional demands of the job
Nearly half the stayers (997 or 49.6%) rated their ability to meet the physical demands of the job as good, and over one-quarter (557 or 27.7%) rated their ability as very good.
Table 17: Current ability to meet the physical demands of the job
Frequency Valid Percent
Ability is: Very poor 14 0.7 Poor 36 1.8 Moderate 405 20.2 Good 997 49.6 Very good 557 27.7 Total 2009 100
Missing 31
14
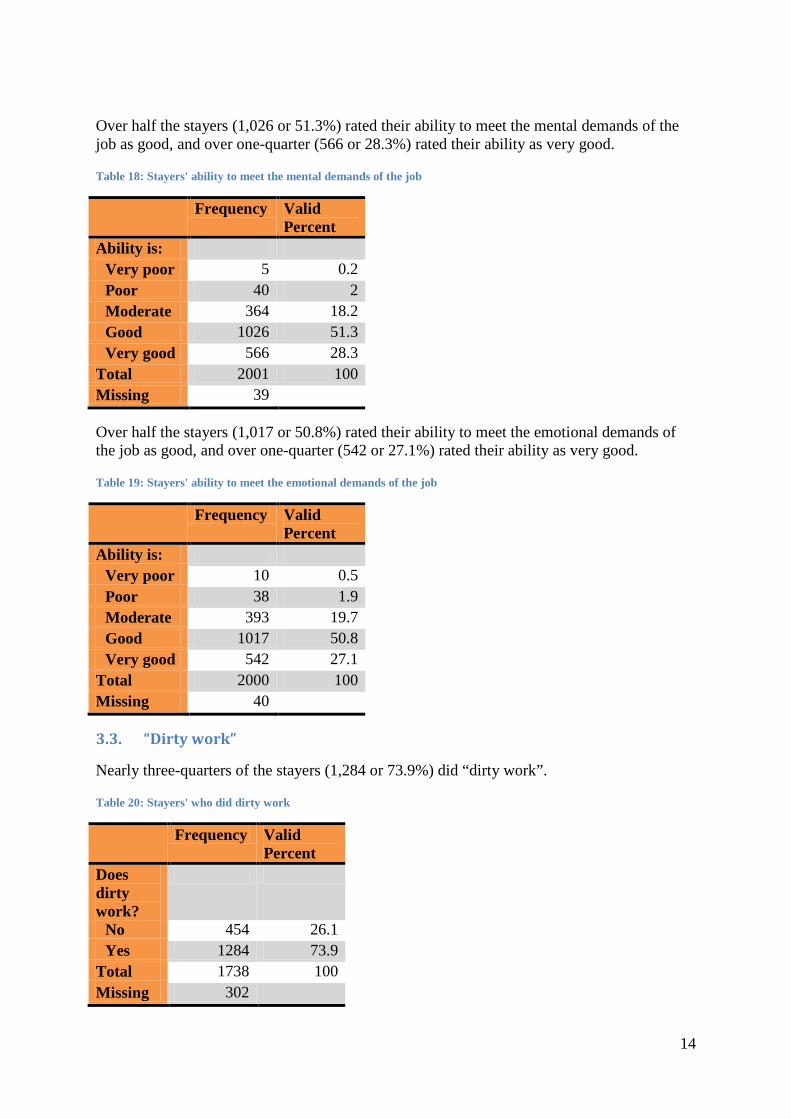
Over half the stayers (1,026 or 51.3%) rated their ability to meet the mental demands of the job as good, and over one-quarter (566 or 28.3%) rated their ability as very good.
Table 18: Stayers' ability to meet the mental demands of the job
Frequency Valid Percent
Ability is: Very poor 5 0.2 Poor 40 2 Moderate 364 18.2 Good 1026 51.3 Very good 566 28.3
Total 2001 100 Missing 39
Over half the stayers (1,017 or 50.8%) rated their ability to meet the emotional demands of the job as good, and over one-quarter (542 or 27.1%) rated their ability as very good.
Table 19: Stayers' ability to meet the emotional demands of the job
Frequency Valid Percent
Ability is: Very poor 10 0.5 Poor 38 1.9 Moderate 393 19.7 Good 1017 50.8 Very good 542 27.1
Total 2000 100 Missing 40
3.3. “Dirty work”
Nearly three-quarters of the stayers (1,284 or 73.9%) did “dirty work”.
Table 20: Stayers' who did dirty work
Frequency Valid Percent
Does dirty work?
No 454 26.1 Yes 1284 73.9
Total 1738 100 Missing 302

15
Section 4. Family and caring roles at home
In this section of the survey, stayers were firstly asked if they lived with a partner. If they did not, they were asked to describe their current situation. If they lived with a partner, the stayers were asked about their partner’s current work and health status. The stayers were also asked if they had any dependent children living with them; how much time on average they spent per week caring for children, an ill or disabled partner, and an ill, disabled, or elderly family member; and how their current informal caring role at home compared with a year ago. They were then asked to describe the effect that their caring role at home had on their work in aged care.
4.1. Partners
There were 602 (4.3%) stayers who did not live with a partner.
Table 21: Stayers who did not live with a partner
Frequency Valid Percent
Lives with a partner?
Yes 1400 95.7 No 602 4.3
Missing 1438
Of 538 stayers who did not live with a partner, over half (279 or 51.9%) were divorced, 101 (18.8%) who were widowed, 99 (18.4%) who were separated, and 59 stayers (11%) who were never married.
Table 22: The current situation of stayers who did not live with a partner
Frequency Valid Percent
Separated 99 18.4 Divorced 279 51.9 Widowed 101 18.8 Never married 59 11 Total 538 100 Missing 1502

16
Of the stayers who lived with a partner, most (889 or 63.2%) had a partner who was working full-time. There were 225 stayers (16%) whose partner was retired.
Table 23: Partners' current work status
Frequency Valid Percent
Working full time including business owners
889 63.2
Working part time or casual 218 15.5 Unemployed, disabled or home duties 75 5.3 Retired 225 16 Total 1407 100 Missing 633
Most stayers had a partner whose health was good (496 or 37.3%) or very good (468 or 35.2%).
Table 24: Partner's health status
Frequency
Valid Percent
Partner’s health is: Poor 48 3.6 Fair 203 15.3 Good 496 37.3 Very good 468 35.2 Excellent 114 8.6
Total 1329 100 Missing 711
4.2. Dependent children
Stayers were asked if they had dependent children living with them including natural children, foster children, step children, grandchildren, and adult children who were financially dependent. Nearly one-quarter of stayers (503 or 24.9%) had dependent children living with them.
Table 25: Stayers who had dependent children
Frequency Valid Percent Dependent children?
No 1516 75.1 Yes 503 24.9
Total 2019 100 Missing 21

17
Of the 499 stayers who had dependent children living with them, the number of children ranged from one to nine. Over half the stayers (269 or 53.9%) had one dependent child living with them.
Table 26: Number of dependent children
Frequency Valid Percent
1 269 53.9 2 176 35.3 3 43 8.6 4 5 1 5 3 0.6 6 2 0.4 9 1 0.2
Total 499 100 Missing 1541
4.3. Time spent on informal care
There were 521 stayers (30.9%) who spent seven or more hours caring for children each week.
Table 27: Stayers who spent 7 or more hours caring for children each week
Frequency Valid Percent 7+hrs per week?
No 1164 69.1 Yes 521 30.9 Total 1685 100 Missing 355
There were 81 stayers (6.2%) who spent seven or more hours caring for an ill or disabled partner per week.
Table 28: Stayers who spent 7 or more hours caring for an ill or disabled partner per week
Frequency Valid Percent
7+hrs per week?
No 1226 93.8 Yes 81 6.2
Total 1307 100 Missing 733

18
There were 161 stayers (11.3%) who spent seven or more hours caring for an ill or disabled family member per week. Table 29: Stayers who spent 7 or more hours caring for an ill or disabled family member per week
Frequency Valid Percent
7+hrs per week?
No 1259 88.7 Yes 161 11.3
Total 1420 100 Missing 620
Nearly one-quarter of stayers (306 or 24.6%) spent seven or more hours caring for children or an ill or disabled partner or family member per week.
Table 30: Stayers who spent 7 or more hours caring for children or an ill or disabled partner or family member each week
Frequency Valid Percent
7+hrs per week?
No 939 75.4 Yes 306 24.6
Total 1245 100 Missing 795
4.4. Changes in informal care roles in past year
Around two-thirds of stayers (1,108 or 66.1%) had informal care roles that were unchanged from 12 months ago. Around one-fifth (350 or 20.9%) had care roles that had increased.
Table 31: Stayers' informal care role compared with 12 months ago
Frequency Valid Percent
Informal care role has:
Increased 350 20.9 Stayed about the same
1108 66.1
Decreased 219 13.1 Total 1677 100 Missing 363

19
4.5. The effects of informal care roles
There were 758 stayers (40.5%) who did not have any caring roles at home and 631 stayers (33.7%) who did not need to change their working hours or take time off to cope with their unpaid caring roles at home. 110 stayers (5.9%) were able to manage with the help of their family, friends and/or community organisations. However, 321 stayers (17.2%) needed to change their working hours and/or take extra time off to manage their caring roles at home and 51 stayers (2.7%) found it difficult to manage their caring roles at home and their job in aged care.
Table 32: The effect of stayers' informal care roles on their job in aged care
Frequency Valid Percent
Informal care roles:
You do not have any caring roles at home
758 40.5
They have had no effect. You have been able to manage without changing your working hours or taking extra time off
631 33.7
They have had an effect but you have been able to manage by changing your working hours &/or taking extra time off
321 17.2
They have had some effect but your have been able to manage with the help of your family, friends and/or community organisations
110 5.9
They have had a large effect. You have found it difficult to manage your caring roles at home and your job in aged care
51 2.7
Total 1871 100 Missing 169

20
Part 5. Working time arrangements
Stayers were asked to provide information on their contract of employment in their aged care organisation; the shifts they worked; how much influence they had in planning the hours they worked; and whether their working hours sometimes changed at short notice. They were also asked how many hours per shift they usually worked; how many hours per week they were paid to work; how many hours per week they would like to work; the number of unpaid hours they worked; and if they felt able to take time off from their job in aged care.
5.1. Current contract of employment
Most stayers (1,464 or 80.4%) were employed on permanent contracts.
Table 33: Current contract of employment
Frequency Valid Percent
Casual 293 16.1 Permanent 1464 80.4 Fixed term 65 3.6 Total 1822 100 Missing 218
5.2. Current schedule
Over half of the stayers (1,027 or 59.6%) worked a regular daytime shift and 213 stayers (12.4%) worked a regular evening shift.
Table 34: Stayers' current schedule
Frequency Valid Percent
Regular daytime shift 1027 59.6 Regular evening shift 213 12.4 Regular night shift 112 6.5 Rotating shift (changes from days to evenings to nights)
164 9.5
Split shifts (two distinct periods each day) 32 1.9 On call 17 1 Irregular schedule, including casual 158 9.2 Total 1723 100 System 317

21
5.3. Influence in planning work hours
There were 495 stayers (26.8%) who had a moderate influence and 509 (27.6%) who had considerable influence in planning the hours they worked. 235 stayers (12.7%) totally decided their own hours of work. There were 282 stayers (15.3%) who had little influence and 325 (17.6%) who had no influence in planning the hours they worked.
Table 35: Influence in planning work hours
Frequency Valid Percent
Degree of influence: None 325 17.6 Little 282 15.3 Moderate 495 26.8 Considerable 509 27.6 Total - you decide yourself
235 12.7
Total 1846 100 Missing 194
5.4. Working hours that change at short notice
Over half of stayers (1,076 or 57.9%) had working hours which changed at short notice.
Table 36: Whether working hours change at short notice
Frequency Valid Percent
Hours change at short notice?
No 782 42.1 Yes 1076 57.9 Total 1858 100 Missing 182
5.5. Weekend shifts
Over half the stayers (999 or 54.2%) worked weekend shifts.

22
Table 37: Whether stayers' worked weekend shifts
Frequency Valid Percent
Work weekends?
No 845 45.8 Yes 999 54.2 Total 1844 100 Missing 196
5.6. Preferred amount of work per week
Stayers were asked how many hours they worked each week and how many hours they would prefer to work. Over half the stayers (939 or 55.9%) were working the number of hours they preferred to work each week. Over one-quarter (491 or 29.2%) would prefer to work more hours per week and 250 stayers (14.9%) preferred to work fewer hours per week.
Frequency Valid Percent
Prefer to work fewer hours 250 14.9 Prefer to work current hours
939 55.9
Prefer to work more hours 491 29.2 Total 1680 100 System 360
5.7. Number of unpaid hours worked each week
Stayers were asked how many unpaid hours they spent travelling between different clients/residents each week and how many unpaid hours the spent on other tasks associated with their job in aged care.
Over half of stayers (613 or 59.2%) did not spend any unpaid time travelling each week. Of those that did, 67 (6.5%) spent one hour, 97 (9.4%) spent two hours, and 54 (5.2%) spent three hours of unpaid time travelling between their clients/residents each week.

23
Table 38: Unpaid hours spent travelling between clients each week
Frequency Valid Percent
0 613 59.2 1-10 392 37.8
11-20 25 2.5 >20 5 0.5
Total 1035 100 System 1005
Over one-third of stayers (537 or 38.7%) did not work any unpaid time per week. Of those who did, 169 (12.2%) spent one hour and 265 (19.1%) spent two hours of unpaid time per week on other tasks associated with their job in aged care.
Table 39: Unpaid time per week spent on other tasks
Frequency Valid Percent
0 537 38.7 1-11 824 59.4 >11 26 2
Total 1387 100 System 653
5.8. Ability to take time off from the job
Most stayers (1,611 or 87.7%) felt able to take time off from their job when they were unwell but there were 226 stayers (12.3%) who did not.
Table 40: Able to take time off when unwell?
Frequency Valid Percent
No 226 12.3 Yes 1611 87.7 Total 1837 100 Missing 203
Most stayers (1,446 or 83.3%) felt able to take time off from their job to attend to their family’s needs but 289 stayers (16.7%) did not.

24
Table 41: Able to take time off for family's needs?
Frequency Valid Percent
No 289 16.7 Yes 1446 83.3 Total 1735 100 Missing 305

25
Part 6. Other paid jobs
This section asked stayers whether they worked in more than one job per week and, if so, in how many jobs. They were also asked how many hours per week they usually worked in these jobs, how many hours they spent travelling between jobs, and if the other jobs were in aged care.
6.1. Working in more than one job
There were 292 stayers (15.8%) who worked in more than one job each week.
Table 42: Stayers who worked in more than one job
Frequency Valid Percent
Multi jobs?
No 1561 84.2 Yes 292 15.8 Total 1853 100 Missing 187
Of the stayers who worked in more than one job per week, most (242 or 86.4%) worked in two jobs and 38 (13.6%) worked in more than two jobs.
Table 43: Number of jobs worked in per week
Frequency Valid Percent
Two 242 86.4 More than two 38 13.6 Total 280 100 Missing 1760
Over half the stayers (147 or 50.5%) who worked in more than one job had another job in aged care.
Table 44: Other jobs in aged care?
Frequency Valid Percent
No 144 49.5 Yes 147 50.5 Total 291 100 Missing 1749

26
Part 7. Working relationships
Stayers were asked how much they felt that their work in aged care was valued by their immediate supervisor, high level management, their family, their local community, their clients/residents, and the families of their clients/residents.
Just over half of stayers (920 or 50.5%) felt that their work was highly valued by their immediate supervisor and nearly half (782 or 42.9%) felt that their work was moderately valued. There were 119 stayers (6.5%) who felt that their work was not at all valued by their immediate supervisor.
Table 45: Stayers’ perceptions of the valuation of their work by their immediate supervisor
Frequency Valid Percent
Perceived value:
Not at all 119 6.5 Moderately 782 42.9 Highly 920 50.5 Total 1821 100
Missing 219
Over half of stayers (940 or 53%) felt their work was moderately valued by high level management and just over one-quarter (467 or 26.3%) felt their work was highly valued. There were 368 stayers (20.7%) who felt that their work was not at all valued by high level management.
Table 46: Stayers’ perceptions of the valuation of their work by high level management
Frequency Valid Percent
Perceived value:
Not at all 368 20.7 Moderately 940 53 Highly 467 26.3 Total 1775 100
Missing 265
Just over half of stayers (917 or 51.1%) felt that their work in aged care was highly valued by their family and close to half (764 or 42.6%) felt their work was moderately valued. There were 112 stayers (6.2%) who felt their work was not at all valued by their family.

27
Table 47: Stayers’ perceptions of the valuation of their work by their family
Frequency Valid Percent
Perceived value:
Not at all 112 6.2 Moderately 764 42.6 Highly 917 51.1 Total 1793 100
Missing 247
Nearly one half of stayers (784 or 45.7%) felt their work was moderately valued by their local community and over one-third (637 or 37.1%) felt their work was highly valued. There were 294 stayers (17.1%) who felt that their work in aged care was not at all valued by their local community.
Table 48: Stayers’ perceptions of the valuation of their work by their local community
Frequency Valid Percent
Perceived value:
Not at all 294 17.1 Moderately 784 45.7 Highly 637 37.1 Total 1715 100
Missing 325
Over two-thirds of stayers (1,351 or 74%) felt their work was highly valued by their clients/residents and nearly one-quarter (444 or 24.3%) felt their work was moderately valued. There were 31 stayers (1.7%) who felt that their work in aged care was not at all valued by their clients/residents.
Table 49: Stayers’ perceptions of the valuation of their work by their clients/residents
Frequency Valid Percent
Perceived value:
Not at all 31 1.7 Moderately 444 24.3 Highly 1351 74 Total 1826 100
Missing 214

28
Nearly two-thirds of stayers (1,087 or 60.4%) felt that their work was highly valued by the families of their clients/residents and over one-third (648 or 36%) felt their work was moderately valued. There were 65 stayers (3.6%) who felt that their work in aged care was not at all valued by the families of their clients/residents.
Table 50: Whether stayers' work was valued by their clients/residents' families
Frequency Valid Percent
Perceived value:
Not at all 65 3.6 Moderately 648 36 Highly 1087 60.4 Total 1800 100
Missing 240

29
Part 8. Pay and economic situation
Stayers were asked for their usual hourly rate of pay, how satisfied they were with their pay, if they thought they could find another job in aged care if they lost their current job, how they would describe their economic situation, and how their current economic situation compared with 12 months ago.
8.1. Usual hourly rate of pay
Nearly half of the stayers (860 or 44.8%) earned between $15 and $20 per hour and over one-third (694 or 36.2%) earned between $21 and $25 per hour.
Table 51: Stayers' current rate of pay
Frequency Valid Percent
Hourly rate ($)
<15 6 0.3 15-20 860 44.8 21-25 694 36.2 26-30 123 6.4 31-35 110 5.7 36-40 75 3.9 41-50 40 2.1 50+ 10 0.5 Total 1918 100
System 122
8.2. Pay satisfaction
Stayers were asked about their satisfaction with their rate of pay in relation to their need for an income, and considering the importance of their work to society, the demands of their job, the skills needed to perform the job well, the amount of job security they had, and their satisfaction with their rate of pay overall.
Over half of stayers (1,208 or 63.2%) were moderately satisfied with their rate of pay in relation to their need of an income and 143 (7.5%) were highly satisfied. Over one-quarter of stayers (560 or 29.3%) were not at all satisfied with their rate of pay in relation to their need for an income.

30
Table 52: Pay satisfaction in relation to stayers' need for income
Frequency Valid Percent
Satisfied? Not at all 560 29.3 Moderately 1208 63.2 Highly 143 7.5 Total 1911 100
Missing 129 2040
Nearly half of stayers (848 or 45%) were moderately satisfied and 147 stayers (7.8%) were highly satisfied with their rate of pay in relation to the importance of their work for society. Nearly one-half of stayers (890 or 47.2%) were not at all satisfied with their rate of pay in relation to the importance of their work.
Table 53: Pay satisfaction in relation to the importance of the work for society
Frequency Valid Percent
Satisfied? Not at all 890 47.2 Moderately 848 45 Highly 147 7.8 Total 1885 100
Missing 155
There were 781 stayers (40.8%) who were moderately satisfied and 115 (6%) who were highly satisfied with their rate of pay in relation to the demands of their job. Over half of stayers (1,016 or 53.1%) were not at all satisfied with their rate of pay in relation to the demands of their job.
Table 54: Pay satisfaction in relation to the demands of the job
Frequency Valid Percent
Satisfied? Not at all 1016 53.1 Moderately 781 40.8 Highly 115 6 Total 1912 100
Missing 128
Over half of stayers (905 or 47.8%) were moderately satisfied and 151 (8%) were highly satisfied with their rate of pay in relation to the skills needed. Nearly half (838 or 44.2%) were not at all satisfied with their rate of pay in relation to the skills needed to perform their job well.

31
Table 55: Pay satisfaction considering the skills needed to perform the job well
Frequency Valid Percent
Satisfied? Not at all 838 44.2 Moderately 905 47.8 Highly 151 8 Total 1894 100
Missing 146
Nearly two-thirds of stayers (1,169 or 62.4%) were moderately satisfied and 207 (11.1%) were highly satisfied with their rate of pay in relation to their job security. Over one-quarter of stayers (497 or 26.5%) were not at all satisfied with their rate of pay in relation to their job security.
Table 56: Pay satisfaction in relation to job security
Frequency Valid Percent
Satisfied? Not at all 497 26.5 Moderately 1169 62.4 Highly 207 11.1 Total 1873 100
Missing 167
Over half of stayers (1,059 or 57.6%) were moderately satisfied and 120 (6.5%) were highly satisfied with their pay overall. Over one-third of stayers (660 or 35.9%) were not at all satisfied with their rate of pay overall.
Table 57: Overall pay satisfaction
Frequency Valid Percent
Satisfied? Not at all 660 35.9 Moderately 1059 57.6 Highly 120 6.5 Total 1839 100
Missing 201
8.3. Ability to easily find another job
Well over three-quarters of stayers (1,396 or 71.8%) thought that they could find another job if they lost their current job.

32
Table 58: Perceived ability to easily find another job
Frequency Valid Percent
Easily able to find another job?
No 549 28.2 Yes 1396 71.8 Total 1945 100
Missing 95

33
8.4. Current economic situation
Over one-third of stayers (773 or 39.1%) had an economic situation that was neither good nor bad, around one-third (658 or 33.3%) had a good economic situation and for 121 stayers (6.1%) their economic situation was very good. There were 354 stayers (17.9%) whose economic situation was strained and for 70 stayers (3.5%) their economic situation was very strained.
Table 59: Stayers' current economic situation
Frequency Valid Percent
Economic situation Very strained 70 3.5 Strained 354 17.9 Neither good nor bad
773 39.1
Good 658 33.3 Very good 121 6.1 Total 1976 100
Missing 64
8.5. Changes in economic situation in last year
Around two-thirds of stayers (1,320 or 66.5%) had an economic situation that was about the same as 12 months ago. There were 239 stayers (12%) whose economic situation was better and 46 (2.3%) whose economic situation was much better than 12 months ago. There were 331 stayers (16.7%) whose economic situation was worse and 48 stayers (2.4%) whose economic situation was much worse than 12 months ago.
Table 60: Current economic situation compared with 12 months ago
Frequency Valid Percent
Much worse 48 2.4 Worse 331 16.7 About the same 1320 66.5 Better 239 12 Much better 46 2.3 Total 1984 100 Missing 56

34
Part 9. Retirement
Stayers were asked if they were thinking about retirement, if they considered themselves to be partially retired from paid work, how they rated their financial preparation for retirement, and if concerns about retirement savings affected their thoughts about staying in aged care.
9.1. Thinking about retirement
Stayers were asked at what age they thought they would completely retire and at what age they would prefer to retire. Nearly half of stayers (238 or 47.9%) preferred to retire earlier than their expected time of retirement. Almost half (227 or 45.7%) preferred to retire at their expected time and 32 stayers (6.4%) preferred to retire later than their intended time of retirement.
Table 61: Retirement preference
Frequency Valid Percent
Prefer to retire earlier 238 47.9 Prefer to retire at expected time 227 45.7 Prefer to retire later 32 6.4 Total 497 100 Missing 1543
9.2. Financial preparation for retirement
Well over a third of stayers (812 or 41%) rated their preparation from retirement as poor and for 267 stayers (13.5%) it was very poor. Nearly one-third of stayers (642 or 32.4%) rated their financial preparation for retirement as adequate. There were 202 stayers (10.2%) whose financial preparation for retirement was good and for 59 stayers (3%) it was very good.
Table 62: Stayers' financial preparation for retirement
Frequency Valid Percent
Financial preparation
Very poor 267 13.5 Poor 812 41.0 Adequate 642 32.4 Good 202 10.2 Very good 59 3 Total 1982 100
Missing 58

35
9.4. Retirement savings and thoughts about staying in aged care
Nearly half of stayers (884 or 45.5%) said that their thoughts for their retirement savings did not affect their thoughts about staying in aged care and 182 (9.4%) did not have any concerns about their retirement savings. Over one-third (749 or 38.6%) wanted to stay in aged care so that they could save more for their retirement and 126 (6.5%) planned to leave aged care and work in a different job so that they could save more for their retirement.
Table 63: Thoughts about staying in aged care and retirement savings
Frequency Valid Percent
Yes, I want to stay in aged care so that I can save more for my retirement
749 38.6
Yes, I plan to leave aged care and work in a different job so that I can save more for my retirement
126 6.5
No, my thoughts for my retirement savings do not affect my thoughts about staying in aged care
884 45.5
No, I do not have concerns about my retirement savings
182 9.4
Total 1941 100 Missing 99