the bangchak petroleum plc · japan portfolio (19.5 mwac) biofuel business –increased capacity...
TRANSCRIPT

Opportunity Day - 3Q2016
November 15, 2016
The Bangchak Petroleum PLC
AGENDA
2
1 Performance Summary
2 Financial Performance Update
4 Investment Update
3 Oil Market Outlook

AGENDA
3
1 Performance Summary
2 Financial Performance Update
4 Investment Update
3 Oil Market Outlook

BCP Group Performance
4The Bangchak Petroleum Plc
Q3/16 Performance Snapshots
9M/16
EBITDA PerformanceUnit: THB Million
Refinery• Consistent high level of crude run • Softer market GRM
Marketing• Maintain 2nd market share• 11% retail sales volume growth (Jan-Sep 16/15) • Satisfied marketing margin
Green Power Plant• BCPG listing on schedule• COD 8.8 MWac of solar power business in Japan
Biofuel• COD of Biodiesel Plant 2 and Ethanol Plant (BBE)• Affected by the government reduced the portion
of B100 mixing with diesel from 7% to 3%
E&P• Galoc oil field recorded an Uptime of 99.3%• Cost reduction continue
4
Refinery51%
Marketing20%
Solar Power21%
Biofuel-2%
E&P6%
EBITDA
2,798THB Million
Q3/16
Refinery42%
Marketing31%
Solar Power22%
Biofuel2%
E&P3%
EBITDA
8,076THB Million

Q3/15 Q2/16 Q3/16
Accounting Operating
EBITDA Performance - BCP Group
5The Bangchak Petroleum Plc
Unit: THB Million
EBITDA Performance
28% YoY
-32% QoQ
Accounting EBITDA
-21% YoY
-10% QoQ
Operating EBITDA2,184
3,5674,085
3,143 2,798 2,833
Refinery Marketing Solar Power Biofuel E&P
Q3/16 EBITDA Performance Compare to Target by Business Unit
Target
1,503MB
607MB
612MB
-65MB
171MB
5
2,833
2,798
0 1,000 2,000 3,000 4,000 5,000
Operating
Accounting
Target3,700
Unit: THB Million

EBITDA Performance - BCP Group
0%
50%
100%
150%
200%
0.5 1.5 2.5 3.5 4.5 5.5
Solar Power1,765
Marketing2,531
Refinery3,389
Biofuel195 E&P
252
9M/16 Performance Compare to Target by Business Unit
Accounting EBITDA 8,076 Million Baht
Unit: THB Million
Target100%
6The Bangchak Petroleum Plc 6

BCP Group Portfolios
7The Bangchak Petroleum Plc
Green Power Plant Biofuel E&PRefinery Marketing
7

Refinery Performance: Smooth Operation
8The Bangchak Petroleum Plc
Q3/15 Q2/16 Q3/16
Domestic Import
16% 13% 12%1%
53% 53% 55%
10% 11% 11%
19% 20% 19%
2% 2% 3%
Q3/15 Q2/16 Q3/16
Crude SourcingUnit: KBD
Product YieldUnit: %
LPG
Gasoline
Jet
Diesel
Fuel OilUCO
117 112 115
59%
41%
65%
35%
52%
48%
100 96 101 101 98
48
97 102109 112 117 114
64
112 116
83% 80% 84% 84% 82%
40%
81%85%
91% 93% 97% 95%
53%
93% 96%
0%
20%
40%
60%
80%
100%
0102030405060708090
100110120130140
Q1/13 Q2/13 Q3/13 Q4/13 Q1/14 Q2/14 Q3/14 Q4/14 Q1/15 Q2/15 Q3/15 Q4/15 Q1/16 Q2/16 Q3/16
Crude Run UtilizationRefinery Crude RunUnit: KBD
TAMTAM
8

Refinery Performance
9The Bangchak Petroleum Plc
0
2
4
0
20
40
60
80
100
Q3/15 Q4 Q1/16 Q2 Q3
DB DTD/DB
Crude Price & Crack Spreads ($/BBL)
-10
-5
0
5
10
15
20
Q3/15 Q4 Q1/16 Q2 Q3
GO/DB
UNL95/DB
FO/DB
7.906.27 5.62
-0.12
0.010.03
-3.72
2.510.32
Q3/15 Q2/16 Q3/16
Inventory Gain Loss
Hedging
Market GRM
Accounting GRM 4.07 8.79 5.97
GRM Performance
Q3/16: Market GRM softer than previous quarter
Refinery utilization increased lead to higher value product yield
FO/DB spread was improved while UNL95/DB were weak
Crude cost spread Dated Brent and Dubai (DTD/DB) widening QoQ
An inventory gain of THB 120 Million
764
2,531
1,503
2,103
1,6261,384
Q3/15 Q2/16 Q3/16
Accounting
Operating
Refinery EBITDAUnit: $/BBL
Unit: THB Million
9

0
200
400
600
800
1,000Retail Market
Industrial Market
Export
Wholesales
Distribution channel: Retail market is our main priority
10
Refined Petroleum Products: % Portion of total sales volume Q3/2016
Marketing Business
RetailMarket
IndustrialMarket
Wholesales
Export
46%
27%
14%
13%
Q3/15 = 45%, Q2/16 = 48% Q3/15 = 26%, Q2/16 = 28% Q3/15 = 9%, Q2/16 = 14% Q3/15 = 19%, Q2/16 = 12%
Unit: Million Litre
Total Sales Volume
670706
754777
851879
921

Distribution channel: Retail market is our main priority
11The Bangchak Petroleum Plc
803 921 879
469 529 503
Q3/15 Q2/16 Q3/16
Marketing Sales VolumeUnit: Million Litre
1,2721,450 1,382
Industrial Market+7% YoY-5% QoQ
Retail Market+9% YoY-5% QoQ
551
882
607574
858
609
Q3/15 Q2/16 Q3/16
Accounting
Operating
Marketing EBITDA
Unit: THB Million
11
0.97 1.09 1.04
0.24 0.50 0.38
Q3/15 Q2/16 Q3/16
Net Retail Margin Net Industrial Margin
0.70
0.870.80
Net Marketing MarginUnit: Baht/Litre
Retail & Industrial sales volume reduced by
seasonal factor
Retail Margin maintained its level
Industrial Margin dropped from seasonal factor
and excess supply in the market
Q3/16: Seasonal Effected

0
50
100
150
200
250
300
100
200
300
400
500
600
700
12
Marketing NetworkIncrease Thruput per S/S by Network Expansion
BCP - BGN S/S
Major M7 Oil excl. BCP
433
Unit: K.Litre/Station/ Month
Thruput per station
595
554
463
180
200
220
240
260
280
300
320
340
JAN FEB MAR APR MAY JUN JUL AUG SEP OCT NOV DEC
FY2012
FY2013
FY2014
FY2015
FY2016
+11% Average YoY Growth Unit: Million Litre/ Month
Retail Sales VolumeY2015 Jan-Sep 16 ∆
37.1% 37.0%
15.0% 15.0%
13.6% 12.9%
13.0% 12.9%
6.0% 5.7%
5.2% 5.0%
1.5% 1.8%
6.9% 7.9%
1.6% 1.6%
Market Share (Retail Channel)
BCP - Co-Op Type
BCP – Dealer Type
Standard TypeSmall Type
Minor M7 Oil
146
114

R&M PerformanceRefinery and Marketing business are the main source of overall earnings
13
8.345.88 6.96
9.055.80
3.31
2.683.47
3.53
3.90
2012 2013 2014 2015 9M2016
Net MKM
Market GRM
Unit: $/BBL
Normalize Integrated Margin
11.66 8.56 10.43 12.58 9.70
7,026 6,579 7,167
12,838
5,471
2,973 2,6083,562
4,134
3,731
2012 2013 2014 2015 9M2016
Unit: THB Million
R&M being fully integrated model, the profit can be optimized through business cycle
Refinery Business earning was volatile due to market conditions and Turnaround maintenance (TAM)
Marketing Business Captures a Demand Surge During Low Oil Price Environment
Net MKM
Market GRM

BCP Group Portfolios
14
Green Power Plant Biofuel E&PRefinery Marketing

3.7
7
7.7
1
3.4
4
8.0
7
Q2/16 Q3/16
Target2 Actual3
55.6
5
65.3
5
60.6
5
63
.88
65
.03
61
.01
Q3/15 Q2/16 Q3/16
Target Actual
Green Power Plant – New commercial operated plant in Japan
15
Thailand Portfolio (118 MWac)
Electricity Sales by Country (Unit: Million kWh)
Revenue from Electricity Sales (Unit: THB Million)
Steady steam of cash flow
Thailand: Lower Electricity Sales due to the
rainy season
Japan: Higher Electricity Sales during summer
time & additional COD of 8.8 MW PPA
692
525612
Q3/15 Q2/16 Q3/16
Accounting
Green Power EBITDAUnit: THB Million
731 716 680
43 105
Q3/15 Q2/16 Q3/16
TH JP
Japan Portfolio (19.5 MWac)

Biofuel Business – Increased capacity from new biodiesel plant
16
366 387452
568
741
478
Q3/15 Q2/16 Q3/16
Daily Production Sales Volume
Capacity expanded from 2nd Biodiesel plant’s COD
Lower demand of Biodiesel (government’s policy of decreasing
the portion of B100 mixing with diesel from 7% in to 3%)
Biodiesel plants recorded a 56% utilization rate, current
capacity increased to 810 K. Litre / day
Short term CPO & B100 price fluctuation hence to an
inventory loss
Biodiesel Plant: Daily Production and Sales Volume
Unit: K. Litre per day
62
113
-65
83101 89
Q3/15 Q2/16 Q3/16
Accounting
Operating
Biofuel EBITDAUnit: THB Million
B7 to B5 in July B5 to B3 in Aug
28
30
32
34
36
38
40
42
CPO Price B100 Price
(Baht / Kg.) (Baht / Litre)
Average Monthly CPO and B100 product price
Source: Department of Energy Business, Ministry of Energy

E&P Business – Self Revision, Survival Plan Cutting Down Costs
17
6.115.12 5.08
3.412.86 2.84
Q3/15 Q2/16 Q3/16
Gross Production Net to NIDO
Production (Unit: KBD)
Q3/15 Q2/16 Q3/16
Volumes lifted and Sold*
(bbls)201,003 393,375 196,474
Cargo 1 Cargo 2 Cargoes 1 Cargo
All prices are on FOB
realized basis
($/BBL)
Cargo 47
49.84
Cargo 51
40.53
Cargo 53
45.46
Cargo 52
48.15
49.9943.23 43.19
49.84 44.34 45.46
Q3/15 Q2/16 Q3/16
Dubai Nido
Comparing Nido Selling Price to Dubai benchmark priceUnit: $/BBL
Note: The cargo#52 sold in June was subject to the DES (Delivery Ex Ship) condition, Nido realized the revenue in July 2016
Implement cost cutting plan
Galoc oil filed uptime was 99.3%
Cost saving plan still implemented
Use derivatives to hedge against crude oil price volatility
156
59
171
Q3/15 Q2/16 Q3/16
AccountingE&P EBITDAUnit: THB Million

AGENDA
18
1 Performance Summary
2 Financial Performance Update
4 Investment Update
3 Oil Market Outlook

19
Quarterly Remark – From Financial Aspects
Q3/16 Remarks
BCP
o Long-term loan from financial institution repayment of the company and BCPG Plc. of THB 4,309 million.
o Dividend payment for Shareholders of the Company at 0.80 per share, totaling THB 1,101.54 million.
o The capital increase of Bangchak Bioethanol (Chachoengsao) Co., Ltd. of THB 425 million.
o The capital increase of Bangchak Retail Co., Ltd. of THB 800 million.
o The capital increase of Bongkot Marine service of THB 300,000.
o Paid up share capital of BCP Trading Pte. Ltd. of USD 1 million.
BCPG
o The newly issued ordinary shares of 590 million shares is listed in the Stock Exchange of Thailand,
the company’s shareholding portion in BCPG Plc. was reduced to 70.35%
o BCPG Plc. received cash from selling of equity of Baht 5,711 million.
BCP Energy International Pte.
o Increase of registered share capital from USD 91.31 million to USD 111.41 million for appraisal wells program in the Mid-Galoc area of Galoc oil field in Philippines
Established Oam Suk social Enterprise Co.,Ltd.
o BCP holds 40% in joint venture with Buddhist Economic Foundation, initial registered capital of THB 10 Million
20
Key Financial Performance - Consolidated
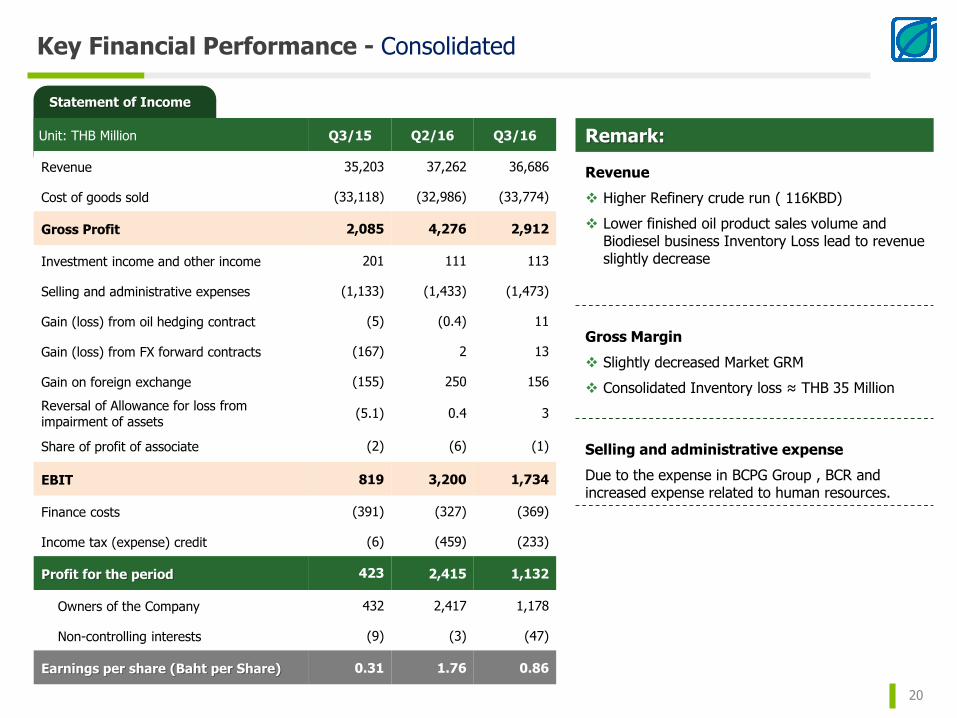
Statement of Income
Unit: THB Million Q3/15 Q2/16 Q3/16
Revenue 35,203 37,262 36,686
Cost of goods sold (33,118) (32,986) (33,774)
Gross Profit 2,085 4,276 2,912
Investment income and other income 201 111 113
Selling and administrative expenses (1,133) (1,433) (1,473)
Gain (loss) from oil hedging contract (5) (0.4) 11
Gain (loss) from FX forward contracts (167) 2 13
Gain on foreign exchange (155) 250 156
Reversal of Allowance for loss from impairment of assets
(5.1) 0.4 3
Share of profit of associate (2) (6) (1)
EBIT 819 3,200 1,734
Finance costs (391) (327) (369)
Income tax (expense) credit (6) (459) (233)
Profit for the period 423 2,415 1,132
Owners of the Company 432 2,417 1,178
Non-controlling interests (9) (3) (47)
Earnings per share (Baht per Share) 0.31 1.76 0.86
Remark:
Revenue
Higher Refinery crude run ( 116KBD)
Lower finished oil product sales volume and Biodiesel business Inventory Loss lead to revenue slightly decrease
Gross Margin
Slightly decreased Market GRM
Consolidated Inventory loss ≈ THB 35 Million
Selling and administrative expense
Due to the expense in BCPG Group , BCR and increased expense related to human resources.

21
BCP Group Performance - Consolidated
Q3/2016 BCP BGN BBF BCPG BCR BBE BCPE BCPI BCPT NIDO Total
% of Share holding 100% 70% 70.35% 100% 85% 100% 100% 100% 81.41%
Revenue 34,506 7,430 1,553 785 0.3 - - 644
Net Profit 949 27 (108) 365 (25) (8) (0.1) - (0.2) (70) 1,128
UBE - Share of profit of investments in associates (2)
Eliminations 6
Net Profit for the period 1,132
Profit (loss) attributable to:
Owner of the company 1,178
Non-controlling interests (46)
Unit: THB Million

22
BCP Group Performance - Consolidated
9M/2016 BCP BGN BBF BCPG BCR BBE BCPE BCPI BCPT NIDO Total
% of Share holding 100% 70% 70.35% 100% 85% 100% 100% 100% 81.41%
Revenue 98,281 21,555 5,641 2,327 0.3 - - 1,176
Net Profit 2,716 90 110 1,214 (55) (8.0) (0.3) 2 (0.2) (423) 3,646
UBE - Share of profit of investments in associates 5
NIDO - Adjust loss from impairment of assets (399)
Eliminations 269
Net Profit for the period 3,521
Profit (loss) attributable to:
Owner of the company 3,642
Non-controlling interests (121)
Unit: THB Million

23
Key Financial Performance - Consolidated
EBITDA Structure of the Company and its subsidiaries
Q3/15 Q2/16 Q3/16 YoY QoQ
Total Revenue 35,203 37,262 36,686 4% -2%
Total EBITDA 2,184 4,085 2,798 28% -32%
EBITDA Refinery 764 2,531 1,503 97% -41%
EBITDA Marketing 1/ 551 882 607 10% -31%
EBITDA Solar Power 2/ 692 525 612 -12% 17%
EBITDA Biofuel 3/ 62 113 (65) -204% -157%
EBITDA Exploration and Production 4/ 156 59 171 10% 191%
EBITDA Others 5/ (41) (25) (31) 25% -23%
Profit attributable to
owners of the Company432 2,417 1,178 173% -51%
Earnings per share (Baht) 0.31 1.76 0.86 177% -51%
1/ EBITDA from Marketing Business, Bangchak Greenet Co.,Ltd, and Bangchak Retail Co.,Ltd2/ EBITDA from Solar Power Plant Business, BCPG Co.,Ltd. and its subsidiaries3/ EBITDA from Bangchak Biofuel Co., Ltd. and share of profit/ (loss) from Ubon Bio Ethanol Co, Ltd4/ EBITDA from Nido Petroleum Limited 5/ EBITDA from BCP Energy International Pte, Ltd. and others

24
Key Financial Position - Consolidated
Assets:
Cash & Equivalents increased by 11,222 MB mainly from cash from operation of 8,203 MB
Inventory decreased by 1,329 MB mainly from lower volume of finished products from 3.25 to 2.11 MBBL
PP&E increased by 4,445 MB from refinery machinery and equipment, acquisition of solar power plant and biodiesel plant.
Other Non Current assets increased mainly from goodwill & license of BCPG Japan and fair value measurements for investment in Lithium Americas Corp.
Liabilities & Equity:
Current Liabilities increased mainly from
Account Payable increased by 1,592 MB from the value of crude oil purchase in Sep 2016 higher than in Dec 2015, and from the finished oil products import of Bath 400 million.
Long-term debt increased by 5,298 MB
BCP loans decreased from repayment and prepayment
Subsidiary’s long-term loans increased from BBF, BBE and BCPG
Equities mainly increased from Net Profit 3,642 MB and decreased by 2,478 from dividend payment
Unit: THB Million
40,044 44,489
8,09910,387
13,94512,616
11,9839,717
7,87219,094
Cash and Equivalents
Current Assets
Inventory
PP&E
Non Current Assets
81,942
96,303
Assets
31 Dec 15 30 Sep 16
35,983 43,066
2,8383,385
33,658
38,956
9,462
10,89681,942
96,303
Liabilities & Equity
31 Dec 15 30 Sep 16
Current Liabilities
Long Term Debt
Total Equity
Non Current Liabilities
(Including current portion of L/T debt)

25
Cash Flow - Consolidated
Beginning Cash7,872 MB
Change in Cash11,255 MB
Ending Cash19,094 MB
FX adjustment(33 MB) 7,821
1,022
839
4,309
14,584
7,888
3,499
2,523
254
Cash From Operation(CFO)
Funding
Others
26,997
Sources of Cash Used of CashDebt Service
15,742
Asset PurchaseAcquisition
Cash Received from maturity of short-term investment
9M/2016 Sources and Uses of CashUnit: THB Million
Dividend Paid
Prepayment
Change in Working Cap
0.54 0.59 0.55 0.52 0.45
Q3/15 Q4/15 Q1/16 Q2/16 Q3/16
Net IBD/E Ratio (Times)
11,98131%
6,94018%
4,04910%
15,98641%
Baht LoanBaht Bond
USD Loan
38,956 THB Million
(as of Sep 30, 2016)
Long-Term Debt Portion
JPY Loan
Asset Purchase / Acquisition
PP&E refinery machinery and
equipment(BCP) 3,243 MB, BCR 24 MB
Biodiesel plant(BBF,BBE) 1,413 MB
Acquisition of solar power business
1,537 MB
leasehold right 371 MB
Intangible assets and Others 358 MB
Other
Mainly from Cash for selling Equity 5,770 MB (BCPG)

AGENDA
26
1 Performance Summary
2 Financial Performance Update
4 Investment Update
3 Oil Market Outlook

Oil Balance seen tighten in 2017
27
• In the fourth quarter of 2016, winter supply/demand fundamentals together with new OPEC policy should push price into a $50-$55 /BBL bythe end of this year.
• Supply creation will become the market’s focus in 2017 and this will require higher oil prices.
57.60 56.60 57.00
6.80 6.90 7.00
32.10
95.10 96.30 97.50
0
10
20
30
40
50
60
70
80
90
100
2015 2016 2017
MB
D
Global Oil Balance 2015 - 2017
Non-OPEC Supply OPEC(NGLs) OPEC Production Total Demand
Call on OPEC
33.50 MBD
Call on OPEC 32.80 MBD
Tighten supply if OPEC policy reducing production to 32.5-33.0 MBD
Actual OPEC ProductionJan-Oct’16: 33.075 MBD

Crude Oil Prices Outlook
28
Q4: OPEC decision is an important bullish development for oil prices
2017: Surplus stock will continue to decline lead to higher oil prices
0
20
40
60
80
Jan-15 Apr-15 Jul-15 Oct-15 Jan-16 Apr-16 Jul-16 Oct-16 Jan-17 Apr-17 Jul-17 Oct-17
$/BBL
Iran nuclear deal reached
Greece Debt Default U.S.
Presidential election
Stronger winter demand / La Niña?
Rig count drop
Upstream investment cut
China’s stock rout
No OPEC production ceiling agreement
Iran’s sanction lifted
Possible of OPEC and Non-OPEC
coordination
FED rate hike
Dubai AVG: Q1/16 = 30.42 Q2/16 = 43.19 Q3/16 = 43.16 Q4/16 (F) = 47.5FY2015 = 50.8 $/BBL FY2016 (F) = 41.06 $/BBL FY2017 (F) = 53.00 $/BBL
Hurricane Season
Q4-16
• New OPEC’s policy to cut oil production.
• Higher oil demand during winter.
• Refineries return from maintenance.
• Fed rate hike Expectation in Dec.
• Chinese economic slowdown.
2017
• Stronger world Economic.
• China buying for SPR filling.
• Weak Chinese economy.
• Some U.S. shale production return.
• Higher non-OPEC supplies.
OPEC talks
Fed Rate Hike Expectation
Significant global inventories decrease
Shale oil production recovery
Effects from Trump win on oil industry
• Opposed Iran sanctions oil supply issue.
• Support U.S. upstream and open federal land and water for fossil exploration.
• Support to coal industry return.
• Emerge from international trade leads to U.S. oil demand growth.

Higher Refinery Product Margins in Q4-16 on Middle Distillate cracks Supports
29
Singapore Product Cracks Spread Outlook
Market Highlights in Q4-16:
• Seasonally softer gasoline demand in Q4 but the Colonial pipeline shutdown, refinery maintenance in Asia (Oct) and ME (Nov) support gasoline cracks.
• Improving gasoil cracks due to seasonally stronger demand.
• Higher demand and tight supply remain support fuel oil cracks.
• Asian CDU capacity additions will rebound in 2017 but some delay is likely.
• Continuation of relative light end support compared to middle distillates on still strong demand.
• Bunker demand slowdown following oil prices rise although fuel oil supply decrease on export tax hike and refinery upgrade in Russia.
Factors to watch 2017:
15.4
19.8 19.4 18.7 18.8
14.411.6
14.0
18.3
14.714.1
16.3
13.710.8
13.7
9.7 10.5 10.913.0 13.6
11.012.5
-1.9-3.5
-8.1-6.6 -5.2
-8.7
-4.3 -4.0-5.0 -5.6 -6.0
-15
-10
-5
0
5
10
15
20
25
Q1-15 Q2-15 Q3-15 Q4-15 Q1-16 Q2-16 Q3-16 Q4-16 2015 2016 2017
ULG95 - Dubai
Gas oil 0.05%S - Dubai
Fuel Oil - Dubai
$/BBL

AGENDA
30
1 Performance Summary
2 Financial Performance Update
4 Investment Update
3 Oil Market Outlook

New Co-Gen Power Plant
3E Project – Project Progress
31
Y2016 Y2017 Y2018 Y2019 Y2020
Completion
Project Timeline
New Co-Gen Power Plant (≈12 MW)
Under Construction
Continuous Catalyst Regeneration Unit (CCR)
(Extend Maintenance Cycle)
FEED&ITB Preparation for Enlarge Capacity
Debottlenecking
(For light end products)
Basic Design Preparation
Completion EPC Award
Completion EPC AwardNPU and ISOU
Boiler Stack/ Structure HRSGOverall Site
Progress: 86%

Oam Suk Social Enterprise Company Limited
32
Oam Suk Social Enterprise
Company Limited
Buddhist Economic
Foundation
40%holds
60%holds

Resources Business
33
E&P
Increase of registered share capital from USD 91.31 million to USD 111.41 million for appraisal wells program in the Mid-Galoc area (GMA) of Galoc oil field in Philippines
Nido’s budgeted participating interest share of well costs is estimated to be A$24.0 million (US$18.5 million)
2P – 4.1MMstb2C – 7.4MMstb
Galoc Reserves & Resources1/
1/Reserves estimates as at 31 December 2015 and Contingent Resources estimates as at 1 August 2016
If successfully developed:
Production & Cost Saving
expected to start production in 2019
would save Galoc total cost by 30%
Optimal timing
• Enough time window for GMA to be developed before decommissioning of Galoc Field and related infrastructure
• Lower global oil price reduced drilling & developing cost by almost 50%

Bangchak Service Station - Greenovative Experience
34
“New paradigm shift to be Customer Centric”
o Introduced new service stations design
o Expanded new potential service stations

New Service Station Design
35
Greenovative Experience
Developed Non oil one roof concept

New Chapter of Bangchak Retail Non-Oil Business
36

37
Disclaimer : The information contained herein is being furnished on a confidential basis for discussion purposes only and only for the use of the
recipient, and may be subject to completion or amendment through the delivery of additional documentation. Except as otherwise provided
herein, this document does not constitute an offer to sell or purchase any security or engage in any transaction. The information contained herein
has been obtained from sources that The Bangchak Petroleum Public Company Limited (“BCP”) considers to be reliable; however, BCP makes no
representation as to, and accepts no responsibility or liability for, the accuracy or completeness of the information contained herein. Any
projections, valuations and statistical analyses contained herein have been provided to assist the recipient in the evaluation of the matters
described herein; such projections, valuations and analyses may be based on subjective assessments and assumptions and may utilize one among
alternative methodologies that produce differing results; accordingly, such projections, valuations and statistical analyses are not to be viewed as
facts and should not be relied upon as an accurate representation of future events. The recipient should make an independent evaluation and
judgment with respect to the matters contained herein.
Thank You
Q&A