the bahr el ghazal basin - hydrologie.orghydrologie.org/bluebooks/sp005/bb_005_0088.pdfthe bahr el...
TRANSCRIPT

The Hydrology of the Nile by J. V. Sutcliffe & Y. P. Parks. IAHS Special Publication no. 5, 1999.
CHAPTER 6
THE BAHR EL GHAZAL BASIN
INTRODUCTION
Chapter 6
The Bahr el Ghazal is unique among the Nile tributaries in that its outflow to the White Nile is almost negligible. The rainfall of 1200-1400 mm in the upper basin is the highest in the Sudan and gives rise to a number of seasonal tributaries, which converge towards the confluence of the Bahr el Ghazal with the White Nile (Fig. 5.1). These contribute about 12 km3 of water from their upper catchments to areas of swamp in the lower basin, where the inflows are almost entirely lost to evaporation. The most recent study of the Bahr el Ghazal swamps was that of Sutcliffe & Parks (1994b), which made use of recent flow records and a water balance model developed for the Sudd (Sutcliffe & Parks, 1987). This model was applied to the Bahr el Ghazal swamps in order to compare their regime with that of the Bahr el Jebel swamps.
Previous hydrological studies of the Bahr el Ghazal basin have been published in The Nile Basin, vols I and V (Hurst & Phillips, 1931,1938), in the reports of the Jonglei Investigation Team (1954), Southern Development Investigation Team (1955), and Chan & Eagleson (1980).
In this chapter the findings of these earlier studies are followed by discussion of the available flow records and the main topics whose solution is essential to a realistic water balance of the basin. These are an assessment of the total inflow of the various tributaries, whether there is significant spill from the Bahr el Jebel towards the Bahr el Ghazal, and the estimated area of the Bahr el Ghazal swamps. Recent records show that the inflows of the Bahr el Ghazal tributaries have decreased in recent years, in contrast to the increase in the Bahr el Jebel. A hydrological model, supported by satellite imagery, shows that the area of the Bahr el Ghazal swamps has become small compared with the Bahr el Jebel swamps.
V
EARLY STUDIES
Physical background
The Nile Basin, vol.1 (Hurst & Phillips, 1931), contains first-hand descriptions of the topography of the basin as a whole and of individual rivers; it is particularly useful as it is

The Bahr el Ghazal basin 89
illustrated by a number of photographs. These show the rivers at the sites of key road crossings during both the wet and dry seasons, and together with the text give a clear picture of the country. Of particular interest are photographs of the River Tonj at Tonj, where a level gauge was established in 1932. One oblique photograph taken from the air (their Plate 81) shows the river full and beginning to overflow into the "toich", or seasonally inundated grassland, on the flood plain. The toich is relatively limited in width at this point, being contained between slightly higher ground with woodland. A pair of photographs (Plates 86c and d) show the Loi at Nyamlel as a narrow channel through higher ground, though the river is said to flood upstream of this site. Another photograph (Plate 89a) shows the Jur at Wau in September 1930, when the river flow was above the average peak flow. These three sites have been used to measure the three largest tributaries, which as shown later together contribute 80% of the inflow of the 10 Bahr el Ghazal tributaries.
There are also three rivers to the southeast of the Bahr el Ghazal tributaries which flow towards the Bahr el Jebel, but their contribution to the Bahr el Jebel swamps is likely to be relatively small.
River profile
The Bahr el Ghazal tributaries follow a common pattern, first described by the Southern Development Investigation Team (1955). They develop from an area of rapid runoff along the Nile-Congo divide, where rainfall is relatively high at 1200-1400 mm and the relief up to 1000 m provides good drainage. The rivers drain across an ironstone peneplain, covered by woodland; this is overlain in its lower reaches by clay grassland plains northeast of a line Aweil-Wau-Tonj-Rumbek-Yirol-Juba. Some 5-10% of the rainfall drains in numerous small streams, which unite to form rivers which are at this stage erratic in flow. As the rivers leave the upper zone the extreme flows are damped to some extent, but still carry sediment during the rainy season. The rivers leave the upper catchment in defined valleys where the slopes decrease and sediment is deposited. They traverse a zone where they meander between alluvial banks in a widening flood plain defined by the slightly higher land of the valley sides. Much of the low dry season flow takes place through the sandy bed. Eventually the rivers emerge into a zone of unrestricted flooding over clay plains, where the vegetation provides the main resistance to the spread of water. In this sense the Bahr el Ghazal tributaries are similar to the main channel of the Bahr el Jebel. However, the inflows are divided between a number of channels rather than a single river, and the volumes are relatively small compared with the areas over which flooding can spread. Also the sediment load of these rivers is higher than the lake-fed Bahr el Jebel, and there is a greater potential for the formation of alluvial channels. The lower course of the Bahr el Ghazal consists of a series of channels and lakes, with somewhat stunted papyrus swamp on either side of the channels. A much smaller fraction of the inflow, less than 3%, emerges from the Bahr el Ghazal swamps compared with about 50% on the Bahr el Jebel, but the processes of spilling and drainage are similar.
Early water balance
A preliminary water balance of the Bahr el Ghazal swamps was outlined in The Nile Basin, vol. V (Hurst & Phillips, 1938), with measured flows of the Jur at Wau supplemented by estimates for the other tributaries. The average flow of the Jur at Wau was assessed as 5.0 km3, based on levels from 1912 to 1932 and discharge measurements in 1930-1932. From rainfall estimates of 1140-1450 mm over the useful catchments, the total average runoff from the Bahr el Ghazal tributaries was estimated as 15.7 km3, with an additional 2.7 km3 from the

90 The Bahr el Ghazal basin
Bahr el Jebel tributaries. These total flows were compared with estimated evaporation from the areas of swamps in the lower Bahr el Ghazal basin, estimated from survey maps. The total area of the Bahr el Ghazal swamps, including those fed by the Bahr el Jebel tributaries, was tentatively assessed as 16 700 km2, from which the net evaporation loss was deduced as slightly over 1 m, plus 0.8-0.9 m average rainfall.
At the same time, Butcher (1938) had been studying the water balance of the Bahr el Jebel swamps (Chapter 5) and had deduced from comparative balances, at different latitudes down the length of the river, that there was a possible spill of about 6 km3 year"1 from the lower Bahr el Jebel towards the Bahr el Ghazal swamps to the west.
Estimates of tributary inflow
After reconnaissance in 1930-1931, when Hurst noted the areas of runoff accumulation and of spill, the tributary inflows were measured at a series of sites established along the main road from Juba to Wau and Nyamlel. These sites roughly follow the boundary of the ironstone plateau, and thus lie at the limit of the zone of runoff generation. Level gauges were erected from 1932, though one had been read at Wau from 1904. Regular gaugings began about 1941-1942 at these sites, and flow records were published in The Nile Basin, vol. IV and supplements. Flow measurements were interrupted about 1961, but were resumed by the Sudan authorities at several major sites about 1970 and records have been printed in Sudan yearbooks.
Summaries of measured and estimated flows along this line of gauges were given in Jonglei Investigation Team (1954), and flows were estimated for all the main rivers by the Southern Development Investigation Team (1955). These estimates have been revised in subsequent studies. Hurst et al (1978) used records up to 1962 to estimate average flows. Chan & Eagleson of MIT (1980) used flow records up to 1961 (The Nile Basin, vol. IV, supplement 8) as a preliminary input to a water balance study of the Bahr el Ghazal basin. These estimates are compared in Table 6.1.
Following agreement to divide responsibility for river flow measurement between Egypt and Sudan, river flows were measured by the Sudan authorities in a revived programme from 1970, and recent statistics differ somewhat from earlier estimates. At those sites where recent records are available, the revised estimates of mean flow have decreased. It appears
Table 6.1 Estimated flows of Bahr el Ghazal tributaries (km3) (after Sutcliffe & Parks, 1994b).
River Southern Development Hurst ( 1978) MIT (Chan & Sutcliffe & Investigation Team Eagleson, 1980) Parks (1994b) (1955)
Raqaba el Zarqa Bahr el Arab Loi at Nyamlel Pongo Geti Jur at Wau Tonj at Tonj Gel Wokko Naam at Mvolo Total
Bahr el Jebel tributaries Lau/Yei at Yirol Tapari Gwir
0.10 0.32 4.23
4.52 1.11 0.55
0.64 11.47
1.02 0.44 0.12
4.2 0.6
5.0 1.5 0.5
0.5 12.3
0.100 0.300 3.900 0.575
5.220 1.600 0.520
0.476 12.69
2.060
0.100 0.300 3.243 0.597 0.095 4.496 1.363 0.523 0.130 0.476
11.323

The Bahr el Ghazal basin 91
(Chapter 12) that the flows of the Bahr el Ghazal tributaries are correlated with the Ethiopian tributaries like the Blue Nile, Dinder and Rahad. These have tended to decrease in recent years, in contrast to the outflows from the East African lakes which provide the main contribution to the Bahr el Jebel and which increased dramatically after 1961.
TOPICS FOR INVESTIGATION
Thus the pattern is of a complex system converging on Lake No, draining a impermeable plateau with rainfall of about 1200-1400 mm between March and October. After soil moisture recharge, runoff occurs between June and November and averages about 60-100 mm over the gauged basins. The rivers leave the plateau in defined channels and then meander in alluvial channels through flood plains, with spill over limited areas. They converge downstream in complex swamps from which little flow reaches the White Nile. The rivers spill first into local and then wider flood plains in a pattern which gives rise to seasonally flooded grasslands and permanent papyrus swamp. The analysis (Sutcliffe & Parks, 1994b) drawn on in this chapter used up-to-date hydrological records to revise the estimated inflow and to study the extent of this seasonal and permanent flooding. The items needed to provide a realistic balance are a historical sequence of river inflows, an assessment of spill from the Bahr el Jebel to the Bahr el Ghazal swamps, and the area of the permanent and seasonal swamps.
AVAILABLE FLOW RECORDS
River flow records for eight tributaries were published in The Nile Basin up to 1962, though records became intermittent towards the end of this period. Estimates have been made for the Bahr el Arab and Raqaba el Zarqa, whose flows are small. Since 1970 flows for the Loi at Nyamlel, the Jur at Wau and the Tonj at Tonj were measured by the Sudan authorities (Gibb, 1989). Although a reasonable number of gaugings were carried out yearly at Nyamlel since 1944, the number of high flow measurements has been limited; the ratings have broadly been stable but there have been some shifts and the flows are not precise. At Tonj, where gaugings began in 1942, the ratings have been reasonably stable and well defined, but in some years there were few high flow gaugings and flows may have been underestimated. At Wau, on the other hand, where gaugings have been regular from 1942, the high flow ratings have been well defined and stable, but the low flow ratings are less well defined.
The longest potential flow record in the upper Bahr el Ghazal basin is on the Jur at Wau, where a level gauge was established in 1904. Regular flow gaugings were not begun until 1942, but a total of 21 gaugings were carried out in 1930-1932. These were used by Hurst & Phillips (1938, p. 171) to construct a rating curve, which they believed could be fairly permanent; there is in fact a protruding rock bar at the site. These gaugings provide a rating derived by HYDATA of Q = 49.14 (h - 9.64)1646, with Q in m3 s"1, which is similar to more recent ratings. An appraisal of the site (Gibb, 1989) suggested that the higher flows would be reasonably estimated from the rating curves, though low flow ratings would be less stable. This equation has been applied to 10-day gauge levels for the period 1904-1941 to indicate long-term flows for comparison with the more recent record. Monthly flows for the whole period, with some gaps filled by averages, are illustrated in Fig. 6.1(a) while annual totals are shown in Fig. 6.1(b). These records illustrate the seasonal nature of the runoff, its annual variability and its decline in recent years. Flows for various periods are summarized in Table 6.2. There is little difference between the estimated flows for 1904-1941 and those for 1942-1961; the difference in low flows is likely to be due to uncertainties in the early rating. The decline of total flows in recent years is clear.

92 The Bahr el Ghazal basin
1904
9.0
8.0 -I
7.0
co 6.0
5f 5.0 o
4—
« 4.0 C
< 3.0
2.0 -I
1.0
0.0
1914 1924 1934 1944 1954 1964 1974
T"IT|TI 111 i-rpr n r i ï i ï i ï i
1984
(b)
i 1904 1914 1924 1934 1944 1954 1964 1974
Fig. 6.1 River Jur at Wau: (a) monthly flows, 1904-1986; (b) annual flows, 1904-1984
1986.
The seasonal distributions of the Bahr el Ghazal tributaries were compared in Sutcliffe & Parks (1994b, Table 2) from the monthly normals up to 1962 published in The Nile Basin. This comparison showed that the seasonal distribution of runoff is similar at the different sites.
Flows estimated for the MIT study
In their water balance study, Chan & Eagleson (1980) initially used the river flows published in The Nile Basin up to 1962, with a total average annual flow of 12.7 km3. They also added
Table 6.2 Average flows of Jur at Wau for various periods (m3 * 105).
Jan. Feb. March April May June July Aug. Sept. Oct. Nov. Dec. Year
1904-1941 65 28
1942-1961 19 4
1970-1986 29 5
17
1
31
7
4
110 227 498 911 1116 1118 636
95 227 427 803 1308 1383 700
74 155 366 615 871 927 494
193
196
111
4951
5171
3653

The Bahr el Ghazal basin 93
spilling of 6 km from the Bahr el Jebel to the Bahr el Ghazal, citing Jonglei Investigation Team (1954). However, they then doubled these total flows following a preliminary water balance. They first compared the measured river inflows with the estimated evaporation (2200 mm) from the areas of swamp (16 600 km2) given by The Nile Basin, vol. V, taking the whole area to be permanent papyrus swamp. They then added evaporation from the area below the road linking the gauging stations, which they termed the Central Swampland (84 950 km2). They assumed this to include both the papyrus swamp (16 600 km2) and grassland (68 4001cm2), part of which was seasonally inundated.
In the absence of direct evidence, they assumed that in addition to the papyrus swamp there was 28 500 Ian2 of seasonally flooded grassland, which would transpire at the potential rate (1440 mm) throughout the year; and 39 900 km2 of unflooded grassland, transpiring only during the rainy season (840 mm). The total evaporation loss was compared with direct rainfall and river inflows, but a preliminary water balance left a shortfall of some 15 Ion3, even after including Bahr el Jebel spill of 6 km3. This apparent shortfall was assumed to be due to ungauged runoff or groundwater flow down the various tributary valleys.
A further water balance was then carried out, using the catchment water balance model developed by Eagleson (1978). Each component was formulated as a function of the climate, soil and vegetation of the basin. Deep underground and lateral seepage are neglected but it is argued (Chan & Eagleson, 1980) that "wherever there is a large discrepancy between the computed mean annual basin yield and that obtained from a long series of historical records of discharge, the groundwater seepage term or the ungaged discharge has to be included". On this basis, unmeasured flows were estimated at 19.8 km3 by comparing the total measured inflow from each basin with the catchment yield simulated by the conceptual model. With measured inflow of 12.7 km3 and Bahr el Jebel spill of 6 Ion3 this gave a total inflow of 38.5 km3. Thus the assumed inflow was three times the measured runoff.
Although the measured flows of the main Bahr el Ghazal tributaries are low (3-7%) when expressed as percentages of rainfall, this does not seem to justify trebling the published flows. Available knowledge of the area, supported by the photographs mentioned earlier, suggests that the gauging sites were well located in defined valleys with limited flood plains. Unmeasured flow through the sand bed or valley vegetation is likely to be small by comparison with channel flow; so is underground flow through these relatively hard rock basins. The rating curves at some sites may be imprecise at high flows, but such problems are not unusual. It seems preferable to use the measured flows and to take advantage of the fact that measurements have been continued on the main rivers to bring up to date the earlier estimates.
REVISED ANALYSIS OF AVAILABLE RIVER FLOW RECORDS
Recent records of discharge exist for the three major tributaries (Loi, Jur and Tonj) and account for over 80% of the total inflow. A reasonable extended time series and long-term average total inflow may be obtained from these three records and estimates of average flows from early records at other sites. The records of the minor tributaries are too intermittent to complete the time series. Early flows for the Jur have now been estimated for 1904-1941; however, these flows are not sufficiently precise for use in extension.
Flow measurements are available for the three sites for much of the period between 1942 and 1986, but each record is somewhat intermittent, with a gap at all sites between 1963 and 1969. There have been problems in gauging these rivers over the years; some spill occurs at high flows, the flow regimes are highly seasonal with negligible or zero flows during the dry season, and access to the sites has not been easy in recent years. For example, the records of

94 The Bahr el Ghazal basin
the Jur at Wau show zero flow for several months of the dry season in some years, and have gaps in the record in other dry seasons. Field inspection of the site and records suggested that gauge levels and flows were often left unrecorded when river flows were low. However, the bulk of the flows occurs during the wet season and recession months of June to November inclusive, and therefore total flows are acceptable. Other problems are found with the Tonj at Tonj, where two gauges were maintained and recorded separately as "through road bridge" and "downstream road bridge". These two flow records differ significantly but the former, larger, flows have been accepted for the overall water balance.
Before deriving the total inflow series from the three major records, these were first completed to give full years of record. During the recession period short gaps were estimated by comparison of adjacent records. In other months, which were usually during the dry season, long-term monthly average flows were inserted provided that measured flows gave a high percentage of the year's total; where this was not the case the year was treated as missing. After this process a total 36 years of flow record were available for the Jur, 26 years for the Tonj and 34 years for the Loi. Monthly and annual average flows calculated from these complete years are included in Table 6.3 for the three sites. This illustrates the similarity of the seasonal flow distributions, with minor differences reflecting the larger catchment area above Wau. The three annual flow series reveal similar patterns of runoff (Sutcliffe & Parks, 1994b, Fig. 2a-c) with high and low years coinciding in general and a decline in recent years evident.
Table 6.3 Average river flows (m3 * 106), rainfall and evaporation (after Sutcliffe & Parks, 1994b).
Jan. Feb. March April
Loi at Nyamlel (1944-1985) 10.2 2.0 0.6 1.6
Jur at Wau (1942-1986) 23.6 4.4 2.0 5.6
Tonj at Tonj (1944-1985) 4.8 1.3 1.4 1.1
Total inflow (1942-1986) 52.0 9.8 4.9 10.4
May
14.6
85.8
30.9
157
Outflow at Khor Doleib (1937-1964) 22.6 31.5 41.9 41.7 29.4
Rainfall (mm) 0 4 14 49
Evaporation (mm) 217 190 202 186
110
183
June
106
195
74.6
465
22.6
143
159
July
293
400
158
1061
24.6
175
140
Aug.
652
719
250
2012
28.5
184
140
Sept.
995
1114
342
3048
17.9
141
150
Oct.
851
1181
304
2919
18.2
69
177
Nov.
268
608
161
1290
13.7
10
189
Dec.
49.1
158
33.6
305
12.5
1
217
Year
3 243
4 496
1 363
11333
305
900
2 150
DERIVATION OF TOTAL INFLOW SERIES
For a water balance study of the Bahr el Ghazal basin, a time series of total inflow was required for as many years as possible. This was derived by comparing the measured flows at the three main sites with the estimated mean flows of other tributaries. Normal monthly and annual flows for these other tributaries were published in The Nile Basin, vol. IV, supplement 8, for the years up to 1962, and these flows have been used to estimate the total inflow. Although recent records on the three major rivers show that runoff has decreased in this area, there is no recent evidence for the smaller tributaries, and the early estimates have been used to complete the average total inflow. The estimated flows of the Bahr el Arab and Raqaba el Zarqa were derived from The Nile Basin, vol. V (1938). Two additional small

The Bahr el Ghazal basin 95
tributaries which appear to have been overlooked in earlier studies are the Geti and Wokko, whose normal flows are included in the total (Table 6.1).
Thus the total average inflow has been taken as the sum of the recent average flows at the three sites and the earlier normal flows at other sites. Comparison of the estimated total inflow with the total from the three measured sites gives a multiplier of 11.323/9.102 which has been applied to monthly flows when flows at all three sites are available. Other multipliers were derived in similar fashion for years when less than three measured flows were available. These multipliers were applied to as many years as possible to give the monthly total inflow series given in Fig. 6.2(a). The annual totals of this integrated series are shown in Fig. 6.2(b); this illustrates the considerable variation in total inflows from year to year, and also the decline in inflows after 1975. The discharges of the Lau or Yei (2.060 km3), Tapari (estimated 0.440 km3) and Gwir (estimated 0.120 km3) have not been included in the water balance of the Bahr el Ghazal swamps as they flow towards the Bahr el Jebel. It is unlikely that they contribute significantly to the flow of the main river, as they flow through flood plains before they reach the Bahr el Jebel valley. However, the flows of the Gwir and Tapari are significant in terms of the Aliab valley (Chapter 5).
7.0
6.0
co 5 - ° E x: S 4.0 o J? 3.0
2.0 -
1.0
0.0 Jil i
(a)
HI H I / D u l l I. 1/ / U
1940 1945 1950 1955 1960 1965 1970 1975 1980 1985
5 o CO
c <
1940 1945 1950 1955 1960 1965 1970 1975 1980 1985 Fig. 6.2 Bahr el Ghazal tributary inflow: (a) monthly flows, 1942-1986; annual flows, 1942-1986 (after Sutcliffe & Parks, 1994b).

96 The Bahr el Ghazal basin
OTHER WATER BALANCE ELEMENTS
The outflow series has been deduced from the published flows of the Bahr el Ghazal below Khor Doleib, about 40 km above Lake No, where the average annual discharge is only 0.305 1cm3 compared with the average inflow of 11.323 Ian3. The flows of the Bahr el Ghazal at its confluence with the Bahr el Jebel at Lake No (0.634 km3) are somewhat higher but these appear to include some spill from the Bahr el Jebel just above the confluence.
Because the use of average rainfall had little effect on the predicted flooded areas in the Bahr el Jebel swamps (Sutcliffe & Parks, 1989), the combined average monthly rainfall totals at Aweil, Rumbek, Meshra el Req and Shambe (Shahin, 1985) and average open water evaporation for the Sudd (Table 6.3) have been used for the modelling of the Bahr el Ghazal swamps.
SPILL FROM BAHR EL JEBEL TO BAHR EL GHAZAL
As mentioned above, Chan & Eagleson (1980) took account of an annual spill of 6 km3 from the Bahr el Jebel north of Shambe westwards to the Bahr el Ghazal swamps. They cite the Jonglei Investigation Team (1954) but this estimate draws on the study of "latitude flows" by Butcher (1938). Such a flow, if it existed, would be a significant factor in the water balance of both swamps, and it is worth tracing this hypothesis to its source.
There is evidence of physical links between the two swamps. Hurst & Phillips (1931), after air reconnaissance, observed that "the swamps of the Bahr el Jebel and Bahr el Ghazal north of Hillet Nuer are connected by depressions which are for the most part full of papyrus". Newhouse (1929, p. 12) described channels which take off west of the Bahr el Jebel below Shambe and rejoin the main river downstream. He drew attention to Gage's Channel starting at Hillet Nuer (Adok) which, though completely overgrown by papyrus, had been traced to Khor Doleib joining the Bahr el Ghazal; however, he commented that the discharge was trifling.
Butcher (1938) attempted water balances (see Chapter 5) between latitude sites along the Bahr el Jebel and found that only some 40% of the losses could be attributed to evaporation; the most likely explanation of the shortfall was flow towards the Bahr el Ghazal, though no trace of a passage had been found. However, his estimate of swamp evaporation (1533 mm year"1 less 912 mm rainfall) was based on tank measurements where evaporation was greatly underestimated because of stagnant conditions (Chapter 5). Hurst & Phillips (1938) concluded that swamp transpiration was about 30% higher than tank estimates, and that flows from the Bahr el Jebel to the Bahr el Ghazal swamps were an untenable explanation of the Bahr el Jebel losses.
Nevertheless, the Jonglei Investigation Team (1954) repeated that "6.0 milliards of Bahr el Jebel spill, it is estimated, flow westwards between Lake Nuong and Buffalo Cape". They examined physical links in some detail, but noted that channels were overgrown and quoted flows were small. However, when a more realistic estimate of evaporation rates is included in a water balance study of the Bahr el Jebel swamps, the necessity for this spill disappears (Chapter 5). Although the Bahr el Jebel swamps extend to the northwest near Adok (Fig. 6.4) and there is evidence of some local loss to the Bahr el Ghazal near Lake No, there is no evidence of spill of this magnitude from basin to basin.
AREA OF BAHR EL GHAZAL SWAMPS
An early estimate of areas flooded in the Bahr el Ghazal swamps was published in The Nile Basin, vol. V (Hurst & Phillips, 1938, p. 185). Areas marked as swamp or reported
The Bahr el Ghazal basin 97
swamp were estimated from recent 1:250 000 mapping. It was noted that detailed survey had in the past reduced the areas classified as swamp, though large areas were swampy during the rainfall season. The areas of swamp fed from the Loi, Jur, Tonj, Meridi and Bahr el Arab were given as 7700 km2 of definite swamp and 6800 km2 of reported swamp, with an additional 2100 km2 fed from the Naam and the Lau, which flows towards the Bahr el Jebel.
Chan & Eagleson (1980) took this total of 16 600 km2 as papyrus swamp and assumed that over half the area below the gauging stations was inundated permanently or seasonally. They assumed additional seasonally flooded areas of 28 500 km2, but the evidence for this assumption is unclear. This required a large increase in the measured inflows to approach a water balance.
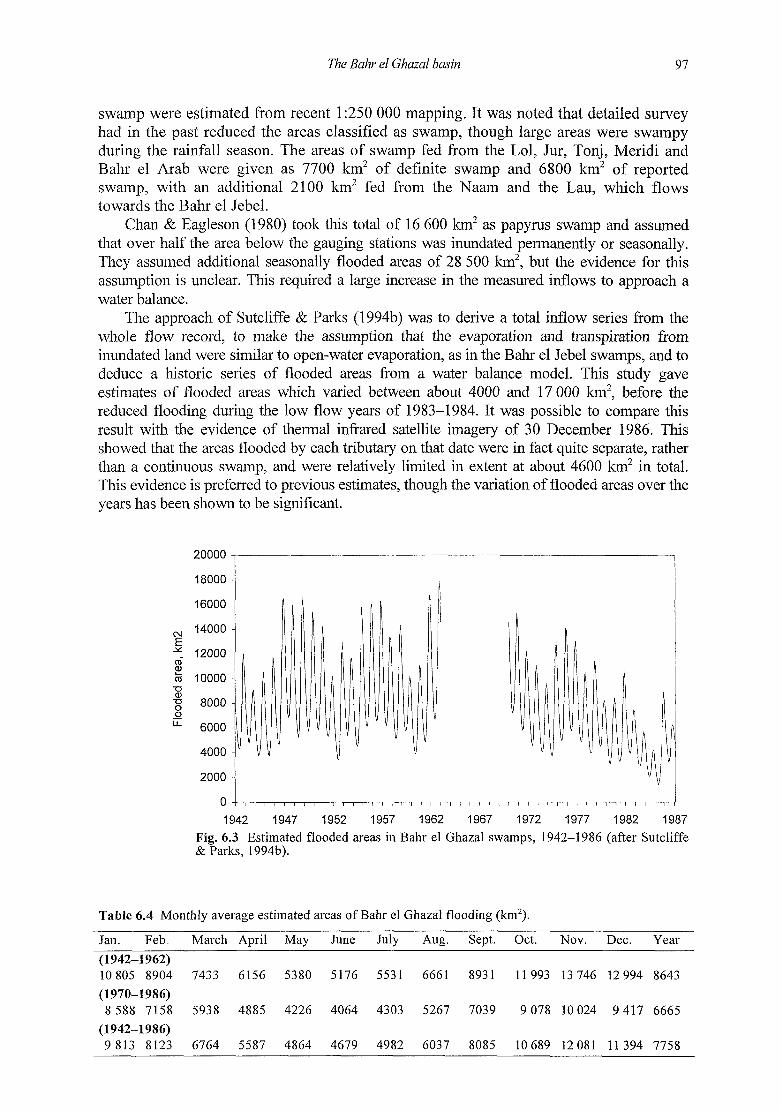
The approach of Sutcliffe & Parks (1994b) was to derive a total inflow series from the whole flow record, to make the assumption that the evaporation and transpiration from inundated land were similar to open-water evaporation, as in the Bahr el Jebel swamps, and to deduce a historic series of flooded areas from a water balance model. This study gave estimates of flooded areas which varied between about 4000 and 17 000 km2, before the reduced flooding during the low flow years of 1983-1984. It was possible to compare this result with the evidence of thermal infrared satellite imagery of 30 December 1986. This showed that the areas flooded by each tributary on that date were in fact quite separate, rather than a continuous swamp, and were relatively limited in extent at about 4600 km2 in total. This evidence is preferred to previous estimates, though the variation of flooded areas over the years has been shown to be significant.
20000
18000
16000
CM 14000 -I E -*. 12000 as TO 10000 -a •S 8000 -I 8
6000 -
4000 -
2000
1942 1947 1952 1957 1962 1967 1972 1977 1982 1987
Fig. 6.3 Estimated flooded areas in Bahr el Ghazal swamps, 1942-1986 (after Sutcliffe & Parks, 1994b).
Table 6.4 Monthly average estimated areas of Bahr el Ghazal flooding (km2).
Jan. Feb. March April May June July Aug. Sept. Oct. Nov. Dec. Year
(1942-1962) 10805 8904 7433 6156 5380 5176 5531 6661 8931 11993 13 746 12 994 8643
(1970-1986)
8 588 7158 5938 4885 4226 4064 4303 5267 7039 9 078 10 024 9 417 6665
(1942-1986) 9 813 8123 6764 5587 4864 4679 4982 6037 8085 10 689 12 081 11394 7758

98 The Bahr el Ghazal basin
THE WATER BALANCE MODEL
A simple water balance model (Sutcliffe & Parks, 1987, 1989) was developed to make use of the facts that inflow and rainfall equal evaporation, storage change and outflow for any wetland area. Evaporation from a flooded wetland can be estimated on the assumption that it approximates to open-water evaporation. The model also allows for infiltration into newly flooded ground, and uses an empirical observation, based on surveys around the Sudd, that flooded volume is linearly related to flooded area. In other words the average depth of flooding remains approximately constant as flooding spreads. It is assumed that deep percolation is negligible by comparison with evaporation. The model does not include areas where grassland is maintained by rainfall without river spillage. These areas do not contribute significantly to the water balance of the inundated areas.
This model was applied to the hydrological data to give a monthly series (Fig. 6.3) of estimated inundated areas for the periods 1942-1962 and 1970-1986. An initial area of 8000 km2 and an average depth of 1.0 m were assumed in line with the Bahr el Jebel model. The modelling gives estimates of flooded areas for 1942-1962 varying between 9000 and 18 000 Ion2 in November at the end of the wet season and about 3400-6800 km2 in June at the end of the dry season. This is compatible with the estimate of 14 500 Ian2 for the Bahr el Ghazal tributaries given in The Nile Basin, vol. V (1938), though it is not clear whether this
The Bahr el Ghazal basin 99
estimate referred to the average, minimum or maximum extent. After 1970, the estimated areas of flooding decreased fairly steadily in line with the reduced inflows of recent years. After 1976 the areas of flooding varied seasonally between about 4600-11 000 km2 and 1400^1800 km2. Table 6.4 summarizes average monthly areas in the different periods of record.
After this reappraisal of tributary flows and swamp modelling had been completed, evidence which provided a check on the analysis was found. The Mullard Space Science Laboratory (Harris, 1991) had developed a technique for remote sensing of wetland areas using thermal infrared satellite data based on the temperature contrast between dry and inundated ground; they provided a typical AVHRR band 4 image dated 30 December 1986 (Sutcliffe & Parks, 1994b, Fig. 5) showing the extent (Fig. 6.4) of the inundated flood plains of the Bahr el Ghazal tributaries, which could clearly be located from a map of the river system. It also showed the outline of the Sudd or Bahr el Jebel swamps.
The image corresponded with the end date of the hydrological modelling, and appeared to verify the modelling. The total flooded area of the Bahr el Ghazal swamps has a range of estimates of 4000-5000 km2, because of some subjective interpretation of cloud cover and wetland outline. The model estimate of flooded area on 1 January 1987 was 5000 km2. This comparison suggested that the estimated inflows on which the model was based, and the calibration of the model, were both realistic and provided reasonable estimates of the extent of flooding. The model could in future be refined by using further satellite imagery, given a resumption of flow measurements. The range of flooded areas could be changed by altering the model depth parameter, but this would have little effect on the average areas of flooding.
DISTRIBUTION OF WETLANDS
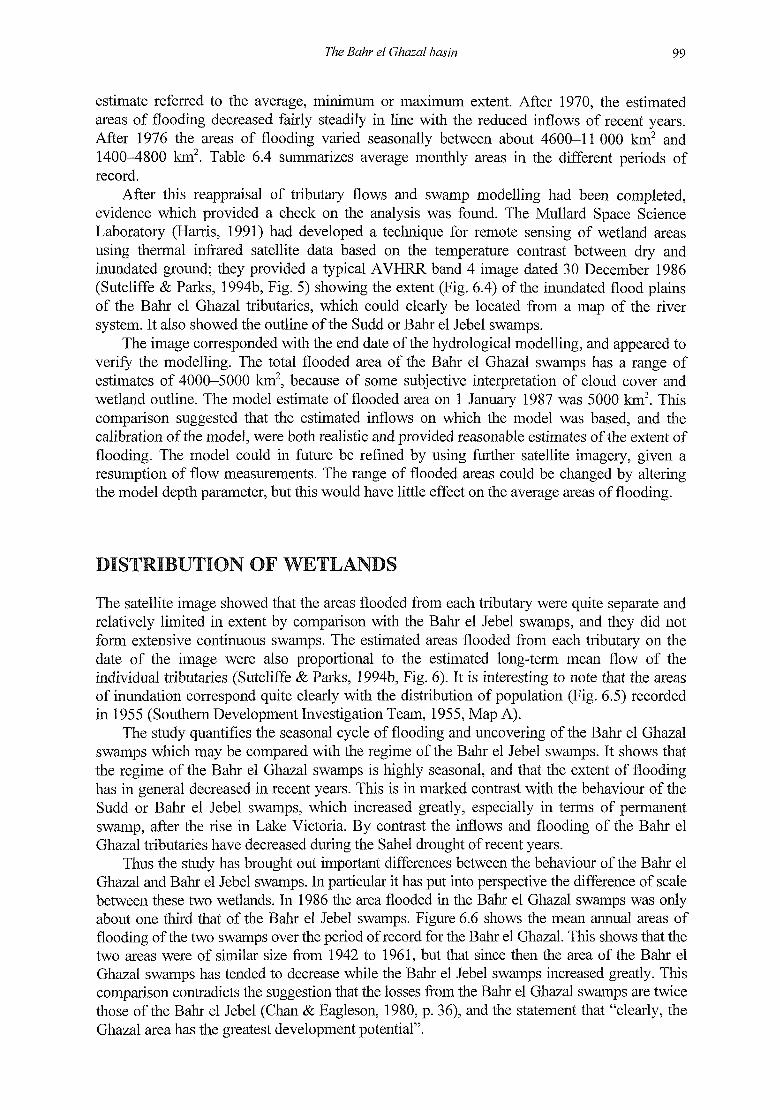
The satellite image showed that the areas flooded from each tributary were quite separate and relatively limited in extent by comparison with the Bahr el Jebel swamps, and they did not form extensive continuous swamps. The estimated areas flooded from each tributary on the date of the image were also proportional to the estimated long-term mean flow of the individual tributaries (Sutcliffe & Parks, 1994b, Fig. 6). It is interesting to note that the areas of inundation correspond quite clearly with the distribution of population (Fig. 6.5) recorded in 1955 (Southern Development Investigation Team, 1955, Map A).
The study quantifies the seasonal cycle of flooding and uncovering of the Bahr el Ghazal swamps which may be compared with the regime of the Bahr el Jebel swamps. It shows that the regime of the Bahr el Ghazal swamps is highly seasonal, and that the extent of flooding has in general decreased in recent years. This is in marked contrast with the behaviour of the Sudd or Bahr el Jebel swamps, which increased greatly, especially in terms of permanent swamp, after the rise in Lake Victoria. By contrast the inflows and flooding of the Bahr el Ghazal tributaries have decreased during the Sahel drought of recent years.
Thus the study has brought out important differences between the behaviour of the Bahr el Ghazal and Bahr el Jebel swamps. In particular it has put into perspective the difference of scale between these two wetlands. In 1986 the area flooded in the Bahr el Ghazal swamps was only about one third that of the Bahr el Jebel swamps. Figure 6.6 shows the mean annual areas of flooding of the two swamps over the period of record for the Bahr el Ghazal. This shows that the two areas were of similar size from 1942 to 1961, but that since then the area of the Bahr el Ghazal swamps has tended to decrease while the Bahr el Jebel swamps increased greatly. This comparison contradicts the suggestion that the losses from the Bahr el Ghazal swamps are twice those of the Bahr el Jebel (Chan & Eagleson, 1980, p. 36), and the statement that "clearly, the Ghazal area has the greatest development potential".

Fig. 6.5 Population map of southern Sudan, 1955 (after Southern Development Investigation Team, 1955).
/ / Jti
°Hojo */ nulo
UH».fd, 2TC t.

102 The Bahr el Ghazal basin
30.0 -,
25.0
CO
O
X eg
E
area
, A
nnua
l 20.0
15.0
10.0
5.0 -j " \
0 . 0 IrTTTTT-TTTTT-rr , M M M U M m W T W T ^ I ! M l I • ! T T T
1942 1947 1952 1957 1962 1967 1972 1977 1982
Fig. 6.6 Mean annual areas of swamps: Bahr el Jebel and Bahr el Ghazal, 1942-1986.
PLANS FOR REDUCING LOSSES IN THE BAHR EL GHAZAL BASIN
There have been plans for the conservation of losses in the Bahr el Ghazal basin over the years. After failure to reach agreement on the use of Lake Albert as a storage reservoir, these plans were given priority as "the Upper Nile project most likely to produce substantial additional supplies of water within a reasonable time, since agreement with only one other country, the Sudan, is involved" (Hurst et al, The Nile Basin, vol. XI, 1978). These plans have not been published in any detail, although it appears that some storage sites with capacities of 0.5-2 Ion3 have been found near Wau. The main features of the project are collector canals to divert the flows of the tributaries to the White Nile and the Bahr el Jebel (Ezzat, 1993). It has been suggested (Hurst et al, 1978) that the yield from the Loi and Jur alone could average 8.3 km3, but this implies that all the flows of the rivers are diverted.
A comparison of the areas of flooding revealed from the satellite image of 1986 with the population map compiled in 1954 (Fig. 6.5) shows that there is a close connection, which has persisted over many years, between the areas of flooding and the population centres. This enables the population to take advantage of the seasonally flooded wetlands during the dry season. In other words, the population of the Bahr el Ghazal basin, like that of the Bahr el Jebel, is closely dependent on the hydrology of the wetlands. This dependence is linked to the seasonally flooded areas which provide grazing, rather than the permanently flooded areas dominated by papyrus; any diversion of river flows should be designed to take account of this dependence.
CONCLUSION
Although a number of Bahr el Ghazal tributaries converge towards the confluence with the Bahr el Jebel at Lake No, the contribution to the combined flow is very small. The upper basins have relatively high rainfall, but the river flows spill into flood plains and are lost by evaporation. A water balance study based on measured flows, supported by satellite imagery, shows that areas of flooding have decreased in recent years in contrast to the Bahr el Jebel.
-Bahr el Jebel
• Bahr el Ghazal