the astonishing world of mgm resorts...
TRANSCRIPT

The Astonishing World of MGM Resorts International.2011 AnnuAl RepoR t
3
4/20/12 5:50 PM

30210cvr.indd 4-6

30210narr.indd 1 4/20/12 6:38 PM

2
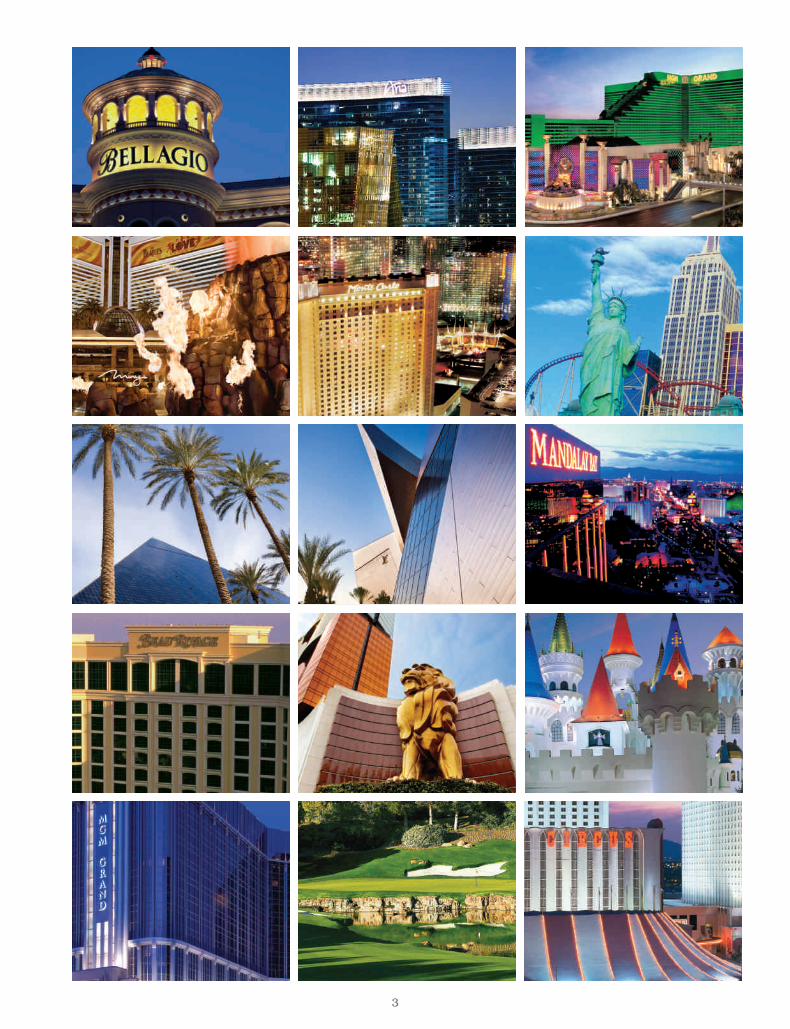
The MGM Resorts International portfolio reflects the world’s most
diverse and comprehensive collection of resorts and amenities;
developments that have become iconic landmarks in Las Vegas,
Detroit, along the Gulf Coast of Mississippi and in Macau.
We have already accomplished more than most imagined. We persevered
through a devastating macro economic downturn. As a result, we have
emerged as better operators, with stronger ties to our employees and
customers. We now look forward to the future of our business as we see
potential benefits from our improved customer rewards relationships
and global expansion opportunities.
As industry leaders, we are committed to delivering unparalleled
guest experiences and exceptional customer service in a strikingly
distinctive combination.
MGM Resorts International delivers on its promises—to its business
partners, employees and communities. We create an astonishing world.
To Our Shareholders We are inspiring a renewed sense of passion in our business.
30210narr.indd 2 4/18/12 9:34 PM
33
30210narr.indd 3 4/18/12 9:35 PM

A FINEperformance.A FINEperformance.
4
We continued to make strategic steps to improve our business—setting us up for success as the recovery in Las Vegas takes hold:
• We refinanced CityCenter—in January 2011 we refinanced $2 billion in debt at CityCenter.
• We launched M life—leveraging our unparalleled assets through a game-changing customer loyalty program designed to promote the breadth of our Company’s offerings.
• We listed MGM China on the Hong Kong Stock Exchange—the successful initial public offering priced at the high end of the proposed range. We purchased an additional 1% of MGM China’s capital stock and became the controlling shareholder.
• We prepared our business for the prospect of online gaming—partnering with bwin.party to jointly offer online poker in the U.S. if legalized.
2011 was a critical year for our Company.
30210narr.indd 4 4/18/12 9:35 PM
5
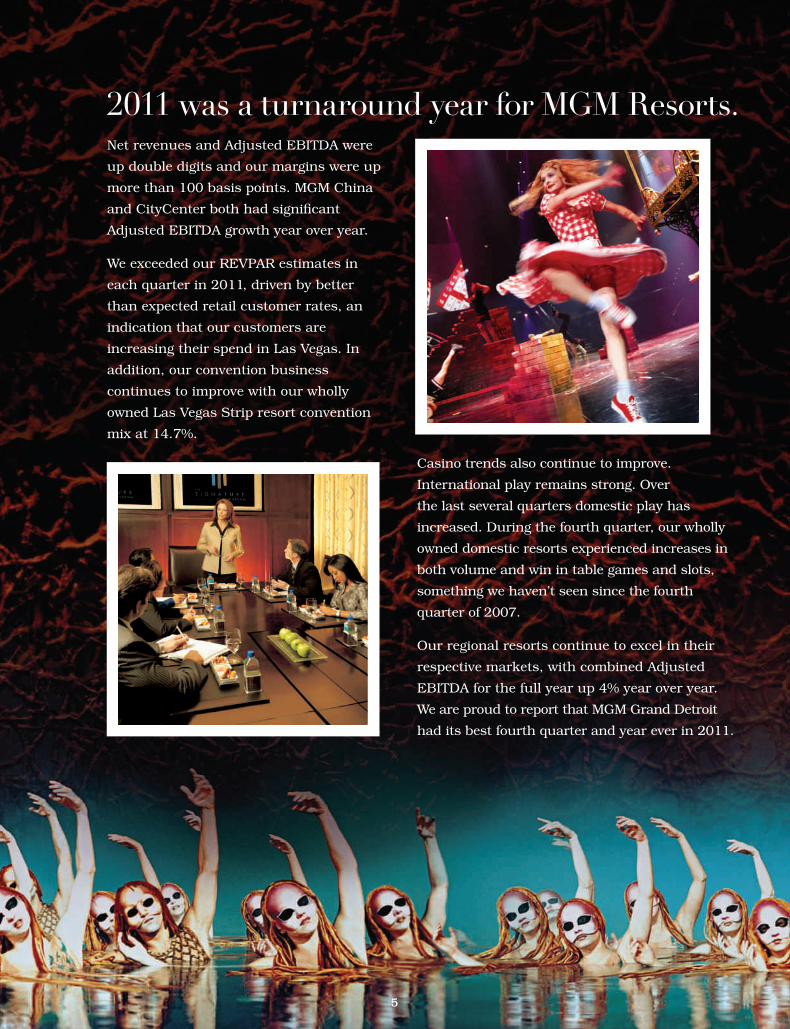
Casino trends also continue to improve.
International play remains strong. Over
the last several quarters domestic play has
increased. During the fourth quarter, our wholly
owned domestic resorts experienced increases in
both volume and win in table games and slots,
something we haven’t seen since the fourth
quarter of 2007.
Our regional resorts continue to excel in their
respective markets, with combined Adjusted
EBITDA for the full year up 4% year over year.
We are proud to report that MGM Grand Detroit
had its best fourth quarter and year ever in 2011.
2011 was a turnaround year for MGM Resorts.Net revenues and Adjusted EBITDA were
up double digits and our margins were up
more than 100 basis points. MGM China
and CityCenter both had significant
Adjusted EBITDA growth year over year.
We exceeded our REVPAR estimates in
each quarter in 2011, driven by better
than expected retail customer rates, an
indication that our customers are
increasing their spend in Las Vegas. In
addition, our convention business
continues to improve with our wholly
owned Las Vegas Strip resort convention
mix at 14.7%.
30210narr.indd 5 4/18/12 9:35 PM

An internationalSUCCESS. An internationalSUCCESS.
6
MGM China is fulfilling international goals.The initial public offering of MGM China occurred
in June 2011 and priced at the high end of the
range. As part of the transaction, we purchased
an additional 1% of the overall capital stock and
became the controlling shareholder. As a result of
the transaction, we began consolidating the results
of MGM China.
In early 2012, the MGM China Board of Directors
approved a special dividend in the amount of
approximately $400 million to its shareholders
of record on March 9, 2012. We are pleased
that MGM China’s continually improving cash
flows have afforded it the ability to return cash
to its shareholders. MGM China is evaluating
opportunities for the use of cash as they manage growth and expansion prospects with the
continued desire to return cash to shareholders.
MGM China’s focus on customer relationship building across its business lines has improved
revenue and is the core strategy driving future revenue growth. MGM China continues to make
operational improvements and believes it still has additional room for further earnings growth.
MGM China expects to spend approximately $80 million on capital projects at MGM Macau in
2012, including the build-out of currently undeveloped space and refurbishment capital projects.
In Cotai, we are well positioned and have plans for a truly unique experience. Our plans call for
a resort containing approximately 1,600 rooms, 500 casino table games, 2,500 slot machines
and various restaurant, retail and entertainment offerings.
30210narr.indd 6 4/18/12 9:35 PM

THE CENTERof it all.THE CENTERof it all.THE CENTERof it all.
7
CityCenter’s second year of operations showed continued improvement.
ARIA’s improvement is attributable to significant growth in volume and revenue
across all key operating divisions. Casino revenues increased 27% year over year
and hotel revenue increased 24%. Because of its leadership in sustainability
initiatives, ARIA continues to develop as one of the top convention destinations in
the country; for 2012 ARIA has more than 100% of its planned convention room
nights booked.
ARIA has announced plans to replace its existing Cirque du Soleil show with Zarkana
which we expect to significantly boost business volumes throughout the entire
resort. We are also in the process of updating some of our dining options. This year
we will open Javier’s, a high-energy casual Mexican restaurant which is extremely
popular in the Southern California market. We are also evaluating our other dining
options for opportunities to introduce additional recognizable brands to ARIA.
All components of CityCenter continue to progress. Vdara was able to grow rate and
occupancy in 2011 while also adding an additional 131,000 available room nights
into inventory. Vdara had its best quarter yet in the fourth quarter and continues to
gain momentum as the premier non-gaming, non-smoking resort in Las Vegas.
Crystals at CityCenter, our unparalleled collection of shopping, dining and nightlife,
continues to increase its occupancy and same store sales. In addition, CityCenter’s
strategy of leasing unsold condominium units continues to be successful.
30210narr.indd 7 4/18/12 9:35 PM

The year the GAME CHANGED.
2011 marked the culmination of something unmatched in
the resort industry: M life, the loyalty program that rewards
members for virtually every dollar they spend across 15 of
our iconic resorts.
M life leverages the full power of our renowned destinations and
their complete range of unparalleled dining, entertainment,
hotel and spa offerings. Members can earn and redeem rewards
at our resorts in Mississippi, Detroit and throughout Las Vegas.
The program’s tier structure (Sapphire, Pearl, Gold, Platinum
and NOIR) enables all members to enjoy rewards unique to their
relationship with the company. Beyond special hotel offers,
pre-sale access to show tickets, room upgrades and more,
membership comes along with the opportunity to enjoy M life
Moments—one-of-a-kind experiences like a private dinner
courtesy of a celebrity chef, choosing the songs for the Bellagio
Fountain Show and more.
Access is the lynchpin of the program—not only in giving
everyday travelers the potential to experience high-roller
treatment, but also in making it simple and convenient for
members to enjoy our breadth of offerings. This takes shape in
the all-new mlife.com, an industry leading, revolutionary online
8
30210narr.indd 8 4/18/12 9:35 PM

9
tool that gives members the power to book and share an entire itinerary across multiple resorts —
including dinners, shows, spa treatments and accommodations—from a single website.
M life is a world all its own—one that is continually expanding. We’ve established strategic partnerships
with sbe (a leading hospitality and lifestyle company), Ameristar Casinos, Avis Budget Group and Dover
Downs Gaming & Entertainment so that our members can enjoy expansive benefits throughout the
country—more possibilities, in more places than ever. Key milestones in the evolution of M life include:
• July 2010: M life launches at Beau Rivage
• August 2010: The program launches at MGM Grand Detroit and Gold Strike Tunica
• January 2011: M life launches at our Las Vegas destinations
• June 2011: M life Insider is introduced to MGM Resorts International employees allowing them to easily book rooms for friends and family and access all our company programs
• September 2011: M life is enhanced to include non-gaming spend at Beau Rivage
• November 2011: Non-gaming spend becomes a part of M life at all participating resorts
• February 2012: The launch of the all-new mlife.com
30210narr.indd 9 4/18/12 9:35 PM

A POSITIVE outlook.
10
30210narr.indd 10 4/18/12 9:35 PM

11
We have made further balance sheet
improvements in 2012 by improving our capital
structure at MGM Resorts and CityCenter and
returning value to shareholders at MGM China
through a cash dividend.
We extended $1.8 billion of our senior credit
facility—improving our interest rate and
extending the maturity to February 2015.
We also issued $1.85 billion of senior notes—
enhancing our maturity profile at attractive rates.
We launched the expanded M life rewards
program to include non-gaming spend and the
all-new mlife.com.
We have developed strategic relationships
—expanding our customer reach into regional
destinations via a marketing relationship with
Ameristar Casinos, Inc.
We are actively pursuing development in
key regions—focusing on opportunities
domestically such as Massachusetts and
internationally in markets such as Japan,
Taiwan and South Korea.
We opened our first MGM Hospitality property in
Sanya, People’s Republic of China—growing our
brand recognition and database globally with
further openings to come.
Our resorts are more exciting than
ever before:
•Bellagio—completed a room remodel of its main tower in 2011 and will begin remodeling the Spa tower in late 2012.
•MGM Grand Las Vegas—commenced a room remodel in 2011 which will be completed by the end of 2012.
•1Oak nightclub—opened New Year’s Eve at The Mirage.
•Hyde lounge—opened New Year’s Eve at Bellagio.
•Lily lounge—opened early 2012 at Bellagio.
Future openings include:
•Hakkasan restaurant and nightclub— MGM Grand Las Vegas
•MichaelJacksonCirqueduSoleil—Mandalay Bay
•BlueManGroup—MonteCarlo
We have accomplished many strategic objectives thus far in 2012.
30210narr.indd 11 4/20/12 7:12 PM
12
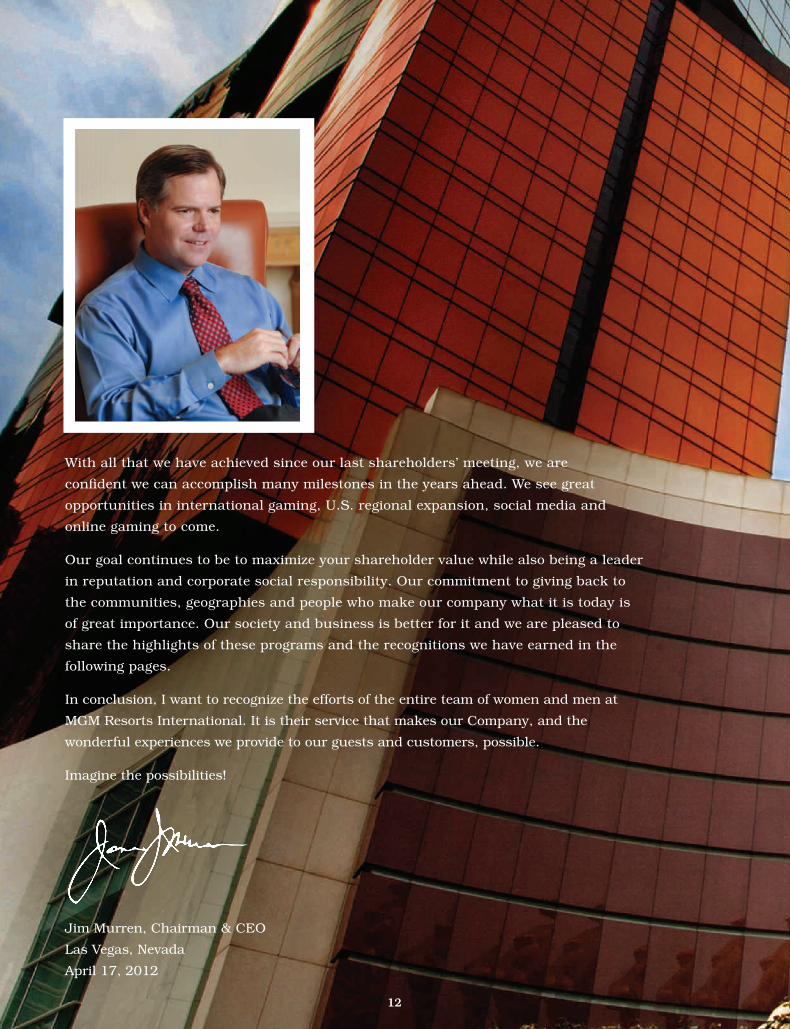
With all that we have achieved since our last shareholders’ meeting, we are
confident we can accomplish many milestones in the years ahead. We see great
opportunities in international gaming, U.S. regional expansion, social media and
online gaming to come.
Our goal continues to be to maximize your shareholder value while also being a leader
in reputation and corporate social responsibility. Our commitment to giving back to
the communities, geographies and people who make our company what it is today is
of great importance. Our society and business is better for it and we are pleased to
share the highlights of these programs and the recognitions we have earned in the
following pages.
In conclusion, I want to recognize the efforts of the entire team of women and men at
MGM Resorts International. It is their service that makes our Company, and the
wonderful experiences we provide to our guests and customers, possible.
Imagine the possibilities!
Jim Murren, Chairman & CEO
Las Vegas, Nevada
April 17, 2012
30210narr.indd 12 4/18/12 9:35 PM

13
LOOKING FORWARD. Imagine the possibilities.
30210narr.indd 13 4/18/12 9:35 PM

INSPIRING a better world.INSPIRING a better world.
14
Social responsibility is integral to our core creed and philosophy, a reflection of our
fundamental integrity in our business conduct and our relationships with our employees,
our guests, our communities and our planet Earth. We are inspired by our recognition
that we have a vast ability to maximize shareholder value while making a positive impact
on our world. In 2011, we consolidated our pioneering diversity and inclusion, community
engagement and environmental sustainability initiatives into a comprehensive platform
to promote greater synergies among these pillars. We rededicated our board oversight and
executive leadership of our responsibility programs, spearheaded by Chairman and CEO
Jim Murren, to drive greater coordination with our strategic business objectives, and to
embed these values more deeply throughout our company culture. We aspire to be the most
respected global leader in entertainment and hospitality, for both our high performance
and our responsible citizenship.
30210narr.indd 14 4/18/12 9:35 PM

15
We respect and value our diverse and immensely talented team
members as the foundation of our success as a global company.
Diversity and inclusion, in alignment with our business goals
and operations, are essential to our Company’s competitive
advantage. Our designation as an employer of choice, our
delivery of superlative customer service as the destination of
choice, customer expansion, employee engagement, team
collaboration, enhanced innovation, sustained competitiveness—
all are rooted in our ability to leverage an inclusive work
environment where our team members are inspired to perform
at their highest potential, and feel empowered to express different
perspectives and opinions in pursuit of cutting-edge excellence.
We embrace the continuous commitment, education,
communication and evolution required to make diversity and
inclusion our way of doing business and our way of life—for
top-tier performance, now and into our future.
For more information on our Diversity and Inclusion initiatives,
please visit: mgmresortsdiversity.com.
DIVERSITY &InClUSIOn
30210narr.indd 15 4/18/12 9:35 PM

16
COMMUnITY EnGAGEMEnTOur interests as a company are inextricably linked with the well-being of our host
communities. Through our extensive philanthropy, volunteerism and community service,
we foster healthy, dynamic and sustainable communities where our employees live and
work and our guests visit.
Our company-directed charitable giving continues to mitigate the impacts of the Great
Recession on the fragile social infrastructure of our communities with support in the vital focus
areas of public education, health and wellness, basic human needs such as hunger relief and
affordable housing, environmental sustainability, and the cultural arts. Our employee-driven
MGM Resorts Foundation, which channels our employee contributions through individual
designations and pooled grants, makes donations to an even wider array of qualified non-profit
agencies selected by individual employees or our employee grant councils. Since our foundation’s
creation in 2002, our employees have donated more than $44 million to non-profit agencies and
initiatives that elevate the quality of life in our communities.
Through our MGM Resorts Employee Volunteer Program our team members share their
passions, talents and spirit through countless community service activities—ranging from
service on non-profit boards, to outfitting students with school supplies, to neighborhood
cleanup, to meal preparation at food banks, to student tutoring, to mentoring at-risk youth,
to spending time with the elderly at senior centers, just to name a few. We are inspired to be
the change we wish to see in our world.
For more information on our Community Engagement initiatives, please visit:
mgmresortsfoundation.com.
30210narr.indd 16 4/18/12 9:35 PM

17
MGM Resorts International is committed to being a global leader in
sustainability and stewardship of the environment, bringing value to
communities and shareholders alike. Our company operates more
intelligently and efficiently by extending sustainable business
practices to the operations of existing resorts as well as new projects.
We focus on reducing the environmental impact of our resorts by
strategically implementing sustainable operating practices, including
innovative conservation and waste management programs.
In 2011, MGM Resorts International was the highest rated green
resort and casino company on Newsweek magazine’s listing of green
companies. We are also proud to be among a select group of
international hotel companies working on behalf of the hospitality industry to standardize the measurement
and communication of a carbon footprint for customers. The Hotel Carbon Measurement Initiative includes
members of the International Tourism Partnership (ITP) and the World Travel & Tourism Council (WTTC).
Our Environmental Responsibility Report may be viewed at: mgmresorts.com/environment.
• The MGM Resorts Green Advantage is our comprehensive strategic approach to sustainability, focusing on the core areas of energy and water use, green building, waste and recycling, supply chain, and outreach and education.
• Through 2011, MGM Resorts International:
* Reduced electric power consumption by 300 million kWh (enough to power 25,000 homes for a year);
* Reduced natural gas consumption by over 500 thousand MMBtu;
* Reduced water consumption by 1.7 B gallons (the equivalent of 2,570 Olympic-sized swimming pools);
* Distributed 150,000 energy efficient light bulbs to company employees.
• Since 2007, MGM Resorts has increased its recycling rate more than four-fold, with six resorts achieving rates over 40%.
• CityCenter earned six LEED Gold certifications making it the single largest environmental accomplishment in multi-use new construction in the world.
• In 2009, MGM Resorts introduced the world’s first fleet of CNG-powered limousines at CityCenter, and in 2011 expanded with additional vehicles for its Bellagio and Mirage resorts.
• “Green Fairs” have educated more than 50,000 company employees on how to be environmentally responsible at home and at work.
SUSTAInABIlITY
30210narr.indd 17 4/18/12 9:35 PM

18
Diversity & Inclusion25 Noteworthy Companies for Diversity
DiversityInc Magazine
40 Best Companies for Diversity Black Enterprise Magazine
Corporate Equality Index Human Rights Campaign
#15 of Top 50 Employers Equal Opportunity Magazine
The Diversity Elite Hispanic Business Magazine
Best Companies for Latina Employees Latina Style Magazine
MGM Grand Las Vegas – Top 25 U.S. Diversity Councils
The Association of Diversity Councils
Community EngagementOne of top three corporate finalists for the State of Nevada
Governor’s Points of Light Volunteer Award
Sustainability12 Green Key certifications
2011 American Forestry and Paper Association Business Leadership in Recycling Award
2011 EPA Waste Wise Gold Achievement
2011 AWARDS & RECOGnITIOnS
30210narr.indd 18 4/18/12 9:35 PM
10JAN201211265675
2011 Annual Report — Financial Section
CONTENTS
Selected Financial Data . . . . . . . . . . . . . . . . . . . . . . . . . . . . . . . . . . . . . . . . . . . . . . . . . . . . . . . . . . . . . . . . . . . . . . . . . . . . . . . . . . . . . . . . . . . . . . 2
Management’s Discussion and Analysis of Financial Condition and Results of Operations . . . . . . . . . . . . 4
Management’s Annual Report on Internal Control Over Financial Reporting . . . . . . . . . . . . . . . . . . . . . . . . . . . . 33
Reports of Independent Registered Public Accounting Firm .. . . . . . . . . . . . . . . . . . . . . . . . . . . . . . . . . . . . . . . . . . . . . . . . 34
Consolidated Balance Sheets . . . . . . . . . . . . . . . . . . . . . . . . . . . . . . . . . . . . . . . . . . . . . . . . . . . . . . . . . . . . . . . . . . . . . . . . . . . . . . . . . . . . . . . . 36
Consolidated Statements of Operations. . . . . . . . . . . . . . . . . . . . . . . . . . . . . . . . . . . . . . . . . . . . . . . . . . . . . . . . . . . . . . . . . . . . . . . . . . . 37
Consolidated Statements of Cash Flows . . . . . . . . . . . . . . . . . . . . . . . . . . . . . . . . . . . . . . . . . . . . . . . . . . . . . . . . . . . . . . . . . . . . . . . . . . 38
Consolidated Statements of Stockholders’ Equity . . . . . . . . . . . . . . . . . . . . . . . . . . . . . . . . . . . . . . . . . . . . . . . . . . . . . . . . . . . . . . . 39
Notes to Consolidated Financial Statements . . . . . . . . . . . . . . . . . . . . . . . . . . . . . . . . . . . . . . . . . . . . . . . . . . . . . . . . . . . . . . . . . . . . . 40

SELECTED FINANCIAL DATA
The following reflects selected historical financial data that should be read in conjunction with‘‘Management’s Discussion and Analysis of Financial Condition and Results of Operations’’ and theconsolidated financial statements and notes thereto included elsewhere in this Annual Report. Thehistorical results are not necessarily indicative of the results of operations to be expected in the future.
For the Years Ended December 31,2011 2010 2009 2008 2007
(In thousands, except per share data)Net revenues . . . . . . . . . . . . . . . . . . . . . . . . . . . . . . . . . . . . . . $ 7,849,312 $ 6,056,001 $ 6,010,588 $ 7,231,273 $ 7,714,650Operating income (loss) . . . . . . . . . . . . . . . . . . . . . . . . . 4,057,146 (1,158,931) (963,876) (195,986) 2,863,930Income (loss) from continuing operations. . . . 3,234,944 (1,437,397) (1,291,682) (921,669) 1,400,545Net income (loss) . . . . . . . . . . . . . . . . . . . . . . . . . . . . . . . . 3,234,944 (1,437,397) (1,291,682) (921,669) 1,584,419Net income (loss) attributable to MGM
Resorts International. . . . . . . . . . . . . . . . . . . . . . . . . . 3,114,637 (1,437,397) (1,291,682) (921,669) 1,584,419
Earnings per share of common stockattributable to MGM Resorts:
BasicIncome from continuing operations. . . . . . $ 6.37 $ (3.19) $ (3.41) $ (3.29) $ 4.88Net income (loss) per share. . . . . . . . . . . . . . . $ 6.37 $ (3.19) $ (3.41) $ (3.29) $ 5.52Weighted average number of shares . . . . . 488,652 450,449 378,513 279,815 286,809
DilutedIncome from continuing operations. . . . . . $ 5.62 $ (3.19) $ (3.41) $ (3.29) $ 4.70Net income (loss) per share. . . . . . . . . . . . . . . $ 5.62 $ (3.19) $ (3.41) $ (3.29) $ 5.31Weighted average number of shares . . . . . 560,895 450,449 378,513 279,815 298,284
At year-end:Total assets . . . . . . . . . . . . . . . . . . . . . . . . . . . . . . . . . . . . . $ 27,766,276 $ 18,951,848 $ 22,509,013 $ 23,265,519 $ 22,784,872Total debt, including capital leases. . . . . . . . . . 13,472,263 12,050,437 14,060,270 13,470,618 11,182,003Stockholders’ equity . . . . . . . . . . . . . . . . . . . . . . . . . . . 9,882,222 2,932,162 3,804,049 3,907,978 6,060,703MGM Resorts stockholders’ equity . . . . . . . . . 6,086,578 2,932,162 3,804,049 3,907,978 6,060,703MGM Resorts Stockholders’ equity per
share . . . . . . . . . . . . . . . . . . . . . . . . . . . . . . . . . . . . . . . . . . $ 12.45 $ 6.00 $ 8.62 $ 14.13 $ 20.63Number of shares outstanding. . . . . . . . . . . . . . . 488,835 488,513 441,222 276,507 293,769
The selected financial data above includes restatements to certain balance sheet and incomestatement accounts for errors related to deferred tax liabilities in our financial statements for years prior to2009. See Note 2 in the accompanying financial statements for additional information related to theserestatements. In addition, pursuant to the guidance in the recently issued AICPA Audit and AccountingGuide, ‘‘Gaming,’’ we have also reclassified certain amounts paid under slot participation agreements froma reduction in casino revenue to casino expense.
The following events/transactions affect the year-to-year comparability of the selected financial datapresented above:
Acquisitions and Dispositions• In 2007, we sold the Primm Valley Resorts.• In 2007, we sold the Colorado Belle and Edgewater resorts in Laughlin, Nevada (the ‘‘Laughlin
Properties’’).• In 2007, we recognized a $1.03 billion pre-tax gain on the contribution of CityCenter to a joint venture.• In 2009, we sold the Treasure Island casino resort (‘‘TI’’) in Las Vegas, Nevada and recorded a gain on
the sale of $187 million.
2

• In 2011, we acquired an additional 1% of the overall capital stock in MGM China (and obtained acontrolling interest) and thereby became the indirect owner of 51% of MGM China. We recorded a gainof $3.5 billion on the transaction.
The results of the Primm Valley Resorts and the Laughlin Properties are classified as discontinuedoperations for all applicable periods presented, including the gain on sales of such assets. The results of TIare not recorded as discontinued operations, as we believe significant customer migration occurredbetween TI and our other Las Vegas Strip resorts. As a result of our acquisition of the additional 1% shareof MGM China, we began consolidating the results of MGM China on June 3, 2011 and ceased recordingthe results of MGM Macau as an equity method investment.
Other• During 2007, we recognized $93 million related to our share of profits from the sale of condominium
units at The Signature at MGM Grand.• During 2007, we recognized $284 million of pre-tax income for insurance recoveries related to Hurricane
Katrina.• In 2008, we recorded a $1.2 billion non-cash impairment charge related to goodwill and indefinite-lived
intangible assets recognized in the Mandalay acquisition.• In 2009, we recorded non-cash impairment charges of $176 million related to our M Resort note,
$956 million related to our investment in CityCenter, $203 million related to our share of the CityCenterresidential impairment, and $548 million related to our land holdings on Renaissance Pointe in AtlanticCity and capitalized development costs related to our MGM Grand Atlantic City Project.
• In 2010, we recorded non-cash impairment charges of $1.3 billion related to our investment inCityCenter, $166 million related to our share of the CityCenter residential real estate impairment, and$128 million related to our Borgata investment.
• In 2010, we recorded a $142 million net gain on extinguishment of debt in connection with our 2010senior credit facility amendment and restatement.
• In 2011, we recorded non-cash impairment charges of $26 million related to our share of the CityCenterresidential real estate impairment, $80 million related to Circus Circus Reno, $23 million related to ourinvestment in Silver Legacy and $62 million related to our investment in Borgata.
3

MANAGEMENT’S DISCUSSION AND ANALYSIS OF FINANCIAL CONDITIONAND RESULTS OF OPERATIONS
Executive Overview
Current Operations
Our primary business is the ownership and operation of casino resorts, which includes offeringgaming, hotel, convention, dining, entertainment, retail and other resort amenities. We believe that we ownand invest in several of the premier casino resorts in the world and have continually reinvested in ourresorts to maintain our competitive advantage. Most of our revenue is cash-based, through customerswagering with cash or paying for non-gaming services with cash or credit cards. We rely heavily on theability of our resorts to generate operating cash flow to repay debt financing, fund maintenance capitalexpenditures and provide cash for future development. Our results of operations are affected by decisionswe make related to our capital allocation, our access to capital, and our cost of capital – all of which wereaffected by the recent economic recession and credit crisis leading to constraints on investments and highercosts of capital. However, our access to lower cost capital has improved, and over the next few years weremain committed to further deleveraging our balance sheet and improving our credit profile.
Our results of operations do not tend to be seasonal in nature, though a variety of factors may affectthe results of any interim period, including the timing of major Las Vegas conventions, the amount andtiming of marketing and special events for our high-end customers, and the level of play during majorholidays, including New Year and Chinese New Year. Our results do not depend on key individualcustomers, although our success in marketing to customer groups, such as convention customers, or thefinancial health of customer segments, such as business travelers or high-end gaming customers from aparticular country or region, can affect our results. Certain of our resorts earn significant revenues fromthe high-end gaming business, which lead to variability in our results.
We have two reportable segments that are based on the regions in which we operate: wholly owneddomestic resorts and MGM China. We currently operate 15 wholly owned resorts in the United States.MGM China’s operations consist of the MGM Macau resort and casino. We have additional businessactivities including our investments in unconsolidated affiliates, our MGM Hospitality operations, andcertain other corporate and management operations. CityCenter is our most significant unconsolidatedaffiliate, which we also manage for a fee. Our operations which have not been segregated into separatereportable segments are reported as ‘‘corporate and other’’ operations in our reconciliations of segmentresults to consolidated results.
Wholly Owned Domestic Resorts. At December 31, 2011, our wholly owned domestic resorts consistedof the following casino resorts:
Las Vegas, Nevada: Bellagio, MGM Grand Las Vegas (including The Signature), Mandalay Bay,The Mirage, Luxor, New York-New York, Excalibur, Monte Carlo andCircus Circus Las Vegas.
Other: MGM Grand Detroit in Detroit, Michigan; Beau Rivage in Biloxi,Mississippi; Gold Strike Tunica in Tunica, Mississippi; Circus Circus Reno inReno, Nevada; Gold Strike in Jean, Nevada; and Railroad Pass inHenderson, Nevada.
We also own the Shadow Creek golf course in North Las Vegas, Fallen Oak golf course in Saucier,Mississippi, and the Primm Valley Golf Club (currently operated by a third party) at the California stateline.
4

Over half of the net revenue from our wholly owned domestic resorts is derived from non-gamingactivities, including hotel, food and beverage, entertainment and other non-gaming amenities. Oursignificant convention and meeting facilities allow us to maximize hotel occupancy and customer volumesduring off-peak times such as mid-week or during traditionally slower leisure travel periods, which alsoleads to better labor utilization. Our operating results are highly dependent on the volume of customers atour resorts, which in turn affects the price we can charge for our hotel rooms and other amenities. Wemarket to different customer segments to manage our hotel occupancy, such as targeting large conventionsto increase mid-week occupancy.
We generate a significant portion of our revenue from our wholly owned domestic resorts in LasVegas, Nevada, which exposes us to certain risks, such as increased competition from new or expanded LasVegas resorts, and from the expansion of gaming in California.
We have experienced a recovery in our wholly owned domestic operations during 2011. While adverseconditions in the economic environment have affected our operating results in recent years, we believepositive trends, such as increased visitation and consumer spending, will continue in 2012. However, wecontinue to believe that certain aspects of the current economy, such as weaknesses in employment and thehousing market, will limit economic growth in the U.S. and temper our recovery. Because of theseeconomic conditions, we have increasingly focused on managing costs and staffing levels across all ourresorts and will continue to strive to achieve additional operating efficiencies. However, as a result of ourleveraged business model, our operating results are significantly affected by our ability to generateoperating revenues.
Key performance indicators related to gaming and hotel revenue at our wholly owned domesticresorts are:
• Gaming revenue indicators: table games drop and slots handle (volume indicators); ‘‘win’’ or ‘‘hold’’percentage, which is not fully controllable by us. Our normal table games hold percentage is in therange of 19% to 23% of table games drop and our normal slots hold percentage is in the range of7.5% to 8.5% of slots handle;
• Hotel revenue indicators: hotel occupancy (a volume indicator); average daily rate (‘‘ADR,’’ a priceindicator); and revenue per available room (‘‘REVPAR,’’ a summary measure of hotel results,combining ADR and occupancy rate).
MGM China. On June 3, 2011, we and Ms. Ho, Pansy Catilina Chiu King (‘‘Ms. Pansy Ho’’) completed areorganization of the capital structure and the initial public offering of 760 million shares of MGM ChinaLimited (‘‘MGM China’’) on The Stock Exchange of Hong Kong Limited (the ‘‘IPO’’), representing 20%of the post issuance base capital stock of MGM China, at an offer price of HKD 15.34 per share. Pursuantto this reorganization, we acquired, through a wholly owned subsidiary, an additional 1% of the overallcapital stock of MGM China for HKD 15.34 per share, or approximately $75 million, and thereby becamethe owner of 51% of MGM China, which owns MGM Grand Paradise, S.A. (‘‘MGM Grand Paradise’’), theMacau company that owns the MGM Macau resort and casino and the related gaming subconcession andland concession.
Through the acquisition of the additional 1% interest of MGM China, we obtained a controllinginterest and were required to consolidate MGM China as of June 3, 2011. Prior to the IPO, we held a 50%interest in MGM Grand Paradise, which was accounted for under the equity method. The acquisition ofthe controlling financial interest was accounted for as a business combination and we recognized 100% ofthe assets, liabilities, and noncontrolling interests of MGM China at fair value at the date of acquisition.The fair value of the equity of MGM China was determined by the IPO transaction price and equaledapproximately $7.5 billion. The carrying value of our equity method investment was significantly less thanour share of the fair value of MGM China, resulting in a $3.5 billion gain on the acquisition.
5

We believe our investment in MGM China plays an important role in extending our reachinternationally and will foster future growth and profitability. Asia is the fastest-growing gaming market inthe world and Macau is the world’s largest gaming destination in terms of revenue, and has continued togrow over the past few years despite the global economic downturn.
Our MGM China operations relate to MGM Macau resort and casino. Revenues at MGM Macau aregenerated primarily from gaming operations made up of two distinct market segments: main floor andhigh-end (‘‘VIP’’). MGM Macau main floor operations consist of both table games and slot machinesoffered to the public, which usually consists of walk-in and day trip visitors. VIP players play mostly indedicated VIP rooms or designated gaming areas. VIP customers can be further divided into customerssourced by in-house VIP programs and those sourced through gaming promoters. A significant portion ofour VIP volume is generated through the use of gaming promoters, also known as junket operators. Theseoperators introduce high-end gaming players to MGM Macau, assist these customers with travelarrangements, and extend gaming credit to these players.
VIP gaming at MGM Macau is conducted by the use of special purpose nonnegotiable gaming chipscalled ‘‘rolling chips.’’ Gaming promoters purchase these rolling chips from MGM Macau and in turn theysell these chips to their players. The rolling chips allow MGM Macau to track the amount of wageringconducted by each gaming promoters’ clients in order to determine VIP gaming play. In exchange for thegaming promoters’ services, MGM Macau pays them either through rolling chip turnover-basedcommissions or through revenue-sharing arrangements. The estimated portion of the gaming promoterpayments that represent amounts passed through to VIP customers is recorded net against casino revenue,and the estimated portion retained by the gaming promoter for its compensation is recorded to casinoexpense.
In addition to the key performance indicators used by our wholly owned domestic resorts, MGMMacau utilizes ‘‘turnover’’ which is the sum of rolling chip wagers won by MGM Macau (rolling chipspurchased plus rolling chips exchanged less rolling chips returned). Turnover provides a basis formeasuring VIP casino win percentage. Normal win for VIP gaming operations at MGM Macau is in therange of 2.7% to 3.0% of turnover. MGM Macau’s main floor historical table games hold percentage is inthe range of 20% to 26% of table games drop. Normal slots hold percentage at MGM Macau is in therange of 5.5% to 7.5% of slots handle.
Corporate and other. Corporate and other includes our investments in unconsolidated affiliates, MGMHospitality and certain management and other operations.
CityCenter. We own 50% of CityCenter. The other 50% of CityCenter is owned by Infinity WorldDevelopment Corp (‘‘Infinity World’’), a wholly-owned subsidiary of Dubai World, a Dubai, United ArabEmirates government decree entity. CityCenter consists of Aria, a 4,004-room casino resort; MandarinOriental Las Vegas, a 392-room non-gaming boutique hotel; Crystals, a retail district with approximately329,000 leasable square feet; and Vdara, a 1,495-room luxury condominium-hotel. In addition, CityCenterfeatures residential units in the Residences at Mandarin Oriental – 225 units and Veer – 669 units. Aria,Vdara, Mandarin Oriental and Crystals all opened in December 2009 and the sales of residential unitswithin CityCenter began closing in early 2010. We receive a management fee of 2% of revenues for themanagement of Aria and Vdara, and 5% of EBITDA (as defined in the agreements governing ourmanagement of Aria and Vdara). In addition, we receive an annual fee of $3 million for the managementof Crystals.
Other unconsolidated affiliates. We also own 50% interests in Grand Victoria and Silver Legacy. GrandVictoria is a riverboat casino in Elgin, Illinois; an affiliate of Hyatt Gaming owns the other 50% of GrandVictoria and also operates the resort. Silver Legacy is located in Reno, adjacent to Circus Circus Reno, andthe other 50% is owned by Eldorado LLC. See ‘‘Operating Results – Details of Certain Charges.’’
6
MGM Hospitality. MGM Hospitality seeks to leverage our management expertise and well-recognizedbrands through strategic partnerships and international expansion opportunities. We have entered intomanagement agreements for hotels in the Middle East, North Africa, India and, through its joint venturewith Diaoyutai State Guesthouse, The People’s Republic of China. MGM Hospitality opened its firstresort, MGM Grand Sanya on Hainan Island, People’s Republic of China in early 2012.
Borgata. We have a 50% economic interest in Borgata Hotel Casino & Spa (‘‘Borgata’’) located onRenaissance Pointe in the Marina area of Atlantic City, New Jersey. Boyd Gaming Corporation (‘‘Boyd’’)owns the other 50% of Borgata and also operates the resort. Our interest is held in trust and currentlyoffered for sale pursuant to our settlement agreement with New Jersey Department of GamingEnforcement (‘‘DGE’’). In March 2010, the New Jersey Casino Control Commission (‘‘CCC’’) approvedthe settlement agreement with the DGE pursuant to which we placed our 50% ownership interest inBorgata and related leased land in Atlantic City into a divestiture trust. The settlement agreement wasamended on July 22, 2011 with the approval of the CCC on August 8, 2011. Following the transfer of theseinterests into trust, we ceased to be regulated by the CCC or the DGE, except as otherwise provided by thetrust agreement and the settlement agreement.
The terms of the settlement agreement, as amended, mandate the sale of the trust property by March2014, which represents an 18-month extension compared to the original agreement. During the periodending in March 2013, which also represents an 18-month extension compared to the original agreement,we have the right to direct the trustee to sell the trust property, subject to approval of the CCC. If a sale isnot concluded by that time, the trustee is responsible for selling the trust property during the following12-month period. Prior to the consummation of the sale, the divestiture trust will retain any cash flowsreceived in respect of the trust property, but will pay property taxes and other costs attributable to the trustproperty. We are the sole economic beneficiary of the trust and will be permitted to reapply for a NewJersey gaming license beginning 30 months after the completion of the sale of the trust assets. As ofDecember 31, 2011 and 2010, the trust had $188 million of cash and investments, of which $150 million isheld in U.S. treasury securities with maturities greater than three months but less than one year, and isrecorded within ‘‘Prepaid expenses and other.’’
As a result of our ownership interest in Borgata being placed into a trust, we no longer havesignificant influence over Borgata; therefore, we discontinued the equity method of accounting for Borgataat the point the assets were placed in the trust in March 2010, and account for our investment in Borgataunder the cost method of accounting. The carrying value of the investment related to Borgata is includedin ‘‘Other long-term assets, net.’’ Earnings and losses that relate to the investment that were previouslyaccrued remain as a part of the carrying amount of the investment. Distributions received by the trust thatdo not exceed our share of earnings are recognized currently in earnings. However, distributions receivedby the trust that exceed our share of earnings for such periods are applied to reduce the carrying amount ofits investment. We consolidate the trust as we are the sole economic beneficiary. The trust did not receivedistributions from Borgata during the year ended December 31, 2011. The trust received net distributionsfrom the joint venture of $113 million for the year ended December 31, 2010. We recorded $94 million as areduction of the carrying value and $19 million was recorded as ‘‘Other, net’’ non-operating income for theyear ended December 31, 2010.
In connection with the settlement agreement discussed above, we entered into an amendment to ourjoint venture agreement with Boyd to permit the transfer of our 50% ownership interest into trust inconnection with our settlement agreement with the DGE. In accordance with such agreement, Boydreceived a priority partnership distribution of approximately $31 million (equal to the excess prior capitalcontributions by Boyd) upon successful refinancing of the Borgata credit facility in August 2010.
We recorded a pre-tax impairment charge of approximately $128 million at September 30, 2010 whichdecreased the carrying value of our investment in Borgata to approximately $250 million. The impairmentcharge was based on an offer received from a potential buyer at that time and authorized by our Board of
7

Directors. We ultimately did not reach final agreement with such buyer. We continue to negotiate withother parties who have expressed interest in the asset, but can provide no assurance that a transaction willbe completed.
We reviewed the carrying value of our 50% interest in Borgata as of December 31, 2011 anddetermined that it was necessary to record an other-than-temporary impairment charge of $62 million in‘‘Property transactions, net,’’ based on an estimated fair value of $185 million for our 50% interest.Management used a discounted cash flow analysis to determine the estimated fair value from a marketparticipant’s point of view. Key assumptions included in such analysis include management’s estimates offuture cash flows, including outflows for capital expenditures, an appropriate discount rate, and long-termgrowth rate. There is significant uncertainty surrounding Borgata’s future operating results, primarily dueto the planned opening of a major new resort in the Atlantic City market during 2012 and other additionalcompetition expected in surrounding markets. As a result, for purposes of this analysis management hasreflected a decrease in forecasted cash flows in 2012 and 2013. Also, management used a long-term growthrate of 3% and a discount rate of 10.5%, which it believes appropriately reflects risk associated with theestimated cash flows. This analysis is sensitive to management assumptions, and increases or decreases inthese assumptions would have a material impact on the analysis.
In July 2010, we entered into an agreement to sell four long-term ground leases and their respectiveunderlying real property parcels, approximately 11 acres, underlying the Borgata. The transaction closed inNovember 2010; the trust received net proceeds of $71 million and we recorded a gain of $3 million relatedto the sale in ‘‘Property transactions, net.’’
Liquidity and Financial Position
As of December 31, 2011, we had approximately $13.6 billion principal amount of indebtednessoutstanding, including $3.3 billion of borrowings under our senior credit facility, which included$778 million borrowed in December 2011, to increase our capacity for issuing additional securedindebtedness. Giving effect to the subsequent repayment of these amounts, we would have hadapproximately $957 million of available borrowing capacity under our senior credit facility at December 31,2011. Any increase in the interest rates applicable to our existing or future borrowings would increase thecost of our indebtedness and reduce the cash flow available to fund our other liquidity needs. AtDecember 31, 2011 we had no other existing sources of borrowing availability, except to the extent we paydown further amounts outstanding under the senior credit facility.
In January 2012, we issued $850 million of 8.625% senior notes due 2019, for net proceeds to us ofapproximately $836 million. The notes are unsecured and otherwise rank equally in right of payment withour existing and future senior indebtedness.
Our senior credit facility was amended and restated in February 2012, and consists of approximately$1.8 billion in term loans and a $1.3 billion revolver. Under the restated senior credit facility, loans andrevolving commitments aggregating approximately $1.8 billion (the ‘‘extending loans’’) were extended toFebruary 2015. The extending loans are subject to a pricing grid that decreases the LIBOR spread by asmuch as 250 basis points based upon collateral coverage levels at any given time (commencing 45 daysafter the restatement effective date) and the LIBOR floor on extended loans is reduced from 200 basispoints to 100 basis points.
The restated senior credit facility allows us to refinance indebtedness maturing prior to February 23,2015 but limits our ability to prepay later maturing indebtedness until the extended facilities are paid infull. We may issue unsecured debt, equity-linked and equity securities to refinance our outstandingindebtedness; however, we are required to use net proceeds from certain indebtedness issued in amountsin excess of $250 million (excluding amounts used to refinance indebtedness) to ratably prepay the creditfacilities in an amount equal to 50% of the net cash proceeds of such excess. Under the restated seniorcredit facility we are no longer required to use net proceeds from equity offerings to prepay the restated
8
senior credit facility. In connection with the restated senior credit facility we agreed to use commerciallyreasonable efforts to deliver a mortgage, limited in amount to comply with indenture restrictions,encumbering the Beau Rivage within 90 days from the effective date of the restated loan agreement. Uponthe issuance of such mortgage, the holders of our 13% senior secured notes due 2013 would obtain anequal and ratable lien in the collateral.
Under the amended senior credit facility, we and our restricted subsidiaries are required to maintain aminimum trailing annual EBITDA (as defined in the agreement governing our senior credit facility) of$1.2 billion for each of the quarters of 2012, increasing to $1.25 billion at March 31, 2013, to $1.3 billion atJune 30, 2013, and to $1.4 billion at March 31, 2014. Capital expenditure limits previously in place underthe senior credit facility did not change in the restated loan agreement.
MGM China. As of December 31, 2011, MGM Grand Paradise, had cash of approximately $720 millionand approximately $552 million of debt outstanding under its term loan credit facility, which is secured bythe assets of MGM Macau. We do not guarantee MGM Grand Paradise’s obligations under its creditagreement. In February 2012, MGM China’s Board of Directors declared a dividend of approximately$400 million which will be paid to shareholders of record as of March 9, 2012, and distributed on or aboutMarch 20, 2012. We will receive approximately $204 million, representing 51% of such dividend.
‘‘Principal Debt Arrangements’’ for further discussion of our debt agreements and related covenants.
Results of Operations
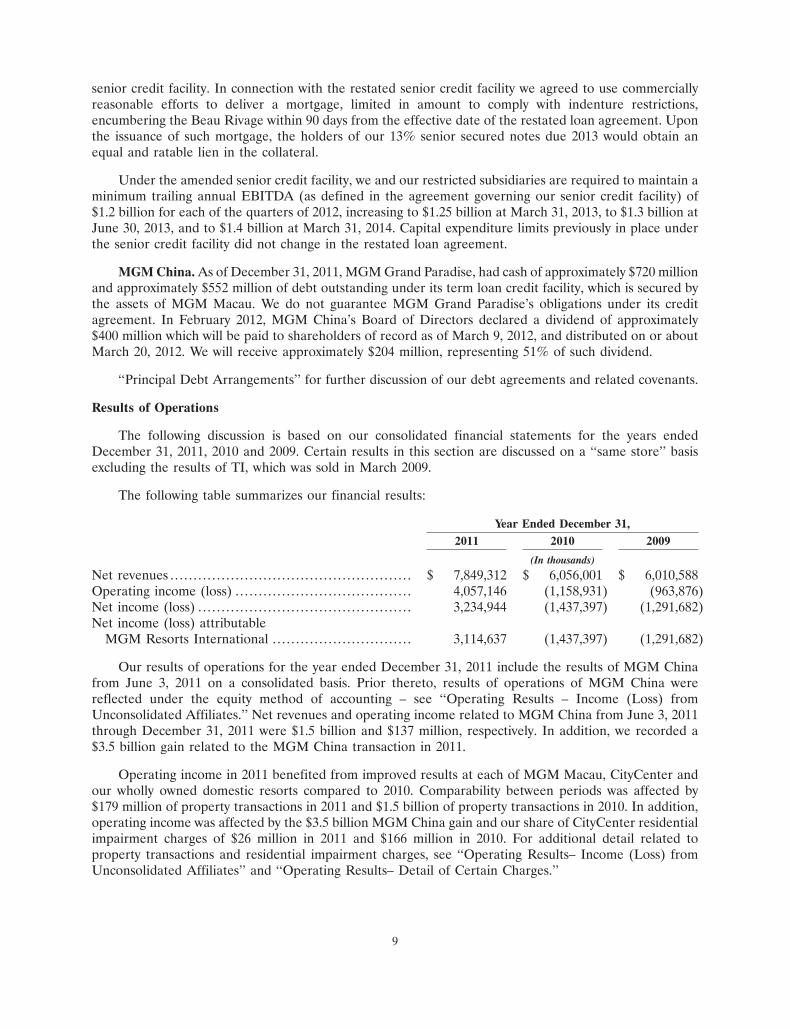
The following discussion is based on our consolidated financial statements for the years endedDecember 31, 2011, 2010 and 2009. Certain results in this section are discussed on a ‘‘same store’’ basisexcluding the results of TI, which was sold in March 2009.
The following table summarizes our financial results:
Year Ended December 31,2011 2010 2009
(In thousands)
Net revenues . . . . . . . . . . . . . . . . . . . . . . . . . . . . . . . . . . . . . . . . . . . . . . . . . . . . $ 7,849,312 $ 6,056,001 $ 6,010,588Operating income (loss) . . . . . . . . . . . . . . . . . . . . . . . . . . . . . . . . . . . . . . 4,057,146 (1,158,931) (963,876)Net income (loss) . . . . . . . . . . . . . . . . . . . . . . . . . . . . . . . . . . . . . . . . . . . . . . 3,234,944 (1,437,397) (1,291,682)Net income (loss) attributable
MGM Resorts International . . . . . . . . . . . . . . . . . . . . . . . . . . . . . . 3,114,637 (1,437,397) (1,291,682)
Our results of operations for the year ended December 31, 2011 include the results of MGM Chinafrom June 3, 2011 on a consolidated basis. Prior thereto, results of operations of MGM China werereflected under the equity method of accounting – see ‘‘Operating Results – Income (Loss) fromUnconsolidated Affiliates.’’ Net revenues and operating income related to MGM China from June 3, 2011through December 31, 2011 were $1.5 billion and $137 million, respectively. In addition, we recorded a$3.5 billion gain related to the MGM China transaction in 2011.
Operating income in 2011 benefited from improved results at each of MGM Macau, CityCenter andour wholly owned domestic resorts compared to 2010. Comparability between periods was affected by$179 million of property transactions in 2011 and $1.5 billion of property transactions in 2010. In addition,operating income was affected by the $3.5 billion MGM China gain and our share of CityCenter residentialimpairment charges of $26 million in 2011 and $166 million in 2010. For additional detail related toproperty transactions and residential impairment charges, see ‘‘Operating Results– Income (Loss) fromUnconsolidated Affiliates’’ and ‘‘Operating Results– Detail of Certain Charges.’’
9

Operating loss in 2010 increased 20% from 2009 and was negatively affected by recessionary trendsthat extended into 2010. In addition, operating loss was affected by $1.5 billion of property transactions,$166 million of residential impairment charges in 2010, and $1.3 billion of property transactions and$203 million of CityCenter residential inventory impairment charges in 2009.
Corporate expense increased 41% to $175 million in 2011 as a result of costs associated with ourMGM China transaction, transition expenses related to the outsourcing of information systems, additionallegal and development costs associated with future development initiatives, costs associated with theimplementation of our new loyalty program and additional costs associated with community involvement.Corporate expense decreased 14% in 2010 primarily as a result of higher 2009 legal and advisory costsassociated with our activities to improve our financial position.
Depreciation and amortization in 2011 increased from 2010 primarily as a result of the consolidationof MGM China. Of the $221 million of depreciation expense at MGM China, $181 million related toamortization of intangible assets recognized in acquisition. Depreciation and amortization expense in 2010decreased 8% due to certain assets being fully depreciated.
Operating Results – Detailed Segment Information
The following table presents net revenue and Adjusted EBITDA by reportable segment. Managementuses Adjusted Property EBITDA as the primary profit measure for its reportable segments. See‘‘Non-GAAP Measures’’ for additional Adjusted EBITDA and Adjusted Property EBITDA information:
Year Ended December 31,2011 2010 2009
(In thousands)
Net revenue:Wholly owned domestic resorts . . . . . . . . . . . . . . . . . . . . . . . . . . $ 5,892,902 $ 5,634,350 $ 5,875,090MGM China . . . . . . . . . . . . . . . . . . . . . . . . . . . . . . . . . . . . . . . . . . . . . . . . . 1,534,963 - -
Reportable segment net revenue . . . . . . . . . . . . . . . . . . . . . . 7,427,865 5,634,350 5,875,090Corporate and other. . . . . . . . . . . . . . . . . . . . . . . . . . . . . . . . . . . . . . . . 421,447 421,651 135,498
$ 7,849,312 $ 6,056,001 $ 6,010,588
Adjusted EBITDA:Wholly owned domestic resorts . . . . . . . . . . . . . . . . . . . . . . . . . . $ 1,298,116 $ 1,165,413 $ 1,343,562MGM China . . . . . . . . . . . . . . . . . . . . . . . . . . . . . . . . . . . . . . . . . . . . . . . . . 359,686 - -
Reportable segment Adjusted Property EBITDA.. 1,657,802 1,165,413 1,343,562Corporate and other. . . . . . . . . . . . . . . . . . . . . . . . . . . . . . . . . . . . . . . . (101,233) (235,200) (236,463)
$ 1,556,569 $ 930,213 $ 1,107,099
See below for detailed discussion of segment results related to our wholly owned domestic operationsand MGM China. Corporate and other revenue includes revenues from MGM Hospitality andmanagement operations and reimbursed costs revenue primarily related to our CityCenter managementagreement. Reimbursed costs revenue represents reimbursement of costs, primarily payroll-related,incurred by us in connection with the provision of management services and were $351 million,$359 million and $99 million for 2011, 2010 and 2009, respectively.
Adjusted EBITDA losses related to corporate and other decreased in 2011 compared to 2010primarily as a result of a decrease in our share of losses from CityCenter, which were impacted byresidential impairment charges as discussed further in ‘‘Operating Results – Income (loss) fromunconsolidated affiliates.’’ Partially offsetting the decrease in losses related to CityCenter was an increasein corporate expense discussed above and lower earnings from MGM Macau as Adjusted EBITDA related
10

to corporate and other in 2011 only includes our share of earnings from MGM Macau through June 2,2011 versus a full year in 2010 and 2009. Adjusted EBITDA losses related to corporate and other in 2010decreased slightly from 2009, as an increase in our share of earnings from MGM Macau was offset byincreased losses related to CityCenter and lower earnings from Borgata due to discontinuing equitymethod accounting.
Wholly owned domestic operations. The following table presents detailed net revenue at our whollyowned domestic resorts:
Year Ended December 31,Percentage Percentage
2011 Change 2010 Change 2009(In thousands)
Casino revenue, net:Table games . . . . . . . . . . . . . . . . . . . . . . . . . . $ 800,216 (3%) $ 827,274 (13%) $ 955,238Slots . . . . . . . . . . . . . . . . . . . . . . . . . . . . . . . . . . . 1,625,420 3% 1,577,506 (2%) 1,611,037Other . . . . . . . . . . . . . . . . . . . . . . . . . . . . . . . . . . 66,836 (11%) 74,915 (11%) 83,784
Casino revenue, net . . . . . . . . . . . . . . 2,492,472 1% 2,479,695 (6%) 2,650,059
Non-casino revenue:Rooms . . . . . . . . . . . . . . . . . . . . . . . . . . . . . . . . . 1,513,789 10% 1,370,054 (1%) 1,385,196Food and beverage. . . . . . . . . . . . . . . . . . 1,374,614 3% 1,331,357 (2%) 1,362,325Entertainment, retail and other . . 1,139,139 5% 1,086,469 (5%) 1,143,202
Non-casino revenue . . . . . . . . . . . . . . 4,027,542 6% 3,787,880 (3%) 3,890,723
6,520,014 4% 6,267,575 (4%) 6,540,782Less: Promotional allowances. . . . . . . . (627,112) (1%) (633,225) (5%) (665,692)
$ 5,892,902 5% $ 5,634,350 (4%) $ 5,875,090
Net revenue related to wholly owned domestic resorts increased 5% compared to 2010, driven by a13% increase in REVPAR at our Las Vegas Strip resorts as well as increases across our other non-gamingbusiness. Net revenue related to wholly owned domestic resorts for 2010 decreased 4% compared to 2009.On a same store basis, net revenues decreased 3%.
Table games revenue in 2011 decreased 3% compared to 2010 and was negatively affected by a lowerbaccarat hold percentage. Total table games hold percentage was near the low end of our normal range inboth the current and prior year. Total table games revenue in 2011 was also affected by table games volumedecreasing 3% compared to the prior year mainly as a result of lower baccarat volume. Slots revenueincreased 3% overall and 4% at our Las Vegas Strip resorts in 2011.
In 2010, table games revenue decreased 13% compared to 2009 on a same store basis, mainly as aresult of a 6% decrease in overall table games volumes, combined with a lower hold percentage. Slotsrevenue decreased 1% in 2010 on a same store basis as a result of lower slots volume on the Las VegasStrip, partially offset by a 5% increase at MGM Grand Detroit and a 3% increase at Gold Strike Tunica.
Rooms revenue increased 10% in 2011 compared to 2010 driven by higher hotel rates and occupancyat our Las Vegas Strip resorts, as well as the implementation of resort fees across most of our resorts.Rooms revenue was flat on a same store basis for 2010 compared to 2009 as a result of a decrease in
11

occupancy offset by slightly higher room rates. The following table shows key hotel statistics for our LasVegas Strip resorts:
Year Ended December 31,2011 2010 2009
Occupancy . . . . . . . . . . . . . . . . . . . . . . . . . . . . . . . . . . . . . . . . . . . . . . . . . . . . . . . 90% 89% 91%Average Daily Rate (ADR) . . . . . . . . . . . . . . . . . . . . . . . . . . . . . . . . . . $ 127 $ 115 $ 112Revenue per Available Room (REVPAR) . . . . . . . . . . . . . . . . $ 115 $ 102 $ 101
Food and beverage revenues increased 3% in 2011 as a result of increased catering and conventionsales, as well as higher revenue across many Las Vegas Strip outlets. Entertainment, retail and otherrevenues increased 5%, driven by higher entertainment revenues related to arena events and across mostLas Vegas Strip production shows. Food and beverage, entertainment, and retail revenues in 2010 and2009 were negatively affected by lower customer spending.
Adjusted Property EBITDA at our wholly owned domestic resorts was $1.3 billion in 2011, an increaseof 11% driven by improved operating results across most of our Las Vegas Strip properties. In addition,2011 Adjusted EBITDA increased 7% at MGM Grand Detroit, 14% at Beau Rivage and AdjustedProperty EBITDA margin in 2011 increased by approximately 130 basis points from 2010, to 22%.
Adjusted Property EBITDA at wholly owned domestic resorts was $1.2 billion in 2010, a decrease of13% compared to 2009. On a same store basis, excluding the results of Treasure Island in 2009, AdjustedProperty EBITDA decreased 12%. Adjusted Property EBITDA margin in 2010 was approximately 200basis points lower than 2009 as a result of decreased revenues.
MGM China. Net revenue for MGM China was $1.5 billion for the period from June 3, 2011 throughDecember 31, 2011. Adjusted Property EBITDA was $360 million for the same period.
The following table presents certain supplemental pro forma information for MGM China for theyears ended December 31, 2011 and 2010 as if the transaction had occurred as of January 1, 2010. Thisinformation includes the impact of certain purchase accounting adjustments. This supplemental pro formainformation is provided solely for comparative purposes and does not presume to be indicative of whatactual results would have been if the acquisition of the controlling financial interest had been completed asof January 1, 2010, nor indicative of future results:
Year Ended December 31,2011 2010
(In thousands)
Net Revenue. . . . . . . . . . . . . . . . . . . . . . . . . . . . . . . . . . . . . . . . . . . . . . . . . . . . . . . . . . . . . . . . . . . . . . . . . $ 2,605,994 $ 1,571,226
Adjusted Property EBITDA .. . . . . . . . . . . . . . . . . . . . . . . . . . . . . . . . . . . . . . . . . . . . . . . . . . . . . $ 629,692 $ 357,664Property transactions, net . . . . . . . . . . . . . . . . . . . . . . . . . . . . . . . . . . . . . . . . . . . . . . . . . . . . . . (1,618) (3,962)Depreciation and amortization . . . . . . . . . . . . . . . . . . . . . . . . . . . . . . . . . . . . . . . . . . . . . . . . (359,286) (373,829)
Operating income (loss) . . . . . . . . . . . . . . . . . . . . . . . . . . . . . . . . . . . . . . . . . . . . . . . . . . . . . . . . . . . 268,788 (20,127)Non-operating income (expense) . . . . . . . . . . . . . . . . . . . . . . . . . . . . . . . . . . . . . . . . . . . . . (22,621) (46,228)
Income (loss) before income taxes . . . . . . . . . . . . . . . . . . . . . . . . . . . . . . . . . . . . . . . . . . . . . . 246,167 (66,355)Benefit (provision) for income taxes . . . . . . . . . . . . . . . . . . . . . . . . . . . . . . . . . . . . . . . . . 99,068 (37)
Net income (loss). . . . . . . . . . . . . . . . . . . . . . . . . . . . . . . . . . . . . . . . . . . . . . . . . . . . . . . . . . . . . . . . . . . $ 345,235 $ (66,392)
12

Pro forma net revenue and Adjusted Property EBITDA for MGM China for the year endedDecember 31, 2011 increased primarily as a result of a 72% increase in VIP table games turnover and a17% increase in main floor table games drop.
Operating Results – Details of Certain Charges
Stock compensation expense is recorded within the department of the recipient of the stockcompensation award. The following table shows the amount of compensation expense recognized relatedto employee stock-based awards:
Year Ended December 31,2011 2010 2009
(In thousands)
Casino . . . . . . . . . . . . . . . . . . . . . . . . . . . . . . . . . . . . . . . . . . . . . . . . . . . . . . . . . . . . $ 7,552 $ 7,592 $ 10,080Other operating departments . . . . . . . . . . . . . . . . . . . . . . . . . . . . . . . . 3,868 3,092 4,287General and administrative . . . . . . . . . . . . . . . . . . . . . . . . . . . . . . . . . . 9,402 9,974 9,584Corporate expense and other . . . . . . . . . . . . . . . . . . . . . . . . . . . . . . . . 18,885 14,330 12,620
$ 39,707 $ 34,988 $ 36,571
Preopening and start-up expenses consisted of the following:
Year Ended December 31,2011 2010 2009
(In thousands)
CityCenter . . . . . . . . . . . . . . . . . . . . . . . . . . . . . . . . . . . . . . . . . . . . . . . . . . . . . . . $ - $ 3,494 $ 52,010Other . . . . . . . . . . . . . . . . . . . . . . . . . . . . . . . . . . . . . . . . . . . . . . . . . . . . . . . . . . . . . (316) 753 1,003
$ (316) $ 4,247 $ 53,013
Property transactions, net consisted of the following:
Year Ended December 31,2011 2010 2009
(In thousands)
Circus Circus Reno impairment . . . . . . . . . . . . . . . . . . . . . . . . . . . . . $ 79,658 $ - $ -Borgata impairments . . . . . . . . . . . . . . . . . . . . . . . . . . . . . . . . . . . . . . . . . . 61,962 128,395 -Silver Legacy impairment . . . . . . . . . . . . . . . . . . . . . . . . . . . . . . . . . . . . 22,966 - -CityCenter investment impairments . . . . . . . . . . . . . . . . . . . . . . . . - 1,313,219 955,898Atlantic City Renaissance Pointe land impairment . . . . . . - - 548,347Gain on sale of TI . . . . . . . . . . . . . . . . . . . . . . . . . . . . . . . . . . . . . . . . . . . . . - - (187,442)Other property transactions, net . . . . . . . . . . . . . . . . . . . . . . . . . . . . 14,012 9,860 11,886
$ 178,598 $ 1,451,474 $ 1,328,689
Circus Circus Reno. At September 30, 2011 we reviewed the carrying value of our Circus Circus Renolong-lived assets for impairment using revised operating forecasts developed by management for thatresort in the third quarter of 2011. Due to current and forecasted market conditions and results ofoperations through September 30, 2011 being lower than previous forecasts, we recorded a non-cashimpairment charge of $80 million in the third quarter of 2011 primarily related to a write-down of CircusCircus Reno’s long-lived assets. Our discounted cash flow analysis for Circus Circus Reno includedestimated future cash inflows from operations and estimated future cash outflows for capital expendituresutilizing an estimated discount rate and terminal year capitalization rate.
13

Investment in Borgata. As discussed in ‘‘Executive Overview,’’ we recorded a pre-tax impairmentcharge of approximately $128 million in 2010 based on an offer received from a potential buyer. Werecorded an additional $62 million impairment charge at December 31, 2011.
Investment in Silver Legacy. Silver Legacy has approximately $143 million of outstanding senior notesdue in March 2012. Silver Legacy is exploring various alternatives for refinancing or restructuring itsobligations under the notes, including filing for bankruptcy protection. We reviewed the carrying value ofour investment in Silver Legacy as of December 31, 2011 and recorded an ‘‘other-than-temporary’’impairment charge of $23 million to decrease the carrying value of our investment to zero. We willdiscontinue applying the equity method for our investment in Silver Legacy and will not provide foradditional losses until our share of future net income, if any, equals the share of net losses not recognizedduring the period the equity method was suspended.
Investment in CityCenter. At June 30, 2010, we reviewed our CityCenter investment for impairmentusing revised operating forecasts developed by CityCenter management. Based on current and forecastedmarket conditions and because CityCenter’s results of operations through June 30, 2010 were belowprevious forecasts, and the revised operating forecasts were lower than previous forecasts, we concludedthat we should review the carrying value of our investment. We determined that the carrying value of ourinvestment exceeded our fair value determined using a discounted cash flow analyses and therefore animpairment was indicated. We intend to and believe we will be able to retain our investment in CityCenter;however, due to the extent of the shortfall and our assessment of the uncertainty of fully recovering ourinvestment, we determined that the impairments were ‘‘other-than-temporary’’ and recorded impairmentcharges of $1.12 billion in the second quarter of 2010.
At September 30, 2010, we recognized an increase of $232 million in our total net obligation underour CityCenter completion guarantee, and a corresponding increase in our investment in CityCenter. Theincrease primarily reflected a revision to prior estimates based on our assessment of the most currentinformation derived from our close-out and litigation processes and does not reflect certain potentialrecoveries that CityCenter is pursuing as part of the litigation process. We completed an impairmentreview as of September 30, 2010 and as a result recorded an additional impairment of $191 million in thethird quarter of 2010 included in ‘‘Property transactions, net.’’
The discounted cash flow analyses for our investment in CityCenter included estimated future cashinflows from operations, including residential sales, and estimated future cash outflows for capitalexpenditures. The June 2010 and September 2010 analyses used an 11% discount rate and a long termgrowth rate of 4% related to forecasted cash flows for CityCenter’s operating assets.
At September 30, 2009, we reviewed our CityCenter investment for impairment using revisedoperating forecasts developed by CityCenter management at that time. In addition, the impairment chargerelated to CityCenter’s residential real estate under development discussed below further indicated thatour investment may have experienced an ‘‘other-than-temporary’’ decline in value. Our discounted cashflow analysis for CityCenter included estimated future cash outflows for construction and maintenanceexpenditures and future cash inflows from operations, including residential sales. Based on our analysis, wedetermined the carrying value of our investment exceeded its fair value and we determined that theimpairment was ‘‘other-than-temporary.’’ As a result, we recorded an impairment charge of $956 millionincluded in ‘‘Property transactions, net.’’
Atlantic City Renaissance Pointe Land. We reviewed the carrying value of our Renaissance Pointe landholdings for impairment at December 31, 2009 as we determined at that time that we did not intend topursue development of our MGM Grand Atlantic City project for the foreseeable future. Our Board ofDirectors subsequently terminated this project. Our Renaissance Pointe land holdings included a 72-acredevelopment site and also included 11 acres of land subject to a long-term lease with the Borgata jointventure. The fair value of the development land was determined based on a market approach, and the fairvalue of land subject to the long-term lease with Borgata was determined using a discounted cash flow
14

analysis using expected contractual cash flows under the lease discounted at a market capitalization rate.As a result of our review, we recorded a non-cash impairment charge of $548 million in 2009.
Sale of TI. On March 20, 2009, we closed the sale of the Treasure Island casino resort for net proceeds ofapproximately $746 million and recognized a pre-tax gain of $187 million related to the sale.
Other. Other property transactions in 2011 include the write-off of goodwill related to Railroad Pass.Other property transactions during 2010 related primarily to write-downs of various discontinued capitalprojects. Other property transactions in 2009 primarily related to write-downs of various discontinuedcapital projects offset by $7 million of insurance recoveries related to the Monte Carlo fire.
Operating Results – Income (Loss) from Unconsolidated Affiliates
The following table summarizes information related to our income (loss) from unconsolidatedaffiliates:
Year Ended December 31,2011 2010 2009
(In thousands)
CityCenter . . . . . . . . . . . . . . . . . . . . . . . . . . . . . . . . . . . . . . . . . . . . . . . . . . . . . . . $ (56,291) $ (250,482) $ (208,633)MGM Macau . . . . . . . . . . . . . . . . . . . . . . . . . . . . . . . . . . . . . . . . . . . . . . . . . . . 115,219 129,575 24,615Borgata . . . . . . . . . . . . . . . . . . . . . . . . . . . . . . . . . . . . . . . . . . . . . . . . . . . . . . . . . . - 6,971 72,602Other . . . . . . . . . . . . . . . . . . . . . . . . . . . . . . . . . . . . . . . . . . . . . . . . . . . . . . . . . . . . . 32,166 35,502 23,189
$ 91,094 $ (78,434) $ (88,227)
We ceased recording MGM Macau operating results as income from unconsolidated affiliates underthe equity method of accounting in June 2011, and we ceased recording Borgata operating results asincome from unconsolidated affiliates in March 2010.
Our share of CityCenter operating losses included our share of residential impairment charges of$26 million, $166 million and $203 million in 2011, 2010 and 2009, respectively. Upon substantialcompletion of construction of the Mandarin Oriental residential inventory in the first quarter of 2010 andthe Veer residential inventory in the second quarter of 2010, CityCenter was required to carry itsresidential inventory at the lower of its carrying value or fair value less costs to sell. Fair value of theresidential inventory is determined using a discounted cash flow analysis based on management’s currentexpectations of future cash flows. The key inputs in the discounted cash flow analysis include estimatedsales prices of units currently under contract and new unit sales, the absorption rate over the sell-outperiod, and the discount rate. CityCenter recorded a residential real estate impairment charge of$53 million in 2011. We recognized 50% of such impairment charge, resulting in a pre-tax charge ofapproximately $26 million. In 2010, CityCenter recorded residential impairment charges of $330 million.We recognized 50% of such impairment charges, resulting in a pre-tax charge of approximately$166 million.
Included in loss from unconsolidated affiliates for the year ended December 31, 2009 is our share ofan impairment charge relating to CityCenter residential real estate under development (‘‘REUD’’).CityCenter was required to review its REUD for impairment as of September 30, 2009, mainly due toCityCenter’s September 2009 decision to discount the prices of its residential inventory by 30%. Thisdecision and related market conditions led to CityCenter management’s conclusion that the carrying valueof the REUD was not recoverable based on estimates of undiscounted cash flows. As a result, CityCenterwas required to compare the fair value of its REUD to its carrying value and record an impairment chargefor the shortfall. Fair value of the REUD was determined using a discounted cash flow analysis based onmanagement’s current expectations of future cash flows. The key inputs in the discounted cash flowanalysis included estimated sales prices of units currently under contract and new unit sales, the absorption
15

rate over the sell-out period, and the discount rate. This analysis resulted in an impairment charge ofapproximately $348 million of the REUD. We recognized our 50% share of such impairment charge,adjusted by certain basis differences, resulting in a pre-tax charge of $203 million.
Non-operating Results
Interest expense. The following table summarizes information related to interest on our long-term debt:
Year Ended December 31,2011 2010 2009
(In thousands)
Total interest incurred (MGM Resorts) . . . . . . . . . . . . . . . . . . . $ 1,073,949 $ 1,113,580 $ 997,897Total interest incurred (MGM China) . . . . . . . . . . . . . . . . . . . . . 12,916 - -Interest capitalized. . . . . . . . . . . . . . . . . . . . . . . . . . . . . . . . . . . . . . . . . . . . . (33) - (222,466)
$ 1,086,832 $ 1,113,580 $ 775,431
Cash paid for interest, net of amounts capitalized . . . . . . $ 1,001,982 $ 1,020,040 $ 807,523Weighted average total debt balance . . . . . . . . . . . . . . . . . . . . . . . $ 12.4 billion $ 12.7 billion $ 13.2 billionEnd-of-year ratio of fixed-to-floating debt . . . . . . . . . . . . . . . . 72/28 81/19 61/39Weighted average interest rate . . . . . . . . . . . . . . . . . . . . . . . . . . . . . . 7.7% 8.0% 7.6%
In 2011, gross interest costs decreased related to a lower average debt balance during 2011. Includedin interest expense in 2011 is $42 million of amortization of debt discount associated with the amendmentof our senior credit facility during 2010. In 2010, gross interest costs increased compared to 2009 due tohigher interest rates on our senior credit facility and newly issued fixed rate borrowings. Also included ininterest expense in 2010 is $31 million of amortization of debt discount associated with the amendment ofour senior credit facility during 2010.
We had minimal capitalized interest in 2011 and none in 2010, as we ceased capitalization of interestrelated to CityCenter in December 2009. We have minimal other ongoing qualifying capital projects.
Other, net. We recorded a net gain on extinguishment of debt of $142 million in ‘‘Other, net’’ related tothe modification of our senior credit facility in March 2010. In 2009, we recorded an impairment of$176 million related to our M Resort note.
Income taxes. The following table summarizes information related to our income taxes:
Year Ended December 31,2011 2010 2009
(In thousands)
Income (loss) before income taxes . . . . . . . . . . . . . . . . . . . . . . . . . $ 2,831,631 $ (2,216,025) $ (2,012,593)Benefit for income taxes. . . . . . . . . . . . . . . . . . . . . . . . . . . . . . . . . . . . . . 403,313 778,628 720,911Effective income tax rate . . . . . . . . . . . . . . . . . . . . . . . . . . . . . . . . . . . . . (14.2)% 35.1% 35.8%Federal, state and foreign income taxes paid, net of
refunds . . . . . . . . . . . . . . . . . . . . . . . . . . . . . . . . . . . . . . . . . . . . . . . . . . . . . . . . $ (172,018) $ (330,218) $ (53,863)
We recorded an income tax benefit in 2011 even though we had pre-tax income for the year becausewe did not provide U.S. deferred taxes on the $3.5 billion gain recorded on the acquisition of thecontrolling financial interest in MGM China. The gain increased the excess amount for financial reportingover the U.S. tax basis of our investment in MGM China. No U.S. deferred taxes were provided for thisexcess amount because we expect it to resolve through repatriations of future MGM China earnings forwhich there will be sufficient foreign tax credits to offset all U.S. income tax that would result from suchrepatriations. Excluding the MGM China gain, we would have provided income tax benefit at an effectivetax rate of 60.7% for 2011, higher than the federal statutory rate due primarily to an income tax benefit
16
resulting from a decrease to the Macau net deferred tax liability recorded to reflect an assumed 5-yearextension of the exemption from complementary tax on gaming profits and a lower effective tax rate onMGM China earnings. The income tax benefit on pre-tax loss in 2010 was provided essentially at thefederal statutory rate of 35%. The income tax benefit provided on pre-tax loss in 2009 was greater than35% primarily as a result of state tax benefit provided on the write-down of land in Atlantic City.
The net refunds of cash taxes in 2011 and 2010 were due primarily to the carryback to prior years ofU.S federal income tax net operating losses incurred in 2010 and 2009, respectively. The net refund of cashtaxes in 2009 was due primarily to refunds of taxes that were paid in 2008.
Non-GAAP Measures
‘‘Adjusted EBITDA’’ is earnings before interest and other non-operating income (expense), taxes,depreciation and amortization, preopening and start-up expenses, and property transactions, net, and thegain on the MGM China transaction. ‘‘Adjusted Property EBITDA’’ is Adjusted EBITDA before corporateexpense and stock compensation expense related to the MGM Resorts stock option plan, which is notallocated to each property. MGM China recognizes stock compensation expense related to its stockcompensation plan which is included in the calculation of Adjusted Property EBITDA for MGM China.Adjusted EBITDA information is presented solely as a supplemental disclosure to reported GAAPmeasures because management believes these measures are 1) widely used measures of operatingperformance in the gaming industry, and 2) a principal basis for valuation of gaming companies.
We believe that while items excluded from Adjusted EBITDA and Adjusted Property EBITDA maybe recurring in nature and should not be disregarded in evaluation of our earnings performance, it is usefulto exclude such items when analyzing current results and trends compared to other periods because theseitems can vary significantly depending on specific underlying transactions or events that may not becomparable between the periods being presented. Also, we believe excluded items may not relatespecifically to current operating trends or be indicative of future results. For example, preopening andstart-up expenses will be significantly different in periods when we are developing and constructing a majorexpansion project and dependent on where the current period lies within the development cycle, as well asthe size and scope of the project(s). ‘‘Property transactions, net’’ includes normal recurring disposals andgains and losses on sales of assets related to specific assets within our resorts, but also includes gains orlosses on sales of an entire operating resort or a group of resorts and impairment charges on entire assetgroups or investments in unconsolidated affiliates, which may not be comparable period over period. Inaddition, capital allocation, tax planning, financing and stock compensation awards are all managed at thecorporate level. Therefore, we use Adjusted Property EBITDA as the primary measure of our operatingresorts’ performance.
Adjusted EBITDA or Adjusted Property EBITDA should not be construed as an alternative tooperating income or net income, as an indicator of our performance; or as an alternative to cash flowsfrom operating activities, as a measure of liquidity; or as any other measure determined in accordance withgenerally accepted accounting principles. We have significant uses of cash flows, including capitalexpenditures, interest payments, taxes and debt principal repayments, which are not reflected in AdjustedEBITDA. Also, other companies in the gaming and hospitality industries that report Adjusted EBITDAinformation may calculate Adjusted EBITDA in a different manner and therefore, comparability may belimited.
17

The following table presents a reconciliation of Adjusted EBITDA to net loss:Year Ended December 31,
2011 2010 2009
(In thousands)Adjusted EBITDA . . . . . . . . . . . . . . . . . . . . . . . . . . . . . . . . . . . . . . . . . . . . . . . . . . . . . . . . . . $ 1,556,569 $ 930,213 $ 1,107,099
Preopening and start-up expenses . . . . . . . . . . . . . . . . . . . . . . . . . . . . . . . . . . . . . . 316 (4,247) (53,013)Property transactions, net . . . . . . . . . . . . . . . . . . . . . . . . . . . . . . . . . . . . . . . . . . . . . . . (178,598) (1,451,474) (1,328,689)Gain on MGM China transaction . . . . . . . . . . . . . . . . . . . . . . . . . . . . . . . . . . . . . . 3,496,005 - -Depreciation and amortization . . . . . . . . . . . . . . . . . . . . . . . . . . . . . . . . . . . . . . . . . (817,146) (633,423) (689,273)
Operating income (loss). . . . . . . . . . . . . . . . . . . . . . . . . . . . . . . . . . . . . . . . . . . . . . . . . . . . 4,057,146 (1,158,931) (963,876)
Non-operating income (expense):Interest expense, net . . . . . . . . . . . . . . . . . . . . . . . . . . . . . . . . . . . . . . . . . . . . . . . . . . . . . (1,086,832) (1,113,580) (775,431)Other, net . . . . . . . . . . . . . . . . . . . . . . . . . . . . . . . . . . . . . . . . . . . . . . . . . . . . . . . . . . . . . . . . . (138,683) 56,486 (273,286)
(1,225,515) (1,057,094) (1,048,717)
Income (loss) before income taxes . . . . . . . . . . . . . . . . . . . . . . . . . . . . . . . . . . . . . . . . 2,831,631 (2,216,025) (2,012,593)Benefit for income taxes . . . . . . . . . . . . . . . . . . . . . . . . . . . . . . . . . . . . . . . . . . . . . . . . 403,313 778,628 720,911
Net income (loss) . . . . . . . . . . . . . . . . . . . . . . . . . . . . . . . . . . . . . . . . . . . . . . . . . . . . . . . . . . . 3,234,944 (1,437,397) (1,291,682)Less: Net income attributable to noncontrolling interests . . . . . . . . . . . . . . (120,307) - -
Net income (loss) attributable to MGM Resorts International . . . . . . . . $ 3,114,637 $ (1,437,397) $ (1,291,682)
The following tables present reconciliations of operating income (loss) to Adjusted Property EBITDAand Adjusted EBITDA:
Year Ended December 31, 2011
Gain onMGM China
Transaction &Preopening Property Depreciation
Operating and Start-up Transactions, and AdjustedIncome (Loss) Expenses Net Amortization EBITDA
(In thousands)Bellagio . . . . . . . . . . . . . . . . . . . . . . . . . . . . . . . . . . . . . $ 203,026 $ - $ 2,772 $ 96,699 $ 302,497MGM Grand Las Vegas . . . . . . . . . . . . . . . . . . 71,762 - 232 77,142 149,136Mandalay Bay . . . . . . . . . . . . . . . . . . . . . . . . . . . . . . 84,105 - 531 84,488 169,124The Mirage . . . . . . . . . . . . . . . . . . . . . . . . . . . . . . . . . 41,338 - 1,559 59,546 102,443Luxor . . . . . . . . . . . . . . . . . . . . . . . . . . . . . . . . . . . . . . . . 39,866 - 112 38,103 78,081New York-New York . . . . . . . . . . . . . . . . . . . . . . 63,824 - (76) 23,536 87,284Excalibur . . . . . . . . . . . . . . . . . . . . . . . . . . . . . . . . . . . . 44,428 - 646 20,183 65,257Monte Carlo . . . . . . . . . . . . . . . . . . . . . . . . . . . . . . . . 35,059 - 131 22,214 57,404Circus Circus Las Vegas . . . . . . . . . . . . . . . . . . 4,040 - (1) 18,905 22,944MGM Grand Detroit . . . . . . . . . . . . . . . . . . . . . . 125,235 - 1,415 39,369 166,019Beau Rivage . . . . . . . . . . . . . . . . . . . . . . . . . . . . . . . . 30,313 - 58 39,649 70,020Gold Strike Tunica . . . . . . . . . . . . . . . . . . . . . . . . . 15,991 - 36 13,639 29,666Other resort operations . . . . . . . . . . . . . . . . . . . (86,012) - 80,120 4,133 (1,759)
Wholly owned domestic resorts . . . . . . . . 672,975 - 87,535 537,606 1,298,116MGM China . . . . . . . . . . . . . . . . . . . . . . . . . . . . . . . . 137,440 - 1,120 221,126 359,686MGM Macau (50%). . . . . . . . . . . . . . . . . . . . . . . 115,219 - - - 115,219CityCenter (50%) . . . . . . . . . . . . . . . . . . . . . . . . . . (56,291) - - - (56,291)Other unconsolidated resorts . . . . . . . . . . . . . 32,166 - - - 32,166Management and other operations . . . . . . (13,813) (316) - 14,416 287
887,696 (316) 88,655 773,148 1,749,183
Stock compensation. . . . . . . . . . . . . . . . . . . . . . . . (36,528) - - - (36,528)Corporate . . . . . . . . . . . . . . . . . . . . . . . . . . . . . . . . . . . 3,205,978 - (3,406,062) 43,998 (156,086)
$ 4,057,146 $ (316) $ (3,317,407) $ 817,146 $ 1,556,569
(1) For the twelve months ended December 31, 2011, represents the Adjusted EBITDA of MGM China from June 3, 2011 (the firstday of our majority ownership of MGM China) through December 31, 2011.
(2) Represents our share of operating income, adjusted for the effect of certain basis differences for the approximately five monthsended June 2, 2011.
18

Year Ended December 31, 2010
Preopening Property DepreciationOperating and Start-up Transactions, and Adjusted
Income (Loss) Expenses Net Amortization EBITDA
(In thousands)Bellagio . . . . . . . . . . . . . . . . . . . . . . . . . . . . . . . . . . . . . $ 174,355 $ - $ (17) $ 96,290 $ 270,628MGM Grand Las Vegas . . . . . . . . . . . . . . . . . . 84,359 - 127 78,607 163,093Mandalay Bay . . . . . . . . . . . . . . . . . . . . . . . . . . . . . . 29,859 - 2,892 91,634 124,385The Mirage . . . . . . . . . . . . . . . . . . . . . . . . . . . . . . . . . 36,189 - (207) 66,124 102,106Luxor . . . . . . . . . . . . . . . . . . . . . . . . . . . . . . . . . . . . . . . . 18,822 - 257 42,117 61,196New York-New York . . . . . . . . . . . . . . . . . . . . . . 41,845 - 6,880 27,529 76,254Excalibur . . . . . . . . . . . . . . . . . . . . . . . . . . . . . . . . . . . . 39,534 - 803 22,899 63,236Monte Carlo . . . . . . . . . . . . . . . . . . . . . . . . . . . . . . . . 5,020 185 3,923 24,427 33,555Circus Circus Las Vegas . . . . . . . . . . . . . . . . . . (5,366) - 230 20,741 15,605MGM Grand Detroit . . . . . . . . . . . . . . . . . . . . . . 115,040 - (327) 40,460 155,173Beau Rivage . . . . . . . . . . . . . . . . . . . . . . . . . . . . . . . . 21,564 - 349 39,374 61,287Gold Strike Tunica . . . . . . . . . . . . . . . . . . . . . . . . . 26,115 - (540) 14,278 39,853Other resort operations . . . . . . . . . . . . . . . . . . . (6,391) - 20 5,413 (958)
Wholly owned domestic resorts . . . . . . . . 580,945 185 14,390 569,893 1,165,413MGM Macau (50%). . . . . . . . . . . . . . . . . . . . . . . 129,575 - - - 129,575CityCenter (50%) . . . . . . . . . . . . . . . . . . . . . . . . . . (253,976) 3,494 - - (250,482)Other unconsolidated resorts . . . . . . . . . . . . . 42,764 - - - 42,764Management and other operations . . . . . . (27,084) 568 - 14,358 (12,158)
472,224 4,247 14,390 584,251 1,075,112
Stock compensation. . . . . . . . . . . . . . . . . . . . . . . . (34,988) - - - (34,988)Corporate . . . . . . . . . . . . . . . . . . . . . . . . . . . . . . . . . . . (1,596,167) - 1,437,084 49,172 (109,911)
$ (1,158,931) $ 4,247 $ 1,451,474 $ 633,423 $ 930,213
Year Ended December 31, 2009
Preopening Property DepreciationOperating and Start-up Transactions, and Adjusted
Income (Loss) Expenses Net Amortization EBITDA
(In thousands)Bellagio . . . . . . . . . . . . . . . . . . . . . . . . . . . . . . . . . . . . . $ 157,079 $ - $ 2,326 $ 115,267 $ 274,672MGM Grand Las Vegas . . . . . . . . . . . . . . . . . . 123,378 - 30 90,961 214,369Mandalay Bay . . . . . . . . . . . . . . . . . . . . . . . . . . . . . . 65,841 948 (73) 93,148 159,864The Mirage . . . . . . . . . . . . . . . . . . . . . . . . . . . . . . . . . 74,756 - 313 66,049 141,118Luxor . . . . . . . . . . . . . . . . . . . . . . . . . . . . . . . . . . . . . . . . 37,527 (759) 181 39,218 76,167Treasure Island . . . . . . . . . . . . . . . . . . . . . . . . . . . . . 12,730 - (1) - 12,729New York-New York . . . . . . . . . . . . . . . . . . . . . . 45,445 - 1,631 31,479 78,555Excalibur . . . . . . . . . . . . . . . . . . . . . . . . . . . . . . . . . . . . 47,973 - (16) 24,173 72,130Monte Carlo . . . . . . . . . . . . . . . . . . . . . . . . . . . . . . . . 16,439 - (4,740) 24,895 36,594Circus Circus Las Vegas . . . . . . . . . . . . . . . . . . 4,015 - (9) 23,116 27,122MGM Grand Detroit . . . . . . . . . . . . . . . . . . . . . . 90,183 - 7,336 40,491 138,010Beau Rivage . . . . . . . . . . . . . . . . . . . . . . . . . . . . . . . . 16,234 - 157 49,031 65,422Gold Strike Tunica . . . . . . . . . . . . . . . . . . . . . . . . . 29,010 - (209) 16,250 45,051Other resort operations . . . . . . . . . . . . . . . . . . . (4,172) - (57) 5,988 1,759
Wholly owned domestic resorts . . . . . . . . 716,438 189 6,869 620,066 1,343,562MGM Macau (50%). . . . . . . . . . . . . . . . . . . . . . . 24,615 - - - 24,615CityCenter (50%) . . . . . . . . . . . . . . . . . . . . . . . . . . (260,643) 52,009 - - (208,634)Other unconsolidated resorts . . . . . . . . . . . . . 96,132 815 - - 96,947Management and other operations . . . . . . 7,285 - 2,473 8,564 18,322
583,827 53,013 9,342 628,630 1,274,812
Stock compensation. . . . . . . . . . . . . . . . . . . . . . . . (36,571) - - - (36,571)Corporate . . . . . . . . . . . . . . . . . . . . . . . . . . . . . . . . . . . (1,511,132) - 1,319,347 60,643 (131,142)
$ (963,876) $ 53,013 $ 1,328,689 $ 689,273 $ 1,107,099
19

Liquidity and Capital Resources
Cash Flows – Summary
Our cash flows consisted of the following:Year Ended December 31,
2011 2010 2009
(In thousands)Net cash provided by operating activities . . . . . . . . . . . . . . . . . . . . . . . . . . . . . . . . $ 675,126 $ 504,014 $ 587,914
Investing cash flows:Capital expenditures, net of construction payable . . . . . . . . . . . . . . . . . . . . (301,244) (207,491) (136,850)Proceeds from sale of Treasure Island, net . . . . . . . . . . . . . . . . . . . . . . . . . . . . - - 746,266Acquisition of MGM China, net of cash paid . . . . . . . . . . . . . . . . . . . . . . . . 407,046 - -Investments in and advances to unconsolidated affiliates. . . . . . . . . . . . (128,848) (553,000) (963,685)Distributions from unconsolidated affiliates in excess of earnings . . 2,212 135,058 -Distributions from cost method investments . . . . . . . . . . . . . . . . . . . . . . . . . . - 113,422 -Property damage insurance recoveries . . . . . . . . . . . . . . . . . . . . . . . . . . . . . . . . . - - 7,186Investments in treasury securities- maturities longer than 90 days . (330,313) (149,999) -Proceeds from treasury securities- maturities longer than 90 days . 330,130 - -Other . . . . . . . . . . . . . . . . . . . . . . . . . . . . . . . . . . . . . . . . . . . . . . . . . . . . . . . . . . . . . . . . . . . . . . (295) 75,931 16,828
Net cash used in investing activities . . . . . . . . . . . . . . . . . . . . . . . . . . . . . . . . . (21,312) (586,079) (330,255)
Financing cash flows:Net borrowings (repayments) under bank credit facilities . . . . . . . . . . . 900,848 (3,207,716) (198,156)Issuance of senior notes . . . . . . . . . . . . . . . . . . . . . . . . . . . . . . . . . . . . . . . . . . . . . . . . . 311,415 2,489,485 1,921,751Retirement of senior notes . . . . . . . . . . . . . . . . . . . . . . . . . . . . . . . . . . . . . . . . . . . . . . (493,816) (1,154,479) (1,176,452)Issuance of common stock in public offering, net . . . . . . . . . . . . . . . . . . . . - 588,456 1,104,418Other . . . . . . . . . . . . . . . . . . . . . . . . . . . . . . . . . . . . . . . . . . . . . . . . . . . . . . . . . . . . . . . . . . . . . . (6,525) (190,924) (162,811)
Net cash provided by (used in) financing activities . . . . . . . . . . . . . . . . 711,922 (1,475,178) 1,488,750
Effect of exchange rate on cash . . . . . . . . . . . . . . . . . . . . . . . . . . . . . . . . . . . . . . . . . . . 1,213 - -
Net increase (decrease) in cash and cash equivalents . . . . . . . . . . . . . . . . . . $ 1,366,949 $ (1,557,243) $ 1,746,409
Cash Flows – Operating Activities
We require a certain amount of cash on hand to operate our resorts. Beyond our cash on hand, weutilize company-wide cash management procedures to minimize the amount of cash held on hand or inbanks. Funds are swept from accounts at our resorts daily into central bank accounts, and excess funds areinvested overnight or are used to repay borrowings under our bank credit facilities. Trends in our operatingcash flows tend to follow trends in operating income, excluding non-cash charges, but can be affected bythe timing of significant tax payments or refunds and distributions from unconsolidated affiliates.
At December 31, 2011 and 2010, we held cash and cash equivalents of $1.9 billion and $499 million,respectively. In December 2011, we borrowed an additional $778 million under our senior credit facility toincrease our capacity for issuing additional secured indebtedness. In addition, our cash balance atDecember 31, 2011 included $720 million of cash and cash equivalents related to MGM China.
Cash provided by operating activities increased 34% compared to 2010. The current year includes$354 million in cash provided by operating activities related to MGM China. In addition, increased cashflows at our resorts were offset by lower tax refunds received in the current year period compared to theprior year period. We received net tax refunds of approximately $172 million in 2011 and net tax refunds ofapproximately $330 million in 2010. Cash flow from operating activities decreased 14% in 2010 comparedto 2009 due to a decrease in operating income excluding non-cash charges, partially offset by the tax refundnoted above.
20

Cash Flows – Investing Activities
A significant portion of our investing activities over the past three years related to our CityCenterjoint venture. In 2011, we made contributions of $129 million to CityCenter, including $92 million relatedto the completion guarantee. In 2010, we made contributions of $553 million to CityCenter related to thecompletion guarantee. In 2009, we made equity contributions of $731 million to CityCenter.
We had capital expenditures of $301 million in 2011, which included $27 million at MGM China.Capital expenditures related mainly to room remodels at Bellagio and MGM Grand, restaurant remodels,theater renovations, slot machine purchases and a remodel of the high limit slots area at Bellagio. Most ofthe costs capitalized related to furniture and fixtures, materials, and external labor costs. Capitalexpenditures of $207 million in 2010 mainly related to enhancements at various resorts and the purchase ofan airplane. Capital expenditures of $137 million in 2009 consisted primarily of room remodel projects andvarious property enhancements, including capitalized interest.
Our capital expenditures fluctuate from year to year depending on our decisions with respect tostrategic capital investments in new or existing resorts and the timing of more regular capital investmentsto maintain the quality of our resorts; the amounts of which can vary depending on timing of largerremodel projects related to our public spaces and hotel rooms. In accordance with our senior credit facilitycovenants, we and our restricted subsidiaries were limited to $500 million of annual capital expenditures(as defined in the agreement governing our senior credit facility) in 2011.
In June 2011, we paid approximately $75 million to acquire an additional 1% interest in MGM Chinaand acquired cash of $482 million.
During 2011, the trust holding our 50% ownership interest in Borgata received proceeds of$330 million from treasury securities with maturities greater than 90 days and reinvested $330 million intreasury securities with maturities greater than 90 days. We did not receive distributions from the Borgatatrust in 2011. In 2010, the trust received $113 million of net distributions from Borgata and received$71 million from the sale of ground leases and underlying land. All amounts in the trust account, includingthe proceeds from the sale of our Borgata interest, will be distributed to us upon consummation of the saleof our Borgata interest. At December 31, 2011, there was $188 million in the trust account.
In 2010, we recognized $135 million of distributions from unconsolidated affiliates within investingactivities as a return of our investments, which primarily related to MGM Macau. We received a total of$192 million from MGM Macau in 2010, $59 million of which was recognized as cash flows from operatingactivities.
We received $746 million in net proceeds related to the sale of TI in 2009. The insurance recoveriesclassified as investing cash flows in 2009 relate to the Monte Carlo fire.
Cash Flows – Financing Activities
In 2011, excluding the $778 million we repaid in early January 2012 on our senior credit facility, werepaid $60 million of net debt in 2011 including $91 million repaid by MGM China under its senior creditfacility for the period from June 3, 2011 through December 31, 2011.
During the year, we repaid:
• $325 million outstanding principal amount of our 8.375% senior subordinated notes at maturity;• $129 million outstanding principal amount of our 6.375% senior notes due 2011 at maturity;• $6 million outstanding principal amount of our floating rate senior convertible debentures due
2033; and• $10 million principal amount of our 6.75% senior notes due 2012 and $22 million principal amount
of our 6.75% senior notes due 2013 in open market repurchases.
21

During 2011, we issued $300 million of 4.25% convertible senior notes due 2015 for net proceeds of$311 million, which were used to pay down borrowings under our senior credit facility.
In 2010, excluding the $1.6 billion we repaid in early January 2011 on our senior credit facility, werepaid net debt of $290 million. We issued the following senior secured, convertible senior and senior notesduring 2010:
• $1.15 billion of 4.25% convertible senior notes due 2015; we paid $81 million for capped calltransactions entered into in connection with the issuance;
• $845 million of 9% senior secured notes due 2020; and• $500 million of 10% senior notes due 2016.
In the fourth quarter of 2010, we issued approximately 47 million shares of our common stock for totalnet proceeds to us of approximately $588 million. Concurrently with our stock issuance, Tracinda soldapproximately 32 million shares of our common stock. We did not receive any proceeds from the sale ofsuch common stock by Tracinda.
We repaid the following principal amounts of senior and senior subordinated notes during 2010:
• $75 million 8.375% senior subordinated notes (redeemed prior to maturity essentially at par);• $297 million 9.375% senior notes (repaid at maturity); and• $782 million of our 8.5% senior notes (redeemed $136 million prior to maturity essentially at par
and repaid $646 million at maturity).
Excluding the $1.6 billion borrowed under the senior credit facility in late December 2009 and repaidin early January 2010, we repaid net debt of $1.1 billion in 2009. In addition, pursuant to our developmentagreement, we repaid $49 million of bonds issued by the Economic Development Corporation of the Cityof Detroit. In May 2009, we issued approximately 164.5 million shares of our common stock at $7 pershare, for total net proceeds to us of $1.2 billion.
We issued the following senior secured and senior notes during 2009:
• $650 million of 10.375% senior secured notes due 2014;• $850 million of 11.125% senior secured notes due 2017; and• $475 million of 11.375% senior notes due 2018.
We repaid the following principal amounts of senior and senior subordinated notes during 2009:
• $226 million 6.5% senior notes (redeemed $122 million prior to maturity essentially at par);• $820 million 6% senior notes (redeemed $763 million prior to maturity essentially at par and the
remaining $57 million was repaid at maturity); and• $100 million 7.25% senior debentures (redeemed prior to maturity for $127 million).
Other Factors Affecting Liquidity
Borgata settlement. As discussed in ‘‘Executive Overview,’’ we entered into a settlement agreementwith the DGE under which we will sell our 50% ownership interest in Borgata and related leased land inAtlantic City. Prior to the consummation of the sale, the divestiture trust will retain any cash flows receivedin respect of the trust property, but will pay property taxes and other costs attributable to the trust propertyto the extent that minimum trust cash balances are maintained. Prior to the settlement agreement, we hadreceived significant distributions from Borgata, and not receiving such distributions until the ultimate salecould negatively affect our liquidity in interim periods.
CityCenter completion guarantee. In January 2011, we entered into an amended completion and costoverrun guarantee in connection with CityCenter’s restated senior credit facility agreement and issuance of
22

$1.5 billion of senior secured first lien notes and senior secured second lien notes. Consistent with theprevious completion guarantee, the terms of the amended completion guarantee provide for theapplication of the then remaining $124 million of net residential proceeds from sales of condominiumproperties at CityCenter to fund construction costs, or to reimburse us for construction costs previouslyexpended; however, the timing of receipt of such proceeds is uncertain.
As of December 31, 2011, we had funded $645 million under the completion guarantee. We haverecorded a receivable from CityCenter of $110 million related to these amounts, which represents amountsreimbursable to us from CityCenter from future residential proceeds. We had a remaining estimated netobligation under the completion guarantee of $28 million which includes estimated litigation costs for theresolution of disputes with contractors as to the final construction costs and estimated amounts to be paidto contractors either through the joint venture’s extra-judicial settlement process or through the legalprocess related to the Perini litigation. Our accrual also reflects certain estimated offsets to the amountsclaimed by the contractors. CityCenter has reached, or expects to reach, settlement agreements with mostof the construction subcontractors. However, significant disputes remain with the general contractor andcertain subcontractors. Amounts claimed by such parties exceed amounts included in our completionguarantee accrual by approximately $185 million, as such amounts exceed our best estimate of our liability.Moreover, we have not accrued for any contingent payments to CityCenter related to the Harmon Hotel &Spa component, which is unlikely to be completed using the building as it now stands. See Note 11 in theaccompanying financial statements for discussion of the status of the Harmon.
We do not believe we would be responsible for funding under the completion guarantee anyadditional remediation efforts that might be required with respect to the Harmon; however, our view isbased on a number of developing factors, including with respect to on-going litigation with CityCenter’scontractors, actions by local officials and other developments related to the CityCenter venture, that aresubject to change. CityCenter’s restated senior credit facility provides that certain demolition expenses maybe funded only by equity contributions from the members of the CityCenter venture or certain specifiedextraordinary receipts (which include any proceeds from the Perini litigation). Based on current estimates,which are subject to change, we believe the demolition of the Harmon would cost approximately$31 million
Principal Debt Arrangements
Our long-term debt consists of publicly held senior, senior secured, senior subordinated andconvertible senior notes and our senior credit facility. We pay fixed rates of interest ranging from 4.25% to13% on our senior, senior secured, convertible senior and subordinated notes. At December 31, 2011, oursenior credit facility had a capacity of $3.5 billion consisting of a term loan facility of $1.8 billion and arevolving credit facility of $1.7 billion and interest was based on a LIBOR margin of 5.00%, with a LIBORfloor of 2.00%, and a base margin of 4.00%, with a base rate floor of 4.00%. We amended and restated oursenior credit facility in February 2012, see ‘‘Executive Overview’’ for more information on the amendedand restated senior credit facility.
Our senior credit facility contains certain financial and non-financial covenants, including a quarterlyminimum EBITDA test, based on a rolling 12-month EBITDA and a covenant limiting annual capitalexpenditures. Further, our senior credit facility and certain of our debt securities contain restrictivecovenants that, among other things, limit our ability to: pay dividends or distributions, repurchase or issueequity, prepay debt or make certain investments; incur additional debt or issue certain disqualified stockand preferred stock; incur liens on assets; pledge or sell assets or consolidate with another company or sellall or substantially all assets; enter into transactions with affiliates; allow certain subsidiaries to transferassets; and enter into sale and lease-back transactions. We are in compliance with all covenants, includingfinancial covenants, under our senior credit facilities as of December 31, 2011.
At December 31, 2011, we and our restricted subsidiaries were required under the senior credit facilityto maintain a minimum trailing annual EBITDA (as defined in the agreement governing our senior credit
23

facility) of $1.2 billion as of December 31, 2011. EBITDA for the trailing twelve months endedDecember 31, 2011 calculated in accordance with the terms of the senior credit facility was $1.28 billion.Additionally, we and our restricted subsidiaries were limited to $500 million of annual capital expenditures(as defined) during 2011; we were in compliance with the maximum capital expenditures covenants atDecember 31, 2011. We are limited to $500 million of capital expenditures in 2012.
As of December 31, 2011, our senior credit facility allowed us to refinance indebtedness maturingprior to February 21, 2014, but limited our ability to prepay later maturing indebtedness until the extendedfacilities are paid in full. We may issue unsecured debt, equity-linked and equity securities to refinance ouroutstanding indebtedness; however, we were required to use net proceeds (a) from certain indebtednessissued in amounts in excess of $250 million (excluding amounts used to refinance indebtedness) and(b) from equity issued, other than in exchange for our indebtedness, in amounts in excess of $500 million(which limit we reached with our October 2010 stock offering) to ratably prepay the credit facilities, ineach case, in an amount equal to 50% of the net cash proceeds of such excess subject to certain limitationsunder our senior credit facility and senior note indentures. Under the restated senior credit facility we areno longer required to use net proceeds from equity offerings to prepay the restated senior credit facility.
All of our principal debt arrangements are guaranteed by each of our material subsidiaries, other thanMGM Grand Detroit, LLC, our foreign subsidiaries and their U.S. holding companies, and our insurancesubsidiaries. MGM Grand Detroit is a guarantor under the senior credit facility, but only to the extent thatMGM Grand Detroit, LLC borrows under such facility. At December 31, 2011, the outstanding amount ofborrowings related to MGM Grand Detroit, LLC was $450 million. In connection with our May 2009senior credit facility amendment, MGM Grand Detroit granted lenders a security interest in its assets tosecure its obligations under the senior credit facility. We and our subsidiaries may from time to time, in oursole discretion, purchase, repay, redeem or retire any of our outstanding debt securities, in privatelynegotiated or open market transactions, by tender offer or otherwise pursuant to authorization of ourBoard of Directors.
Also in connection with our May 2009 senior credit facility amendment, we granted a security interestin Gold Strike Tunica and certain undeveloped land on the Las Vegas Strip to secure up to $300 million ofobligations under the senior credit facility. In addition, substantially all of the assets of New York-NewYork serve as collateral for the 13% senior secured notes issued in 2008, substantially all of the assets ofBellagio and The Mirage serve as collateral for the 10.375% and 11.125% senior secured notes issued in2009, and substantially all of the assets of the MGM Grand serve as collateral for the 9.00% senior securednotes issued in 2010. Upon the issuance of the 10.375%, 11.125%, and 9.00% senior secured notes, theholders of our 13% senior secured notes due 2013 obtained an equal and ratable lien in all collateralsecuring these notes. No other assets serve as collateral for our principal debt arrangements.
MGM Grand Paradise’s credit facility is equivalent to approximately $552 million in term loans and a$400 million undrawn revolving loan at December 31, 2011, based on exchange rates at that date.Scheduled amortization on the term loan begins in July 2012 with a lump sum payment of $276 millionupon final maturity in July 2015. The revolving loan may be redrawn, but is required to be repaid in full onthe last date of the respective term loan, no later than July 2015. Interest on the term loan facility is basedon HIBOR plus a margin ranging between 3% and 4.5%, based on MGM Grand Paradise’s adjustedleverage ratio as defined in its credit facility agreement. Interest on the revolving facility can bedenominated in either Hong Kong dollars or U.S. dollars and is based on the same margin range, plusHIBOR or LIBOR, as appropriate. As of December 31, 2011, the revolving facility is denominated entirelyin Hong Kong dollars and interest is based on HIBOR plus 3%.
At December 31, 2011, MGM Grand Paradise was required to maintain a specified adjusted leverageratio at the end of each quarter while the loans are outstanding. The adjusted leverage ratio is required tobe no greater than 4.00 to 1.00 for each quarter during 2011 and no greater than 3.50 to 1.00 thereafter. Inaddition, MGM Grand Paradise is required to maintain a debt service coverage ratio of no less than 1.50 to
24

1.00 at each quarter end. At December 31, 2011, MGM Grand Paradise was in compliance with itsadjusted leverage ratio and debt service coverage ratios.
Off Balance Sheet Arrangements
Investments in unconsolidated affiliates. Our off balance sheet arrangements consist primarily ofinvestments in unconsolidated affiliates, which consist primarily of our investments in CityCenter, GrandVictoria and Silver Legacy. We have not entered into any transactions with special purpose entities, norhave we engaged in any derivative transactions. Our unconsolidated affiliate investments allow us to realizethe proportionate benefits of owning a full-scale resort in a manner that minimizes our initial investment.We have not historically guaranteed financing obtained by our investees, and there are no other provisionsof the venture agreements which we believe are unusual or subject us to risks to which we would not besubjected if we had full ownership of the resort.
Letters of credit. At December 31, 2011, we had outstanding letters of credit totaling $37 million.
Commitments and Contractual Obligations
The following table summarizes our scheduled contractual obligations as of December 31, 2011:
2012 2013 2014 2015 2016 Thereafter(In millions)
Long-term debt. . . . . . . . . . . . . . . . . . . . . . . . . . . . . . . . . . . . $ 563 $ 1,445 $ 4,565 $ 2,656 $ 1,476 $ 2,918Estimated interest payments on long-term
debt (1) . . . . . . . . . . . . . . . . . . . . . . . . . . . . . . . . . . . . . . . . . . 1,047 996 624 502 367 494Capital leases . . . . . . . . . . . . . . . . . . . . . . . . . . . . . . . . . . . . . . 1 - - - - -Operating leases. . . . . . . . . . . . . . . . . . . . . . . . . . . . . . . . . . . 18 13 7 5 4 39Tax liabilities (2) . . . . . . . . . . . . . . . . . . . . . . . . . . . . . . . . . . 29 - - - - -Long-term liabilities . . . . . . . . . . . . . . . . . . . . . . . . . . . . . . 6 5 5 4 3 28CityCenter funding commitments (3) . . . . . . . . . 28 - - - - -Other Purchase obligations
Employment agreements . . . . . . . . . . . . . . . . . . . . . 101 48 12 1 - -Entertainment agreements (4) . . . . . . . . . . . . . . . 94 - - - - -Other (5) . . . . . . . . . . . . . . . . . . . . . . . . . . . . . . . . . . . . . . . . 207 42 43 42 32 -
$ 2,094 $ 2,549 $ 5,256 $ 3,210 $ 1,882 $ 3,479
(1) Estimated interest payments are based on principal amounts and expected maturities of debt outstanding at December 31, 2011and management’s forecasted LIBOR rates for our senior credit facility and HIBOR rates for the MGM Grand Paradise creditfacility.
(2) Approximately $112 million of liabilities related to uncertain tax positions and other tax liabilities are excluded from the table aswe cannot reasonably estimate when examination and other activity related to these amounts will conclude.
(3) Under our completion guarantee for CityCenter, we are committed to fund amounts in excess of currently funded project costs.Based on current forecasted expenditures, we estimate that we will be required to fund approximately $28 million for suchguarantee, excluding future proceeds to be received from residential closings of $110 million.
(4) Our largest entertainment commitments consist of minimum contractual payments to Cirque du Soleil, which performs shows atseveral of our resorts. We are generally contractually committed for a period of 12 months based on our ability to exercisecertain termination rights; however, we expect these shows to continue for longer periods.
(5) The amount for 2011 includes approximately $114 million of open purchase orders. Other commitments are for variouscontracts, including information technology, advertising, maintenance and other service agreements.
See ‘‘Executive Overview—Liquidity and Financial Position’’ for discussion of our liquidity andfinancial position and ability to meet known obligations.
25

Critical Accounting Policies and Estimates
Management’s discussion and analysis of our results of operations and liquidity and capital resourcesare based on our consolidated financial statements. To prepare our consolidated financial statements inaccordance with accounting principles generally accepted in the United States of America, we must makeestimates and assumptions that affect the amounts reported in the consolidated financial statements. Weregularly evaluate these estimates and assumptions, particularly in areas we consider to be criticalaccounting estimates, where changes in the estimates and assumptions could have a material effect on ourresults of operations, financial position or cash flows. Senior management and the Audit Committee of theBoard of Directors have reviewed the disclosures included herein about our critical accounting estimates,and have reviewed the processes to determine those estimates. However, by their nature, judgments aresubject to an inherent degree of uncertainty and therefore actual results can differ from our estimates.
Business Combinations
We accounted for our acquisition of MGM China in June 2011 as a business combination and havehistorically had significant acquisitions accounted for as business combinations. In a business combination,we determine the fair value of acquired assets, including identifiable intangible assets, assumed liabilities,and noncontrolling interests. The fair value of the acquired business is allocated to the acquired assets,assumed liabilities, and noncontrolling interests based on their fair value, with any remaining fair valueallocated to goodwill. This allocation process requires use of estimates and assumptions, includingestimates of future cash flows to be generated by the acquired assets. Identifiable finite-life intangibleassets, such as certain license rights and customer lists, are amortized over the intangible asset’s estimateduseful life. The method of amortization reflects the pattern in which the economic benefits of theintangible asset are consumed if determinable, normally estimated based on estimated future cash flows ofthe intangible asset. Goodwill, as well as other intangible assets determined to have indefinite lives, are notamortized, but are reviewed for impairment as discussed further below.
Allowance for Doubtful Casino Accounts Receivable
Marker play represents a significant portion of the table games volume at Aria, Bellagio, MGMGrand Las Vegas and The Mirage. In addition, MGM China extends credit to certain in house gamingcustomers and gaming promoters. Our other facilities do not emphasize marker play to the same extent,although we offer markers to customers at those casinos as well. We maintain strict controls over theissuance of markers and aggressively pursue collection from those customers who fail to pay their markerbalances timely. These collection efforts are similar to those used by most large corporations when dealingwith overdue customer accounts, including the mailing of statements and delinquency notices, personalcontacts, the use of outside collection agencies and civil litigation. Markers are generally legallyenforceable instruments in the United States and Macau. At December 31, 2011 and 2010, approximately28% and 36%, respectively, of our casino accounts receivable was owed by customers from the UnitedStates. Markers are not legally enforceable instruments in some foreign countries, but the United Statesassets of foreign customers may be reached to satisfy judgments entered in the United States. AtDecember 31, 2011 and 2010, approximately 61% and 51%, respectively, of our casino accounts receivablewas owed by customers from the Far East. We consider the likelihood and difficulty of enforceability,among other factors, when we issue credit to customers who are not residents of the United States.
We maintain an allowance, or reserve, for doubtful casino accounts at all of our operating casinoresorts. The provision for doubtful accounts, an operating expense, increases the allowance for doubtfulaccounts. We regularly evaluate the allowance for doubtful casino accounts. At resorts where marker playis not significant, the allowance is generally established by applying standard reserve percentages to agedaccount balances. At resorts where marker play is significant, we apply standard reserve percentages toaged account balances under a specified dollar amount and specifically analyze the collectibility of eachaccount with a balance over the specified dollar amount, based on the age of the account, the customer’s
26

financial condition, collection history and any other known information. We also monitor regional andglobal economic conditions and forecasts to determine if reserve levels are adequate.
In addition to enforceability issues, the collectibility of unpaid markers given by foreign customers isaffected by a number of factors, including changes in currency exchange rates and economic conditions inthe customers’ home countries. Because individual customer account balances can be significant, theallowance and the provision can change significantly between periods, as information about a certaincustomer becomes known or as changes in a region’s economy occur.
The following table shows key statistics related to our casino receivables:
At December 31,2011 2010 2009
(In thousands)
Casino receivables. . . . . . . . . . . . . . . . . . . . . . . . . . . . . . . . . . . . . . . . . . . . . . . . . . . . . . . . $ 347,679 $ 229,318 $ 261,025Allowance for doubtful casino accounts receivable . . . . . . . . . . . . . . . . 94,800 85,547 88,557Allowance as a percentage of casino accounts receivable . . . . . . . . 27% 37% 34%Percentage of casino accounts outstanding over 180 days . . . . . . . . 18% 28% 24%
Approximately $87 million of casino receivables and $21 million of the allowance for doubtful casinoaccounts receivable relate to MGM China at December 31, 2011. The allowance for doubtful accounts as apercentage of casino accounts receivable has decreased in the current year due to improved aging ofaccounts and improved collections. At December 31, 2011, a 100 basis-point change in the allowance fordoubtful accounts as a percentage of casino accounts receivable would change pre-tax net income by$3 million, or less than $0.01 per share.
Fixed Asset Capitalization and Depreciation Policies
Property and equipment are stated at cost. For the majority of our property and equipment, cost hasbeen determined based on estimated fair values in connection with the June 2011 MGM China acquisition,the April 2005 Mandalay acquisition and the May 2000 Mirage Resorts acquisition. Maintenance andrepairs that neither materially add to the value of the property nor appreciably prolong its life are chargedto expense as incurred. Depreciation and amortization are provided on a straight-line basis over theestimated useful lives of the assets. When we construct assets, we capitalize direct costs of the project,including fees paid to architects and contractors, property taxes, and certain costs of our design andconstruction subsidiaries. In addition, interest cost associated with major development and constructionprojects is capitalized as part of the cost of the project. Interest is typically capitalized on amountsexpended on the project using the weighted-average cost of our outstanding borrowings, since we typicallydo not borrow funds directly related to a development project. Capitalization of interest starts whenconstruction activities begin and ceases when construction is substantially complete or developmentactivity is suspended for more than a brief period.
We must make estimates and assumptions when accounting for capital expenditures. Whether anexpenditure is considered a maintenance expense or a capital asset is a matter of judgment. Whenconstructing or purchasing assets, we must determine whether existing assets are being replaced orotherwise impaired, which also may be a matter of judgment. In addition, our depreciation expense ishighly dependent on the assumptions we make about our assets’ estimated useful lives. We determine theestimated useful lives based on our experience with similar assets, engineering studies, and our estimate ofthe usage of the asset. Whenever events or circumstances occur which change the estimated useful life ofan asset, we account for the change prospectively.
27

Impairment of Long-lived Assets, Goodwill and Indefinite-lived Intangible Assets
We evaluate our property and equipment and other long-lived assets for impairment based on ourclassification as a) held for sale or b) to be held and used. Several criteria must be met before an asset isclassified as held for sale, including that management with the appropriate authority commits to a plan tosell the asset at a reasonable price in relation to its fair value and is actively seeking a buyer. For assetsclassified as held for sale, we recognize the asset at the lower of carrying value or fair market value lesscosts of disposal, as estimated based on comparable asset sales, offers received, or a discounted cash flowmodel. For assets to be held and used, we review for impairment whenever indicators of impairment exist.We then compare the estimated future cash flows of the asset, on an undiscounted basis, to the carryingvalue of the asset. If the undiscounted cash flows exceed the carrying value, no impairment is indicated. Ifthe undiscounted cash flows do not exceed the carrying value, then an impairment is recorded based on thefair value of the asset, typically measured using a discounted cash flow model. If an asset is still underdevelopment, future cash flows include remaining construction costs. All recognized impairment losses,whether for assets to be held for sale or assets to be held and used, are recorded as operating expenses.
There are several estimates, assumptions and decisions in measuring impairments of long-lived assets.First, management must determine the usage of the asset. To the extent management decides that an assetwill be sold, it is more likely that an impairment may be recognized. Assets must be tested at the lowestlevel for which identifiable cash flows exist. This means that some assets must be grouped, andmanagement has some discretion in the grouping of assets. Future cash flow estimates are, by their nature,subjective and actual results may differ materially from our estimates.
On a quarterly basis, we review our major long-lived assets to determine if events have occurred orcircumstances exist that indicate a potential impairment. Potential factors which could trigger animpairment include underperformance compared to historical or projected operating results, negativeindustry or economic factors, or significant changes to our operating environment. We estimate future cashflows using our internal budgets. When appropriate, we discount future cash flows using a weighted-average cost of capital, developed using a standard capital asset pricing model, based on guidelinecompanies in our industry.
We review indefinite-lived intangible assets and goodwill at least annually and between annual testdates in certain circumstances. We perform our annual impairment test for indefinite-lived intangibleassets and goodwill in the fourth quarter of each fiscal year. Indefinite-lived intangible assets consistprimarily of license rights, which are tested for impairment using a discounted cash flow approach, andtrademarks, which are tested for impairment using the relief-from-royalty method. Goodwill represents theexcess of purchase price over fair market value of net assets acquired in business combinations. Goodwillfor relevant reporting units is tested for impairment using a discounted cash flow analysis based on ourbudgeted future results discounted using a weighted average cost of capital, developed using a standardcapital asset pricing model based on guideline companies in our industry, and market indicators ofterminal year capitalization rates. As of the date we completed our 2011 goodwill impairment analysis, theestimated fair values of our reporting units with associated goodwill were substantially in excess of theircarrying values for all our reporting units with goodwill except for Railroad Pass, for which we wrote off$5 million of goodwill in 2011, and MGM China. As discussed in ‘‘Executive Overview’’ we acquired acontrolling interest in MGM China in June 2011. We recorded $2.8 billion of goodwill in connection withthis acquisition. As of the date of our goodwill impairment test in the fourth quarter, which was less than ayear from our original valuation completed in connection with the acquisition, we determined that the fairvalue of our MGM China reporting unit is slightly in excess of its carrying value, therefore no impairmentwas indicated. As discussed below, management makes significant judgments and estimates as part of theseanalyses. If future operating results for MGM China do not meet our current expectations, we may berequired to record an impairment charge related to the MGM China goodwill.
28
There are several estimates inherent in evaluating these assets for impairment. In particular, futurecash flow estimates are, by their nature, subjective and actual results may differ materially from ourestimates. In addition, the determination of capitalization rates and the discount rates used in theimpairment tests are highly judgmental and dependent in large part on expectations of future marketconditions.
See ‘‘Executive Overview’’ and ‘‘Results of Operations’’ for discussion of write-downs andimpairments of long-lived assets, goodwill and intangible assets. Other than mentioned therein, we are notaware of events or circumstances through December 31, 2011 that would cause us to review any materiallong-lived assets, goodwill or indefinite-lived intangible assets for impairment.
Impairment of Investments in Unconsolidated Affiliates
We evaluate our investments in unconsolidated affiliates for impairment whenever events or changesin circumstances indicate that the carrying value of our investment may have experienced an‘‘other-than-temporary’’ decline in value. If such conditions exist, we compare the estimated fair value ofthe investment to its carrying value to determine whether an impairment is indicated and determinewhether the impairment is ‘‘other-than-temporary’’ based on our assessment of relevant factors, includingconsideration of our intent and ability to retain our investment. We estimate fair value using a discountedcash flow analysis based on estimates of future cash flows and market indicators of discount rates andterminal year capitalization rates. See ‘‘Executive Overview’’ and ‘‘Results of Operations’’ for discussion ofimpairment charges related to our investments in CityCenter, Borgata and Silver Legacy.
Income Taxes
We recognize deferred tax assets, net of applicable reserves, related to net operating losscarryforwards and certain temporary differences with a future tax benefit to the extent that realization ofsuch benefit is more likely than not. Otherwise, a valuation allowance is applied. Except for certain statedeferred tax assets, a foreign tax credit carryforward for U.S. income tax purposes and certain Macaudeferred assets, we believe that it is more likely than not that our deferred tax assets are fully realizablebecause of the future reversal of existing taxable temporary differences. Given the negative impact of theU.S. economy on the results of our operations in the past several years and our expectations that ourrecovery will be tempered by certain aspects of the current economic conditions such as weaknesses inemployment conditions and the housing market, we no longer rely on future domestic operating income inassessing the realizability of our domestic deferred tax assets and now rely only on the future reversal ofexisting domestic taxable temporary differences. Since the future reversal of existing U.S. federal taxabletemporary differences currently exceeds the future reversal of existing U.S. federal deductible temporarydifferences, we continue to conclude that it is more likely than not that our U.S federal deferred tax assetsas of December 31, 2011, other than the foreign tax credit carryforward, are realizable. We anticipate thatthe future reversal of our U.S. federal deductible temporary differences could exceed the future reversal ofour U.S. federal taxable temporary differences as early as the first quarter of 2012, in which case we wouldrecord a valuation allowance for such excess with a corresponding reduction of federal income tax benefiton our statement of operations.
Our income tax returns are subject to examination by the Internal Revenue Service (‘‘IRS’’) and othertax authorities. Positions taken in tax returns are sometimes subject to uncertainty in the tax laws and maynot ultimately be accepted by the IRS or other tax authorities.
We assess our tax positions using a two-step process. A tax position is recognized if it meets a ‘‘morelikely than not’’ threshold, and is measured at the largest amount of benefit that is greater than 50 percentlikely of being realized. We review uncertain tax positions at each balance sheet date. Liabilities we recordas a result of this analysis are recorded separately from any current or deferred income tax accounts, andare classified as current (‘‘Other accrued liabilities’’) or long-term (‘‘Other long-term liabilities’’) based on
29

the time until expected payment. Additionally, we recognize accrued interest and penalties, if any, relatedto unrecognized tax benefits in income tax expense.
We file income tax returns in the U.S. federal jurisdiction, various state and local jurisdictions, andforeign jurisdictions, although the taxes paid in foreign jurisdictions are not material.
As of December 31, 2011, we were no longer subject to examination of our U.S. consolidated federalincome tax returns filed for years ended prior to 2005. The IRS completed its examination of ourconsolidated federal income tax returns for the 2003 and 2004 tax years during 2010 and we paid$12 million in tax and $4 million in associated interest with respect to adjustments to which we agreed. Inaddition, we submitted a protest to IRS Appeals of certain adjustments to which we do not agree. Weexpect the issues subject to appeal will be settled within the next 12 months. During the fourth quarter of2010, the IRS opened an examination of our consolidated federal income tax returns for the 2005 through2009 tax years. It is reasonably possible that the IRS will complete this examination within the next12 months and we may agree to certain adjustments and protest others.
During the first quarter of 2011, the IRS opened audits of the 2007 through 2008 tax years ofCityCenter Holdings LLC, an unconsolidated affiliate treated as a partnership for income tax purposes andthe 2008 through 2009 tax years of MGM Grand Detroit LLC, a subsidiary treated as a partnership forincome tax purposes. It is reasonably possible that the IRS will complete these examinations within thenext 12 months and we may agree to certain adjustments and protest others.
We reached settlement during 2010 with IRS Appeals with respect to the audit of the 2004 through2006 tax years of MGM Grand Detroit, LLC. At issue was the tax treatment of payments made under anagreement to develop, own and operate a hotel casino in the City of Detroit. We agreed to pay $1 millionin tax for such years as a result of this settlement.
During the fourth quarter of 2010, a tentative settlement was reached with IRS Appeals with respectto the audit of the 2003 and 2004 tax years of a cost method investee of ours that is treated as a partnershipfor income tax purposes. The adjustments to which we agreed in such tentative settlement will be includedin any settlement that we may reach with respect to the 2003 and 2004 examination of our consolidatedfederal income tax return. The IRS is currently auditing the 2005 through 2009 tax years of this investee. Itis reasonably possible that the IRS will complete these examinations within the next 12 months and we mayagree to certain adjustments and protest others.
The IRS closed during 2010 its examination of the federal income tax return of Mandalay ResortGroup for the pre-acquisition year ended April 25, 2005 and issued a ‘‘No-Change Letter.’’ The statutes oflimitations for assessing tax for all Mandalay Resort Group pre-acquisition years are now closed.
As of December 31, 2011, other than the exceptions noted below, we were no longer subject toexamination of our various state and local tax returns filed for years ended prior to 2007. The state ofIllinois during 2010 initiated an audit of our Illinois combined returns for the 2006 and 2007 tax years. Weexpect that this audit will close and all issues will be settled in the next 12 months. The state of New Jerseybegan audit procedures during 2010 of a cost method investee of ours for the 2003 through 2006 tax years.No other state or local income tax returns of ours are currently under exam.
Stock-based Compensation
We account for stock options and stock appreciation rights (‘‘SARs’’) measuring fair value using theBlack-Scholes model. For restricted stock units, compensation expense is calculated based on the fairmarket value of our stock on the date of grant. There are several management assumptions required todetermine the inputs into the Black-Scholes model. Our volatility and expected term assumptions cansignificantly affect the fair value of stock options and SARs. The extent of the impact will depend, in part,on the extent of awards in any given year.
30
2005 Omnibus Incentive Plan. In 2011, we granted 3.5 million SARs with a total fair value of$19 million. In 2010, we granted 3.8 million SARs with a total fair value of $27 million. In 2009, we granted6.8 million SARs with a total fair value of $37 million.
For 2011 awards, a 10% change in the volatility assumption (72% for 2011; for sensitivity analysis,volatility was assumed to be 65% and 79%) would have resulted in a $1.5 million, or 8%, change in fairvalue. A 10% change in the expected term assumption (4.9 years for 2011; for sensitivity analysis, expectedterm was assumed to be 4.4 years and 5.4 years) would have resulted in a $1 million, or 4%, change in fairvalue. These changes in fair value would have been recognized over the four year vesting period of suchawards. It should be noted that a change in the expected term would cause other changes, since therisk-free rate and volatility assumptions are specific to the term; we did not attempt to adjust thoseassumptions in performing the sensitivity analysis above.
MGM China Share Option Plan. In 2011, MGM China granted 19.3 million stock options with a totalfair value of $24 million. For 2011 awards, a 10% change in the volatility assumption (60% for 2011; forsensitivity analysis, volatility was assumed to be 54% and 66%) would have resulted in a $1.8 million, or7%, change in fair value. A 10% change in the expected term assumption (8 years for 2011; for sensitivityanalysis, expected term was assumed to be 7.2 years and 8.8 years) would have resulted in a $1 million, or4%, change in fair value. These changes in fair value would have been recognized over the four yearvesting period of such awards. It should be noted that a change in the expected term would cause otherchanges, since the risk-free rate is specific to the term; we did not attempt to adjust those assumptions inperforming the sensitivity analysis above.
Recently Issued Accounting Standards
Certain amendments to Accounting Standards Codification (‘‘ASC’’) 820, ‘‘Fair ValueMeasurements,’’ will become effective for us for fiscal years beginning after December 15, 2011. Suchamendments included a consistent definition of fair value, enhanced disclosure requirements for ‘‘Level 3’’fair value adjustments and other changes to required disclosures. We will comply with the disclosureenhancements of this amendment when the amendment becomes effective. We do not expect thisamendment to have a material effect on our financial statements.
In June 2011, ASC 220, ‘‘Comprehensive Income,’’ was amended and will become effective for us forfiscal years beginning after December 15, 2011, including retrospective adjustment. Such amendmentsallow us two options for the presentation of comprehensive income. Under either option, we are requiredto present each component of net income along with total net income, each component of othercomprehensive income along with a total for other comprehensive income, and a total amount forcomprehensive income. As a result of the amendment, the option to present the components of othercomprehensive income as part of the statement of changes in stockholders’ equity is eliminated. We willcomply with the disclosure enhancements of this amendment when the amendment becomes effective. Wedo not expect this amendment to have a material effect on our financial statements.
In September 2011, ASC 350, ‘‘Intangibles-Goodwill and Others,’’ was amended to simplify theassessment of goodwill impairment and will become effective for us for fiscal years beginning afterDecember 15, 2011. The amended guidance allows us to do an initial qualitative assessment of relativeevents and circumstances to determine if fair value of a reporting unit is more likely than not less than itscarrying value, prior to performing the two-step quantitative goodwill impairment test. We will comply withthe disclosure enhancements of this amendment when the amendment becomes effective. We do notexpect this amendment to have a material effect on our financial statements.
Market Risk
In addition to the inherent risks associated with our normal operations, we are also exposed toadditional market risks. Market risk is the risk of loss arising from adverse changes in market rates and
31

prices, such as interest rates and foreign currency exchange rates. Our primary exposure to market risk isinterest rate risk associated with our variable rate long-term debt. We attempt to limit our exposure tointerest rate risk by managing the mix of our long-term fixed rate borrowings and short-term borrowingsunder our bank credit facilities. A change in interest rates generally does not have an impact upon ourfuture earnings and cash flow for fixed-rate debt instruments. As fixed-rate debt matures, however, and ifadditional debt is acquired to fund the debt repayment, future earnings and cash flow may be affected bychanges in interest rates. This effect would be realized in the periods subsequent to the periods when thedebt matures. We do not hold or issue financial instruments for trading purposes and do not enter intoderivative transactions that would be considered speculative positions.
As of December 31, 2011, long-term variable rate borrowings represented approximately 28% of ourtotal borrowings. Assuming a 100 basis-point increase in LIBOR over the 2% floor specified in our seniorcredit facility, our annual interest cost would change by approximately $33 million based on gross amountsoutstanding at December 31, 2011. Assuming a 100 basis-point increase in HIBOR for the MGM GrandParadise credit facility, our annual interest cost would change by approximately $6 million based onamounts outstanding at December 31, 2011. The following table provides additional information about ourgross long-term debt subject to changes in interest rates:
Fair ValueDebt maturing in, December 31,2012 2013 2014 2015 2016 Thereafter Total 2011
(In millions)Fixed rate . . . . . . . . . . . . . . . . . . . . . $ 535 $ 1,362 $ 1,158 $ 2,325 $ 1,476 $ 2,918 $ 9,774 $ 10,017Average interest rate . . . . . . . . 6.8% 10.3% 8.4% 5.1% 8.2% 9.7% 8.1%Variable rate. . . . . . . . . . . . . . . . . . $ 28 $ 83 $ 3,407 $ 331 $ - $ - $ 3,849 $ 3,692Average interest rate . . . . . . . . 3.2% 3.2% 6.9% 3.2% N/A N/A 6.5%
32
MANAGEMENT’S ANNUAL REPORTON INTERNAL CONTROL OVER FINANCIAL REPORTING
Management’s Responsibilities
Management is responsible for establishing and maintaining adequate internal control over financialreporting (as defined in Sections 13a- 15(f) and 15d- 15(f) of the Exchange Act) for MGM ResortsInternational and subsidiaries (the ‘‘Company’’).
Objective of Internal Control over Financial Reporting
In establishing adequate internal control over financial reporting, management has developed andmaintained a system of internal control, policies and procedures designed to provide reasonable assurancethat information contained in the accompanying consolidated financial statements and other informationpresented in this annual report is reliable, does not contain any untrue statement of a material fact or omitto state a material fact, and fairly presents in all material respects the financial condition, results ofoperations and cash flows of the Company as of and for the periods presented in this annual report. Theseinclude controls and procedures designed to ensure that this information is accumulated andcommunicated to the Company’s management, including its principal executive officer and principalfinancial officer, as appropriate to all timely decisions regarding required disclosure. Significant elementsof the Company’s internal control over financial reporting include, for example:
• Hiring skilled accounting personnel and training them appropriately;• Written accounting policies;• Written documentation of accounting systems and procedures;• Segregation of incompatible duties;• Internal audit function to monitor the effectiveness of the system of internal control;• Oversight by an independent Audit Committee of the Board of Directors.
Management’s Evaluation
Management, with the participation of the Company’s principal executive officer and principalfinancial officer, has evaluated the Company’s internal control over financial reporting using the criteriaestablished in Internal Control—Integrated Framework issued by the Committee of SponsoringOrganizations of the Treadway Commission. In making its assessment of changes in internal control overfinancial reporting as of December 31, 2011, the Company has excluded the MGM China operationsbecause these operations were acquired in a business combination on June 3, 2011. These operationsrepresent approximately 33% of the Company’s total assets at December 31, 2011 and approximately 20%of its total net revenues for the year ended December 31, 2011. The Company intends to disclose anymaterial changes in internal control over financial reporting with respect to the MGM China operations inthe first annual assessment of internal control over financial reporting in which it is required to includeMGM China.
Based on its evaluation as of December 31, 2011, management believes that the Company’s internalcontrol over financial reporting is effective in achieving the objectives described above.
Report of Independent Registered Public Accounting Firm
Deloitte & Touche LLP audited the Company’s consolidated financial statements as of and for theyear ended December 31, 2011 and issued their report thereon, which is included in this annual report.Deloitte & Touche LLP has also issued an attestation report on the effectiveness of the Company’s internalcontrol over financial reporting and such report is also included in this annual report.
33

REPORT OF INDEPENDENT REGISTERED PUBLIC ACCOUNTING FIRM
To the Board of Directors and Stockholdersof MGM Resorts International
We have audited the internal control over financial reporting of MGM Resorts International andsubsidiaries (the ‘‘Company’’) as of December 31, 2011, based on criteria established in Internal Control—Integrated Framework issued by the Committee of Sponsoring Organizations of the TreadwayCommission. As described in Management’s Annual Report on Internal Control Over FinancialReporting, management excluded from its assessment the internal control over financial reporting atMGM China Holdings Limited, which was acquired on June 3, 2011 and whose financial statementsconstitute 78.4% and 32.6% of net and total assets, respectively, 19.6% of revenues, and 7.4% of netincome of the consolidated financial statement amounts as of and for the year ended December 31, 2011.Accordingly, our audit did not include the internal control over financial reporting at MGM ChinaHoldings Limited. The Company’s management is responsible for maintaining effective internal controlover financial reporting and for its assessment of the effectiveness of internal control over financialreporting, included in the accompanying Management’s Annual Report on Internal Control OverFinancial Reporting. Our responsibility is to express an opinion on the effectiveness of the Company’sinternal control over financial reporting based on our audit.
We conducted our audit in accordance with the standards of the Public Company AccountingOversight Board (United States). Those standards require that we plan and perform the audit to obtainreasonable assurance about whether effective internal control over financial reporting was maintained inall material respects. Our audit included obtaining an understanding of internal control over financialreporting, assessing the risk that a material weakness exists, testing and evaluating the design andoperating effectiveness of internal control based on the assessed risk, and performing such otherprocedures as we considered necessary in the circumstances. We believe that our audit provides areasonable basis for our opinion.
A company’s internal control over financial reporting is a process designed by, or under thesupervision of, the company’s principal executive and principal financial officers, or persons performingsimilar functions, and effected by the company’s board of directors, management, and other personnel toprovide reasonable assurance regarding the reliability of financial reporting and the preparation offinancial statements for external purposes in accordance with generally accepted accounting principles. Acompany’s internal control over financial reporting includes those policies and procedures that (1) pertainto the maintenance of records that, in reasonable detail, accurately and fairly reflect the transactions anddispositions of the assets of the company; (2) provide reasonable assurance that transactions are recordedas necessary to permit preparation of financial statements in accordance with generally acceptedaccounting principles, and that receipts and expenditures of the company are being made only inaccordance with authorizations of management and directors of the company; and (3) provide reasonableassurance regarding prevention or timely detection of unauthorized acquisition, use, or disposition of thecompany’s assets that could have a material effect on the financial statements.
Because of the inherent limitations of internal control over financial reporting, including thepossibility of collusion or improper management override of controls, material misstatements due to erroror fraud may not be prevented or detected on a timely basis. Also, projections of any evaluation of theeffectiveness of the internal control over financial reporting to future periods are subject to the risk thatthe controls may become inadequate because of changes in conditions, or that the degree of compliancewith the policies or procedures may deteriorate.
In our opinion, the Company maintained, in all material respects, effective internal control overfinancial reporting as of December 31, 2011, based on the criteria established in Internal Control—Integrated Framework issued by the Committee of Sponsoring Organizations of the TreadwayCommission.
We have also audited, in accordance with the standards of the Public Company Accounting OversightBoard (United States), the consolidated financial statements as of and for the year ended December 31,2011. Our report dated February 29, 2012 expressed an unqualified opinion on those financial statements.
/s/ DELOITTE & TOUCHE LLP
Las Vegas, NevadaFebruary 29, 2012
34

REPORT OF INDEPENDENT REGISTERED PUBLIC ACCOUNTING FIRM
To the Board of Directors and Stockholdersof MGM Resorts International
We have audited the accompanying consolidated balance sheets of MGM Resorts International andsubsidiaries (the ‘‘Company’’) as of December 31, 2011 and 2010, and the related consolidated statementsof operations, stockholders’ equity, and cash flows for each of the three years in the period endedDecember 31, 2011. These financial statements are the responsibility of the Company’s management. Ourresponsibility is to express an opinion on the financial statements based on our audits.
We conducted our audits in accordance with the standards of the Public Company AccountingOversight Board (United States). Those standards require that we plan and perform the audit to obtainreasonable assurance about whether the financial statements are free of material misstatement. An auditincludes examining, on a test basis, evidence supporting the amounts and disclosures in the financialstatements. An audit also includes assessing the accounting principles used and significant estimates madeby management, as well as evaluating the overall financial statement presentation. We believe that ouraudits provide a reasonable basis for our opinion.
In our opinion, such consolidated financial statements present fairly, in all material respects, thefinancial position of MGM Resorts International and subsidiaries as of December 31, 2011 and 2010, andthe results of their operations and their cash flows for each of the three years in the period endedDecember 31, 2011, in conformity with accounting principles generally accepted in the United States ofAmerica.
We have also audited, in accordance with the standards of the Public Company Accounting OversightBoard (United States), the Company’s internal control over financial reporting as of December 31, 2011,based on the criteria established in Internal Control—Integrated Framework issued by the Committee ofSponsoring Organizations of the Treadway Commission and our report dated February 29, 2012, expressedan unqualified opinion on the Company’s internal control over financial reporting.
/s/ DELOITTE & TOUCHE LLP
Las Vegas, NevadaFebruary 29, 2012
35

MGM RESORTS INTERNATIONAL AND SUBSIDIARIESCONSOLIDATED BALANCE SHEETS
(In thousands, except share data)
At December 31,2011 2010
ASSETSCurrent assets
Cash and cash equivalents . . . . . . . . . . . . . . . . . . . . . . . . . . . . . . . . . . . . . . . . . . . . . . . . . . . . . $ 1,865,913 $ 498,964Accounts receivable, net. . . . . . . . . . . . . . . . . . . . . . . . . . . . . . . . . . . . . . . . . . . . . . . . . . . . . . . . 491,730 321,894Inventories . . . . . . . . . . . . . . . . . . . . . . . . . . . . . . . . . . . . . . . . . . . . . . . . . . . . . . . . . . . . . . . . . . . . . . . . 112,735 96,392Income tax receivable . . . . . . . . . . . . . . . . . . . . . . . . . . . . . . . . . . . . . . . . . . . . . . . . . . . . . . . . . . . - 175,982Deferred income taxes . . . . . . . . . . . . . . . . . . . . . . . . . . . . . . . . . . . . . . . . . . . . . . . . . . . . . . . . . . 91,060 110,092Prepaid expenses and other. . . . . . . . . . . . . . . . . . . . . . . . . . . . . . . . . . . . . . . . . . . . . . . . . . . . 251,282 252,321
Total current assets . . . . . . . . . . . . . . . . . . . . . . . . . . . . . . . . . . . . . . . . . . . . . . . . . . . . . . . . . . . 2,812,720 1,455,645
Property and equipment, net . . . . . . . . . . . . . . . . . . . . . . . . . . . . . . . . . . . . . . . . . . . . . . . . . . . . . 14,866,644 14,554,350
Other assetsInvestments in and advances to unconsolidated affiliates . . . . . . . . . . . . . . . . 1,635,572 1,923,155Goodwill . . . . . . . . . . . . . . . . . . . . . . . . . . . . . . . . . . . . . . . . . . . . . . . . . . . . . . . . . . . . . . . . . . . . . . . . . . . 2,896,609 77,156Other intangible assets, net . . . . . . . . . . . . . . . . . . . . . . . . . . . . . . . . . . . . . . . . . . . . . . . . . . . . 5,048,117 342,804Other long-term assets, net . . . . . . . . . . . . . . . . . . . . . . . . . . . . . . . . . . . . . . . . . . . . . . . . . . . . 506,614 598,738
Total other assets . . . . . . . . . . . . . . . . . . . . . . . . . . . . . . . . . . . . . . . . . . . . . . . . . . . . . . . . . . . . . 10,086,912 2,941,853
$ 27,766,276 $ 18,951,848
LIABILITIES AND STOCKHOLDERS’ EQUITY
Current liabilitiesAccounts payable . . . . . . . . . . . . . . . . . . . . . . . . . . . . . . . . . . . . . . . . . . . . . . . . . . . . . . . . . . . . . . . . $ 170,994 $ 167,084Income taxes payable . . . . . . . . . . . . . . . . . . . . . . . . . . . . . . . . . . . . . . . . . . . . . . . . . . . . . . . . . . . 7,611 -Accrued interest on long-term debt . . . . . . . . . . . . . . . . . . . . . . . . . . . . . . . . . . . . . . . . . . 203,422 211,914Other accrued liabilities . . . . . . . . . . . . . . . . . . . . . . . . . . . . . . . . . . . . . . . . . . . . . . . . . . . . . . . . 1,362,737 867,223
Total current liabilities . . . . . . . . . . . . . . . . . . . . . . . . . . . . . . . . . . . . . . . . . . . . . . . . . . . . . . . 1,744,764 1,246,221
Deferred income taxes . . . . . . . . . . . . . . . . . . . . . . . . . . . . . . . . . . . . . . . . . . . . . . . . . . . . . . . . . . . . . 2,502,096 2,526,519Long-term debt . . . . . . . . . . . . . . . . . . . . . . . . . . . . . . . . . . . . . . . . . . . . . . . . . . . . . . . . . . . . . . . . . . . . . 13,470,167 12,047,698Other long-term obligations . . . . . . . . . . . . . . . . . . . . . . . . . . . . . . . . . . . . . . . . . . . . . . . . . . . . . . 167,027 199,248
Commitments and contingencies (Note 11)
Stockholders’ equityCommon stock, $.01 par value: authorized 1,000,000,000 shares;
issued and outstanding 488,834,773 and 488,513,351 shares . . . . . . . . . . 4,888 4,885Capital in excess of par value . . . . . . . . . . . . . . . . . . . . . . . . . . . . . . . . . . . . . . . . . . . . . . . . . 4,094,323 4,060,826Retained earnings (accumulated deficit) . . . . . . . . . . . . . . . . . . . . . . . . . . . . . . . . . . . . 1,981,389 (1,133,248)Accumulated other comprehensive income (loss) . . . . . . . . . . . . . . . . . . . . . . . . . 5,978 (301)
Total MGM Resorts International stockholders’ equity . . . . . . . . . . . . . . . 6,086,578 2,932,162Noncontrolling interests . . . . . . . . . . . . . . . . . . . . . . . . . . . . . . . . . . . . . . . . . . . . . . . . . . . . . . . . 3,795,644 -
Total stockholders’ equity . . . . . . . . . . . . . . . . . . . . . . . . . . . . . . . . . . . . . . . . . . . . . . . . . . . 9,882,222 2,932,162
$ 27,766,276 $ 18,951,848
The accompanying notes are an integral part of these consolidated financial statements.
36
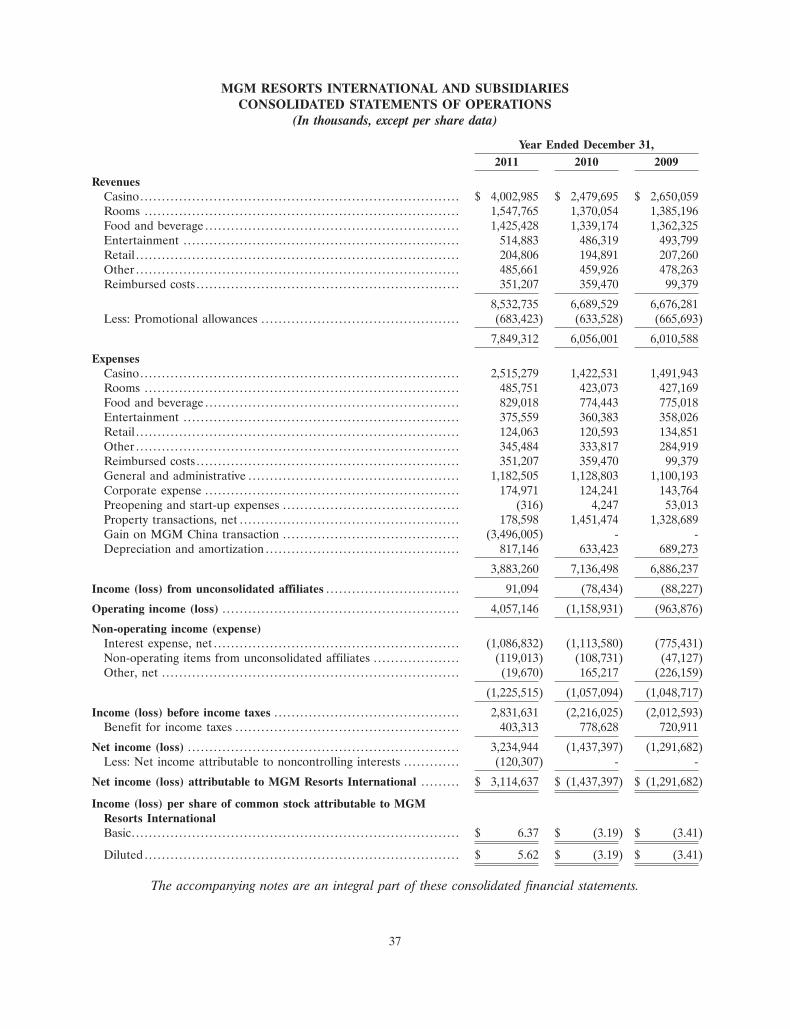
MGM RESORTS INTERNATIONAL AND SUBSIDIARIESCONSOLIDATED STATEMENTS OF OPERATIONS
(In thousands, except per share data)
Year Ended December 31,2011 2010 2009
RevenuesCasino. . . . . . . . . . . . . . . . . . . . . . . . . . . . . . . . . . . . . . . . . . . . . . . . . . . . . . . . . . . . . . . . . . . . . . . . . . $ 4,002,985 $ 2,479,695 $ 2,650,059Rooms . . . . . . . . . . . . . . . . . . . . . . . . . . . . . . . . . . . . . . . . . . . . . . . . . . . . . . . . . . . . . . . . . . . . . . . . . 1,547,765 1,370,054 1,385,196Food and beverage . . . . . . . . . . . . . . . . . . . . . . . . . . . . . . . . . . . . . . . . . . . . . . . . . . . . . . . . . . . 1,425,428 1,339,174 1,362,325Entertainment . . . . . . . . . . . . . . . . . . . . . . . . . . . . . . . . . . . . . . . . . . . . . . . . . . . . . . . . . . . . . . . . 514,883 486,319 493,799Retail . . . . . . . . . . . . . . . . . . . . . . . . . . . . . . . . . . . . . . . . . . . . . . . . . . . . . . . . . . . . . . . . . . . . . . . . . . . 204,806 194,891 207,260Other . . . . . . . . . . . . . . . . . . . . . . . . . . . . . . . . . . . . . . . . . . . . . . . . . . . . . . . . . . . . . . . . . . . . . . . . . . . 485,661 459,926 478,263Reimbursed costs . . . . . . . . . . . . . . . . . . . . . . . . . . . . . . . . . . . . . . . . . . . . . . . . . . . . . . . . . . . . . 351,207 359,470 99,379
8,532,735 6,689,529 6,676,281Less: Promotional allowances . . . . . . . . . . . . . . . . . . . . . . . . . . . . . . . . . . . . . . . . . . . . . . (683,423) (633,528) (665,693)
7,849,312 6,056,001 6,010,588
ExpensesCasino. . . . . . . . . . . . . . . . . . . . . . . . . . . . . . . . . . . . . . . . . . . . . . . . . . . . . . . . . . . . . . . . . . . . . . . . . . 2,515,279 1,422,531 1,491,943Rooms . . . . . . . . . . . . . . . . . . . . . . . . . . . . . . . . . . . . . . . . . . . . . . . . . . . . . . . . . . . . . . . . . . . . . . . . . 485,751 423,073 427,169Food and beverage . . . . . . . . . . . . . . . . . . . . . . . . . . . . . . . . . . . . . . . . . . . . . . . . . . . . . . . . . . . 829,018 774,443 775,018Entertainment . . . . . . . . . . . . . . . . . . . . . . . . . . . . . . . . . . . . . . . . . . . . . . . . . . . . . . . . . . . . . . . . 375,559 360,383 358,026Retail . . . . . . . . . . . . . . . . . . . . . . . . . . . . . . . . . . . . . . . . . . . . . . . . . . . . . . . . . . . . . . . . . . . . . . . . . . . 124,063 120,593 134,851Other . . . . . . . . . . . . . . . . . . . . . . . . . . . . . . . . . . . . . . . . . . . . . . . . . . . . . . . . . . . . . . . . . . . . . . . . . . . 345,484 333,817 284,919Reimbursed costs . . . . . . . . . . . . . . . . . . . . . . . . . . . . . . . . . . . . . . . . . . . . . . . . . . . . . . . . . . . . . 351,207 359,470 99,379General and administrative . . . . . . . . . . . . . . . . . . . . . . . . . . . . . . . . . . . . . . . . . . . . . . . . . 1,182,505 1,128,803 1,100,193Corporate expense . . . . . . . . . . . . . . . . . . . . . . . . . . . . . . . . . . . . . . . . . . . . . . . . . . . . . . . . . . . 174,971 124,241 143,764Preopening and start-up expenses . . . . . . . . . . . . . . . . . . . . . . . . . . . . . . . . . . . . . . . . . (316) 4,247 53,013Property transactions, net . . . . . . . . . . . . . . . . . . . . . . . . . . . . . . . . . . . . . . . . . . . . . . . . . . . 178,598 1,451,474 1,328,689Gain on MGM China transaction . . . . . . . . . . . . . . . . . . . . . . . . . . . . . . . . . . . . . . . . . (3,496,005) - -Depreciation and amortization . . . . . . . . . . . . . . . . . . . . . . . . . . . . . . . . . . . . . . . . . . . . . 817,146 633,423 689,273
3,883,260 7,136,498 6,886,237
Income (loss) from unconsolidated affiliates . . . . . . . . . . . . . . . . . . . . . . . . . . . . . . . 91,094 (78,434) (88,227)
Operating income (loss) . . . . . . . . . . . . . . . . . . . . . . . . . . . . . . . . . . . . . . . . . . . . . . . . . . . . . . . 4,057,146 (1,158,931) (963,876)
Non-operating income (expense)Interest expense, net . . . . . . . . . . . . . . . . . . . . . . . . . . . . . . . . . . . . . . . . . . . . . . . . . . . . . . . . . (1,086,832) (1,113,580) (775,431)Non-operating items from unconsolidated affiliates . . . . . . . . . . . . . . . . . . . . (119,013) (108,731) (47,127)Other, net . . . . . . . . . . . . . . . . . . . . . . . . . . . . . . . . . . . . . . . . . . . . . . . . . . . . . . . . . . . . . . . . . . . . . (19,670) 165,217 (226,159)
(1,225,515) (1,057,094) (1,048,717)
Income (loss) before income taxes . . . . . . . . . . . . . . . . . . . . . . . . . . . . . . . . . . . . . . . . . . . 2,831,631 (2,216,025) (2,012,593)Benefit for income taxes . . . . . . . . . . . . . . . . . . . . . . . . . . . . . . . . . . . . . . . . . . . . . . . . . . . . 403,313 778,628 720,911
Net income (loss) . . . . . . . . . . . . . . . . . . . . . . . . . . . . . . . . . . . . . . . . . . . . . . . . . . . . . . . . . . . . . . . 3,234,944 (1,437,397) (1,291,682)Less: Net income attributable to noncontrolling interests . . . . . . . . . . . . . (120,307) - -
Net income (loss) attributable to MGM Resorts International . . . . . . . . . $ 3,114,637 $ (1,437,397) $ (1,291,682)
Income (loss) per share of common stock attributable to MGMResorts InternationalBasic. . . . . . . . . . . . . . . . . . . . . . . . . . . . . . . . . . . . . . . . . . . . . . . . . . . . . . . . . . . . . . . . . . . . . . . . . . . . $ 6.37 $ (3.19) $ (3.41)
Diluted . . . . . . . . . . . . . . . . . . . . . . . . . . . . . . . . . . . . . . . . . . . . . . . . . . . . . . . . . . . . . . . . . . . . . . . . . $ 5.62 $ (3.19) $ (3.41)
The accompanying notes are an integral part of these consolidated financial statements.
37

MGM RESORTS INTERNATIONAL AND SUBSIDIARIESCONSOLIDATED STATEMENTS OF CASH FLOWS
(In thousands)
Year Ended December 31,
2011 2010 2009
Cash flows from operating activitiesNet income (loss) . . . . . . . . . . . . . . . . . . . . . . . . . . . . . . . . . . . . . . . . . . . . . . . . . . . . . . . . . . . . . . . . . . . . . . . . . . . . . . . . $ 3,234,944 $ (1,437,397) $ (1,291,682)Adjustments to reconcile net income (loss) to net cash provided by operating activities:
Depreciation and amortization . . . . . . . . . . . . . . . . . . . . . . . . . . . . . . . . . . . . . . . . . . . . . . . . . . . . . . . . . . . . . . . 817,146 633,423 689,273Amortization of debt discounts, premiums and issuance costs . . . . . . . . . . . . . . . . . . . . . . . . . . . . . 93,800 87,983 50,852(Gain) loss on retirement of long-term debt . . . . . . . . . . . . . . . . . . . . . . . . . . . . . . . . . . . . . . . . . . . . . . . . (717) (132,126) 61,563Provision for doubtful accounts . . . . . . . . . . . . . . . . . . . . . . . . . . . . . . . . . . . . . . . . . . . . . . . . . . . . . . . . . . . . . . 39,093 29,832 54,074Stock-based compensation . . . . . . . . . . . . . . . . . . . . . . . . . . . . . . . . . . . . . . . . . . . . . . . . . . . . . . . . . . . . . . . . . . . . 39,707 34,988 36,571Business interruption insurance - lost profits . . . . . . . . . . . . . . . . . . . . . . . . . . . . . . . . . . . . . . . . . . . . . . . . - - (15,115)Property transactions, net . . . . . . . . . . . . . . . . . . . . . . . . . . . . . . . . . . . . . . . . . . . . . . . . . . . . . . . . . . . . . . . . . . . . . 178,598 1,451,474 1,328,689Gain on MGM China transaction . . . . . . . . . . . . . . . . . . . . . . . . . . . . . . . . . . . . . . . . . . . . . . . . . . . . . . . . . . . . (3,496,005) - -Convertible note investment impairment . . . . . . . . . . . . . . . . . . . . . . . . . . . . . . . . . . . . . . . . . . . . . . . . . . . . - - 175,690(Income) loss from unconsolidated affiliates . . . . . . . . . . . . . . . . . . . . . . . . . . . . . . . . . . . . . . . . . . . . . . . . 27,919 190,659 188,178Distributions from unconsolidated affiliates . . . . . . . . . . . . . . . . . . . . . . . . . . . . . . . . . . . . . . . . . . . . . . . . . 60,801 92,706 93,886Change in deferred income taxes . . . . . . . . . . . . . . . . . . . . . . . . . . . . . . . . . . . . . . . . . . . . . . . . . . . . . . . . . . . . (394,437) (634,082) (344,690)Change in current assets and liabilities:
Accounts receivable. . . . . . . . . . . . . . . . . . . . . . . . . . . . . . . . . . . . . . . . . . . . . . . . . . . . . . . . . . . . . . . . . . . . . . . . . (155,043) (17,376) (121,088)Inventories . . . . . . . . . . . . . . . . . . . . . . . . . . . . . . . . . . . . . . . . . . . . . . . . . . . . . . . . . . . . . . . . . . . . . . . . . . . . . . . . . . (8,039) 5,418 6,571Income taxes receivable and payable, net . . . . . . . . . . . . . . . . . . . . . . . . . . . . . . . . . . . . . . . . . . . . . . . . . 183,649 197,986 (334,522)Prepaid expenses and other . . . . . . . . . . . . . . . . . . . . . . . . . . . . . . . . . . . . . . . . . . . . . . . . . . . . . . . . . . . . . . . . 15,268 1,647 (17,427)Accounts payable and accrued liabilities . . . . . . . . . . . . . . . . . . . . . . . . . . . . . . . . . . . . . . . . . . . . . . . . . . 32,924 11,208 37,158
Business interruption insurance recoveries . . . . . . . . . . . . . . . . . . . . . . . . . . . . . . . . . . . . . . . . . . . . . . . . . . - - 16,391Other . . . . . . . . . . . . . . . . . . . . . . . . . . . . . . . . . . . . . . . . . . . . . . . . . . . . . . . . . . . . . . . . . . . . . . . . . . . . . . . . . . . . . . . . . . . 5,518 (12,329) (26,458)
Net cash provided by operating activities . . . . . . . . . . . . . . . . . . . . . . . . . . . . . . . . . . . . . . . . . . . . . . . 675,126 504,014 587,914
Cash flows from investing activitiesCapital expenditures, net of construction payable . . . . . . . . . . . . . . . . . . . . . . . . . . . . . . . . . . . . . . . . . . . (301,244) (207,491) (136,850)Proceeds from sale of Treasure Island, net . . . . . . . . . . . . . . . . . . . . . . . . . . . . . . . . . . . . . . . . . . . . . . . . . . - - 746,266Dispositions of property and equipment . . . . . . . . . . . . . . . . . . . . . . . . . . . . . . . . . . . . . . . . . . . . . . . . . . . . . 348 77,601 22,291Acquisition of MGM China, net of cash paid . . . . . . . . . . . . . . . . . . . . . . . . . . . . . . . . . . . . . . . . . . . . . . . 407,046 - -Investments in and advances to unconsolidated affiliates . . . . . . . . . . . . . . . . . . . . . . . . . . . . . . . . . . . (128,848) (553,000) (963,685)Distributions from unconsolidated affiliates in excess of earnings . . . . . . . . . . . . . . . . . . . . . . . . . 2,212 135,058 -Distributions from cost method investments. . . . . . . . . . . . . . . . . . . . . . . . . . . . . . . . . . . . . . . . . . . . . . . . . - 113,422 -Property damage insurance recoveries . . . . . . . . . . . . . . . . . . . . . . . . . . . . . . . . . . . . . . . . . . . . . . . . . . . . . . . - - 7,186Investments in treasury securities- maturities longer than 90 days . . . . . . . . . . . . . . . . . . . . . . . . . (330,313) (149,999) -Proceeds from treasury securities- maturities longer than 90 days . . . . . . . . . . . . . . . . . . . . . . . . . 330,130 - -Other . . . . . . . . . . . . . . . . . . . . . . . . . . . . . . . . . . . . . . . . . . . . . . . . . . . . . . . . . . . . . . . . . . . . . . . . . . . . . . . . . . . . . . . . . . . (643) (1,670) (5,463)
Net cash used in investing activities. . . . . . . . . . . . . . . . . . . . . . . . . . . . . . . . . . . . . . . . . . . . . . . . . . . . . (21,312) (586,079) (330,255)
Cash flows from financing activitiesNet borrowings (repayments) under bank credit facilities – maturities of 90 days or less . . (305,880) (1,886,079) (1,027,193)Borrowings under bank credit facilities – maturities longer than 90 days . . . . . . . . . . . . . . . . . 7,559,112 9,486,223 6,771,492Repayments under bank credit facilities – maturities longer than 90 days . . . . . . . . . . . . . . . . (6,352,384) (10,807,860) (5,942,455)Issuance of senior notes . . . . . . . . . . . . . . . . . . . . . . . . . . . . . . . . . . . . . . . . . . . . . . . . . . . . . . . . . . . . . . . . . . . . . . 311,415 2,489,485 1,921,751Retirement of senior notes . . . . . . . . . . . . . . . . . . . . . . . . . . . . . . . . . . . . . . . . . . . . . . . . . . . . . . . . . . . . . . . . . . . (493,816) (1,154,479) (1,176,452)Debt issuance costs. . . . . . . . . . . . . . . . . . . . . . . . . . . . . . . . . . . . . . . . . . . . . . . . . . . . . . . . . . . . . . . . . . . . . . . . . . . . - (106,831) (112,055)Issuance of common stock in public offering, net . . . . . . . . . . . . . . . . . . . . . . . . . . . . . . . . . . . . . . . . . . . - 588,456 1,104,418Capped call transactions . . . . . . . . . . . . . . . . . . . . . . . . . . . . . . . . . . . . . . . . . . . . . . . . . . . . . . . . . . . . . . . . . . . . . . - (81,478) -Repayment of Detroit Economic Development Corporation bonds . . . . . . . . . . . . . . . . . . . . . . . - - (49,393)Other . . . . . . . . . . . . . . . . . . . . . . . . . . . . . . . . . . . . . . . . . . . . . . . . . . . . . . . . . . . . . . . . . . . . . . . . . . . . . . . . . . . . . . . . . . . (6,525) (2,615) (1,363)
Net cash provided by (used in) financing activities . . . . . . . . . . . . . . . . . . . . . . . . . . . . . . . . . . . . 711,922 (1,475,178) 1,488,750
Effect of exchange rate on cash . . . . . . . . . . . . . . . . . . . . . . . . . . . . . . . . . . . . . . . . . . . . . . . . . . . . . . . . . . . . . . . . . . . 1,213 - -
Cash and cash equivalentsNet increase (decrease) for the period . . . . . . . . . . . . . . . . . . . . . . . . . . . . . . . . . . . . . . . . . . . . . . . . . . . . . . . . . 1,366,949 (1,557,243) 1,746,409Change in cash related to assets held for sale . . . . . . . . . . . . . . . . . . . . . . . . . . . . . . . . . . . . . . . . . . . . . . . . . - - 14,154Balance, beginning of period . . . . . . . . . . . . . . . . . . . . . . . . . . . . . . . . . . . . . . . . . . . . . . . . . . . . . . . . . . . . . . . . . . . . 498,964 2,056,207 295,644
Balance, end of period . . . . . . . . . . . . . . . . . . . . . . . . . . . . . . . . . . . . . . . . . . . . . . . . . . . . . . . . . . . . . . . . . . . . . . . . . . $ 1,865,913 $ 498,964 $ 2,056,207
Supplemental cash flow disclosuresInterest paid, net of amounts capitalized . . . . . . . . . . . . . . . . . . . . . . . . . . . . . . . . . . . . . . . . . . . . . . . . . . . . . . . $ 1,001,982 $ 1,020,040 $ 807,523Federal, state and foreign income taxes paid, net of refunds . . . . . . . . . . . . . . . . . . . . . . . . . . . . . . . . . (172,018) (330,218) (53,863)
Non-cash investing and financing activitiesIncrease (decrease) in investment in CityCenter related to change in completion
guarantee liability . . . . . . . . . . . . . . . . . . . . . . . . . . . . . . . . . . . . . . . . . . . . . . . . . . . . . . . . . . . . . . . . . . . . . . . . . . . . . $ 54,352 $ 358,708 $ (55,000)
The accompanying notes are an integral part of these consolidated financial statements.
38

MGM RESORTS INTERNATIONAL AND SUBSIDIARIESCONSOLIDATED STATEMENTS OF STOCKHOLDERS’ EQUITY
For the Years ended December 31, 2011, 2010 and 2009(In thousands)
Common Retained Accumulated Total MGMStock Capital in Earnings Other Resorts Non- TotalPar Excess of Treasury (Accumulated Comprehensive Stockholders’ controlling Stockholders’
Shares Value Par Value Stock Deficit) Income (Loss) Equity Interests Equity
Balances, January 1, 2009, aspreviously reported . . . . . . . . . . . . . . . 276,507 $3,693 $4,018,410 $(3,355,963) $ 3,365,122 $ (56,901) $ 3,974,361 $ - $ 3,974,361
Prior period adjustment (seeNote 2) . . . . . . . . . . . . . . . . . . . . . . . . . . . . - - - - (66,383) - (66,383) - (66,383)
Balances, January 1, 2009, asrestated (see Note 2) . . . . . . . . . . . . . 276,507 $3,693 $4,018,410 $(3,355,963) $ 3,298,739 $ (56,901) $ 3,907,978 $ - $ 3,907,978Net loss . . . . . . . . . . . . . . . . . . . . . . . . . . . . - - - - (1,291,682) - (1,291,682) - (1,291,682)Currency translation adjustment . - - - - - 532 532 - 532Reclass M resort convertible
note valuation adjustment tocurrent earnings . . . . . . . . . . . . . . . . - - - - - 54,267 54,267 - 54,267
Other comprehensive incomefrom unconsolidated affiliate,net . . . . . . . . . . . . . . . . . . . . . . . . . . . . . . . - - - - - 165 165 - 165
Total comprehensive loss . . . . . . . . . (1,236,718) - (1,236,718)Stock-based compensation . . . . . . . - - 43,050 - - - 43,050 - 43,050Change in excess tax benefit
from stock-basedcompensation . . . . . . . . . . . . . . . . . . . - - (14,854) - - - (14,854) - (14,854)
Issuance of common stock . . . . . . . 164,450 717 (549,354) 3,355,963 (1,702,908) - 1,104,418 - 1,104,418Issuance of common stock
pursuant to stock-basedcompensation awards . . . . . . . . . . 265 2 (29) - - - (27) - (27)
Other . . . . . . . . . . . . . . . . . . . . . . . . . . . . . . - - 202 - - - 202 - 202
Balances, December 31, 2009 . . . . . . . 441,222 4,412 3,497,425 - 304,149 (1,937) 3,804,049 - 3,804,049Net loss . . . . . . . . . . . . . . . . . . . . . . . . . . . . - - - - (1,437,397) - (1,437,397) - (1,437,397)Currency translation adjustment . - - - - - 1,706 1,706 - 1,706Other comprehensive loss from
unconsolidated affiliate, net . . . - - - - - (70) (70) - (70)
Total comprehensive loss . . . . . . . . . (1,435,761) - (1,435,761)Stock-based compensation . . . . . . . - - 40,247 - - - 40,247 - 40,247Change in excess tax benefit
from stock-basedcompensation . . . . . . . . . . . . . . . . . . . - - (10,840) - - - (10,840) - (10,840)
Issuance of common stock . . . . . . . 47,035 470 587,986 - - - 588,456 - 588,456Issuance of common stock
pursuant to stock-basedcompensation awards . . . . . . . . . . 256 3 (1,248) - - - (1,245) - (1,245)
Capped call transactions. . . . . . . . . . - - (52,961) - - - (52,961) - (52,961)Other . . . . . . . . . . . . . . . . . . . . . . . . . . . . . . - - 217 - - - 217 - 217
Balances, December 31, 2010 . . . . . . . 488,513 4,885 4,060,826 - (1,133,248) (301) 2,932,162 - 2,932,162Net income . . . . . . . . . . . . . . . . . . . . . . . . - - - - 3,114,637 - 3,114,637 120,307 3,234,944Currency translation adjustment . - - - - - 6,316 6,316 5,376 11,692Other comprehensive loss from
unconsolidated affiliate, net . . . - - - - - (37) (37) - (37)
Total comprehensive income . . . . . 3,120,916 125,683 3,246,599MGM China acquisition . . . . . . . . . . - - - - - - - 3,672,173 3,672,173Stock-based compensation . . . . . . . - - 42,723 - - - 42,723 1,556 44,279Change in excess tax benefit
from stock-basedcompensation . . . . . . . . . . . . . . . . . . . - - (8,042) - - - (8,042) - (8,042)
Issuance of common stock . . . . . . . - - - - - - - - -Issuance of common stock
pursuant to stock-basedcompensation awards . . . . . . . . . . 322 3 (1,330) - - - (1,327) - (1,327)
Cash distributions tononcontrolling interest owners - - - - - - - (3,768) (3,768)
Other . . . . . . . . . . . . . . . . . . . . . . . . . . . . . . - - 146 - - - 146 - 146
Balances, December 31, 2011 . . . . . . . 488,835 $4,888 $4,094,323 $ - $ 1,981,389 $ 5,978 $ 6,086,578 $ 3,795,644 $ 9,882,222
The accompanying notes are an integral part of these consolidated financial statements.
39
MGM RESORTS INTERNATIONAL AND SUBSIDIARIESNOTES TO CONSOLIDATED FINANCIAL STATEMENTS
NOTE 1 — ORGANIZATION
Organization. MGM Resorts International (the ‘‘Company’’) is a Delaware corporation that actslargely as a holding company and, through wholly owned subsidiaries, owns and/or operates casino resorts.As of December 31, 2011, approximately 23% of the outstanding shares of the Company’s common stockwere owned by Tracinda Corporation, a Nevada corporation wholly owned by Kirk Kerkorian. TracindaCorporation has significant influence with respect to the election of directors and other matters, but it doesnot have the power to solely determine these matters. The Company has two reportable segments: whollyowned domestic resorts and MGM China. See Note 17 for additional information about the Company’ssegment information.
The Company owns and operates the following casino resorts in Las Vegas, Nevada: Bellagio, MGMGrand Las Vegas (including The Signature), The Mirage, Mandalay Bay, Luxor, New York-New York,Monte Carlo, Excalibur, and Circus Circus Las Vegas. Other Nevada operations include Circus CircusReno, Gold Strike in Jean, and Railroad Pass in Henderson. The Company and its local partners own andoperate MGM Grand Detroit in Detroit, Michigan. The Company owns and operates two resorts inMississippi: Beau Rivage in Biloxi and Gold Strike Tunica. The Company also owns Shadow Creek, anexclusive world-class golf course located approximately ten miles north of its Las Vegas Strip resorts,Primm Valley Golf Club at the California/Nevada state line and Fallen Oak golf course in Saucier,Mississippi.
The Company owns 51% and has a controlling interest in MGM China Holdings Limited (‘‘MGMChina’’), which owns MGM Grand Paradise, S.A. (‘‘MGM Grand Paradise’’), the Macau company thatowns the MGM Macau resort and casino and the related gaming subconcession and land concession. SeeNote 3 for additional information related to MGM China.
The Company owns 50% of CityCenter, located between Bellagio and Monte Carlo. The other 50% ofCityCenter is owned by Infinity World Development Corp (‘‘Infinity World’’), a wholly owned subsidiary ofDubai World, a Dubai, United Arab Emirates government decree entity. CityCenter consists of Aria, acasino resort; Mandarin Oriental Las Vegas, a non-gaming boutique hotel; Crystals, a retail, dining andentertainment district; and Vdara, a luxury condominium-hotel. In addition, CityCenter featuresresidential units in the Residences at Mandarin Oriental and Veer. The Company receives a managementfee of 2% of revenues for the management of Aria and Vdara, and 5% of EBITDA (as defined in theagreements governing the Company’s management of Aria and Vdara). In addition, the Company receivesan annual fee of $3 million for the management of Crystals.
The Company has 50% interests in Grand Victoria and Silver Legacy. Grand Victoria is a riverboatcasino in Elgin, Illinois; an affiliate of Hyatt Gaming owns the other 50% of Grand Victoria and alsooperates the resort. Silver Legacy is located in Reno, adjacent to Circus Circus Reno, and the other 50% isowned by Eldorado LLC. See Note 6 for additional information related to Silver Legacy.
MGM Hospitality seeks to leverage the Company’s management expertise and well-recognized brandsthrough strategic partnerships and international expansion opportunities. The Company has entered intomanagement agreements for hotels in the Middle East, North Africa, India and China.
Borgata. The Company has a 50% economic interest in Borgata Hotel Casino & Spa (‘‘Borgata’’)located on Renaissance Pointe in the Marina area of Atlantic City, New Jersey. Boyd Gaming Corporation(‘‘Boyd’’) owns the other 50% of Borgata and also operates the resort. The Company’s interest is held intrust and currently offered for sale pursuant to the Company’s settlement agreement with New JerseyDepartment of Gaming Enforcement (‘‘DGE’’). In March 2010, the New Jersey Casino ControlCommission (‘‘CCC’’) approved the Company’s settlement agreement with the DGE pursuant to which
40

the Company placed its 50% ownership interest in Borgata and related leased land in Atlantic City into adivestiture trust. The settlement agreement was amended on July 22, 2011 with the approval of the CCCon August 8, 2011. Following the transfer of these interests into trust, the Company ceased to be regulatedby the CCC or the DGE, except as otherwise provided by the trust agreement and the settlementagreement.
The terms of the settlement agreement, as amended, mandate the sale of the trust property by March2014, which represents an 18-month extension compared to the original agreement. During the periodending in March 2013, which also represents an 18-month extension compared to the original agreement,the Company has the right to direct the trustee to sell the trust property, subject to approval of the CCC. Ifa sale is not concluded by that time, the trustee is responsible for selling the trust property during thefollowing 12-month period. Prior to the consummation of the sale, the divestiture trust will retain any cashflows received in respect of the trust property, but will pay property taxes and other costs attributable tothe trust property. The Company is the sole economic beneficiary of the trust and will be permitted toreapply for a New Jersey gaming license beginning 30 months after the completion of the sale of the trustassets. As of December 31, 2011, the trust had $188 million of cash and investments, of which $150 millionis held in U.S. treasury securities with maturities greater than three months but less than one year, and isrecorded within ‘‘Prepaid expenses and other.’’
As a result of the Company’s ownership interest in Borgata being placed into a trust, the Company nolonger has significant influence over Borgata; therefore, the Company discontinued the equity method ofaccounting for Borgata at the point the assets were placed in the trust in March 2010, and accounts for itsinvestment in Borgata under the cost method of accounting. The carrying value of the investment relatedto Borgata is included in ‘‘Other long-term assets, net.’’ Earnings and losses that relate to the investmentthat were previously accrued remain as a part of the carrying amount of the investment. Distributionsreceived by the trust that do not exceed the Company’s share of earnings are recognized currently inearnings. However, distributions received by the trust that exceed the Company’s share of earnings forsuch periods are applied to reduce the carrying amount of its investment. The Company consolidates thetrust as it is the sole economic beneficiary. The Company did not receive any distributions from the trust in2011. The trust received net distributions from the joint venture of $113 million for the year endedDecember 31, 2010 and recorded $94 million as a reduction of the carrying value and $19 million to‘‘Other, net’’ non-operating income.
The Company recorded a pre-tax impairment charge of approximately $128 million at September 30,2010 which decreased the carrying value of its investment in Borgata to approximately $250 million. Theimpairment charge was based on an offer received from a potential buyer at that time and authorized bythe Company’s Board of Directors. The Company ultimately did not reach final agreement with suchbuyer. The Company continues to negotiate with other parties who have expressed interest in the asset, butcan provide no assurance that a transaction will be completed.
The Company reviewed the carrying value of its 50% interest in Borgata as of December 31, 2011 anddetermined that it was necessary to record an other-than-temporary impairment charge of $62 million in‘‘Property transactions, net,’’ based on an estimated fair value of $185 million for its 50% interest.Management used a discounted cash flow analysis to determine the estimated fair value from a marketparticipant’s point of view. Key assumptions included in such analysis include management’s estimates offuture cash flows, including outflows for capital expenditures, an appropriate discount rate, and long-termgrowth rate. There is significant uncertainty surrounding Borgata’s future operating results, primarily dueto the planned opening of a major new resort in the Atlantic City market during 2012 and other additionalcompetition expected in surrounding markets. As a result, for purposes of this analysis management hasreflected a decrease in forecasted cash flows in 2012 and 2013. Also, management used a long-term growthrate of 3% and a discount rate of 10.5%, which it believes appropriately reflects risk associated with theestimated cash flows. This analysis is sensitive to management assumptions, and increases or decreases inthese assumptions would have a material impact on the analysis.
41

In July 2010, the Company entered into an agreement to sell four long-term ground leases and theirrespective underlying real property parcels, approximately 11 acres, underlying the Borgata. Thetransaction closed in November 2010 and the Company received net proceeds of $71 million and recordeda gain of $3 million related to the sale in ‘‘Property transactions, net.’’
NOTE 2 — SIGNIFICANT ACCOUNTING POLICIES AND BASIS OF PRESENTATION
Principles of consolidation. The consolidated financial statements include the accounts of the Companyand its subsidiaries. The Company’s investments in unconsolidated affiliates which are 50% or less ownedare accounted for under the equity method. The Company does not have significant variable interests invariable interest entities. All intercompany balances and transactions have been eliminated inconsolidation.
Prior period restatements and reclassifications. The Company identified certain errors related todeferred tax liabilities in its financial statements for years prior to 2009. Such errors have been corrected inthe accompanying financial statements. The Company recorded an additional $57 million of non-currentdeferred tax liabilities, a $66 million increase in accumulated deficit and a $9 million decrease in goodwillin the December 31, 2010 balance sheet, and a $66 million decrease to beginning retained earnings in thestatement of stockholders’ equity for the period ended December 31, 2009. These restatements did notimpact the income statements for the periods ended December 31, 2009 or 2010 included herein. Therestated amounts include a $74 million deferred tax liability (reduced in part by several minor purchaseaccounting items) from the Company’s joint venture investment in Grand Victoria, which was acquired aspart of the Mandalay Resort Group acquisition in 2005. Additional goodwill should have been recorded inpurchase accounting for the Mandalay acquisition; however, this additional goodwill would have beenincluded as an additional $66 million goodwill impairment when the Company recorded an impairmentcharge of $1.2 billion in the fourth quarter of 2008 for the majority of the goodwill recognized in theMandalay acquisition.
In addition, the consolidated financial statements for prior years reflect certain reclassifications, whichhave no effect on previously reported net income, to conform to the current year presentation. TheCompany reclassified hotel resort fees to rooms revenue from other revenue. The total amountsreclassified to rooms revenue for 2010 and 2009 were $70 million and $15 million, respectively. Pursuant tothe guidance in the recently issued AICPA Audit and Accounting Guide, ‘‘Gaming,’’ the Company has alsoreclassified certain amounts paid under slot participation agreements from a reduction in casino revenueto casino expense in 2010 and 2009. Slot participation fees were $37 million in 2010 and $32 million in2009.
Management’s use of estimates. The consolidated financial statements have been prepared inconformity with accounting principles generally accepted in the United States of America. These principlesrequire the Company’s management to make estimates and assumptions that affect the reported amountsof assets and liabilities and disclosure of contingent assets and liabilities at the date of the financialstatements and the reported amounts of revenues and expenses during the reporting period. Actual resultscould differ from those estimates.
Fair value measurements. Fair value measurements affect the Company’s accounting and impairmentassessments of its long-lived assets, investments in unconsolidated affiliates, cost method investments,assets acquired and liabilities assumed in an acquisition, goodwill, and other intangible assets. Fair valuemeasurements also affect the Company’s accounting for certain of its financial assets and liabilities. Fairvalue is defined as the price that would be received to sell an asset or paid to transfer a liability in anorderly transaction between market participants at the measurement date and is measured according to ahierarchy that includes: ‘‘Level 1’’ inputs, such as quoted prices in an active market; ‘‘Level 2’’ inputs,which are observable inputs for similar assets; or ‘‘Level 3’’ inputs, which are unobservable inputs.
42

The Company uses fair value measurements when assessing impairment of its investments inunconsolidated affiliates. The Company estimates such fair value using a discounted cash flow analysisutilizing Level 3 inputs, including market indicators of discount rates and terminal year capitalization rates.See Note 6 for further discussion.
The Company assessed the fair value of its acquisition of MGM China using Level 1 inputs. SeeNote 3 for discussion of the allocation of fair value to assets and liabilities of MGM China. AtSeptember 30, 2011, the Company assessed the fair value of Circus Circus Reno using Level 3 inputs—seeNote 16 for further discussion. At December 31, 2011, the Company assessed the fair value of its costinvestment in Borgata using Level 3 inputs—see Note 1 for further discussion. At December 31, 2011, thefair value of the Company’s treasury securities held by the Borgata trust was $150 million, measured usingLevel 1 inputs—see Note 1 for additional information related to the Borgata trust. The Company’s$300 million 4.25% convertible senior notes due 2015 issued in June 2011 were recorded at fair value onthe issue date, measured using Level 1 inputs—see Note 9 for further discussion of the convertible seniornote issuance.
In connection with its accounting for the March 2010 amended and restated credit facility as discussedin Note 9, the Company estimated fair value of its senior credit facility using Level 1 inputs. The Companyalso uses Level 1 inputs for its long-term debt fair value disclosures.
At December 31, 2009, the fair value of the Company’s Renaissance Pointe land holdings weremeasured using Level 2 and Level 3 inputs—see Note 16 for further discussion of the Renaissance Pointeimpairment.
Cash and cash equivalents. Cash and cash equivalents include investments and interest bearinginstruments with maturities of 90 days or less at the date of acquisition. Such investments are carried atcost, which approximates market value. Book overdraft balances resulting from the Company’s cashmanagement program are recorded as accounts payable, construction payable, or other accrued liabilities,as applicable.
Accounts receivable and credit risk. Financial instruments that potentially subject the Company toconcentrations of credit risk consist primarily of casino accounts receivable. The Company issues credit toapproved casino customers and gaming promoters following background checks and investigations ofcreditworthiness. At December 31, 2011, a substantial portion of the Company’s receivables was due fromcustomers residing in foreign countries. Business or economic conditions or other significant events inthese countries could affect the collectibility of such receivables.
Accounts receivable are typically non-interest bearing and are initially recorded at cost. Accounts arewritten off when management deems the account to be uncollectible. Recoveries of accounts previouslywritten off are recorded when received. An estimated allowance for doubtful accounts is maintained toreduce the Company’s receivables to their net carrying amount, which approximates fair value. Theallowance is estimated based on specific review of customer accounts as well as historical collectionexperience and current economic and business conditions. Management believes that as of December 31,2011, no significant concentrations of credit risk existed for which an allowance had not already beenrecorded.
Inventories. Inventories consist primarily of food and beverage, retail merchandise and operatingsupplies, and are stated at the lower of cost or market. Cost is determined primarily using the average costmethod for food and beverage and operating supplies. Cost for retail merchandise is determined using theretail inventory method or specific identification method.
Property and equipment. Property and equipment are stated at cost. A significant amount of theCompany’s property and equipment was acquired through business combinations and therefore recognizedat fair value at the acquisition date. Gains or losses on dispositions of property and equipment are included
43
in the determination of income. Maintenance costs are expensed as incurred. Property and equipment aregenerally depreciated over the following estimated useful lives on a straight-line basis:
Buildings and improvements . . . . . . . . . . . . . . . . . . . . . . . . . . . . . . . . 20 to 40 yearsLand improvements . . . . . . . . . . . . . . . . . . . . . . . . . . . . . . . . . . . . . . . . . . . 10 to 20 yearsFurniture and fixtures. . . . . . . . . . . . . . . . . . . . . . . . . . . . . . . . . . . . . . . . . 3 to 20 yearsEquipment . . . . . . . . . . . . . . . . . . . . . . . . . . . . . . . . . . . . . . . . . . . . . . . . . . . . . . 3 to 20 years
The Company evaluates its property and equipment and other long-lived assets for impairment basedon its classification as a) held for sale or b) to be held and used. Several criteria must be met before anasset is classified as held for sale, including that management with the appropriate authority commits to aplan to sell the asset at a reasonable price in relation to its fair value and is actively seeking a buyer. Forassets held for sale, the Company recognizes the asset at the lower of carrying value or fair market valueless costs to sell, as estimated based on comparable asset sales, offers received, or a discounted cash flowmodel. For assets to be held and used, the Company reviews for impairment whenever indicators ofimpairment exist. The Company then compares the estimated future cash flows of the asset, on anundiscounted basis, to the carrying value of the asset. If the undiscounted cash flows exceed the carryingvalue, no impairment is indicated. If the undiscounted cash flows do not exceed the carrying value, then animpairment is recorded based on the fair value of the asset, typically measured using a discounted cashflow model. If an asset is still under development, future cash flows include remaining construction costs.All recognized impairment losses, whether for assets held for sale or assets to be held and used, arerecorded as operating expenses. See Note 16 for additional information.
Capitalized interest. The interest cost associated with major development and construction projects iscapitalized and included in the cost of the project. When no debt is incurred specifically for a project,interest is capitalized on amounts expended on the project using the weighted-average cost of theCompany’s outstanding borrowings. Capitalization of interest ceases when the project is substantiallycomplete or development activity is suspended for more than a brief period.
Investment in The M Resort LLC convertible note. In 2009, the Company determined that the fair valueof the M Resort Note was $0, that the decline in value was ‘‘other-than-temporary,’’ and that the entireamount of the indicated impairment related to a credit loss. The conclusion that the decline in value was‘‘other-than-temporary’’ was based on the Company’s assessment of actual results since the opening of theM Resort and M Resort’s management’s revised cash flow projections since its opening, which weresignificantly lower than original predictions due to market and general economic conditions. Based on theconclusions above, the Company recorded a pre-tax impairment charge of $176 million—the accretedvalue as of May 31, 2009—in the second quarter of 2009 within ‘‘Other, net’’ non-operating expense. Ofthat amount, $82 million was reclassified from accumulated other comprehensive loss, which amount was$54 million net of tax. The Company no longer holds this note.
Investments in and advances to unconsolidated affiliates. The Company has investments inunconsolidated affiliates accounted for under the equity method. Under the equity method, carrying valueis adjusted for the Company’s share of the investees’ earnings and losses, as well as capital contributions toand distributions from these companies. Distributions in excess of equity method earnings are recognizedas a return of investment and recorded as investing cash inflows in the accompanying consolidatedstatements of cash flows. The Company classifies operating income and losses as well as gains andimpairments related to its investments in unconsolidated affiliates as a component of operating income orloss, as the Company’s investments in such unconsolidated affiliates are an extension of the Company’score business operations.
The Company evaluates its investments in unconsolidated affiliates for impairment whenever eventsor changes in circumstances indicate that the carrying value of its investment may have experienced an‘‘other-than-temporary’’ decline in value. If such conditions exist, the Company compares the estimated
44
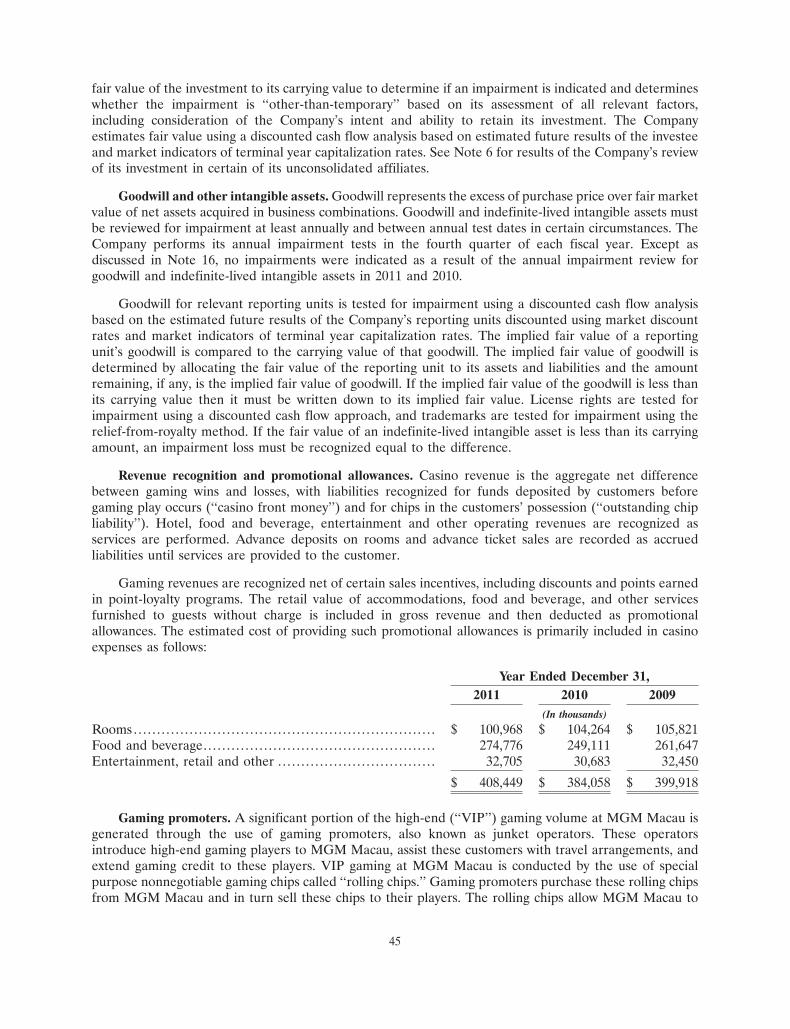
fair value of the investment to its carrying value to determine if an impairment is indicated and determineswhether the impairment is ‘‘other-than-temporary’’ based on its assessment of all relevant factors,including consideration of the Company’s intent and ability to retain its investment. The Companyestimates fair value using a discounted cash flow analysis based on estimated future results of the investeeand market indicators of terminal year capitalization rates. See Note 6 for results of the Company’s reviewof its investment in certain of its unconsolidated affiliates.
Goodwill and other intangible assets. Goodwill represents the excess of purchase price over fair marketvalue of net assets acquired in business combinations. Goodwill and indefinite-lived intangible assets mustbe reviewed for impairment at least annually and between annual test dates in certain circumstances. TheCompany performs its annual impairment tests in the fourth quarter of each fiscal year. Except asdiscussed in Note 16, no impairments were indicated as a result of the annual impairment review forgoodwill and indefinite-lived intangible assets in 2011 and 2010.
Goodwill for relevant reporting units is tested for impairment using a discounted cash flow analysisbased on the estimated future results of the Company’s reporting units discounted using market discountrates and market indicators of terminal year capitalization rates. The implied fair value of a reportingunit’s goodwill is compared to the carrying value of that goodwill. The implied fair value of goodwill isdetermined by allocating the fair value of the reporting unit to its assets and liabilities and the amountremaining, if any, is the implied fair value of goodwill. If the implied fair value of the goodwill is less thanits carrying value then it must be written down to its implied fair value. License rights are tested forimpairment using a discounted cash flow approach, and trademarks are tested for impairment using therelief-from-royalty method. If the fair value of an indefinite-lived intangible asset is less than its carryingamount, an impairment loss must be recognized equal to the difference.
Revenue recognition and promotional allowances. Casino revenue is the aggregate net differencebetween gaming wins and losses, with liabilities recognized for funds deposited by customers beforegaming play occurs (‘‘casino front money’’) and for chips in the customers’ possession (‘‘outstanding chipliability’’). Hotel, food and beverage, entertainment and other operating revenues are recognized asservices are performed. Advance deposits on rooms and advance ticket sales are recorded as accruedliabilities until services are provided to the customer.
Gaming revenues are recognized net of certain sales incentives, including discounts and points earnedin point-loyalty programs. The retail value of accommodations, food and beverage, and other servicesfurnished to guests without charge is included in gross revenue and then deducted as promotionalallowances. The estimated cost of providing such promotional allowances is primarily included in casinoexpenses as follows:
Year Ended December 31,2011 2010 2009
(In thousands)
Rooms . . . . . . . . . . . . . . . . . . . . . . . . . . . . . . . . . . . . . . . . . . . . . . . . . . . . . . . . . . . . . . . . . $ 100,968 $ 104,264 $ 105,821Food and beverage. . . . . . . . . . . . . . . . . . . . . . . . . . . . . . . . . . . . . . . . . . . . . . . . . . 274,776 249,111 261,647Entertainment, retail and other . . . . . . . . . . . . . . . . . . . . . . . . . . . . . . . . . . 32,705 30,683 32,450
$ 408,449 $ 384,058 $ 399,918
Gaming promoters. A significant portion of the high-end (‘‘VIP’’) gaming volume at MGM Macau isgenerated through the use of gaming promoters, also known as junket operators. These operatorsintroduce high-end gaming players to MGM Macau, assist these customers with travel arrangements, andextend gaming credit to these players. VIP gaming at MGM Macau is conducted by the use of specialpurpose nonnegotiable gaming chips called ‘‘rolling chips.’’ Gaming promoters purchase these rolling chipsfrom MGM Macau and in turn sell these chips to their players. The rolling chips allow MGM Macau to
45
track the amount of wagering conducted by each gaming promoters’ clients in order to determine VIPgaming play. In exchange for the gaming promoters’ services, MGM Macau pays the gaming promotersthrough rolling chip turnover-based commissions or through revenue-sharing arrangements. The estimatedportion of the gaming promoter payments that represent amounts passed through to VIP customers isrecorded net against casino revenue, and the estimated portion retained by the gaming promoter for itscompensation is recorded to casino expense.
Reimbursed expenses. The Company recognizes costs reimbursed pursuant to management services asrevenue in the period it incurs the costs. Reimbursed costs related mainly to the Company’s managementof CityCenter and totaled $351 million for 2011, $359 million for 2010 and $99 million for 2009.
Loyalty programs. The Company’s primary loyalty program is ‘‘M life’’ and is available to patrons atsubstantially all of the Company’s owned and operated resorts. Customers earn points based on their slotsplay which can be redeemed for free play at any of the Company’s participating resorts. The Companyrecords a liability based on the points earned multiplied by the redemption value, less an estimate forpoints not expected to be redeemed, and records a corresponding reduction in casino revenue. Customersalso earn credits (‘‘express comps’’) based on their slots play and table games play which can be redeemedfor complimentary services, including hotel rooms, food and beverage, and entertainment. The Companyrecords a liability for the estimated costs of providing services for express comps based on the expresscomps earned multiplied by a cost margin, less an estimate for express comps not expected to be redeemedand records a corresponding expense in the casino department. MGM Macau also has a loyalty program,whereby patrons earn rewards that can be redeemed for complimentary services, including hotel rooms,food and beverage and entertainment.
Advertising. The Company expenses advertising costs the first time the advertising takes place.Advertising expense, which is generally included in general and administrative expenses, was $121 million,$123 million, and $118 million for 2011, 2010 and 2009, respectively.
Corporate expense. Corporate expense represents unallocated payroll and aircraft costs, professionalfees and various other expenses not directly related to the Company’s casino resort operations. In addition,corporate expense includes the costs associated with the Company’s evaluation and pursuit of new businessopportunities, which are expensed as incurred.
Preopening and start-up expenses. Preopening and start-up costs, including organizational costs, areexpensed as incurred. Costs classified as preopening and start-up expenses include payroll, outsideservices, advertising, and other expenses related to new or start-up operations.
Property transactions, net. The Company classifies transactions such as write-downs and impairments,demolition costs, and normal gains and losses on the sale of assets as ‘‘Property transactions, net.’’ SeeNote 16 for a detailed discussion of these amounts.
46

Income per share of common stock. The weighted-average number of common and common equivalentshares used in the calculation of basic and diluted earnings per share consisted of the following:
Year Ended December 31,2011 2010 2009
(In thousands)
Numerator:Net income (loss) attributable to MGM Resorts
International - basic . . . . . . . . . . . . . . . . . . . . . . . . . . . . . . . . . . . . . . . . . . . . . $ 3,114,637 $ (1,437,397) $ (1,291,682)Interest on convertible debt, net of tax . . . . . . . . . . . . . . . . . . . . . . . . . 38,344 - -
Net income (loss) attributable to MGM ResortsInternational - diluted . . . . . . . . . . . . . . . . . . . . . . . . . . . . . . . . . . . . . . . . $ 3,152,981 $ (1,437,397) $ (1,291,682)
Denominator:Weighted-average common shares outstanding - basic . . . . . . . 488,652 450,449 378,513Potential dilution from share-based awards . . . . . . . . . . . . . . . . . . . . 1,577 - -Potential dilution from assumed conversion of convertible
debt . . . . . . . . . . . . . . . . . . . . . . . . . . . . . . . . . . . . . . . . . . . . . . . . . . . . . . . . . . . . . . . . . 70,666 - -
Weighted-average common and common equivalentshares - diluted . . . . . . . . . . . . . . . . . . . . . . . . . . . . . . . . . . . . . . . . . . . . . . . . 560,895 450,449 378,513
Anti-dilutive share-based awards excluded from thecalculation of diluted earnings per share . . . . . . . . . . . . . . . . . . . . 21,886 29,273 29,291
Currency translation. The Company translates the financial statements of foreign subsidiaries that arenot denominated in U.S. dollars. Balance sheet accounts are translated at the exchange rate in effect ateach balance sheet date. Income statement accounts are translated at the average rate of exchangeprevailing during the period. Translation adjustments resulting from this process are charged or credited toother comprehensive income (loss).
Comprehensive income (loss). Comprehensive income includes net income (loss) and all othernon-stockholder changes in equity, or other comprehensive income. Elements of the Company’saccumulated other comprehensive loss are reported in the accompanying consolidated statements ofstockholders’ equity, and the cumulative balance of these elements consisted of the following:
At December 31,2011 2010
(In thousands)
Currency translation adjustments . . . . . . . . . . . . . . . . . . . . . . . . . . . . . . . . . . . . . . . . . . . . . . . . $ 11,602 $ 95Other comprehensive income (loss) from unconsolidated affiliates. . . . . . . (248) (396)
11,354 (301)Less: Currency translation adjustment attributable to noncontrolling
interests. . . . . . . . . . . . . . . . . . . . . . . . . . . . . . . . . . . . . . . . . . . . . . . . . . . . . . . . . . . . . . . . . . . . . . . . . . . . (5,376) -
Comprehensive income (loss) attributable to MGM ResortsInternational . . . . . . . . . . . . . . . . . . . . . . . . . . . . . . . . . . . . . . . . . . . . . . . . . . . . . . . . . . . . . . . . . . . $ 5,978 $ (301)
Financial statement impact of Monte Carlo fire. The Company maintains insurance for both propertydamage and business interruption relating to catastrophic events, such as the rooftop fire at Monte Carloin January 2008. Business interruption insurance covers lost profits and other costs incurred during theclosure period and up to six months following re-opening. The Company settled its final claim with itsinsurance carriers related to the Monte Carlo fire in 2009 for a total of $74 million. The pre-tax impact onthe Company’s statements of operations for the year ended December 31, 2009 related to such insurance
47

recoveries included a $15 million reduction of ‘‘General and administrative’’ expense and a $7 millionoffset to ‘‘Property transactions, net.’’
Sale of TI. On March 20, 2009, the Company closed the sale of the Treasure Island casino resort (‘‘TI’’)to Ruffin Acquisition, LLC for net proceeds to the Company of approximately $746 million and recognizeda pre-tax gain of $187 million related to the sale, which is included within ‘‘Property transactions, net.’’ Inconnection with the sale of TI, including the transfer of all of the membership interests of TI, TI wasreleased as a guarantor of the outstanding indebtedness of the Company and its subsidiaries.
As a result of the sale, the Company evaluated TI’s operations for potential treatment as discontinuedoperations. The Company concluded significant customer migration would occur because there was ashared customer base through the Company’s customer loyalty rewards program and because of thephysical proximity of TI to the Company’s other Las Vegas Strip resorts. Most of the loyalty rewardsprogram customers of TI were also customers of one or more of the Company’s other resorts. TheCompany retained the ability to market to these customers after the sale and believes the loyalty rewardsprogram is an important factor in the migration of customer play to the Company’s other resorts. TheCompany expects the cash flow benefits of such migration to continue for an indefinite period. Therefore,the results of the TI operations through the time of sale have not been classified as discontinuedoperations.
Recently Issued Accounting Standards. Certain amendments to Accounting Standards Codification(‘‘ASC’’) 820, ‘‘Fair Value Measurements,’’ become effective for the Company for fiscal years beginningafter December 15, 2011. Such amendments include a consistent definition of fair value, enhanceddisclosure requirements for ‘‘Level 3’’ fair value adjustments and other changes to required disclosures.The Company does not expect this amendment to have a material effect on its financial statements and willcomply with the disclosure enhancements of this amendment when the amendment is effective.
In June 2011, ASC 220, ‘‘Comprehensive Income,’’ was amended and will become effective for theCompany for fiscal years beginning after December 15, 2011, including retrospective adjustment. Suchamendments allow the Company two options for the presentation of comprehensive income. Under eitheroption, the Company is required to present each component of net income along with total net income,each component of other comprehensive income along with a total for other comprehensive income, and atotal amount for comprehensive income. As a result of the amendment, the option to present thecomponents of other comprehensive income as part of the statement of changes in stockholders’ equity iseliminated. The Company does not expect this amendment to have a material effect on its financialstatements and will comply with the disclosure enhancements of this amendment when the amendment iseffective.
In September 2011, ASC 350, ‘‘Intangibles-Goodwill and Others,’’ was amended to simplify theassessment of goodwill impairment and will become effective for the Company for fiscal years beginningafter December 15, 2011. The amended guidance allows the Company to do an initial qualitativeassessment of relative events and circumstances to determine if fair value of a reporting unit is more likelythan not less than its carrying value, prior to performing the two-step quantitative goodwill impairmenttest. The Company does not expect this amendment to have a material effect on its financial statementsand will comply with the disclosure enhancements of this amendment when the amendment is effective.
NOTE 3 — MGM CHINA ACQUISITION
On June 3, 2011, the Company and Ms. Ho, Pansy Catilina Chiu King (‘‘Ms. Pansy Ho’’) completed areorganization of the capital structure of MGM China and the initial public offering of 760 million sharesof MGM China on The Stock Exchange of Hong Kong Limited (the ‘‘IPO’’), representing 20% of the postissuance capital stock of MGM China, at an offer price of HKD 15.34 per share. Pursuant to thisreorganization, the Company, through a wholly owned subsidiary, acquired an additional 1% of the overallcapital stock of MGM China for HKD 15.34 per share, or approximately $75 million, and thereby becamethe indirect owner of 51% of MGM China. Following the IPO, Ms. Pansy Ho sold an additional 59 millionshares of MGM China pursuant to the underwriters’ overallotment option.
48

Through the acquisition of its additional 1% interest of MGM China, the Company obtained acontrolling interest and was required to consolidate MGM China as of June 3, 2011. Prior to the IPO, theCompany held a 50% interest in MGM Grand Paradise, which was accounted for under the equity methodas discussed in Note 6. The acquisition of the controlling financial interest was accounted for as a businesscombination and the Company recognized 100% of the assets, liabilities, and noncontrolling interests ofMGM China at fair value at the date of acquisition. The fair value of the equity interests of MGM Chinawas determined by the IPO transaction price and equaled approximately $7.5 billion. The carrying value ofthe Company’s equity method investment was significantly less than its share of the fair value of MGMChina at the acquisition date, resulting in a $3.5 billion gain on the acquisition. Under the acquisitionmethod, the fair value was allocated to the assets acquired, liabilities assumed and noncontrolling interestsrecorded in the transaction. The following table sets forth the allocation at June 3, 2011 (in thousands):
Current assets . . . . . . . . . . . . . . . . . . . . . . . . . . . . . . . . . . . . . . . . . . . . . . . . . . . . . . . . . . . . . . . . . . . . . . . . . . . . . . . . . . . . . . . . . . . . $ 558,037Property and equipment and other long-term assets . . . . . . . . . . . . . . . . . . . . . . . . . . . . . . . . . . . . . . . . . . . . . 704,823Goodwill . . . . . . . . . . . . . . . . . . . . . . . . . . . . . . . . . . . . . . . . . . . . . . . . . . . . . . . . . . . . . . . . . . . . . . . . . . . . . . . . . . . . . . . . . . . . . . . . . . 2,821,589Gaming subconcession . . . . . . . . . . . . . . . . . . . . . . . . . . . . . . . . . . . . . . . . . . . . . . . . . . . . . . . . . . . . . . . . . . . . . . . . . . . . . . . . . 4,499,727Land concession . . . . . . . . . . . . . . . . . . . . . . . . . . . . . . . . . . . . . . . . . . . . . . . . . . . . . . . . . . . . . . . . . . . . . . . . . . . . . . . . . . . . . . . . . 84,466Customer lists . . . . . . . . . . . . . . . . . . . . . . . . . . . . . . . . . . . . . . . . . . . . . . . . . . . . . . . . . . . . . . . . . . . . . . . . . . . . . . . . . . . . . . . . . . . . 128,564Gaming promoter relationships . . . . . . . . . . . . . . . . . . . . . . . . . . . . . . . . . . . . . . . . . . . . . . . . . . . . . . . . . . . . . . . . . . . . . . 179,989Current liabilities, excluding long-term debt . . . . . . . . . . . . . . . . . . . . . . . . . . . . . . . . . . . . . . . . . . . . . . . . . . . . . . . (459,518)Long-term debt . . . . . . . . . . . . . . . . . . . . . . . . . . . . . . . . . . . . . . . . . . . . . . . . . . . . . . . . . . . . . . . . . . . . . . . . . . . . . . . . . . . . . . . . . . (642,818)Deferred taxes . . . . . . . . . . . . . . . . . . . . . . . . . . . . . . . . . . . . . . . . . . . . . . . . . . . . . . . . . . . . . . . . . . . . . . . . . . . . . . . . . . . . . . . . . . . (380,628)
$ 7,494,231
Noncontrolling interests . . . . . . . . . . . . . . . . . . . . . . . . . . . . . . . . . . . . . . . . . . . . . . . . . . . . . . . . . . . . . . . . . . . . . . . . . . . . . . . $ (3,672,173)
As discussed above, the Company recognized the identifiable intangible assets of MGM China at fairvalue. The gaming subconcession and land concession had historical cost bases which were beingamortized by MGM Macau. The customer relationship intangible assets did not have historical cost basesat MGM Macau. The estimated fair values of the intangible assets acquired were primarily determinedusing Level 3 inputs. The gaming subconcession was valued using an excess earnings model based onestimated future cash flows of MGM Macau. All of the recognized intangible assets were determined tohave finite lives and are being amortized over their estimated useful lives as discussed below.
Gaming subconcession. Pursuant to the agreement dated June 19, 2004 between MGM Grand Paradiseand Sociedade de Jogos de Macau, S.A. (‘‘SJM’’), a gaming subconcession was acquired by MGM GrandParadise for the right to operate casino games of chance and other casino games for a period of 15 yearscommencing on April 20, 2005. The Company cannot provide any assurance that the gaming subconcessionwill be extended beyond the original terms of the agreement; however, management believes that thegaming subconcession will be extended, given that the land concession agreement with the governmentextends significantly beyond the gaming subconcession. In addition, management believes that the fairvalue of MGM China reflected in the IPO pricing suggests that market participants have assumed thegaming subconcession will be extended beyond its initial term. As such, the Company has determined thatthe gaming subconcession intangible asset should be amortized on a straight-line basis over the initial termof the land concession through April 2031.
Land concession. MGM Grand Paradise entered into a contract with the Macau government to use theland under MGM Macau commencing from April 6, 2006. The land use right has an initial term throughApril 6, 2031, subject to renewal for additional periods. The land concession intangible asset will beamortized on a straight-line basis over the remaining initial contractual term.
Customer lists. The Company recognized an intangible asset related to customer lists, which will beamortized on an accelerated basis over its estimated useful life of five years.
49
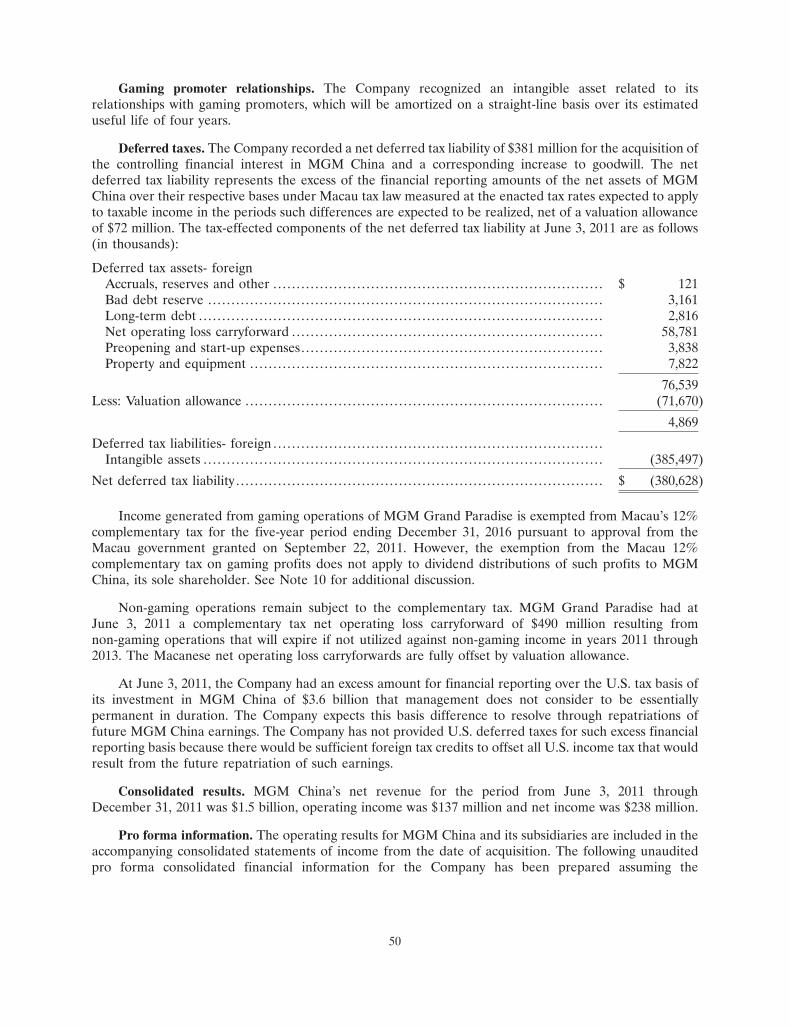
Gaming promoter relationships. The Company recognized an intangible asset related to itsrelationships with gaming promoters, which will be amortized on a straight-line basis over its estimateduseful life of four years.
Deferred taxes. The Company recorded a net deferred tax liability of $381 million for the acquisition ofthe controlling financial interest in MGM China and a corresponding increase to goodwill. The netdeferred tax liability represents the excess of the financial reporting amounts of the net assets of MGMChina over their respective bases under Macau tax law measured at the enacted tax rates expected to applyto taxable income in the periods such differences are expected to be realized, net of a valuation allowanceof $72 million. The tax-effected components of the net deferred tax liability at June 3, 2011 are as follows(in thousands):
Deferred tax assets- foreignAccruals, reserves and other . . . . . . . . . . . . . . . . . . . . . . . . . . . . . . . . . . . . . . . . . . . . . . . . . . . . . . . . . . . . . . . . . . . . . . . $ 121Bad debt reserve . . . . . . . . . . . . . . . . . . . . . . . . . . . . . . . . . . . . . . . . . . . . . . . . . . . . . . . . . . . . . . . . . . . . . . . . . . . . . . . . . . . . . 3,161Long-term debt . . . . . . . . . . . . . . . . . . . . . . . . . . . . . . . . . . . . . . . . . . . . . . . . . . . . . . . . . . . . . . . . . . . . . . . . . . . . . . . . . . . . . . . 2,816Net operating loss carryforward . . . . . . . . . . . . . . . . . . . . . . . . . . . . . . . . . . . . . . . . . . . . . . . . . . . . . . . . . . . . . . . . . . . 58,781Preopening and start-up expenses. . . . . . . . . . . . . . . . . . . . . . . . . . . . . . . . . . . . . . . . . . . . . . . . . . . . . . . . . . . . . . . . . 3,838Property and equipment . . . . . . . . . . . . . . . . . . . . . . . . . . . . . . . . . . . . . . . . . . . . . . . . . . . . . . . . . . . . . . . . . . . . . . . . . . . . 7,822
76,539Less: Valuation allowance . . . . . . . . . . . . . . . . . . . . . . . . . . . . . . . . . . . . . . . . . . . . . . . . . . . . . . . . . . . . . . . . . . . . . . . . . . . . . (71,670)
4,869
Deferred tax liabilities- foreign . . . . . . . . . . . . . . . . . . . . . . . . . . . . . . . . . . . . . . . . . . . . . . . . . . . . . . . . . . . . . . . . . . . . . . .Intangible assets . . . . . . . . . . . . . . . . . . . . . . . . . . . . . . . . . . . . . . . . . . . . . . . . . . . . . . . . . . . . . . . . . . . . . . . . . . . . . . . . . . . . . . (385,497)
Net deferred tax liability . . . . . . . . . . . . . . . . . . . . . . . . . . . . . . . . . . . . . . . . . . . . . . . . . . . . . . . . . . . . . . . . . . . . . . . . . . . . . . . $ (380,628)
Income generated from gaming operations of MGM Grand Paradise is exempted from Macau’s 12%complementary tax for the five-year period ending December 31, 2016 pursuant to approval from theMacau government granted on September 22, 2011. However, the exemption from the Macau 12%complementary tax on gaming profits does not apply to dividend distributions of such profits to MGMChina, its sole shareholder. See Note 10 for additional discussion.
Non-gaming operations remain subject to the complementary tax. MGM Grand Paradise had atJune 3, 2011 a complementary tax net operating loss carryforward of $490 million resulting fromnon-gaming operations that will expire if not utilized against non-gaming income in years 2011 through2013. The Macanese net operating loss carryforwards are fully offset by valuation allowance.
At June 3, 2011, the Company had an excess amount for financial reporting over the U.S. tax basis ofits investment in MGM China of $3.6 billion that management does not consider to be essentiallypermanent in duration. The Company expects this basis difference to resolve through repatriations offuture MGM China earnings. The Company has not provided U.S. deferred taxes for such excess financialreporting basis because there would be sufficient foreign tax credits to offset all U.S. income tax that wouldresult from the future repatriation of such earnings.
Consolidated results. MGM China’s net revenue for the period from June 3, 2011 throughDecember 31, 2011 was $1.5 billion, operating income was $137 million and net income was $238 million.
Pro forma information. The operating results for MGM China and its subsidiaries are included in theaccompanying consolidated statements of income from the date of acquisition. The following unauditedpro forma consolidated financial information for the Company has been prepared assuming the
50

Company’s acquisition of its controlling financial interest had occurred as of January 1, 2010 and excludesthe gain recognized by the Company:
Year Ended December 31,2011 2010
(In thousands, except per share data)
Net revenues . . . . . . . . . . . . . . . . . . . . . . . . . . . . . . . . . . . . . . . . . . . . . . . . . . . . . . . . . . . . . . . . . . . . . . . . $ 8,920,343 $ 7,627,227Operating income (loss) . . . . . . . . . . . . . . . . . . . . . . . . . . . . . . . . . . . . . . . . . . . . . . . . . . . . . . . . . . . 577,271 (1,308,633)Net loss . . . . . . . . . . . . . . . . . . . . . . . . . . . . . . . . . . . . . . . . . . . . . . . . . . . . . . . . . . . . . . . . . . . . . . . . . . . . . . . (262,452) (1,599,813)Net loss attributable to MGM Resorts International . . . . . . . . . . . . . . . . . . . . . . . . (435,099) (1,567,281)Loss per share of common stock attributable to
MGM Resorts International:Basic. . . . . . . . . . . . . . . . . . . . . . . . . . . . . . . . . . . . . . . . . . . . . . . . . . . . . . . . . . . . . . . . . . . . . . . . . . . . . $ (0.89) $ (3.48)Diluted . . . . . . . . . . . . . . . . . . . . . . . . . . . . . . . . . . . . . . . . . . . . . . . . . . . . . . . . . . . . . . . . . . . . . . . . . . $ (0.89) $ (3.48)
NOTE 4 — ACCOUNTS RECEIVABLE, NET
Accounts receivable consisted of the following:
At December 31,2011 2010
(In thousands)
Casino . . . . . . . . . . . . . . . . . . . . . . . . . . . . . . . . . . . . . . . . . . . . . . . . . . . . . . . . . . . . . . . . . . . . . . . . . . . . . . . . $ 347,679 $ 229,318Hotel . . . . . . . . . . . . . . . . . . . . . . . . . . . . . . . . . . . . . . . . . . . . . . . . . . . . . . . . . . . . . . . . . . . . . . . . . . . . . . . . . . 165,410 119,887Other . . . . . . . . . . . . . . . . . . . . . . . . . . . . . . . . . . . . . . . . . . . . . . . . . . . . . . . . . . . . . . . . . . . . . . . . . . . . . . . . . 79,848 66,449
592,937 415,654Less: Allowance for doubtful accounts . . . . . . . . . . . . . . . . . . . . . . . . . . . . . . . . . . . . . . . . . (101,207) (93,760)
$ 491,730 $ 321,894
NOTE 5 — PROPERTY AND EQUIPMENT, NET
Property and equipment consisted of the following:
At December 31,2011 2010
(In thousands)
Land . . . . . . . . . . . . . . . . . . . . . . . . . . . . . . . . . . . . . . . . . . . . . . . . . . . . . . . . . . . . . . . . . . . . . . . . . . . . . . . . . . $ 7,032,853 $ 7,039,806Buildings, building improvements and land improvements . . . . . . . . . . . . . . . . . 9,122,080 8,504,655Furniture, fixtures and equipment . . . . . . . . . . . . . . . . . . . . . . . . . . . . . . . . . . . . . . . . . . . . . . . 3,926,438 3,768,476Construction in progress . . . . . . . . . . . . . . . . . . . . . . . . . . . . . . . . . . . . . . . . . . . . . . . . . . . . . . . . . . 122,372 72,843
20,203,743 19,385,780Less: Accumulated depreciation and amortization . . . . . . . . . . . . . . . . . . . . . . . . . . . (5,337,099) (4,831,430)
$ 14,866,644 $ 14,554,350
51

NOTE 6 — INVESTMENTS IN AND ADVANCES TO UNCONSOLIDATED AFFILIATES
Investments in and advances to unconsolidated affiliates consisted of the following:
At December 31,2011 2010
(In thousands)
CityCenter Holdings, LLC – CityCenter (50%) . . . . . . . . . . . . . . . . . . . . . . . . . . . . . . $ 1,332,299 $ 1,417,843Elgin Riverboat Resort–Riverboat Casino – Grand Victoria (50%) . . . . . . 292,094 294,305MGM Grand Paradise Limited – Macau (50%). . . . . . . . . . . . . . . . . . . . . . . . . . . . . . - 173,030Circus and Eldorado Joint Venture – Silver Legacy (50%) . . . . . . . . . . . . . . . . - 25,408Other . . . . . . . . . . . . . . . . . . . . . . . . . . . . . . . . . . . . . . . . . . . . . . . . . . . . . . . . . . . . . . . . . . . . . . . . . . . . . . . . . 11,179 12,569
$ 1,635,572 $ 1,923,155
The Company recorded its share of the results of operations of unconsolidated affiliates as follows:
Year Ended December 31,2011 2010 2009
(In thousands)
Income (loss) from unconsolidated affiliates . . . . . . . . . . . . . $ 91,094 $ (78,434) $ (88,227)Preopening and start-up expenses . . . . . . . . . . . . . . . . . . . . . . . . . . - (3,494) (52,824)Non-operating items from unconsolidated affiliates . . . . . (119,013) (108,731) (47,127)
$ (27,919) $ (190,659) $ (188,178)
Borgata
As discussed in Note 1, the Company discontinued the equity method of accounting for Borgata inMarch 2010 at the point the assets were placed in the trust, and accounts for its rights under the trustarrangement under the cost method of accounting.
Silver Legacy
Silver Legacy has approximately $143 million of outstanding senior notes due in March 2012. SilverLegacy is exploring various alternatives for refinancing or restructuring its obligations under the notes,including filing for bankruptcy protection. The Company reviewed the carrying value of its investment inSilver Legacy as of December 31, 2011 and has recorded an ‘‘other-than-temporary’’ impairment charge of$23 million to decrease the carrying value of its investment to zero. The Company will discontinue applyingthe equity method for its investment in Silver Legacy and will not provide for additional losses until itsshare of future net income, if any, equals the share of net losses not recognized during the period theequity method was suspended.
MGM Grand Paradise Limited
As discussed in Note 3, the Company obtained a controlling financial interest in MGM China as ofJune 3, 2011, which owns MGM Grand Paradise, the Macau company that owns MGM Macau resort andcasino and the related gaming subconcession and land concession, and therefore was required toconsolidate MGM China beginning on that date. Prior thereto, the Company’s investment in MGM GrandParadise was accounted for under the equity method. Prior to the transaction the Company receiveddistributions from MGM Grand Paradise of approximately $192 million in 2010 and $31 million in 2011.
52

CityCenter
January 2011 debt restructuring transactions. In January 2011, CityCenter completed a series oftransactions including the issuance of $900 million in aggregate principal amount of 7.625% senior securedfirst lien notes due 2016 and $600 million in aggregate principal amount of 10.75%/11.50% senior securedsecond lien PIK toggle notes due 2017 in a private placement. The interest rate on the second lien notes is10.75% for interest paid in cash, and 11.50% if CityCenter pays interest in the form of additional debt.CityCenter received net proceeds from the offering of the notes of $1.46 billion after initial purchaser’sdiscounts and commissions but before other offering expenses.
Effective concurrently with the notes offering, CityCenter’s senior credit facility was amended andrestated which extended the maturity of $500 million of the $1.85 billion outstanding loans untilJanuary 21, 2015. The restated senior credit facility does not include a revolving loan component. Allborrowings under the senior credit facility in excess of $500 million were repaid using the proceeds of thefirst lien notes and the second lien notes. In addition, net proceeds from the note offerings, together withequity contributions of $73 million from the members, were used to fund the interest escrow account of$159 million for the benefit of the holders of the first lien notes and the lenders under the restated seniorcredit facility. The restated senior credit facility is secured, on a pari passu basis with the first lien notes, bya first priority lien on substantially all of CityCenter’s assets and those of its subsidiaries, except that anyproceeds generated by the sale of Crystals outside of bankruptcy or foreclosure proceedings will be paidfirst to the lenders under the restated senior credit facility. CityCenter recorded a loss on the debtmodification of $24 million in the first quarter of 2011 related to the above transactions.
February 2012 senior notes issuance. In February 2012, CityCenter issued $240 million in aggregateprincipal amount of its 7.625% senior secured first lien notes at a premium for net proceeds to theCompany, after deducting initial purchasers’ discounts and commissions, of approximately $247 million.The Company used net proceeds from the offering, together with excess cash on hand, to repay$300 million of the outstanding borrowings under its restated senior credit facility.
Completion guarantee. The Company entered into an amended completion and cost overrun guaranteein connection with CityCenter’s restated senior credit facility agreement and issuance of $1.5 billion ofsenior secured first lien notes and senior secured second lien notes, as discussed in Note 11.
Investment impairment. At June 30, 2010, the Company reviewed its CityCenter investment forimpairment using revised operating forecasts developed by CityCenter management. Based on current andforecasted market conditions and because CityCenter’s results of operations through June 30, 2010 werebelow previous forecasts, and the revised operating forecasts were lower than previous forecasts, theCompany concluded that it should review the carrying value of its investment. The Company determinedthat the carrying value of its investment exceeded the fair value determined using a discounted cash flowanalyses and therefore an impairment was indicated. The Company intends to and believes it will be ableto retain its investment in CityCenter; however, due to the extent of the shortfall and its assessment of theuncertainty of fully recovering its investment, the Company determined that the impairments were‘‘other-than-temporary’’ and recorded impairment charges of $1.12 billion in the second quarter of 2010
At September 30, 2010, the Company recognized an increase of $232 million in its total net obligationunder its CityCenter completion guarantee, and a corresponding increase in its investment in CityCenter.The increase primarily reflected a revision to prior estimates based on its assessment of the most currentinformation derived from the close-out and litigation processes and does not reflect certain potentialrecoveries that CityCenter is pursuing as part of the litigation process. The Company completed animpairment review as of September 30, 2010 and as a result recorded an additional impairment of$191 million in the third quarter of 2010 included in ‘‘Property transactions, net.’’
The discounted cash flow analyses for the Company’s investment in CityCenter included estimatedfuture cash inflows from operations, including residential sales, and estimated future cash outflows for
53
capital expenditures. The June 2010 and September 2010 analyses used an 11% discount rate and a longterm growth rate of 4% related to forecasted cash flows for CityCenter’s operating assets.
In 2009, the Company reviewed its CityCenter investment for impairment using revised operatingforecasts developed by CityCenter management. In addition, the impairment charge related toCityCenter’s residential real estate under development discussed below further indicated that theCompany’s investment may have experienced an ‘‘other-than-temporary’’ decline in value. The Company’sdiscounted cash flow analysis for CityCenter included estimated future cash outflows for construction andmaintenance expenditures and future cash inflows from operations, including residential sales. Based on itsanalysis, the Company determined the carrying value of its investment exceeded its fair value anddetermined that the impairment was ‘‘other-than-temporary.’’ The Company recorded an impairmentcharge of $956 million included in ‘‘Property transactions, net.’’
Residential impairment. Upon substantial completion of construction of the Mandarin Orientalresidential inventory in the first quarter of 2010 and the Veer residential inventory in the second quarter of2010, CityCenter is required to carry its residential inventory at the lower of its carrying value or fair valueless costs to sell. Fair value of the residential inventory is determined using a discounted cash flow analysisbased on management’s current expectations of future cash flows. The key inputs in the discounted cashflow analysis include estimated sales prices of units currently under contract and new unit sales, theabsorption rate over the sell-out period, and the discount rate.
CityCenter recorded a residential impairment charge of $53 million in 2011. The Company recognized50% of such impairment charge, resulting in a pre-tax charge of approximately $26 million. In 2010,CityCenter recorded residential impairment charges of $330 million. The Company recognized 50% ofsuch impairment charges, resulting in a pre-tax charge of approximately $166 million.
Included in loss from unconsolidated affiliates for the year ended December 31, 2009 is theCompany’s share of an impairment charge relating to CityCenter residential real estate under development(‘‘REUD’’). CityCenter was required to review its REUD for impairment as of September 30, 2009, mainlydue to CityCenter’s September 2009 decision to discount the prices of its residential inventory by 30%.This decision and related market conditions led to CityCenter management’s conclusion that the carryingvalue of the REUD was not recoverable based on estimates of undiscounted cash flows. As a result,CityCenter was required to compare the fair value of its REUD to its carrying value and record animpairment charge for the shortfall. Fair value of the REUD was determined using a discounted cash flowanalysis based on management’s current expectations of future cash flows. The key inputs in thediscounted cash flow analysis included estimated sales prices of units currently under contract and new unitsales, the absorption rate over the sell-out period, and the discount rate. This analysis resulted in animpairment charge of approximately $348 million of the REUD. The Company recognized its 50% shareof such impairment charge, adjusted by certain basis differences, resulting in a pre-tax charge of$203 million.
Harmon. During the third quarter of 2010, CityCenter management determined that it was unlikelythat the Harmon Hotel & Spa (‘‘Harmon’’) would be completed using the building as it stood. As a result,CityCenter recorded an impairment charge of $279 million in the third quarter of 2010 related toconstruction in progress assets. The impairment of Harmon did not affect the Company’s loss fromunconsolidated affiliates in the third quarter of 2010, because the Company’s 50% share of the impairmentcharge had previously been recognized by the Company in connection with prior impairments of itsinvestment balance. See Note 11 for additional information about Harmon.
54
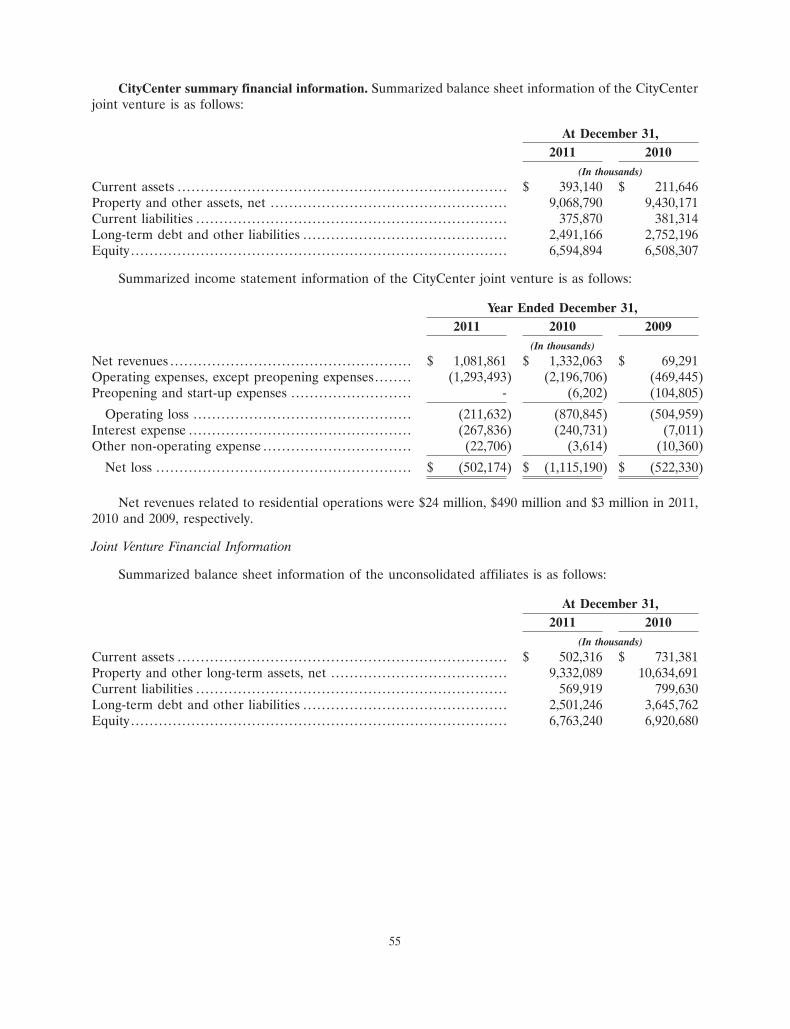
CityCenter summary financial information. Summarized balance sheet information of the CityCenterjoint venture is as follows:
At December 31,2011 2010
(In thousands)
Current assets . . . . . . . . . . . . . . . . . . . . . . . . . . . . . . . . . . . . . . . . . . . . . . . . . . . . . . . . . . . . . . . . . . . . . . . $ 393,140 $ 211,646Property and other assets, net . . . . . . . . . . . . . . . . . . . . . . . . . . . . . . . . . . . . . . . . . . . . . . . . . . . 9,068,790 9,430,171Current liabilities . . . . . . . . . . . . . . . . . . . . . . . . . . . . . . . . . . . . . . . . . . . . . . . . . . . . . . . . . . . . . . . . . . . 375,870 381,314Long-term debt and other liabilities . . . . . . . . . . . . . . . . . . . . . . . . . . . . . . . . . . . . . . . . . . . . 2,491,166 2,752,196Equity . . . . . . . . . . . . . . . . . . . . . . . . . . . . . . . . . . . . . . . . . . . . . . . . . . . . . . . . . . . . . . . . . . . . . . . . . . . . . . . . . 6,594,894 6,508,307
Summarized income statement information of the CityCenter joint venture is as follows:
Year Ended December 31,2011 2010 2009
(In thousands)
Net revenues . . . . . . . . . . . . . . . . . . . . . . . . . . . . . . . . . . . . . . . . . . . . . . . . . . . . $ 1,081,861 $ 1,332,063 $ 69,291Operating expenses, except preopening expenses . . . . . . . . (1,293,493) (2,196,706) (469,445)Preopening and start-up expenses . . . . . . . . . . . . . . . . . . . . . . . . . . - (6,202) (104,805)
Operating loss . . . . . . . . . . . . . . . . . . . . . . . . . . . . . . . . . . . . . . . . . . . . . . . (211,632) (870,845) (504,959)Interest expense . . . . . . . . . . . . . . . . . . . . . . . . . . . . . . . . . . . . . . . . . . . . . . . . (267,836) (240,731) (7,011)Other non-operating expense . . . . . . . . . . . . . . . . . . . . . . . . . . . . . . . . (22,706) (3,614) (10,360)
Net loss . . . . . . . . . . . . . . . . . . . . . . . . . . . . . . . . . . . . . . . . . . . . . . . . . . . . . . . $ (502,174) $ (1,115,190) $ (522,330)
Net revenues related to residential operations were $24 million, $490 million and $3 million in 2011,2010 and 2009, respectively.
Joint Venture Financial Information
Summarized balance sheet information of the unconsolidated affiliates is as follows:
At December 31,2011 2010
(In thousands)
Current assets . . . . . . . . . . . . . . . . . . . . . . . . . . . . . . . . . . . . . . . . . . . . . . . . . . . . . . . . . . . . . . . . . . . . . . . $ 502,316 $ 731,381Property and other long-term assets, net . . . . . . . . . . . . . . . . . . . . . . . . . . . . . . . . . . . . . . 9,332,089 10,634,691Current liabilities . . . . . . . . . . . . . . . . . . . . . . . . . . . . . . . . . . . . . . . . . . . . . . . . . . . . . . . . . . . . . . . . . . . 569,919 799,630Long-term debt and other liabilities . . . . . . . . . . . . . . . . . . . . . . . . . . . . . . . . . . . . . . . . . . . . 2,501,246 3,645,762Equity . . . . . . . . . . . . . . . . . . . . . . . . . . . . . . . . . . . . . . . . . . . . . . . . . . . . . . . . . . . . . . . . . . . . . . . . . . . . . . . . . 6,763,240 6,920,680
55

Summarized results of operations of the unconsolidated affiliates are as follows:
Year Ended December 31,2011 2010 2009
(In thousands)
Net revenues . . . . . . . . . . . . . . . . . . . . . . . . . . . . . . . . . . . . . . . . . . . . . . . . . . . . $ 2,558,631 $ 3,345,630 $ 2,269,789Operating expenses, except preopening expenses . . . . . . . . (2,472,668) (3,871,243) (2,391,792)Preopening and start-up expenses . . . . . . . . . . . . . . . . . . . . . . . . . . - (6,202) (105,504)
Operating income (loss) . . . . . . . . . . . . . . . . . . . . . . . . . . . . . . . . . . . 85,963 (531,815) (227,507)Interest expense . . . . . . . . . . . . . . . . . . . . . . . . . . . . . . . . . . . . . . . . . . . . . . . . (293,578) (288,273) (83,449)Other non-operating expense . . . . . . . . . . . . . . . . . . . . . . . . . . . . . . . . (25,876) (27,451) (36,861)
Net loss . . . . . . . . . . . . . . . . . . . . . . . . . . . . . . . . . . . . . . . . . . . . . . . . . . . . . . . $ (233,491) $ (847,539) $ (347,817)
Basis Differences
The Company’s investments in unconsolidated affiliates do not equal the venture-level equity due tovarious basis differences. Basis differences related to depreciable assets are being amortized based on theuseful lives of the related assets and liabilities and basis differences related to non–depreciable assets arenot being amortized. Differences between the Company’s venture-level equity and investment balances areas follows:
At December 31,2011 2010
(In thousands)
Venture-level equity . . . . . . . . . . . . . . . . . . . . . . . . . . . . . . . . . . . . . . . . . . . . . . . . . . . . . . . . . . . . . . . . $ 3,376,803 $ 3,433,966Fair value adjustments to investments acquired in business
combinations (A) . . . . . . . . . . . . . . . . . . . . . . . . . . . . . . . . . . . . . . . . . . . . . . . . . . . . . . . . . . . . . . . . 267,190 244,636Capitalized interest (B). . . . . . . . . . . . . . . . . . . . . . . . . . . . . . . . . . . . . . . . . . . . . . . . . . . . . . . . . . . . 281,678 331,340Adjustment to CityCenter equity upon contribution of net assets by
MGM Resorts International (C). . . . . . . . . . . . . . . . . . . . . . . . . . . . . . . . . . . . . . . . . . . . . . (594,730) (600,122)Completion guarantee (D). . . . . . . . . . . . . . . . . . . . . . . . . . . . . . . . . . . . . . . . . . . . . . . . . . . . . . . . 283,739 292,575Advances to CityCenter, net of discount (E). . . . . . . . . . . . . . . . . . . . . . . . . . . . . . . . . . 217,157 379,167Other-than-temporary impairments of CityCenter investment (F) . . . . . . . . (2,030,113) (2,087,593)Other adjustments (G) . . . . . . . . . . . . . . . . . . . . . . . . . . . . . . . . . . . . . . . . . . . . . . . . . . . . . . . . . . . . (166,152) (70,814)
$ 1,635,572 $ 1,923,155
(A) Includes a $267 million increase for Grand Victoria related to indefinite-lived gaming license rights.(B) Relates to interest capitalized on the Company’s investment balance during the unconsolidated affiliates’ development
and construction stages. Such amounts are being amortized over the life of the underlying assets.(C) Relates to land, other fixed assets, residential real estate, and other assets.(D) The Company funded $92 million and $553 million under the completion guarantee in 2011 and 2010, respectively. The
2011 contribution and $429 million of the 2010 contribution was recognized as equity contributions by the joint venture tobe split by the partners.
(E) The advances to CityCenter are recognized as long-term debt by CityCenter; however, since such advances were providedat below market rates, CityCenter recorded the advances at a discount with a corresponding equity contribution. Thisbasis difference will be resolved when the advances are repaid and upon accretion of the discount.
(F) The impairment of the Company’s CityCenter investment includes $426 million of impairments allocated to land, whichare not amortized. The remaining impairment is being amortized over the average life of the underlying assets.
(G) Other adjustments in 2011 include the deferred gain on the CityCenter transaction, the receivable from CityCenter andthe other-than-temporary impairment of the Company’s Silver Legacy investment. The deferred gain on the CityCentertransaction has been allocated to the underlying assets and is being amortized over the life of the underlying assets. Thereceivable from CityCenter will be resolved when the remaining condominium proceeds owed to the Company under thecompletion guarantee are repaid. Other adjustments in 2010 include the deferred gain on the CityCenter transaction andcertain adjustments related to the Company’s MGM Macau investment.
56

NOTE 7 — GOODWILL AND OTHER INTANGIBLE ASSETS
Goodwill and other intangible assets consisted of the following:
At December 31,2011 2010
(In thousands)
Goodwill:Mirage Resorts acquisition (2000) . . . . . . . . . . . . . . . . . . . . . . . . . . . . . . . . . . . . . . . . . . . . $ 30,451 $ 30,451Mandalay Resort Group acquisition (2005) . . . . . . . . . . . . . . . . . . . . . . . . . . . . . . . . 40,524 45,510MGM China acquisition (2011) . . . . . . . . . . . . . . . . . . . . . . . . . . . . . . . . . . . . . . . . . . . . . . . 2,825,634 -Other. . . . . . . . . . . . . . . . . . . . . . . . . . . . . . . . . . . . . . . . . . . . . . . . . . . . . . . . . . . . . . . . . . . . . . . . . . . . . . . - 1,195
$ 2,896,609 $ 77,156
Indefinite-lived intangible assets:Detroit development rights . . . . . . . . . . . . . . . . . . . . . . . . . . . . . . . . . . . . . . . . . . . . . . . . . . . . $ 98,098 $ 98,098Trademarks, license rights and other. . . . . . . . . . . . . . . . . . . . . . . . . . . . . . . . . . . . . . . . . 234,073 235,672
Total indefinite-lived intangible assets . . . . . . . . . . . . . . . . . . . . . . . . . . . . . . . . . 332,171 333,770
Finite-lived intangible assets:Macau gaming subconcession . . . . . . . . . . . . . . . . . . . . . . . . . . . . . . . . . . . . . . . . . . . . . . . . . 4,496,552 -Less: Accumulated amortization . . . . . . . . . . . . . . . . . . . . . . . . . . . . . . . . . . . . . . . . . . . . . . (121,478) -
4,375,074 -Macau land concession . . . . . . . . . . . . . . . . . . . . . . . . . . . . . . . . . . . . . . . . . . . . . . . . . . . . . . . . . 84,585 -Less: Accumulated amortization . . . . . . . . . . . . . . . . . . . . . . . . . . . . . . . . . . . . . . . . . . . . . . (2,458) -
82,127 -Macau customer lists . . . . . . . . . . . . . . . . . . . . . . . . . . . . . . . . . . . . . . . . . . . . . . . . . . . . . . . . . . . . 128,744 -Less: Accumulated amortization . . . . . . . . . . . . . . . . . . . . . . . . . . . . . . . . . . . . . . . . . . . . . . (32,573) -
96,171 -Macau gaming promoter relationships. . . . . . . . . . . . . . . . . . . . . . . . . . . . . . . . . . . . . . . 180,242 -Less: Accumulated amortization . . . . . . . . . . . . . . . . . . . . . . . . . . . . . . . . . . . . . . . . . . . . . . (25,991) -
154,251 -Other intangible assets . . . . . . . . . . . . . . . . . . . . . . . . . . . . . . . . . . . . . . . . . . . . . . . . . . . . . . . . . 30,226 30,229Less: Accumulated amortization . . . . . . . . . . . . . . . . . . . . . . . . . . . . . . . . . . . . . . . . . . . . . . (21,903) (21,195)
8,323 9,034
Total finite-lived intangible assets . . . . . . . . . . . . . . . . . . . . . . . . . . . . . . . . . . . . . . . 4,715,946 9,034
Total other intangible assets, net . . . . . . . . . . . . . . . . . . . . . . . . . . . . . . . . . . . . . . . . $ 5,048,117 $ 342,804
Goodwill related to the Mirage Resorts acquisition relates to Bellagio and The Mirage. The estimatedfair values of Bellagio and Mirage are substantially in excess of their carrying values including goodwill.The majority of the goodwill related to the Mandalay Resort Group acquisition was written off in 2008 andan additional $5 million related to Railroad Pass was written off in 2011. The remaining balance relates toGold Strike Tunica. See Note 3 for additional information related to goodwill recognized as part of theMGM China transaction.
The Company’s indefinite-lived intangible assets consist primarily of development rights in Detroit,trademarks and license rights, of which $215 million includes trademarks and trade names related to theMandalay acquisition.
57

See Note 3 for additional information related to the finite-lived intangible assets recognized as part ofthe MGM China transaction. The Company’s remaining finite–lived intangible assets consist primarily oflease acquisition costs amortized over the life of the related leases, and certain license rights amortizedover their contractual life. Total amortization expense related to intangible assets was $181 million,$1 million and $3 million for 2011, 2010 and 2009, respectively.
Estimated future amortization is as follows:
(In thousands)
Years ending December 31,2012 . . . . . . . . . . . . . . . . . . . . . . . . . . . . . . . . . . . . . . . . . . . . . . . . . . . . . . . . . . . . . . . . . . . . . . . . . . . . . . . . . . . . . . . . . . . . . . . . . . . . . $ 319,9712013 . . . . . . . . . . . . . . . . . . . . . . . . . . . . . . . . . . . . . . . . . . . . . . . . . . . . . . . . . . . . . . . . . . . . . . . . . . . . . . . . . . . . . . . . . . . . . . . . . . . . . 302,8472014 . . . . . . . . . . . . . . . . . . . . . . . . . . . . . . . . . . . . . . . . . . . . . . . . . . . . . . . . . . . . . . . . . . . . . . . . . . . . . . . . . . . . . . . . . . . . . . . . . . . . . 292,5732015 . . . . . . . . . . . . . . . . . . . . . . . . . . . . . . . . . . . . . . . . . . . . . . . . . . . . . . . . . . . . . . . . . . . . . . . . . . . . . . . . . . . . . . . . . . . . . . . . . . . . . 260,5732016 . . . . . . . . . . . . . . . . . . . . . . . . . . . . . . . . . . . . . . . . . . . . . . . . . . . . . . . . . . . . . . . . . . . . . . . . . . . . . . . . . . . . . . . . . . . . . . . . . . . . . 235,103Thereafter . . . . . . . . . . . . . . . . . . . . . . . . . . . . . . . . . . . . . . . . . . . . . . . . . . . . . . . . . . . . . . . . . . . . . . . . . . . . . . . . . . . . . . . . . . . . . 3,305,090
$ 4,715,946
NOTE 8 — OTHER ACCRUED LIABILITIES
Other accrued liabilities consisted of the following:
At December 31,2011 2010
(In thousands)
Payroll and related . . . . . . . . . . . . . . . . . . . . . . . . . . . . . . . . . . . . . . . . . . . . . . . . . . . . . . . . . . . . . . . . . $ 344,992 $ 256,305Advance deposits and ticket sales . . . . . . . . . . . . . . . . . . . . . . . . . . . . . . . . . . . . . . . . . . . . . . . 97,753 114,808Casino outstanding chip liability . . . . . . . . . . . . . . . . . . . . . . . . . . . . . . . . . . . . . . . . . . . . . . . . . 290,238 79,987Casino front money deposits . . . . . . . . . . . . . . . . . . . . . . . . . . . . . . . . . . . . . . . . . . . . . . . . . . . . . 111,763 97,586Other gaming related accruals . . . . . . . . . . . . . . . . . . . . . . . . . . . . . . . . . . . . . . . . . . . . . . . . . . . 156,837 79,062Taxes, other than income taxes . . . . . . . . . . . . . . . . . . . . . . . . . . . . . . . . . . . . . . . . . . . . . . . . . . 183,576 63,888CityCenter completion guarantee . . . . . . . . . . . . . . . . . . . . . . . . . . . . . . . . . . . . . . . . . . . . . . . 27,515 79,583Other . . . . . . . . . . . . . . . . . . . . . . . . . . . . . . . . . . . . . . . . . . . . . . . . . . . . . . . . . . . . . . . . . . . . . . . . . . . . . . . . . 150,063 96,004
$ 1,362,737 $ 867,223
58
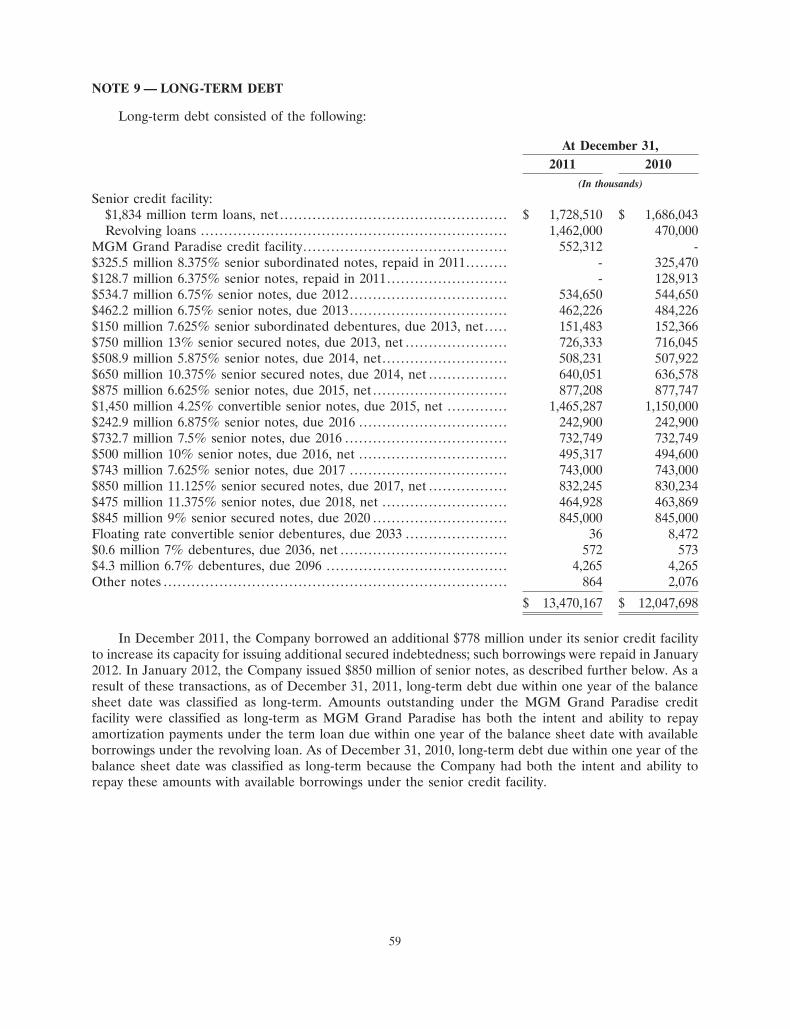
NOTE 9 — LONG-TERM DEBT
Long-term debt consisted of the following:
At December 31,2011 2010
(In thousands)
Senior credit facility:$1,834 million term loans, net . . . . . . . . . . . . . . . . . . . . . . . . . . . . . . . . . . . . . . . . . . . . . . . . . $ 1,728,510 $ 1,686,043Revolving loans . . . . . . . . . . . . . . . . . . . . . . . . . . . . . . . . . . . . . . . . . . . . . . . . . . . . . . . . . . . . . . . . . . 1,462,000 470,000
MGM Grand Paradise credit facility. . . . . . . . . . . . . . . . . . . . . . . . . . . . . . . . . . . . . . . . . . . . 552,312 -$325.5 million 8.375% senior subordinated notes, repaid in 2011. . . . . . . . . - 325,470$128.7 million 6.375% senior notes, repaid in 2011. . . . . . . . . . . . . . . . . . . . . . . . . . - 128,913$534.7 million 6.75% senior notes, due 2012. . . . . . . . . . . . . . . . . . . . . . . . . . . . . . . . . . 534,650 544,650$462.2 million 6.75% senior notes, due 2013. . . . . . . . . . . . . . . . . . . . . . . . . . . . . . . . . . 462,226 484,226$150 million 7.625% senior subordinated debentures, due 2013, net . . . . . 151,483 152,366$750 million 13% senior secured notes, due 2013, net . . . . . . . . . . . . . . . . . . . . . . 726,333 716,045$508.9 million 5.875% senior notes, due 2014, net. . . . . . . . . . . . . . . . . . . . . . . . . . . 508,231 507,922$650 million 10.375% senior secured notes, due 2014, net . . . . . . . . . . . . . . . . . 640,051 636,578$875 million 6.625% senior notes, due 2015, net . . . . . . . . . . . . . . . . . . . . . . . . . . . . . 877,208 877,747$1,450 million 4.25% convertible senior notes, due 2015, net . . . . . . . . . . . . . 1,465,287 1,150,000$242.9 million 6.875% senior notes, due 2016 . . . . . . . . . . . . . . . . . . . . . . . . . . . . . . . . 242,900 242,900$732.7 million 7.5% senior notes, due 2016 . . . . . . . . . . . . . . . . . . . . . . . . . . . . . . . . . . . 732,749 732,749$500 million 10% senior notes, due 2016, net . . . . . . . . . . . . . . . . . . . . . . . . . . . . . . . . 495,317 494,600$743 million 7.625% senior notes, due 2017 . . . . . . . . . . . . . . . . . . . . . . . . . . . . . . . . . . 743,000 743,000$850 million 11.125% senior secured notes, due 2017, net . . . . . . . . . . . . . . . . . 832,245 830,234$475 million 11.375% senior notes, due 2018, net . . . . . . . . . . . . . . . . . . . . . . . . . . . 464,928 463,869$845 million 9% senior secured notes, due 2020 . . . . . . . . . . . . . . . . . . . . . . . . . . . . . 845,000 845,000Floating rate convertible senior debentures, due 2033 . . . . . . . . . . . . . . . . . . . . . . 36 8,472$0.6 million 7% debentures, due 2036, net . . . . . . . . . . . . . . . . . . . . . . . . . . . . . . . . . . . . 572 573$4.3 million 6.7% debentures, due 2096 . . . . . . . . . . . . . . . . . . . . . . . . . . . . . . . . . . . . . . . 4,265 4,265Other notes . . . . . . . . . . . . . . . . . . . . . . . . . . . . . . . . . . . . . . . . . . . . . . . . . . . . . . . . . . . . . . . . . . . . . . . . . . 864 2,076
$ 13,470,167 $ 12,047,698
In December 2011, the Company borrowed an additional $778 million under its senior credit facilityto increase its capacity for issuing additional secured indebtedness; such borrowings were repaid in January2012. In January 2012, the Company issued $850 million of senior notes, as described further below. As aresult of these transactions, as of December 31, 2011, long-term debt due within one year of the balancesheet date was classified as long-term. Amounts outstanding under the MGM Grand Paradise creditfacility were classified as long-term as MGM Grand Paradise has both the intent and ability to repayamortization payments under the term loan due within one year of the balance sheet date with availableborrowings under the revolving loan. As of December 31, 2010, long-term debt due within one year of thebalance sheet date was classified as long-term because the Company had both the intent and ability torepay these amounts with available borrowings under the senior credit facility.
59
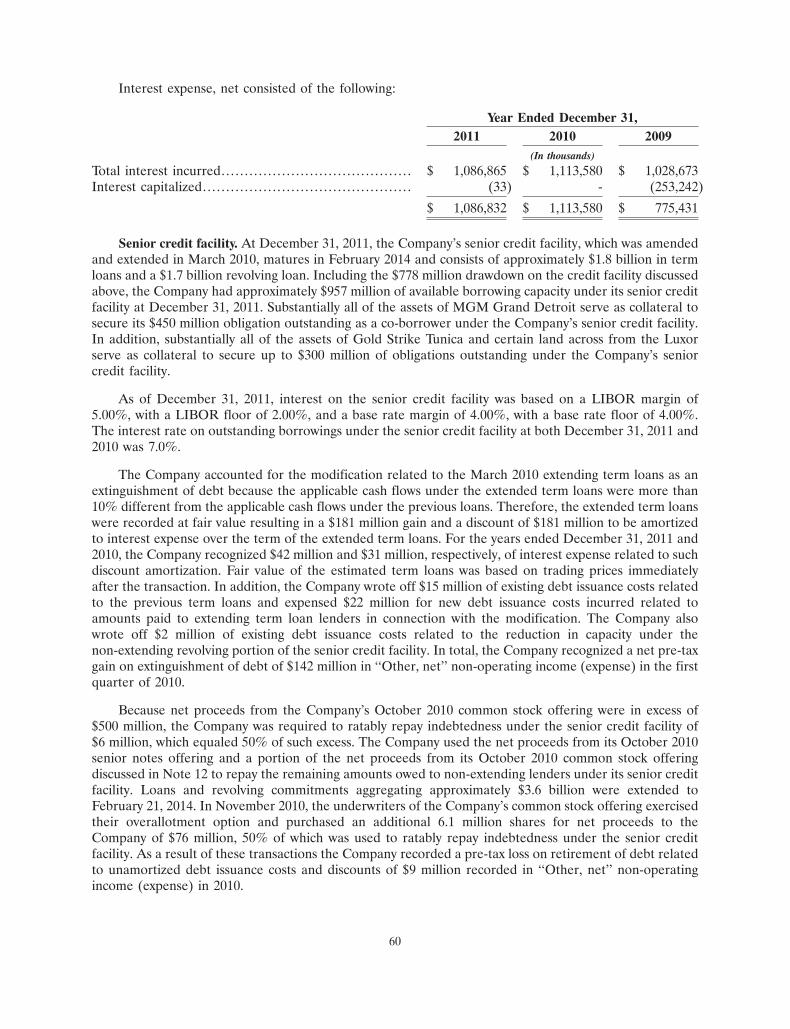
Interest expense, net consisted of the following:
Year Ended December 31,2011 2010 2009
(In thousands)
Total interest incurred. . . . . . . . . . . . . . . . . . . . . . . . . . . . . . . . . . . . . . . . . $ 1,086,865 $ 1,113,580 $ 1,028,673Interest capitalized. . . . . . . . . . . . . . . . . . . . . . . . . . . . . . . . . . . . . . . . . . . . . (33) - (253,242)
$ 1,086,832 $ 1,113,580 $ 775,431
Senior credit facility. At December 31, 2011, the Company’s senior credit facility, which was amendedand extended in March 2010, matures in February 2014 and consists of approximately $1.8 billion in termloans and a $1.7 billion revolving loan. Including the $778 million drawdown on the credit facility discussedabove, the Company had approximately $957 million of available borrowing capacity under its senior creditfacility at December 31, 2011. Substantially all of the assets of MGM Grand Detroit serve as collateral tosecure its $450 million obligation outstanding as a co-borrower under the Company’s senior credit facility.In addition, substantially all of the assets of Gold Strike Tunica and certain land across from the Luxorserve as collateral to secure up to $300 million of obligations outstanding under the Company’s seniorcredit facility.
As of December 31, 2011, interest on the senior credit facility was based on a LIBOR margin of5.00%, with a LIBOR floor of 2.00%, and a base rate margin of 4.00%, with a base rate floor of 4.00%.The interest rate on outstanding borrowings under the senior credit facility at both December 31, 2011 and2010 was 7.0%.
The Company accounted for the modification related to the March 2010 extending term loans as anextinguishment of debt because the applicable cash flows under the extended term loans were more than10% different from the applicable cash flows under the previous loans. Therefore, the extended term loanswere recorded at fair value resulting in a $181 million gain and a discount of $181 million to be amortizedto interest expense over the term of the extended term loans. For the years ended December 31, 2011 and2010, the Company recognized $42 million and $31 million, respectively, of interest expense related to suchdiscount amortization. Fair value of the estimated term loans was based on trading prices immediatelyafter the transaction. In addition, the Company wrote off $15 million of existing debt issuance costs relatedto the previous term loans and expensed $22 million for new debt issuance costs incurred related toamounts paid to extending term loan lenders in connection with the modification. The Company alsowrote off $2 million of existing debt issuance costs related to the reduction in capacity under thenon-extending revolving portion of the senior credit facility. In total, the Company recognized a net pre-taxgain on extinguishment of debt of $142 million in ‘‘Other, net’’ non-operating income (expense) in the firstquarter of 2010.
Because net proceeds from the Company’s October 2010 common stock offering were in excess of$500 million, the Company was required to ratably repay indebtedness under the senior credit facility of$6 million, which equaled 50% of such excess. The Company used the net proceeds from its October 2010senior notes offering and a portion of the net proceeds from its October 2010 common stock offeringdiscussed in Note 12 to repay the remaining amounts owed to non-extending lenders under its senior creditfacility. Loans and revolving commitments aggregating approximately $3.6 billion were extended toFebruary 21, 2014. In November 2010, the underwriters of the Company’s common stock offering exercisedtheir overallotment option and purchased an additional 6.1 million shares for net proceeds to theCompany of $76 million, 50% of which was used to ratably repay indebtedness under the senior creditfacility. As a result of these transactions the Company recorded a pre-tax loss on retirement of debt relatedto unamortized debt issuance costs and discounts of $9 million recorded in ‘‘Other, net’’ non-operatingincome (expense) in 2010.
60

As of December 31, 2011, the senior credit facility allowed the Company to refinance indebtednessmaturing prior to February 21, 2014, but limited its ability to prepay later maturing indebtedness until theextended facilities are paid in full. The Company may issue unsecured debt, equity-linked and equitysecurities to refinance its outstanding indebtedness; however, the Company was required to use netproceeds (a) from certain indebtedness issued in amounts in excess of $250 million (excluding amountsused to refinance indebtedness) and (b) from equity issued, other than in exchange for its indebtedness, inamounts in excess of $500 million (which limit the Company reached with its October 2010 stock offering)to ratably prepay the credit facilities, in each case, in an amount equal to 50% of the net cash proceeds ofsuch excess. Under the February 2012 restated senior credit facility discussed below, the Company is nolonger required to use net proceeds from equity offerings to prepay the restated senior credit facility.
At December 31, 2011, the Company and its restricted subsidiaries were required under the seniorcredit facility to maintain a minimum trailing annual EBITDA (as defined in the agreement governing theCompany’s senior credit facility) of $1.2 billion as of December 31, 2011. EBITDA for the trailing twelvemonths ended December 31, 2011 calculated in accordance with the terms of the senior credit facility was$1.28 billion. Additionally, the Company and its restricted subsidiaries were limited to $500 million ofannual capital expenditures (as defined) during 2011; the Company was in compliance with the maximumcapital expenditures covenants at December 31, 2011. The Company is limited to $500 million of capitalexpenditures in 2012.
February 2012 senior credit facility amendment. The Company’s senior credit facility was amended andrestated in February 2012, and consists of approximately $1.8 billion in term loans and a $1.3 billionrevolver. Under the restated senior credit facility, loans and revolving commitments aggregatingapproximately $1.8 billion (the ‘‘extending loans’’) were extended to February 2015. The extending loansare subject to a pricing grid that decreases the LIBOR spread by as much as 250 basis points based uponcollateral coverage levels at any given time (commencing 45 days after the restatement effective date) andthe LIBOR floor on extended loans is reduced from 200 basis points to 100 basis points.
The restated senior credit facility allows the Company to refinance indebtedness maturing prior toFebruary 23, 2015 but limits its ability to prepay later maturing indebtedness until the extended facilitiesare paid in full. The Company may issue unsecured debt, equity-linked and equity securities to refinance itsoutstanding indebtedness; however, the Company is required to use net proceeds from certainindebtedness issued in amounts in excess of $250 million (excluding amounts used to refinanceindebtedness) to ratably prepay the credit facilities in an amount equal to 50% of the net cash proceeds ofsuch excess. Under the restated senior credit facility the Company is no longer required to use netproceeds from equity offerings to prepay the restated senior credit facility. In connection with the restatedsenior credit facility, the Company agreed to use commercially reasonable efforts to deliver a mortgage,limited in amount to comply with the indenture restrictions, encumbering the Beau Rivage within 90 daysfrom the effective date of the restated loan agreement. Upon the issuance of such mortgage, the holders ofthe Company’s 13% senior secured notes due 2013 would obtain an equal and ratable lien in the collateral.
Under the amended senior credit facility, the Company and its restricted subsidiaries are required tomaintain a minimum trailing annual EBITDA (as defined in the agreement governing its senior creditfacility) of $1.2 billion for each of the quarters of 2012, increasing to $1.25 billion at March 31, 2013, to$1.3 billion at June 30, 2013, and to $1.4 billion at March 31, 2014. Capital expenditure limits previously inplace under the senior credit facility did not change with the amendment.
MGM Grand Paradise credit facility. MGM Grand Paradise’s credit facility is comprised ofapproximately $552 million in term loans and a $400 million revolving loan. The outstanding balance ofMGM Grand Paradise’s credit facility at December 31, 2011 is comprised solely of the $552 million termloans. Scheduled amortization on the term loan begins in July 2012, with a lump sum payment ofapproximately $276 million upon final maturity in July 2015. The revolving loan may be redrawn, but isrequired to be repaid in full on the last date of the respective term loan, no later than July 2015. Interest
61
on the term loan facility is based on HIBOR plus a margin ranging between 3% and 4.5%, based on MGMGrand Paradise’s adjusted leverage ratio, as defined in its credit facility agreement. Interest on therevolving facility can be denominated in either Hong Kong dollars or U.S. dollars and is based on the samemargin range, plus HIBOR or LIBOR, as appropriate. As of December 31, 2011, the credit facility isdenominated entirely in Hong Kong dollars and interest is based on the margin range of 3%, plus HIBOR.Substantially all of the assets of MGM Grand Paradise serve as collateral for the MGM Grand Paradisecredit facility, which is guaranteed by MGM China and certain of its direct and indirect subsidiaries.
At December 31, 2011, MGM Grand Paradise was required to maintain a specified adjusted leverageratio, as defined, at the end of each quarter while the loans are outstanding. The adjusted leverage ratio isrequired to be no greater than 4.00 to 1.00 for each quarter during 2011 and no greater than 3.50 to 1.00thereafter. In addition, MGM Grand Paradise is required to maintain a debt service coverage ratio, asdefined of no less than 1.50 to 1.00 at each quarter end. At December 31, 2011, MGM Grand Paradise wasin compliance with its adjusted leverage ratio and debt service coverage ratios.
Senior convertible notes. In April 2010, the Company issued $1.15 billion of 4.25% convertible seniornotes due 2015 for net proceeds to the Company of $1.12 billion. The notes are general unsecuredobligations of the Company and rank equally in right of payment with the Company’s other existing seniorunsecured indebtedness. The Company used the net proceeds from the senior convertible note issuance totemporarily repay amounts outstanding under its senior credit facility.
The notes are convertible at an initial conversion rate of approximately 53.83 shares of the Company’scommon stock per $1,000 principal amount of the notes, representing an initial conversion price ofapproximately $18.58 per share of the Company’s common stock. The initial conversion rate wasdetermined based on the closing trading price of the Company’s common stock on the date of thetransaction, plus a 27.5% premium. The terms of the notes do not provide for any beneficial conversionfeatures.
In connection with the offering, the Company entered into capped call transactions to reduce thepotential dilution of the Company’s stock upon conversion of the notes. The capped call transactions havea cap price equal to approximately $21.86 per share. The Company paid approximately $81 million for thecapped call transactions, which is reflected as a decrease in ‘‘Capital in excess of par value,’’ net of$29 million of associated tax benefits.
Financial instruments that are indexed to an entity’s own stock and are classified as stockholders’equity in an entity’s statement of financial position are not considered within the scope of derivativeinstruments. The Company performed an evaluation of the embedded conversion option and capped calltransactions, which included an analysis of contingent exercise provisions and settlement requirements,and determined that the embedded conversion option and capped call transactions are considered indexedto the Company’s stock and should be classified as equity, and therefore are not accounted for asderivative instruments. Accordingly, the entire face amount of the notes was recorded as debt untilconverted or retired at maturity, and the capped call transactions were recorded within equity as describedabove.
In June 2011, the Company sold an additional $300 million in aggregate principal amount of theCompany’s 4.25% convertible senior notes due 2015 (the ‘‘Notes’’) on terms that were consistent withthose governing the Company’s existing convertible senior notes due 2015 for a purchase price of103.805% of the principal amount to an indirect wholly owned subsidiary of Ms. Pansy Ho in a transactionexempt from registration under the Securities Act of 1933, as amended. The Notes are convertible at aninitial conversion rate, subject to adjustment under certain circumstances, of approximately 53.83 shares ofthe Company’s common stock per $1,000 principal amount of the Notes. The Company receivedapproximately $311 million in proceeds related to this transaction. The initial agreement to sell the Notesoccurred in April 2011, and the Notes were not sold until June 2011. The agreement to issue the Notes at alater date based on the fixed terms described above constituted a derivative instrument. At issuance, the
62

fair value of the derivative instrument was equal to the difference between the fair value of the Notes andthe Notes’ issuance price. The Notes were recorded at fair value determined by the trading price(105.872%) of the Company’s existing convertible notes on the date of issuance of the Notes, with thedifference recorded as a premium to be recognized over the term of the Notes. The Company recorded aloss of $6 million related to the change in fair value of the derivative in ‘‘Other, net’’ non-operating income(expense) during the second quarter of 2011.
Senior and senior secured notes. In February 2011, the Company repaid the $325 million of outstandingprincipal amount of its 8.375% senior subordinated notes due 2011 at maturity and in December 2011, theCompany repaid the $129 million of outstanding principal of its 6.375% senior notes due 2011 at maturity.
In addition, during the third quarter of 2011 the Company repurchased $10 million principal amountof its 6.75% senior notes due 2012 and $22 million principal amount of its 6.75% senior notes due 2013 inopen market repurchases and recognized a gain of approximately $1 million in ‘‘Other, net’’ non-operatingincome (expense) related to these transactions.
In February 2010, the Company repaid the $297 million of outstanding principal amount of its 9.375%senior subordinated notes due 2010 at maturity. During the second quarter of 2010, the Companyrepurchased $136 million principal amount of its 8.5% senior notes due 2010 and $75 million principalamount of its 8.375% senior notes due 2011 essentially at par. In September 2010, the Company repaid theremaining $646 million of outstanding principal of its 8.5% senior notes due 2010 at maturity.
In March 2010, the Company issued $845 million of 9% senior secured notes due 2020 for netproceeds to the Company of approximately $826 million. The notes are secured by the equity interests andsubstantially all of the assets of MGM Grand Las Vegas and otherwise rank equally in right of paymentwith the Company’s existing and future senior indebtedness. Upon the issuance of such notes, the holdersof the Company’s 13% senior notes due 2013 obtained an equal and ratable lien in all collateral securingthese notes. The Company used the net proceeds from the senior note issuance to permanently repayapproximately $820 million of loans previously outstanding under its credit facility.
In October 2010, the Company issued $500 million of 10% senior notes due 2016, issued at a discountto yield 10.25%, for net proceeds to the Company of approximately $486 million. The notes are unsecuredand otherwise rank equally in right of payment with the Company’s existing and future seniorindebtedness.
Substantially all of the assets of New York-New York serve as collateral for the Company’s 13% seniorsecured notes due 2013, substantially all of the assets of Bellagio and The Mirage serve as collateral for theCompany’s 10.375% senior secured notes due 2014 and the 11.125% senior secured notes due 2017, andsubstantially all of the assets of MGM Grand serve as collateral for the Company’s 9.00% senior securednotes due 2020. Upon the issuance of the 10.375%, 11.125% and 9.00% notes, the holders of theCompany’s 13% senior secured notes due 2013 obtained an equal and ratable lien in all collateral securingthese notes.
Repurchases of senior notes. Subject to certain limitations under its senior credit facility and seniornote indentures, the Company and its subsidiaries may from time to time, in their sole discretion, purchase,repay, redeem or retire any of the Company’s outstanding debt securities, in privately negotiated or openmarket transactions, by tender offer or otherwise pursuant to authorization of the Company’s Board ofDirectors.
January 2012 debt issuance. In January 2012 the Company issued $850 million of 8.625% senior notesdue 2019 for net proceeds to the Company of approximately $836 million. The notes are unsecured andotherwise rank equally in right of payment with the Company’s existing and future senior indebtedness.
63

Maturities of long-term debt. Maturities of the Company’s long-term debt as of December 31, 2011 areas follows:
(In thousands)
Years ending December 31,2012 . . . . . . . . . . . . . . . . . . . . . . . . . . . . . . . . . . . . . . . . . . . . . . . . . . . . . . . . . . . . . . . . . . . . . . . . . . . . . . . . . . . . . . . . . . . . . . . . . . . . . $ 563,1552013 . . . . . . . . . . . . . . . . . . . . . . . . . . . . . . . . . . . . . . . . . . . . . . . . . . . . . . . . . . . . . . . . . . . . . . . . . . . . . . . . . . . . . . . . . . . . . . . . . . . . . 1,445,0732014 . . . . . . . . . . . . . . . . . . . . . . . . . . . . . . . . . . . . . . . . . . . . . . . . . . . . . . . . . . . . . . . . . . . . . . . . . . . . . . . . . . . . . . . . . . . . . . . . . . . . . 4,565,4892015 . . . . . . . . . . . . . . . . . . . . . . . . . . . . . . . . . . . . . . . . . . . . . . . . . . . . . . . . . . . . . . . . . . . . . . . . . . . . . . . . . . . . . . . . . . . . . . . . . . . . . 2,656,3872016 . . . . . . . . . . . . . . . . . . . . . . . . . . . . . . . . . . . . . . . . . . . . . . . . . . . . . . . . . . . . . . . . . . . . . . . . . . . . . . . . . . . . . . . . . . . . . . . . . . . . . 1,475,649Thereafter . . . . . . . . . . . . . . . . . . . . . . . . . . . . . . . . . . . . . . . . . . . . . . . . . . . . . . . . . . . . . . . . . . . . . . . . . . . . . . . . . . . . . . . . . . . . . 2,917,854
13,623,607Debt premiums and discounts, net . . . . . . . . . . . . . . . . . . . . . . . . . . . . . . . . . . . . . . . . . . . . . . . . . . . . . . . . . . . . . . . . . . (153,440)
$ 13,470,167
Fair value of long-term debt. The estimated fair value of the Company’s long-term debt atDecember 31, 2011 was approximately $13.7 billion. Fair value was estimated using quoted market pricesfor the Company’s senior notes, senior subordinated notes and senior credit facility. Carrying value of theMGM Grand Paradise credit facility approximates fair value. At December 31, 2010, the estimated fairvalue of the Company’s long-term debt was approximately $12.4 billion, and was based on quoted marketprices.
NOTE 10 — INCOME TAXES
The Company recognizes deferred income tax assets, net of applicable reserves, related to netoperating loss carryforwards and certain temporary differences. The Company recognizes future taxbenefits to the extent that realization of such benefit is more likely than not. Otherwise, a valuationallowance is applied.
Consolidated income (loss) before taxes for domestic and foreign operations consisted of thefollowing:
Year Ended December 31,2011 2010 2009
(In thousands)
Domestic operations. . . . . . . . . . . . . . . . . . . . . . . . . . . . . . . . . . . . . . . . . . . $ (902,613) $ (2,309,317) $ (2,003,584)Foreign operations . . . . . . . . . . . . . . . . . . . . . . . . . . . . . . . . . . . . . . . . . . . . . 3,734,244 93,292 (9,009)
$ 2,831,631 $ (2,216,025) $ (2,012,593)
64

The income tax provision (benefit) attributable to loss before income taxes is as follows:
Year Ended December 31,2011 2010 2009
(In thousands)
FederalCurrent . . . . . . . . . . . . . . . . . . . . . . . . . . . . . . . . . . . . . . . . . . . . . . . . . . . . . . . . $ 1,237 $ (186,444) $ (391,281)Deferred (excluding operating loss carryforward) . . . . (57,573) (404,522) (280,603)Deferred—operating loss carryforward . . . . . . . . . . . . . . . . . (260,167) (225,589) -Other noncurrent . . . . . . . . . . . . . . . . . . . . . . . . . . . . . . . . . . . . . . . . . . . 2,812 5,167 7,891
Benefit for federal income taxes . . . . . . . . . . . . . . . . . . . . . . (313,691) (811,388) (663,993)
StateCurrent . . . . . . . . . . . . . . . . . . . . . . . . . . . . . . . . . . . . . . . . . . . . . . . . . . . . . . . . 4,482 7,262 1,105Deferred (excluding separate components) . . . . . . . . . . . . (9,472) (13,739) (52,860)Deferred—operating loss carryforward . . . . . . . . . . . . . . . . . 3,357 (9,619) (6,357)Deferred—valuation allowance . . . . . . . . . . . . . . . . . . . . . . . . . . . 7,787 49,208 -Deferred—enacted changes in tax laws or rates . . . . . . 12,743 - -Other noncurrent . . . . . . . . . . . . . . . . . . . . . . . . . . . . . . . . . . . . . . . . . . . 1,320 (1,707) 1,125
Provision (benefit) for state income taxes . . . . . . . . . . . 20,217 31,405 (56,987)
ForeignCurrent . . . . . . . . . . . . . . . . . . . . . . . . . . . . . . . . . . . . . . . . . . . . . . . . . . . . . . . . 3,800 1,355 69Deferred . . . . . . . . . . . . . . . . . . . . . . . . . . . . . . . . . . . . . . . . . . . . . . . . . . . . . . (113,639) - -
Provision (benefit) for foreign income taxes . . . . . . . . (109,839) 1,355 69
$ (403,313) $ (778,628) $ (720,911)
A reconciliation of the federal income tax statutory rate and the Company’s effective tax rate is asfollows:
Year Ended December 31,2011 2010 2009
Federal income tax statutory rate . . . . . . . . . . . . . . . . . . . . . . . . . . . 35.0% 35.0% 35.0%State income tax (net of federal benefit) . . . . . . . . . . . . . . . . . . 0.3 0.5 1.9State valuation allowance. . . . . . . . . . . . . . . . . . . . . . . . . . . . . . . . . . . . . 0.2 (1.5) -Foreign jurisdiction income/losses taxed at other than
35% .. . . . . . . . . . . . . . . . . . . . . . . . . . . . . . . . . . . . . . . . . . . . . . . . . . . . . . . . . . . (2.1) 1.2 (0.4)Foreign jurisdiction tax rate change . . . . . . . . . . . . . . . . . . . . . . . . (4.6) - -MGM China acquisition gain . . . . . . . . . . . . . . . . . . . . . . . . . . . . . . . . (43.2) - -Tax credits . . . . . . . . . . . . . . . . . . . . . . . . . . . . . . . . . . . . . . . . . . . . . . . . . . . . . . . (0.2) 0.2 0.2Permanent and other items . . . . . . . . . . . . . . . . . . . . . . . . . . . . . . . . . . 0.4 (0.3) (0.9)
(14.2)% 35.1% 35.8%
65

The major tax-effected components of the Company’s net deferred tax liability are as follows:
At December 31,2011 2010
(In thousands)
Deferred tax assets—federal and stateBad debt reserve . . . . . . . . . . . . . . . . . . . . . . . . . . . . . . . . . . . . . . . . . . . . . . . . . . . . . . . . . . . . . . . . . $ 36,901 $ 43,007Deferred compensation. . . . . . . . . . . . . . . . . . . . . . . . . . . . . . . . . . . . . . . . . . . . . . . . . . . . . . . . . 2,895 14,278Net operating loss carryforward . . . . . . . . . . . . . . . . . . . . . . . . . . . . . . . . . . . . . . . . . . . . . . 492,515 237,178Accruals, reserves and other. . . . . . . . . . . . . . . . . . . . . . . . . . . . . . . . . . . . . . . . . . . . . . . . . . . 59,874 80,498Investments in unconsolidated affiliates . . . . . . . . . . . . . . . . . . . . . . . . . . . . . . . . . . . . . 340,051 359,849Stock-based compensation . . . . . . . . . . . . . . . . . . . . . . . . . . . . . . . . . . . . . . . . . . . . . . . . . . . . . 56,912 51,582Tax credits . . . . . . . . . . . . . . . . . . . . . . . . . . . . . . . . . . . . . . . . . . . . . . . . . . . . . . . . . . . . . . . . . . . . . . . . . 29,716 27,774Michigan Business Tax deferred asset, net . . . . . . . . . . . . . . . . . . . . . . . . . . . . . . . . . . - 39,068
1,018,864 853,234Less: Valuation allowance. . . . . . . . . . . . . . . . . . . . . . . . . . . . . . . . . . . . . . . . . . . . . . . . . . . . . . . . . (8,779) (35,723)
1,010,085 817,511
Deferred tax assets—foreignBad debt reserve . . . . . . . . . . . . . . . . . . . . . . . . . . . . . . . . . . . . . . . . . . . . . . . . . . . . . . . . . . . . . . . . . 2,273 -Net operating loss carryforward . . . . . . . . . . . . . . . . . . . . . . . . . . . . . . . . . . . . . . . . . . . . . . 50,745 -Property and equipment . . . . . . . . . . . . . . . . . . . . . . . . . . . . . . . . . . . . . . . . . . . . . . . . . . . . . . . . 8,898 -Long-term debt . . . . . . . . . . . . . . . . . . . . . . . . . . . . . . . . . . . . . . . . . . . . . . . . . . . . . . . . . . . . . . . . . . 2,378 -
64,294 -Less: Valuation allowance. . . . . . . . . . . . . . . . . . . . . . . . . . . . . . . . . . . . . . . . . . . . . . . . . . . . . . . . . (63,222) -
1,072 -
Total deferred tax assets . . . . . . . . . . . . . . . . . . . . . . . . . . . . . . . . . . . . . . . . . . . . . . . . . . . . . . . . $ 1,011,157 $ 817,511
Deferred tax liabilities—federal and stateProperty and equipment . . . . . . . . . . . . . . . . . . . . . . . . . . . . . . . . . . . . . . . . . . . . . . . . . . . . . . . . (2,659,471) (2,719,201)Long-term debt . . . . . . . . . . . . . . . . . . . . . . . . . . . . . . . . . . . . . . . . . . . . . . . . . . . . . . . . . . . . . . . . . . (359,873) (366,324)Cost method investments. . . . . . . . . . . . . . . . . . . . . . . . . . . . . . . . . . . . . . . . . . . . . . . . . . . . . . . (34,239) (41,849)Intangibles . . . . . . . . . . . . . . . . . . . . . . . . . . . . . . . . . . . . . . . . . . . . . . . . . . . . . . . . . . . . . . . . . . . . . . . . (100,099) (106,564)
(3,153,682) (3,233,938)
Deferred tax liabilities—foreignAccruals, reserves and other. . . . . . . . . . . . . . . . . . . . . . . . . . . . . . . . . . . . . . . . . . . . . . . . . . . (12,527) -Intangibles . . . . . . . . . . . . . . . . . . . . . . . . . . . . . . . . . . . . . . . . . . . . . . . . . . . . . . . . . . . . . . . . . . . . . . . . (255,984) -
(268,511) -
Total deferred tax liability . . . . . . . . . . . . . . . . . . . . . . . . . . . . . . . . . . . . . . . . . . . . . . . . . . . . . . $ (3,422,193) $ (3,233,938)
Net deferred tax liability . . . . . . . . . . . . . . . . . . . . . . . . . . . . . . . . . . . . . . . . . . . . . . . . . . . . . . . $ (2,411,036) $ (2,416,427)
As discussed in Note 2, the Company identified certain errors related to deferred tax liabilities in itsfinancial statements for years prior to 2009. Such errors have been corrected in the accompanying financialstatements. The 2010 components of the Company’s net deferred tax liability disclosed in the table abovereflect adjustments to correct amounts previously presented as a result of the errors. The deferred tax assetrelated to ‘‘Investments in unconsolidated affiliates’’ was reduced by $74 million, the deferred tax liabilitiesrelated to ‘‘Property and equipment’’ and ‘‘Long-term debt’’ were decreased by $12 million and $4 million,respectively and ‘‘Valuation allowance’’ was decreased by $1 million.
66

The Company recorded a net deferred tax liability of $381 million at June 3, 2011 for the acquisitionof the controlling financial interest in MGM China and a corresponding increase to goodwill. The netdeferred tax liability represented the excess on the acquisition date of the financial reporting amounts ofthe net assets of MGM China over their respective bases under Macau tax law measured at the enacted taxrates expected to apply to taxable income in the periods such differences are expected to be realized, net ofa valuation allowance.
Income generated from gaming operations of MGM Grand Paradise, which is wholly owned by MGMChina, is exempted from Macau’s 12% complementary tax for the five-year period ending December 31,2016 pursuant to approval from the Macau government granted on September 22, 2011. Absent thisexemption, ‘‘Net income attributable to MGM Resorts International’’ would have been reduced by$18 million or $0.03 per share. The approval granted in 2011 represented the second five-year exemptionperiod granted to MGM Grand Paradise. When measuring the net deferred tax liability at June 3, 2011,the Company did not assume an extension of this exemption beyond December 31, 2016. However, duringthe fourth quarter of 2011, the Company changed its assumption concerning the granting of an additionalfive-year exemption period because a competitor of MGM Grand Paradise was granted during suchquarter a third five-year exemption. Therefore the Company believes MGM Grand Paradise should also beentitled to a third five-year exemption in order to ensure non-discriminatory treatment among gamingconcessionaires and sub-concessionaires, a requirement under Macanese law. Accordingly, the Companydecreased this net deferred liability by $129 million during the fourth quarter of 2011 with a correspondingincrease to income tax benefit.
Non-gaming operations remain subject to the Macau complementary tax. MGM Grand Paradise hadat December 31, 2011 a complementary tax net operating loss carryforward of $423 million resulting fromnon-gaming operations that will expire if not utilized against non-gaming income in years 2012 through2014. The Macanese net operating loss carryforwards are fully offset by valuation allowance.
MGM Grand Paradise’s exemption from the Macau 12% complementary tax on gaming profits doesnot apply to dividend distributions of such profits to MGM China. The complementary tax would be leviedon MGM China at the time such profits are distributed. MGM Grand Paradise has submitted a request tothe Macau government to settle the complementary tax that would be due on such distributions by paying aflat annual fee (‘‘Annual Fee Arrangement’’) regardless of the amount of distributable dividends. MGMChina would not be subject to the complementary tax on such distributions if the annual fee arrangementwere in place. Since this arrangement was not in place at December 31, 2011, the Company has provideddeferred taxes in the amount of $15 million on the U.S. GAAP earnings of MGM Grand Paradise from thedate of the acquisition of the controlling financial interest and will continue to do so until an arrangementis in place. Since gaming profits subject to the complementary tax on dividend distributions exceed suchU.S. GAAP earnings, a distribution of such gaming profits before the annual fee arrangement is put inplace could result in the accrual of additional complementary tax in the period such distribution is made.
In February 2012, the board of directors of MGM Grand Paradise declared a distribution to MGMChina that will be subject to complementary tax in the amount of $59 million if the Annual FeeArrangement is not put in place before the tax is due (no later than June 30, 2013). If the Annual FeeArrangement is not in place before March 31, 2012, the Company will provide an additional $44 million ofcomplementary tax above what it would have otherwise accrued on a U.S. GAAP basis in the first quarterof 2012. All complementary tax provided on gaming profits would be reversed in the period the AnnualFee Arrangement is put in place and the agreed annual fee would be accrued in its place.
As of December 31, 2011, the Company had an excess amount for financial reporting over the U.S. taxbasis of its investment in MGM China of $3.8 billion that management does not consider to be essentiallypermanent in duration. The Company expects this basis difference to resolve through repatriations offuture MGM China earnings. The Company has not provided U.S. deferred taxes for such excess financial
67

reporting basis because it believes there would be sufficient foreign tax credits to offset all U.S. income taxthat would result from the future repatriation of such earnings.
For U.S. federal income tax purposes, the Company has a net operating loss carryforward of$1.4 billion that will begin to expire in 2030, an alternative minimum tax credit carryforward of $12 millionthat will not expire and a general business tax credit carryforward of $15 million that will begin to expire in2029. The Company also has a charitable contribution carryforward of $7 million that will begin to expirein 2014 and a foreign tax credit carryforward of $2 million that will expire if not utilized by 2015.
At December 31, 2011 the Company was close to the ownership change threshold set forth in InternalRevenue Code section 382 as a result of transactions in its stock over the past several years. Should anownership change occur in a future period, the Company’s U.S. federal income tax net operating lossesand tax credits incurred prior to the ownership change would generally be subject to a post-change annualusage limitation equal to the value of the Company at the time of the ownership change multiplied by thelong-term tax exempt rate at such time as established by the IRS. The Company does not anticipate thatthis limitation would prevent the utilization of the Company’s net operating losses and tax credits prior totheir expiration or materially impact the cash taxes payable in future years.
For state income tax purposes, the Company has Illinois and New Jersey net operating losscarryforwards of $59 million and $103 million, respectively, which equates to deferred tax assets, afterfederal tax effect and before valuation allowance, of $3 million and $6 million, respectively. The Illinois netoperating loss carryforwards will begin to expire if not utilized by 2021. The New Jersey net operating losscarryforwards will expire if not utilized by various dates from 2012 through 2031.
The state of Michigan enacted during 2011 changes in its corporate tax law that became effective onJanuary 1, 2012. The state replaced the Michigan Business Tax (‘‘MBT’’) regime with a new CorporateIncome Tax (‘‘CIT’’) regime that taxes unitary combined income apportioned to the state at a 6% rate. Netoperating loss carryforwards generated under the MBT, of which the Company had $198 million atDecember 31, 2011, may not be carried over and utilized under the CIT. Losses generated under the CITwill have a 10 year carryforward period. Furthermore, the book-tax difference deduction, which would havebeen available under the MBT in 2015 through 2029, is not available under the CIT. The Companyrecorded during 2011 an increase to the net Michigan deferred tax liability in the amount of $8 million,after federal effect, to reflect the impact of this tax law change, with a corresponding reduction to incometax benefit.
During 2011, the state of Illinois enacted increases to its corporate income tax rate and also suspendedthe use of net operating loss carryforwards for three years, effective beginning 2011. The impact of this taxlaw change on the net Illinois deferred tax liability was less than $1 million.
At December 31, 2011, there is a $6 million valuation allowance, after federal effect, provided oncertain state deferred tax assets, a valuation allowance of $2 million on the U.S. foreign tax credit and avaluation allowance of $63 million on certain Macau deferred tax assets because management believesthese assets do not meet the ‘‘more likely than not’’ criteria for recognition. Given the negative impact ofthe U.S. economy on the results of operations in the past several years and expectations that our recoverywill be tempered by certain aspects of the current economic conditions such as weaknesses in employmentconditions and the housing market, the Company no longer relies on future domestic operating income inassessing the realizability of its domestic deferred tax assets and now relies only on the future reversal ofexisting domestic taxable temporary differences. Since the future reversal of existing U.S. federal taxabletemporary differences currently exceeds the future reversal of existing U.S. federal deductible temporarydifferences, the Company continued to conclude that it is more likely than not that its U.S federal deferredtax assets as of December 31, 2011, other than the foreign tax credit carryforward, are realizable. TheCompany anticipates that the future reversal of its U.S. federal deductible temporary differences couldexceed the future reversal of its U.S. federal taxable temporary differences as early as the first quarter of
68

2012, in which case the Company would record a valuation allowance for such excess with a correspondingreduction of federal income tax benefit on its statement of operations.
The Company assesses its tax positions using a two-step process. A tax position is recognized if itmeets a ‘‘more likely than not’’ threshold, and is measured at the largest amount of benefit that is greaterthan 50 percent likely of being realized. Uncertain tax positions must be reviewed at each balance sheetdate. Liabilities recorded as a result of this analysis must generally be recorded separately from any currentor deferred income tax accounts, and at December 31, 2011, the Company has classified $29 million ascurrent in ‘‘Other accrued liabilities’’ and $112 million as long-term in ‘‘Other long-term obligations,’’based on the time until expected payment.
A reconciliation of the beginning and ending amounts of gross unrecognized tax benefits is as follows:
Year Ended December 31,2011 2010 2009
(In thousands)
Gross unrecognized tax benefits at January 1 . . . . . . . . . . . . $ 134,417 $ 161,377 $ 102,783Gross increases – Prior period tax positions . . . . . . . . . . . 9,360 16,431 13,890Gross decreases – Prior period tax positions . . . . . . . . . . (13,772) (40,347) (10,372)Gross increases – Current period tax positions . . . . . . . 15,794 14,995 60,286Settlements with taxing authorities . . . . . . . . . . . . . . . . . . . . . . - (14,844) (5,210)Lapse in statutes of limitations . . . . . . . . . . . . . . . . . . . . . . . . . . . - (3,195) -
Gross unrecognized tax benefits at December 31 . . . . . . . $ 145,799 $ 134,417 $ 161,377
The total amount of net unrecognized tax benefits that, if recognized, would affect the effective taxrate was $32 million and $30 million at December 31, 2011 and 2010, respectively.
The Company recognizes accrued interest and penalties related to unrecognized tax benefits inincome tax expense. The Company had $26 million in interest related to unrecognized tax benefits accruedat both December 31, 2011 and 2010. No amounts were accrued for penalties as of either date. Income taxexpense for the years ended December 31, 2011, 2010, and 2009 includes interest related to unrecognizedtax benefits of $0 million, $8 million, and $8 million, respectively.
The Company files income tax returns in the U.S. federal jurisdiction, various state and localjurisdictions, and foreign jurisdictions, although the taxes paid in foreign jurisdictions are not material. Asof December 31, 2011, the Company is no longer subject to examination of its U.S. consolidated federalincome tax returns filed for years ended prior to 2005. The IRS completed its examination of theCompany’s consolidated federal income tax returns for the 2003 and 2004 tax years during 2010 and theCompany paid $12 million in tax and $4 million in associated interest with respect to adjustments to whichit agreed. In addition, the Company submitted a protest to IRS Appeals of certain adjustments to which itdid not agree. The Company expects the issues subject to appeal will be settled within the next 12 months.During the fourth quarter of 2010, the IRS opened an examination of the Company’s consolidated federalincome tax returns for the 2005 through 2009 tax years. It is reasonably possible that the IRS will completethis examination within the next 12 months and the Company may agree to certain adjustments and protestothers.
During the first quarter of 2011, the IRS opened audits of the 2007 through 2008 tax years ofCityCenter Holdings LLC, an unconsolidated affiliate treated as a partnership for income tax purposes andthe 2008 through 2009 tax years of MGM Grand Detroit LLC, a subsidiary treated as a partnership forincome tax purposes. It is reasonably possible that the IRS will complete these examinations within thenext 12 months and the Company may agree to certain adjustments and protest others.
69

The Company reached settlement during 2010 with IRS Appeals with respect to the audit of the 2004through 2006 tax years of MGM Grand Detroit, LLC. At issue was the tax treatment of payments madeunder an agreement to develop, own and operate a hotel casino in the City of Detroit. The Companyagreed to pay $1 million in tax for such years as a result of this settlement.
During the fourth quarter of 2010, the Company and its joint venture partner reached tentativesettlement with IRS Appeals with respect to the audit of the 2003 and 2004 tax years of a cost methodinvestee of the Company that is treated as a partnership for income tax purposes. The adjustments towhich the Company agreed in such tentative settlement will be included in any settlement that it may reachwith respect to the 2003 and 2004 examination of its consolidated federal income tax return. The IRS iscurrently auditing the 2005 through 2009 tax years of this investee. It is reasonably possible that the IRSwill complete this examination within the next 12 months and the Company may agree to certainadjustments and protest others.
The IRS closed during 2010 its examination of the federal income tax return of Mandalay ResortGroup for the pre-acquisition year ended April 25, 2005 and issued a ‘‘No-Change Letter.’’ The statutes oflimitations for assessing tax for all Mandalay Resort Group pre-acquisition years are now closed.
As of December 31, 2011, other than the exceptions noted below, the Company was no longer subjectto examination of its various state and local tax returns filed for years ended prior to 2007. The state ofIllinois during 2010 initiated an audit of its Illinois combined returns for the 2006 and 2007 tax years. TheCompany expects that this audit will close and all issues will be settled in the next 12 months. The state ofNew Jersey began audit procedures during 2010 of a cost method investee of the Company’s for the 2003through 2006 tax years. No other state or local income tax returns are currently under exam.
The Company believes that it is reasonably possible that the total amounts of unrecognized taxbenefits at December 31, 2011 may decrease by a range of $25 to $36 million within the next twelve monthson the expectation during such period of (1) settlement of issues under appeal in connection with the IRSaudit of the Company’s 2003 and 2004 consolidated federal income tax returns, and (2) the possible closureof the IRS audits of the 2005 through 2009 consolidated federal income tax returns; the 2007 through 2008federal income tax returns of CityCenter Holdings, LLC; the 2008 through 2009 federal income tax returnsof MGM Grand Detroit, LLC and the 2005 through 2009 federal income tax returns of its cost methodinvestee.
NOTE 11 — COMMITMENTS AND CONTINGENCIES
Leases. The Company leases real estate and various equipment under operating and, to a lesserextent, capital lease arrangements. Certain real estate leases provide for escalation of rent based upon aspecified price index and/or based upon periodic appraisals.
70
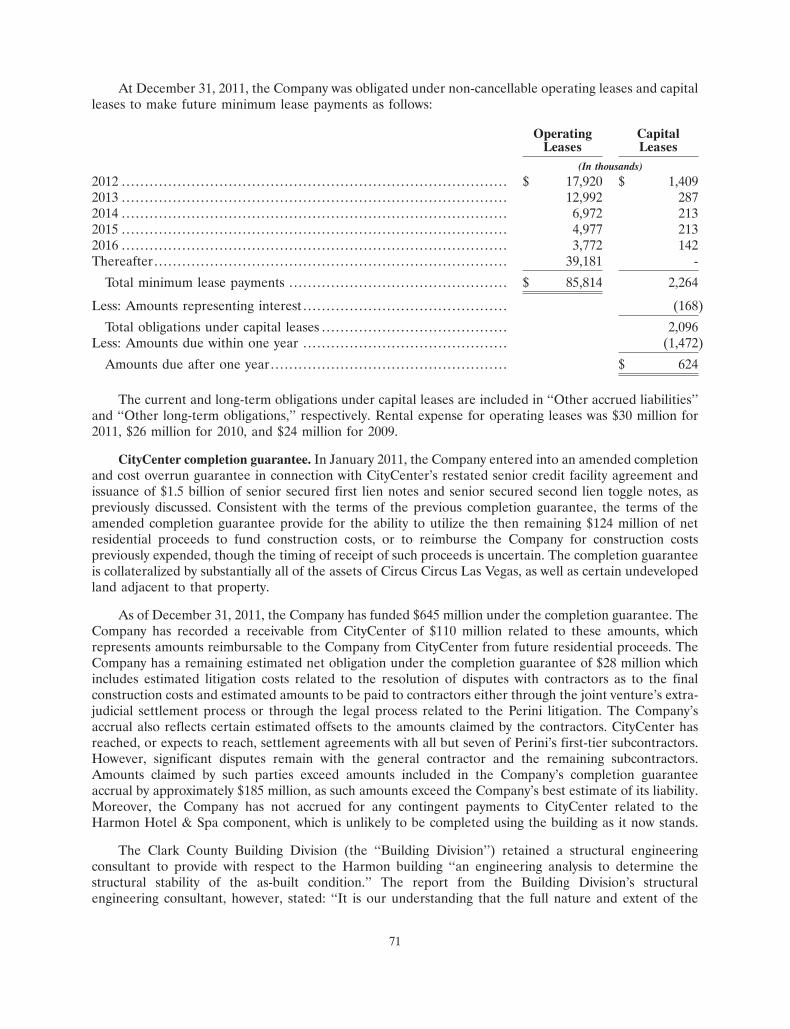
At December 31, 2011, the Company was obligated under non-cancellable operating leases and capitalleases to make future minimum lease payments as follows:
Operating CapitalLeases Leases
(In thousands)
2012 . . . . . . . . . . . . . . . . . . . . . . . . . . . . . . . . . . . . . . . . . . . . . . . . . . . . . . . . . . . . . . . . . . . . . . . . . . . . . . . . . . . $ 17,920 $ 1,4092013 . . . . . . . . . . . . . . . . . . . . . . . . . . . . . . . . . . . . . . . . . . . . . . . . . . . . . . . . . . . . . . . . . . . . . . . . . . . . . . . . . . . 12,992 2872014 . . . . . . . . . . . . . . . . . . . . . . . . . . . . . . . . . . . . . . . . . . . . . . . . . . . . . . . . . . . . . . . . . . . . . . . . . . . . . . . . . . . 6,972 2132015 . . . . . . . . . . . . . . . . . . . . . . . . . . . . . . . . . . . . . . . . . . . . . . . . . . . . . . . . . . . . . . . . . . . . . . . . . . . . . . . . . . . 4,977 2132016 . . . . . . . . . . . . . . . . . . . . . . . . . . . . . . . . . . . . . . . . . . . . . . . . . . . . . . . . . . . . . . . . . . . . . . . . . . . . . . . . . . . 3,772 142Thereafter . . . . . . . . . . . . . . . . . . . . . . . . . . . . . . . . . . . . . . . . . . . . . . . . . . . . . . . . . . . . . . . . . . . . . . . . . . . . 39,181 -
Total minimum lease payments . . . . . . . . . . . . . . . . . . . . . . . . . . . . . . . . . . . . . . . . . . . . . . . $ 85,814 2,264
Less: Amounts representing interest . . . . . . . . . . . . . . . . . . . . . . . . . . . . . . . . . . . . . . . . . . . . (168)
Total obligations under capital leases . . . . . . . . . . . . . . . . . . . . . . . . . . . . . . . . . . . . . . . . 2,096Less: Amounts due within one year . . . . . . . . . . . . . . . . . . . . . . . . . . . . . . . . . . . . . . . . . . . . (1,472)
Amounts due after one year. . . . . . . . . . . . . . . . . . . . . . . . . . . . . . . . . . . . . . . . . . . . . . . . . . . $ 624
The current and long-term obligations under capital leases are included in ‘‘Other accrued liabilities’’and ‘‘Other long-term obligations,’’ respectively. Rental expense for operating leases was $30 million for2011, $26 million for 2010, and $24 million for 2009.
CityCenter completion guarantee. In January 2011, the Company entered into an amended completionand cost overrun guarantee in connection with CityCenter’s restated senior credit facility agreement andissuance of $1.5 billion of senior secured first lien notes and senior secured second lien toggle notes, aspreviously discussed. Consistent with the terms of the previous completion guarantee, the terms of theamended completion guarantee provide for the ability to utilize the then remaining $124 million of netresidential proceeds to fund construction costs, or to reimburse the Company for construction costspreviously expended, though the timing of receipt of such proceeds is uncertain. The completion guaranteeis collateralized by substantially all of the assets of Circus Circus Las Vegas, as well as certain undevelopedland adjacent to that property.
As of December 31, 2011, the Company has funded $645 million under the completion guarantee. TheCompany has recorded a receivable from CityCenter of $110 million related to these amounts, whichrepresents amounts reimbursable to the Company from CityCenter from future residential proceeds. TheCompany has a remaining estimated net obligation under the completion guarantee of $28 million whichincludes estimated litigation costs related to the resolution of disputes with contractors as to the finalconstruction costs and estimated amounts to be paid to contractors either through the joint venture’s extra-judicial settlement process or through the legal process related to the Perini litigation. The Company’saccrual also reflects certain estimated offsets to the amounts claimed by the contractors. CityCenter hasreached, or expects to reach, settlement agreements with all but seven of Perini’s first-tier subcontractors.However, significant disputes remain with the general contractor and the remaining subcontractors.Amounts claimed by such parties exceed amounts included in the Company’s completion guaranteeaccrual by approximately $185 million, as such amounts exceed the Company’s best estimate of its liability.Moreover, the Company has not accrued for any contingent payments to CityCenter related to theHarmon Hotel & Spa component, which is unlikely to be completed using the building as it now stands.
The Clark County Building Division (the ‘‘Building Division’’) retained a structural engineeringconsultant to provide with respect to the Harmon building ‘‘an engineering analysis to determine thestructural stability of the as-built condition.’’ The report from the Building Division’s structuralengineering consultant, however, stated: ‘‘It is our understanding that the full nature and extent of the
71

current as-built condition has not been documented or provided to us at the current time. We based thisstudy only on information that was obtained from the available design documents, non-compliance reportsand limited visual observations.’’ Thus, the Building Division’s structural engineering consultant apparentlydid not perform other testing or a relevant analysis of the building in its current, as-built condition.
Among its general findings the report of the Building Division’s structural engineering consultantstated: ‘‘Our analytical findings suggest that the as-designed Harmon Tower structure is structurally stableunder design loads from a maximum considered earthquake (MCE) event;’’ and further, ‘‘Our analysisindicates that the as-designed strength of Harmon Tower’s shear wall system is generally sufficient to resistthe design loads from a maximum considered earthquake (MCE).’’ The report from the BuildingDivision’s structural engineering consultant recommended further study of the Harmon building’svulnerabilities. Accordingly, since the County’s consultant did not appear to have performed an as-builtanalysis, the report that was issued has minimal value if any in resolution of the issues presented to theCompany’s pending litigation with Perini.
The Building Division requested that CityCenter conduct an analysis, based on all availableinformation, as to the structural stability of the Harmon under building-code-specified load combinations.On July 11, 2011 a consulting engineer engaged by CityCenter for this review submitted the results of hisanalysis of the Harmon tower and podium in its current as-built condition. The engineer opined, amongother things, that ‘‘[i]n a code-level earthquake, using either the permitted or current code specified loads,it is likely that critical structural members in the tower will fail and become incapable of supporting gravityloads, leading to a partial or complete collapse of the tower. There is missing or misplaced reinforcing steelin columns, beams, shear walls, and transfer walls throughout the structure of the tower below the twenty-first floor.’’ In response to this opinion, on July 12, 2011 the Building Division required CityCenter, nolater than August 15, 2011, ‘‘to provide a plan of action that will abate the potential for structural collapseand protect impacted uses and occupancies.’’ Under the relevant building code provision, ‘‘abate’’ meansrepair, rehabilitation, demolition or removal of the subject building.
On August 15, 2011, after expert consultation, CityCenter submitted its reply to the Building Division.CityCenter informed the Building Division it has decided to abate the potential for structural collapse ofthe Harmon in the event of a code-level earthquake by demolishing the building, and enclosed a plan ofaction for demolition by implosion prepared by LVI Environmental Services of Nevada, Inc. CityCenteralso advised that prior to undertaking the demolition plan of action, it will seek relief from a standingorder of the District Court judge presiding over the Perini litigation that prohibits alteration or destructionof the building without court approval. In addition, CityCenter supplied the foundational data for theengineering conclusions stated in the July 11, 2011 letter declaring the Harmon’s structural instability inthe event of a code-level earthquake.
The Building Division advised CityCenter that the Building Division’s staff would review CityCenter’sAugust 15, 2011 submission and then issue its conclusions to CityCenter, but the Building Division did notspecify a date for such guidance. By letter dated August 18, 2011, the Building Division requested ameeting with CityCenter’s retained engineering firm concerning its conclusions regarding the Harmon’sas-built condition. Pursuant to this request by the Building Division, representatives from CityCenter’sretained engineering firm met with the Building Division and directly responded to the Building Division’sinquiries.
On November 22, 2011, the Building Division informed CityCenter by letter that ‘‘[b]ased on theinformation provided to Clark County Development Services including but not limited to the Weidlinger &Associates Letter of August 11, 2011 and subsequent conversations, it is required that MGM Resortssubmit a plan abating the code deficiencies discovered in the Harmon Tower.’’ CityCenter has made amotion to the court presiding over the Perini litigation for permission to proceed with the demolition ofthe Harmon in advance of the conclusion of the litigation. That motion is set for hearing on March 12,2012. CityCenter has also resubmitted the plan of abatement action prepared by LVI which was submitted
72

on August 15, 2011, and applied to the Building Division for appropriate demolition permits andapprovals. Those applications are pending.
The Company does not believe it would be responsible for funding under the completion guaranteeany additional remediation efforts that might be required with respect to the Harmon; however, theCompany’s view is based on a number of developing factors, including with respect to on-going litigationwith CityCenter’s contractors, actions by local officials and other developments related to the CityCenterventure, that are subject to change. CityCenter’s restated senior credit facility provides that certaindemolition expenses may be funded only by equity contributions from the members of the CityCenterventure or certain specified extraordinary receipts (which include any proceeds from the Perini litigation).Based on current estimates, which are subject to change, the Company believes the demolition of theHarmon would cost approximately $31 million.
CityCenter construction litigation. In March 2010, Perini Building Company, Inc. (‘‘Perini’’), generalcontractor for CityCenter, filed a lawsuit in the Eighth Judicial District Court for Clark County, State ofNevada, against MGM MIRAGE Design Group (a wholly owned subsidiary of the Company which was theoriginal party to the Perini construction agreement) and certain direct or indirect subsidiaries ofCityCenter Holdings, LLC (the ‘‘CityCenter Owners’’). Perini asserts that CityCenter was substantiallycompleted, but the defendants failed to pay Perini approximately $490 million allegedly due and owingunder the construction agreement for labor, equipment and materials expended on CityCenter. Thecomplaint further charges the defendants with failure to provide timely and complete design documents,late delivery to Perini of design changes, mismanagement of the change order process, obstruction ofPerini’s ability to complete the Harmon component, and fraudulent inducement of Perini to compromisesignificant amounts due for its general conditions. The complaint advances claims for breach of contract,breach of the implied covenant of good faith and fair dealing, tortious breach of the implied covenant ofgood faith and fair dealing, unjust enrichment and promissory estoppel, and fraud and intentionalmisrepresentation. Perini seeks compensatory damages, punitive damages, attorneys’ fees and costs.
In April 2010, Perini served an amended complaint in this case which joins as defendants many ownersof CityCenter residential condominium units (the ‘‘Condo Owner Defendants’’), adds a count forforeclosure of Perini’s recorded master mechanic’s lien against the CityCenter property in the amount ofapproximately $491 million, and asserts the priority of this mechanic’s lien over the interests of theCityCenter Owners, the Condo Owner Defendants and CityCenter lenders in the CityCenter property.
The CityCenter Owners and the other defendants dispute Perini’s allegations, and contend that thedefendants are entitled to substantial amounts from Perini, including offsets against amounts claimed to beowed to Perini and its subcontractors and damages based on breach of their contractual and other duties toCityCenter, duplicative payment requests, non-conforming work, lack of proof of alleged workperformance, defective work related to the Harmon, property damage and Perini’s failure to perform itsobligations to pay certain subcontractors and to prevent filing of liens against CityCenter. Parallel to thecourt litigation, CityCenter management conducted an extra-judicial program for settlement of CityCentersubcontractor claims. CityCenter has resolved the claims of 215 first-tier Perini subcontractors (includingthe claims of any lower-tier subcontractors that might have claims through those first-tier subcontractors),with only seven remaining for further proceedings along with trial of Perini’s claims and CityCenter’sHarmon-related counterclaim and other claims by CityCenter against Perini and its parent guarantor,Tutor Perini. Three of the remaining subcontractors are implicated in the defective work at the Harmon. InDecember 2010, Perini recorded an amended notice of lien reducing its lien to approximately $313 million.Because of settlements with subcontractors, CityCenter believes it is entitled to a further lien reduction ofapproximately $133 million (for a revised lien amount of $186 million, including certain liens not related toPerini’s lien) once the Company has provided the court and Perini with the required information.
The court has set a trial date of February 4, 2013 for the consolidated action involving Perini, theremaining Perini subcontractors and any related third parties. The CityCenter Owners and the other
73

defendants will continue to vigorously assert and protect their interests in the Perini lawsuit. The Companybelieves that a loss with respect to Perini’s punitive damages claim is neither probable nor reasonablypossible. Please refer to the disclosure above for further discussion on the Company’s completionguarantee obligation which may be impacted by the outcome of the above litigation and the joint venture’sextra-judicial settlement process.
Sales and use tax on complimentary meals. In March 2008, the Nevada Supreme Court ruled, in acase involving another gaming company, that food and non-alcoholic beverages purchased for use inproviding complimentary meals to customers and to employees were exempt from use tax. The Companyhad previously paid use tax on these items and has generally filed for refunds for the periods from January2001 to February 2008 related to this matter. The Company is claiming the exemption on sales and use taxreturns for periods after February 2008 in light of this Nevada Supreme Court decision and has notaccrued or paid any sales or use tax for those periods. Recently the Nevada Department of Taxation hasasserted that gaming companies should pay sales tax on customer complimentary meals and employeemeals on a prospective basis. This position stems from a recent Nevada Tax Commission decisionconcerning another gaming company which states that complimentary meals provided to customers aresubject to sales tax at the retail value of the meal and employee meals are subject to sales tax at the cost ofthe meal. The other gaming company filed in Clark County District Court a petition for judicial review ofthe Nevada Tax Commission decision. The Company is currently evaluating whether or not to accrue taxprospectively as it disagrees with the position asserted by the Nevada Department of Taxation.
Other guarantees. The Company is party to various guarantee contracts in the normal course ofbusiness, which are generally supported by letters of credit issued by financial institutions. The Company’ssenior credit facility limits the amount of letters of credit that can be issued to $250 million, and theamount of available borrowings under the senior credit facility is reduced by any outstanding letters ofcredit. At December 31, 2011, the Company had provided $37 million of total letters of credit. In addition,MGM China had provided approximately $40 million of guarantees under the MGM Grand Paradisecredit facility.
Other litigation. The Company is a party to various legal proceedings, most of which relate to routinematters incidental to its business. Management does not believe that the outcome of such proceedings willhave a material adverse effect on the Company’s financial position, results of operations or cash flows.
NOTE 12 — STOCKHOLDERS’ EQUITY
Authorized common stock. In June 2011, the stockholders of the Company approved a proposal toamend and restate the Amended and Restated Certificate of Incorporation of the Company to increase theCompany’s number of authorized shares of common stock to 1,000,000,000 shares.
Stock offering. In October 2010, the Company issued 40.9 million shares of its common stock for totalnet proceeds to the Company of $512 million. Concurrently with the Company’s issuance, Tracinda soldapproximately 27.8 million shares of the Company’s common stock. The Company did not receive anyproceeds from the sale of such common stock by Tracinda. In November 2010, the underwriter exercised itsability to purchase an additional 6.1 million shares from the Company and 4.2 million shares from Tracindato cover overallotments, with net proceeds to the Company of approximately $77 million. Proceeds fromthe common stock offering were used to repay outstanding amounts under the Company’s senior creditfacility (see Note 9) and for general corporate purposes.
Stock repurchases. Share repurchases are only conducted under repurchase programs approved by theBoard of Directors and publicly announced. At December 31, 2011, the Company had 20 million sharesavailable for repurchase under the May 2008 authorization, subject to limitations under the Company’sagreements governing its long-term indebtedness. The Company did not repurchase any shares during2011, 2010 or 2009.
74

MGM China Dividend. In February 2012, MGM China’s Board of Directors declared a dividend ofapproximately $400 million which will be paid to shareholders of record as of March 9, 2012, anddistributed on or about March 20, 2012. The Company will receive approximately $204 million,representing 51% of such dividend.
NOTE 13 — NONCONTROLLING INTERESTS
As discussed in Note 3, the Company became the controlling shareholder of MGM China and beganconsolidating the financial position of MGM China in its financial statements as of June 3, 2011. Thenoncontrolling interests in MGM China and other minor subsidiaries are presented as a separatecomponent of stockholders’ equity in the Company’s consolidated balance sheets, and the net incomeattributable to noncontrolling interests is presented on the Company’s consolidated statements ofoperations. Net income attributable to noncontrolling interests was $120 million for the year endedDecember 31, 2011.
NOTE 14 — STOCK-BASED COMPENSATION
2005 Omnibus Incentive Plan. The Company’s omnibus incentive plan, as amended (the ‘‘OmnibusPlan’’), allows it to grant stock options, stock appreciation rights (‘‘SARs’’), restricted stock, restrictedstock units (‘‘RSUs’’), and other stock-based awards to eligible directors, officers and employees of theCompany and its subsidiaries. The Omnibus Plan is administered by the Compensation Committee (the‘‘Committee’’) of the Board of Directors. The Committee has discretion under the Omnibus Planregarding which type of awards to grant, the vesting and service requirements, exercise price and otherconditions, in all cases subject to certain limits, including:
• As amended, the Omnibus Plan allows for the issuance of up to 35 million shares or share-basedawards; and
• For stock options and SARs, the exercise price of the award must be at least equal to the fairmarket value of the stock on the date of grant and the maximum term of such an award is 10 years.
Stock options and SARs granted under all plans generally have terms of either seven or ten years, andin most cases vest in either four or five equal annual installments. RSUs granted vest ratably over fouryears.
75

As of December 31, 2011, the Company had an aggregate of approximately 8 million shares ofcommon stock available for grant as share-based awards under the Omnibus Plan. A summary of activityunder the Company’s share-based payment plans for the year ended December 31, 2011 is presentedbelow:
Stock options and stock appreciation rights (‘‘SARs’’)
WeightedWeighted AverageAverage Remaining Aggregate
Shares Exercise Contractual Intrinsic(000’s) Price Term Value
Outstanding at January 1, 2011 . . . . . . . . . . . . . . . . . . . . . . . . . . . . 28,129 $ 21.73Granted . . . . . . . . . . . . . . . . . . . . . . . . . . . . . . . . . . . . . . . . . . . . . . . . . . . . . . . . 3,514 9.06Exercised. . . . . . . . . . . . . . . . . . . . . . . . . . . . . . . . . . . . . . . . . . . . . . . . . . . . . . . (268) 10.38Forfeited or expired . . . . . . . . . . . . . . . . . . . . . . . . . . . . . . . . . . . . . . . . . . (1,055) 26.94
Outstanding at December 31, 2011 . . . . . . . . . . . . . . . . . . . . . . . . 30,320 20.18 3.07 $ 20,384
Vested and expected to vest at December 31, 2011 . . . . . 29,686 20.40 3.00 $ 19,607
Exercisable at December 31, 2011 . . . . . . . . . . . . . . . . . . . . . . . . . 20,631 24.34 1.89 $ 7,821
As of December 31, 2011, there was a total of $50 million of unamortized compensation related tostock options and stock appreciation rights expected to vest, which is expected to be recognized over aweighted-average period of 1.8 years.
Restricted stock units (‘‘RSUs’’)
WeightedAverage
Grant-DateShares Fair(000’s) Value
Nonvested at January 1, 2011 . . . . . . . . . . . . . . . . . . . . . . . . . . . . . . . . . . . . . . . . . . . . . . . . . . . . . . . . . . . . . . . . 1,144 $ 13.90Granted . . . . . . . . . . . . . . . . . . . . . . . . . . . . . . . . . . . . . . . . . . . . . . . . . . . . . . . . . . . . . . . . . . . . . . . . . . . . . . . . . . . . . . . . . 518 8.28Vested . . . . . . . . . . . . . . . . . . . . . . . . . . . . . . . . . . . . . . . . . . . . . . . . . . . . . . . . . . . . . . . . . . . . . . . . . . . . . . . . . . . . . . . . . . . (367) 14.87Forfeited . . . . . . . . . . . . . . . . . . . . . . . . . . . . . . . . . . . . . . . . . . . . . . . . . . . . . . . . . . . . . . . . . . . . . . . . . . . . . . . . . . . . . . . . (114) 13.77
Nonvested at December 31, 2011 . . . . . . . . . . . . . . . . . . . . . . . . . . . . . . . . . . . . . . . . . . . . . . . . . . . . . . . . . . . 1,181 11.15
As of December 31, 2011, there was a total of $19 million of unamortized compensation related toRSUs which is expected to be recognized over a weighted-average period of 1.3 years.
The following table includes additional information related to stock options, SARs and RSUs:
Year Ended December 31,2011 2010 2009
(In thousands)Intrinsic value of share-based awards exercised or RSUs vested . . . . . . . . $ 4,841 $ 4,377 $ 2,546Income tax benefit from share-based awards exercised or RSUs
vested . . . . . . . . . . . . . . . . . . . . . . . . . . . . . . . . . . . . . . . . . . . . . . . . . . . . . . . . . . . . . . . . . . . . . . . . . . 1,675 1,521 891Proceeds from stock option exercises . . . . . . . . . . . . . . . . . . . . . . . . . . . . . . . . . . . . . . . . - - 637
In 2009, the Company began to net settle stock option exercises, whereby shares of common stock areissued equivalent to the intrinsic value of the option less applicable taxes. Accordingly, the Company nolonger receives proceeds from the exercise of stock options.
76

MGM China Share Option Plan. The Company’s subsidiary, MGM China, adopted an equity awardplan in 2011 for grants of stock options to purchase ordinary shares of MGM China to eligible directors,employees and non-employees of MGM China and its subsidiaries (‘‘MGM China Plan’’). The MGMChina Plan is administered by MGM China’s Board of Directors, which has the discretion to determine theexercise price and term of the award, as well as other conditions, in all cases subject to certain limits,including:
• The current MGM China Plan allows for a maximum of 30% of the total number of shares of MGMChina in issue at the date of approval of the MGM China Plan to be issued upon exercise; and
• The exercise price of the award must be the higher of the closing price of the stock on the offerdate, or the average of the closing price for the five business days immediately preceding the offerdate, and the maximum term of the award must not exceed ten years.
Stock options currently granted under the MGM China Plan have a term of ten years, and vest in fourequal annual installments. Expense is recognized on a straight-line basis over the vesting period of theawards net of estimated forfeitures. Forfeitures are estimated at the time of grant, with such estimateupdated periodically and with actual forfeitures recognized currently to the extent they differ from theestimate. The Company estimates the fair value of stock options granted under the MGM China Planusing the Black-Scholes model. Expected volatilities are based on historical volatility from a selection ofcompanies in MGM China’s peer group due to MGM China’s lack of historical information. The Companydetermined expected term based on a binomial model. The risk-free interest rate was based on rates ineffect at the grant date for the Hong Kong Exchange Fund Note with maturities matching the relevantexpected term of the award.
As of December 31, 2011, MGM China had an aggregate of approximately 1.1 billion shares ofoptions available for grant as share-based awards. A summary of activity under the MGM China Plan forthe year ended December 31, 2011 is presented below:
Stock options
WeightedWeighted AverageAverage Remaining Aggregate
Shares Exercise Contractual Intrinsic(000’s) Price Term Value
Outstanding at January 1, 2011 . . . . . . . . . . . . . . . . . . . . . . . . . . . . - $ -Granted . . . . . . . . . . . . . . . . . . . . . . . . . . . . . . . . . . . . . . . . . . . . . . . . . . . . . . . . 19,260 1.99
Outstanding at December 31, 2011 . . . . . . . . . . . . . . . . . . . . . . . . 19,260 1.99 3.45 $ -
Vested and expected to vest at December 31, 2011 . . . . . 18,297 1.99 3.45 $ -
As of December 31, 2011, there was a total of $20 million of unamortized compensation related tostock options expected to vest, which is expected to be recognized over a weighted-average period of3.5 years.
77

Recognition of compensation cost. Compensation cost for both the Omnibus Plan and MGM ChinaPlan was recognized as follows:
Year Ended December 31,2011 2010 2009
(In thousands)
Compensation costStock options and SARS.. . . . . . . . . . . . . . . . . . . . . . . . . . . . . . . . . . $ 23,956 $ 20,554 $ 21,756RSUs . . . . . . . . . . . . . . . . . . . . . . . . . . . . . . . . . . . . . . . . . . . . . . . . . . . . . . . . . . 17,147 19,693 21,294MGM China Plan . . . . . . . . . . . . . . . . . . . . . . . . . . . . . . . . . . . . . . . . . . . 3,176 - -
Total compensation cost. . . . . . . . . . . . . . . . . . . . . . . . . . . . . . . . . 44,279 40,247 43,050Less: CityCenter reimbursed costs . . . . . . . . . . . . . . . . . . . . . . . . . . (4,572) (5,259) (6,415)Less: Compensation cost capitalized . . . . . . . . . . . . . . . . . . . . . . . - - (64)
Compensation cost recognized as expense . . . . . . . . . 39,707 34,988 36,571Less: Related tax benefit . . . . . . . . . . . . . . . . . . . . . . . . . . . . . . . . . . . . . (12,712) (12,162) (12,689)
Compensation expense, net of tax benefit . . . . . . . . . $ 26,995 $ 22,826 $ 23,882
Compensation cost for SARs granted under the 2005 Omnibus Plan is based on the fair value of eachaward, measured by applying the Black-Scholes model on the date of grant, using the following weighted-average assumptions:
Year Ended December 31,2011 2010 2009
Expected volatility . . . . . . . . . . . . . . . . . . . . . . . . . . . . . . . . . . . . . . . . . . . . . 72% 71% 82%Expected term .. . . . . . . . . . . . . . . . . . . . . . . . . . . . . . . . . . . . . . . . . . . . . . . . . 4.9 yrs. 4.8 yrs. 4.7 yrs.Expected dividend yield . . . . . . . . . . . . . . . . . . . . . . . . . . . . . . . . . . . . . . 0% 0% 0%Risk-free interest rate . . . . . . . . . . . . . . . . . . . . . . . . . . . . . . . . . . . . . . . . . 1.0% 1.9% 2.4%Weighted-average fair value of options granted. . . . . . . . . . $ 5.29 $ 6.91 $ 5.37
Expected volatility is based in part on historical volatility and in part on implied volatility based ontraded options on the Company’s stock. The expected term considers the contractual term of the option aswell as historical exercise and forfeiture behavior. The risk-free interest rate is based on the rates in effecton the grant date for U.S. Treasury instruments with maturities matching the relevant expected term of theaward.
Compensation cost for stock options granted under the MGM China Plan is based on the fair value ofeach award, measured by applying the Black-Scholes model on the date of grant, using the followingweighted-average assumptions:
Year Ended December 31,2011 2010 2009
Expected volatility . . . . . . . . . . . . . . . . . . . . . . . . . . . . . . . . . . . . . . . . . . . . . 60% NA NAExpected term .. . . . . . . . . . . . . . . . . . . . . . . . . . . . . . . . . . . . . . . . . . . . . . . . . 8.0 yrs. NA NAExpected dividend yield . . . . . . . . . . . . . . . . . . . . . . . . . . . . . . . . . . . . . . 0% NA NARisk-free interest rate . . . . . . . . . . . . . . . . . . . . . . . . . . . . . . . . . . . . . . . . . 2.1% NA NAWeighted-average fair value of options granted. . . . . . . . . . $ 1.26 NA NA
NOTE 15 — EMPLOYEE BENEFIT PLANS
Multiemployer benefit plans. Employees of the Company who are members of various unions arecovered by union-sponsored, collectively bargained, multiemployer health and welfare and defined benefit
78
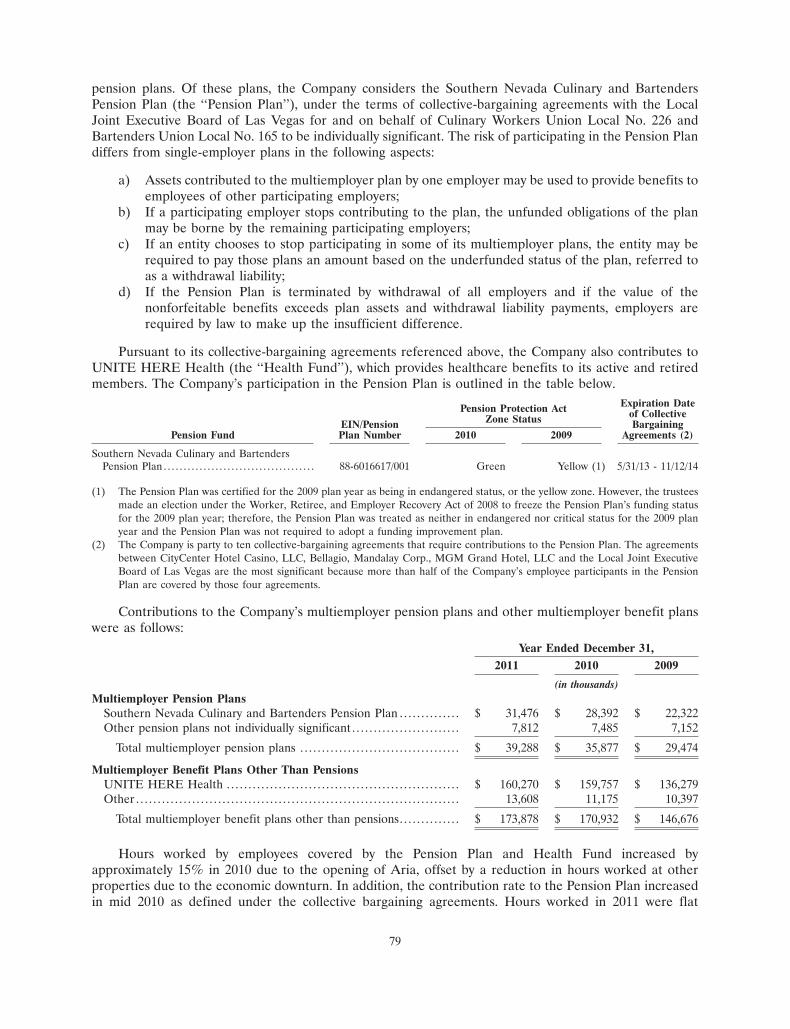
pension plans. Of these plans, the Company considers the Southern Nevada Culinary and BartendersPension Plan (the ‘‘Pension Plan’’), under the terms of collective-bargaining agreements with the LocalJoint Executive Board of Las Vegas for and on behalf of Culinary Workers Union Local No. 226 andBartenders Union Local No. 165 to be individually significant. The risk of participating in the Pension Plandiffers from single-employer plans in the following aspects:
a) Assets contributed to the multiemployer plan by one employer may be used to provide benefits toemployees of other participating employers;
b) If a participating employer stops contributing to the plan, the unfunded obligations of the planmay be borne by the remaining participating employers;
c) If an entity chooses to stop participating in some of its multiemployer plans, the entity may berequired to pay those plans an amount based on the underfunded status of the plan, referred toas a withdrawal liability;
d) If the Pension Plan is terminated by withdrawal of all employers and if the value of thenonforfeitable benefits exceeds plan assets and withdrawal liability payments, employers arerequired by law to make up the insufficient difference.
Pursuant to its collective-bargaining agreements referenced above, the Company also contributes toUNITE HERE Health (the ‘‘Health Fund’’), which provides healthcare benefits to its active and retiredmembers. The Company’s participation in the Pension Plan is outlined in the table below.
Expiration DatePension Protection Act of CollectiveZone StatusEIN/Pension BargainingPension Fund Plan Number 2010 2009 Agreements (2)
Southern Nevada Culinary and BartendersPension Plan . . . . . . . . . . . . . . . . . . . . . . . . . . . . . . . . . . . . . . 88-6016617/001 Green Yellow (1) 5/31/13 - 11/12/14
(1) The Pension Plan was certified for the 2009 plan year as being in endangered status, or the yellow zone. However, the trusteesmade an election under the Worker, Retiree, and Employer Recovery Act of 2008 to freeze the Pension Plan’s funding statusfor the 2009 plan year; therefore, the Pension Plan was treated as neither in endangered nor critical status for the 2009 planyear and the Pension Plan was not required to adopt a funding improvement plan.
(2) The Company is party to ten collective-bargaining agreements that require contributions to the Pension Plan. The agreementsbetween CityCenter Hotel Casino, LLC, Bellagio, Mandalay Corp., MGM Grand Hotel, LLC and the Local Joint ExecutiveBoard of Las Vegas are the most significant because more than half of the Company’s employee participants in the PensionPlan are covered by those four agreements.
Contributions to the Company’s multiemployer pension plans and other multiemployer benefit planswere as follows:
Year Ended December 31,2011 2010 2009
(in thousands)Multiemployer Pension Plans
Southern Nevada Culinary and Bartenders Pension Plan . . . . . . . . . . . . . . $ 31,476 $ 28,392 $ 22,322Other pension plans not individually significant . . . . . . . . . . . . . . . . . . . . . . . . . 7,812 7,485 7,152
Total multiemployer pension plans . . . . . . . . . . . . . . . . . . . . . . . . . . . . . . . . . . . . . $ 39,288 $ 35,877 $ 29,474
Multiemployer Benefit Plans Other Than PensionsUNITE HERE Health . . . . . . . . . . . . . . . . . . . . . . . . . . . . . . . . . . . . . . . . . . . . . . . . . . . . . . $ 160,270 $ 159,757 $ 136,279Other . . . . . . . . . . . . . . . . . . . . . . . . . . . . . . . . . . . . . . . . . . . . . . . . . . . . . . . . . . . . . . . . . . . . . . . . . . . 13,608 11,175 10,397
Total multiemployer benefit plans other than pensions. . . . . . . . . . . . . . $ 173,878 $ 170,932 $ 146,676
Hours worked by employees covered by the Pension Plan and Health Fund increased byapproximately 15% in 2010 due to the opening of Aria, offset by a reduction in hours worked at otherproperties due to the economic downturn. In addition, the contribution rate to the Pension Plan increasedin mid 2010 as defined under the collective bargaining agreements. Hours worked in 2011 were flat
79
compared to 2010; however, the contribution rate to the Pension Plan increased again in mid 2011 asdefined under the collective bargaining agreements. Bellagio, Mandalay Bay and MGM Grand were listedin the Pension Plan’s Forms 5500 as providing more than 5% of the total contributions for the plan yearsended December 31, 2010 and 2009. Aria was listed as providing more than 5% of the total contributionsfor the plan year ended December 31, 2010. At the date the financial statements were issued, Form 5500was not available for the plan year ending in 2011. No surcharges were imposed on the Company’scontributions to any of the plans.
Self insurance. The Company is self-insured for most health care benefits and workers compensationfor its non-union employees. The liability for health care claims filed and estimates of claims incurred butnot reported was $23 million and $18 million at December 31, 2011 and 2010, respectively. The workerscompensation liability for claims filed and estimates of claims incurred but not reported was $27 millionand $24 million as of December 31, 2011 and 2010, respectively. Both liabilities are included in ‘‘Otheraccrued liabilities.’’
Retirement savings plans. The Company has retirement savings plans under Section 401(k) of theInternal Revenue Code for eligible employees. The plans allow employees to defer, within prescribedlimits, up to 30% of their income on a pre-tax basis through contributions to the plans. The Companysuspended its matching contributions to the plan in 2009, though certain employees at MGM GrandDetroit and Four Seasons were still eligible for matching contributions. The Company reinstated a morelimited 401(k) company contribution in 2011 and will continue to monitor the plan contributions as theeconomy changes. In the case of certain union employees, the Company contributions to the plan arebased on hours worked. The Company recorded charges for 401(k) contributions of $10 million in 2011,$3 million in 2010 and $2 million in 2008.
The Company maintains nonqualified deferred retirement plans for certain key employees. The plansallow participants to defer, on a pre-tax basis, a portion of their salary and bonus and accumulate taxdeferred earnings, plus investment earnings on the deferred balances, as a deferred tax savings. Allemployee deferrals vest immediately. In 2009, the Company suspended contributions to the plan.
The Company also maintains nonqualified supplemental executive retirement plans (‘‘SERP’’) forcertain key employees. Until September 2008, the Company made quarterly contributions intended toprovide a retirement benefit that is a fixed percentage of a participant’s estimated final five-year averageannual salary, up to a maximum of 65%. The Company has indefinitely suspended these contributions.Employees do not make contributions under these plans. A portion of the Company contributions andinvestment earnings thereon vest after three years of SERP participation and the remaining portion vestsafter both five years of SERP participation and 10 years of continuous service.
Pursuant to the amendments of the nonqualified deferred retirement plans and SERP plans during2008, and consistent with certain transitional relief provided by the Internal Revenue Service pursuant torules governing nonqualified deferred compensation, the Company permitted participants under the plansto make a one-time election to receive, without penalty, all or a portion of their respective vested accountbalances. Based on elections made, the Company made payments to participants of $62 million in 2009.
MGM China contributes to a retirement plan as part of an employee benefits package for eligibleemployees. Contributions to the retirement plan for the period June 3, 2011 through December 31, 2011were $2 million.
80
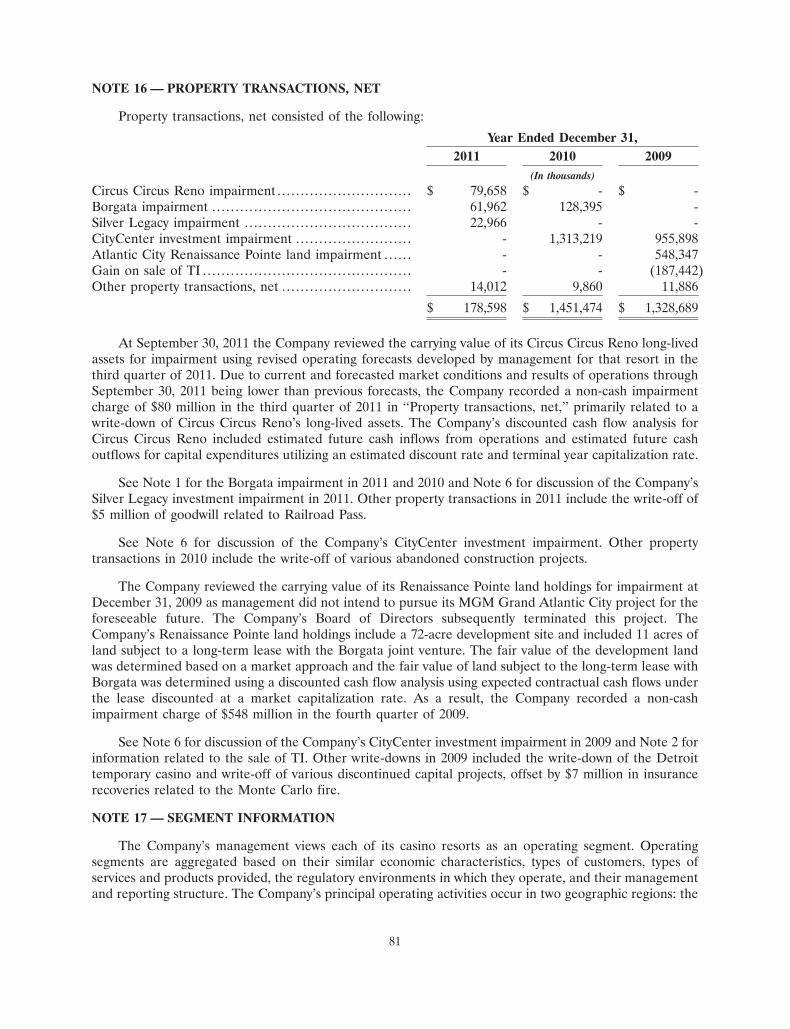
NOTE 16 — PROPERTY TRANSACTIONS, NET
Property transactions, net consisted of the following:
Year Ended December 31,2011 2010 2009
(In thousands)
Circus Circus Reno impairment . . . . . . . . . . . . . . . . . . . . . . . . . . . . . $ 79,658 $ - $ -Borgata impairment . . . . . . . . . . . . . . . . . . . . . . . . . . . . . . . . . . . . . . . . . . . 61,962 128,395 -Silver Legacy impairment . . . . . . . . . . . . . . . . . . . . . . . . . . . . . . . . . . . . 22,966 - -CityCenter investment impairment . . . . . . . . . . . . . . . . . . . . . . . . . - 1,313,219 955,898Atlantic City Renaissance Pointe land impairment . . . . . . - - 548,347Gain on sale of TI . . . . . . . . . . . . . . . . . . . . . . . . . . . . . . . . . . . . . . . . . . . . . - - (187,442)Other property transactions, net . . . . . . . . . . . . . . . . . . . . . . . . . . . . 14,012 9,860 11,886
$ 178,598 $ 1,451,474 $ 1,328,689
At September 30, 2011 the Company reviewed the carrying value of its Circus Circus Reno long-livedassets for impairment using revised operating forecasts developed by management for that resort in thethird quarter of 2011. Due to current and forecasted market conditions and results of operations throughSeptember 30, 2011 being lower than previous forecasts, the Company recorded a non-cash impairmentcharge of $80 million in the third quarter of 2011 in ‘‘Property transactions, net,’’ primarily related to awrite-down of Circus Circus Reno’s long-lived assets. The Company’s discounted cash flow analysis forCircus Circus Reno included estimated future cash inflows from operations and estimated future cashoutflows for capital expenditures utilizing an estimated discount rate and terminal year capitalization rate.
See Note 1 for the Borgata impairment in 2011 and 2010 and Note 6 for discussion of the Company’sSilver Legacy investment impairment in 2011. Other property transactions in 2011 include the write-off of$5 million of goodwill related to Railroad Pass.
See Note 6 for discussion of the Company’s CityCenter investment impairment. Other propertytransactions in 2010 include the write-off of various abandoned construction projects.
The Company reviewed the carrying value of its Renaissance Pointe land holdings for impairment atDecember 31, 2009 as management did not intend to pursue its MGM Grand Atlantic City project for theforeseeable future. The Company’s Board of Directors subsequently terminated this project. TheCompany’s Renaissance Pointe land holdings include a 72-acre development site and included 11 acres ofland subject to a long-term lease with the Borgata joint venture. The fair value of the development landwas determined based on a market approach and the fair value of land subject to the long-term lease withBorgata was determined using a discounted cash flow analysis using expected contractual cash flows underthe lease discounted at a market capitalization rate. As a result, the Company recorded a non-cashimpairment charge of $548 million in the fourth quarter of 2009.
See Note 6 for discussion of the Company’s CityCenter investment impairment in 2009 and Note 2 forinformation related to the sale of TI. Other write-downs in 2009 included the write-down of the Detroittemporary casino and write-off of various discontinued capital projects, offset by $7 million in insurancerecoveries related to the Monte Carlo fire.
NOTE 17 — SEGMENT INFORMATION
The Company’s management views each of its casino resorts as an operating segment. Operatingsegments are aggregated based on their similar economic characteristics, types of customers, types ofservices and products provided, the regulatory environments in which they operate, and their managementand reporting structure. The Company’s principal operating activities occur in two geographic regions: the
81
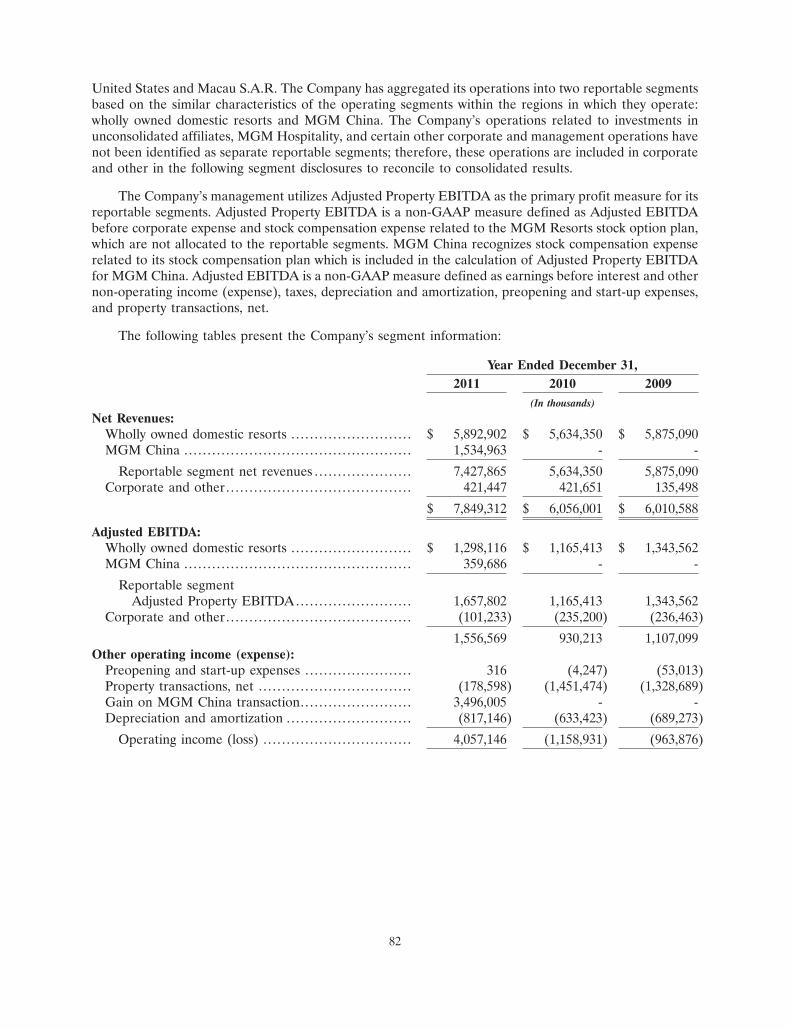
United States and Macau S.A.R. The Company has aggregated its operations into two reportable segmentsbased on the similar characteristics of the operating segments within the regions in which they operate:wholly owned domestic resorts and MGM China. The Company’s operations related to investments inunconsolidated affiliates, MGM Hospitality, and certain other corporate and management operations havenot been identified as separate reportable segments; therefore, these operations are included in corporateand other in the following segment disclosures to reconcile to consolidated results.
The Company’s management utilizes Adjusted Property EBITDA as the primary profit measure for itsreportable segments. Adjusted Property EBITDA is a non-GAAP measure defined as Adjusted EBITDAbefore corporate expense and stock compensation expense related to the MGM Resorts stock option plan,which are not allocated to the reportable segments. MGM China recognizes stock compensation expenserelated to its stock compensation plan which is included in the calculation of Adjusted Property EBITDAfor MGM China. Adjusted EBITDA is a non-GAAP measure defined as earnings before interest and othernon-operating income (expense), taxes, depreciation and amortization, preopening and start-up expenses,and property transactions, net.
The following tables present the Company’s segment information:
Year Ended December 31,2011 2010 2009
(In thousands)
Net Revenues:Wholly owned domestic resorts . . . . . . . . . . . . . . . . . . . . . . . . . . $ 5,892,902 $ 5,634,350 $ 5,875,090MGM China . . . . . . . . . . . . . . . . . . . . . . . . . . . . . . . . . . . . . . . . . . . . . . . . . 1,534,963 - -
Reportable segment net revenues . . . . . . . . . . . . . . . . . . . . . 7,427,865 5,634,350 5,875,090Corporate and other. . . . . . . . . . . . . . . . . . . . . . . . . . . . . . . . . . . . . . . . 421,447 421,651 135,498
$ 7,849,312 $ 6,056,001 $ 6,010,588
Adjusted EBITDA:Wholly owned domestic resorts . . . . . . . . . . . . . . . . . . . . . . . . . . $ 1,298,116 $ 1,165,413 $ 1,343,562MGM China . . . . . . . . . . . . . . . . . . . . . . . . . . . . . . . . . . . . . . . . . . . . . . . . . 359,686 - -
Reportable segmentAdjusted Property EBITDA .. . . . . . . . . . . . . . . . . . . . . . . . 1,657,802 1,165,413 1,343,562
Corporate and other. . . . . . . . . . . . . . . . . . . . . . . . . . . . . . . . . . . . . . . . (101,233) (235,200) (236,463)
1,556,569 930,213 1,107,099Other operating income (expense):
Preopening and start-up expenses . . . . . . . . . . . . . . . . . . . . . . . 316 (4,247) (53,013)Property transactions, net . . . . . . . . . . . . . . . . . . . . . . . . . . . . . . . . . (178,598) (1,451,474) (1,328,689)Gain on MGM China transaction. . . . . . . . . . . . . . . . . . . . . . . . 3,496,005 - -Depreciation and amortization . . . . . . . . . . . . . . . . . . . . . . . . . . . (817,146) (633,423) (689,273)
Operating income (loss) . . . . . . . . . . . . . . . . . . . . . . . . . . . . . . . . 4,057,146 (1,158,931) (963,876)
82

Year Ended December 31,2011 2010 2009
(In thousands)
(Continued)Non-operating income (expense):
Interest expense, net . . . . . . . . . . . . . . . . . . . . . . . . . . . . . . . . . . . . . . . (1,086,832) (1,113,580) (775,431)Non-operating items from unconsolidated affiliates . . (119,013) (108,731) (47,127)Other, net . . . . . . . . . . . . . . . . . . . . . . . . . . . . . . . . . . . . . . . . . . . . . . . . . . . . (19,670) 165,217 (226,159)
(1,225,515) (1,057,094) (1,048,717)
Income (loss) before income taxes. . . . . . . . . . . . . . . . . . . . . . . . . . 2,831,631 (2,216,025) (2,012,593)Benefit for income taxes . . . . . . . . . . . . . . . . . . . . . . . . . . . . . . . . . . . 403,313 778,628 720,911
Net income (loss) . . . . . . . . . . . . . . . . . . . . . . . . . . . . . . . . . . . . . . . . . . . . . . 3,234,944 (1,437,397) (1,291,682)Less: Net income attributable to noncontrolling
interests . . . . . . . . . . . . . . . . . . . . . . . . . . . . . . . . . . . . . . . . . . . . . . . . . . . . (120,307) - -
Net income (loss) attributable to MGM ResortsInternational . . . . . . . . . . . . . . . . . . . . . . . . . . . . . . . . . . . . . . . . . . . . . . . . . $ 3,114,637 $ (1,437,397) $ (1,291,682)
At December 31,2011 2010
Total assets: (In thousands)
Wholly owned domestic resorts . . . . . . . . . . . . . . . . . . . . . . . . . . . . . . . . . . . . . . . . . . . . . . . $ 14,237,132 $ 14,038,040MGM China . . . . . . . . . . . . . . . . . . . . . . . . . . . . . . . . . . . . . . . . . . . . . . . . . . . . . . . . . . . . . . . . . . . . . . 9,040,344 -
Reportable segment total assets. . . . . . . . . . . . . . . . . . . . . . . . . . . . . . . . . . . . . . . . . . . . 23,277,476 14,038,040Corporate and other . . . . . . . . . . . . . . . . . . . . . . . . . . . . . . . . . . . . . . . . . . . . . . . . . . . . . . . . . . . . 4,488,800 4,913,808
$ 27,766,276 $ 18,951,848
Year Ended December 31,2011 2010 2009
Capital expenditures: (In thousands)
Wholly owned domestic resorts . . . . . . . . . . . . . . . . . . . . . . . . . . $ 235,638 $ 147,317 $ 101,363MGM China . . . . . . . . . . . . . . . . . . . . . . . . . . . . . . . . . . . . . . . . . . . . . . . . . 26,649 - -
Reportable segment capital expenditures . . . . . . . . . . . . 262,287 147,317 101,363Corporate and other. . . . . . . . . . . . . . . . . . . . . . . . . . . . . . . . . . . . . . . . 38,957 60,174 35,487
$ 301,244 $ 207,491 $ 136,850
NOTE 18 — RELATED PARTY TRANSACTIONS
CityCenter
Management agreements. The Company and CityCenter have entered into agreements whereby theCompany is responsible for management of the design, planning, development and construction ofCityCenter and is managing the operations of CityCenter for a fee. The Company earned fees of$33 million, $20 million and $2 million for the years ended December 31, 2011, 2010 and 2009. TheCompany is being reimbursed for certain costs in performing its development and management services.During the years ended December 31, 2011, 2010 and 2009 the Company incurred $346 million,$354 million, and $95 million, respectively, of costs reimbursable by the joint venture, primarily foremployee compensation and certain allocated costs. As of December 31, 2011 and 2010, CityCenter owedthe Company $49 and $35 million, respectively, for management services and reimbursable costs.
83

Other agreements. The Company owns OE Pub, LLC, which leases retail space in Crystals. TheCompany recorded $1 million of expense related to the lease agreement in each of the years endedDecember 31, 2011 and 2010. The Company entered into an agreement with CityCenter whereby theCompany provides CityCenter the use of its aircraft on a time sharing basis. CityCenter is charged a ratethat is based on Federal Aviation Administration regulations, which provides for reimbursement forspecific costs incurred by the Company without any profit or mark-up. During the years endedDecember 31, 2011 and 2010, the Company was reimbursed $3 million and $4 million, respectively, foraircraft related expenses. The Company has various other arrangements with CityCenter for the provisionof certain shared services, reimbursement of costs and other transactions undertaken in the ordinarycourse of business.
MGM China
Ms. Pansy Ho is member of the board of directors of, and holds a minority ownership interest in,MGM China. Ms. Pansy Ho is also the managing director of Shun Tak Holdings Limited (together with itssubsidiaries ‘‘Shun Tak’’), a leading conglomerate in Hong Kong with core businesses in transportation,property, hospitality and investments. Shun Tak provides various services and products, including ferrytickets, travel products, rental of hotel rooms, laundry services, advertising services and property cleaningservices to MGM China and MGM China provides rental of hotel rooms at wholesale room rates to ShunTak and receives rebates for ferry tickets from Shun Tak. For the period from June 3, 2011 throughDecember 31, 2011, MGM China incurred expenses of $9 million related to such services and recordedrevenue of less than $1 million related to hotel rooms provided to Shun Tak. As of December 31, 2011,MGM China did not have a material payable to or receivable from Shun Tak.
In connection with the MGM China IPO, MGM Branding and Development Holdings, Ltd., an entityincluded in the Company’s consolidated financial statements in which Ms. Pansy Ho indirectly holds anoncontrolling interest, entered into a brand license agreement with MGM China. MGM China pays alicense fee to MGM Branding and Development Holdings, Ltd equal to 1.75% of MGM China’sconsolidated net revenue, subject to an annual cap of $25 million for the initial year of the agreement,prorated to $15 million for the portion of 2011 subsequent to the date of the IPO. The annual cap willincrease by 20% per annum for each subsequent calendar year during the term of the agreement. Duringthe period from June 3, 2011 through December 31, 2011, total license fees of $15 million were incurred byMGM China. Such amounts have been eliminated in consolidation. An entity owned by Ms. Pansy Horeceived a distribution of $4 million during the year ended December 31, 2011 in connection with theownership of a noncontrolling interest in MGM Branding and Development Holdings, Ltd.
Convertible notes
In June 2011, the Company sold $300 million in aggregate principal amount of the Company’s 4.25%convertible senior notes due 2015 to an indirect wholly owned subsidiary of Ms. Pansy Ho. See Note 9 foradditional information related to the convertible notes.
84
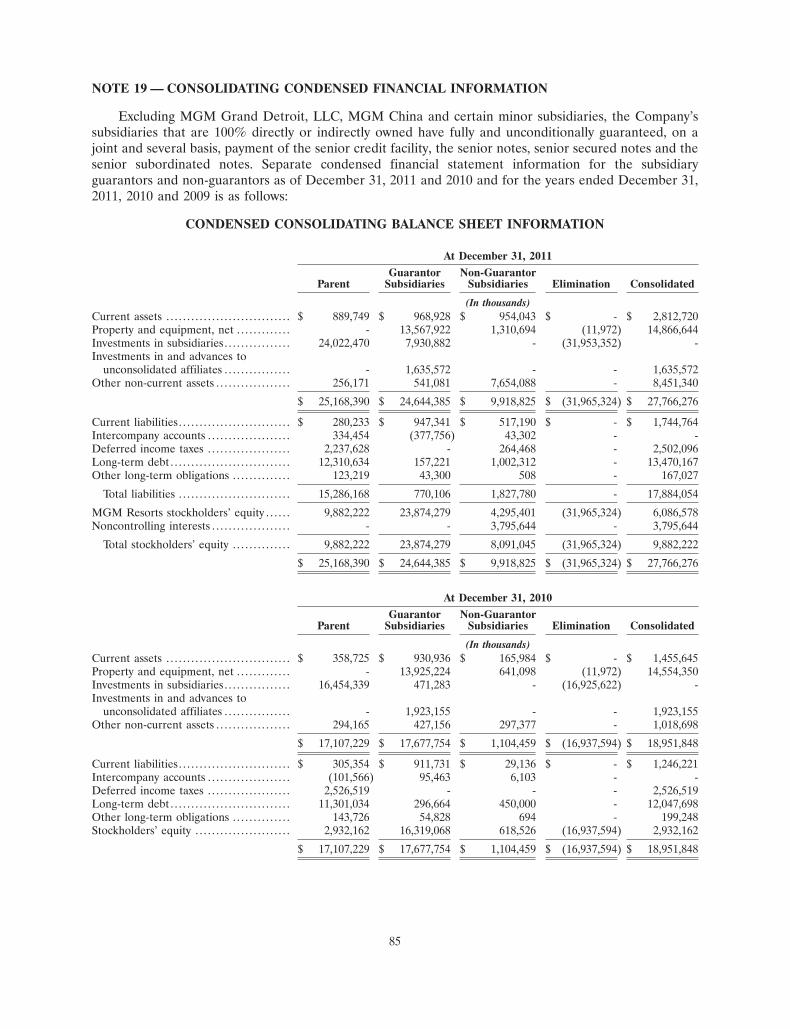
NOTE 19 — CONSOLIDATING CONDENSED FINANCIAL INFORMATION
Excluding MGM Grand Detroit, LLC, MGM China and certain minor subsidiaries, the Company’ssubsidiaries that are 100% directly or indirectly owned have fully and unconditionally guaranteed, on ajoint and several basis, payment of the senior credit facility, the senior notes, senior secured notes and thesenior subordinated notes. Separate condensed financial statement information for the subsidiaryguarantors and non-guarantors as of December 31, 2011 and 2010 and for the years ended December 31,2011, 2010 and 2009 is as follows:
CONDENSED CONSOLIDATING BALANCE SHEET INFORMATION
At December 31, 2011Guarantor Non-Guarantor
Parent Subsidiaries Subsidiaries Elimination Consolidated
(In thousands)Current assets . . . . . . . . . . . . . . . . . . . . . . . . . . . . . . $ 889,749 $ 968,928 $ 954,043 $ - $ 2,812,720Property and equipment, net . . . . . . . . . . . . . - 13,567,922 1,310,694 (11,972) 14,866,644Investments in subsidiaries . . . . . . . . . . . . . . . . 24,022,470 7,930,882 - (31,953,352) -Investments in and advances to
unconsolidated affiliates . . . . . . . . . . . . . . . . - 1,635,572 - - 1,635,572Other non-current assets . . . . . . . . . . . . . . . . . . 256,171 541,081 7,654,088 - 8,451,340
$ 25,168,390 $ 24,644,385 $ 9,918,825 $ (31,965,324) $ 27,766,276
Current liabilities. . . . . . . . . . . . . . . . . . . . . . . . . . . $ 280,233 $ 947,341 $ 517,190 $ - $ 1,744,764Intercompany accounts . . . . . . . . . . . . . . . . . . . . 334,454 (377,756) 43,302 - -Deferred income taxes . . . . . . . . . . . . . . . . . . . . 2,237,628 - 264,468 - 2,502,096Long-term debt . . . . . . . . . . . . . . . . . . . . . . . . . . . . . 12,310,634 157,221 1,002,312 - 13,470,167Other long-term obligations . . . . . . . . . . . . . . 123,219 43,300 508 - 167,027
Total liabilities . . . . . . . . . . . . . . . . . . . . . . . . . . . 15,286,168 770,106 1,827,780 - 17,884,054
MGM Resorts stockholders’ equity . . . . . . 9,882,222 23,874,279 4,295,401 (31,965,324) 6,086,578Noncontrolling interests . . . . . . . . . . . . . . . . . . . - - 3,795,644 - 3,795,644
Total stockholders’ equity . . . . . . . . . . . . . . 9,882,222 23,874,279 8,091,045 (31,965,324) 9,882,222
$ 25,168,390 $ 24,644,385 $ 9,918,825 $ (31,965,324) $ 27,766,276
At December 31, 2010Guarantor Non-Guarantor
Parent Subsidiaries Subsidiaries Elimination Consolidated
(In thousands)Current assets . . . . . . . . . . . . . . . . . . . . . . . . . . . . . . $ 358,725 $ 930,936 $ 165,984 $ - $ 1,455,645Property and equipment, net . . . . . . . . . . . . . - 13,925,224 641,098 (11,972) 14,554,350Investments in subsidiaries . . . . . . . . . . . . . . . . 16,454,339 471,283 - (16,925,622) -Investments in and advances to
unconsolidated affiliates . . . . . . . . . . . . . . . . - 1,923,155 - - 1,923,155Other non-current assets . . . . . . . . . . . . . . . . . . 294,165 427,156 297,377 - 1,018,698
$ 17,107,229 $ 17,677,754 $ 1,104,459 $ (16,937,594) $ 18,951,848
Current liabilities. . . . . . . . . . . . . . . . . . . . . . . . . . . $ 305,354 $ 911,731 $ 29,136 $ - $ 1,246,221Intercompany accounts . . . . . . . . . . . . . . . . . . . . (101,566) 95,463 6,103 - -Deferred income taxes . . . . . . . . . . . . . . . . . . . . 2,526,519 - - - 2,526,519Long-term debt . . . . . . . . . . . . . . . . . . . . . . . . . . . . . 11,301,034 296,664 450,000 - 12,047,698Other long-term obligations . . . . . . . . . . . . . . 143,726 54,828 694 - 199,248Stockholders’ equity . . . . . . . . . . . . . . . . . . . . . . . 2,932,162 16,319,068 618,526 (16,937,594) 2,932,162
$ 17,107,229 $ 17,677,754 $ 1,104,459 $ (16,937,594) $ 18,951,848
85

CONDENSED CONSOLIDATING STATEMENT OF OPERATIONS INFORMATION
Year Ended December 31, 2011Guarantor Non-Guarantor
Parent Subsidiaries Subsidiaries Elimination Consolidated
(In thousands)Net revenues . . . . . . . . . . . . . . . . . . . . . . . . . . . . . . . . $ - $ 5,745,417 $ 2,103,895 $ - $ 7,849,312Equity in subsidiaries’ earnings . . . . . . . . . . 3,908,981 3,784,101 - (7,693,082) -Expenses:
Casino and hotel operations . . . . . . . . . . . 10,030 3,610,360 1,405,971 - 5,026,361General and administrative . . . . . . . . . . . . 7,613 1,015,923 158,969 - 1,182,505Corporate expense . . . . . . . . . . . . . . . . . . . . . . 69,958 104,288 725 - 174,971Preopening and start-up expenses . . . . . - (316) - - (316)Property transactions, net . . . . . . . . . . . . . . - 176,063 2,535 - 178,598Gain on MGM China transaction . . . . . - - (3,496,005) - (3,496,005)Depreciation and amortization . . . . . . . . - 556,538 260,608 - 817,146
87,601 5,462,856 (1,667,197) - 3,883,260
Income (loss) from unconsolidatedaffiliates. . . . . . . . . . . . . . . . . . . . . . . . . . . . . . . . . . . - (24,096) 115,190 - 91,094
Operating income (loss) . . . . . . . . . . . . . . . . . . . 3,821,380 4,042,566 3,886,282 (7,693,082) 4,057,146Interest expense . . . . . . . . . . . . . . . . . . . . . . . . . . . . (1,023,090) (18,882) (44,860) - (1,086,832)Other, net . . . . . . . . . . . . . . . . . . . . . . . . . . . . . . . . . . . 16,644 (115,009) (40,318) - (138,683)
Income before income taxes . . . . . . . . . . . . . . 2,814,934 3,908,675 3,801,104 (7,693,082) 2,831,631Benefit (provision) for income taxes . . 299,703 (18) 103,628 - 403,313
Net income (loss) . . . . . . . . . . . . . . . . . . . . . . . . . . 3,114,637 3,908,657 3,904,732 (7,693,082) 3,234,944Less: Net income attributable to
noncontrolling interests . . . . . . . . . . . . . . . . . - - (120,307) - (120,307)
Net income (loss) attributable to MGMResorts International . . . . . . . . . . . . . . . . . . . $ 3,114,637 $ 3,908,657 $ 3,784,425 $ (7,693,082) $ 3,114,637
86
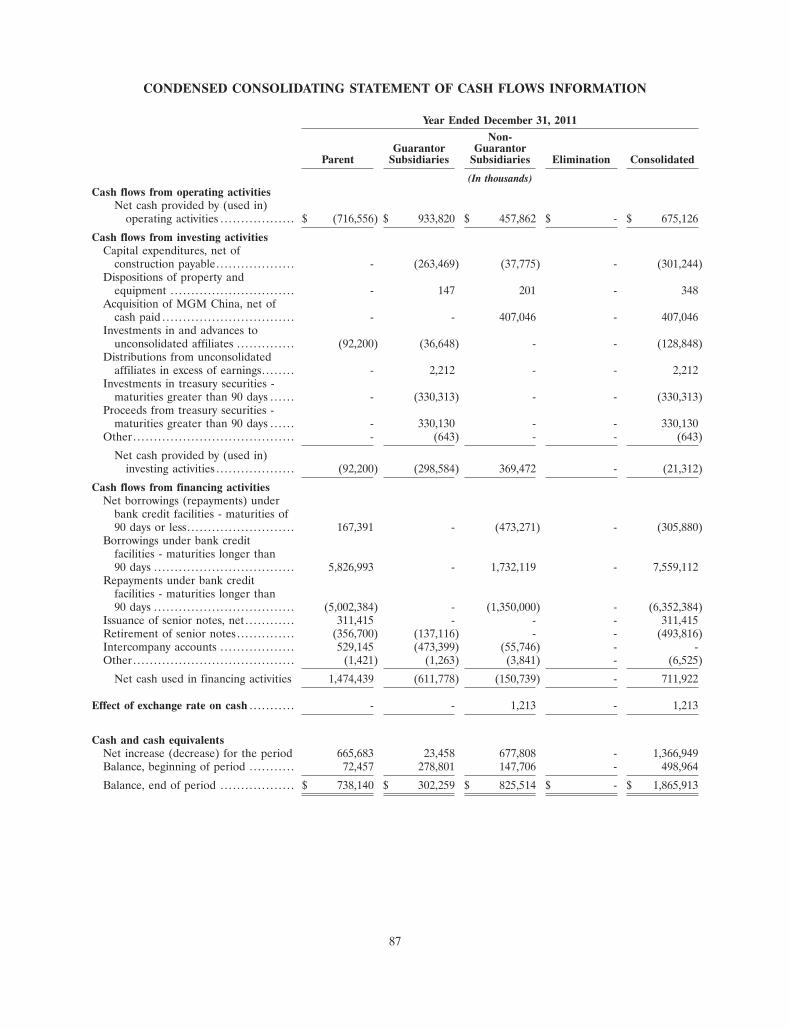
CONDENSED CONSOLIDATING STATEMENT OF CASH FLOWS INFORMATION
Year Ended December 31, 2011Non-
Guarantor GuarantorParent Subsidiaries Subsidiaries Elimination Consolidated
(In thousands)Cash flows from operating activities
Net cash provided by (used in)operating activities . . . . . . . . . . . . . . . . . . $ (716,556) $ 933,820 $ 457,862 $ - $ 675,126
Cash flows from investing activitiesCapital expenditures, net of
construction payable. . . . . . . . . . . . . . . . . . . - (263,469) (37,775) - (301,244)Dispositions of property and
equipment . . . . . . . . . . . . . . . . . . . . . . . . . . . . . . - 147 201 - 348Acquisition of MGM China, net of
cash paid . . . . . . . . . . . . . . . . . . . . . . . . . . . . . . . . - - 407,046 - 407,046Investments in and advances to
unconsolidated affiliates . . . . . . . . . . . . . . (92,200) (36,648) - - (128,848)Distributions from unconsolidated
affiliates in excess of earnings. . . . . . . . - 2,212 - - 2,212Investments in treasury securities -
maturities greater than 90 days . . . . . . - (330,313) - - (330,313)Proceeds from treasury securities -
maturities greater than 90 days . . . . . . - 330,130 - - 330,130Other . . . . . . . . . . . . . . . . . . . . . . . . . . . . . . . . . . . . . . . - (643) - - (643)
Net cash provided by (used in)investing activities . . . . . . . . . . . . . . . . . . . (92,200) (298,584) 369,472 - (21,312)
Cash flows from financing activitiesNet borrowings (repayments) under
bank credit facilities - maturities of90 days or less. . . . . . . . . . . . . . . . . . . . . . . . . . 167,391 - (473,271) - (305,880)
Borrowings under bank creditfacilities - maturities longer than90 days . . . . . . . . . . . . . . . . . . . . . . . . . . . . . . . . . . 5,826,993 - 1,732,119 - 7,559,112
Repayments under bank creditfacilities - maturities longer than90 days . . . . . . . . . . . . . . . . . . . . . . . . . . . . . . . . . . (5,002,384) - (1,350,000) - (6,352,384)
Issuance of senior notes, net . . . . . . . . . . . . 311,415 - - - 311,415Retirement of senior notes . . . . . . . . . . . . . . (356,700) (137,116) - - (493,816)Intercompany accounts . . . . . . . . . . . . . . . . . . 529,145 (473,399) (55,746) - -Other . . . . . . . . . . . . . . . . . . . . . . . . . . . . . . . . . . . . . . . (1,421) (1,263) (3,841) - (6,525)
Net cash used in financing activities 1,474,439 (611,778) (150,739) - 711,922
Effect of exchange rate on cash . . . . . . . . . . . - - 1,213 - 1,213
Cash and cash equivalentsNet increase (decrease) for the period 665,683 23,458 677,808 - 1,366,949Balance, beginning of period . . . . . . . . . . . 72,457 278,801 147,706 - 498,964
Balance, end of period . . . . . . . . . . . . . . . . . . $ 738,140 $ 302,259 $ 825,514 $ - $ 1,865,913
87

CONDENSED CONSOLIDATING STATEMENT OF OPERATIONS INFORMATION
Year Ended December 31, 2010Non-
Guarantor GuarantorParent Subsidiaries Subsidiaries Elimination Consolidated
(In thousands)Net revenues . . . . . . . . . . . . . . . . . . . . . . . . . . . . . . . . . $ - $ 5,517,086 $ 538,915 $ - $ 6,056,001Equity in subsidiaries’ earnings. . . . . . . . . . . . (1,281,514) 164,502 - 1,117,012 -Expenses:
Casino and hotel operations . . . . . . . . . . . . 10,684 3,494,995 288,631 - 3,794,310General and administrative . . . . . . . . . . . . . 9,974 1,020,119 98,710 - 1,128,803Corporate expense . . . . . . . . . . . . . . . . . . . . . . . 15,734 110,199 (1,692) - 124,241Preopening and start-up expenses . . . . . . - 4,247 - - 4,247Property transactions, net . . . . . . . . . . . . . . . - 1,451,801 (327) - 1,451,474Depreciation and amortization . . . . . . . . . - 592,895 40,528 - 633,423
36,392 6,674,256 425,850 - 7,136,498
Income (loss) from unconsolidatedaffiliates . . . . . . . . . . . . . . . . . . . . . . . . . . . . . . . . . . . . - (208,099) 129,665 - (78,434)
Operating income (loss) . . . . . . . . . . . . . . . . . . . . (1,317,906) (1,200,767) 242,730 1,117,012 (1,158,931)Interest income (expense), net . . . . . . . . . . . . (1,060,511) (22,512) (30,557) - (1,113,580)Other, net . . . . . . . . . . . . . . . . . . . . . . . . . . . . . . . . . . . . 148,074 (50,929) (40,659) - 56,486
Income (loss) before income taxes . . . . . . . (2,230,343) (1,274,208) 171,514 1,117,012 (2,216,025)Benefit (provision) for income taxes . . . . . 792,946 (9,316) (5,002) - 778,628
Net income (loss) . . . . . . . . . . . . . . . . . . . . . . . . . . . $ (1,437,397) $ (1,283,524) $ 166,512 $ 1,117,012 $ (1,437,397)
88
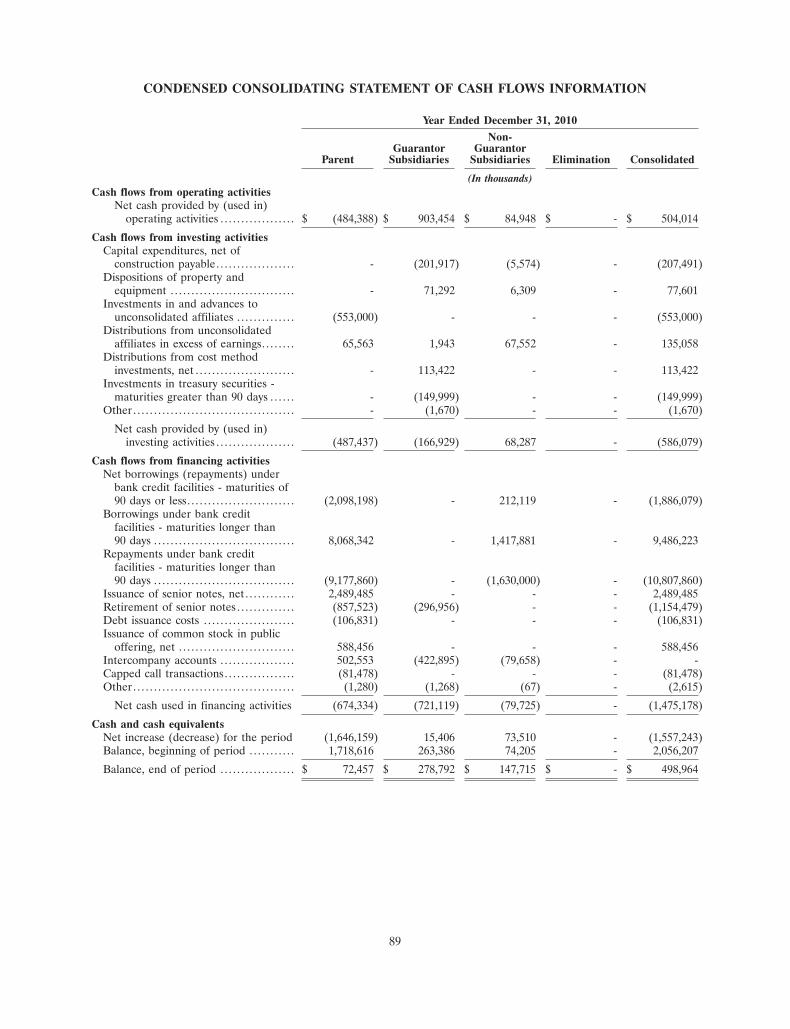
CONDENSED CONSOLIDATING STATEMENT OF CASH FLOWS INFORMATION
Year Ended December 31, 2010Non-
Guarantor GuarantorParent Subsidiaries Subsidiaries Elimination Consolidated
(In thousands)Cash flows from operating activities
Net cash provided by (used in)operating activities . . . . . . . . . . . . . . . . . . $ (484,388) $ 903,454 $ 84,948 $ - $ 504,014
Cash flows from investing activitiesCapital expenditures, net of
construction payable. . . . . . . . . . . . . . . . . . . - (201,917) (5,574) - (207,491)Dispositions of property and
equipment . . . . . . . . . . . . . . . . . . . . . . . . . . . . . . - 71,292 6,309 - 77,601Investments in and advances to
unconsolidated affiliates . . . . . . . . . . . . . . (553,000) - - - (553,000)Distributions from unconsolidated
affiliates in excess of earnings. . . . . . . . 65,563 1,943 67,552 - 135,058Distributions from cost method
investments, net . . . . . . . . . . . . . . . . . . . . . . . . - 113,422 - - 113,422Investments in treasury securities -
maturities greater than 90 days . . . . . . - (149,999) - - (149,999)Other . . . . . . . . . . . . . . . . . . . . . . . . . . . . . . . . . . . . . . . - (1,670) - - (1,670)
Net cash provided by (used in)investing activities . . . . . . . . . . . . . . . . . . . (487,437) (166,929) 68,287 - (586,079)
Cash flows from financing activitiesNet borrowings (repayments) under
bank credit facilities - maturities of90 days or less. . . . . . . . . . . . . . . . . . . . . . . . . . (2,098,198) - 212,119 - (1,886,079)
Borrowings under bank creditfacilities - maturities longer than90 days . . . . . . . . . . . . . . . . . . . . . . . . . . . . . . . . . . 8,068,342 - 1,417,881 - 9,486,223
Repayments under bank creditfacilities - maturities longer than90 days . . . . . . . . . . . . . . . . . . . . . . . . . . . . . . . . . . (9,177,860) - (1,630,000) - (10,807,860)
Issuance of senior notes, net . . . . . . . . . . . . 2,489,485 - - - 2,489,485Retirement of senior notes . . . . . . . . . . . . . . (857,523) (296,956) - - (1,154,479)Debt issuance costs . . . . . . . . . . . . . . . . . . . . . . (106,831) - - - (106,831)Issuance of common stock in public
offering, net . . . . . . . . . . . . . . . . . . . . . . . . . . . . 588,456 - - - 588,456Intercompany accounts . . . . . . . . . . . . . . . . . . 502,553 (422,895) (79,658) - -Capped call transactions. . . . . . . . . . . . . . . . . (81,478) - - - (81,478)Other . . . . . . . . . . . . . . . . . . . . . . . . . . . . . . . . . . . . . . . (1,280) (1,268) (67) - (2,615)
Net cash used in financing activities (674,334) (721,119) (79,725) - (1,475,178)
Cash and cash equivalentsNet increase (decrease) for the period (1,646,159) 15,406 73,510 - (1,557,243)Balance, beginning of period . . . . . . . . . . . 1,718,616 263,386 74,205 - 2,056,207
Balance, end of period . . . . . . . . . . . . . . . . . . $ 72,457 $ 278,792 $ 147,715 $ - $ 498,964
89

CONDENSED CONSOLIDATING STATEMENT OF OPERATIONS INFORMATION
Year Ended December 31, 2009Non-
Guarantor GuarantorParent Subsidiaries Subsidiaries Elimination Consolidated
(In thousands)Net Revenues . . . . . . . . . . . . . . . . . . . . . . . . . . . . . . . . $ - $ 5,467,273 $ 543,315 $ - $ 6,010,588Equity in subsidiaries’ earnings. . . . . . . . . . . . (834,524) 65,531 - 768,993 -Expenses:
Casino and hotel operations . . . . . . . . . . . . 14,368 3,255,606 301,331 - 3,571,305General and administrative . . . . . . . . . . . . . 9,584 996,310 94,299 - 1,100,193Corporate Expense . . . . . . . . . . . . . . . . . . . . . . . 33,265 114,394 (3,895) - 143,764Preopening and start-up expenses . . . . . . - 53,013 - - 53,013Property transactions, net . . . . . . . . . . . . . . . - 1,321,353 7,336 - 1,328,689Depreciation and amortization . . . . . . . . . - 648,703 40,570 - 689,273
57,217 6,389,379 439,641 - 6,886,237
Income from unconsolidated affiliates . . . - (112,856) 24,629 - (88,227)
Operating income (loss) . . . . . . . . . . . . . . . . . . . . (891,741) (969,431) 128,303 768,993 (963,876)Interest expense, net . . . . . . . . . . . . . . . . . . . . . . . . (953,820) 201,815 (23,426) - (775,431)Other, net . . . . . . . . . . . . . . . . . . . . . . . . . . . . . . . . . . . . (185,590) (57,100) (30,596) - (273,286)
Income (loss) before income taxes . . . . . . . (2,031,151) (824,716) 74,281 768,993 (2,012,593)Provision for income taxes . . . . . . . . . . . . . . . . . 739,469 (13,726) (4,832) - 720,911
Net Income (loss) . . . . . . . . . . . . . . . . . . . . . . . . . . . $ (1,291,682) $ (838,442) $ 69,449 $ 768,993 $ (1,291,682)
90

CONDENSED CONSOLIDATING STATEMENT OF CASH FLOWS INFORMATION
Year Ended December 31, 2009Non-
Guarantor GuarantorParent Subsidiaries Subsidiaries Elimination Consolidated
(In thousands)Cash flows from operating activities
Net cash provided by (used in)operating activities . . . . . . . . . . . . . . . . . . $ (652,977) $ 1,154,595 $ 86,296 $ - $ 587,914
Cash flows from investing activitiesCapital expenditures, net of
construction payable . . . . . . . . . . . . . . . . - (135,211) (1,639) - (136,850)Proceeds from sale of Treasure Island,
net . . . . . . . . . . . . . . . . . . . . . . . . . . . . . . . . . . . . . . . - 746,266 - - 746,266Dispositions of property and
equipment . . . . . . . . . . . . . . . . . . . . . . . . . . . . . . - 22,291 - - 22,291Investments in and advances to
unconsolidated affiliates . . . . . . . . . . . . . . - (956,550) - (7,135) (963,685)Property damage insurance recoveries. - 7,186 - - 7,186Other . . . . . . . . . . . . . . . . . . . . . . . . . . . . . . . . . . . . . . . - (5,463) - - (5,463)
Net cash used in investing activities . - (321,481) (1,639) (7,135) (330,255)
Cash flows from financing activitiesNet repayments under bank credit
facilities - maturities of 90 days orless . . . . . . . . . . . . . . . . . . . . . . . . . . . . . . . . . . . . . . . (983,593) - (43,600) - (1,027,193)
Borrowings under bank creditfacilities maturities longer than90 days . . . . . . . . . . . . . . . . . . . . . . . . . . . . . . . . . . 6,041,492 - 730,000 - 6,771,492
Repayments under bank creditfacilities maturities longer than90 days . . . . . . . . . . . . . . . . . . . . . . . . . . . . . . . . . . (5,302,455) - (640,000) - (5,942,455)
Issuance of senior notes, net . . . . . . . . . . . . 1,921,751 - - - 1,921,751Retirement of senior notes . . . . . . . . . . . . . . (820,010) (356,442) - - (1,176,452)Debt issuance costs . . . . . . . . . . . . . . . . . . . . . . (112,055) - - - (112,055)Issuance of common stock in public
offering, net . . . . . . . . . . . . . . . . . . . . . . . . . . . . 1,103,738 680 - - 1,104,418Intercompany accounts . . . . . . . . . . . . . . . . . . 1,247,519 (1,222,105) (32,549) 7,135 -Repayment of Detroit Economic
Development Corporation bonds . . . . - - (49,393) - (49,393)Other . . . . . . . . . . . . . . . . . . . . . . . . . . . . . . . . . . . . . . . 3,180 (4,480) (63) - (1,363)
Net cash provided by (used in)financing activities . . . . . . . . . . . . . . . . . . 3,099,567 (1,582,347) (35,605) 7,135 1,488,750
Cash and cash equivalentsNet increase (decrease) for the period 2,446,590 (749,233) 49,052 - 1,746,409Change in cash related to assets held
for sale . . . . . . . . . . . . . . . . . . . . . . . . . . . . . . . . . . - 14,154 - - 14,154Balance, beginning of period . . . . . . . . . . . 2,665 262,494 30,485 - 295,644
Balance, end of period . . . . . . . . . . . . . . . . . . $ 2,449,255 $ (472,585) $ 79,537 $ - $ 2,056,207
91
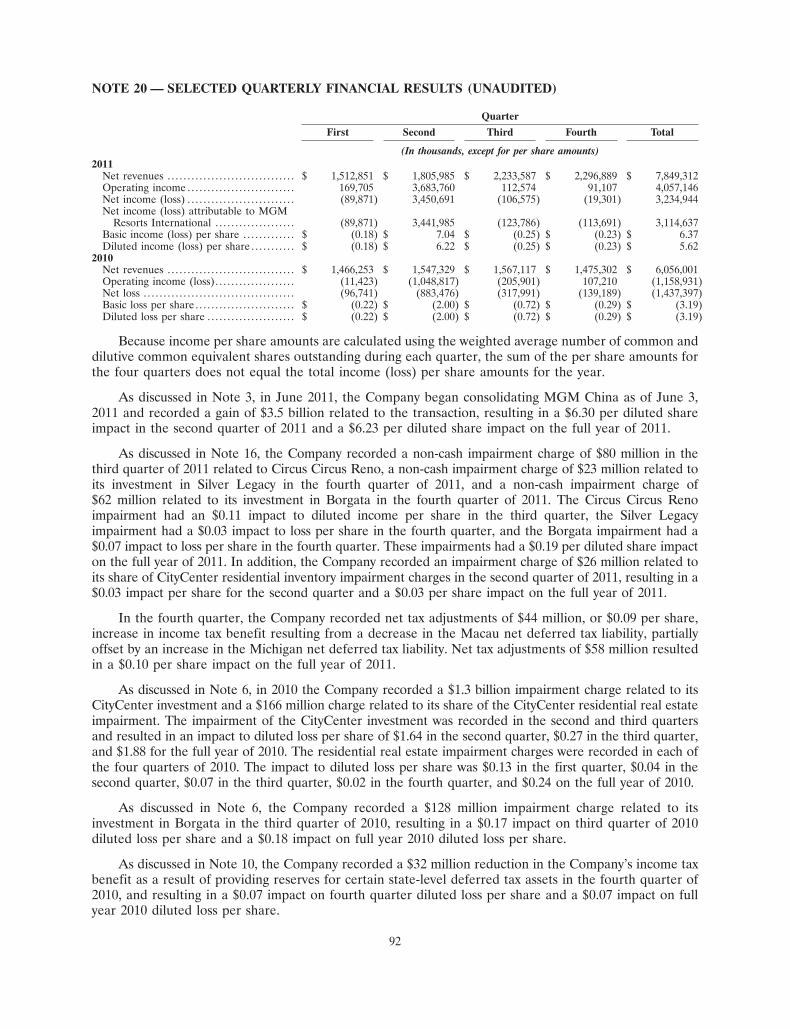
NOTE 20 — SELECTED QUARTERLY FINANCIAL RESULTS (UNAUDITED)
Quarter
First Second Third Fourth Total
(In thousands, except for per share amounts)2011
Net revenues . . . . . . . . . . . . . . . . . . . . . . . . . . . . . . . . $ 1,512,851 $ 1,805,985 $ 2,233,587 $ 2,296,889 $ 7,849,312Operating income . . . . . . . . . . . . . . . . . . . . . . . . . . . 169,705 3,683,760 112,574 91,107 4,057,146Net income (loss) . . . . . . . . . . . . . . . . . . . . . . . . . . . (89,871) 3,450,691 (106,575) (19,301) 3,234,944Net income (loss) attributable to MGM
Resorts International . . . . . . . . . . . . . . . . . . . . (89,871) 3,441,985 (123,786) (113,691) 3,114,637Basic income (loss) per share . . . . . . . . . . . . . $ (0.18) $ 7.04 $ (0.25) $ (0.23) $ 6.37Diluted income (loss) per share . . . . . . . . . . . $ (0.18) $ 6.22 $ (0.25) $ (0.23) $ 5.62
2010Net revenues . . . . . . . . . . . . . . . . . . . . . . . . . . . . . . . . $ 1,466,253 $ 1,547,329 $ 1,567,117 $ 1,475,302 $ 6,056,001Operating income (loss). . . . . . . . . . . . . . . . . . . . (11,423) (1,048,817) (205,901) 107,210 (1,158,931)Net loss . . . . . . . . . . . . . . . . . . . . . . . . . . . . . . . . . . . . . . (96,741) (883,476) (317,991) (139,189) (1,437,397)Basic loss per share . . . . . . . . . . . . . . . . . . . . . . . . . $ (0.22) $ (2.00) $ (0.72) $ (0.29) $ (3.19)Diluted loss per share . . . . . . . . . . . . . . . . . . . . . . $ (0.22) $ (2.00) $ (0.72) $ (0.29) $ (3.19)
Because income per share amounts are calculated using the weighted average number of common anddilutive common equivalent shares outstanding during each quarter, the sum of the per share amounts forthe four quarters does not equal the total income (loss) per share amounts for the year.
As discussed in Note 3, in June 2011, the Company began consolidating MGM China as of June 3,2011 and recorded a gain of $3.5 billion related to the transaction, resulting in a $6.30 per diluted shareimpact in the second quarter of 2011 and a $6.23 per diluted share impact on the full year of 2011.
As discussed in Note 16, the Company recorded a non-cash impairment charge of $80 million in thethird quarter of 2011 related to Circus Circus Reno, a non-cash impairment charge of $23 million related toits investment in Silver Legacy in the fourth quarter of 2011, and a non-cash impairment charge of$62 million related to its investment in Borgata in the fourth quarter of 2011. The Circus Circus Renoimpairment had an $0.11 impact to diluted income per share in the third quarter, the Silver Legacyimpairment had a $0.03 impact to loss per share in the fourth quarter, and the Borgata impairment had a$0.07 impact to loss per share in the fourth quarter. These impairments had a $0.19 per diluted share impacton the full year of 2011. In addition, the Company recorded an impairment charge of $26 million related toits share of CityCenter residential inventory impairment charges in the second quarter of 2011, resulting in a$0.03 impact per share for the second quarter and a $0.03 per share impact on the full year of 2011.
In the fourth quarter, the Company recorded net tax adjustments of $44 million, or $0.09 per share,increase in income tax benefit resulting from a decrease in the Macau net deferred tax liability, partiallyoffset by an increase in the Michigan net deferred tax liability. Net tax adjustments of $58 million resultedin a $0.10 per share impact on the full year of 2011.
As discussed in Note 6, in 2010 the Company recorded a $1.3 billion impairment charge related to itsCityCenter investment and a $166 million charge related to its share of the CityCenter residential real estateimpairment. The impairment of the CityCenter investment was recorded in the second and third quartersand resulted in an impact to diluted loss per share of $1.64 in the second quarter, $0.27 in the third quarter,and $1.88 for the full year of 2010. The residential real estate impairment charges were recorded in each ofthe four quarters of 2010. The impact to diluted loss per share was $0.13 in the first quarter, $0.04 in thesecond quarter, $0.07 in the third quarter, $0.02 in the fourth quarter, and $0.24 on the full year of 2010.
As discussed in Note 6, the Company recorded a $128 million impairment charge related to itsinvestment in Borgata in the third quarter of 2010, resulting in a $0.17 impact on third quarter of 2010diluted loss per share and a $0.18 impact on full year 2010 diluted loss per share.
As discussed in Note 10, the Company recorded a $32 million reduction in the Company’s income taxbenefit as a result of providing reserves for certain state-level deferred tax assets in the fourth quarter of2010, and resulting in a $0.07 impact on fourth quarter diluted loss per share and a $0.07 impact on fullyear 2010 diluted loss per share.
92

IN V ESTOR IN FOR M ATIONCommon Stock InformationThe following table represents the high and low trading prices of the Company’s common stock.
The Company’s common stock is listed on the New York Stock Exchange under the symbol MGM. There were approximately 4,490 record holders of the Company’s common stock as of March 31, 2012. The Company has not paid dividends on its common stock in the last two fiscal years. The Company’s current senior credit facility prohibits the making of cash dividends with respect to its common stock, and the indentures governing the Company’s public indebtedness also currently effectively prohibit the Company from making any such dividends. Furthermore, as a holding company with no independent operations, the Company’s ability to pay dividends in the future will depend upon the receipt of dividends and other payments from its subsidiaries. The Company’s Board of Directors periodically reviews its policy with respect to dividends consistent with applicable contract and legal restrictions, and any future determination to pay dividends in the future will be at the sole discretion of the Board of Directors. The Company currently intends to retain any earnings to fund the operation of its businesses, to service and repay its debt and to make strategic investments.
Cautionary Language Concerning Forward-Looking StatementsStatements in this annual report that are not historical facts are “forward-looking” statements and “safe harbor statements” within the meaning of the Private Securities Litigation Reform Act of 1995 and other related laws that involve risks and/or uncertainties, including risks and/or uncertainties as described in the Company’s public filings with the Securities and Exchange Commission. We have based those forward-looking statements on management’s current expectations and assumptions and not on historical facts. These forward-looking statements involve a number of risks and uncertainties. Among the important factors that could cause actual results to differ materially from those indicated in such forward-looking statements include effects of economic conditions and market conditions in the markets in which the Company operates and competition with other destination travel locations throughout the United States and the world. In providing forward-looking statements, the Company is not undertaking any duty or obligation to update these statements publicly as a result of new information, future events or otherwise except as required by law.
Form 10-KA copy of the Company’s annual report on Form 10-K, asfiled with the Securities and Exchange Commission, willbe furnished without charge to any stockholderupon written request to:
Mr. John M. McManusExecutive Vice President – General Counseland SecretaryMGM Resorts International3600 Las Vegas Blvd. SouthLas Vegas, NV 89109
Stock Performance GraphThe graph to the right compares the cumulative 5-year total return* of holders of MGM Resorts International’s common stock with the cumulative total returns of the Dow Jones US total market index and the Dow Jones US Gambling index. The graph tracks the performance of a $100 investment in the Company’s common stock and in each of the indexes (with the reinvestment of all dividends) from 12/31/2006 to 12/31/2011.
Transfer Agent and Registrar For Common StockBNY Mellon Shareowner Services480 Washington Blvd.Jersey City, NJ 07310-1900(800) 368-2066 United States(201) 680-6578 Foreign(800) 231-5469 TDD for Hearing Impaired(201) 680-6610 TDD for Foreign Stockholderswww.bnymellon.com/shareowner/isd
*$100 invested on 12/31/06 in stock or index, including reinvestment of dividends. Fiscal year ending December 31.
Copyright© 2012 Dow Jones & Co. All rights reserved.
Independent Registered Public Accounting FirmDeloitte & Touche LLP3883 Howard Hughes Parkway, Suite 400Las Vegas, NV 89169
For the years ended December 31, 2011 2010
HIGH LOW HIGH LOW
First Quarter $16.94 $12.15 $12.87 $9.31
Second Quarter 15.80 11.78 16.66 9.59
Third Quarter 16.05 9.01 11.56 8.92
Fourth Quarter 12.41 7.40 15.10 10.70
The stock price performance included in this graph is not necessarily indicative of future stock price performance.
$0
$20
$40
$60
$80
$100
$120
$140
$160
12/06 12/07 12/08 12/09 12/10 12/11
COMPARISON OF 5 YEAR CUMULATIVE TOTAL RETURN* Among MGM Resorts International, the Dow Jones US Index, and the Dow Jones US Gambling Index
MGM Resorts International Dow Jones US Dow Jones US Gambling
21
12/06 12/07 12/08 12/09 12/10 12/11MGM Resorts International 100.00 146.50 23.99 15.90 25.89 18.19Dow Jones US 100.00 106.01 66.61 85.79 100.08 101.42Dow Jones US Gambling 100.00 114.80 30.87 48.08 83.23 77.3
30210narr.indd 21 4/20/12 7:07 PM
COR POR ATE IN FOR M ATION
MGM Resorts International3600 Las Vegas Blvd. SouthLas Vegas, NV 891091-702-693-7120www.mgmresorts.com
BellagioLas Vegas, NV1-702-693-7111www.bellagio.com
MGM Grand Las VegasLas Vegas, NV1-702-891-1111www.mgmgrand.com
Mandalay BayLas Vegas, NV1-702-632-7777www.mandalaybay.com
Four Seasons Hotel Las VegasLas Vegas, NV1-702-632-5000www.fourseasons.com/lasvegas
The MirageLas Vegas, NV1-702-791-7111www.mirage.com
LuxorLas Vegas, NV1-702-262-4000www.luxor.com
New York-New YorkHotel & CasinoLas Vegas, NV1-702-740-6969www.nynyhotelcasino.com
ExcaliburLas Vegas, NV1-702-597-7777www.excalibur.com
Monte CarloLas Vegas, NV1-702-730-7777www.montecarlo.com
ARIA Resort and CasinoLas Vegas, NV1-866-359-7111www.arialasvegas.com
Vdara Hotel & SpaLas Vegas, NV1-866-745-7111www.vdara.com
CrystalsRetail and EntertainmentLas Vegas, NV1-866-754-2489www.crystalsatcitycenter.com
Mandarin Oriental, Las VegasLas Vegas, NV1-702-590-8888www.mandarinoriental.com/lasvegas
Circus Circus Las VegasLas Vegas, NV1-702-734-0410www.circuscircus.com
Circus Circus RenoReno, NV1-775-329-0711www.circusreno.com
Gold Strike JeanJean, NV1-702-477-5000www.goldstrikejean.com
Railroad PassHenderson, NV1-702-294-5000www.railroadpass.com
MGM Grand DetroitDetroit, MI1-877-888-2121www.mgmgranddetroit.com
Beau RivageBiloxi, MS1-228-386-7444www.beaurivage.com
Gold Strike TunicaTunica, MS1-662-357-1111www.goldstrike.com
Silver LegacyReno, NV1-775-329-4777www.silverlegacyreno.com
Grand VictoriaElgin, IL1-847-468-7000www.grandvictoria.com
MGM MacauMacau, S.A.R.853-8802-8888www.mgmmacau.com
William J. HornbuckleChief Marketing Officer
Corey I. SandersChief Operating Officer
Daniel J. D’ArrigoExecutive Vice President,Chief Financial Officer and Treasurer
Phyllis A. JamesExecutive Vice President, Special Counsel – Litigation and Chief Diversity Officer
Aldo ManziniExecutive Vice President and Chief Administrative Officer
John M. McManusExecutive Vice President, General Counsel and Secretary
Christopher Nordling Executive Vice President of Operations
William M. Scott IVExecutive Vice President – Corporate Strategy and Special Counsel
Robert C. SelwoodExecutive Vice President andChief Accounting Officer
Rick ArpinSenior Vice President – Corporate Controller
Alan M. FeldmanSenior Vice President – Public Affairs
James A. Freeman Senior Vice President – Capital Markets and Strategy
Shawn T. SaniSenior Vice President – Taxes
James J. MurrenDirector/OfficerChairman of the Board, Chief Executive Officer, MGM Resorts International
Robert H. BaldwinDirector/OfficerChief Design and Construction Officer,MGM Resorts International
William A. BibleDirector
Burton M. CohenDirector
Willie D. DavisDirectorPresident, All-Pro Broadcasting, Inc., a radio broadcasting company
Alexis M. HermanDirectorPresident and Chief Executive Officer,New Ventures, a corporate consulting company
Roland HernandezDirectorPresident, Hernandez Media Ventures, a privately held media assets company
Anthony L. MandekicDirectorSecretary/Treasurer,Tracinda Corporation,a private investment company
Rose McKinney-JamesDirectorManaging Principal, McKinney-James and Associates, a government affairs firm
Daniel J. TaylorDirectorExecutive, Tracinda Corporation,a private investment company
Melvin B. WolzingerDirector
CORPORATE DIRECTORY
OFFICERS
DIRECTORS
DIRECTOR EMERITUS
Kirk KerkorianPresident and Chief Executive Officer,Tracinda Corporation, a private investment company
30210narr.indd 22 4/20/12 5:46 PM

IN CELEBRATION“What you leave behind is not what is engraved in stone monuments, but what is woven into the lives of others.”~ Pericles
our former Chairman and Chief executive officer was known to everyone who met him simply
as “terry,” but his contributions and legacy in las Vegas and beyond are no less than profound.
An extraordinary industry leader, he changed the profile of the gaming and hospitality industry,
and became the modern iconic face of gaming as a sophisticated and professional corporate
business. He steered the team effort that transformed MGM Grand from a single-property
company into the global enterprise that it is today.
A deeply committed philanthropist, he set the model of sharing and caring for others as the path
for our Company. not only did he spearhead creation of our employee-directed MGM Resorts
Foundation, but he also led the vanguard in addressing acute community needs, such as quality
public education through Clark County School District’s empowerment Schools, three Square,
Shade tree and the Smith Center for the performing Arts.
terry’s most enduring legacy is our company’s and our industry’s pioneering Diversity and
Inclusion initiative—first and foremost a true reflection of his personal moral creed, but also the
modern paradigm for global business. After founding our initiative in 2000, in just five short
years—by force of character, leadership and practice, he infused diversity and inclusion into our
culture and core business operations, and now MGM Resorts has become one of the leading
models of diversity in corporate America.
We celebrate terry, a man of far-reaching vision, bedrock principles and unflinching courage and
spirit. every day we embrace the values he instilled—aspire to be better, excel by doing better.
Godspeed to our mentor, our colleague, our friend!
Terry Lanni, 1943–2011
4/20/12 5:50 PM

mgmresorts.com
30210cvr.indd 1-3