mgm resorts international eastern europe market entry proposal
TRANSCRIPT


Eastern Europe Market Entry Proposal
prepared for
Dr. Alexander Nill
May 8, 2008
prepared by Cole Grundstedt
Nolan Nivera Woohyung Shin
Emily Tien Laura Torreso

Executive Summary
Upon close inspection, legalized gaming is prevalent in many places worldwide than one
might expect. The gaming markets in Las Vegas, Atlantic City, the Gulf Coast, and in Macau
receive the most attention simply because the largest casino operators tend to keep it that way.
Surprisingly, gaming in Europe is still largely untouched by the American gaming companies, and
the European casinos are operated by relatively small local and regional entities.
This proposal presents a case for MGM Mirage to utilize its core competencies and
competitive advantages to establish an operation in Eastern Europe which could then lead to
further expansion throughout the European Union should those growth opportunities arise.
Further research shows Estonia, one of the Baltic States, as a country where MGM
Mirage can develop its first European property. Its government is highly stable, a huge plus
considering its history as a former Soviet state whose contemporaries are still struggling with
independence from Moscow. In addition, Estonia’s tourism industry shows strong growth
indicators fueled by visitors from nearby countries. Also, the Estonian gaming market currently in
existence is largely controlled by one company, Olympic Entertainment Group. Under this
proposal, MGM Mirage would partner with OEG in a joint venture with 50% interest to combine
operational strengths to develop a themed resort in downtown Tallinn, the capital of Estonia.
This new resort will be positioned as a high-end property relative to others in Tallinn, but
comparable to mid-market properties MGM Mirage operates in Las Vegas. An integrated
marketing plan, featuring heavy advertising in the target markets of Sweden and Finland, travel
packages, and promotional tie-ins to local media and athletic sponsorships, will quickly build
recognition and a solid customer base.
Financially, MGM Mirage has consistently demonstrated fiscal responsibility through its
acquisitions of rival firms and strategic partnerships. This proposal calls for a conservative capital
investment of US$87.1 million with NPV into perpetuity of US$41.1 million & US$93.2 million
based on best estimate and optimistic projections with a break-even of 6 and 11 years.
By setting a foothold in Estonia, MGM Mirage would boost its international portfolio,
diversify its U.S. market, and strengthen its status as a global entertainment company.

Table of Contents
CORPORATE BACKGROUND ................................................................ 1
CORE COMPETENCIES................................................................................................. 1
COMPETITIVE ADVANTAGES ........................................................................................ 3
OPPORTUNITY ANALYSIS ...................................................................... 5
COUNTRY SCREENING PROCESS ................................................................................ 5
ANALYSIS OF THE TARGET COUNTRY ......................................................................... 8
MARKET ANALYSIS ................................................................................ 10
PLAN DEVELOPMENT ............................................................................ 12
FINANCIAL EVALUATION...................................................................... 15
FINANCING METHODOLOGY ....................................................................................... 17
CASH FLOW ANALYSIS .............................................................................................. 17
FINANCIAL RISKS ....................................................................................................... 17
CONCLUSION............................................................................................ 19
APPENDIX .....................................................................................................I
REFERENCES ...........................................................................................XI

Corporate Background1 MGM Mirage has its roots in the movie business having been founded in the 1920’s as
Metro-Goldwyn-Mayer, or MGM Studios. By the early 1970’s, an Armenian-American named Kirk
Kerkorian bought the studio and slowly transformed it to solely focus on hotels and casinos.
Today, MGM Mirage is the second largest gaming company, boasting a market value of US$14.6
billion, with Kerkorian’s privately held Tracinda Corporation as the majority holder (50.7%) of
MGM Mirage stock. The firm owns 17 resorts and has ownership interests in 4 others. Together,
these 21 properties comprise 46,000 hotel rooms, 1,600 table games, 35,000 slot machines and
66,000 employees. It is interesting to note that 20 of these resorts are located throughout the
United States, with half concentrated along the Las Vegas Strip. The lone international presence
is a 50% interest in the recently opened MGM Grand Paradise in the Chinese enclave of Macau.
In 1973, when Kerkorian built the original MGM Grand in Las Vegas, the business model
of casino properties focused strictly on the gaming operation while non-gaming amenities like the
hotel, restaurants, and showrooms, were simply afterthoughts, or sunk costs needed to drive
casino revenues. In 1989, competitor Steve Wynn, through his company Mirage Resorts, opened
The Mirage and changed the business model to extract as much revenue from all parts of the
resort operation whether gaming or non-gaming2. This notion was so enlightening that Wynn is
widely considered the founder of modern Las Vegas and the rise of the casino mega-resort, a
property that comprises a hotel with thousands of rooms centered around a large casino and with
a host of amenities such as multiple restaurants, a spa and health club, and other entertainment
venues such as nightclubs, and showrooms.
Core Competencies So, what does MGM Mirage do best? First, they are adept at harnessing all of the
various divisions encompassing a modern casino resort and creating one concerted guest
experience. The theory goes that a guest who checks into the resort should not have a reason to
leave it until it is time to go back home. Each division within an MGM Mirage property, from the
casino, to the hotel, to the food and beverage outlets, has skilled managers who specialize in
1

their respective operations. Further, each property has senior managers who can then channel
the efforts of each division to provide that seamless guest experience. As proof of this
commitment to superior service, each of their 10 Strip properties has been recognized by the
venerable Automobile Association of America whose tiered diamond rating represents the
consistent level of quality service provided, from no diamonds for poor service to five diamonds
for the highest level of service. MGM Mirage’s Strip properties range from a respectable three
diamonds for Circus Circus to five diamonds at the Bellagio, while all others have earned four
diamonds.
Perhaps as a nod to its origins as a movie studio, MGM Mirage is also an expert at
promoting live events. For example, if the hottest rock band is touring, or a championship boxing
match is announced, or maybe the country music industry is planning its annual awards show,
the company has the influence to attract these acts and, more importantly, the capacity to host
such events. Doing so only solidifies MGM Mirage as a true entertainment brand.
Another skill which the company exhibits is the ability to determine the dollar value of
each customer. Although this concept is not new, it seems the gaming industry does this better
than most, and MGM Mirage is certainly one of the best. Like all casinos, MGM Mirage
encourages all gambling customers to sign up for frequent player cards under the guise of
rewarding them with complimentaries, or commodities offered for free or reduced cost, such as
hotel room stays, dining credits, or show tickets. Of course, the amount of gambling the customer
does is captured each time the player’s card is used. From this data, the company applies an
expected value function to determine what that customer is worth then tailors a marketing plan
which includes appropriate “comps” to encourage repeat visits and, thus, more casino play.
Finally, although the company has many more core competencies, the last one we will
cover involves property themes and architectural design. In a congested market like Las Vegas,
a casino has to do something to distinguish itself from the competitor next door. Steve Wynn was
a master of this, but the rest of the market caught on quickly. As a result, many of MGM Mirage’s
properties have distinct themes, from the pirate motif of T.I. to the grand Italian villa of the
Bellagio. The trend has now evolved away from themes per se, but rather into dramatic
2
architectural designs that have only been captured via artist renderings since many of the current
projects are still under construction.
Competitive Advantages From its core competencies, MGM Mirage executes its strategies to differentiate itself
from its competitors. One such distinction is the company’s diverse customer base. For
example, if the spectrum of gambling customers can be placed on a scale from low to high and
separated into quartiles, then competitors Wynn and Las Vegas Sands, parent company of the
Venetian, tend to focus on the top 25%, or the high-rollers. This niche, although smaller in
number, tends to have higher margins by virtue of their higher wagers. Clearly, marketing to this
segment is lucrative as their properties reflect such a lifestyle. By contrast, another competitor
Harrah’s Entertainment tends to focus on the bottom 75% with an emphasis on the middle two
quartiles. Their strategy is to capture smaller margins but make up for it in volume, and this has
certainly rewarded their shareholders well. For MGM Mirage, they see this spectrum of gamblers
and decide to market to all of them regardless of where they place on that scale. MGM Mirage
can do this because each of their 10 properties along the Strip is treated as a brand that is
positioned accordingly such that budget conscious guests are steered to the Circus Circus, or
perhaps the Excalibur, while mid-level guests are offered the T.I. or Luxor among others. Their
high-rollers are “comped” at the Bellagio, of course. What if the customer is not a gambler but
simply looking for rest and relaxation? No problem, the company’s marketing team would
suggest a stay at THEhotel at Mandalay Bay to highlight the extensive spa services offered and
mention the Broadway production playing in the adjacent theater venue. Another non-gaming
market segment that MGM Mirage targets is the meeting and convention planning market.
Utilizing their large event centers at several of their properties, MGM Mirage marketers attract
meeting planners whose companies or clients require a large venue to accommodate company
meetings, product rollouts, or trade shows. Convention attendees can number into the thousands
which translates to an equal number of room bookings, followed by residual revenue in restaurant
spending, plus any additional gaming wagers that usually accompany large groups. In addition,
having the space capacity to showcase these meetings on property is an advantage that other
3

gaming properties do not have, as they rely on third party space providers like the local
convention center.
The sheer size of MGM Mirage’s daily operating requirements, either at individual
properties or taken collectively, means the firm can exert pricing pressure on any of its suppliers
to ensure the lowest possible price. Surely, this is done for all general goods and services, like
bed linens, uniforms, and foodstuffs. Any of these items can be procured from local or regional
sources regardless of where the property is located. On the other hand, specialty goods like
gaming equipment are sourced from a smaller pool of suppliers. But, considering the aggregate
number of table games and slot machines the firm uses, it behooves those suppliers to find cost
effective ways to provide the specialty equipment that keeps MGM Mirage buyers happy.
Furthermore, most casinos utilize a lease option for each table game and slot machine on the
gaming floor which translates to residual income in perpetuity for the given supplier.
A quick look at the firm’s financial performance reinforces its sound fiscal stability33. For
the five-year period ended December 31, 2007, the company reported a 114% growth rate to
US$7.7 billion. Casinos tend to emphasize EBITDA because each property is heavily
depreciated and MGM Mirage recorded a 155% growth rate to US$2.8 billion for the same five-
year period. Since casino transactions are mostly in cash, the firm recorded net cash from
operations at US$994.4 million for the year ended December 31, 2007 while the past three-year
average is US$1.14 billion. The companies proves its financial stewardship by using this cash to
buyback stock, pay down debt, or invest in new ventures either through acquisitions or strategic
partnership.
Looking at the company’s growth in the last eight years shows a predictable trend—it
grew largely by acquiring competitors. First, it took over Mirage Resorts in 2000, gaining four
properties along the Strip as well as the Beau Rivage in Mississippi and assuming its current
moniker MGM Mirage. Next, it acquired Mandalay Resort Group in 2005, growing by another five
properties in Las Vegas. While these two acquisitions have been the primary growth vehicle for
MGM Mirage, it’s four other ownership interests are simply strategic alliances with specialty
partners. For example, the planned MGM Grand at Foxwoods is a 50/50 partnership with the
4

Mashantucket Pequot Indian Tribe of Connecticut and gives the firm an entry into the lucrative
tribal gaming market in the U.S. Another interesting partnership involves an agreement with
Mubadala Development Corporation to open a planned US$3 billion resort in Abu Dhabi, United
Arab Emirates. Under this agreement, MGM Mirage does not contribute a single dollar to the
project but will lend its name and operational management expertise in return for a management
fee. Finally, the firm’s existing lone international property, the MGM Grand Paradise Macau, is a
50/50 partnership with Pansy Ho, the daughter of the Stanley Ho who previously monopolized the
Macau gaming market until China allowed foreign investment to expand this gaming destination.
While on the topic of international exposure, clearly MGM Mirage has an opportunity to
broaden its international portfolio. Although the planned developments in Abu Dhabi as well as
other non-gaming properties in mainland China are still a few years away, it only makes sense to
establish a position in another existing international gaming jurisdiction to offset its large U.S.
market.
Opportunity Analysis Country Screening Process
The potential opportunities for a casino resort have been limited to the region of Eastern
Europe. The CIA World Factbook geographically defines this region as comprising the countries
of Belarus, Estonia, Latvia, Lithuania, and Ukraine. Each of these countries will be evaluated
based on general business indictors, potential barriers to entry, and product market data. A
series of screenings will identify the target country.
As part of the first screen, focusing on political risk allows us to exclude Belarus and
Ukraine simply because they are too risky in terms of political risk, commercial risk, and risk of
expropriation and government action. Namely, Belarus has a high rank on war risk compared to
other countries, and Ukraine ranks high for its transfer risk. (see Appendix A)
Continuing the first screen, the three remaining target markets, then, have very
corporate-friendly policies based on the Heritage Foundation’s 2008 Economic Freedom Index. 4
(see Appendix B) Estonia is considered one of the most liberal economies in the world, ranking 12th
in the index. Hallmarks of Estonia’s free, market-based economy include a balanced budget, a
5

flat-rate income tax system (the first in the world), a fully convertible currency pegged to the Euro
(€), a competitive commercial banking sector, and a hospitable environment for foreign
investment, including no tax on reinvested corporate profits (tax is not levied unless a distribution
is made).5 On the other hand, Latvia falls below the other two on this index. (see Appendix C)
We will also look at the impact of tourism on a country’s economy for the second screen
because it affects a large number of goods and services. According to Consumer Eastern
Europe, Estonia and Lithuania lead the tourism market in Eastern Europe for 2007 where tourism
receipts increased 15.1% to US$1.02 billion and 25.6% to US$974 million, respectively, since
2004. With an unemployment rate well above the other two countries’ averages, along with other
disappointing key indicators of economic development, Latvia is eliminated from further
consideration. (see Appendix D)
This third, and final, screen will consider such things as gambling law and regulations,
competition, and taxes between Estonia and Lithuania. In July of 2001, a law was passed
legalizing gambling in Lithuania. The following types of gambling are allowed: table games and
‘A’ type slot machines which enables unlimited win amounts, ‘B’ type slot machines which have a
maximum betting limit of LTL 1 (Lithuanian lita) (€0.29) and a win cap of 200 times the amount
bet, bingo, sports betting, and general betting. Companies can acquire all of the licenses
mentioned above. The mandatory requirements to start a gambling business are that casinos
must have at least 3 table games (one table has to be a roulette table) and at least 30 ‘A’ slot
machines and a minimum share capital of LTL 1 million (€289,620). Foreign equity ownership is
not restricted and licenses can be acquired for an unlimited amount of time.6
In 1995 the Estonia Gambling Tax Act was adopted by its parliament. The first casino
was opened in 1993. The types of gambling allowed are table games, slot machines, bingo, and
sports betting. The mandatory requirements to start a gambling business are a minimum share
capital of EEK 2 million (Estonian kroons) (€127,812), the gambling location is limited only to
gambling whereby no other economic activities are permitted (currency exchange and catering
6

services are allowed, however), and an operation permit is required which is good for 5 years and
indicates exact gambling locations. Foreign equity ownership is not restricted and an activity
license is provided for 10 years
Based on the information listed above we can conclude that gambling in Estonia has
been established much longer and people are getting much more accustomed to it than in
Lithuania. The requirements to open a new business are similar in both countries and all types of
gambling are the same.7
In Lithuania, the largest gaming companies are Olympic Casino, Casino Planet, Nese,
and Lydia Ludic.8 The largest gaming companies currently operating in Estonia are Olympic
Casino, Play-in Casino, Videomat Casino, and Casino Sfinks. Olympic Casino currently has 38%
of the market in Estonia and 55% in Lithuania. The biggest casino in Estonia is Reval Casino –
Park Hotel which has 4 table games and 75 slot machines. As we can see from the table (see
Appendix E), the Estonian market has a larger number of casinos. Of the various companies, the
largest (Olympic Entertainment Group) owns 38% of the market. In Lithuania, OEG also owns a
majority of the casinos, but the casinos are less in number.9 The greater market presence of
OEG in Estonia will become strategically important later making it easier to enter the market
there. Gaming taxes in both counties are also distinctly different.
From the table (see Appendix F) we can assume people will be willing to gamble more in
Estonia, because they will need to pay less tax on any winnings. We can safely assume, then,
that people are more willing to gamble in Estonia, including Lithuanians, because of the lower tax
rates.
The data shows that it will be easier to enter the Estonian gambling market. MGM
Mirage should model their services after Las Vegas while adapting some to the Estonian market.
In this way, they should enter the market with the idea to build a smaller version of their resorts in
Tallinn, the Capital, and offer all varieties of gambling that their competitors do not offer. Using
this approach they should then employ an aggressive strategy of focus marketing to attract
potential clients, such as the Finnish who would make frequent weekend holidays to Estonian
because of the short 40 mile ferry ride.
7

Analysis of the Target Country
Competitive Environment
Estonia has legalized gambling in most of its cities. About 12 cities in Estonia have
around 72 legal gambling casinos. The casinos in the country have a wide mix and variety of
casino games like poker, bingo and slots. Since the country has many cities, the casinos are
spread out in a very different proportion. Tallinn has 38 casinos, the maximum in an Estonian
city. The gaming machines are a good combination of slots, video poker terminals and many
more. The largest casino, Reval Casino operated by OEG, is also located in Tallinn with 75
gaming machines and four table games.10
The main competitor in Estonia is Olympic Entertainment Group. OEG is the biggest
company in Baltic States organizing gambling games in Estonia, Latvia, Lithuania and Ukraine.
There are 18 OEG Casinos in Estonia. Currently, it has in total 22 gaming tables and 1250 slot
machines. The casino market in Estonia as a whole grew by 39%; OEG increased its turnover by
48.2%, market share increased to 38%. Its position employs a combination of Las Vegas
entertainment and European manners, having the newest slot machines and tables for roulette,
blackjack, oasis stud poker and baccarat.11
Consumers
The largest determinants of the success and growth of the gaming industry are
consumers’ purchasing power and preferences. With the increased sophistication of the
consumer, he or she is now more demanding in the variety of amenities and services being
offered, thus the idea of an MGM Mirage type casino that offers a variety of amenities and
services would be an ideal business investment.
The main target markets and consumers for MGM Mirage are the Finnish and the
Swedish. According to the World Fact Book, the population in Finland and Sweden is 5,244,749
and 9,045,389 (July 2008 est.). 66.8% of Finnish and 65.6% of Swedish are between 15 and 64
years.12 Based on this information, we estimate the target market’s sizes are approximately 3
million for Finland and 5 million for Swedish.
8

Market Segments and Attractiveness
Looking at the market segments and their attractiveness, the largest gaming market
country in Eastern Europe is Estonia. As we mentioned before, Estonia leads the tourism market
in Eastern Europe for 2007 where tourism receipts increased 15.1% to US$1.02 billion since
2004. In 2006, growth gaming revenue in Estonia is more than €18 million which is the highest
revenue. The following table (see Appendix G) shows us that Estonia has a better market segment
and attractiveness than other countries in Eastern Europe.
Estonia has the most casino units which causes the highest Growth Gaming Revenue
(GGR). Moreover, it has the lowest tax rates in Eastern Europe which effectively increases its
GGR. With the smallest population among three countries, we can assume that Estonia has a
casino friendly environment. It also proves that Estonia leads the tourism market in Eastern
Europe.
Country Infrastructure Considerations
We will first look at the communication systems. Estonia’s communication systems as
applied to the business environment are considered to be well developed. Radio stations,
television stations, and internet service providers are prevalent countrywide. The postal service
is considered to be reliable and offers many services.
Looking at the banking system, the financial system in Estonia consists of both
commercial and investment banks. Banking in Estonia is very user friendly and offers many of
the services that one would find in the United States. There are three major banks in Estonia and
provide effective services available to all citizens.
Regarding foreign currency transactions, the Estonian monetary system is based on a
currency board arrangement, under which the exchange rate of the EEK, the major currency in
Estonia, is pegged to the €.13 In order to maintain the fixed rate of the EEK, the central bank’s
liabilities, including the monetary base in the economy, must be fully guaranteed by foreign
exchange reserves.14 All other major currencies can be exchanged at banks and bureaux de
change.
9

Political and Regulatory Risk
This will involve firstly institutional stability. Joining the European Union has helped to
increase the political stability and the standards of business ethics.15 Political stability and
absence of violence is rated at 70%, control of corruption is rated at about 80%, and government
effectiveness is roughly 80-85%.16 Political risk data indicates Estonia is a good country to start a
business by avoiding corruption with a political stability rating of 70%.
Noting the pro-business climate, Estonia is a capitalistic free market economy that places
a high priority on foreign business and investments. The unemployment rate in 2006 was 4.5%,
below the EU-wide average of 6.7%. Around Tallinn, especially, the rate was impressively about
0%.17 Estonia’s business attitude toward the United States is positive, and business relations
between the two countries are increasing. Finnish and Swedish companies are the primary
competitors in Estonian marketplace.
Cultural Considerations
Estonian is the official language. Most people also speak Russian, which is the mother
tongue of around 30% of the population. Many of the Russians or their ancestors settled in
Estonia after the Union of Soviet Socialist Republics (USSR). Estonia is highly urbanized and
about 69% of the people live in cities or towns, with nearly one-third of the total population
residing in the capital, Tallinn. About 46% of the people are Christians. Estonia has an adult
literacy rate of nearly 100%, and education is compulsory for 9 years starting from age 7.18
Market Analysis The Estonian gaming market exhibits robust growth indicators. The average annual
visitor growth rate over the last two years is 41.5%, with domestic tourism in Tallinn growing by as
much as 15%, and foreign visitation increasing by 2%.19,20 In 2007, tourism accounted for
US$1.3 billion to Estonian coffers20. The casino industry in total for Estonia is comprised of
nearly 5,000 slot machines21. In addition, Estonian casinos made a net profit of US$15.1
10

million22. Also, the country’s GDP per capita is US$19,600 with the GDP growth rate measured
at 11.4% from 2006 to 200723.
Casinos currently operating in Estonia face an identical cost structure to those in the U.S.
Labor and marketing costs tend to be the largest expenses, followed by taxes. As in the U.S.,
Estonian casinos are heavily depreciated, with varying rates on buildings and gaming equipment.
There is also the inherent risk of “bad luck” should betting customers hit a win streak that tends to
skew quarterly operating results. Aside from the initial capital outlay, barriers to entry in Estonia
are becoming more difficult as the government will limit the number of casinos by 2009, forcing
consolidation24. Other licensing requirements are easily attained, such as a minimum of 30 slots
and 5 table games. Also, casinos must be in stand-alone structures and will be allowed to share
space with adjacent hotels, conference centers, or entertainment complexes, which is currently
not the case. In a twist of capturing customer data through player’s cards, casino visitors must
also present their passport to gain entry. The industry also faces a direct threat from unlicensed
online gambling, which affects gaming markets worldwide since enforcement can be difficult.
Most Estonian casinos are highly visible and easily accessible via public and private
transportation modes. Additionally, several casinos sponsor local athletic teams that play in
regional as well as international venues. This leads to better brand recognition in those locations
and fosters loyalty among the “hometown” crowd. Unlike the U.S. market, resort services here
are still fragmented, but the larger casinos are getting better at coordinating gaming, lodging,
dining, and entertainment operations.
There are currently 4 large competitors operating in Estonia today. The first, Olympic
Entertainment Group, has the largest market share and touts its passionate for providing
excellent customer service19. Next is Ritzio Entertainment Group that also positions its properties
at the high-end, like OEG, and is active in local philanthropy25. Coming in as a mid-market
player, the Play-In Casino Group AS retains modern facilities and appeals to all gamblers26. The
value position is maintained by Videomat whose casinos offer a neighborhood vibe with an
abundance of cheap drinks and lower denomination slot machines27.
11
Plan Development28
MGM Mirage brings many strengths to Estonia. They not only have a strong market
position but they also possess strong financial performance and high operating cash flows. The
operating profit of the company was US$1,758.2 million during fiscal year 2006, an increase of
32.2% over 2005. The net profit was US$648.3 million in fiscal year 2006, an increase of 46.3%
over 2005. As far as management experience, MGM Mirage owns a wide class range of
properties from Circus Circus casino to Bellagio casino which gives them a strong ability to
manage different classes of casino resorts. In addition, being the market leader in the hospitality
industry, MGM Mirage has solid supplier relationships. However, since this is the first project for
MGM Mirage in the European market, we believe that the most difficult problems for MGM Mirage
to deal with are the legal issues including the previously discussed special regulations for the
gaming industry and the trend towards consolidation. This is compounded by the notable culture
differences. In contrast, Olympic Entertainment Group has been in the Estonian market for more
than a decade so they know the Estonian culture and regulations well enough and they also have
an established clientele and labor pool.
Because of these strength and weakness for MGM Mirage in this new market, we
suggest that MGM Mirage enter into a joint venture with OEG which owns the largest gaming
market in Estonia at 38%. MGM Mirage can take advantage of OEG’s expertise for market
penetration to have a better understating of the unique nature of Estonia. MGM Mirage should
also send some upper-level managers to Estonia for an ethnographic study to understand the
culture and the business of OEG; this will also serve to build relationships with potential
customers and local suppliers. Conversely, OEG can utilize MGM Mirage’s strong financial
backing and their management skills in a luxury casino resort.
There might be some arguments against OEG entering into a joint venture with MGM
Mirage such as market sharing and dilution; however OEG is currently targeting the local market
and our new project is focusing on the tourists from Finland and Sweden so this argument is
moot. There might be some other arguments such as the difference of corporate culture and the
perception of service quality between MGM Mirage and OEG. These might cause the conflicts
12

between the companies and also the brand name will be damaged if the operating issues can’t be
solved. These corporate culture and management issues are mitigated, however, due to the
similar power distances between the U.S. and Estonia according to Hofstede’s cultural
dimensions. (see Appendix H) Nevertheless, these are issues that we need to deal with for the joint
venture. The structure of the joint venture, though, will be 50-50 where both MGM Mirage and
OEG will have 50% investment duty and ownership rights. This also means that MGM Mirage
can reduce 50% of the risk.
The first two biggest casinos in Estonia are Reval casino and Bally’s casino; the Reval
casino has 4 tables and 75 slot machines and Bally’s casino has 5 tables and 50 slot machines.
The biggest drawback of the current casinos is that they have separate facilities for different
services which make it inconvenient for the customers. Also, most of the casinos are small and
low-class with limited games offered like the small casinos in downtown Las Vegas. Our project
proposes to have all the services and entertainment in the same building and provide a high
quality of service to differentiate from our competitors. We will position ourselves as an upper-
scale luxury casino resort which will be similar to the TI or the Luxor in Las Vegas. Despite the
fact that these comparable casino resorts are mid-scale in Las Vegas, they are upper-scale in
Estonia because there are no luxurious casino resorts like the TI or the Luxor currently. We also
want our customers to have a “TASTE OF VEGAS” which means they can enjoy all the services
and entertainment that they can get from Las Vegas without actually coming here. Compared to
OEG’s current market, we have a different target market which is Scandinavians in their 20’s to
30’s with mid to upper-middle level of income for people who want to enjoy Las Vegas lifestyle;
this will also increase the interest for OEG to enter a joint venture with MGM Mirage due to the
wider customer base. We believe that people from Scandinavia will come here often to spend
their weekends or vacations and enjoy the luxury service and relaxation. They will feel the
“TASTE OF VEGAS” that they can’t get anywhere in their country.
The casino resort will have a Las Vegas style theme and the size will be twice as big as
the current biggest casino in Estonia. Therefore there will be roughly 1,000 rooms in the hotel
and about 8 table games and 150 slot machines in the casino. All the fees including the room
13

charges, services and all other amenities will be 15% to 20% more than the current market rates.
That way it will be in an acceptable price range, yet reflect the expectation of higher quality and
service.
We also decided to build a brand new casino. The reason being is that refurbishment will
cost even more than a new building due to the poor construction of old Soviet era buildings. The
location will be close to the main port to make it convenient and visible for the tourists arriving
from Finland and Sweden. Also, nearly all the hotels and casinos in the industry are clustered
around the port. This allows us to take advantage of these resources such as suppliers, labor
and existing infrastructure for the industry.
Gaming advertising is not allowed in Estonia; as a result our marketing program will be
focused mainly in Stockholm and Helsinki (the capital cities of our target market countries). Since
our primary target market is Finnish and Swedish in their 20’s and 30’s, we believe that ads via
television and internet will be the most effective way to attract their attention. The goal for our
marketing program is for people to recognize the MGM Mirage brand name as well as to attract
people to come to our resort. The advertisement will focus on expressing the benefit of living the
Las Vegas lifestyle which ranges from the luxurious bars, high class night clubs, relaxing spa
services, sports books and much more. Based on Hofstede’s Cultural Dimensions for
masculinity, this method of advertising should catch people’s eye since people from Finland and
Sweden value the quality of life (versus quantity of life) being the most feminine countries in the
world. (see Appendix H) This advertisement will also make them feel how amazing it is to merely
spend their few day’s vacation to have the same quality of service of Las Vegas without spending
much time and money to physically go to Las Vegas. We will also use sports stars and TV or
music celebrities in our advertising because this will raise the interest and increase the legitimacy
in our resort to our target market.
Since the ferry is the main transportation for people from Finland and Sweden to Estonia,
we will also advertise on the ferry and provide promotion packages which will include ferry rides
with hotel accommodations as well as shuttle services between the port, our casino resort and all
other local OEG properties. In this way, OEG will also benefit from this service. In addition to
14

advertising, a kick-off party will be held from the grand opening. VIP’s in the industry and
important people from the government will be invited. The media will also be in attendance which
will also give us free publicity at the same time.
Financial Evaluation In order to determine whether this project should proceed, there are many financial
factors that must be considered. We will need to estimate the costs involved in the project
including the building construction, the land, taxes, utilities, advertising and labor. Since all of
these costs will be incurred in a foreign market, there must be allowances for the cost differences
between Estonia and the U.S.
All of the bottom line numbers are listed in US$ for comparative purposes. All financial
data was converted (if appropriate) into US$ using the average exchange rate at the time the
comparative cost was incurred. This was then (if appropriate) converted to 2007 US$ since this
was the most current complete year that data is available.
Capital Investments & Initial Expense We intend to build a casino resort that will be bigger than the largest casino in Estonia.
Currently this is the Reval Park Hotel & Casino (OEG operates the casino). It has 75 slot
machines and 4 table games10 and has 121 rooms & suites29. Our casino will be twice the size
(160 slot machines and table games) and have 1,000 rooms.
To determine the cost of construction for this new casino resort, we will use a similar
casino resort currently owned by MGM Mirage as a reference – Treasure Island (TI). The style
and class of the resort are similar to what we will be building in Tallinn, Estonia. The TI was built
in 1993, cost US$430 million and is 1,268,000 sq. ft. (see Appendix I). The overall cost in today’s
(2007) dollars would be US$617 million (see Appendix J). This will be US$43.2 million for the casino
portion and US$573.8 million for the remainder of the resort. (see Appendix K)
The new casino resort will have 31 of the rooms of TI (1,000 rooms) and 12
1 the casino
size (7,500 square feet). (see Appendix L) This would therefore cost US$3.6 million for the casino
and US$191.3 for the remainder of the resort. The total construction costs will be US$195 million
15

if constructed in the U.S. (see Appendix M) The cost of construction of the same building in Estonia
would be US$172.7 million. (see Appendix N)
The total land required to build the new casino resort is 28,633 square feet. The cost of
unimproved land in the Tallinn area is EEK4000 – 5000 per square meter in 200230. Therefore
the total cost of land is US$1,017,053. (see Appendix O) To acquire a gaming license for 10 years,
we must provide a minimum share capital of US$199,3817. (see Appendix P) We estimate it will
cost the entire year’s advertizing expense for initial campaign (kick-off party) which is
US$308,937. (see Appendix Q)
Operating Expenses (Fixed) The cost to maintain the property land including utilities and taxes is US$288,311 a year.
(see Appendix R) Salary and wages of the new resorts employees are estimated at US$6.62
million per year. (see Appendix S) The new casino resort will have an annual advertizing expense
of US$308,937. (see Appendix Q)
Operating Expenses (Variable) To estimate the costs specific to the operation of the casino resort, we will be peg off of
the whole operations of MGM Mirage. Adjustments were made for the differing costs from the
U.S. market versus Estonia. We estimate that it costs US$49.38 per person per year to run the
casino resort. Using tourism data from the Estonia Tourism Board, in-bound/international tourism
is expected to grow by 2% in 2008 and beyond from the 1.38 million tourists in 2007 for
accommodation establishments (similar to our proposal). We therefore used a customer
population base of 1.41 million. We then used the 38% market share of OEG that we hope to
capture. We used an optimistic (100%), best estimate (75%) and pessimistic (50%) as the
percentage of the OEG market that we hope to capture. This computed our variables costs at
US$26.5 million, US$19.8 million, and US$13.2 million respectively. (see Appendix T)
Operating Revenue The revenue is variable like the aforementioned costs. Using Estonian market data for
2007 which will be the average revenue per person based on in-bound (international) tourists
staying overnight as accommodation establishments (which is defined as a hotel that offers
amenities such as spas and restaurants). This comes to US$143.03 per person. The total
16

revenues are calculated similar to the costs using an optimistic, best estimate and pessimistic
view of the percentage of OEG market share we will capture. These are US$76.6 million,
US$57.5 million, and US$38.3 million respectively. (see Appendix U)
Financing Methodology From the above calculations, we determined that MGM Mirage must raise US$174.2
million to fund the project. This will be a mix of debt through loans and corporate bonds and
equity through stock issuance. The company’s preferred debt equity mix is 65% debt and 35%
equity. (see Appendix V) This is common for gaming companies with lower operational risk to raise
leveraged funds through long-term debt.
To determine the weighted average cost of capital (WACC), we must determine the cost
of debt. We estimate this at 6.5%. (see Appendix W)
To determine the cost of equity, we used the return-on-equity (ROE) percentage as a
proxy re-investment rate31 since MGM Mirage does not issue dividends. The cost of equity rate
is estimated at 31.9% which is the return that investors demand for their money (see Appendix X)
The WACC is therefore 13.9%. (see Appendix Y)
Cash Flow Analysis Using the 50-50 Joint Venture arrangement which assumes a 50% capital investment
contribution and a 50% stake on the income, the net present value of this project’s cash flows into
perpetuity with a 2% growth rate (from Estonian tourist statistics) are US$93.2 million, US$41.1
million, and –US$11.9 million for the optimistic, best estimate, and pessimistic estimates on the
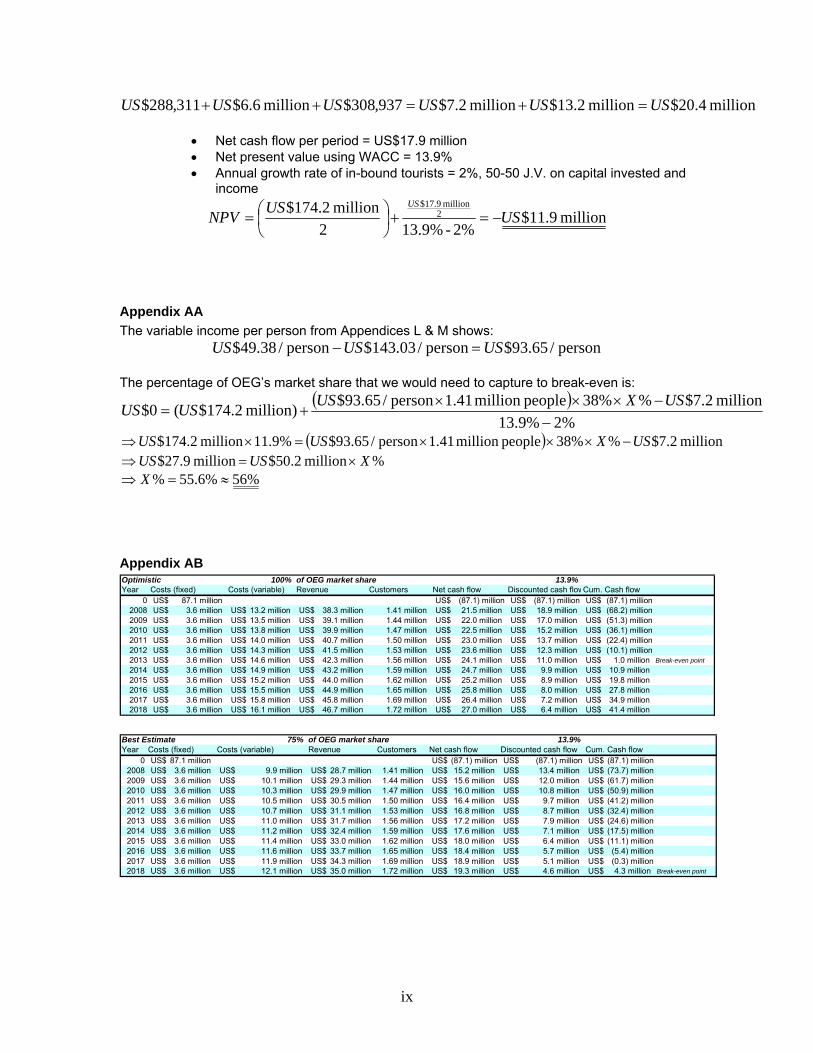
percentage of OEG’s market share we will capture. (see Appendix Z) The break-even point for this
estimate is 56%, meaning that we must capture at least 56% of OEG’s existing market share to
turn a profit. (see Appendix AA) According to the cash flow summaries, using the discounted cash
flows, the project will be profitable after 6 years & 11 years (optimistic & best estimate) as that is
when the initial capital investment will be paid back. (see Appendix AB)
Financial Risks
Customer Risk
17

Given that the cash flow analysis shows that we must capture at least 56% of OEG’s
current market share, we must explore the sensitivity of this number. 100% yields over US$93
million overall and 75% yields US$41 million. The 2% growth rate used was based on future
projections by the Estonia Tourist Board for international tourists. There is always a risk that the
foreign tourism market may experience less growth than expected or shrinkage. The growth rate
in the past 5 years has been slowing down. This has been due to the increasing costs of Estonia
due to their strong market, where cheap prices were the major draw for foreigners.20
To mitigate this, the domestic tourism has been experiencing much stronger growth – as
high as 23% in recent years.20 As the economy in Estonia becomes more developed, the middle
and upper-middle class will grow. This will bring them into the correct demographic for our
project. Increases in this market could balance out decreases or slowing in our targeted Swedish
and Finnish markets.
Another mitigating factor is that access to Estonia through airline routes and hubs is
increasing tourism from countries other than Sweden and Finland, namely Norway, Poland and
Spain in the past year.20 Increases in this market would definitely smooth any downturns in our
target market.
Political risk According to the Worldwide Governance Indicators (1996-2006), Estonia is in the 70th
percentile for political stability as of 2006. By comparison, the United States is in 60th percentile
for political stability for the same period.16 Given that the United States is MGM Mirage’s base of
operations, it is safe to assume that the market entry into Estonia will not have more political risk
than its normal operations. It was therefore appropriate to use the WACC as our discount rate.
Other mitigating factors for the political risk are Estonia’s membership in the European
Union. This will shield Estonia from most of the political pressure and instability that neighboring
Russia can cause – which they have already caused in Belarus and Ukraine.
Currency risk For our initial investment, since much of the funds will be due upon completion of the
project which is a reasonably defined date, MGM Mirage can hedge their risk by purchasing a
18

19
forward contract to buy €’s at a specified US$ amount in 2 years. Because the EEK is pegged to
the €, we can get a contract to buy €’s at the future rate with no currency risk to change into EEK.
For the new casino resort’s ongoing operations, it would mitigate risk for all expenses to
be paid in EEK or €’s by using the revenues from the customers who paid in EEK or €’s, creating
a pseudo-closed system that’s free from currency risk. This is why it was important to establish
relationships with local and regional suppliers, either through MGM Mirage itself or the Joint
Venture using OEG’s existing contacts. The eventual profits will be converted into US$ causing
potential transaction risk each time, but this is advantageous for MGM Mirage with the current
weak US$. If the US$ does improve, there is no real way to mitigate this risk since it’s
operational and on-going.
Conclusion Pursuing this proposed entry into Estonia will give MGM Mirage instant diversification to
its heavy U.S.-based portfolio. In fact, it will only be the firm’s second international location after
Macau. Additionally, some strategic advantages can be realized from such an entry. First, it
gives the company a foothold into the European Union, an advantage that can be leveraged
should other gaming opportunities arise in any other EU country. Second, MGM Mirage can
enjoy first-mover advantage as no other U.S.-based gaming company currently has an operation
in Europe. Finally, by building and solidifying its name in this relatively untamed market, MGM
Mirage only strengthens itself as a truly global entertainment brand.

Appendix
Appendix A32 Country Political Risk
Short Term Political Risk Medium/Long Term
Political Risk Special transactions
Commercial risk
War risk
Risk of expropriation and government action
Transfer risk
Belarus 6 7 6 C 4 5 4 Estonia 1 2 2 A 1 1 3 Latvia 1 3 2 B 1 1 4 Lithuania 1 2 1 B 1 1 2 Ukraine 3 5 4 C 2 3 5
Appendix B33 Country Estonia Latvia Lithuania Economy Freedom (World Raking) 12 38 26 Unemployment 4.5% (2006) 7.3% (2006) 4.3% (2007)
Appendix C 2003 2004 2005 2006
(estimation) 2007 (forecast)
Central government budget fiscal balance -1.6 -1.1 -1.2 -0.3 -1.4 Central government debt 14.4 14.5 12.1 10.2 10.0 Current account balance -8.1 -12.9 -12.4 -18.5 -18.0 Latvia – Key Indicators of Economic Development (in % of GDP)34
Appendix D35 Tourism Receipts (US $ million) Country 2004 2005 2006 2007 Estonia 887 948 1,001 1,021 Latvia 267 341 355 371 Lithuania 776 921 945 974
Appendix E9 Country Number of casinos Number of cities Estonia 72 12 Lithuania 25 5
i

Appendix F36 Country Sports betting tax Table, slot, bingo tax Estonia 5% 18% Lithuania 27% 27%
Appendix G37 Country Casino Units Growth
Gaming Revenue
Gaming Tax
Tax Rates Population
Estonia 72 €18,187,000 €3,274,000 18.0% 1.4 million Lithuania 13 €13,517,000 €3,379,000 25.0% 3.5 million Latvia 35 €7,114,000 €2,846,000 40.0% 2.4 million
Appendix H38 Country PDI IDV MAS UAI LTO
Estonia 40 60 30 60 Finland 33 63 26 59 Sweden 31 71 5 29 33 United States 40 91 62 46 29
Appendix I The TI has:
• 2,900 room and suites • Each room is on average 400 square feet 39
2room
400 000,160,1rooms 900,22
ftft =×
• 90,000 square feet of casino40 containing 1,947 slot machines 41 • 18,000 square feet of ballroom and other space42
2222 000,268,1000,18000,90000,160,1 ftftftft =++
Appendix J The TI cost US$430 million in 1993. Using the Consumer Price Index 43 :
• Average 1993 = 144.5 • Average 2007 = 207.342
20071993 million 617$5.144
342.207million 430$1993
2007
USUS CPI
CPI
=×
Appendix K
ii

• Portion of the total resort that is casino %7000,268,1000,90 22 =÷ ftft
• The amount of the total construction costs devoted to casino million 2.43$%7million 617$ USUS =×
• Therefore the remainder is devoted to the rest of the resort million 8.573$million 2.43$million 617$ USUSUS =−
Appendix L • TI has 2,900 rooms • The new casino resort will have 1,000 rooms
31900,2000,1 ≈÷
• The new casino resort will have 160 slot machines • The TI has 1,947 slot machines for 90,000 square feet
222
500,7396,7slots 947,1
000,90 slots 160 ftftft≈=×
12122 000,90500,7 ≈÷ ftft
Appendix M • The new casino will be 12
1 of the TI
million 6.3$million 2.43$ 121 USUS =×
• The new resort will be 31 of the TI
million 3.191$million 8.573$ 31 USUS =×
million 195$million 3.191$million 6.3$ USUSUS =+
Appendix N We have to compare the construction costs for casino resorts in the United States and Estonia.
• Olympic Entertainment built an 1,800 square meter (19,375 square feet) casino resort in 2006 for EEK100 million.44
• Construction cost per square foot in Estonia is 22 /161,5375,19million 100 ftEEKftEEK =÷
• Using the 2006 average Interbank exchange rate of EEK/US$45 22 /70.413$
1$47573.12/161,5 ftUS
USEEKftEEK =×
• Comparing the TI casino portion to the same 2006 time period
20072007 million 42$342.2076.201million 2.43$
2007
2006
USUS CPI
CPI
=×
• Construction cost per square in the United States is
iii

22 /467$000,90million 42$ ftUSftUS =÷
• Therefore the new casino resort, if constructed in Estonia would cost
million 7172467
7.413million195 2
2
.US$ftft US$US
Est =×
Appendix O To estimate the total land required, we’ll need to deviate from the Las Vegas model since there is a lot of land devoted to parking. The new casino resort in Tallinn will not have much parking because our target market is arriving by ferry and the resort will be in close proximity so our target customers will likely not have cars.
• The casino will require 7500 square feet • The resort hotel will need a third of the TI’s resort area
23
12 667,442000,268,1 ftft =× • Assuming a 20 storey tower is built, this can be reduced to
22 133,2120667,442 ftft =÷ • The total land required will be
222 633,28133,21500,7 ftftft =+
• Convert this to square meters and adding a 10% safety factor
222
22 930,2%10660,2
7639104.101633,28 mm
ftmft =+⇒≈×
• The cost in EEK in 2002 would be at most
million 65.145000930,2 22 EEK
mEEKm =×
• In US$ in 2002 using the Interbank rate 45
20022002
455,882$$
60141.16million 65.14 USUS
EEKEEK =×
• Using the CPI to get the cost in 2007
20072002 053,017,1$9.179
342.207455,882$2002
2007
USUS CPI
CPI
=×
Appendix P • Convert EEK 2 million into US$ using April 2008 rate46
381,199$031.101$million 2 US
EEKUSEEK =×
Appendix Q • Estonian advertizing investment accounts for €85 per capita in 200747
iv

• Convert to US$ Estoniacapita /51.116$
1€37074.1$ capita/85€ USUS
=×
• U.S. adverting accounts for US$523 per capita in 199048 • Convert to 2007 US$
U.S.20071990 capita /69.829$7.130
342.207capita /523$1990
2007
USUS CPI
CPI
=×
• MGM Mirage’s total advertizing expense per resort
resort/million 7.6$resorts 21million 141$ USUS =÷ 1 • We’ll assume that the ad budget is a third since the new resort is also a third
million 2.2$million 7.6$ 31 USUS =×
• Adjusting the number for comparable Estonian advertizing costs
EstoniaU.S.
EstoniaU.S. 937,308$
capita /69.829$capita /51.116$million 2.2$ US
USUSUS =×
Appendix R • Land maintenance costs are estimated at EEK75 per square meter per month49
million 637.21275930,2.
22 EEKmoEEKm
mom
=××
• Convert to US$
885,262$031.10
$million637.2 USEEK
USEEK =×
• Land taxes cost 2.5% of the value of the land annually49 426255.2053,017,1$ ,US$%US =×
311,288$426,25$885,262$ USUSUS =+
Appendix S We will use MGM Mirage as a model for labor rates
• MGM Mirage has 45,000 employees50 for 21 resorts • This is 2,143 employees average per property • The new casino resort will be a third of the size including staff
715 employees.
• Average salary in Estonia was €598 per month in 200651 • Using the average currency exchange rate in 200645
./751$25622.1$1€./598€ moUS
USmo =×
• Accounting for inflation using the CPI
v

./772$6.201
342.207./751$ 200720062006
2007
moUSmoUS CPI
CPI
=×
We would want to pay above market rate to attract the best, however the hotel and restaurant sector are on the low end of the average51. By maintaining the overall all average we are in turn paying above the average for the industry.
• Labor costs per employee per year ./264,9$.12./772$ yrUSmomoUS =×
million 62.6$employees 715./264,9$ USyrUS =×
Appendix T According to the MGM Mirage 2007 Annual Report, the operating expenses are as follows
• Casino – US$1,678 million • Rooms – US$570 million • F&B – US$984 million • Entertainment – US$399 million • Retail – US$190 million • Other – US$317 million • TOTAL – US$4,138 million1
To determine the cost per person, we’ll use the number of visitors to Las Vegas
• 39,196,761 visitors in 200752 • MGM Mirage Las Vegas casinos account for 38,000 of the 72,000 hotel rooms50
on the strip. This gives a good weighted average of market share which is 52.8% • Therefore the total cost per person in the U.S. is
person/74.55$%8.52persons 761,196,39million 138,4$ USUS
=×
We must then reduce this based on cheaper Estonian operating costs. We’ll use the same ratio for the construction costs.
person/38.49467
7.413person/74.55$ US$US
US
Est =×
Using the 2008 estimate of expected international tourists20, the OEG market share, and the 3 estimates of this market share we hope to capture: Optimistic
million 5.26$%100%38 peoplemillion 41.1person/38.49$ USUS =×××
Best Estimate million 8.19$%75%38 peoplemillion 41.1person/38.49$ USUS =×××
Pessimistic million 2.13$%50%38 peoplemillion 41.1person/38.49$ USUS =×××
Appendix U
vi

According to the Tourism in Estonia in 2007 published by the Estonian Tourist Board, 1.9 million foreign tourists stayed overnight in Estonia. Of this, 1.38 million stayed at accommodation establishments similar to our proposal. According to the same report, revenue for accommodation establishments was €144 million. With this information, we can calculate the average revenue per person:
person/35.104€million38.1million 144€
=
Converting to US$ for 2007 using the Interbank rate average for the year:
person /03.143$1€37074.1$person /35.104€ USUS
=×
Similarly as with the costs, we will use a percentage of the OEG market share to get the total operating revenue: Optimistic
million 6.76$%100%38 peoplemillion 41.1person/03.143$ USUS =×××
Best Estimate million 5.57$%75%38 peoplemillion 41.1person/03.143$ USUS =×××
Pessimistic million 3.38$%50%38 peoplemillion 41.1person/03.143$ USUS =×××
Appendix V We look to the 2007 Annual Report to determine the company’s preferred financing structure.
• Shareholder’s equity was US$6,060,703,000 • Long-term debt was US$11,175,229,000 • Equity mix is
%35000,229,175,11$000,703,060,6$
000,703,060,6$=
+USUSUS
• Therefore the debt mix is 65%
Appendix W We used the current rate on the corporate yield curve for BBB rated companies since MGM Mirage is rated BB. We used the 10-year note rate as a reasonable time frame to finance a large-scale project like this.
• The rate = 6.24% 53 • Adding an underwriting fee estimate, we use 6.5%
Appendix X We must determine the ROE using the 2007 Annual Report.
• Net income, 2007 = US$1,584 million • Shareholder’s equity, 2006 = US$3,860 million • Shareholder’s equity, 2007 = US$6,061 million
vii

%9.31
2860,3$601,6$
584,1$=
+=
USUSUSROE
Appendix Y • Cost of debt = 6.5% • Cost of equity = 31.9% • Debt to equity mix = 65/35 • Marginal tax rate = 35%
%9.13%2.11%7.2%35%9.31%65%)351(%5.6
=+=×+×−×=WACC
Appendix Z • Total capital investment and initial expenses
million 2.174$million )309$.199.0$017.1$7.172$( USUSUSUSUS =+++ Optimistic
• Total revenue per year = US$76.6 million • Total expense per year
million 7.33$million 5.26$million 2.7$937,308$million 6.6$311,288$ USUSUSUSUSUS =+=++
• Net cash flow per period = US$42.9 million • Net present value using WACC = 13.9% • Annual growth rate of in-bound tourists = 2%, 50-50 J.V. on capital invested and
income
million 2.93$2%-13.9%2
million 2.174$ 2million 9.42$
USUSNPVUS
=+⎟⎠⎞
⎜⎝⎛=
Best Estimate
• Total revenue per year = US$57.5 million • Total expense per year
million 0.27$million 8.19$million 2.7$937,308$million 6.6$311,288$ USUSUSUSUSUS =+=++
• Net cash flow per period = US$30.5 million • Net present value using WACC = 13.9% • Annual growth rate of in-bound tourists = 2%, 50-50 J.V. on capital invested and
income
million 1.41$2%-13.9%2
million 2.174$ 2million 5.30$
USUSNPVUS
=+⎟⎠⎞
⎜⎝⎛=
Pessimistic
• Total revenue per year = US$38.3 million • Total expense per year
viii
million 4.20$million 2.13$million 2.7$937,308$million 6.6$311,288$ USUSUSUSUSUS =+=++
• Net cash flow per period = US$17.9 million • Net present value using WACC = 13.9% • Annual growth rate of in-bound tourists = 2%, 50-50 J.V. on capital invested and
income
million 9.11$2%-13.9%2
million 2.174$ 2million 9.17$
USUSNPVUS
−=+⎟⎠⎞
⎜⎝⎛=
Appendix AA The variable income per person from Appendices L & M shows:
person /65.93$person /03.143$person /38.49$ USUSUS =− The percentage of OEG’s market share that we would need to capture to break-even is:
( )%2%9.13
million 2.7$%%38peoplemillion 41.1person /65.93$)million 2.174$(0$−
−×××+=
USXUSUSUS
( ) million 2.7$%%38peoplemillion 41.1person /65.93$%9.11million 2.174$ USXUSUS −×××=×⇒%million 2.50$million 9.27$ XUSUS ×=⇒
%56%6.55% ≈=⇒ X
Appendix AB Optimistic 100% of OEG market share 13.9%Year Costs (fixed) Costs (variable) Revenue Customers Net cash flow Discounted cash flowCum. Cash flow
0 87.1 millionUS$ (87.1) millionUS$ (87.1) millionUS$ (87.1) millionUS$ 2008 3.6 millionUS$ 13.2 millionUS$ 38.3 millionUS$ 1.41 million 21.5 millionUS$ 18.9 millionUS$ (68.2) millionUS$ 2009 3.6 millionUS$ 13.5 millionUS$ 39.1 millionUS$ 1.44 million 22.0 millionUS$ 17.0 millionUS$ (51.3) millionUS$ 2010 3.6 millionUS$ 13.8 millionUS$ 39.9 millionUS$ 1.47 million 22.5 millionUS$ 15.2 millionUS$ (36.1) millionUS$ 2011 3.6 millionUS$ 14.0 millionUS$ 40.7 millionUS$ 1.50 million 23.0 millionUS$ 13.7 millionUS$ (22.4) millionUS$ 2012 3.6 millionUS$ 14.3 millionUS$ 41.5 millionUS$ 1.53 million 23.6 millionUS$ 12.3 millionUS$ (10.1) millionUS$ 2013 3.6 millionUS$ 14.6 millionUS$ 42.3 millionUS$ 1.56 million 24.1 millionUS$ 11.0 millionUS$ 1.0 millionUS$ Break-even point2014 3.6 millionUS$ 14.9 millionUS$ 43.2 millionUS$ 1.59 million 24.7 millionUS$ 9.9 millionUS$ 10.9 millionUS$ 2015 3.6 millionUS$ 15.2 millionUS$ 44.0 millionUS$ 1.62 million 25.2 millionUS$ 8.9 millionUS$ 19.8 millionUS$ 2016 3.6 millionUS$ 15.5 millionUS$ 44.9 millionUS$ 1.65 million 25.8 millionUS$ 8.0 millionUS$ 27.8 millionUS$ 2017 3.6 millionUS$ 15.8 millionUS$ 45.8 millionUS$ 1.69 million 26.4 millionUS$ 7.2 millionUS$ 34.9 millionUS$ 2018 3.6 millionUS$ 16.1 millionUS$ 46.7 millionUS$ 1.72 million 27.0 millionUS$ 6.4 millionUS$ 41.4 millionUS$
Best Estimate 75% of OEG market share 13.9%Year Costs (fixed) Costs (variable) Revenue Customers Net cash flow Discounted cash flow Cum. Cash flow
0 87.1 millionUS$ (87.1) millionUS$ (87.1) millionUS$ (87.1) millionUS$ 2008 3.6 millionUS$ 9.9 millionUS$ 28.7 millionUS$ 1.41 million 15.2 millionUS$ 13.4 millionUS$ (73.7) millionUS$ 2009 3.6 millionUS$ 10.1 millionUS$ 29.3 millionUS$ 1.44 million 15.6 millionUS$ 12.0 millionUS$ (61.7) millionUS$ 2010 3.6 millionUS$ 10.3 millionUS$ 29.9 millionUS$ 1.47 million 16.0 millionUS$ 10.8 millionUS$ (50.9) millionUS$ 2011 3.6 millionUS$ 10.5 millionUS$ 30.5 millionUS$ 1.50 million 16.4 millionUS$ 9.7 millionUS$ (41.2) millionUS$ 2012 3.6 millionUS$ 10.7 millionUS$ 31.1 millionUS$ 1.53 million 16.8 millionUS$ 8.7 millionUS$ (32.4) millionUS$ 2013 3.6 millionUS$ 11.0 millionUS$ 31.7 millionUS$ 1.56 million 17.2 millionUS$ 7.9 millionUS$ (24.6) millionUS$ 2014 3.6 millionUS$ 11.2 millionUS$ 32.4 millionUS$ 1.59 million 17.6 millionUS$ 7.1 millionUS$ (17.5) millionUS$ 2015 3.6 millionUS$ 11.4 millionUS$ 33.0 millionUS$ 1.62 million 18.0 millionUS$ 6.4 millionUS$ (11.1) millionUS$ 2016 3.6 millionUS$ 11.6 millionUS$ 33.7 millionUS$ 1.65 million 18.4 millionUS$ 5.7 millionUS$ (5.4) millionUS$ 2017 3.6 millionUS$ 11.9 millionUS$ 34.3 millionUS$ 1.69 million 18.9 millionUS$ 5.1 millionUS$ (0.3) millionUS$ 2018 3.6 millionUS$ 12.1 millionUS$ 35.0 millionUS$ 1.72 million 19.3 millionUS$ 4.6 millionUS$ 4.3 millionUS$ Break-even point
ix

Pessimistic 50% of OEG market share 13.9%Year Costs (fixed) Costs (variable) Revenue Customers Net cash flow Discounted cash floCum. Cash flow
0 87.1 millionUS$ (87.1) millionUS$ (87.1) millionUS$ (87.1) millionUS$ 2008 3.6 millionUS$ 6.6 millionUS$ 19.2 millionUS$ 1.41 million 8.9 millionUS$ 7.9 millionUS$ (79.2) millionUS$ 2009 3.6 millionUS$ 6.7 millionUS$ 19.5 millionUS$ 1.44 million 9.2 millionUS$ 7.1 millionUS$ (72.2) millionUS$ 2010 3.6 millionUS$ 6.9 millionUS$ 19.9 millionUS$ 1.47 million 9.5 millionUS$ 6.4 millionUS$ (65.8) millionUS$ 2011 3.6 millionUS$ 7.0 millionUS$ 20.3 millionUS$ 1.50 million 9.7 millionUS$ 5.8 millionUS$ (60.0) millionUS$ 2012 3.6 millionUS$ 7.2 millionUS$ 20.7 millionUS$ 1.53 million 10.0 millionUS$ 5.2 millionUS$ (54.8) millionUS$ 2013 3.6 millionUS$ 7.3 millionUS$ 21.2 millionUS$ 1.56 million 10.3 millionUS$ 4.7 millionUS$ (50.1) millionUS$ 2014 3.6 millionUS$ 7.4 millionUS$ 21.6 millionUS$ 1.59 million 10.5 millionUS$ 4.2 millionUS$ (45.9) millionUS$ 2015 3.6 millionUS$ 7.6 millionUS$ 22.0 millionUS$ 1.62 million 10.8 millionUS$ 3.8 millionUS$ (42.0) millionUS$ 2016 3.6 millionUS$ 7.7 millionUS$ 22.4 millionUS$ 1.65 million 11.1 millionUS$ 3.4 millionUS$ (38.6) millionUS$ 2017 3.6 millionUS$ 7.9 millionUS$ 22.9 millionUS$ 1.69 million 11.4 millionUS$ 3.1 millionUS$ (35.5) millionUS$ 2018 3.6 millionUS$ 8.1 millionUS$ 23.4 millionUS$ 1.72 million 11.7 millionUS$ 2.8 millionUS$ (32.7) millionUS$ no break-even
x

xi
References
1 MGM Mirage (2007). “Annual report”. Retrieved from http://media.corporate-
ir.net/media_files/irol/10/101502/Proxy/MGM_AR07.pdf 2 Martinez, Andres, “24/7: Living It Up and Doubling Down in the New Las Vegas,” Villard, 1999 3 Financial date for MGM Mirage. (n.d.) Retrieved from http://finance.yahoo.com. 4 “Index of Economic Freedom” The Heritage Foundation, 2008. Retrieved from
http://www.heritage.org/index 5 “Economy of Estonia.” Wikipedia.org (n.d.) Retrieved from
http://en.wikipedia.org/wiki/Economy_of_Estonia 6 “Lithuanian Republic Gambling Law” Lietuvos Respublikos Seimas , July 19, 2006. Retrieved
from http://www3.lrs.lt/pls/inter3/dokpaieska.showdoc_l?p_id=281303&p_query=&p_tr2= 7 Glikman, Leon & Kadi Kuusk. “Estonian Gambling Regulations.” Gaming Law Review. June 1,
2004, 8(3): 173-174. doi:10.1089/1092188041427319. Retrieved from http://www.liebertonline.com/doi/abs/10.1089/1092188041427319?cookieSet=1&journalCode= glr
8 “Land Casinos Lithuania” Land Casinos Directory. Gambling Il Dado. (n.d.) Retrieved from
http://www.ildado.com/land_casinos_lithuania.html 9 “Investor Site” Olympic Entertainment Group (n.d.) Retrieved from http://www.olympic-
casino.com/?lang=group 10 “Welcome to Estonia” Estonia Casinos and Gambling (n.d.) Retrieved from
http://www.worldcasinodirectory.com/estonia 11 “Olympic Casino in Estonia” Olympic Entertainment Group (n.d.) Retrieved from
http://www.olympic-casino.com/?id=10588 12 “Estonia” The World Factbook, May 1, 2008. Retrieved from
https://www.cia.gov/library/publications/the-world-factbook/geos/en.html#People 13 “Money” Travel guide of Estonia information about Estonia. Destinia.com (n.d.) Retrieved from
http://destinia.com/guide/the-world/europe/estonia/1-30004-30080/4/en 14 “General Principles of the Estonia monetary system” Eesti Pank. (n.d.) Retrieved from
http://www.bankofestonia.info/pub/en/majandus/rahasysteem/yldalused/ 15 “Political Risk Ratings Analysis” Aon, January 2006. Retrieved from
http://www.aon.com/about/publications/pdf/issues/PoliticalRiskRatingsAnalysis-Jan06.pdf 16 “Country Data Report for Estonia” Worldwide Governance Indicators 1996-2006, 2007.
Retrieved from http://info.worldbank.org/governance/wgi2007/pdf/c71.pdf 17 “Business Profile” Travel guide of Estonia information about Estonia. Destinia.com (n.d.)
http://destinia.com/guide/the-world/europe/estonia/1-30004-30080/14/en
xii
18 “Estonia Education” Maps of World.com, (n.d.) Retrieved from
http://www.mapsofworld.com/estonia/education/index.html 19 “Olympic Casino earned 196 million kroons pofits in the first half of the year” Olympic Casino,
August 16, 2007. Retrieved from http://www.olympic-casino.com/?id=92608&b=1&c_tpl=1069&p=10789
20 “Tourism in Estonia in 2007”. Enterprise Estonia. Estonian Tourist Board. February 25, 2008.
Retrieved from http://public.visitestonia.com/files/statistika/Tourism_in_Estonia_2007.pdf 21 Hõbemägi, Toomas. “Estonia still far behind Latvia-Finland by number of slot machines in
casinos” Baltic Business News, January 1, 2008. Retrieved from http://www.balticbusinessnews.com/Default2.aspx?ArticleID=823e67e5-45d7-42fa-907c-88140c9f1b6e
22 Andersson, Stefan “17 000 net salaries lost in Estonian casinos every month.” Baltic Business
News, April 7, 2008. Retrieved from http://www.balticbusinessnews.com/Default2.aspx?BlogID=37b268d6-0c27-4193-8892-40dae3976c78&open=four
23 “Estonia GDP – real growth rate.” Index Mundi, (n.d.) Retrieved from
http://www.indexmundi.com/estonia/gdp_real_growth_rate.html 24 Gellatly, Andrew. “Estonian Casino Law Set To Drive Consolidation.” Gambling Compliance
Ltd., (n.d.) Retrieved from http://www.gamblingcompliance.com/node/7733/search/hl/estonias++market+share%3B
25 “About the brand” City Casino (n.d.) Retrieved from
http://www.citycasino.ee/index.php/pageid/240 26 “Reeglid” Playin (n.d.) Retrieved from http://www.playin.ee/?structure=011002&rnd=19819 27 “Videomat Casino” Videomat Casino Group AS, 2004. Retrieved from
http://www.videomat.ee/english/ 28 “MGM Mirage” MarketLine Business Information Center. 13 August 2007. 29 http://www.revalhotels.com/en/Hotels/Estonia-Tallinn/Reval-Park-Hotel-Casino 30 “Tallinn Real Estate Market Overview.” Arco Vara , January-June 2003. Retrieved from
”www.arcovara.ee/get/53/Tallinna%20kinnisvaraturu%20ylevaade%202003%20%201p.a._ENG.pdf
31 Donahue, Paul. “The dividend advantage” Electric Perspectives. Sep/Oct 2003, p4. Retrieved
from http://findarticles.com/p/articles/mi_qa3650/is_200309/ai_n9242463/pg_5 on 26 Apr 2008.
32 “The Belgian Export Credit Agency.” ONDD, (n.d.) Retrieved from http://www.ondd.be 33 “Unemployment Risk Factors in Estonia, Latvia and Lithuania.” OECD, 2003. Retrieved from
http://www.oecd.org/dataoecd/28/55/2493996.pdf 34 “Economy of Latvia.” Ministry of Economics of Republic of Latvia, www.em.gov.lv, 2005.
Retrieved from http://www.li.lv/index.php?option=com_content&task=view&id=119&Itemid=474

xiii
35 Euromonitor International “Consumer Eastern Europe 2006-2007” 14th Edition, August 2006. 36 “Prizų, laimėjimų ir dovanų apmokestinimas pajamų mokesčiu.” Buhalteris, January 25, 2007.
Retrieved from http://www.buhalteris.lt/index.php?cid=2803&new_id=19527 37 http://www.prater.co.at 38 “Geert Hofstede Cultural Dimensions” ITIM International, 1967-2003. Retrieved from
http://www.geert-hofstede.com/ 39 “TI – Treasure Island Hotel and Casino.” Expedia.com, (n.d.) Retrieved from
http://www.expedia.com/ 40 “Treasure Island.” MGM Mirage, (n.d.) Retrieved from http://www.mgmmirage.com/ 41 “Treasure Island Casino & Resort.” Insider Las Vegas, (n.d.) Retrieved from
http://www.insidervlv.com/casino_TreasureIsland.html 42 “Treasure Island – TI Description.” Vegas.com, 1998-2008. Retrieved from
http://www.vegas.com/resorts/treasure/ 43 “Consumer Price Index.” US Department of Labor, Bureau of Labor Statistics, April 16, 2008.
Retrieved from ftp://ftp.bls.gov/pub/special.requests/cpi/cpiai.txt 44 “Around EEK 100 mln invested in the most fabulous casino in the Baltics.” Olympic
Entertainment Group, January 6, 2006. Retrieved from http://www.olympic-casino.com/?id=24216&b=1&c_tpl=1093
45 “FXHistory: historical currency exchange rates.” Oanda.com (n.d.) Retrieved from
http://www.oanda.com/convert/fxhistory 46 “Currency Converter.” Yahoo Finance, 2008. Retrieved from
http://finance.yahoo.com/currency/convert?amt=1&from=USD&to=EEK&submit=Convert 47 “Latvian media advertising market has increased by 24 % during the year 2007 reaching 93.94
million lats” TNS Latvia. February 27, 2008. Retrieved from http://www.tns.lv/?lang=en&fullarticle=true&category=showuid&id=2756 on 4 May 2008.
48 Tremblay, Carol Horton & Victor J. Tremblay. “Advertising, price, and welfare: evidence from
the U.S. brewing industry” Southern Economic Journal, Vol. 62, 1995. Retrieved from http://www.questia.com/googleScholar.qst on 4 May 2008.
49 “The Real Estate Market.” Enterprise Estonia, (n.d.) Retrieved from
http://www.investinestonia.com/index.php?option=displaypage&Itemid=70&op=page&SubMenu=
50 Smith, Rod “MGM Mirage Makes $7.65 Billion Offer for Mandalay Resort Group.” Las Vegas
Review Journal. June 5. Retrieved from http://www.huntwebberhotels.com/hotel_information/mirage_mandalay.htm on 26 Apr 2008.
51 “Labour Market.” Enterprise Estonia, (n.d.) Retrieved from
http://www.investinestonia.com/index.php?option=displaypage&Itemid=109&op=page&SubMenu

xiv
52 “Metropolitan Las Vegas Tourism Statistics.” Las Vegas Convention and Visitors Authority,
State of Nevada Gaming Control Board, McCarran International Airport, 2007 Retrieved from http://cber.unlv.edu/tour.html on 26 Apr 2008.
53 “BondsOnline Chart Center.” BondsOnline, (n.d.) Retrieved from
http://www.bondsonline.com/Corporate_Bond_Yield_Index.php