mgm investor presentation march 2017 - amazon s3 · 2017-04-07 · mgm resorts international...
TRANSCRIPT

MGM Resorts InternationalINVESTOR PRESENTATION
March 2017

1
Forward-Looking StatementsStatements in this presentation that are not historical facts are forward-looking statements, within the meaning of the Private Securities Litigation Reform Act of1995 and involve risks and/or uncertainties, including those described in the Company's public filings with the Securities and Exchange Commission. The Companyhas based forward-looking statements on management’s current expectations and assumptions and not on historical facts. Examples of these statements include,but are not limited to, the Company’s expectations regarding future results (including RevPAR and other guidance), the payment of any future cash dividends on theCompany’s common stock and dividends and distributions we expect to receive from MGM China, The MGM Growth Properties Operating Partnership orCityCenter, its ability to generate future cash flow growth and to execute on future development and other projects, amounts the Company expects to spend capitalexpenditures, and the Company’s ability to execute its strategic initiatives, improve its financial flexibility (including its balance sheet) and continue to execute onoperational improvements. These forward-looking statements involve a number of risks and uncertainties. Among the important factors that could cause actualresults to differ materially from those indicated in such forward-looking statements include effects of economic conditions and market conditions in the markets inwhich the Company operates and competition with other destination travel locations throughout the United States and the world, the design, timing and costs ofexpansion projects, risks relating to international operations, permits, licenses, financings, approvals and other contingencies in connection with growth in new orexisting jurisdictions and additional risks and uncertainties described in the Company’s Form 10-K, Form 10-Q and Form 8-K reports (including all amendments tothose reports). In providing forward-looking statements, the Company is not undertaking any duty or obligation to update these statements publicly as a result ofnew information, future events or otherwise, except as required by law. If the Company updates one or more forward-looking statements, no inference should bedrawn that it will make additional updates with respect to those other forward-looking statements.
Market and Industry DataThis presentation also contains estimates and information concerning the Company’s industry and peers, including market position and fair share information, thatare based on industry publications, reports and peer company public filings. This information involves a number of assumptions and limitations, and you arecautioned not to rely on or give undue weight to this information. The Company has not independently verified the accuracy or completeness of the data containedin these industry publications, reports or filings. The industry in which we operate is subject to a high degree of uncertainty and risk due to variety of factors,including those described in the “Risk Factors” section of the Company’s public filings with the SEC.
Note Regarding Presentation of Non-GAAP Financial MeasuresThe following presentation includes certain “non-GAAP financial measures” as defined in Regulation G under the Securities Exchange Act of 1934, as amended.Schedules that reconcile the non-GAAP financial measures to the most directly comparable financial measures calculated and presented in accordance withGenerally Accepted Accounting Principles in the United States are included in our earnings releases that have been furnished with the SEC and are available onour website at www.mgmresorts.com.

Company Overview
2
✓ Extensively vetted and globally diversified across all high-quality gaming jurisdictions
✓ Operates some of the best known international luxury properties in the gaming and lodging industry including Bellagio, MGM Grand Las Vegas, ARIA Resort & Casino, Mandalay Bay, Borgata, MGM National Harbor and MGM Macau
✓ Experienced management team and Board of Directors with extensive industry background
✓ Dominant leader in food & beverage and conventions & corporate meetings
▪ Over 400 owned & leased outlets
▪ Over 3 million square feet of convention space
▪ World-class entertainment featuring a wide array of venues & shows
▪ 21 live entertainment venues, including T-Mobile Arena and Cirque du Soleil
✓ Embarking on new growth opportunities worldwide
▪ MGM Springfield
▪ MGM Cotai
▪ MGM Hospitality
✓ Fortune 500 company with 77,000 employees and ~$30bn enterprise value
✓ Consolidated Net Revenue1 of $9.5bn and Adjusted EBITDA1 of $2.8bn
Leading Global Gaming & Hospitality Company with Highly Valuable Portfolio
1 As of 12/31/16

MGM Resorts Organization Structure
3
MGM Resorts(Stock Exchange: NYSE / Ticker: MGM)
Owned & Leased Resorts & Other
(100%)
MGM China Holdings Limited
(56%)
CityCenter Holdings
(50%)
Las Vegas Arena Company(42.5%)
Diaoyutai MGM Hospitality
(49%)
Public Shareholders
MGM Growth Properties REIT
(76%)
OwnedBellagio, MGM Grand LV, Circus Circus LV, MGM National Harbor, Shadow Creek, Fallen Oak
Leased1
Mandalay Bay, Mirage, Luxor, Excalibur, New York-New York, Monte Carlo, The Park, MGM Grand Detroit, Beau Rivage, Gold Strike Tunica, Borgata
DevelopmentMGM Springfield (Opening Late 2018)
Publicly Traded REIT(1)
Stock Exchange: NYSETicker: MGP
Stock Exchange: HKSETicker: 2282 HK
Properties:MGM Macau
DevelopmentMGM Cotai (Opening 2H 2017)
Properties:ARIAVdaraMandarin Oriental
Properties:T-Mobile ArenaMGM Grand Garden (Lease)
Elgin Riverboat Resort(50%)
1 MGM Growth Properties owns the properties leased by MGM Resorts International
Properties:MGM Grand SanyaDiaoyutai Hotel HangzhouDiaoyutai Hotel Chengdu
DevelopmentBellagio Shanghai (Opening 2017)
Properties:Grand Victoria

4
Strategic Highlights

Looking Back – A Transformative 3 Years
5
MGM has come a long way since 2014
➢ Significantly improved MGM’s balance sheet▪ MGP transaction resulted in ~$4bn reduction of debt▪ Sale of Crystals for $1.1bn provided MGM with $540mm dividend from CityCenter▪ Converted $1.45bn of convertible notes to equity▪ Continued MGM China dividends through construction of MGM Cotai▪ Initiated CityCenter dividends▪ Multiple Rating Agency upgrades
➢ Operational initiatives▪ Strategic investment in personnel ▪ Expanded market share through innovative product and media initiatives▪ Profit Growth Plan – initiated program, upsized target, achieved goals ahead of schedule▪ Opened MGM National Harbor, T-Mobile Arena and Park Theater▪ Completed Mandalay Bay Convention Center expansion
➢ Strategic initiatives▪ MGP transaction▪ Borgata acquisition with simultaneous sale of real estate to MGP▪ Sale of non-core assets (Crystals, Circus Circus Reno, Railroad Pass & Gold Strike Jean)▪ Increased ownership in MGM China from 51% to 56%
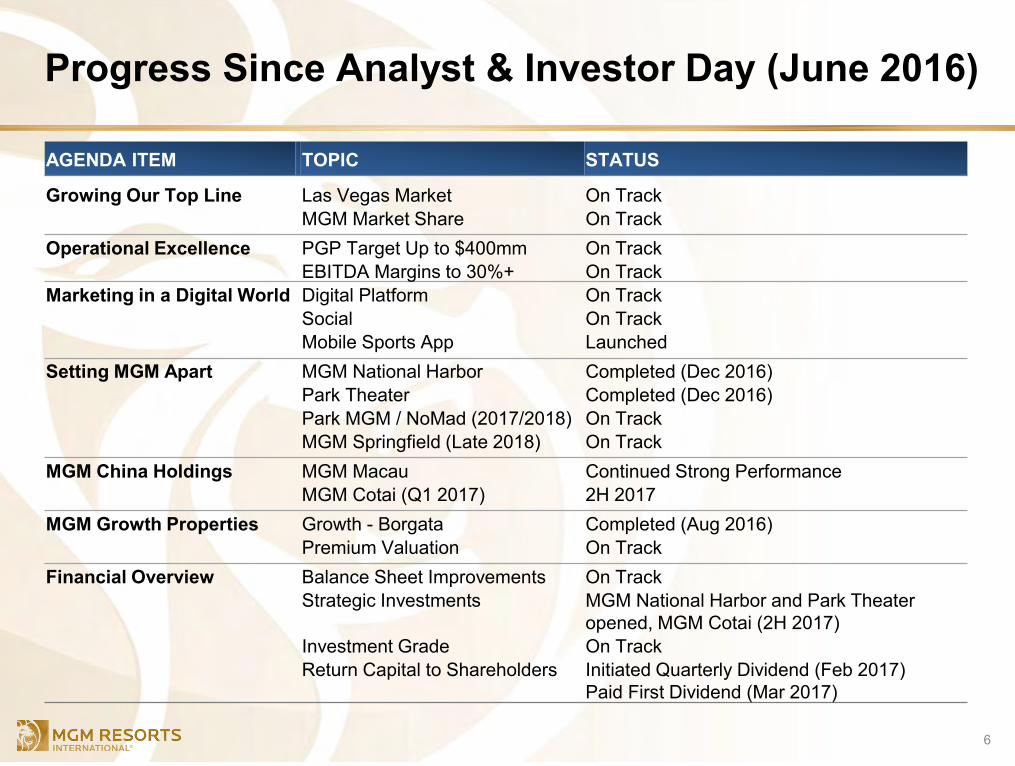
Progress Since Analyst & Investor Day (June 2016)
6
AGENDA ITEM TOPIC STATUS
Growing Our Top Line Las Vegas Market On TrackMGM Market Share On Track
Operational Excellence PGP Target Up to $400mm On TrackEBITDA Margins to 30%+ On Track
Marketing in a Digital World Digital Platform On TrackSocial On TrackMobile Sports App Launched
Setting MGM Apart MGM National Harbor Completed (Dec 2016)Park Theater Completed (Dec 2016)Park MGM / NoMad (2017/2018) On TrackMGM Springfield (Late 2018) On Track
MGM China Holdings MGM Macau Continued Strong PerformanceMGM Cotai (Q1 2017) 2H 2017
MGM Growth Properties Growth - Borgata Completed (Aug 2016)Premium Valuation On Track
Financial Overview Balance Sheet Improvements On TrackStrategic Investments MGM National Harbor and Park Theater
opened, MGM Cotai (2H 2017)Investment Grade On TrackReturn Capital to Shareholders Initiated Quarterly Dividend (Feb 2017)
Paid First Dividend (Mar 2017)

MGM Ongoing Initiatives
7
➢ Continued Operational Improvements▪ Focused on growing topline results and continued margin improvement
▪ Las Vegas Strip:▪ 1QE 2017 RevPAR growth of 7%▪ Achieved 30% margin in 2016▪ Strategies in place to grow 2017 margin 50-100bps
▪ Transition from Profit Growth Plan to Continuous Improvement▪ Disciplined and targeted reinvestment in existing properties
▪ Park MGM/ NoMad▪ Convention center expansions (Aria, MGM Grand, Bellagio)
➢ Further improvement of Balance Sheet▪ Accelerating free cash flow story – current development pipeline winding down ▪ Utilize excess free cash flow to pay down debt and return capital to shareholders▪ Obtain investment grade status
➢ Strategic Initiatives▪ Potential sale of National Harbor real estate to MGP▪ MGM Cotai in 2nd half of 2017▪ MGM Springfield in late 2018▪ Maximizing future dividends from Joint Ventures▪ Continue to utilize MGP as a platform for growth▪ Selectively pursue new jurisdiction opportunities (Japan)

Driving Increased Shareholder Value
8
✓ Leading global integrated resort company
✓ Large scale portfolio with best-in-class brands
✓ Premier operator in the industry
✓ Strong “One Company” culture with focus on continuous improvement
✓ Near term accretive growth opportunities
✓ Enhanced financial position provides visible path to investment grade
✓ Free cash flow profile positions MGM to continue to return capital to its shareholders

9
Operating Highlights

10
MGM Is Well Diversified
54%
19%
27%
Macau
U.S. Regionals
1 Excludes Management & Other Operations and Other Nevada2 Includes 12/31/16 reported Net Revenue plus an annualization adjustment for Borgata and MGM National Harbor for the year ended December 31, 2016
Pro forma FY 2016 2
Las Vegas
62%26%
12%
Macau
U.S. Regionals
FY 2015
Las Vegas
Net Revenue Mix1

44%
27%
15%
7%7%
11
MGM Is Well Positioned In Las Vegas
Source: Company filings(1) Includes 100% of CityCenter(2) Excludes Las Vegas Convention Center(3) As of May 2016
NO. OF ROOMS
49%
25%
12%
9%6%
NO. OF TABLES + SLOTS
CONVENTION SPACE(2)
2016 Las Vegas Strip
48%
12%4%
32%
4%
44%
ARENA, THEATER & SHOWROOM(3)
MGM1MGM1
MGM1 MGM1
10%
5% 5% 5%
3%
5%
6%
8%
6%
5%
7%
3%
14%
6%6%
7%
1%
6%
8%
12%
8%
3%
11%
3%
0%
2%
4%
6%
8%
10%
12%
14%
16%
1Q14 2Q14 3Q14 4Q14 1Q15 2Q15 3Q15 4Q15 1Q16 2Q16 3Q16 4Q16
Guidance RevPAR growth Reported RevPAR growth
6%
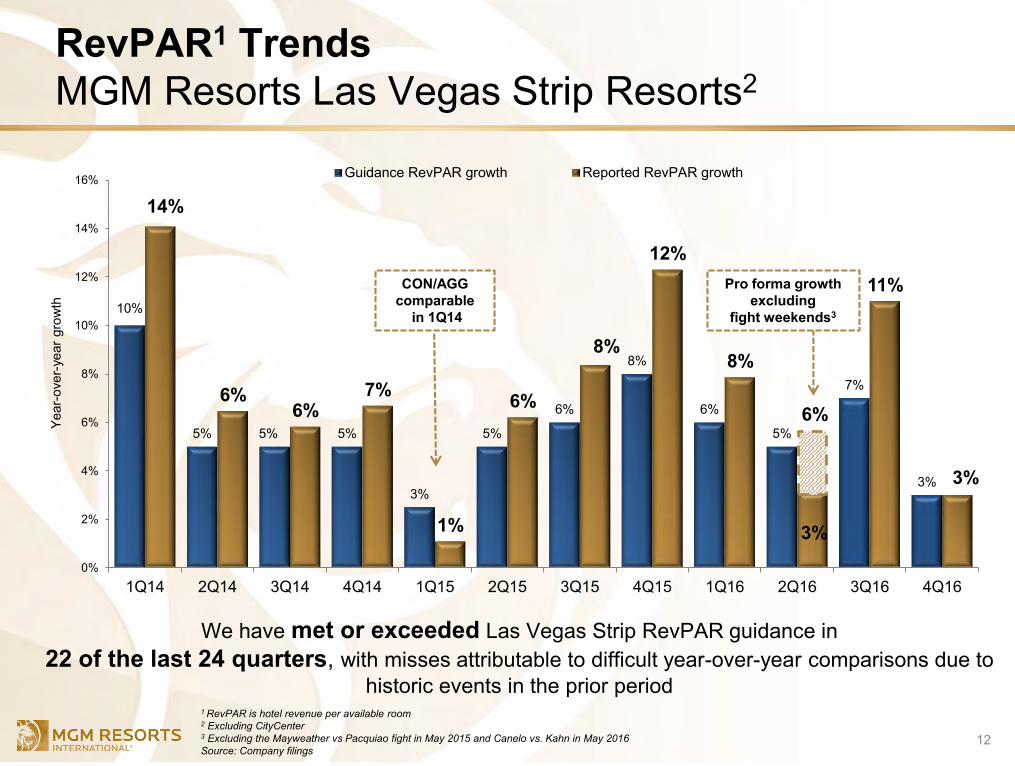
We have met or exceeded Las Vegas Strip RevPAR guidance in 22 of the last 24 quarters, with misses attributable to difficult year-over-year comparisons due to
historic events in the prior period
12
CON/AGGcomparable
in 1Q14
Year
-ove
r-ye
ar g
row
th
1 RevPAR is hotel revenue per available room2 Excluding CityCenter3 Excluding the Mayweather vs Pacquiao fight in May 2015 and Canelo vs. Kahn in May 2016Source: Company filings
Pro forma growth excluding
fight weekends3
RevPAR1 TrendsMGM Resorts Las Vegas Strip Resorts2

13
MGM Has Meaningfully Improved Margins
1 Excludes Borgata which was acquired on August 1, 2016, MGM National Harbor which opened December 8, 2016, and Other Nevada Resorts (Circus Circus Reno, Railroad Pass and Gold Strike Jean) which were sold in 20152 Excludes CityCenter resort operations
Las Vegas Wholly Owned Margin2Same Store Domestic Margin1
24%
26%
30%
22%
23%
24%
25%
26%
27%
28%
29%
30%
31%
32%
2014 2015 2016
24%
26%
30%
22%
23%
24%
25%
26%
27%
28%
29%
30%
31%
32%
2014 2015 2016

MGM Resorts Outperforms CompetitorsBellagio Leads In Luxury Segment
29.6%
32.0%29.3%
35.8%
Wynn/ Encore Bellagio Wynn/ Encore Bellagio
2015 2016
Source: Company filings1 Adjusted Property EBITDA margin is Adjusted Property EBITDA stated as a percentage of net revenue
14
Adjusted Property EBITDA Margin1

MGM Resorts Outperforms CompetitorsMandalay Bay Leads In Convention Segment
15
Adjusted Property EBITDA Margin1
20.3%
22.5% 23.1%
25.2%
Venetian/ Palazzo Mandalay Bay Venetian/ Palazzo Mandalay Bay
2015 2016
Source: Company filings1 Adjusted Property EBITDA margin is Adjusted Property EBITDA stated as a percentage of net revenue

16
Return On Invested CapitalCase Studies

Successful Track Record Of Return On Invested Capital
17
➢ CityCenter▪ MGM invested ~$2.2bn in CityCenter
o $1.1bn monetization of Crystals at extremely attractive cap rate (~4%)− Provided opportunity to repay $260mm in debt & reduced leverage to < 4x
o MGM’s dividends to date: $865mm1
▪ Resulting in MGM’s Net investment in CityCenter of ~$1.38bn1 today
➢ MGM China▪ MGM initial investment in MGM China was $341mm prior to its recent 4.95% purchase
o Distributions and dividends to date of $1.4bn are approximately 4x above initial investment
o MGM’s current ownership of 56% equals $4.3bn2 of value
➢ MGM Detroit▪ MGM invested $800mm
o Stabilized Adjusted Property EBITDA of ~$160mm3
➢ T-Mobile Arena▪ MGM invested ~$73mm and owns 42.5% of the $375mm venue
o Top 3 grossing arena in its category in 2016 (only 9 months of operations)o Benefits nearby MGM properties and several ancillary revenue streams
1 Includes announced dividend of $250 million on March 24, 2017 (of which $125 million represents MGM Resorts’ 50% share)2 Assumes HKD / USD exchange rate of 7.75 based on closing price of $15.70 on 3/24/173 Reflects trailing two year average

CityCenter Case StudyReturn on Invested Capital
18
MGM’s investment in CityCenter is far below investor perception
➢ In 2007, MGM de-risked investment by selling 50% of CityCenter
➢ MGM invested ~$2.2bn in CityCenter▪ $1.1bn monetization of Crystals at extremely attractive cap rate (~4%)
o Provided opportunity to repay $260mm in debto Reduced leverage to < 4x
▪ MGM’s dividends to date: $865mm1
➢ Resulting in MGM’s net investment in CityCenter of ~$1.38bn1
➢ Today, CityCenter is well capitalized, generating strong returns and positioned to continue returning capital to MGM in excess of cumulative earnings
1 Includes announced dividend of $250 million on March 24, 2017 (of which $125 million represents MGM Resorts’ 50% share)

Is CityCenter Misvalued?
19
1 While the Company is referencing publicly available reports prepared by securities analysts, the Company is not endorsing or adopting the views or analysis of, or methodologies employed by, those analysts with respect to whether the valuation multiples utilized by those securities analysts is either the correct methodology or the correct multiple; rather, the Company is solely noting that if such analyst multiples were applied to 50% of CityCenter’s Adjusted EBITDA instead of CityCenter’s Income from Unconsolidated Affiliates2 CityCenter Income From Unconsolidated Affiliates is as of 12/31/16 of $446 million less gain from the Crystals sale of $401 million plus Nevada Energy Expense of $41 million3 Assumes 574 million shares outstanding
➢ Aria is consistently one of the top 3 performing resorts within the MGM portfolio
➢ MGM Resorts accounts for CityCenter under the equity method of accounting as per GAAP. The result of which is Income from Unconsolidated Affiliates which represents our 50% share of operating income of CityCenter and adjusted for certain basis differences
➢ This is not a true reflection of CityCenter’s value to MGM Resorts
2016 Valuation
50% of CityCenter Adjusted EBITDA $175 x 11 = $1,925
Reported CityCenter Income From Unconsolidated Affiliates $86 x 11 = $941
Value Variance $983Value Variance per share $1.71
IllustrativeMultiple1
2
3
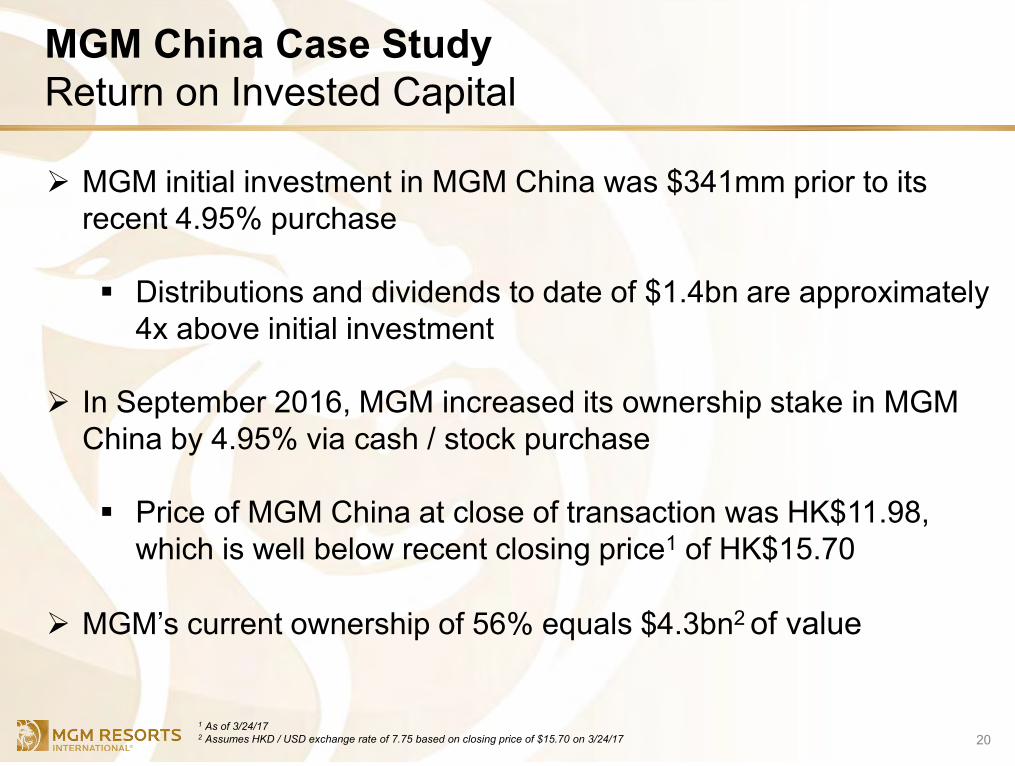
MGM China Case StudyReturn on Invested Capital
20
➢ MGM initial investment in MGM China was $341mm prior to its recent 4.95% purchase
▪ Distributions and dividends to date of $1.4bn are approximately 4x above initial investment
➢ In September 2016, MGM increased its ownership stake in MGM China by 4.95% via cash / stock purchase
▪ Price of MGM China at close of transaction was HK$11.98, which is well below recent closing price1 of HK$15.70
➢ MGM’s current ownership of 56% equals $4.3bn2 of value
1 As of 3/24/172 Assumes HKD / USD exchange rate of 7.75 based on closing price of $15.70 on 3/24/17

MGM Grand Detroit Case StudyReturn on Invested Capital
21
➢ Total spend on current MGM Detroit permanent facility of $800mm
➢ MGM Detroit is generating stabilized Adjusted Property EBITDA of ~$160mm (reflects trailing two year average)
➢ Consistent market leader with > 40% market share

T-Mobile Arena Case StudyReturn on Invested Capital
22
➢ Developed brand new best-in-class $375 million entertainment venue
➢ MGM owns 42.5% in the T-Mobile Arena with a net investment of ~$73 million
➢ Benefits several neighboring MGM Resorts properties and offers incremental ancillary revenue streams to Casino, Hotel, F&B, Retail, Entertainment & Other
➢ Hosting first Las Vegas NHL team beginning 2017, which secures over 40 event dates excluding concerts, boxing and other events
➢ Top 3 grossing arena in its category in 2016 (only 9 months of operations)

23
Leverage & Trading Comparables

24
Historical Consolidated Leverage
2012 2016
Total Cash $1,544 $1,447
LTM Adjusted EBITDA related to:Domestic Resorts $1,325 $2,340Management and other operations 10 13MGM China 679 521Corporate expense (excluding stock-based compensation) (216) (284)
$1,799 $2,590Recurring dividends received by MGM Resorts 22 59
$1,821 $2,649
Total Principal Amount of Debt related to:MGM Resorts Consolidated $13,598 $13,144
$13,598 $13,144
Consolidated Net Leverage Ratio 6.6x 4.4x
1 12/31/2012 includes $952 million at MGM China; 12/31/16 includes $454 million and $360 million at MGM China and MGM Growth Properties, respectively2 Includes 12/31/16 reported Adjusted Property EBITDA plus an annualization adjustment for Borgata and MGM National Harbor for the year ended December 31, 20163 Represents ordinary dividends (excluding special dividends) and other regular cash distributions actually received by MGM from CityCenter and Grand Victoria.4 12/31/12 includes $554 million at MGM China; 12/31/16 includes $1.9 billion, $3.7 billion, and $450 million at MGM China, MGM Growth Properties, and MGM National Harbor, respectively
1
2
3
4

2016 Credit Profile Peer ComparisonMGM vs. Select Gaming Companies
25
Net Leverage1
2.0x
4.4x4.9x
5.8x
6.7x
0.0x
1.0x
2.0x
3.0x
4.0x
5.0x
6.0x
7.0x
8.0x
LVS MGM Red Rock Boyd Wynn
Source: Company filings1 Consolidated net leverage represents total indebtedness less cash and cash equivalents divided by Adjusted EBITDA.

26
Capital Initiative Projects

Source: Company filings; Maryland Gaming commissionNote: Financial performance statistics combine Jan & Feb 2017 based on Maryland Gaming Commission and West Virginia Lottery reports1 Fair share is based on total table game and slot units for the D.C. Metro peer / competitive set2 Win per position per day; assumes 7 seats per table3 D.C. Metro peer / competitive set includes MGM National Harbor, Maryland Live, Horseshoe Baltimore, Hollywood Perryville, Ocean Downs, Rocky Gap and Hollywood Chares Town. MGM National Harbor of $336 vs peer / competitive set total WPPD weighted by total gross gaming revenue YTD as of Feb 20174 As of 12/31/20165 Includes 39 poker tables
Cost: $1.4 billion Location: On the Potomac River just
outside of Washington D.C. Casino: 3,241 slots and 126 tables5
Hotel: 308 rooms Meeting & Event Space: 50,000 sq. ft.
Property Highlights4
Retail and dining: 93,100 sq. ft. Theater: 3,000 seat Luxury spa and roof-top pool Positioned to be one of the highest
grossing facilities in the country
27
MGM National HarborOpened December 8, 2016
Financial Performance Average market share of ~30% vs. fair share1 of 23% Achieved the highest table games revenue on record in January and February of 2017 for Maryland gaming Year-to-date February 2017 total WPPD2 of $336, $40 higher than its peers3
Property is averaging over 22,000 daily visitors

28
MGM National HarborProperty Highlights

✓ Celebrated the grand opening of the 5,200-seat theater with inaugural performances by legendary singer-songwriter Stevie Nicks and renowned rock group The Pretenders
✓ The Park Theater will play a key role in MGM’s strategy to further evolve the entertainment landscape in Las Vegas, featuring unparalleled audio and visual technology and providing intimate exposure to some of the most celebrated artists
29
✓ The stage is set for award winning entertainers in 2017
❖ Bruno Mars, a 17-time GRAMMY® Award nominee will take the stage in March and September
❖ Multiple GRAMMY® Award-winning artist, Ricky Martin will begin his Las Vegas residency in April
❖ The Oscar, Emmy, and GRAMMY® Award-winning Goddess of Pop, Cher will perform in February and May
Park Theater at Monte CarloOpened December 17, 2016

30
Park Theater at Monte Carlo

31
Park Theater at Monte Carlo

Park MGM / The NoMad Las Vegas
Cost: ~$500 million Opening Date: Late 2018 Location: Las Vegas Strip, between New York- New York, T-Mobile Arena and CityCenter Hotel:
Park MGM: 2,700 room luxury resort conceptualized by MGM and Sydell Group conceived to target a younger, well-traveled demographic seeking unique experiences and innovative design.
NoMad Las Vegas: 292 guestrooms and suites with a dedicated drop-off lobby, swimming pool and NoMad branded gaming, eating and drinking experiences.
Project Highlights
Park MGM
Las Vegas Boulevard
NoMad Las Vegas
Park Theater
Trop
icana A
venu
eMarket at Park MGM
Interstate 15
32

Planned Casino Projects
1 Excludes capitalized interest and land related costs 2 Includes poker tables
MGM Springfield
Cost: ~$865 million(1)
Opening Date: Late 2018 Location: 14 acres in downtown Springfield, MA Casino: 3,000 slots and 100 tables(2)
Project Highlights: Hotel: 250 rooms Retail and dining: 100,000 sq. .ft. Parking garage: 3,375 spaces Meeting & Event Space: 44,000 sq. ft.
Everett Wynn
Plainridge Park
Twin River
Newport Grand
FoxwoodsMohegan Sun
Other Casino Properties
50 mi – Population 3.3 million
25 mi – Population 1.2 million
33

34
MGM SpringfieldConstruction – Aerial View

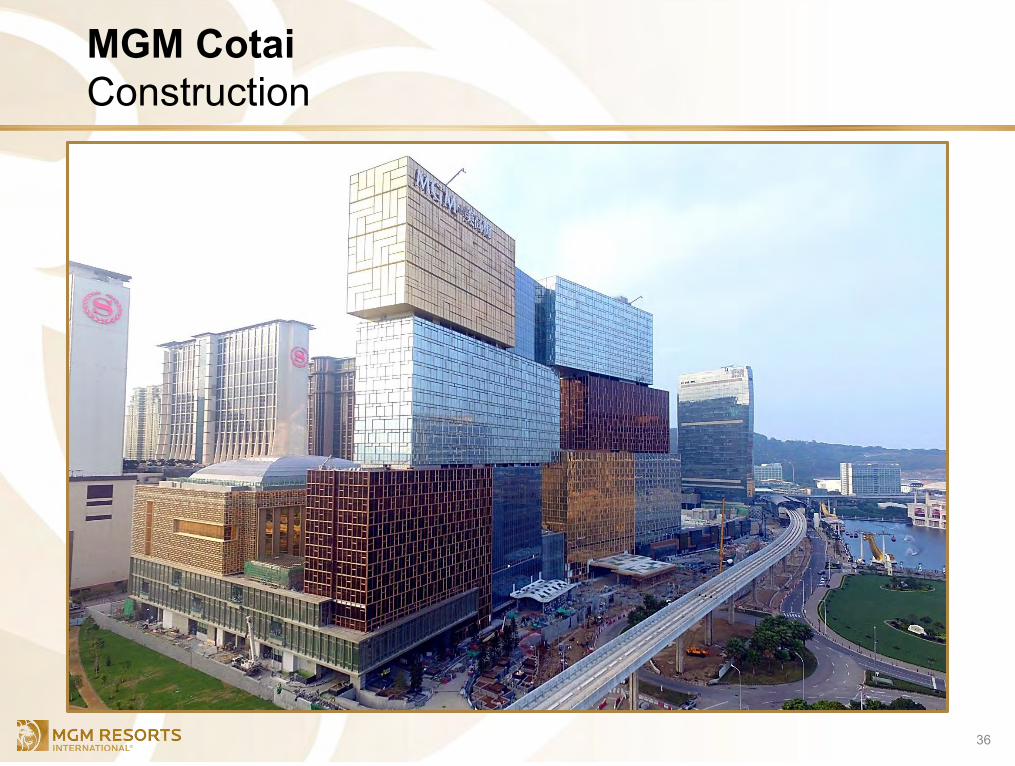
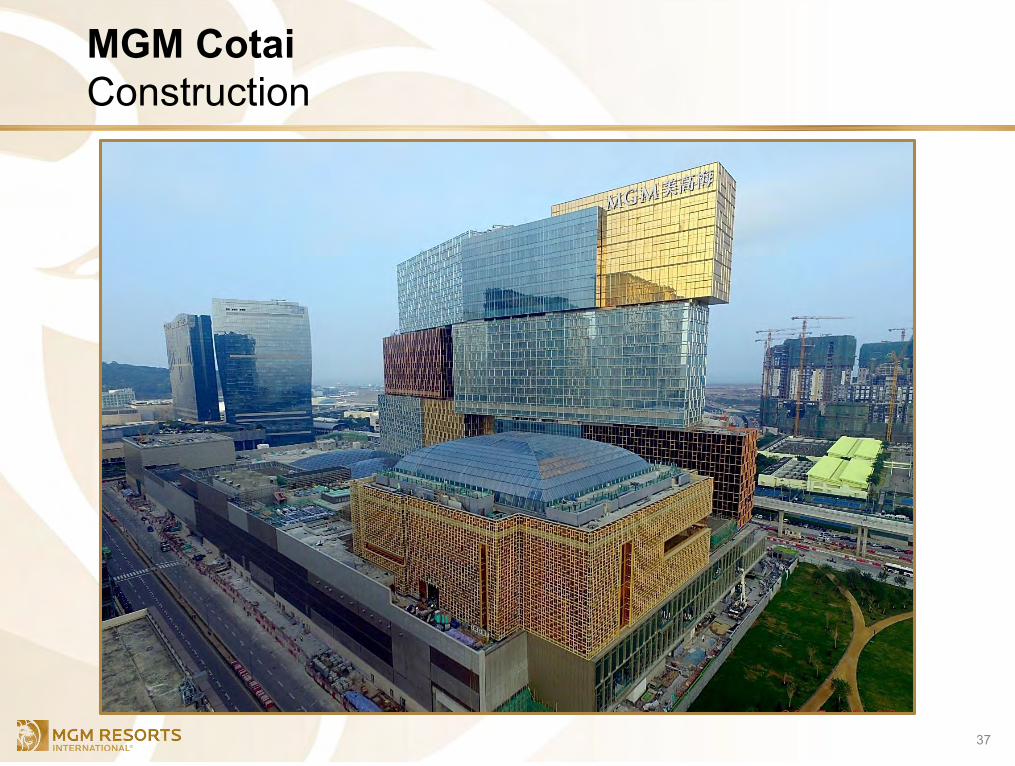
Cost: $3.3 billion Opening Date: 2nd Half of 2017 Location: 18 acre site on the Cotai Strip in Macau Casino: capacity for up to 500 gaming tables and 1,500 slots Hotel: 1,500 rooms Other amenities: meeting space, high end spa, retail offerings, F&B outlets, a transformable theater, and the
Spectacle as well as the first international MGM Mansion villa product for the ultimate luxury experience.
Project Highlights
MGM Cotai
35
36
MGM CotaiConstruction
37
MGM CotaiConstruction

38
Appendix
Total Shareholder Return Performance
Strategic Highlights – Detail

MGM Highlights – 2014 & 2015
39
2014➢ Re-priced CityCenter's TLB generating annual savings of $12mm➢ MGM issued $1.25bn of 6% Senior Notes due 2023➢ MGM repaid $509mm of 5.875% senior notes➢ MGM China paid $499mm special dividend in March, $127mm final dividend in June and $137mm
interim dividend in September
2015➢ Converted $1.45bn convertible notes to equity➢ Closed on sale of Railroad Pass & Gold Strike Jean for net proceeds of $20mm➢ Announced implementation of Profit Growth Plan with initial target of $300mm➢ Closed on sale of Circus Circus Reno for net proceeds of $72mm➢ MGM Resort’s $200mm share of the first ever $400mm special distribution from CityCenter➢ Repayment of the $875mm senior notes ➢ Amend and extend of MGM China's Senior Credit Facility with +$1B upsize➢ MGM China paid $400mm special dividend in March, $120mm final dividend in June and $76mm
interim dividend in August

MGM Highlights – 2016
40
➢ Profit Growth Plan – Continued successful execution with 2017 target increased from $300mm to $400mm
➢ MGP Formation & IPO▪ $1.2bn of proceeds was third largest US IPO of 2016▪ Priced at the high-end of the range▪ 14x multiple represented a premium valuation to closest comp▪ Strong after-market performance with MGP equity currently trading ~16% above issuance
➢ Significant MGM balance sheet improvement▪ Consolidated net leverage below 4.5x
o Lowest levels since pre-recession despite funding over $3bn in construction in progress
▪ MGP transaction resulted in two-notch upgrade from Moody’s and Fitch and a one-notch upgrade from S&P
▪ MGM raised $500mm of 10 year bonds at 4.625% - lowest long-term bond yield in MGM's history
▪ Overall reduction of ~$4bn of debt➢ Crystals Sale for $1.1bn represents cap rate of ~4.2%➢ Acquired BYD's 50% interest in Borgata at $1.8bn valuation (100%) & sold underlying real
estate to MGP for $1.175bn▪ Implied multiple of 8.9x at signing (8.5x at announce)

MGM Highlights – 2016 (Continued)
41
➢ MGM acquired 4.95% of MGM China from Pansy Ho for 7.1mm MGM shares, $100mm cash & $50mm deferred cash payment
➢ Entered into MGM National Harbor $525mm credit facility to complete construction➢ MGP raised $500 million of 10 year bonds at 4.50% - lowest coupon in company's history➢ Re-priced MGP's TLB generating annual savings of $13.5mm upon Moody's upgrade➢ CityCenter Dividends - $540mm received in 2016 by MGM as a result of Crystals transaction➢ MGM China paid $46mm final dividend in June and $58mm interim dividend in August➢ Announced $450mm Monte Carlo rebrand initiative (with expected completion in 2018)➢ Completed $70mm Mandalay Bay Convention expansion➢ Successfully opened the T-Mobile Arena / MGM National Harbor / Park Theater

42
Appendix
Total Shareholder Return Performance
Strategic Highlights – Detail

Total Shareholder Returns
43
MGM has generally outperformed industry peers on a 1,3, and 5 year basis
Source: BloombergNote: Trailing total stock performance as of 3/24/171 Returns include dividends; 3-Year and 5-Year represents the compounded annual growth rate
Annualized Returns1
1-Year 3-Year 5-Year
MGM Resorts International 25.8% 0.3% 12.2%Las Vegas Sands 12.0% -6.5% 4.0%Wynn Resorts 22.3% -17.9% 1.3%
S&P 500 Index 17.6% 10.2% 13.0%

1-Year Performance
44
1-Year Performance
25.8%
12.0%
22.3%17.6%
-30%
-20%
-10%
0%
10%
20%
30%
40%
50%
Mar
-16
Apr
-16
May
-16
Jun-
16
Jul-1
6
Aug
-16
Sep
-16
Oct
-16
Nov
-16
Dec
-16
Jan-
17
Feb-
17
Mar
-17
MGM LVS WYNN S&P 500 Index
Stock Price Stock Price 1 Year
Company 3/24/2016 3/24/2017 Return(1)
MGM Resorts International $20.52 $25.71 25.8%
Las Vegas Sands 52.47 55.62 12.0%
Wynn Resorts 93.47 111.92 22.3%
S&P 500 Index 2,036 2,344 17.6%
Source: BloombergNote: Trailing total stock performance as of 3/24/171 Returns include dividends

3-Year Performance
45
3-Year Performance
0.8%-18.4%
-44.7%
33.8%
-100%
-80%
-60%
-40%
-20%
0%
20%
40%
60%
Mar
-14
Jun-
14
Sep
-14
Dec
-14
Mar
-15
Jun-
15
Sep
-15
Dec
-15
Mar
-16
Jun-
16
Sep
-16
Dec
-16
MGM LVS WYNN S&P 500 Index
Stock Price Stock Price 3 Year Return(1)
Company 3/25/2014 3/24/2017 Cumulative CAGR
MGM Resorts International 25.61 $25.71 0.8% 0.3%
Las Vegas Sands 78.80 55.62 -18.4% -6.5%
Wynn Resorts 219.50 111.92 -44.7% -17.9%
S&P 500 Index 1,866 2,344 33.8% 10.2%
Source: BloombergNote: Trailing total stock performance as of 3/24/171 Returns include dividends
5-Year Performance
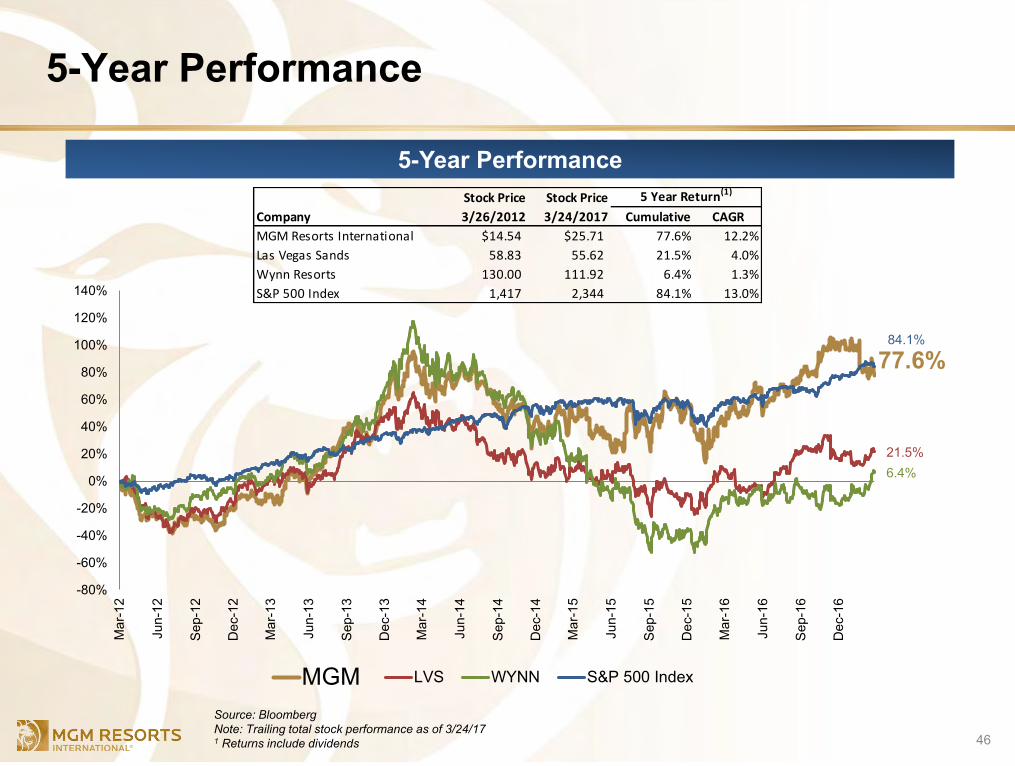
46
5-Year Performance
77.6%
21.5%6.4%
84.1%
-80%
-60%
-40%
-20%
0%
20%
40%
60%
80%
100%
120%
140%
Mar
-12
Jun-
12
Sep
-12
Dec
-12
Mar
-13
Jun-
13
Sep
-13
Dec
-13
Mar
-14
Jun-
14
Sep
-14
Dec
-14
Mar
-15
Jun-
15
Sep
-15
Dec
-15
Mar
-16
Jun-
16
Sep
-16
Dec
-16
MGM LVS WYNN S&P 500 Index
Source: BloombergNote: Trailing total stock performance as of 3/24/171 Returns include dividends
Stock Price Stock Price 5 Year Return(1)
Company 3/26/2012 3/24/2017 Cumulative CAGR
MGM Resorts International $14.54 $25.71 77.6% 12.2%
Las Vegas Sands 58.83 55.62 21.5% 4.0%
Wynn Resorts 130.00 111.92 6.4% 1.3%
S&P 500 Index 1,417 2,344 84.1% 13.0%