the asian real estate market 2015 - nri.com
TRANSCRIPT

The Asian Real Estate Market 2015Viewpoints from Japan, China, Korea, Taiwan, Singapore and India
August 2015
Nomura Research Institute
Marunouchi Kitaguchi Bldg. 1-6-5 Marunouchi, Chiyoda-ku, Tokyo 100-0005, Japan
To create a transparent real estate market in AsiaTo create a transparent real estate market in Asia,to enhance business activities among real estate firms.
This report has been produced by Nomura Research Institute solely for information purposes. It is not intended to be a complete description of the markets or developments to which it refers. No warranty for representation, express or implied ismade as to the accuracy or completeness of any of the information herein and Nomura Research Institute shall not be liable to any reader of this report or any third party in any way whatsoever
Copyright(C) Nomura Research Institute, Ltd. All rights reserved. 1
to any reader of this report or any third party in any way whatsoever.

Japan Japanese Real Estate Investment Market
China China’s market entering an adjustment period
Korea Increase of liquidity within slow economic growthq y g
Taiwan Overview of Office, Residential and Hotel Markets
Singapore Domestic real estate market reaching its peak
India Real Estate Market in India – Residential, Office, etc.
Copyright(C) Nomura Research Institute, Ltd. All rights reserved. 2

Japan Japanese Real Estate Investment Market
China China’s market entering an adjustment period
Korea Increase of liquidity within slow economic growthq y g
Taiwan Overview of Office, Residential and Hotel Markets
Singapore Domestic real estate market reaching its peak
India Real Estate Market in India – Residential, Office, etc.
Copyright(C) Nomura Research Institute, Ltd. All rights reserved. 3
Japan Japanese Real Estate Investment Market
1 Population Movements in Japan
2 Macro Fundamentals of Japan2 Macro Fundamentals of Japan
3 Overview of Real Estate Investment Market in Japan
4 Office Market
5 Residential Market
6 Retail Property Market
7 Logistics Property Market
8 Real Estate Investment Products
Copyright(C) Nomura Research Institute, Ltd. All rights reserved. 4

Population Movements in Japan
Japan’s population is aging and shrinking due to a low birth rate
Total population peaked out in 2005 The number of households is increasing for now but it is projected to decrease after 2019
Japan s population is aging and shrinking due to a low birth rate.The number of households will also be decreasing soon.
Total population peaked out in 2005. The number of households is increasing for now, but it is projected to decrease after 2019. The population of 65 years or older is expected to level off in 2025 and head downwards in 2040.
Population and Households in Japan
Forecast →←Actual60,000
120 000
140,000
Households(thousand)
Population(thousand)
40,000
50,000
80 000
100,000
120,000
0‐14
20,000
30,000
40,000
60,000
80,000 15‐64
65+
Household
0
10,000
0
20,000
0 5 0 5 0 5 0 5 0 5 0 5 0 5 0 5 0 5 0
Copyright(C) Nomura Research Institute, Ltd. All rights reserved. 5
Source: NRI based on National Institution of Population and Social Security Research
Note: Medium-fertility (medium-mortality) projection
1970
1975
1980
1985
1990
1995
2000
2005
2010
2015
2020
2025
2030
2035
2040
2045
2050
2055
2060

Population Movements in Tokyo
Population inflow into Tokyo is expected to continue
Population continues to increase in Greater Tokyo.
Population inflow into Tokyo is expected to continue.
Net Population Inflow into Greater Tokyo
200
250
Population(thousand)
100
150
KanagawaInflow
0
50
1980 1985 1990 1995 2000 2005 2010
Chiba
Saitama
Tokyo
‐100
‐50
1980 1985 1990 1995 2000 2005 2010
Outflow
Copyright(C) Nomura Research Institute, Ltd. All rights reserved. 6
‐150Source: NRI based on Basic Resident Register Population Migration Report

Population Movements in Tokyo
In the Tokyo metropolitan area total population and number of households are projected to peak out in 2015 and 2025 respectively
Population and households are projected to decrease in Tokyo in 5 to 10 years time.
In the Tokyo metropolitan area, total population and number of households are projected to peak out in 2015 and 2025, respectively.
Population in Greater Tokyo Households in Greater Tokyo
16,000
18,000
Households(thousand)
35 000
40,000
Population(thousand)
Forecast →←Actual Forecast →←Actual
10 000
12,000
14,000
,
Chiba
Saitama
Kanagawa25,000
30,000
35,000
Chiba
Saitama
K
6,000
8,000
10,000 Kanagawa
Tokyo
10 000
15,000
20,000Kanagawa
Tokyo
0
2,000
4,000
0
5,000
10,000
70 75 80 85 0 5 00 05 0 5 0 5 0 5 40
Copyright(C) Nomura Research Institute, Ltd. All rights reserved. 7
197
197
198
198
199
199
200
200
201
201
202
202
203
203
204
Source: NRI based on National Institution of Population and Social Security Research
Note: Medium-fertility (medium-mortality) projection

Population Movements in Tokyo
Households in Tokyo are expected to increase over the medium term owing to the strength
The number of single-person households is expected to peak out in 2030
Households in Tokyo are expected to increase over the medium term owing to the strength of one-person households.
The number of single-person households is expected to peak out in 2030.
Number of Households by Family Composition
7,000
Households(thousand)
Forecast →←Actual
4 000
5,000
6,000
One‐person
Couple‐only
C l d hild( )
2,000
3,000
4,000 Couple‐and‐child(ren)
One‐parent‐and‐child(ren)
Other
0
1,000
2,000
Copyright(C) Nomura Research Institute, Ltd. All rights reserved. 8
1995 2000 2005 2010 2015 2020 2025 2030 2035
Source: NRI based on National Institution of Population and Social Security Research
Note: Medium-fertility (medium-mortality) projection
Population Movements in Tokyo
Population in Tokyo is predicted to increase over the long term only in the three wards along
Population is expected to increase in the Chuo Koto and Minato wards
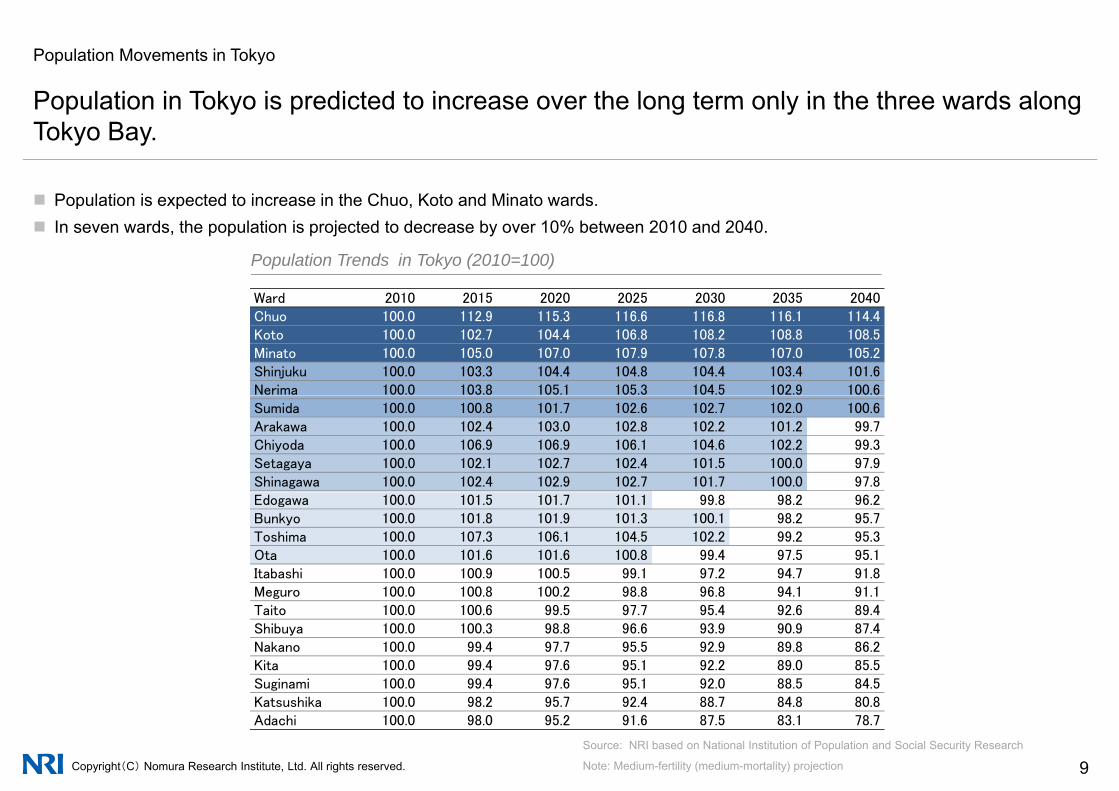
Population in Tokyo is predicted to increase over the long term only in the three wards along Tokyo Bay.
Population is expected to increase in the Chuo, Koto and Minato wards. In seven wards, the population is projected to decrease by over 10% between 2010 and 2040.
Ward 2010 2015 2020 2025 2030 2035 2040
Population Trends in Tokyo (2010=100)
Ward 2010 2015 2020 2025 2030 2035 2040Chuo 100.0 112.9 115.3 116.6 116.8 116.1 114.4Koto 100.0 102.7 104.4 106.8 108.2 108.8 108.5Minato 100.0 105.0 107.0 107.9 107.8 107.0 105.2Shinjuku 100.0 103.3 104.4 104.8 104.4 103.4 101.6Nerima 100.0 103.8 105.1 105.3 104.5 102.9 100.6Sumida 100.0 100.8 101.7 102.6 102.7 102.0 100.6Arakawa 100.0 102.4 103.0 102.8 102.2 101.2 99.7Chiyoda 100.0 106.9 106.9 106.1 104.6 102.2 99.3Setagaya 100.0 102.1 102.7 102.4 101.5 100.0 97.9Shinagawa 100.0 102.4 102.9 102.7 101.7 100.0 97.8Edogawa 100.0 101.5 101.7 101.1 99.8 98.2 96.2Bunkyo 100.0 101.8 101.9 101.3 100.1 98.2 95.7Toshima 100.0 107.3 106.1 104.5 102.2 99.2 95.3Ota 100.0 101.6 101.6 100.8 99.4 97.5 95.1Itabashi 100.0 100.9 100.5 99.1 97.2 94.7 91.8M 100 0 100 8 100 2 98 8 96 8 94 1 91 1Meguro 100.0 100.8 100.2 98.8 96.8 94.1 91.1Taito 100.0 100.6 99.5 97.7 95.4 92.6 89.4Shibuya 100.0 100.3 98.8 96.6 93.9 90.9 87.4Nakano 100.0 99.4 97.7 95.5 92.9 89.8 86.2Kita 100.0 99.4 97.6 95.1 92.2 89.0 85.5Suginami 100 0 99 4 97 6 95 1 92 0 88 5 84 5
Copyright(C) Nomura Research Institute, Ltd. All rights reserved. 9
Suginami 100.0 99.4 97.6 95.1 92.0 88.5 84.5Katsushika 100.0 98.2 95.7 92.4 88.7 84.8 80.8Adachi 100.0 98.0 95.2 91.6 87.5 83.1 78.7
Source: NRI based on National Institution of Population and Social Security Research
Note: Medium-fertility (medium-mortality) projection
Japan Japanese Real Estate Investment Market
1 Population Movements in Japan
2 Macro Fundamentals of Japan2 Macro Fundamentals of Japan
3 Overview of Real Estate Investment Market in Japan
4 Office Market
5 Residential Market
6 Retail Property Market
7 Logistics Property Market
8 Real Estate Investment Products
Copyright(C) Nomura Research Institute, Ltd. All rights reserved. 10

Macro Fundamentals of Japan
Japan’s economic growth is the lowest compared to other major economies with lowJapan s economic growth is the lowest compared to other major economies with low forecasts for future growth.
IMF forecasts estimate Japan’s GDP growth rate at 1% for the next 5 years IMF forecasts estimate Japan s GDP growth rate at 1% for the next 5 years.
(%)
Real GDP growth rate of major economies
Estimate →←Actual
10.0
15.0 (%)
←Actual Estimate→
ChinaIndia
KoreaUS
5.0
JapanUKUS
0.0
‐10.0
‐5.0
Copyright(C) Nomura Research Institute, Ltd. All rights reserved. 11Source: NRI based on IMF data (2014 Oct. and 2015 Update)
2003 2004 2005 2006 2007 2008 2009 2010 2011 2012 2013 2014 2015 2016 2017 2018 2019

Macro Fundamentals of Japan
Despite the weak growth, Japan remains one of the largest economies in the world.
Although Japan was overtaken by China and fell to the third place in world nominal GDP India Brazil and Russia will still remain behind
(Billi USD)
Although Japan was overtaken by China and fell to the third place in world nominal GDP, India, Brazil and Russia will still remain behind Japan by 2020, assuming current growth rates continue.
Nominal GDP of Major Countries
20 000
25,000 (Billion USD)
US
Forecast →←Actual
15,000
20,000 China
10,000
Japan
0
5,000 Japan
Copyright(C) Nomura Research Institute, Ltd. All rights reserved. 12
2003 2004 2005 2006 2007 2008 2009 2010 2011 2012 2013 2014 2015 2016 2017 2018 2019 2020
Source: NRI based on IMF (2014 Oct.)
Note: Figures up to 2019 are IMF forecasts and those up to 2020 are calculated with the assumption that the CAGR from 2014 to 2018 will be maintained.

Macro Fundamentals of Japan
Consumer price index became less active despite the rise in price due to the consumptionConsumer price index became less active, despite the rise in price due to the consumption tax increase.
With consumer sentiment depressed due to the consumption tax increase the growth of consumer price index began to slow down With consumer sentiment depressed due to the consumption tax increase, the growth of consumer price index began to slow down.
Y Y Ch i J ’ C P i I d ( l di f h f d )
4.0 (%)
Year-on-Year Change in Japan’s Consumer Price Index (excluding fresh foods)
2.0
3.0
Inflation targetset by BOJ
0.0
1.0
‐2.0
‐1.0
Copyright(C) Nomura Research Institute, Ltd. All rights reserved. 13
‐3.0
Source: NRI based on Japan Ministry of Internal Affairs data

Macro Fundamentals of Japan
Yen still continues to decline.
Large-scale monetary easing the “first arrow” of Abenomics has rapidly lowered the yen from the end of 2012 Large-scale monetary easing, the first arrow of Abenomics, has rapidly lowered the yen from the end of 2012.
(USDJPY=X)
USD-JPY exchange rate
120
130
100
110
90
70
80
Copyright(C) Nomura Research Institute, Ltd. All rights reserved. 14
Source: NRI based on Bloomberg data
Macro Fundamentals of Japan
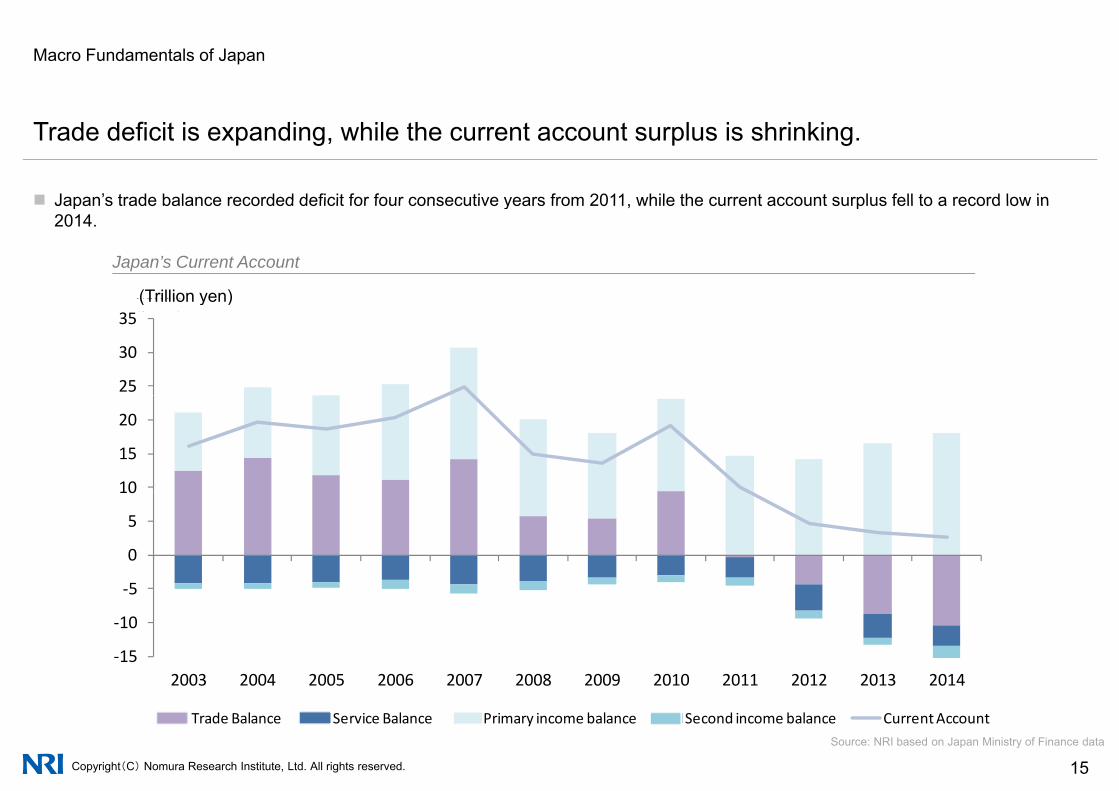
Trade deficit is expanding, while the current account surplus is shrinking.
Japan’s trade balance recorded deficit for four consecutive years from 2011 while the current account surplus fell to a record low in Japan s trade balance recorded deficit for four consecutive years from 2011, while the current account surplus fell to a record low in 2014.
Japan’s Current Account
(兆円)(Trillion yen)
25
30
35(兆円)(Trillion yen)
10
15
20
5
0
5
10
‐15
‐10
‐5
2003 2004 2005 2006 2007 2008 2009 2010 2011 2012 2013 2014 (年)
Copyright(C) Nomura Research Institute, Ltd. All rights reserved. 15Source: NRI based on Japan Ministry of Finance data
年
貿易収支 サービス収支 第一次所得収支 第二次所得収支 経常収支Trade Balance Service Balance Primary income balance Second income balance Current Account
Macro Fundamentals of Japan
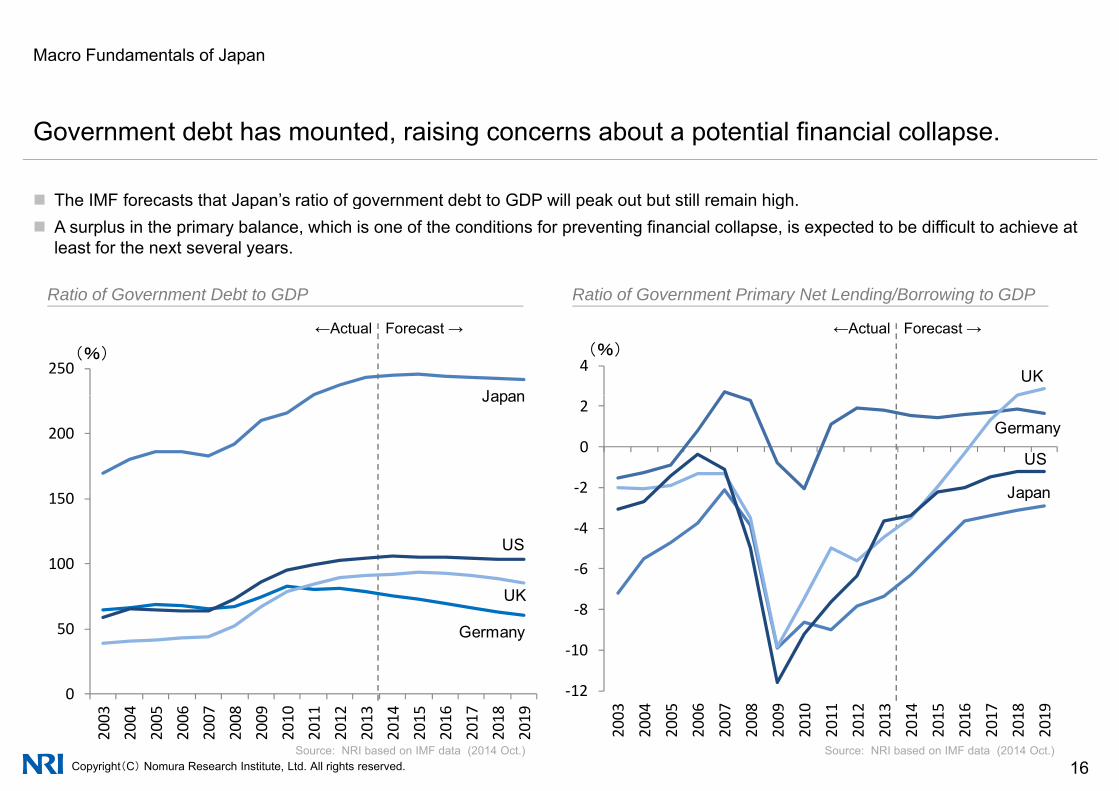
Government debt has mounted, raising concerns about a potential financial collapse.
The IMF forecasts that Japan’s ratio of government debt to GDP will peak out but still remain high The IMF forecasts that Japan s ratio of government debt to GDP will peak out but still remain high. A surplus in the primary balance, which is one of the conditions for preventing financial collapse, is expected to be difficult to achieve at
least for the next several years.
Ratio of Government Debt to GDP Ratio of Government Primary Net Lending/Borrowing to GDP
Forecast →←Actual Forecast →←Actual
Ratio of Government Debt to GDP Ratio of Government Primary Net Lending/Borrowing to GDP
4(%)
UK250(%)
Japan
‐2
0
2
Japan
US
Germany200
Japan
‐6
‐4
2 Japan
100
150
US
12
‐10
‐850
UK
Germany
Copyright(C) Nomura Research Institute, Ltd. All rights reserved. 16Source: NRI based on IMF data (2014 Oct.)Source: NRI based on IMF data (2014 Oct.)
‐12
2003
2004
2005
2006
2007
2008
2009
2010
2011
2012
2013
2014
2015
2016
2017
2018
2019
0
2003
2004
2005
2006
2007
2008
2009
2010
2011
2012
2013
2014
2015
2016
2017
2018
2019

Macro Fundamentals of Japan
A financial collapse is unlikely as long as domestic capital remains in Japan and continuesA financial collapse is unlikely as long as domestic capital remains in Japan and continues to circulate.
The possibility of Japanese government bonds collapsing is seen to be small since more than 90% of the bonds are held by domestic The possibility of Japanese government bonds collapsing is seen to be small since more than 90% of the bonds are held by domestic investors.
Household financial assets, which are a resource for government bond purchases, have increased due to rising stock prices in recent years.
Government Bond Investors Household’s Financial Assets in Japan
1600
1800 (Trillion yen)
80%
100%
Government Bond Investors Household s Financial Assets in Japan
1000
1200
1400
60%
80%
600
800
1000
40%
(年)0
200
400
0%
20%
Japan US UK Germany
Copyright(C) Nomura Research Institute, Ltd. All rights reserved. 17
Source: NRI based on Bank of Japan data
(年)0 2003 2004 2005 2006 2007 2008 2009 2010 2011 2012 2013
Note: Figures for Japan and US are from Dec 2014; for UK and Germany, from 2014 Q3.
Source: BoJ, FRB, ONS, Bundesbank
Domestic investors Foreign investors
Macro Fundamentals of Japan
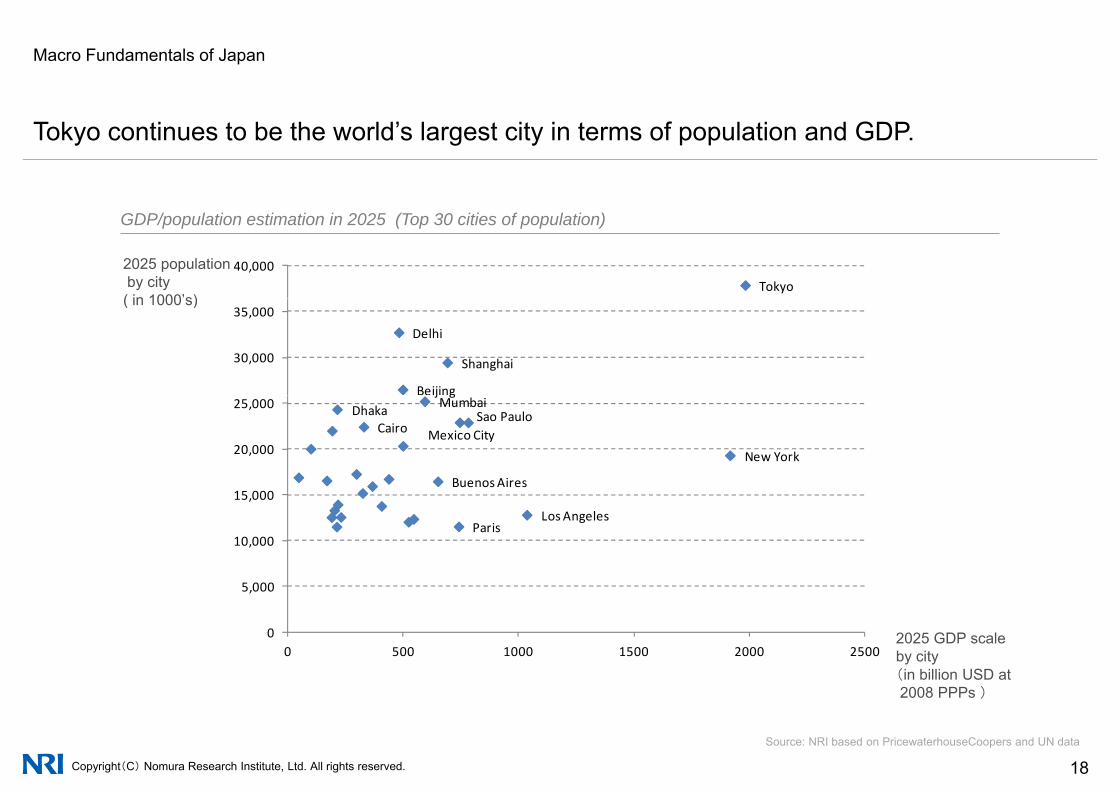
Tokyo continues to be the world’s largest city in terms of population and GDP.
Tokyo40,000
GDP/population estimation in 2025 (Top 30 cities of population)
2025 populationby city( in 1000’s)
Delhi
Shanghai
Beijing
30,000
35,000( in 1000 s)
j gMumbaiDhaka
Mexico CitySao Paulo
Cairo
New York
Buenos Aires15 000
20,000
25,000
Los AngelesParis
5 000
10,000
15,000
0
5,000
0 500 1000 1500 2000 25002025 GDP scaleby city(in billion USD at
)
Copyright(C) Nomura Research Institute, Ltd. All rights reserved. 18
2008 PPPs )
Source: NRI based on PricewaterhouseCoopers and UN data
Macro Fundamentals of Japan
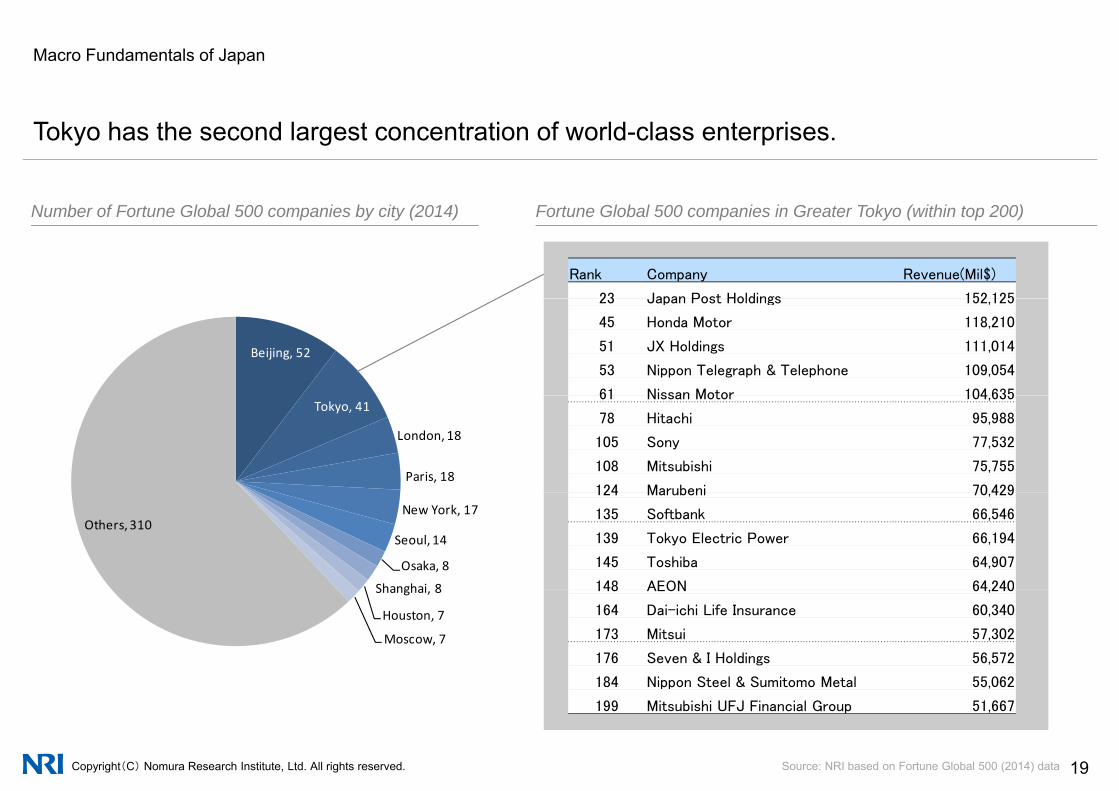
Tokyo has the second largest concentration of world-class enterprises.
Rank Company Revenue(Mil$)
23 Japan Post Holdings 152 125
Number of Fortune Global 500 companies by city (2014) Fortune Global 500 companies in Greater Tokyo (within top 200)
23 Japan Post Holdings 152,125
45 Honda Motor 118,210
51 JX Holdings 111,014
53 Nippon Telegraph & Telephone 109,054
61 Nissan Motor 104 635
Beijing, 52
61 Nissan Motor 104,635
78 Hitachi 95,988
105 Sony 77,532
108 Mitsubishi 75,755
124 Marubeni 70 429
Tokyo, 41
London, 18
Paris, 18124 Marubeni 70,429
135 Softbank 66,546
139 Tokyo Electric Power 66,194
145 Toshiba 64,907
148 AEON 64 240
New York, 17
Seoul, 14
Osaka, 8
Shanghai 8
Others, 310
148 AEON 64,240
164 Dai-ichi Life Insurance 60,340
173 Mitsui 57,302
176 Seven & I Holdings 56,572
184 Nippon Steel & Sumitomo Metal 55,062
Shanghai, 8
Houston, 7
Moscow, 7
Copyright(C) Nomura Research Institute, Ltd. All rights reserved. 19
184 Nippon Steel & Sumitomo Metal 55,062
199 Mitsubishi UFJ Financial Group 51,667
Source: NRI based on Fortune Global 500 (2014) data

Japan Japanese Real Estate Investment Market
1 Population Movements in Japan
2 Macro Fundamentals of Japan2 Macro Fundamentals of Japan
3 Overview of Real Estate Investment Market in Japan
4 Office Market
5 Residential Market
6 Retail Property Market
7 Logistics Property Market
8 Real Estate Investment Products
Copyright(C) Nomura Research Institute, Ltd. All rights reserved. 20
Overview of Real Estate Investment Market in Japan
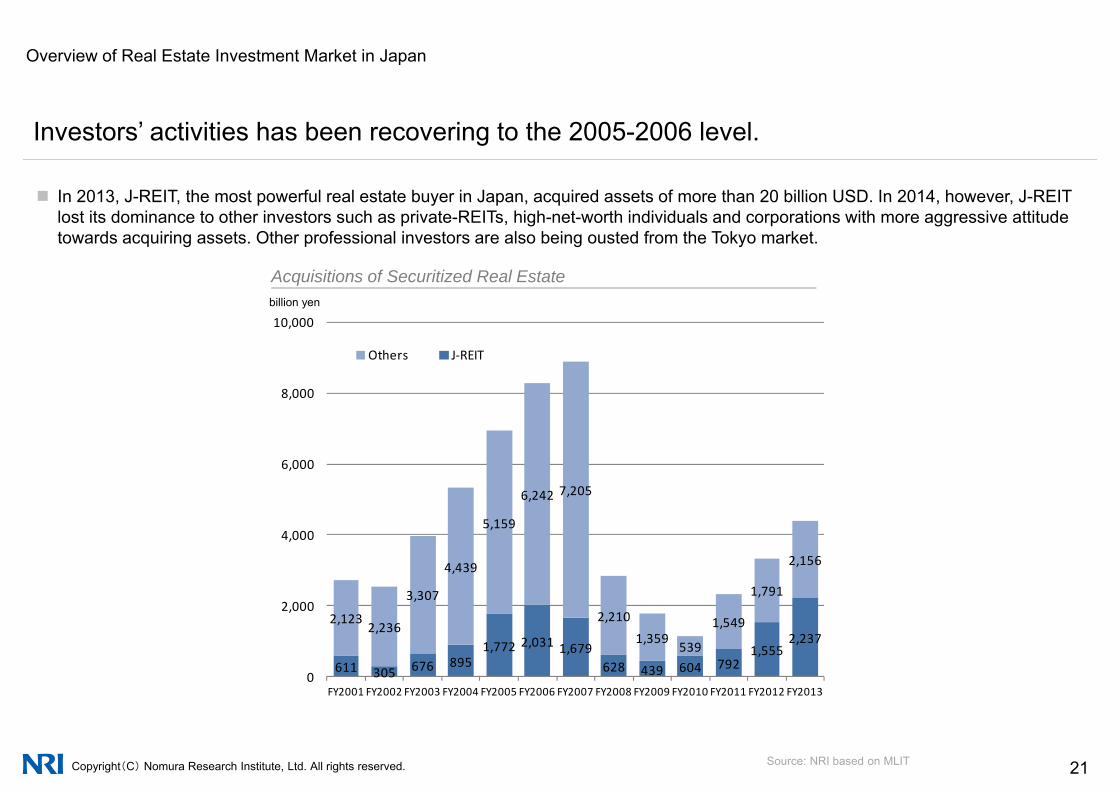
Investors’ activities has been recovering to the 2005-2006 level.
In 2013, J-REIT, the most powerful real estate buyer in Japan, acquired assets of more than 20 billion USD. In 2014, however, J-REITIn 2013, J REIT, the most powerful real estate buyer in Japan, acquired assets of more than 20 billion USD. In 2014, however, J REIT lost its dominance to other investors such as private-REITs, high-net-worth individuals and corporations with more aggressive attitude towards acquiring assets. Other professional investors are also being ousted from the Tokyo market.
billi
Acquisitions of Securitized Real Estate
8 000
10,000
Others J‐REIT
billion yen
6 242 7 205
6,000
8,000
4,439
5,159
6,242 7,205
1 791
2,156
4,000
611 305 676 8951,772 2,031 1,679
628 439 604 7921,555
2,2372,123
2,236
3,3072,210
1,359 539
1,549
1,791
0
2,000
Copyright(C) Nomura Research Institute, Ltd. All rights reserved. 21Source: NRI based on MLIT
FY2001 FY2002 FY2003 FY2004 FY2005 FY2006 FY2007 FY2008 FY2009 FY2010 FY2011 FY2012 FY2013

Hotel deals has been increasing amongst other key segments i e office residential retail
Overview of Real Estate Investment Market in Japan
Hotel deals has been increasing amongst other key segments, i.e. office, residential, retail and logistics properties.
Factors such as the 2020 Olympic game in Tokyo, weak JPY currency, and strong macro economy in Japan have helped to push the demand in hotels, attracting more investors to hotel investment.
Acquisitions of Securitized Real Estate by Asset ClassAllocation of Securitized Real Estate by Asset Classin 5 years (2009-2013)
8,000
Office Residential Retail Logistics Hotel Others
billion yen
Others, 16.0%
1,107 9814 000
6,000
Office, 33.8%
Logistics
Hotel, 3.3%
, %
267 686808
1,293 1,5891,321
603161404
835
790
452
788615
746
2,000
4,000
Residential, 17 1%Retail, 16.0%
Logistics, 13.8%
1,611710
1,516 1,7282,194 2,124 2,503
891 556 768 5121,092
1,501552 348
235441
406
550270 479
289252
309
0FY2001 FY2002 FY2003 FY2004 FY2005 FY2006 FY2007 FY2008 FY2009 FY2010 FY2011 FY2012 FY2013
N t B th tilit f iti ti th t i t l TMK i l th h t b i l d d ft 2001 B f thi th l t t l d t ill t t h ith th d t
17.1%,
Copyright(C) Nomura Research Institute, Ltd. All rights reserved. 22
Note: Because the utility of securitizations that require actual TMK is unclear, they have not been included after 2001. Because of this, the yearly totals and amounts will not match up with the documents cited for this entry.
Source: NRI based on Ministry of Land, Infrastructure, Transport and Tourism’s “Survey of the Current State of Real Estate Securitization”

Overview of Real Estate Investment Market in Japan
Lack of assets in Tokyo is likely to cause investment money to head to other regions.
For last few years, it has been extremely difficult for investors to find investment opportunities in Tokyo. In 2014 and 2015, transactionsFor last few years, it has been extremely difficult for investors to find investment opportunities in Tokyo. In 2014 and 2015, transactions in the ex-Tokyo area are expected to increase significantly in a trend similar to the one seen in pre-global financial crisis era.
Number of Properties Securitized by Region
51.9% 13.3% 10.0% 3.7% 17.8%FY2013
Tokyo Greater Tokyo Osaka Nagoya Fukuoka Others
Number of Properties Securitized by Region
58.8%
47.9%
12.0%
15.3%
8.0%
9.5%
4.0%
5.1%
14.9%
19.9%
FY2011
FY2012
53.0%
66.0%
10.5%
11.8%
8.4%
6.9%
6.9% 17.2%
12.0%
FY2008
FY2009
FY2010
41.9%
51.9%
12.1%
12.7%
10.5%
8.8%
6.4%
5.5%
23.1%
17.4%
0% 10% 20% 30% 40% 50% 60% 70% 80% 90% 100%
FY2007
FY2008
Copyright(C) Nomura Research Institute, Ltd. All rights reserved. 23
Note: not including securitization of real estate of SPCSource: NRI based on MLIT

Overview of Real Estate Investment Market in Japan
Total return recovered to 7%, the 2005 Q1 level.
Prior to the global financial crisis, the total return reached to 7% in 2005 Q1, and hiked till 2006 Q2.Prior to the global financial crisis, the total return reached to 7% in 2005 Q1, and hiked till 2006 Q2. Total return maintained the rate over 10% until 2007 Q1.
Performance Trend in Japan
13.815 0
20.0
(%)
3.7
7.3 7.4
5.05.0
10.0
15.0
Total ReturnIncome Return
‐7.2
0.32.3
‐5.0
0.0
Capital Return
‐11.7‐15.0
‐10.0
Mar Jun
Sep
Dec
Mar Jun
Sep
Dec
Mar Jun
Sep
Dec
Mar Jun
Sep
Dec
Mar Jun
Sep
Dec
Mar Jun
Sep
Dec
Mar Jun
Sep
Dec
Mar Jun
Sep
Dec
Mar Jun
Sep
Dec
Mar Jun
Sep
Dec
Mar Jun
Sep
Dec
Mar Jun
Sep
Copyright(C) Nomura Research Institute, Ltd. All rights reserved. 24
2003 2004 2005 2006 2007 2008 2009 2010 2011 2012 2013 2014
Source: MSCI Real Estate IPD

Overview of Real Estate Investment Market in Japan
Cap rates fell sharply and by 2014 most likely reached the 2007 level.
In the Tokyo market, an increasing number of real estate deals have cap rates of 3-4%. Some investors believe that arguing cap ratesIn the Tokyo market, an increasing number of real estate deals have cap rates of 3 4%. Some investors believe that arguing cap rates is futile as one can expect higher rents. Such market players consider timing and level of rent increase more important rather than cap rate compression.
C R t T d i J
7 0%
8.0%
Cap Rate Trend in Japan
6.0%
7.0%
Office Osaka CBD
4.0%
5.0%
Office Tokyo CBD
Retail Tokyo
Residential TokyoLogistics Tokyo Multi
3.0%
Oct‐03
Mar‐04
Aug‐04
Jan‐05
Jun‐05
Nov‐05
Apr‐06
Sep‐06
Feb‐07
Jul‐07
Dec‐07
May‐08
Oct‐08
Mar‐09
Aug‐09
Jan‐10
Jun‐10
Nov‐10
Apr‐11
Sep‐11
Feb‐12
Jul‐12
Dec‐12
May‐13
Oct‐13
Mar‐14
Aug‐14
Copyright(C) Nomura Research Institute, Ltd. All rights reserved. 25
Office Tokyo CBD Office Osaka CBD Retail Tokyo Residential Tokyo Logistics Tokyo Multi
Source: NRI based on Japan Real Estate Institute

Overview of Real Estate Investment Market in Japan
Mega deals of over one billion USD have increased.
Transaction Month/Year Dec, 2013 Mar, 2014 Aug, 2014 Oct, 2014 Nov, 2014Month/Year
Asset Land next to the Hamamatsucho Station
Otemachi Tower(Ratio of Acquisition: 17% ) Meguro Gajoen Pacific Century Place
Tokyo (Office floors)GE’s Residence Portfolio(200 properties)
Property Type Land Office Office・Hotel Office Residence
Area Minato, Hamamatsucho Chiyoda, Otemachi Meguro, Meguro Chiyoda, Marunouchi All parts of the country
Seller Kokusai Kogyo Tokyo Tatemono’s SPC Lone Star Secured Capital Japan(PAG)
GE Real Estate Japan
Buyer Nippon Life InsuranceObayashi Mizuho Bank Mori Trust GIC Blackstone
TransactionAmount 800 million USD 1,782 million USD 1,300 million USD 1,700 million USD 2,000 million USD
Gross Floor 34 200㎡ 38 840㎡Gross FloorArea 7,205㎡
34,200㎡(Floor Area of Acquisition) 155,820㎡
38,840㎡(Floor Area of Acquisition) NA
Source: NRI based on Nikkei Real Estate Market Report and others
Copyright(C) Nomura Research Institute, Ltd. All rights reserved. 26
M f i t ith diff t ti h d l t t i t i d
Overview of Real Estate Investment Market in Japan
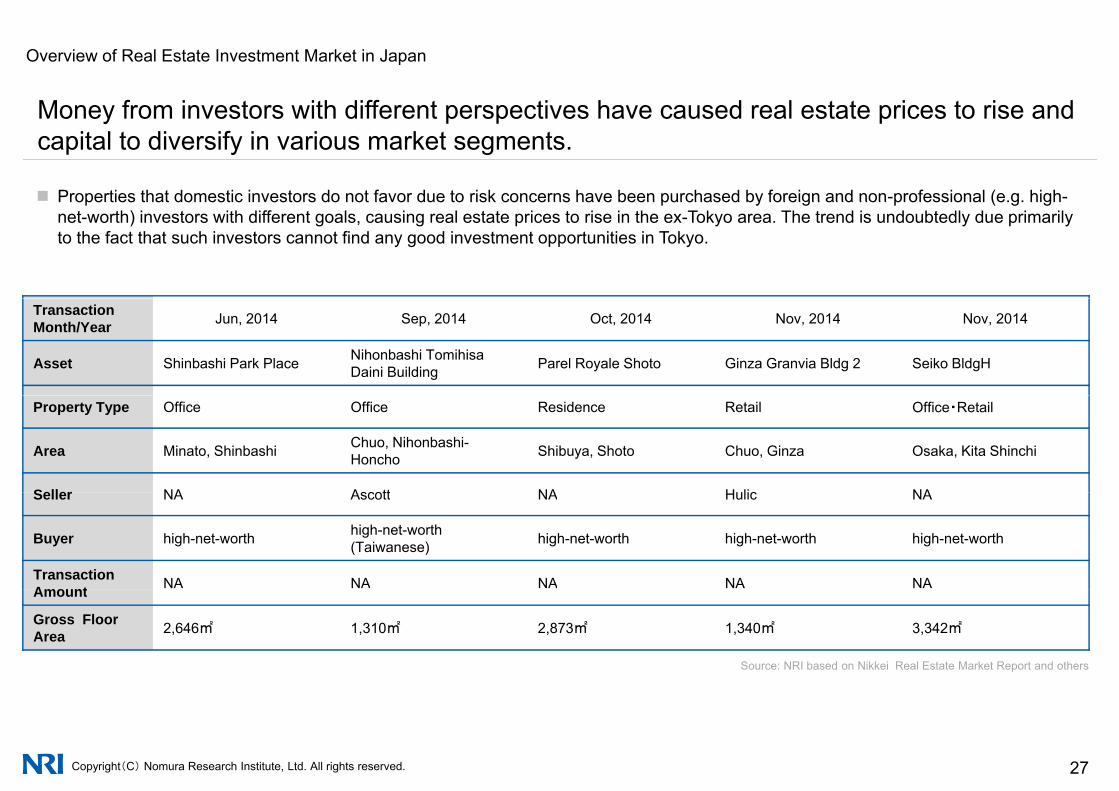
Money from investors with different perspectives have caused real estate prices to rise and capital to diversify in various market segments.
Properties that domestic investors do not favor due to risk concerns have been purchased by foreign and non-professional (e.g. high-Properties that domestic investors do not favor due to risk concerns have been purchased by foreign and non professional (e.g. highnet-worth) investors with different goals, causing real estate prices to rise in the ex-Tokyo area. The trend is undoubtedly due primarily to the fact that such investors cannot find any good investment opportunities in Tokyo.
Transaction Month/Year Jun, 2014 Sep, 2014 Oct, 2014 Nov, 2014 Nov, 2014
Asset Shinbashi Park Place Nihonbashi TomihisaDaini Building Parel Royale Shoto Ginza Granvia Bldg 2 Seiko BldgH
Property Type Office Office Residence Retail Office・Retail
Area Minato, Shinbashi Chuo, Nihonbashi-Honcho Shibuya, Shoto Chuo, Ginza Osaka, Kita Shinchi
Seller NA Ascott NA Hulic NASeller NA Ascott NA Hulic NA
Buyer high-net-worth high-net-worth (Taiwanese) high-net-worth high-net-worth high-net-worth
TransactionAmo nt NA NA NA NA NAAmount
Gross FloorArea 2,646㎡ 1,310㎡ 2,873㎡ 1,340㎡ 3,342㎡
Source: NRI based on Nikkei Real Estate Market Report and others
Copyright(C) Nomura Research Institute, Ltd. All rights reserved. 27
Because of the lack of investment opportunities at Tokyo metropolitan area
Overview of Real Estate Investment Market in Japan
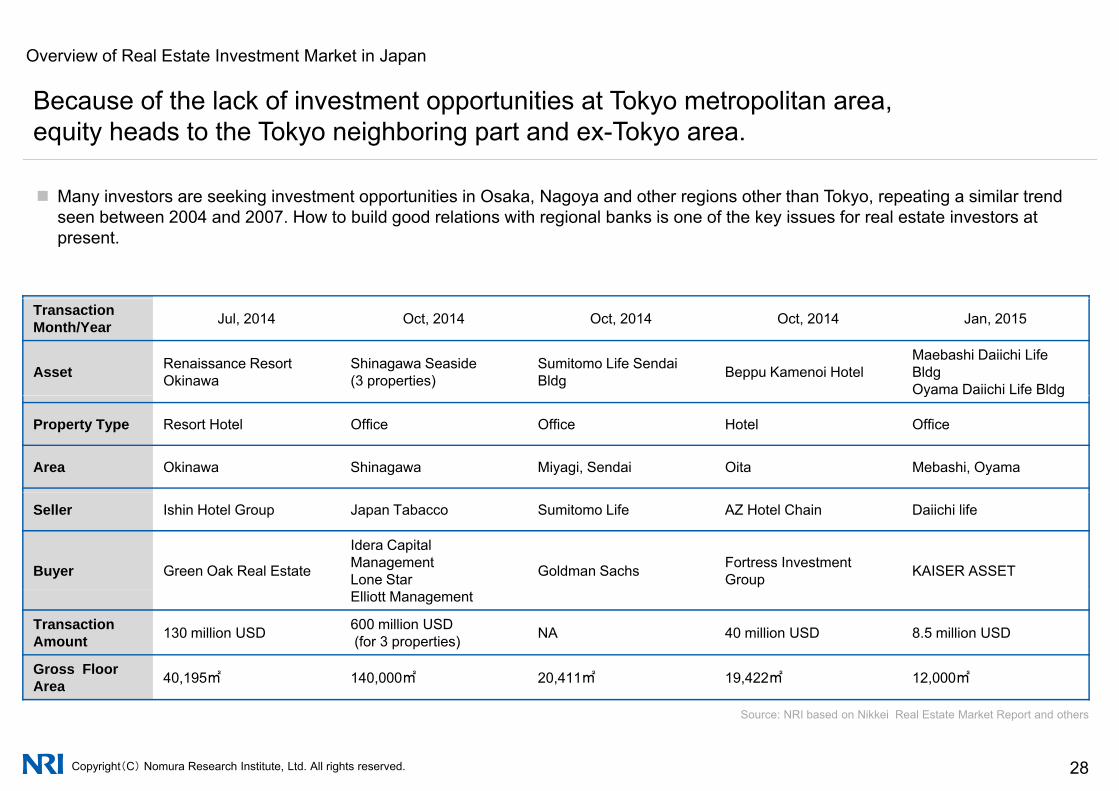
Because of the lack of investment opportunities at Tokyo metropolitan area, equity heads to the Tokyo neighboring part and ex-Tokyo area.
Many investors are seeking investment opportunities in Osaka, Nagoya and other regions other than Tokyo, repeating a similar trendMany investors are seeking investment opportunities in Osaka, Nagoya and other regions other than Tokyo, repeating a similar trend seen between 2004 and 2007. How to build good relations with regional banks is one of the key issues for real estate investors at present.
Transaction Month/Year Jul, 2014 Oct, 2014 Oct, 2014 Oct, 2014 Jan, 2015
Asset Renaissance Resort Okinawa
Shinagawa Seaside (3 properties)
Sumitomo Life Sendai Bldg Beppu Kamenoi Hotel
Maebashi Daiichi Life BldgOyama Daiichi Life Bldgy g
Property Type Resort Hotel Office Office Hotel Office
Area Okinawa Shinagawa Miyagi, Sendai Oita Mebashi, Oyama
Seller Ishin Hotel Group Japan Tabacco Sumitomo Life AZ Hotel Chain Daiichi life
Buyer Green Oak Real Estate
Idera Capital ManagementLone Star Goldman Sachs Fortress Investment
Group KAISER ASSET
Elliott Management
TransactionAmount 130 million USD 600 million USD
(for 3 properties) NA 40 million USD 8.5 million USD
Gross FloorArea 40,195㎡ 140,000㎡ 20,411㎡ 19,422㎡ 12,000㎡
Copyright(C) Nomura Research Institute, Ltd. All rights reserved. 28
Area
Source: NRI based on Nikkei Real Estate Market Report and others

Overview of Real Estate Investment Market in Japan
Fierce competition among commercial banks help boost prices.
Banks’ lending attitude toward the real estate industry is nearly the most lenient since 2000 and almost as lenient as in 2006. ManyBanks lending attitude toward the real estate industry is nearly the most lenient since 2000 and almost as lenient as in 2006. Many people in Japan believe that there are too many banks, and competition among lenders is quite fierce. Along with major banks, regional mid-size banks are trying to reduce spreads and loosen covenants. One big difference from the last peak we saw in 2006, however, is the non-participation of foreign lenders. One reason why foreign lenders are staying away from the Japanese debt market is the fact that the CMBS market has been frozen since 2009.
10
15
Financial Institutions’ Lending Attitude DI toward Real Estate Industry
Loose
‐5
0
5
Tight
‐20
‐15
‐10
‐35
‐30
‐25
0 0 1 1 2 2 3 3 4 4 5 5 6 6 7 7 8 8 9 9 0 0 1 1 2 2 3 3 4 4
Copyright(C) Nomura Research Institute, Ltd. All rights reserved. 29
Source: NRI based on BOJ
Mar‐00
Sep‐00
Mar‐01
Sep‐01
Mar‐02
Sep‐02
Mar‐03
Sep‐03
Mar‐04
Sep‐04
Mar‐05
Sep‐05
Mar‐06
Sep‐06
Mar‐07
Sep‐07
Mar‐08
Sep‐08
Mar‐09
Sep‐09
Mar‐10
Sep‐10
Mar‐11
Sep‐11
Mar‐12
Sep‐12
Mar‐13
Sep‐13
Mar‐14
Sep‐14

Japan Japanese Real Estate Investment Market
1 Population Movements in Japan
2 Macro Fundamentals of Japan2 Macro Fundamentals of Japan
3 Overview of Real Estate Investment Market in Japan
4 Office Market
5 Residential Market
6 Retail Property Market
7 Logistics Property Market
8 Real Estate Investment Products
Copyright(C) Nomura Research Institute, Ltd. All rights reserved. 30

Office Market
Tokyo Area holds 60% of Japan’s office rental market.
Japan has a stock of around 106 million ㎡ of available office rental space The Tokyo area holds an overwhelming share of the market Japan has a stock of around 106 million ㎡ of available office rental space. The Tokyo area holds an overwhelming share of the market at 64 million ㎡, comprising 60% of the total.
Office Floor Space Shares by Major City
1.7% 1.0%5.5%
3.3%2.4% 2.1% 1.6%
80%
90%
100%
(1 85 illi ㎡)(1.12million ㎡)
(5.87million ㎡)(3.57million ㎡)
(2.54million ㎡)(2.23million ㎡)
(1.72million ㎡)
4.7%1.0% 1.8%
14.9%
50%
60%
70%
(5.00million ㎡)(1.03million ㎡)
(1.95million ㎡)(15.91million ㎡)
(1.85million ㎡)
Osaka Area17.7%
59.9%30%
40%
50%
Tokyo Metropolitan Area67.4%
12 major cities106.73million ㎡
0%
10%
20%(63.94million ㎡)
Copyright(C) Nomura Research Institute, Ltd. All rights reserved. 31
Source: NRI based on JREI As of Jan.2014The investigation focus on central area of each city.The investigation object which are smaller than 3,000 square meter are excluded
Tokyo Yokohama Saitama Chiba Osaka Kobe Kyoto Nagoya Fukuoka Sapporo Sendai Hiroshima
Office Market
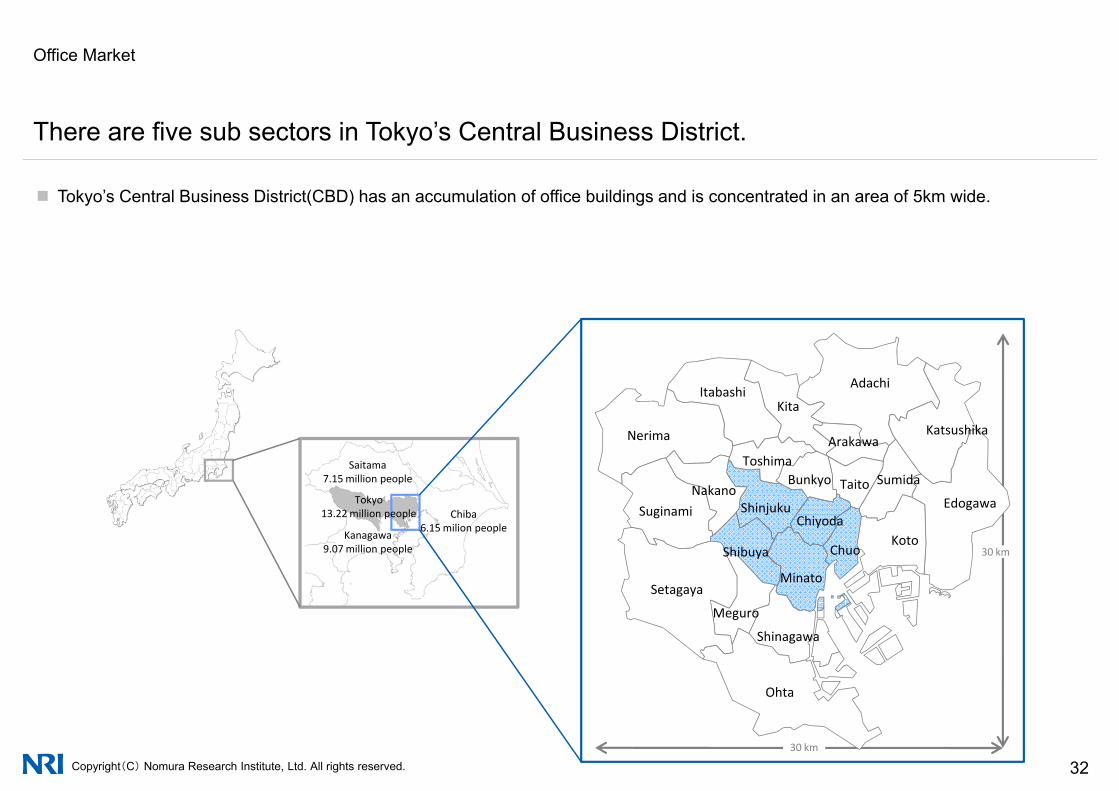
There are five sub sectors in Tokyo’s Central Business District.
Tokyo’s Central Business District(CBD) has an accumulation of office buildings and is concentrated in an area of 5km wide.Tokyo s Central Business District(CBD) has an accumulation of office buildings and is concentrated in an area of 5km wide.
ItabashiAdachi
Saitama7.15 million people
ItabashiKita
Katsushika
SumidaTaito
ArakawaToshima
BunkyoNakano
Nerima
30 km
Tokyo13.22 million people
Kanagawa9.07 million people
Chiba6.15 milion people
SetagayaMinato
Edogawa
KotoShibuya
ShinjukuChiyoda
Chuo
NakanoSuginami
Setagaya
Meguro
Shinagawa
Copyright(C) Nomura Research Institute, Ltd. All rights reserved. 3230 km
Ohta

Office Market
Vacancy rates in the Tokyo office market have been improving for two consecutive years.
Retrospectively vacancy rates have been experiencing regular ups and downs Retrospectively, vacancy rates have been experiencing regular ups and downs.
Vacancy rate movement in Tokyo CBD
M thl (J 2013 J 2015)Y l (1998 2014) Monthly(Jan 2013 –Jan 2015)Yearly(1998 - 2014)
12.0%
14.0%
12.0%
14.0%
8.0%
10.0% Shinjuku
MinatoChuo
8.0%
10.0%
Chuo
Minato
Shinjuku
4.0%
6.0%
Chiyoda4.0%
6.0%
Chiyoda
Chuo
0.0%
2.0%
98 99 00 01 02 03 04 05 06 07 08 09 10 11 12 13 14
Shibuya
0.0%
2.0%
13 13 13 13 14 14 14 14 15
Shibuya
Copyright(C) Nomura Research Institute, Ltd. All rights reserved. 33
Source: NRI based on Miki Shoji Co., Ltd. data
199
199
200
200
200
200
200
200
200
200
200
200
20 20 20 20 20
Jan‐1
Apr‐1
Jul‐1
Oct‐1
Jan‐1
Apr‐1
Jul‐1
Oct‐1
Jan‐1
Office Market
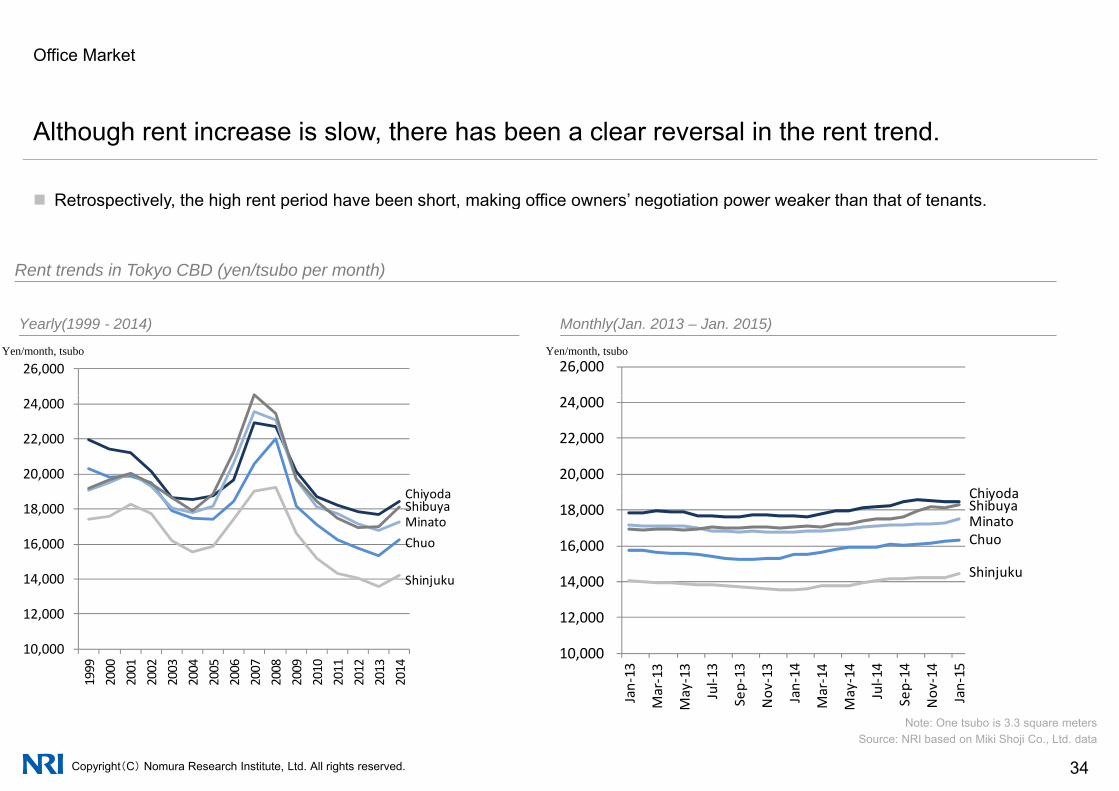
Although rent increase is slow, there has been a clear reversal in the rent trend.
Retrospectively the high rent period have been short making office owners’ negotiation power weaker than that of tenants Retrospectively, the high rent period have been short, making office owners negotiation power weaker than that of tenants.
Rent trends in Tokyo CBD (yen/tsubo per month)
Yen/month, tsubo Yen/month, tsubo
Monthly(Jan. 2013 – Jan. 2015)Yearly(1999 - 2014)
26,000 26,000
20,000
22,000
24,000
Chiyoda20,000
22,000
24,000
Chiyoda
14,000
16,000
18,000ChiyodaShibuyaMinatoChuo
Shinjuku 14,000
16,000
18,000 ChiyodaShibuyaMinatoChuo
Shinjuku
10,000
12,000
1999
2000
2001
2002
2003
2004
2005
2006
2007
2008
2009
2010
2011
2012
2013
2014
10,000
12,000 n‐13
r‐13
y‐13 l‐13
p‐13
v‐13
n‐14
r‐14
y‐14 l‐14
p‐14
v‐14
n‐15
Copyright(C) Nomura Research Institute, Ltd. All rights reserved. 34
Source: NRI based on Miki Shoji Co., Ltd. dataNote: One tsubo is 3.3 square meters
Jan
Mar
May Ju Sep
Nov Jan
Mar
May Ju Sep
Nov Jan
Office Market
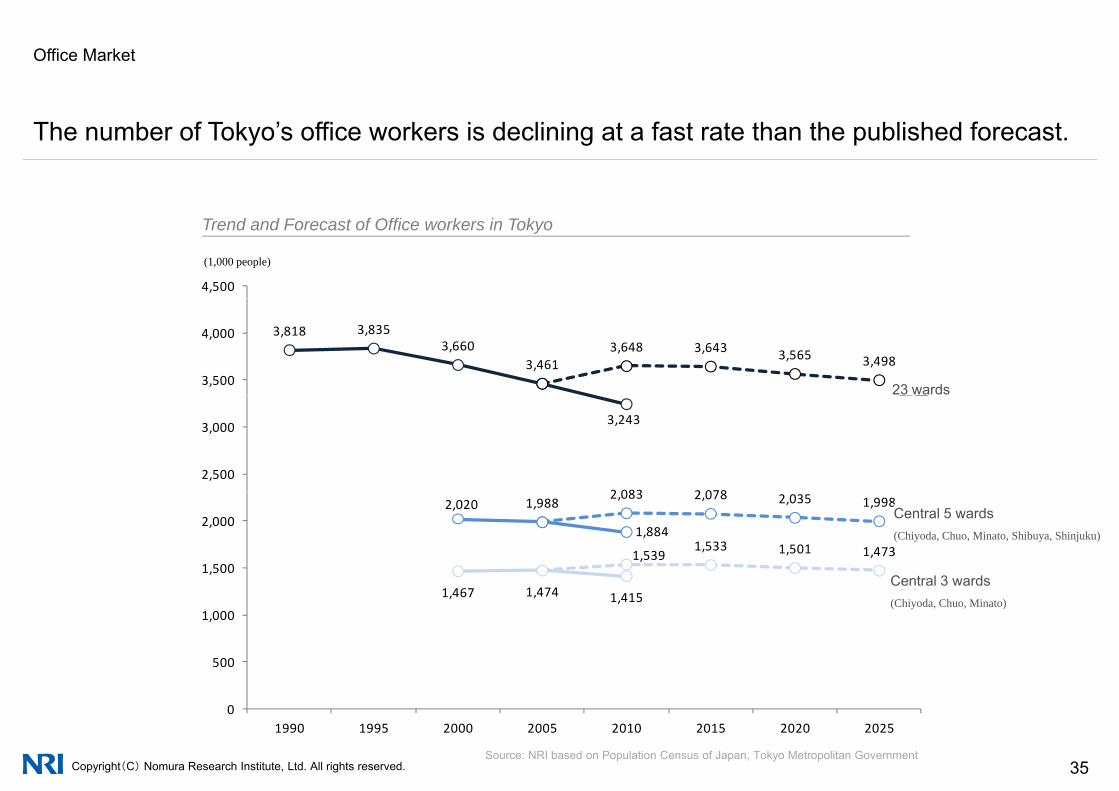
The number of Tokyo’s office workers is declining at a fast rate than the published forecast.
4,500
(千人)
Trend and Forecast of Office workers in Tokyo
(1,000 people)
3,818 3,8353,660
3,4613,648 3,643 3,565 3,498
3,500
4,000
23区23 wards
3,243
2 083 2 0782,500
3,000
23区
2,020 1,988
1,884
1 467 1 474
2,083 2,078 2,035 1,998
1,5391,533 1,501 1,473
1,500
2,0005区
3区Central 3 wards
Central 5 wards(Chiyoda, Chuo, Minato, Shibuya, Shinjuku)
1,467 1,474 1,415
500
1,000
3区(Chiyoda, Chuo, Minato)
Copyright(C) Nomura Research Institute, Ltd. All rights reserved. 35
01990 1995 2000 2005 2010 2015 2020 2025
Source: NRI based on Population Census of Japan, Tokyo Metropolitan Government

Office Market
Despite the dwindle in the number of office workers, new office supply will continue to grow.
# of buildingsSupplied f loor area
(1,000 ㎡)
Office Space Supply in Tokyo’s 23 districts
183
216
175
60
70
200
250( , )
Office supply areaNumber of building supplied
100108104
114118 119
99
125 121
154
119 117
175
111110124
40
50
150
56 55
83
100 10492
74
99
36
72
9177
65
86 85
58
8896
10
20
30
50
100
0
10
0
1986
1987
1988
1989
1990
1991
1992
1993
1994
1995
1996
1997
1998
1999
2000
2001
2002
2003
2004
2005
2006
2007
2008
2009
2010
2011
2012
2013
2014
2015
2016
2017
2018
Copyright(C) Nomura Research Institute, Ltd. All rights reserved. 36
Source: NRI based from Mori Building Company’s “Mega Office Building Market Trends Survey (Preliminary figure)” dated October 22, 2014
Office Market
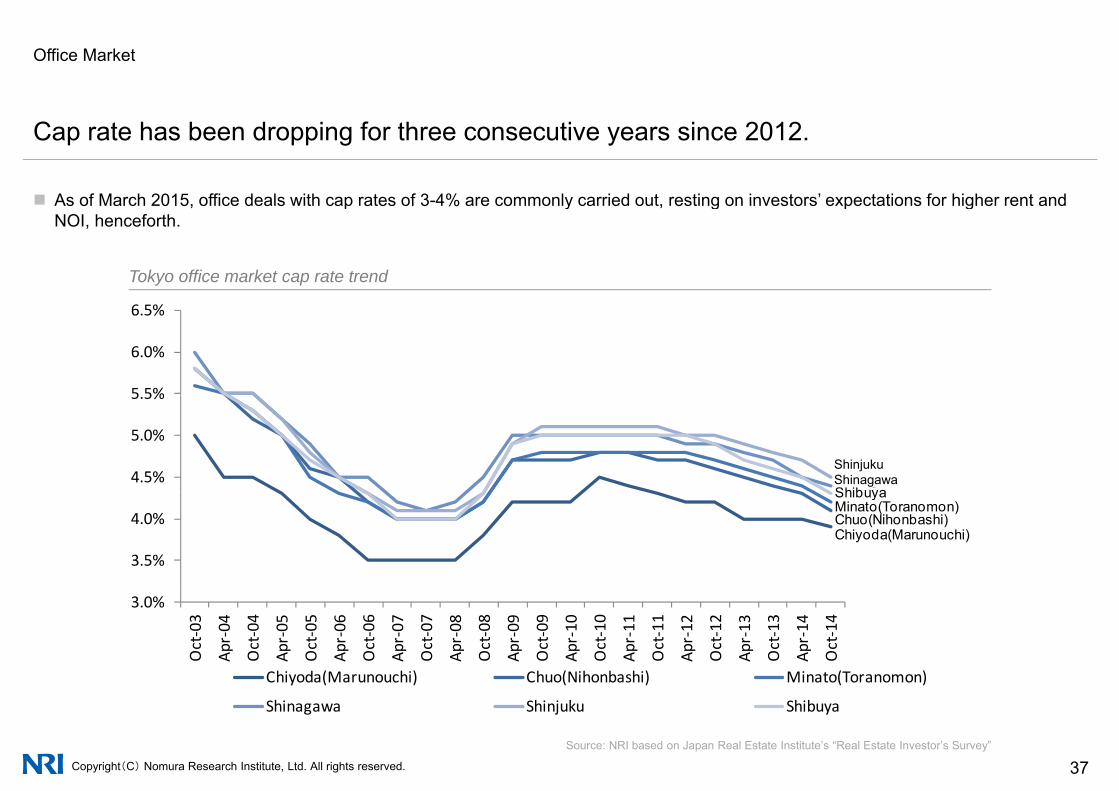
Cap rate has been dropping for three consecutive years since 2012.
As of March 2015 office deals with cap rates of 3-4% are commonly carried out resting on investors’ expectations for higher rent and
Tokyo office market cap rate trend
As of March 2015, office deals with cap rates of 3-4% are commonly carried out, resting on investors expectations for higher rent and NOI, henceforth.
5 5%
6.0%
6.5%
4.5%
5.0%
5.5%
ShinjukShinagaShibuya
ShinjukuShinagawa
3.5%
4.0%ShibuyaMinato(Toranomon)Chuo(Nihonbashi)Chiyoda(Marunouchi)
3.0%
Oct‐03
Apr‐04
Oct‐04
Apr‐05
Oct‐05
Apr‐06
Oct‐06
Apr‐07
Oct‐07
Apr‐08
Oct‐08
Apr‐09
Oct‐09
Apr‐10
Oct‐10
Apr‐11
Oct‐11
Apr‐12
Oct‐12
Apr‐13
Oct‐13
Apr‐14
Oct‐14
Chiyoda(Marunouchi) Chuo(Nihonbashi) Minato(Toranomon)
Copyright(C) Nomura Research Institute, Ltd. All rights reserved. 37Source: NRI based on Japan Real Estate Institute’s “Real Estate Investor’s Survey”
Shinagawa Shinjuku Shibuya
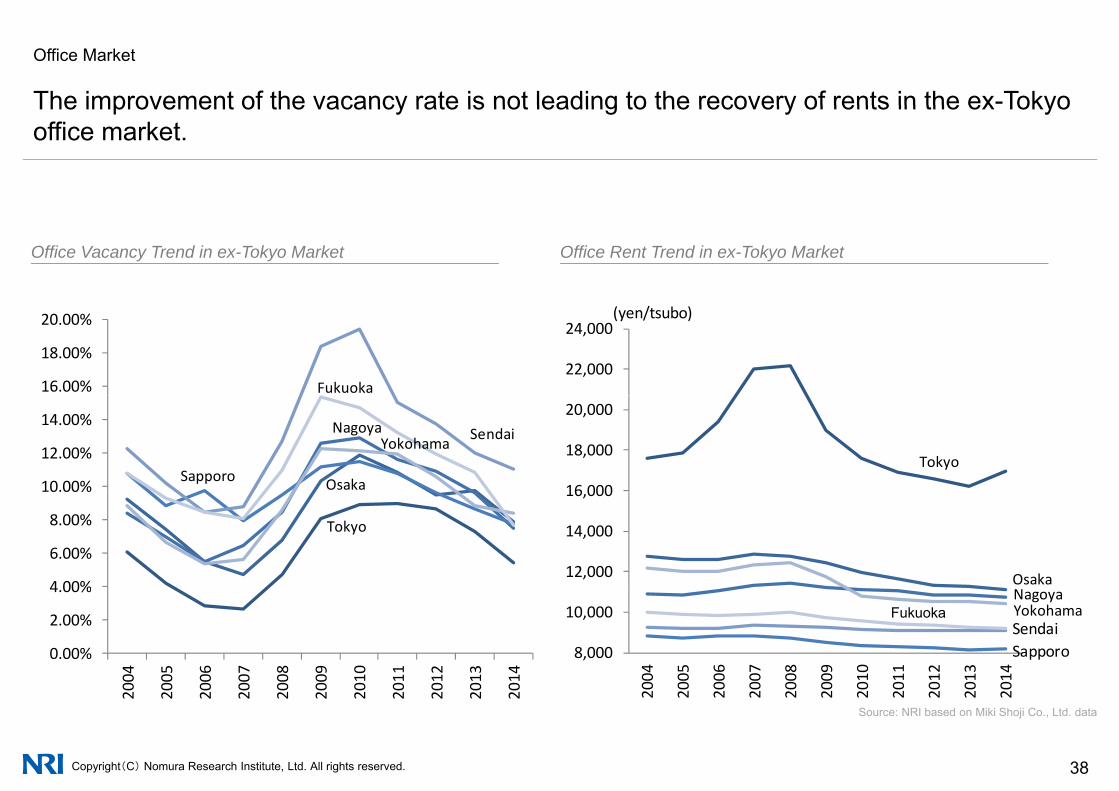
Office Market
The improvement of the vacancy rate is not leading to the recovery of rents in the ex-TokyoThe improvement of the vacancy rate is not leading to the recovery of rents in the ex Tokyo office market.
Office Vacancy Trend in ex-Tokyo Market Office Rent Trend in ex-Tokyo Market
22,000
24,000(yen/tsubo)
16.00%
18.00%
20.00%
Fukuoka
16 000
18,000
20,000
Tokyo10.00%
12.00%
14.00%SendaiNagoya
Yokohama
Sapporo Osaka
12,000
14,000
16,000
OsakaN4 00%
6.00%
8.00% Tokyo
8,000
10,000
004
005
006
007
008
009
010
011
012
013
014
NagoyaYokohamaFukuokSendaiSapporo0.00%
2.00%
4.00%
004
005
006
007
008
009
010
011
012
013
014
Fukuoka
Copyright(C) Nomura Research Institute, Ltd. All rights reserved. 38
20 20 20 20 20 20 20 20 20 20 20
Source: NRI based on Miki Shoji Co., Ltd. data
20 20 20 20 20 20 20 20 20 20 20
Office Market
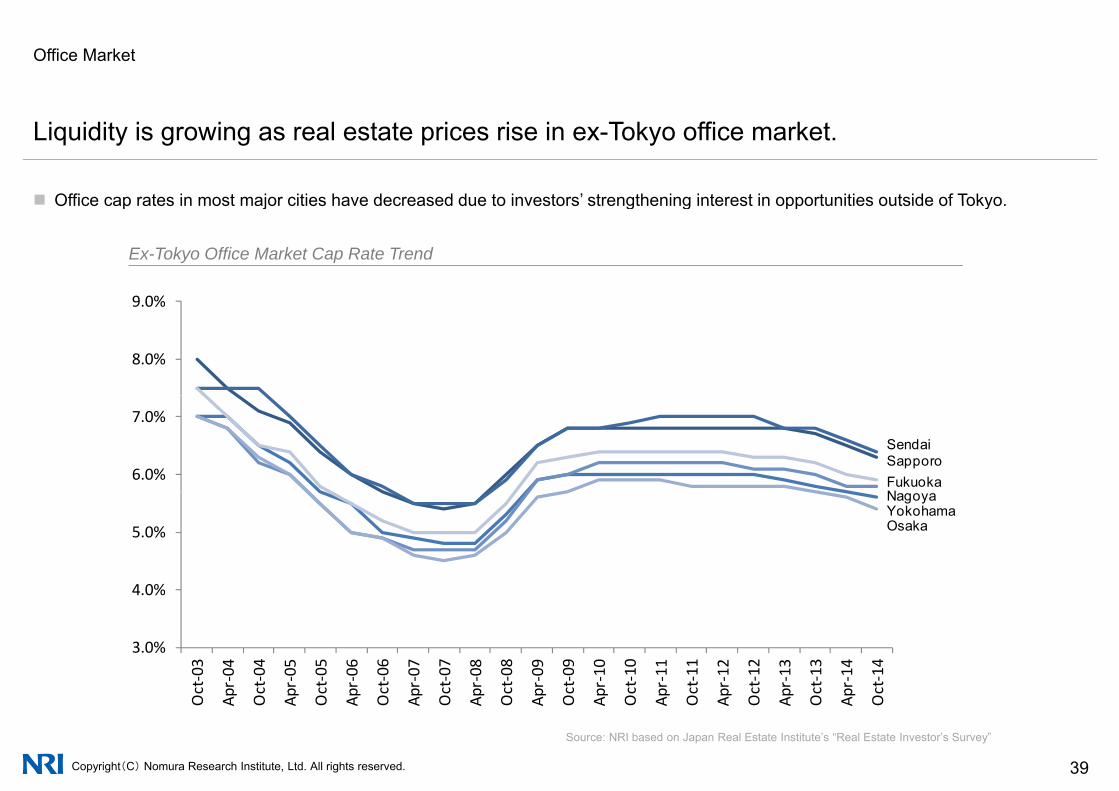
Liquidity is growing as real estate prices rise in ex-Tokyo office market.
Office cap rates in most major cities have decreased due to investors’ strengthening interest in opportunities outside of Tokyo
9 0%
Office cap rates in most major cities have decreased due to investors strengthening interest in opportunities outside of Tokyo.
Ex-Tokyo Office Market Cap Rate Trend
8.0%
9.0%
6.0%
7.0%
SendaiSapporoFukuokaN
4 0%
5.0%
NagoyaYokohamaOsaka
3.0%
4.0%
t‐03
r‐04 t‐04
r‐05 t‐05
r‐06 t‐06
r‐07 t‐07
r‐08 t‐08
r‐09 t‐09
r‐10 t‐10
r‐11 t‐11
r‐12 t‐12
r‐13 t‐13
r‐14 t‐14
Copyright(C) Nomura Research Institute, Ltd. All rights reserved. 39
Oct
Apr
Oct
Apr
Oct
Apr
Oct
Apr
Oct
Apr
Oct
Apr
Oct
Apr
Oct
Apr
Oct
Apr
Oct
Apr
Oct
Apr
Oct
Source: NRI based on Japan Real Estate Institute’s “Real Estate Investor’s Survey”
Japan Japanese Real Estate Investment Market
1 Population Movements in Japan
2 Macro Fundamentals of Japan2 Macro Fundamentals of Japan
3 Overview of Real Estate Investment Market in Japan
4 Office Market
5 Residential Market
6 Retail Property Market
7 Logistics Property Market
8 Real Estate Investment Products
Copyright(C) Nomura Research Institute, Ltd. All rights reserved. 40

Residential Market
About 20% of all households in Japan are living in non-public rental apartments and theAbout 20% of all households in Japan are living in non public rental apartments, and the percentage is trending upwards.
Households living in non-public rental apartments (excluding wooden apartments; hereafter the same in this section) which numbered Households living in non-public rental apartments (excluding wooden apartments; hereafter the same in this section), which numbered 3.34 million in 1988, increased by about 2.6 times to 9.96 million (about 20% of all households) in 2013.
Breakdown of All Households by Housing Type (2013) Number of Households by Housing Type 1988 2013
4 4214,716
4,9895,238
18%20%
20%
25%
5,000
6,000
Ratio of Ho
Apat:10,000)Public Rental
House6%
Company Housing
2%
Breakdown of All Households by Housing Type (2013) Number of Households by Housing Type 1988 - 2013
3,7604,097
4,421
9%
12%
15%16%
18%
15%
3,000
4,000
ouseholds Livingartm
ent House ou
seho
lds (un
it
Private Rental Housing, Others9%
1,411 1,578 1,682 1,724 1,783 1,857
334 490 650 750 879 996
9%
5%
10%
1,000
2,000
g in Private Ren(non‐w
ood)
Num
ber of H
o
0%0'88 '93 '98 '03 '08 '13
ntal &
Households Living in HousingHouseholds Living in Rental HousesHo seholds Li ing in Pri ate Rental & Apartment Ho ses (non ood)
Own House63%
Private Rental House,
Apartment House (non‐
wood)20%
Copyright(C) Nomura Research Institute, Ltd. All rights reserved. 41
Source: NRI based on data from “Housing and Land Survey”, Ministry of Internal Affairs and Communications of Japan.
Households Living in Private Rental & Apartment Houses (non‐wood)Ratio of Households Living in Private Rental & Apartment Houses (non‐wood)
Residential Market
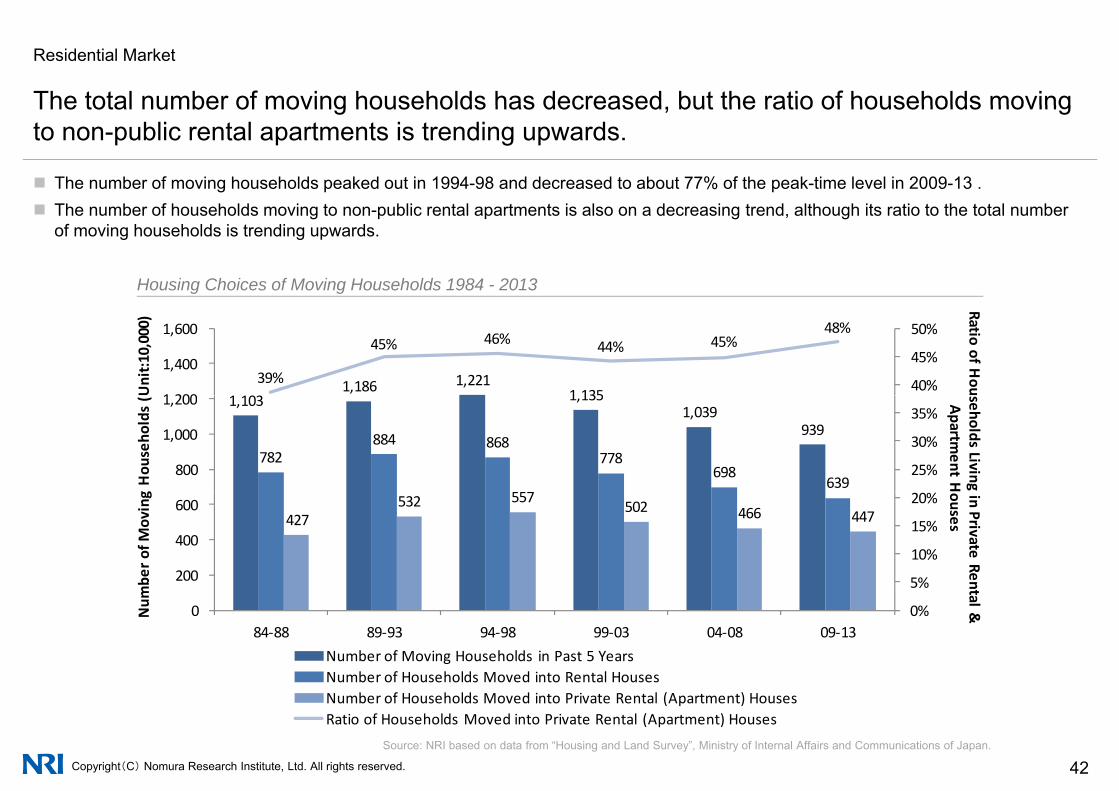
The total number of moving households has decreased but the ratio of households movingThe total number of moving households has decreased, but the ratio of households moving to non-public rental apartments is trending upwards.
The number of moving households peaked out in 1994-98 and decreased to about 77% of the peak-time level in 2009-13 . The number of households moving to non-public rental apartments is also on a decreasing trend, although its ratio to the total number
of moving households is trending upwards.
Housing Choices of Moving Households 1984 - 2013
1,186 1,2211 135
39%
45% 46% 44% 45%48%
40%
45%
50%
1 200
1,400
1,600
Ratio of HouU
nit:1
0,000)
1,103 1,1351,039
939
782884 868
778698
639557
25%
30%
35%
800
1,000
1,200 seholds Living Apartm
ent Hg Hou
seho
lds (
427532 557 502 466 447
5%
10%
15%
20%
200
400
600
in Private Renouses
mbe
r of M
oving
0%084‐88 89‐93 94‐98 99‐03 04‐08 09‐13
tal & N
um
Number of Moving Households in Past 5 YearsNumber of Households Moved into Rental Houses
Copyright(C) Nomura Research Institute, Ltd. All rights reserved. 42Source: NRI based on data from “Housing and Land Survey”, Ministry of Internal Affairs and Communications of Japan.
Number of Households Moved into Private Rental (Apartment) HousesRatio of Households Moved into Private Rental (Apartment) Houses
Residential Market
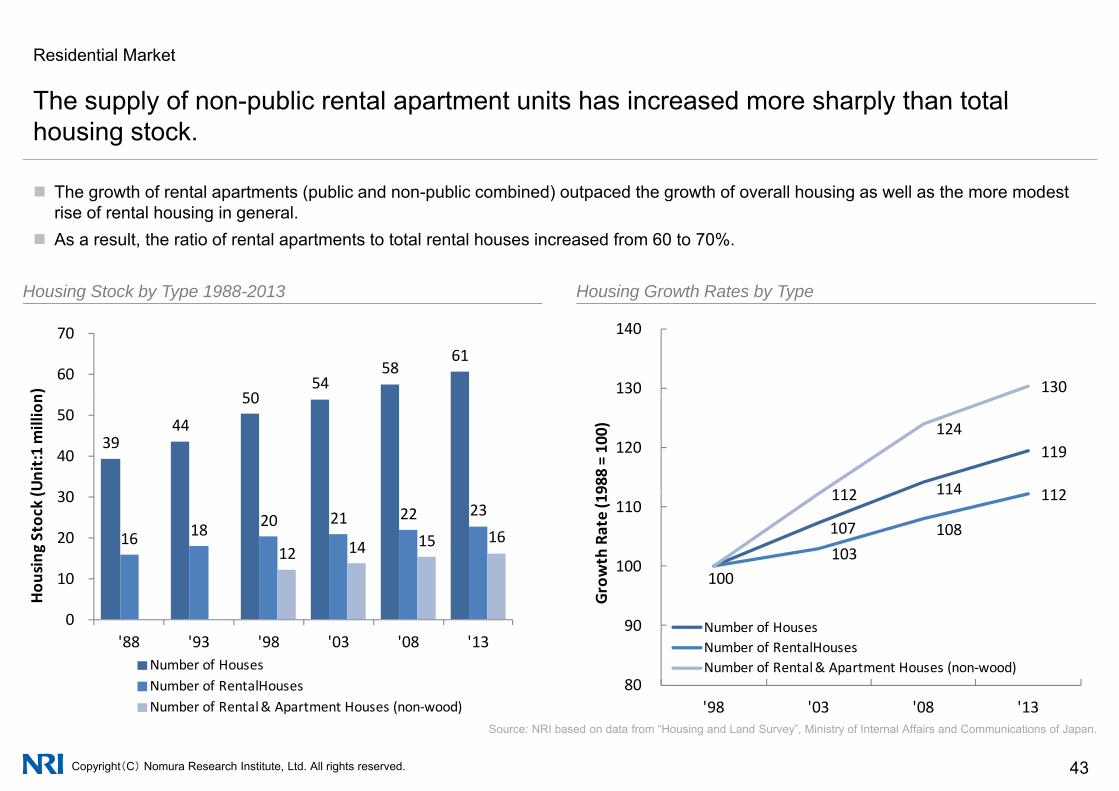
The supply of non-public rental apartment units has increased more sharply than totalThe supply of non public rental apartment units has increased more sharply than total housing stock.
The growth of rental apartments (public and non-public combined) outpaced the growth of overall housing as well as the more modest
Housing Stock by Type 1988-2013
rise of rental housing in general. As a result, the ratio of rental apartments to total rental houses increased from 60 to 70%.
Housing Growth Rates by Typeg y yp g y yp
5054
58 61
60
70
n)
130 130
140
39 44
50
30
40
50
(Unit:1 million
114
119
112112
124 120
988 = 100)
16 18 20 21 22 23
12 14 15 16
10
20
30
ousing
Stock (
100
107
114
103 108
112 112
100
110
rowth Rate (19
0 '88 '93 '98 '03 '08 '13
Ho
Number of HousesNumber of RentalHouses 80
90 Gr
Number of HousesNumber of RentalHousesNumber of Rental & Apartment Houses (non‐wood)
Copyright(C) Nomura Research Institute, Ltd. All rights reserved. 43
Source: NRI based on data from “Housing and Land Survey”, Ministry of Internal Affairs and Communications of Japan.
Number of RentalHousesNumber of Rental & Apartment Houses (non‐wood)
80 '98 '03 '08 '13

Residential Market
Construction of new rental housing declined in 2009 but is now on a recovery path.
The number of new constructions decreased in 2014 as a reaction to last minute surge in demand prior to the tax increase. The ratio of rental house has increased as the number of new rental housing has leveled off while the total number of new construction
has declined.
New Housing Supply Trend: 1991-2014 Breakdown of New Rental Housing Construction by Region
700
800
nit:1
,000)
Provincial RegionKinki RegionChuubu RegionMetropolitanRegion
40%
45%
50%
1,600
1,800
2,000
t:1,000)
New Housing Supply Trend: 1991 2014 Breakdown of New Rental Housing Construction by Region
400
500
600
tion by
Region(Un Metropolitan Region
25%
30%
35%
1,000
1,200
1,400 Ratio of Renion Starts
(Unit
200
300
400
l Housing
Construct
10%
15%
20%
400
600
800
tal Houses
er of Con
structi
0
100
200New
Rental
0%
5%
0
200
91 92 93 94 95 96 97 98 99 00 01 02 03 04 05 06 07 08 09 10 11 12 13 14
Num
be
Own House Rental House Company House
Copyright(C) Nomura Research Institute, Ltd. All rights reserved. 44
91 92 93 94 95 96 97 98 99 00 01 02 03 04 05 06 07 08 09 10 11 12 13 14House Built for Sale Ratio of Rental House
Source: NRI based on data from “Survey of Construction Work Started”, Ministry of Land, Infrastructure, Transport and Tourism of Japan.

Residential Market
Vacancy rates are rising in all of Tokyo’s 23 wards.
Vacancy rate in the metropolitan Tokyo has continued to decline for the past decade. In the recent years, however, Tokyo has seen an upward trend of vacancy rates, especially in the 23 wards. Affected by the Great East Japan earthquake in 2011, vacancy rates in Sendai has seen a significant shrinkage.
Vacancy Rates of Rental Housing (non-wood) in Major Cities Vacancy Rates of Rental Housing in Tokyo Metropolitan Area
15
16
17
nit: %)
20%
25%
(Unit:%) '98 '03 '08 '13
Vacancy Rates of Rental Housing (non wood) in Major Cities Vacancy Rates of Rental Housing in Tokyo Metropolitan Area
13
14
15
cancy Ra
te (U
n
15%
20%
sing (non
‐woo
d)
10
11
12
al Hou
sing
Vac
All Tokyo areas
23 Tokyo districts
10%
e of Ren
tal H
ous
8
9
Jan
Mar
May Jul
Sep
Nov Jan
Mar
May Jul
Sep
Nov Jan
Mar
May Jul
Sep
Nov
Renta
Tokyo cities
Kanagawa
0%
5%
Vacancy Rat
Copyright(C) Nomura Research Institute, Ltd. All rights reserved. 45
M M M
2012 2013 2014 Source: NRI based on data from “Report on Rental Housing Market”, TAS Corp. (Analyzed by TAS
Corp. Data Supplied by At Home Co., Ltd.). Source: NRI based on data from Data from “Housing and Land Survey”, Ministry of Internal Affairs
and Communications of Japan.
Sapporo Sendai Tokyo23 Wards
Nagoya Osaka Hiroshima Fukuoka

Residential Market
The rent level of non-public rental housing continues to fall.
The rent level of non public rental housing rose steadily from 1990 to 2000 after which it gradually declined The
108 0
The rent level of non-public rental housing rose steadily from 1990 to 2000, after which it gradually declined. The rent level downward trend continued in 2013.
Rent in the Private Sector (Annual Average) – Nationwide and Central Tokyo
102 0
104.0
106.0
108.0
e Ye
ar 201
0)
96 0
98.0
100.0
102.0
Rent In
dex (Base
90 0
92.0
94.0
96.0
Annu
al Average)
86.0
88.0
90.0
91 92 93 94 95 96 97 98 99 00 01 02 03 04 05 06 07 08 09 10 11 12 13 14
Private (A Japan
Tokyo 23 Wards
Copyright(C) Nomura Research Institute, Ltd. All rights reserved. 46
Source: NRI based on data from “Consumer Price Index”, Ministry of Internal Affairs and Communications of Japan.
Residential Market
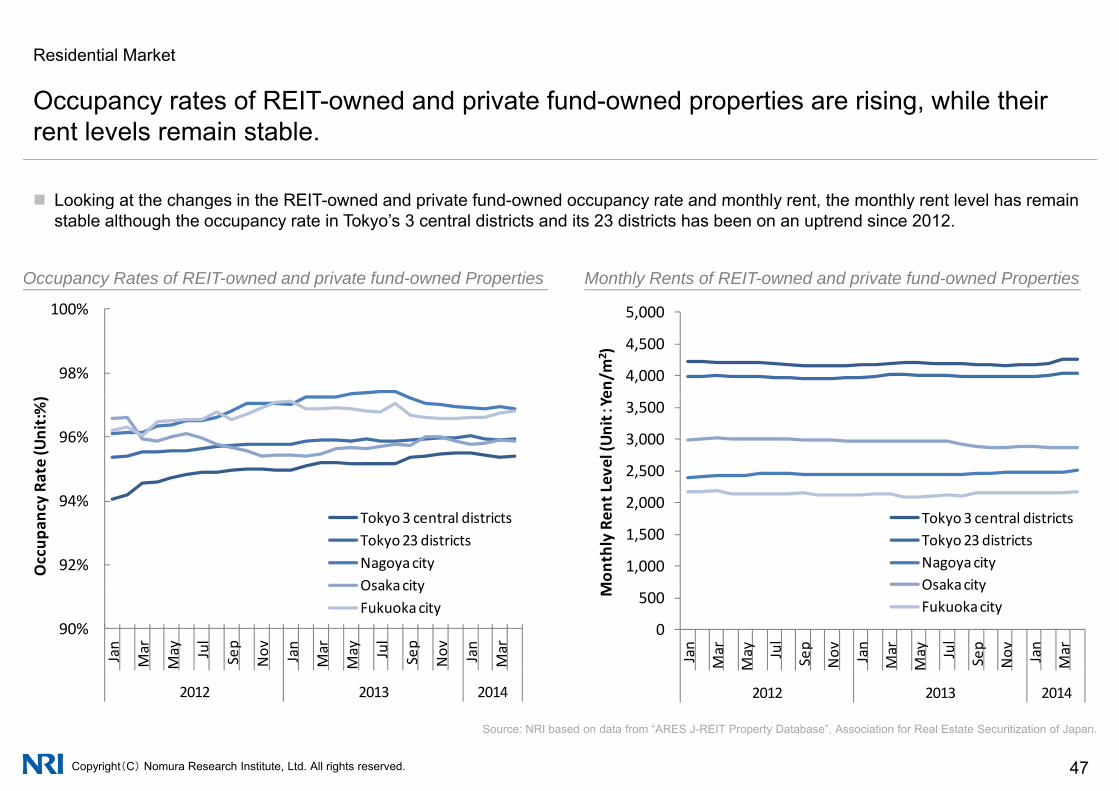
Occupancy rates of REIT-owned and private fund-owned properties are rising while theirOccupancy rates of REIT owned and private fund owned properties are rising, while their rent levels remain stable.
Looking at the changes in the REIT-owned and private fund-owned occupancy rate and monthly rent the monthly rent level has remain Looking at the changes in the REIT-owned and private fund-owned occupancy rate and monthly rent, the monthly rent level has remain stable although the occupancy rate in Tokyo’s 3 central districts and its 23 districts has been on an uptrend since 2012.
Occupancy Rates of REIT-owned and private fund-owned Properties Monthly Rents of REIT-owned and private fund-owned Properties
98%
100%
4,000
4,500
5,000
en/m
2 )
96%
Rate (U
nit:%)
2,500
3,000
3,500
Level (Unit:Ye
92%
94%
Occup
ancy
Tokyo 3 central districtsTokyo 23 districtsNagoya cityOsakacity
1,000
1,500
2,000
Mon
thly Ren
t
Tokyo 3 central districtsTokyo 23 districtsNagoya cityOsakacity
90%
Jan
Mar
May Jul
Sep
Nov Jan
Mar
May Jul
Sep
Nov Jan
Mar
Osaka cityFukuoka city
0
500
Jan
Mar
May Jul
Sep
Nov Jan
Mar
May Jul
Sep
Nov Jan
Mar
M Osaka cityFukuoka city
Copyright(C) Nomura Research Institute, Ltd. All rights reserved. 47
Source: NRI based on data from “ARES J-REIT Property Database”, Association for Real Estate Securitization of Japan.
2012 2013 2014 2012 2013 2014
Japan Japanese Real Estate Investment Market
1 Population Movements in Japan
2 Macro Fundamentals of Japan2 Macro Fundamentals of Japan
3 Overview of Real Estate Investment Market in Japan
4 Office Market
5 Residential Market
6 Retail Property Market
7 Logistics Property Market
8 Real Estate Investment Products
Copyright(C) Nomura Research Institute, Ltd. All rights reserved. 48

Retail Property Market
Development of large-scale retail stores has started to recover since 2009.
9005,000 Floor Area Number of projects
New Retail Space Supply vs. Number of Development Projects
638
786738 731 730 750
654
584620
738705
600
700
800
3,500
4,000
4,500
Num2)
4,1784,545
3 9834,369
450500
400
500
600
2 000
2,500
3,000
, mber of projectA
rea(1000m2
2,455
3,3353,729
, 3,983
1,919 2,081 2,351 2,1932,860 2,824
100
200
300
1,000
1,500
2,000 ts(cases)Floo
r
0
100
0
500
2001 2002 2003 2004 2005 2006 2007 2008 2009 2010 2011 2012 2013
Copyright(C) Nomura Research Institute, Ltd. All rights reserved. 49
Note: The reported numbers for the fiscal years 2002 and 2008 include stores without floor space indication.Source: NRI based on data from the Ministry of Economy, Trade and Industry’s “Large-scale Retail Chain Site Expansion Report”

Retail Property Market
For shopping centers the total floor area for all stores and the floor area per store are bothFor shopping centers, the total floor area for all stores and the floor area per store are both on the rise.
Overall floor area Floor area per SC(i 1 illi 2) (i 1000 2/ t )
Overall floor area and per-store floor area for shopping centers
44 2 45.7 46.4 47.9 11.8 11 6 12.1 12.4 12.8 13.2 13.6
14.1 14.2 14.5 14.8 15.0 15.3
14
16
50
60
Floo
(in 1 million m2) Old SC Standard New SC Standard (in 1000m2/store)
30.6 30.4 31.5 33.1 34.6 36.5 38.0 42.1 42.7 44.2 11.8 11.6
8
10
12
30
40
or area per shall floor area
4
6
10
20
opping centeOvera
0
2
02001 2002 2003 2004 2005 2006 2007 2008 2009 2010 2011 2012 2013
r
Copyright(C) Nomura Research Institute, Ltd. All rights reserved. 50
NB: In the old SC standard, only shopping malls with more than 10 retail tenants were considered.
In the new SC standard, the shopping center must have more than 10 tenants including food stalls, service centers and retail outlets.
On the same note, the shopping center must have more than 1,500 m2 retail space.
Source: NRI based on data from the Council of Shopping Centers’ “SC White Book”
Retail Property Market
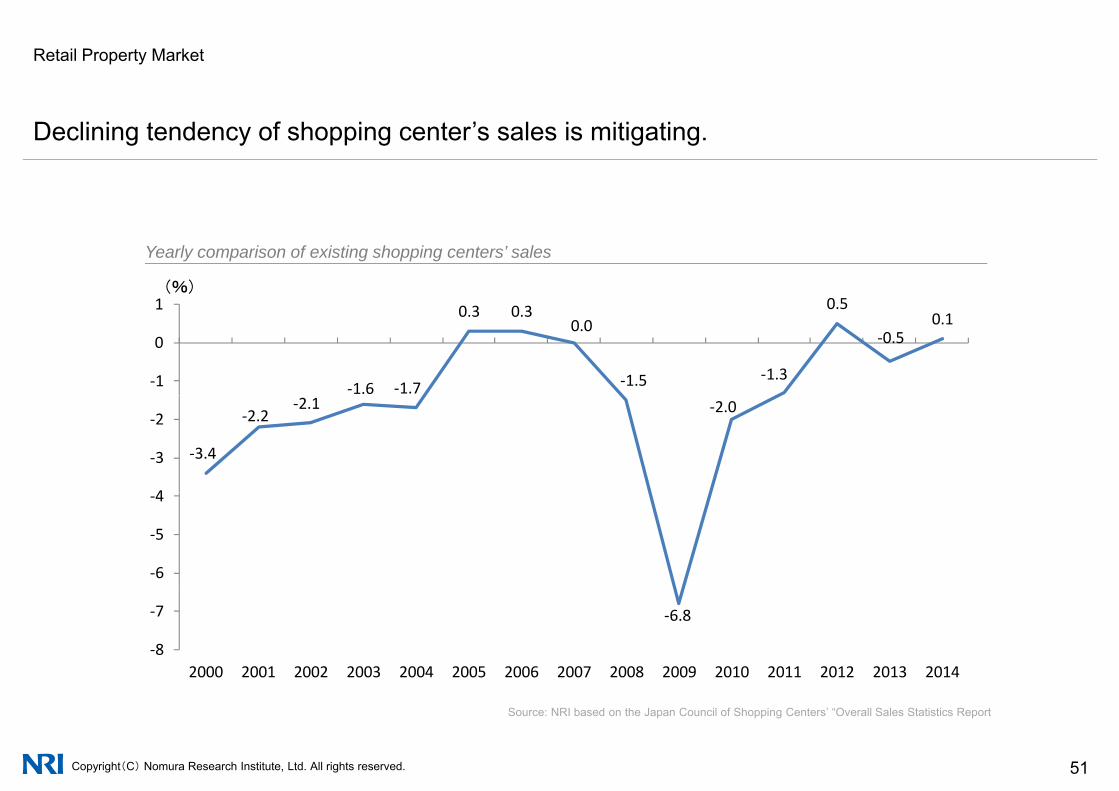
Declining tendency of shopping center’s sales is mitigating.
0 51(%)
Yearly comparison of existing shopping centers’ sales
‐1.6 ‐1.7
0.3 0.30.0
‐1.5 ‐1.3
0.5
‐0.50.1
‐1
0
1
‐3.4
‐2.2‐2.1 ‐2.0
4
‐3
‐2
‐6
‐5
‐4
‐6.8
‐8
‐7
2000 2001 2002 2003 2004 2005 2006 2007 2008 2009 2010 2011 2012 2013 2014
Copyright(C) Nomura Research Institute, Ltd. All rights reserved. 51
Source: NRI based on the Japan Council of Shopping Centers’ “Overall Sales Statistics Report
Retail Property Market
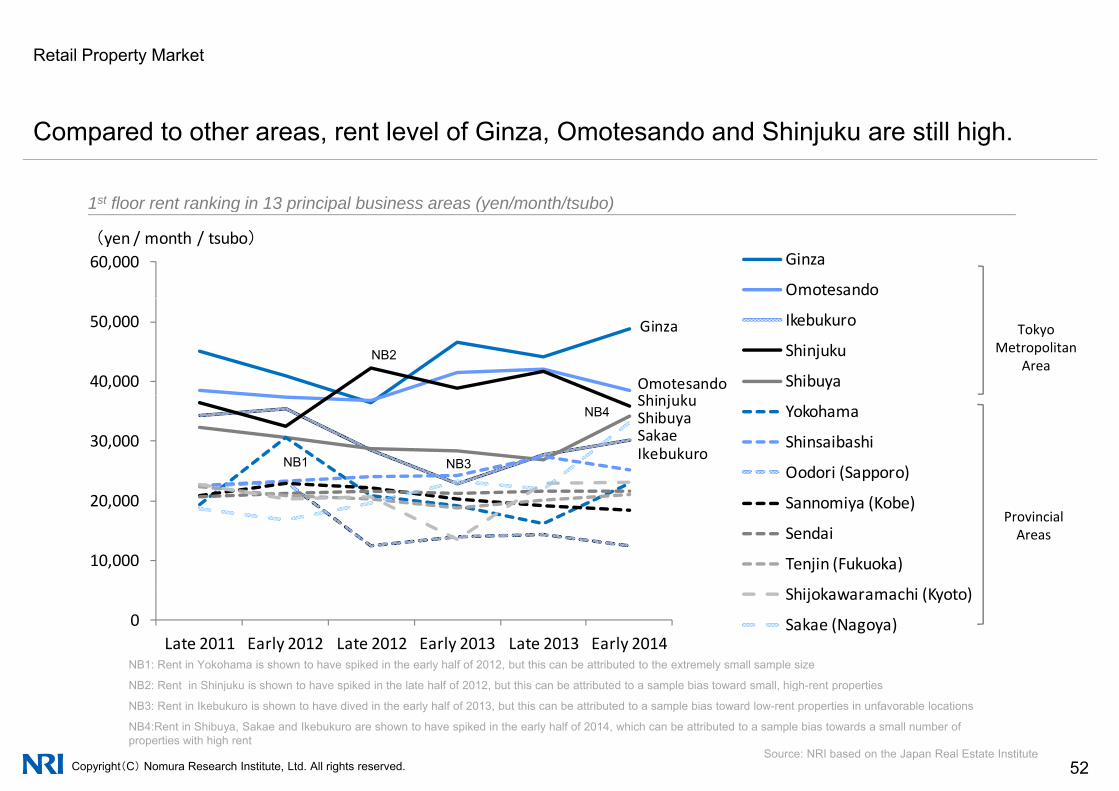
Compared to other areas, rent level of Ginza, Omotesando and Shinjuku are still high.
1st floor rent ranking in 13 principal business areas (yen/month/tsubo)
60,000 Ginza
Omotesando
(yen / month / tsubo)
1st floor rent ranking in 13 principal business areas (yen/month/tsubo)
40,000
50,000 Ikebukuro
Shinjuku
Shibuya
Ginza
OmotesandoShi j k
NB2
Tokyo Metropolitan
Area
30,000
Yokohama
Shinsaibashi
Oodori (Sapporo)
ShinjukuShibuyaSakaeIkebukuroNB1 NB3
NB4
10,000
20,000 Sannomiya (Kobe)
Sendai
Tenjin (Fukuoka)
Shij k hi (K )
Provincial Areas
0Late 2011 Early 2012 Late 2012 Early 2013 Late 2013 Early 2014
Shijokawaramachi (Kyoto)
Sakae (Nagoya)
NB1: Rent in Yokohama is shown to have spiked in the early half of 2012, but this can be attributed to the extremely small sample size
NB2: Rent in Shinjuku is shown to have spiked in the late half of 2012 but this can be attributed to a sample bias toward small high-rent properties
Copyright(C) Nomura Research Institute, Ltd. All rights reserved. 52
NB2: Rent in Shinjuku is shown to have spiked in the late half of 2012, but this can be attributed to a sample bias toward small, high-rent properties
NB3: Rent in Ikebukuro is shown to have dived in the early half of 2013, but this can be attributed to a sample bias toward low-rent properties in unfavorable locations
NB4:Rent in Shibuya, Sakae and Ikebukuro are shown to have spiked in the early half of 2014, which can be attributed to a sample bias towards a small number of properties with high rent
Source: NRI based on the Japan Real Estate Institute

Retail Property Market
Cap rates have been falling since 2011 In the Tokyo Metropolitan Area cap rates areCap rates have been falling since 2011. In the Tokyo Metropolitan Area, cap rates are approaching the all-time low.
8.0%
Commercial establishment cap rates (expected yield)
5.0%
6.0%
7.0% Suburban, Nagoya
Metropolitan , Metropolitan, Osaka
Suburnban, TokyoSuburban, Osaka
2 0%
3.0%
4.0% Metropolitan , GinzaMetropolitan , Omotesando
0.0%
1.0%
2.0%NB:Metropolitan high-class specialty stores:
Length of time after construction -or- large-scale repair/improvement: less than 5 years
Tenants: Mainly retailers of high-class brands.Rent system: Mainly fixed-term, variable rental schemes based on theRent system: Mainly fixed term, variable rental schemes based on the
revenue.Areas: Along Chuodoori in Ginza’s Chuo district.
Along Omotesando in Omotesando’s Shibuya district.
Suburban shopping centers:Sales floor area: around 20,000m2
Key tenants: Prominent general merchandise stores (GMS)R t t M i l fi d t fi d h t l h
Copyright(C) Nomura Research Institute, Ltd. All rights reserved. 53Source: NRI based on the Japan Real Estate Institute’s “Real Estate Investor’s Survey”
Rent system: Mainly fixed-term, fixed-charge rental schemesAreas: 1-hour Shinkansen ride along key stations to Tokyo’s Metropolitan
District
Stores for areas outside Tokyo follow similar locational conditions as above.

Retail Property Market
Accessibility and density level of commercial facilities are the important factors in selecting
In evaluating a commercial district the most heavily considered factor is its accessibility (i e inter-district factors) followed by
Accessibility and density level of commercial facilities are the important factors in selecting locations.
In evaluating a commercial district, the most heavily considered factor is its accessibility (i.e. inter-district factors), followed by quantitative aspects such as choice of items/services and number of shops/facilities within a district.
Intra-district factors are also regarded important (i.e. mobility between shops/facilities). On the other hand, exclusivity of a district is not heavily considered (i.e. presence of shops/facilities exclusive to the location, lack of similar shops/facilities around home/work).
Important Factors in Selecting Commercial Districts by General Consumers (in Metropolitan Area)
42%
22%
41%
49%
12%
21%
5%
7%
0% 20% 40% 60% 80% 100%
交通アクセスがしやすい
商品やサービスなどの選択肢が豊富である
The most heavily considered factor High accessibility
Abundant choice of items/services Quantitative aspects of
Important Factors in Selecting Commercial Districts by General Consumers (in Metropolitan Area)
22%
20%
19%
18%
49%
48%
48%
45%
21%
24%
24%
25%
7%
9%
9%
12%
商品やサ などの選択肢が豊富である
店舗や施設の数が多い
様々な用途の店舗や施設がある
店舗や施設間の回遊がしやすい
地域 かな 店舗 施設がある
Ample shops/facilities
Wide variety of shops/facilities
High mobility between shops/facilities
Sh /f iliti l i t th l ti
Quantitative aspects of shops/facilities are considered important
16%
14%
12%
11%
42%
36%
33%
35%
28%
32%
33%
32%
14%
18%
23%
23%
その地域にしかない店舗や施設がある
公園などの休憩エリアが十分にある
自宅や就業地に近接している
自宅や就業地に同様の店舗や施設がない
Shops/facilities exclusive to the location
Bountiful resting spaces
Proximity from home/work
Lack of similar shops/facilities around home/work
Exclusivity of a district is not heavily considered
8%
7%
6%
5%
30%
26%
24%
20%
31%
34%
33%
31%
31%
33%
37%
44%
様々な年齢や職業の人が来訪している
イベントなどが数多く開催されている
企業が集積している
店舗や施設の入替や更新が多い
Presence of visitors from various occupations and age groups
High frequency of events
High density of companies
High frequency of realignment of shops/facilities
Questionnaire name:Investigation about integrated areaPractitioner:NRI
Copyright(C) Nomura Research Institute, Ltd. All rights reserved. 54
5% 20% 31% 44%店舗や施設の入替や更新が多い
とても重要である 重要である やや重要である 重要でないn=41,273 Very important Important Slightly important Not important
High frequency of realignment of shops/facilities Practitioner:NRIPeriod of time:July 2014~
August2014

Retail Property Market
Large scale development of commercial buildings will proceed mainly around Tokyo station.
Total store area of commercial buildings in metropolitanTokyo
(1,000m2)
100%350
60%
80%
200
250
300
6%15%
24%
7%0%
34%
8%
36%
20%
40%
50
100
150Total area(Future plan)
Total area(Existing)
New store rate
0%0%0
Shinjuku(W
est)
Shibuya
・Marun
iouchi
urakucho
Ginza
Shinjuku(W
est)
nbashi・
Yaesu
・Kyob
ashi
・Omotesando
Ropp
ongi
NB)
S
Otemachi
・Y u S
Nihon ・
Aoyama
Copyright(C) Nomura Research Institute, Ltd. All rights reserved. 55Source:NRI based on the Sangyo-Times ”Commercial Facilities Schedule Guide”, Toyo Keizai Shinposha “National Supermarket Guide 2015”
Total area(Existing) includes department stores and specialty stores. Data as of May 2014 Total area(Future plan) is calculated via following formula: Total area(Future plan) = Site area × Floor area rate ×Commercial building rate × Shop floor rate Note that the above-calculation is based on a presupposition that floor area rate, commercial building rate and shop floor rate to be 700%, 20% and 60%, respectively.

Japan Japanese Real Estate Investment Market
1 Population Movements in Japan
2 Macro Fundamentals of Japan2 Macro Fundamentals of Japan
3 Overview of Real Estate Investment Market in Japan
4 Office Market
5 Residential Market
6 Retail Property Market
7 Logistics Property Market
8 Real Estate Investment Products
Copyright(C) Nomura Research Institute, Ltd. All rights reserved. 56

Logistics Property Market
The truck-based transport volume (in tons) which forms the bedrock of Japan’s cargoThe truck based transport volume (in tons), which forms the bedrock of Japan s cargo industry, has continued to decline in recent years.
Truck-based (automobile) transport is the primary transport method that constitutes a large share of Japan’s freight traffic
Cargo quantity by transport method (FY2012) Automobile cargo quantity movement
Truck-based (automobile) transport is the primary transport method that constitutes a large share of Japan s freight traffic. In recent years, the volume of cargo transported via automobile has declined due to the downturn in the quantity of trucks sold for
private use.
Ca go qua t ty by t a spo t et od ( 0 ) g q y
6 000
7,000 Business Personal(1 million tons)
Coastwise vessels 366,8%
Domestic aviation 1,0%
Railways
Unit: 1 million tons
4,000
5,000
6,000Railways42,1%
2,000
3,000
4,000
Motor vehicles 4,366,91%
0
1,000
,4,366,91%
Copyright(C) Nomura Research Institute, Ltd. All rights reserved. 57
NB: The chronological continuity of data from prior to 2009 could not be guaranteed due to thechanges made to the in tallying methodology in the middle of 2010.
Source: NRI based on the Ministry of Affairs’ “Transport quantity by transport method” and the Ministry of Land, Infrastructure, Transport and Tourism’s “Automobile Transport Statistics Survey”
'60 '65 '70 '75 '80 '85 '90 '95 '97 '99 '01 '03 '05 '07 '09 '11 '13

Logistics Property Market
As the movement to smaller logistics lots progresses the quantity distributed in such lotsAs the movement to smaller logistics lots progresses, the quantity distributed in such lots appears to be in upward trend based on the number of instances.
As the movement to smaller logistics lots progresses across the whole industry the quantity distributed has increased to a yearly rate of As the movement to smaller logistics lots progresses across the whole industry, the quantity distributed has increased to a yearly rate of 4.0% based on the number of reported instances.
The increased quantity of distribution in warehouses is remarkably high. This increase is propelled by the increase in distribution quantity using small lots that are less than 0.1 tons.
Industry-wide (except warehousing) distribution quantity by lot size(unit: number of instances)
Warehousing distribution quantity per lot size(number of instances)
0 500 1,000 1,500 2,000 (thousandi t )
Below 0.1t 0.1~0.5t 0.5~1t 1~5t Above 5t0 5,000 10,000 15,000 20,000 25,000 (thousand
instances)
Below 0.1t 0.1~0.5t 0.5~1t 1~5t Above 5t
CAGR
46.4%2000
instances)
64.4%2000
instances)
CAGR4.5% CAGR
7.3%
59.2%2005 69.2%2005
CAGR3.7%
CAGR12.6%
72 4%201075.3%2010
Copyright(C) Nomura Research Institute, Ltd. All rights reserved. 58Source: NRI based on the Ministry of Land, Infrastructure, Transport and Tourism’s “Logistics Census”
72.4%2010
Logistics Property Market
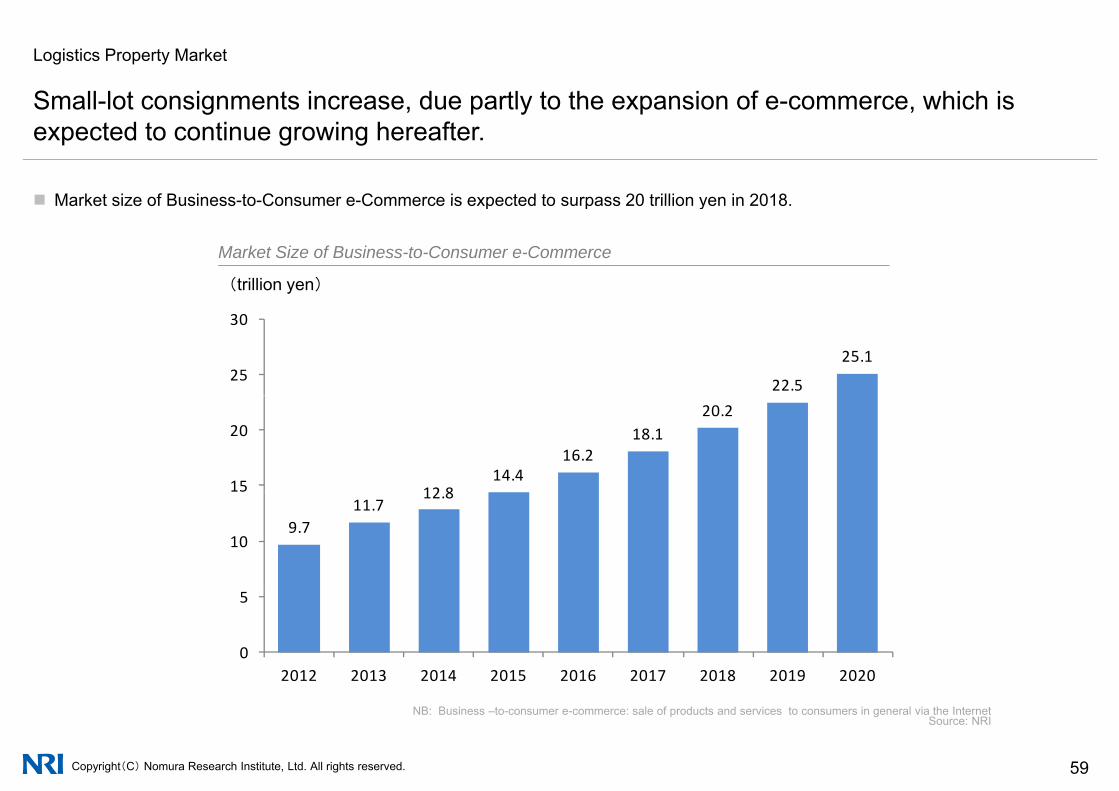
Small-lot consignments increase due partly to the expansion of e-commerce which isSmall lot consignments increase, due partly to the expansion of e commerce, which is expected to continue growing hereafter.
Market size of Business-to-Consumer e-Commerce is expected to surpass 20 trillion yen in 2018
(兆円)
Market Size of Business-to-Consumer e-Commerce
Market size of Business-to-Consumer e-Commerce is expected to surpass 20 trillion yen in 2018.
(trillion yen)
22.5
25.125
30
12 814.4
16.218.1
20.2
15
20
9.711.7
12.8
10
0
5
2012 2013 2014 2015 2016 2017 2018 2019 2020
Copyright(C) Nomura Research Institute, Ltd. All rights reserved. 59
NB: Business –to-consumer e-commerce: sale of products and services to consumers in general via the InternetSource: NRI
Logistics Property Market
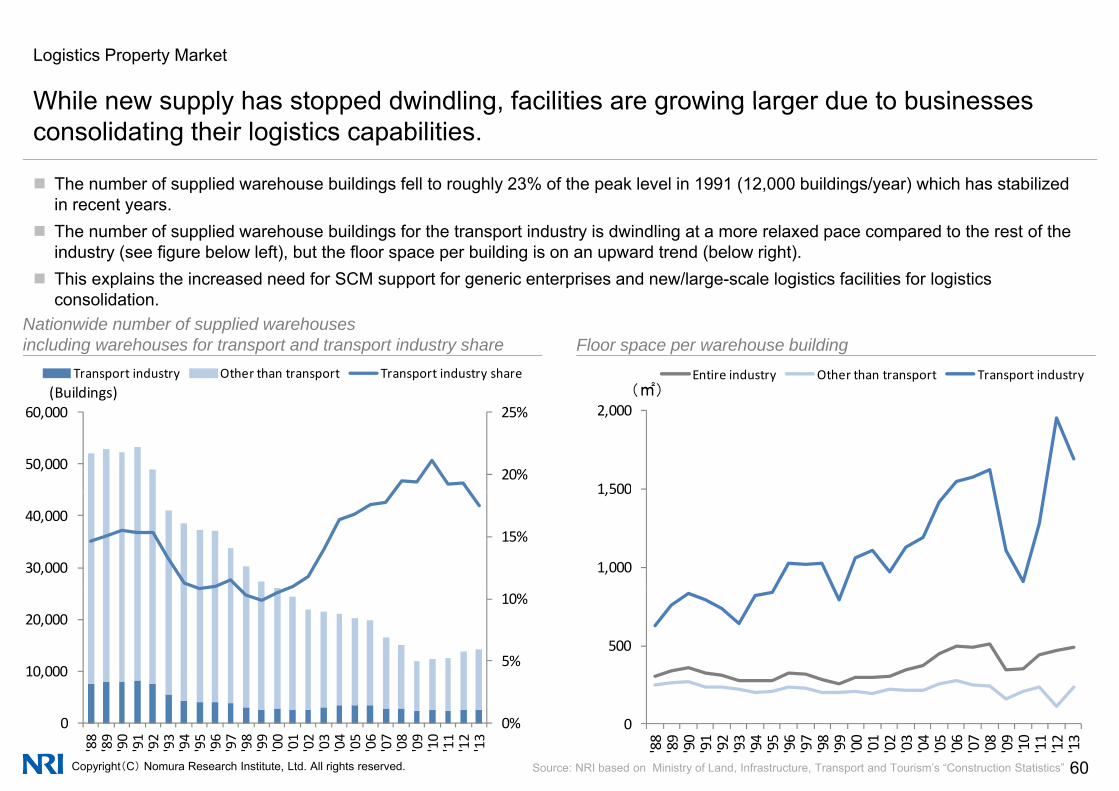
While new supply has stopped dwindling facilities are growing larger due to businessesWhile new supply has stopped dwindling, facilities are growing larger due to businesses consolidating their logistics capabilities.
The number of supplied warehouse buildings fell to roughly 23% of the peak level in 1991 (12,000 buildings/year) which has stabilized in recent yearsin recent years.
The number of supplied warehouse buildings for the transport industry is dwindling at a more relaxed pace compared to the rest of the industry (see figure below left), but the floor space per building is on an upward trend (below right).
This explains the increased need for SCM support for generic enterprises and new/large-scale logistics facilities for logistics consolidation
(㎡)Entire industry Other than transport Transport industry
(Buildings)Transport industry Other than transport Transport industry share
Nationwide number of supplied warehouses including warehouses for transport and transport industry share Floor space per warehouse building
consolidation.
1,500
2,000(㎡)
20%
25%
50,000
60,000(Buildings)
1,000
1,500
15%
30,000
40,000
5005%
10%
10,000
20,000
Copyright(C) Nomura Research Institute, Ltd. All rights reserved. 60
0
'88
'89
'90
'91
'92
'93
'94
'95
'96
'97
'98
'99
'00
'01
'02
'03
'04
'05
'06
'07
'08
'09
'10
'11
'12
'13
0%0
'88
'89
'90
'91
'92
'93
'94
'95
'96
'97
'98
'99
'00
'01
'02
'03
'04
'05
'06
'07
'08
'09
'10
'11
'12
'13
Source: NRI based on Ministry of Land, Infrastructure, Transport and Tourism’s “Construction Statistics”

Logistics Property Market
Development of logistics real estate which had been shrinking since the Lehman shock isDevelopment of logistics real estate, which had been shrinking since the Lehman shock, is now back in full swing.
600(1 billion yen) Real estate industry Transport industry Others
Order volume for construction of warehouses/logistics facilities by ordering industry
500
600
300
400
100
200
0
100
2000 2001 2002 2003 2004 2005 2006 2007 2008 2009 2010 2011 2012 2013 2014
Copyright(C) Nomura Research Institute, Ltd. All rights reserved. 61
Note: Only contracts worth 5 billion yen above are includedSource: NRI based on Ministry of Land, Infrastructure, Transport and Tourism’s “Construction Order Trends, Statistics and Survey”
Logistics Property Market
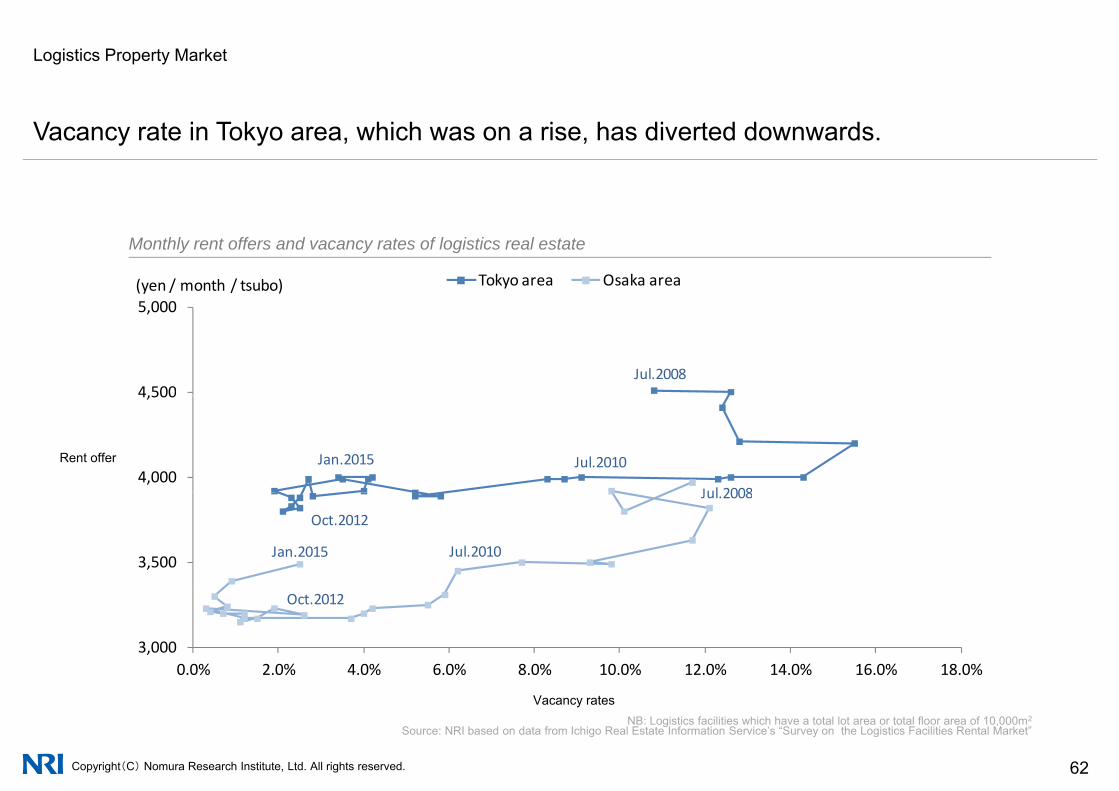
Vacancy rate in Tokyo area, which was on a rise, has diverted downwards.
Monthly rent offers and vacancy rates of logistics real estate
(yen / month / tsubo) Tokyo area Osaka area
Jul.20084,500
5,000
Rent offer Jul.2010Jan.2015
Jul 20084,000
4,500
Oct.2012
Jul.2008
Jul.2010Jan.20153,500
Oct.2012
3,0000.0% 2.0% 4.0% 6.0% 8.0% 10.0% 12.0% 14.0% 16.0% 18.0%
Copyright(C) Nomura Research Institute, Ltd. All rights reserved. 62
NB: Logistics facilities which have a total lot area or total floor area of 10,000m2
Source: NRI based on data from Ichigo Real Estate Information Service’s “Survey on the Logistics Facilities Rental Market”
Vacancy rates
Logistics Property Market
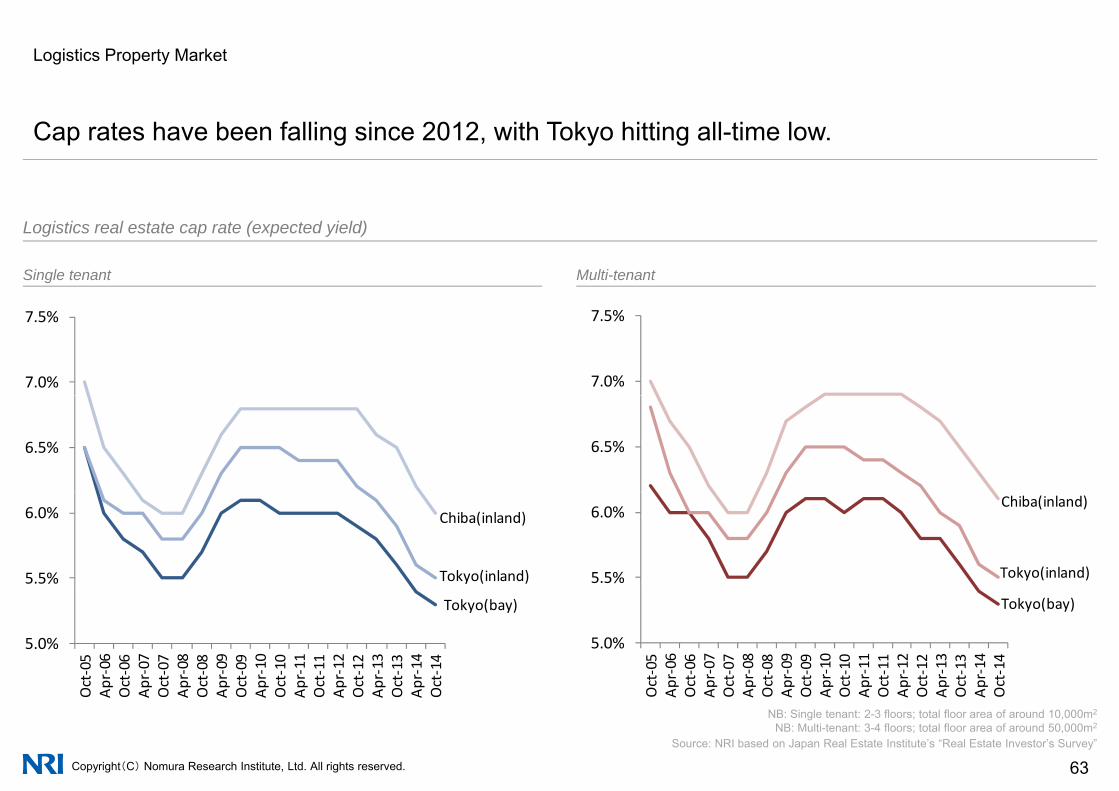
Cap rates have been falling since 2012, with Tokyo hitting all-time low.
Single tenant Multi-tenant
Logistics real estate cap rate (expected yield)
7.0%
7.5%
7.0%
7.5%
6.5%6.5%
5.5%
6.0%
5.5%
6.0%
Tokyo(inland)
Chiba(inland)
Tokyo(inland)
Chiba(inland)
5.0%ct‐05
pr‐06
ct‐06
pr‐07
ct‐07
pr‐08
ct‐08
pr‐09
ct‐09
pr‐10
ct‐10
pr‐11
ct‐11
pr‐12
ct‐12
pr‐13
ct‐13
pr‐14
ct‐14
5.0%
ct‐05
pr‐06
ct‐06
pr‐07
ct‐07
pr‐08
ct‐08
pr‐09
ct‐09
pr‐10
ct‐10
pr‐11
ct‐11
pr‐12
ct‐12
pr‐13
ct‐13
pr‐14
ct‐14
Tokyo(bay) Tokyo(bay)
Copyright(C) Nomura Research Institute, Ltd. All rights reserved. 63
O Ap O A p O Ap O A p O Ap O A p O Ap O A p O Ap OOc
Ap Oc
Ap Oc
Ap Oc
Ap Oc
Ap Oc
Ap Oc
Ap Oc
Ap Oc
Ap Oc
NB: Single tenant: 2-3 floors; total floor area of around 10,000m2
NB: Multi-tenant: 3-4 floors; total floor area of around 50,000m2
Source: NRI based on Japan Real Estate Institute’s “Real Estate Investor’s Survey”
Japan Japanese Real Estate Investment Market
1 Population Movements in Japan
2 Macro Fundamentals of Japan2 Macro Fundamentals of Japan
3 Overview of Real Estate Investment Market in Japan
4 Office Market
5 Residential Market
6 Retail Property Market
7 Logistics Property Market
8 Real Estate Investment Products
Copyright(C) Nomura Research Institute, Ltd. All rights reserved. 64

Real Estate Investment Instruments
An overall perspective of the Japanese real estate market
Unlisted open-ended private REITs was offered in November 2010, and the size of private REITs market is growing rapidly.
20(¥tn)
Overview of the Real Estate Investment Instruments in Japan
12.7
15.1 14.4
12
16
0.9 0 4
4
8
0.4 0
Listed REIT Private Fund Private REIT RMBS CMBS
Equity Type Debt TypeEquity Type Debt Type
Listed Unlisted
Close-Ended Open-ended
ResidentialMortgage
CommercialMortgage
Copyright(C) Nomura Research Institute, Ltd. All rights reserved. 65
NB: Listed REIT figure is updated as of end of Jan 2015, private fund figure is updated as of end of Dec 2014, unlisted REIT is an estimated figure as of end of Oct 2014, RMBS/CMBS figure is updated as of end of Sept 2014.
Source: NRI based on the Association for Real Estate Securitization, Sumitomo Mitsui Trust Research Institute Co., Ltd., and the Japan Securities Dealers Association
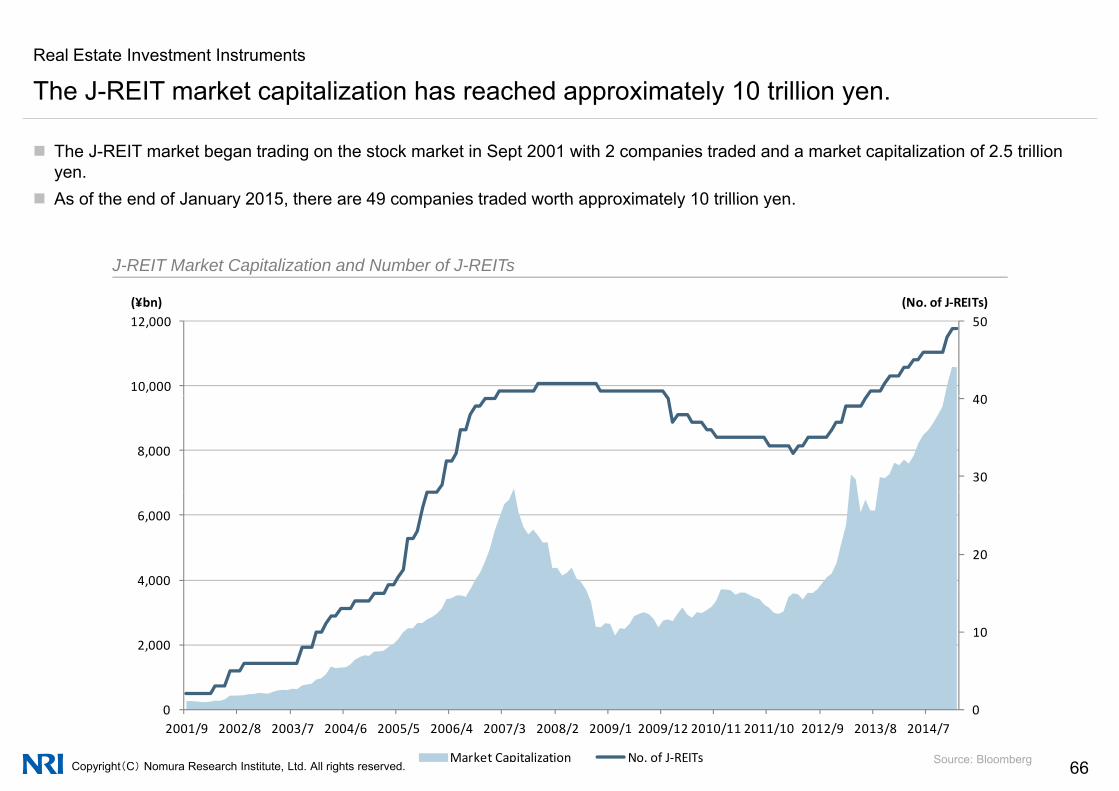
Real Estate Investment Instruments
The J-REIT market capitalization has reached approximately 10 trillion yen.
The J-REIT market began trading on the stock market in Sept 2001 with 2 companies traded and a market capitalization of 2.5 trillion yen.
As of the end of January 2015 there are 49 companies traded worth approximately 10 trillion yen
y y
(N f J REIT )(¥b )
As of the end of January 2015, there are 49 companies traded worth approximately 10 trillion yen.
J-REIT Market Capitalization and Number of J-REITs
40
50
10,000
12,000(No. of J‐REITs)(¥bn)
30
40
8,000
20
4,000
6,000
102,000
Copyright(C) Nomura Research Institute, Ltd. All rights reserved. 66
002001/9 2002/8 2003/7 2004/6 2005/5 2006/4 2007/3 2008/2 2009/1 2009/12 2010/11 2011/10 2012/9 2013/8 2014/7
Market Capitalization No. of J‐REITs Source: Bloomberg

Real Estate Investment Instruments
Approximately 75% of J-REITs assets are located in the Tokyo Metropolitan Area and
Approximately 75% of real estate owned by J-REITs is in the Tokyo Metropolitan Area
Approximately 75% of J REITs assets are located in the Tokyo Metropolitan Area, and approximately 50% of J-REITs assets are office properties.
Approximately 75% of real estate owned by J-REITs is in the Tokyo Metropolitan Area. In recent years, J-REITs have become more diversified in type of property, and Healthcare REIT has started in November 2014.
Asset Mix of J-REITs by Area and Asset Class
Other Areas7.9% Logistics
Others3.8%
y
5 Central Wards of Tokyo
Kinki Area13.1%
Hotel3.3%
10.2%
37.8%Chubu Area4.2%
Office47.4%Retail
18.2%
Approx.12.7
trillion yen
Approx.12.7
trillion yen
23 Wards of Tokyo
Kanto Area18.9%
Residential%
Copyright(C) Nomura Research Institute, Ltd. All rights reserved. 67
Tokyo18.2% 17.0%Greater Tokyo Area
74.9%* As of the end of January 2015
Source: NRI based on ARES
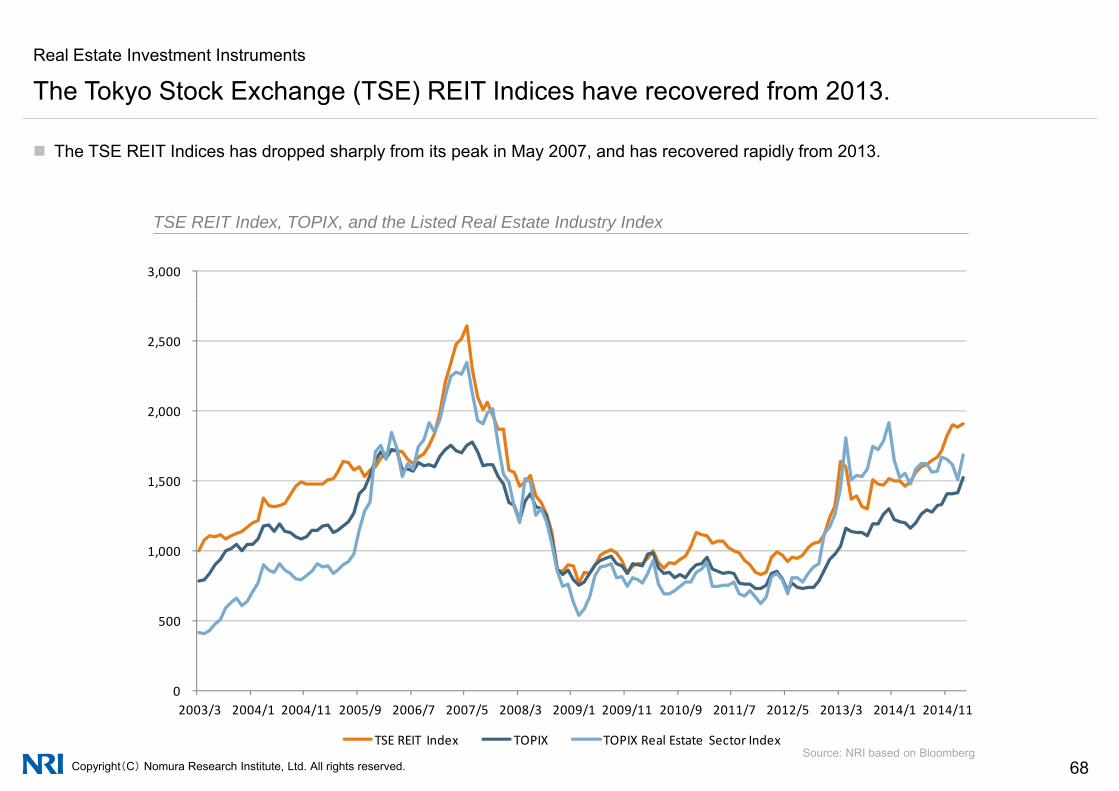
Real Estate Investment Instruments
The Tokyo Stock Exchange (TSE) REIT Indices have recovered from 2013.
The TSE REIT Indices has dropped sharply from its peak in May 2007, and has recovered rapidly from 2013.
y g ( )
3,000
TSE REIT Index, TOPIX, and the Listed Real Estate Industry Index
2,500
1,500
2,000
1,000
500
Copyright(C) Nomura Research Institute, Ltd. All rights reserved. 68
0 2003/3 2004/1 2004/11 2005/9 2006/7 2007/5 2008/3 2009/1 2009/11 2010/9 2011/7 2012/5 2013/3 2014/1 2014/11
TSE REIT Index TOPIX TOPIX Real Estate Sector IndexSource: NRI based on Bloomberg
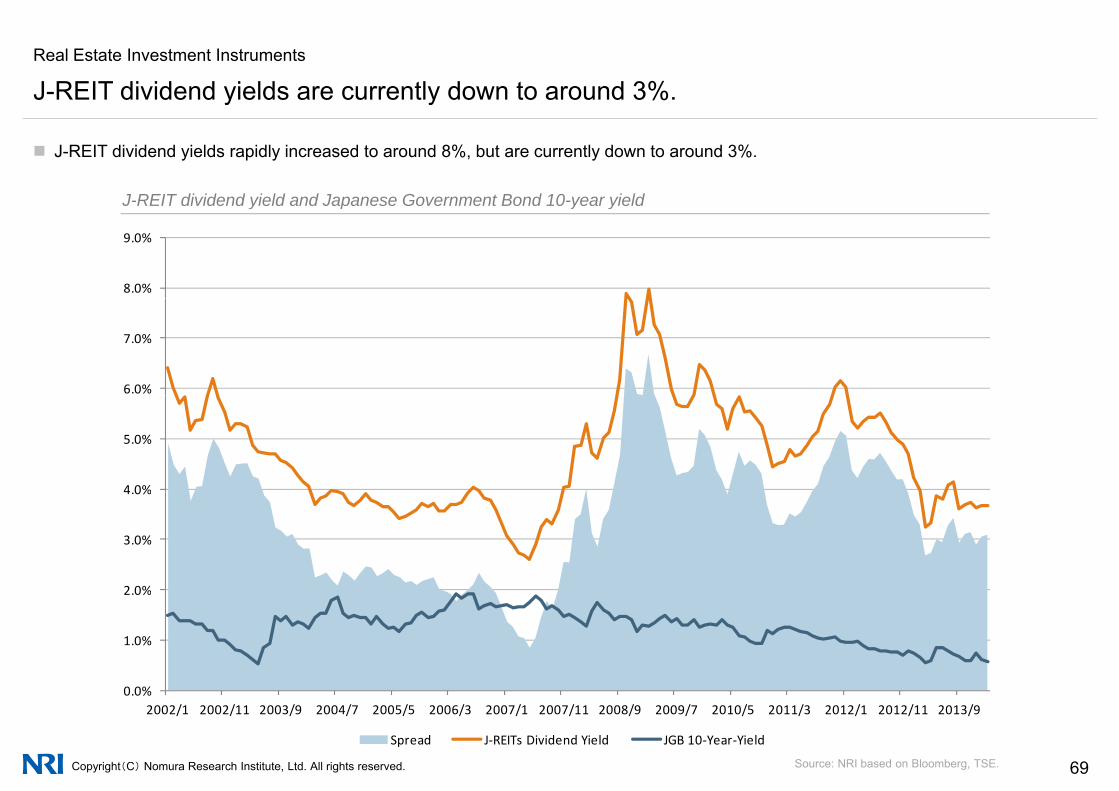
Real Estate Investment Instruments
J-REIT dividend yields are currently down to around 3%.
J-REIT dividend yields rapidly increased to around 8%, but are currently down to around 3%.
y y
J-REIT dividend yield and Japanese Government Bond 10-year yield
8.0%
9.0%
J-REIT dividend yield and Japanese Government Bond 10-year yield
6.0%
7.0%
4 0%
5.0%
2 0%
3.0%
4.0%
1.0%
2.0%
Copyright(C) Nomura Research Institute, Ltd. All rights reserved. 69
0.0%2002/1 2002/11 2003/9 2004/7 2005/5 2006/3 2007/1 2007/11 2008/9 2009/7 2010/5 2011/3 2012/1 2012/11 2013/9
Spread J‐REITs Dividend Yield JGB 10‐Year‐Yield
Source: NRI based on Bloomberg, TSE.
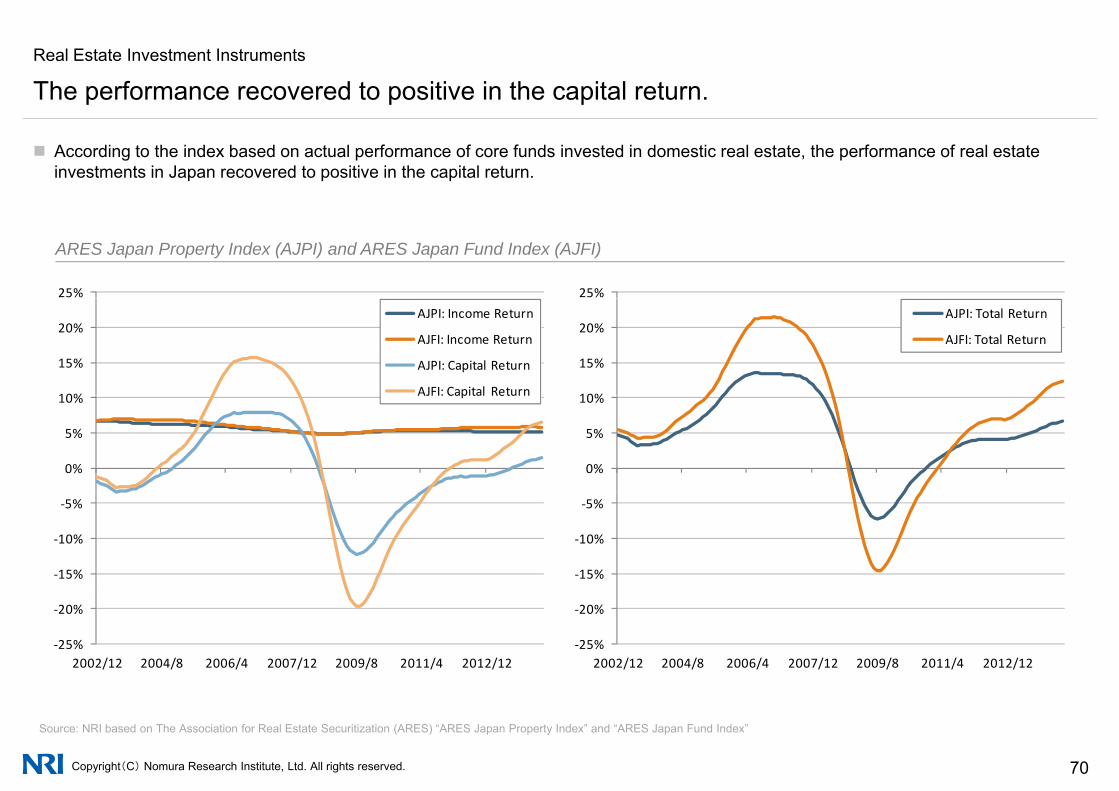
Real Estate Investment Instruments
The performance recovered to positive in the capital return.
According to the index based on actual performance of core funds invested in domestic real estate, the performance of real estate investments in Japan recovered to positive in the capital return.
25%
ARES Japan Property Index (AJPI) and ARES Japan Fund Index (AJFI)
25%
10%
15%
20%AJPI: Total Return
AJFI: Total Return
10%
15%
20%AJPI: Income Return
AJFI: Income Return
AJPI: Capital Return
AJFI: Capital Return
0%
5%
10%
0%
5%
10% AJFI: Capital Return
‐15%
‐10%
‐5%
‐15%
‐10%
‐5%
‐25%
‐20%
2002/12 2004/8 2006/4 2007/12 2009/8 2011/4 2012/12‐25%
‐20%
2002/12 2004/8 2006/4 2007/12 2009/8 2011/4 2012/12
Copyright(C) Nomura Research Institute, Ltd. All rights reserved. 70
Source: NRI based on The Association for Real Estate Securitization (ARES) “ARES Japan Property Index” and “ARES Japan Fund Index”
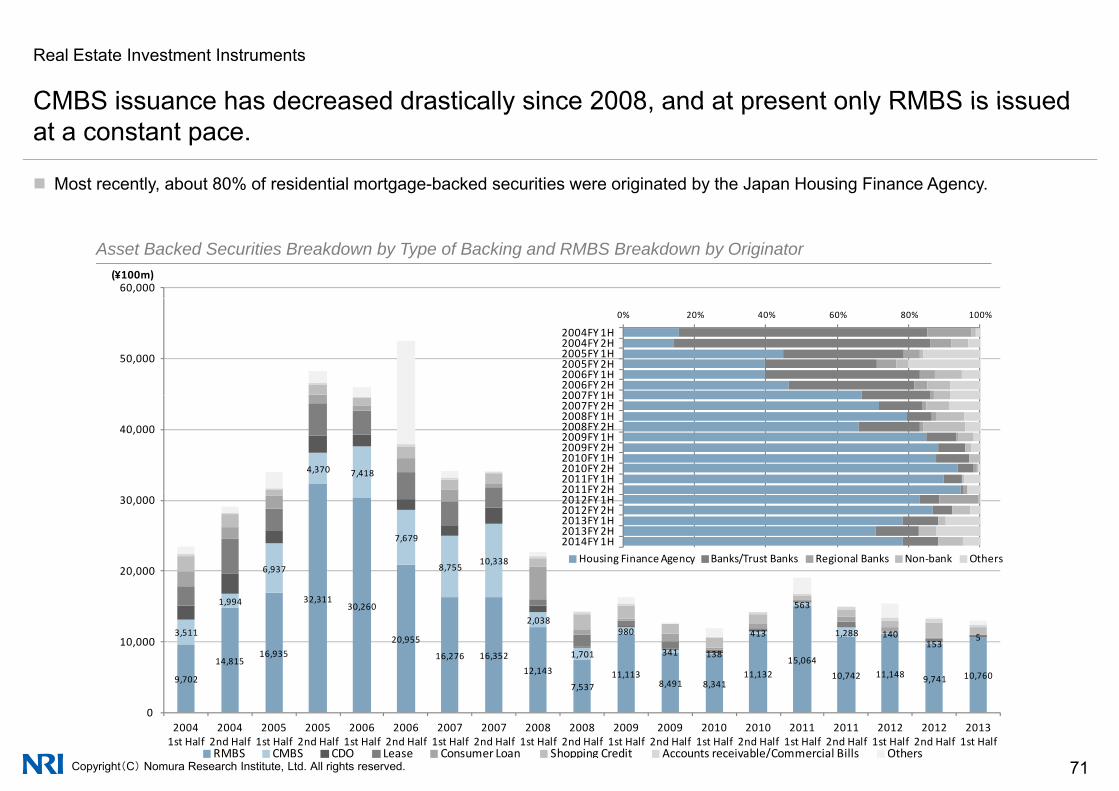
Real Estate Investment Instruments
CMBS issuance has decreased drastically since 2008 and at present only RMBS is issued
Most recently, about 80% of residential mortgage-backed securities were originated by the Japan Housing Finance Agency.
CMBS issuance has decreased drastically since 2008, and at present only RMBS is issued at a constant pace.
60,000(¥100m)
Asset Backed Securities Breakdown by Type of Backing and RMBS Breakdown by Originator
50,000
0% 20% 40% 60% 80% 100%
2004FY 1H2004FY 2H2005FY 1H2005FY 2H2006FY 1H2006FY 2H2007FY1H
4,370 7,418
40,000
2007FY 1H2007FY 2H2008FY 1H2008FY 2H2009FY 1H2009FY 2H2010FY 1H2010FY 2H2011FY 1H2011FY2H
6,937
7,679
8,75510,338
20,000
30,0002011FY 2H2012FY 1H2012FY 2H2013FY 1H2013FY 2H2014FY 1H
Housing Finance Agency Banks/Trust Banks Regional Banks Non‐bank Others
9,702
14,81516,935
32,31130,260
20,955
16,276 16,35212,143
7 53711,113
8,491 8 34111,132
15,064
10,742 11,148 9,741 10,760
3,511
1,994
2,038
1,701
980
341 138
413
563
1,288 140153
510,000
Copyright(C) Nomura Research Institute, Ltd. All rights reserved. 71
7,537 8,491 8,341
020041st Half
20042nd Half
20051st Half
20052nd Half
20061st Half
20062nd Half
20071st Half
20072nd Half
20081st Half
20082nd Half
20091st Half
20092nd Half
20101st Half
20102nd Half
20111st Half
20112nd Half
20121st Half
20122nd Half
20131st Half
RMBS CMBS CDO Lease Consumer Loan Shopping Credit Accounts receivable/Commercial Bills Others
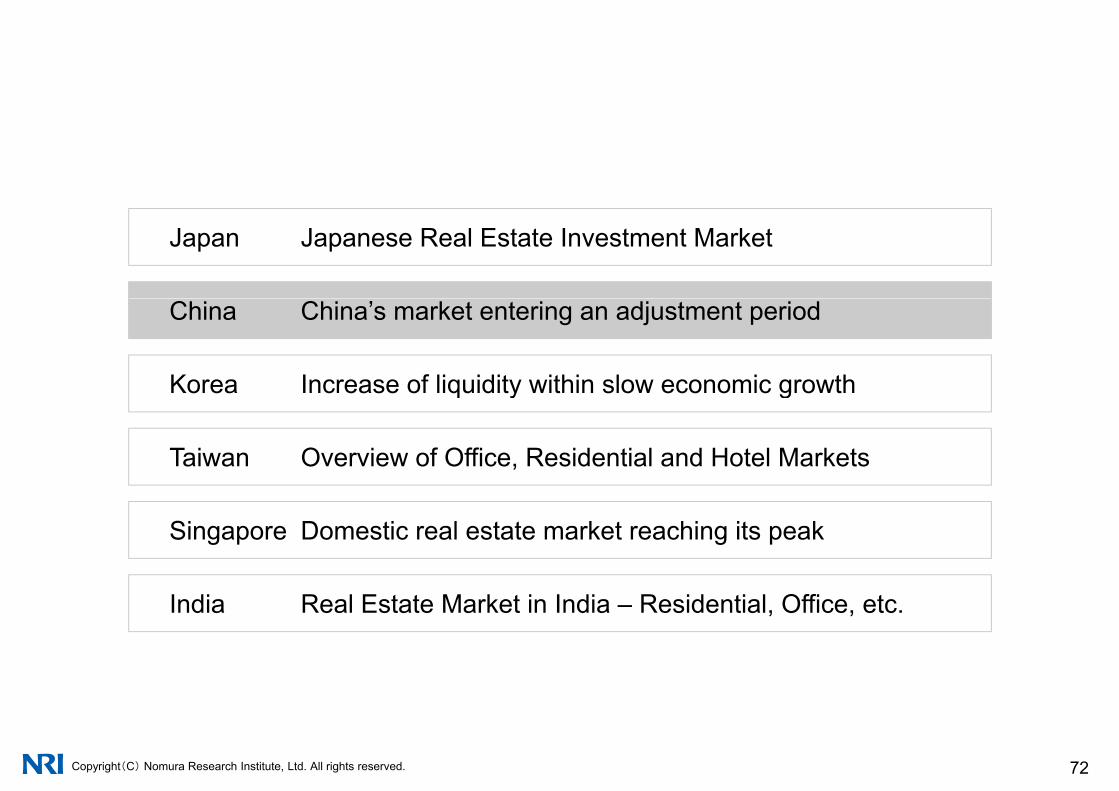
Japan Japanese Real Estate Investment Market
China China’s market entering an adjustment period
Korea Increase of liquidity within slow economic growthq y g
Taiwan Overview of Office, Residential and Hotel Markets
Singapore Domestic real estate market reaching its peak
India Real Estate Market in India – Residential, Office, etc.
Copyright(C) Nomura Research Institute, Ltd. All rights reserved. 72
China China’s market entering an adjustment period
1 Macro Economy and Real Estate Investment
2 China's Real Estate Investment
3 Residential Market
4 Commercial Development and Office Market
5 Movements of Chinese Real Estate Developers
Copyright(C) Nomura Research Institute, Ltd. All rights reserved. 73
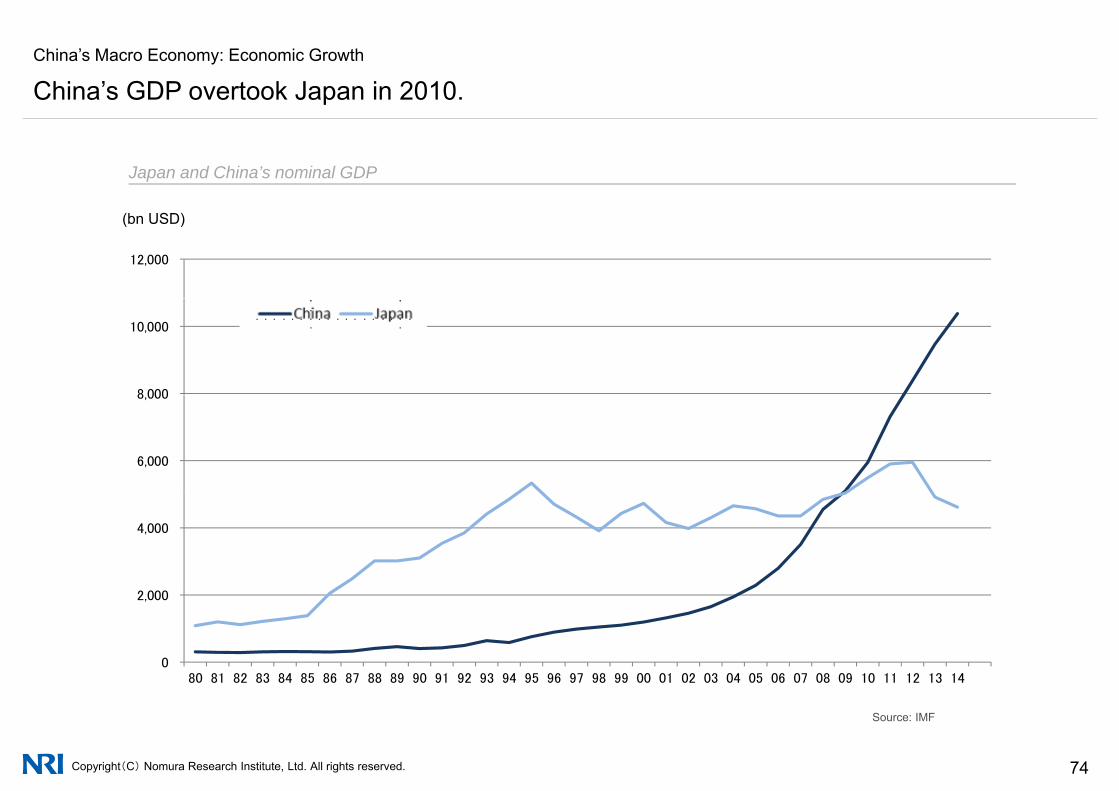
China’s Macro Economy: Economic Growth
China’s GDP overtook Japan in 2010.
Japan and China’s nominal GDP
(bn USD)
12,000
8 000
10,000中国 日本
6,000
8,000
4,000
0
2,000
80 81 82 83 84 85 86 87 88 89 90 91 92 93 94 95 96 97 98 99 00 01 02 03 04 05 06 07 08 09 10 11 12 13 14
Copyright(C) Nomura Research Institute, Ltd. All rights reserved. 74
Source: IMF
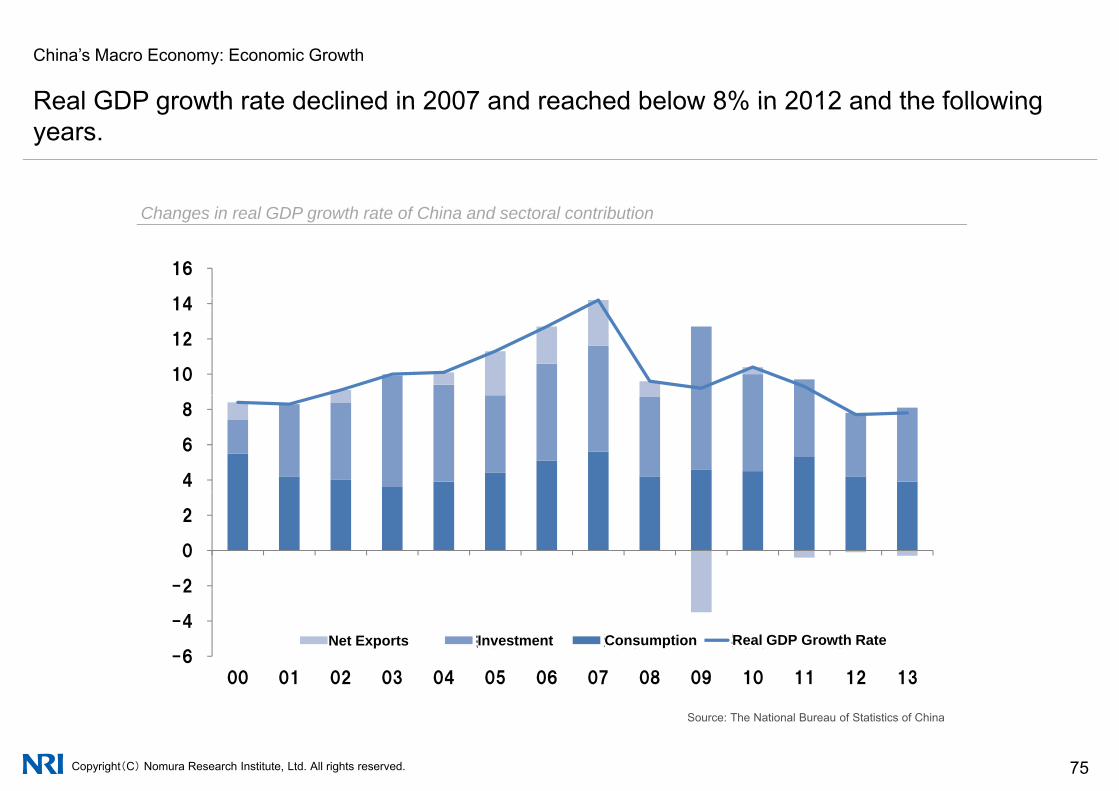
China’s Macro Economy: Economic Growth
Real GDP growth rate declined in 2007 and reached below 8% in 2012 and the followingReal GDP growth rate declined in 2007 and reached below 8% in 2012 and the following years.
14
16
Changes in real GDP growth rate of China and sectoral contribution
10
12
14
4
6
8
-2
0
2
-6
-4
2
00 01 02 03 04 05 06 07 08 09 10 11 12 13
純輸出 投資 消費 実質GDP成長率Net Exports Investment Consumption Real GDP Growth Rate
Copyright(C) Nomura Research Institute, Ltd. All rights reserved. 75
Source: The National Bureau of Statistics of China

China’s Macro Economy: Economic Growth
GDP per capita of Beijing Tianjin and Shanghai has reached the criteria set for high-GDP per capita of Beijing, Tianjin, and Shanghai has reached the criteria set for highincome nation, i.e. 12,616 USD.
GDP per capita (b pro ince/m nicipalit directl nder the central go ernment(2013)
120,000
(RMB)
GDP per capita (by province/municipality directly under the central government(2013)
80,000
100,000
High-income country: RMB 78,405
40,000
60,000
National average: RMB 41,908
0
20,000
京 津 北 西 ル 寧 林 江 海 蘇 江 徽 建 西 東 南 北 南 東 西 南 慶 南 ト 西 粛 海 夏 疆
北京
天津
河北
山西
内モ
ンゴ
ル
遼寧
吉林
黑龍
江
上海
江蘇
浙江
安徽
福建
江西
山東
河南
湖北
湖南
広東
広西
海南
重慶
四川
貴州
雲南
チベ
ット
陝西
甘粛
青海
寧夏
新疆
Copyright(C) Nomura Research Institute, Ltd. All rights reserved. 76Source: National Bureau of Statistics, China
Note: IMF definition of high-income country: GDP per capita ≥ USD 12,616 (about RMB 78,405 according to the rate on Friday, May 1, 2015)

China’s Macro Economy: Economic Growth
Tertiary industries has been growing with its contribution to GDP growth reaching approx 50% in 2014Tertiary industries has been growing with its contribution to GDP growth reaching approx. 50% in 2014. This growth became the main factor for increasing real estate investment in urban areas.
(100 mil Yuan)
Trends of Percentage of Tertiary Industryies Aaccounting for in GDP
Copyright(C) Nomura Research Institute, Ltd. All rights reserved. 77
Source) National Bureau of Statistics of China
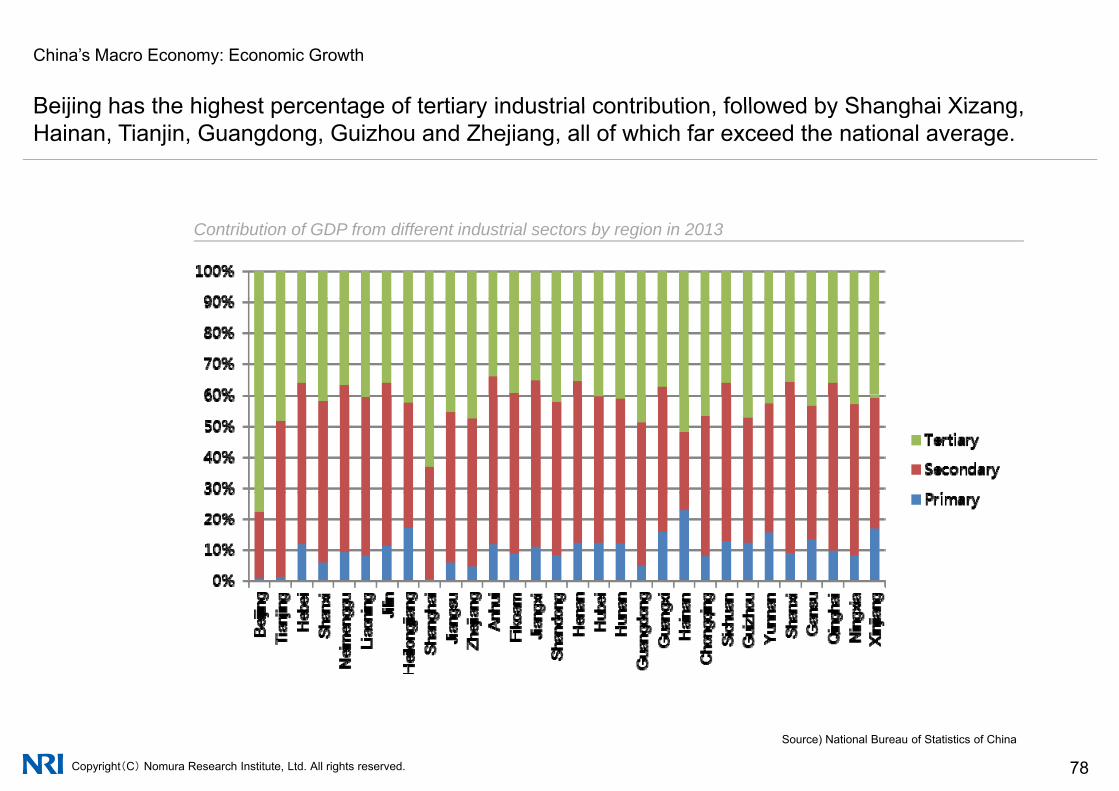
China’s Macro Economy: Economic Growth
Beijing has the highest percentage of tertiary industrial contribution followed by Shanghai XizangBeijing has the highest percentage of tertiary industrial contribution, followed by Shanghai Xizang, Hainan, Tianjin, Guangdong, Guizhou and Zhejiang, all of which far exceed the national average.
Contribution of GDP from different industrial sectors by region in 2013
Copyright(C) Nomura Research Institute, Ltd. All rights reserved. 78
Source) National Bureau of Statistics of China
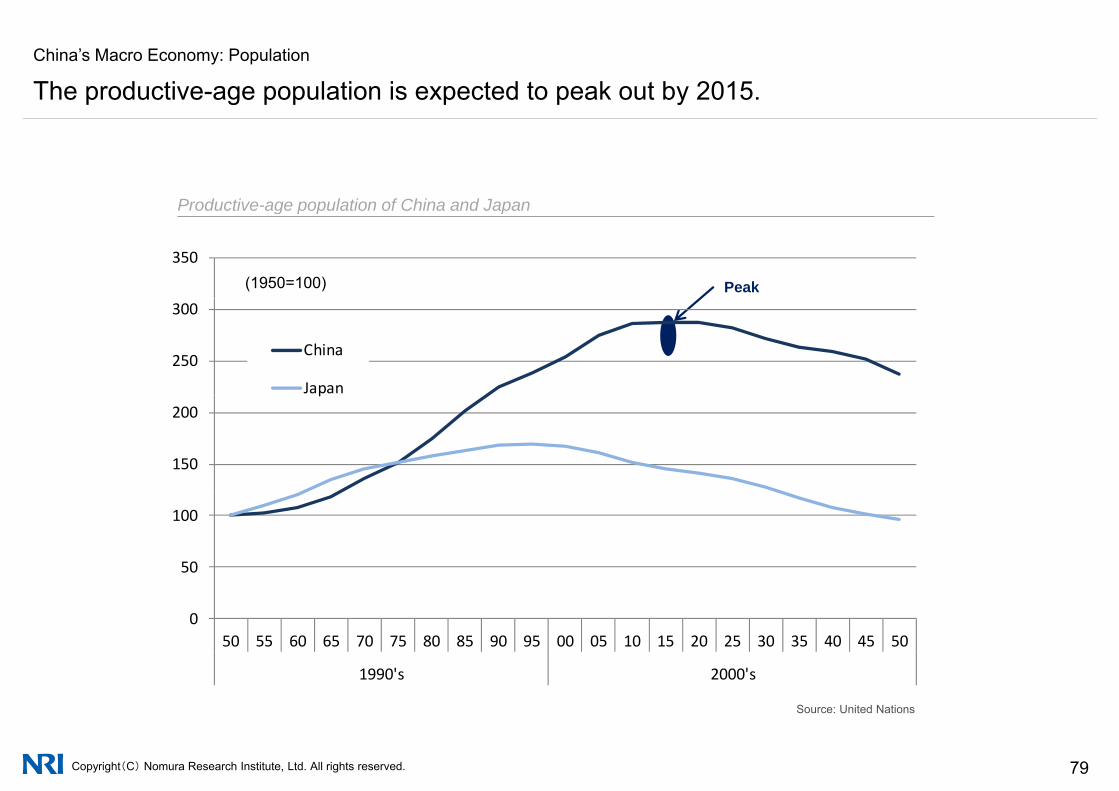
China’s Macro Economy: Population
The productive-age population is expected to peak out by 2015.g y
Prod cti e age pop lation of China and Japan
(1950=100) Peak
350
Productive-age population of China and Japan
250
300
China
Japan
150
200p
50
100
050 55 60 65 70 75 80 85 90 95 00 05 10 15 20 25 30 35 40 45 50
1990's 2000's
Copyright(C) Nomura Research Institute, Ltd. All rights reserved. 79
Source: United Nations

China's macro-economic environment: Demographic changesWhen demographic dividend of China disappears in 2015, the country has to face increased financial burden decrease of labor force consumption slump etc due to decreased proportion of young
After 2015, when it is estimated China's demographic dividend disappears, the government has to face increased financial burden, decrease of labor force consumption slump and other problems due to declining birthrate and aging population
burden, decrease of labor force, consumption slump, etc due to decreased proportion of young population and high population aging rate.
decrease of labor force, consumption slump and other problems due to declining birthrate and aging population. As a countermeasure, the government announced a policy that aims to ease the one-child policy at the end of December 2013.
• The one-child policy was implemented in China in 1979. To solve the problems of aging population and decrease in labor force, the government announced an easing policy, two-child policy, which allows couples to have one more child if any one of them is the only child in their parents family at the end of December 2013child in their parents family, at the end of December 2013.
• In 2014 and after announcement of the two-child policy by the central government, local governments of Beijing, Shanghai, and Guangdong province announced detailed regulations to "allow couples to have one more child if any one of them is the only child in their parents family" and started receiving applications for approval of birth of the second child.
• It is believed the two-child policy will be implemented throughout China in the future• It is believed the two-child policy will be implemented throughout China in the future.
(%) 45.0 30.0(%)
Change in proportion of young population (<15) Change in proportion of 65+ population
30.0
35.0
40.0
15 0
20.0
25.0
15.0
20.0
25.0
5.0
10.0
15.0
Copyright(C) Nomura Research Institute, Ltd. All rights reserved. 80
10.0
1950
1955
1960
1965
1970
1975
1980
1985
1990
1995
2000
2005
2010
2015
2020
2025
2030
2035
2040
2045
2050
0.0
1950
1955
1960
1965
1970
1975
1980
1985
1990
1995
2000
2005
2010
2015
2020
2025
2030
2035
2040
2045
2050
Source: UN World Population Prospects: The 2012 Revision
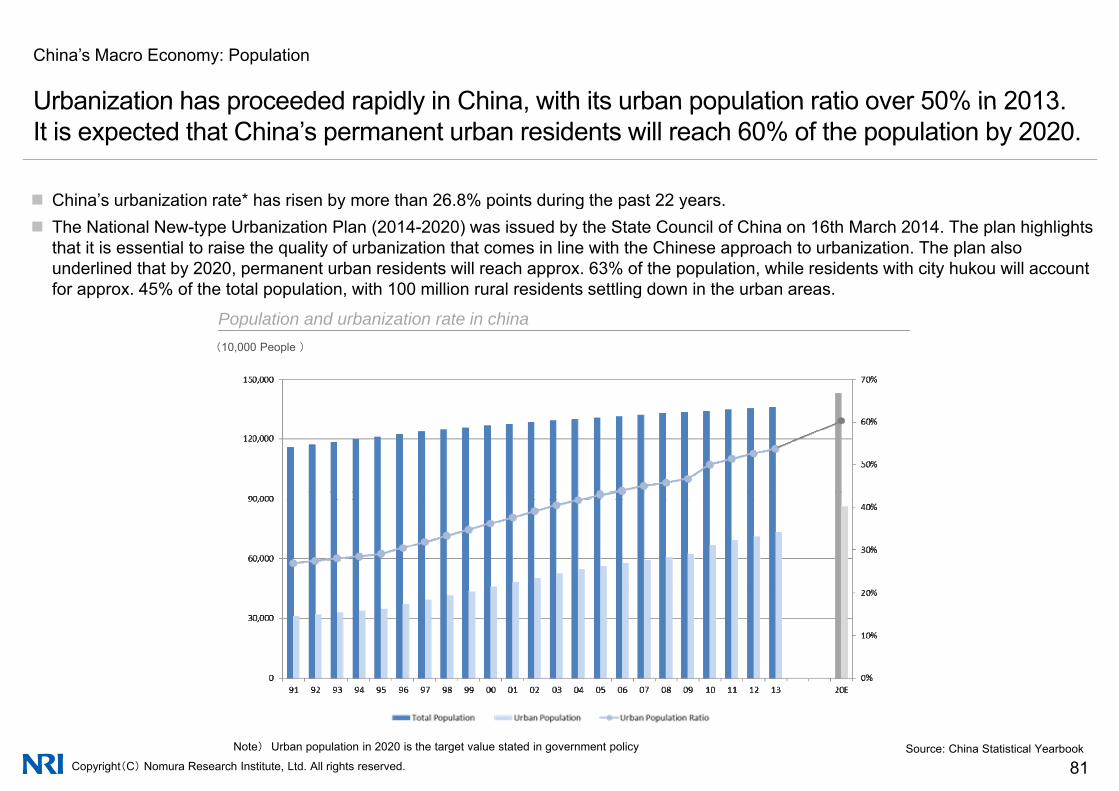
China’s Macro Economy: Population
Urbanization has proceeded rapidly in China with its urban population ratio over 50% in 2013
China’s urbanization rate* has risen by more than 26 8% points during the past 22 years
Urbanization has proceeded rapidly in China, with its urban population ratio over 50% in 2013.It is expected that China’s permanent urban residents will reach 60% of the population by 2020.
China s urbanization rate has risen by more than 26.8% points during the past 22 years. The National New-type Urbanization Plan (2014-2020) was issued by the State Council of China on 16th March 2014. The plan highlights
that it is essential to raise the quality of urbanization that comes in line with the Chinese approach to urbanization. The plan also underlined that by 2020, permanent urban residents will reach approx. 63% of the population, while residents with city hukou will account for approx. 45% of the total population, with 100 million rural residents settling down in the urban areas.
(10,000 People )
Population and urbanization rate in china
Copyright(C) Nomura Research Institute, Ltd. All rights reserved. 81Note) Urban population in 2020 is the target value stated in government policy Source: China Statistical Yearbook

China's macro-economic environment: Demographic changes
Urbanization is not only seen in coastal areas but also in Inner Mongolia Hubei ChongqingUrbanization is not only seen in coastal areas, but also in Inner Mongolia, Hubei, Chongqing and other cities in hinterland and northeastern China.
Urbanization rate of China by area (2013)
100 0%
70.0%
80.0%
90.0%
100.0%
30 0%
40.0%
50.0%
60.0% National average: 53.7%
0.0%
10.0%
20.0%
30.0%
京 津 北 西 ル 寧 林 江 海 蘇 江 徽 建 西 東 南 北 南 東 西 南 慶 川 州 南 ト 西 粛 海 夏 疆
北京
天津
河北
山西
内モ
ンゴ
ル遼
寧吉
林黑
龍江
上海
江蘇
浙江
安徽
福建
江西
山東
河南
湖北
湖南
広東
広西
海南
重慶
四川
貴州
雲南
チベ
ット
陝西
甘粛
青海
寧夏
新疆
Copyright(C) Nomura Research Institute, Ltd. All rights reserved. 82
Source: National Bureau of Statistics, China
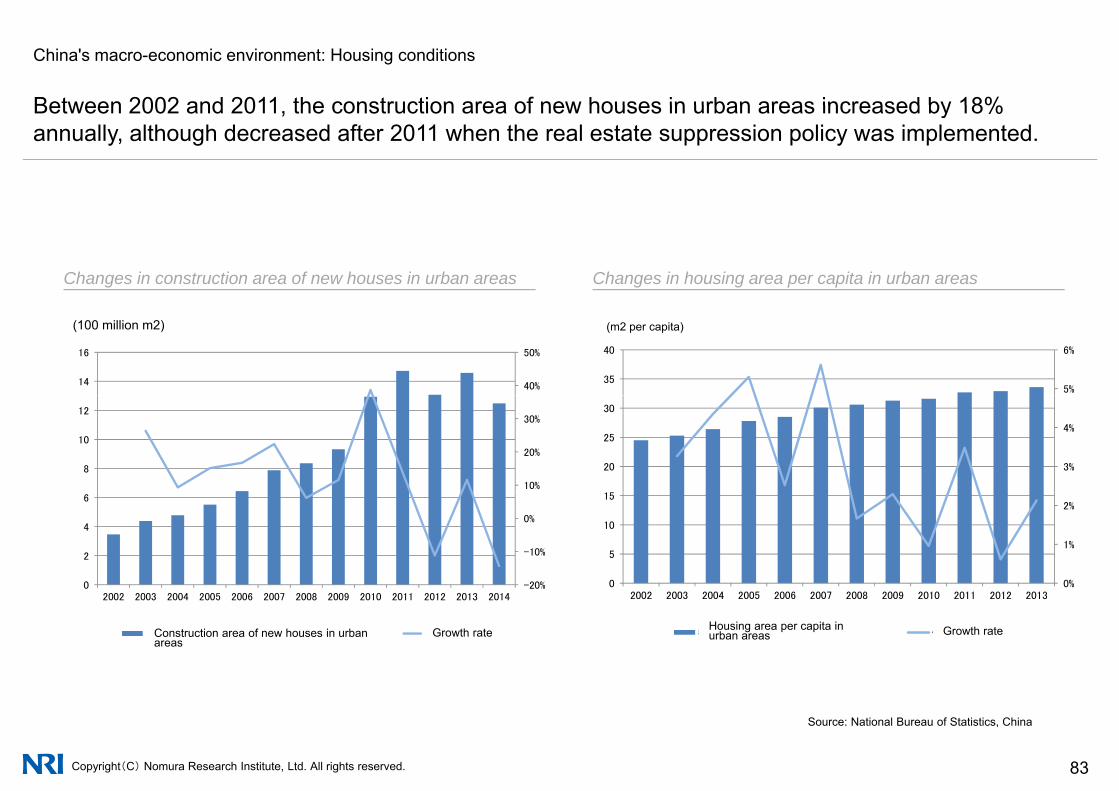
China's macro-economic environment: Housing conditions
Between 2002 and 2011 the construction area of new houses in urban areas increased by 18%Between 2002 and 2011, the construction area of new houses in urban areas increased by 18% annually, although decreased after 2011 when the real estate suppression policy was implemented.
Changes in construction area of new houses in urban areas Changes in housing area per capita in urban areas
(100 million m2) (m2 per capita)
40%
50%
14
16
5%
6%
35
40
10%
20%
30%
8
10
12
3%
4%
15
20
25
30
-20%
-10%
0%
0
2
4
6
0%
1%
2%
0
5
10
15
2002 2003 2004 2005 2006 2007 2008 2009 2010 2011 2012 2013 2014
不動産企業による新築住宅の着工面積(左目盛) 伸び率(右目盛)
2002 2003 2004 2005 2006 2007 2008 2009 2010 2011 2012 2013
都市部の1人あたり居住面積(左目盛) 伸び率(右目盛)Construction area of new houses in urban areas
Growth rate Growth rateHousing area per capita in urban areas
Copyright(C) Nomura Research Institute, Ltd. All rights reserved. 83
Source: National Bureau of Statistics, China
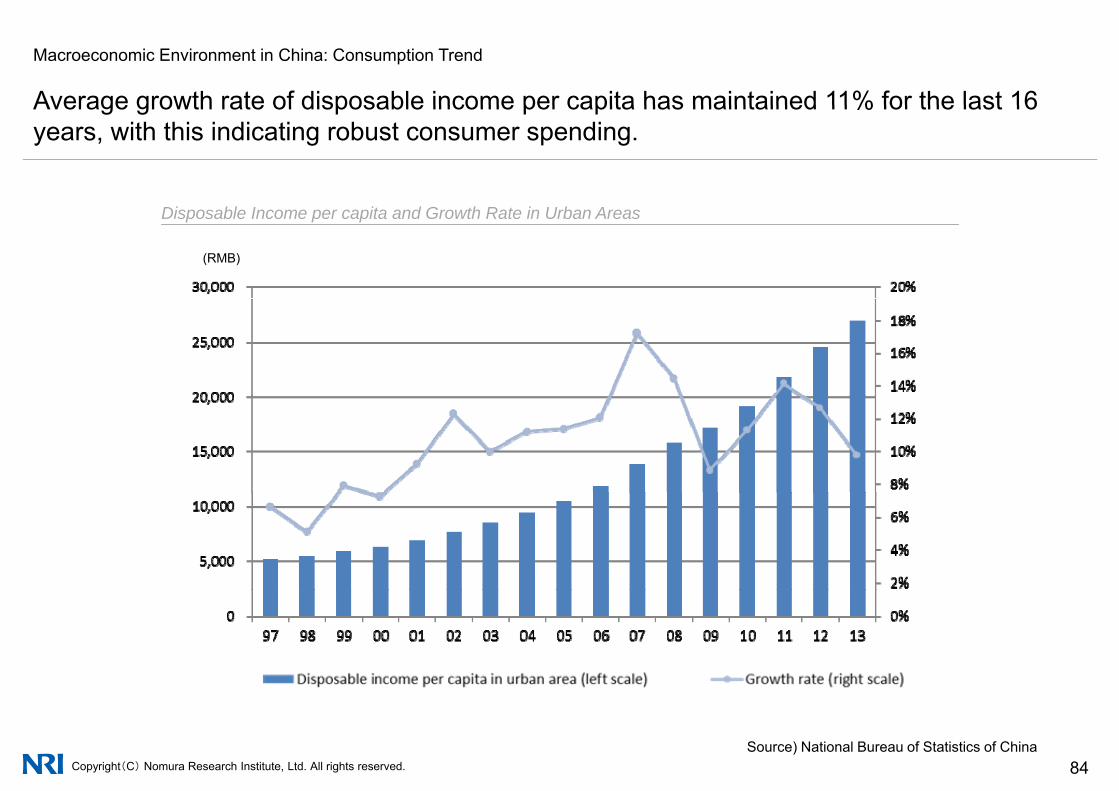
Macroeconomic Environment in China: Consumption Trend
Average growth rate of disposable income per capita has maintained 11% for the last 16Average growth rate of disposable income per capita has maintained 11% for the last 16 years, with this indicating robust consumer spending.
(RMB)
Disposable Income per capita and Growth Rate in Urban Areas
Copyright(C) Nomura Research Institute, Ltd. All rights reserved. 84Source) National Bureau of Statistics of China
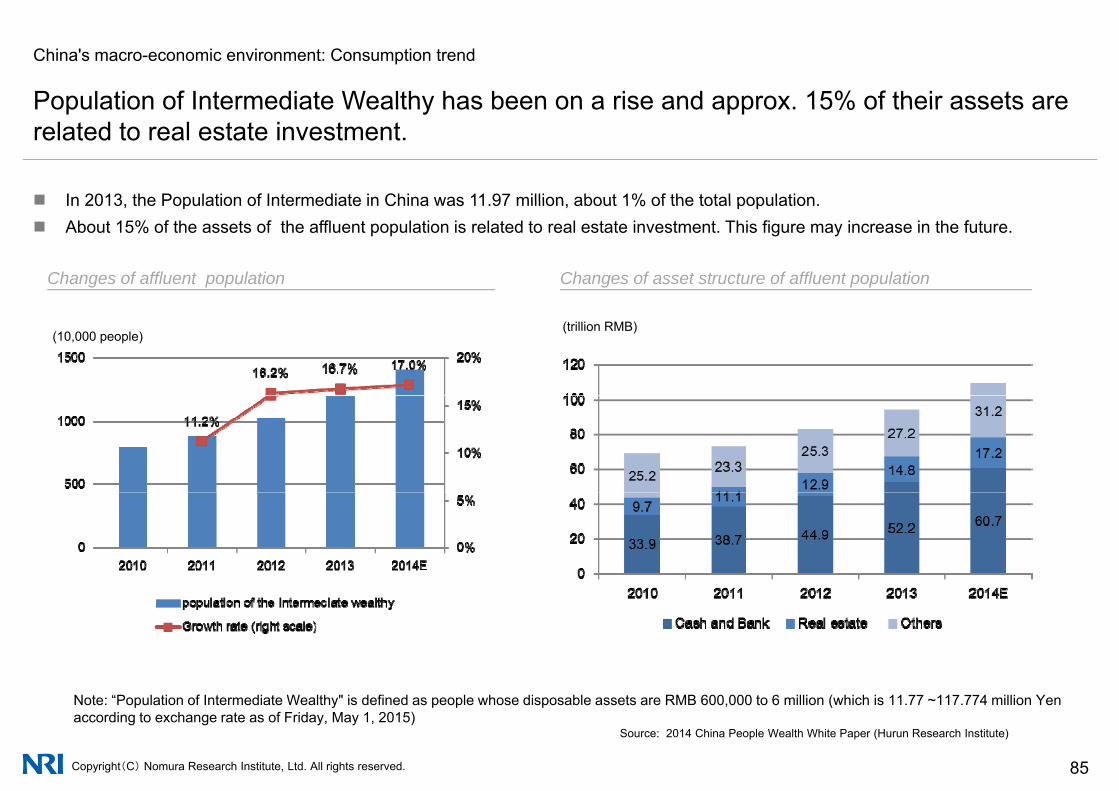
China's macro-economic environment: Consumption trend
Population of Intermediate Wealthy has been on a rise and approx 15% of their assets are
In 2013 the Population of Intermediate in China was 11 97 million about 1% of the total population
Population of Intermediate Wealthy has been on a rise and approx. 15% of their assets are related to real estate investment.
In 2013, the Population of Intermediate in China was 11.97 million, about 1% of the total population. About 15% of the assets of the affluent population is related to real estate investment. This figure may increase in the future.
Changes of affluent population Changes of asset structure of affluent population
(10,000 people) (trillion RMB)
Copyright(C) Nomura Research Institute, Ltd. All rights reserved. 85
Note: “Population of Intermediate Wealthy" is defined as people whose disposable assets are RMB 600,000 to 6 million (which is 11.77 ~117.774 million Yen according to exchange rate as of Friday, May 1, 2015)
Source: 2014 China People Wealth White Paper (Hurun Research Institute)
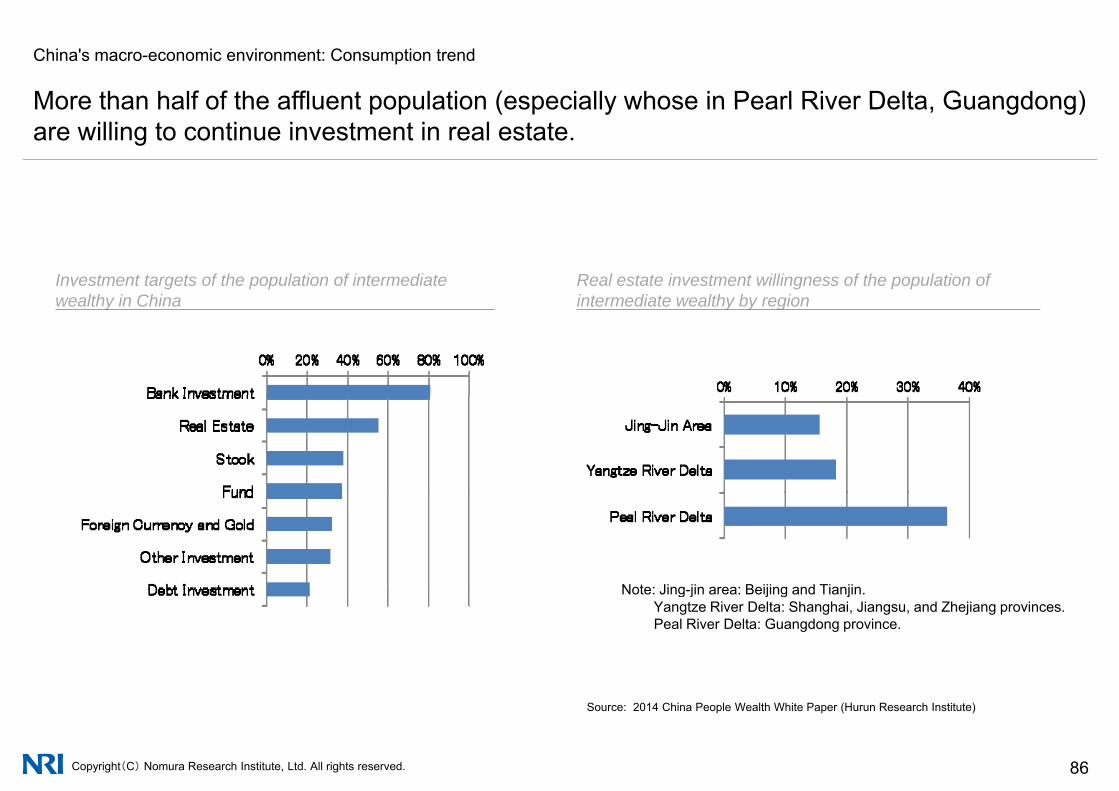
China's macro-economic environment: Consumption trend
More than half of the affluent population (especially whose in Pearl River Delta Guangdong)More than half of the affluent population (especially whose in Pearl River Delta, Guangdong) are willing to continue investment in real estate.
Investment targets of the population of intermediate wealthy in China
Real estate investment willingness of the population of intermediate wealthy by regionwealthy in China intermediate wealthy by region
Note: Jing jin area: Beijing and TianjinNote: Jing-jin area: Beijing and Tianjin. Yangtze River Delta: Shanghai, Jiangsu, and Zhejiang provinces. Peal River Delta: Guangdong province.
Copyright(C) Nomura Research Institute, Ltd. All rights reserved. 86
Source: 2014 China People Wealth White Paper (Hurun Research Institute)
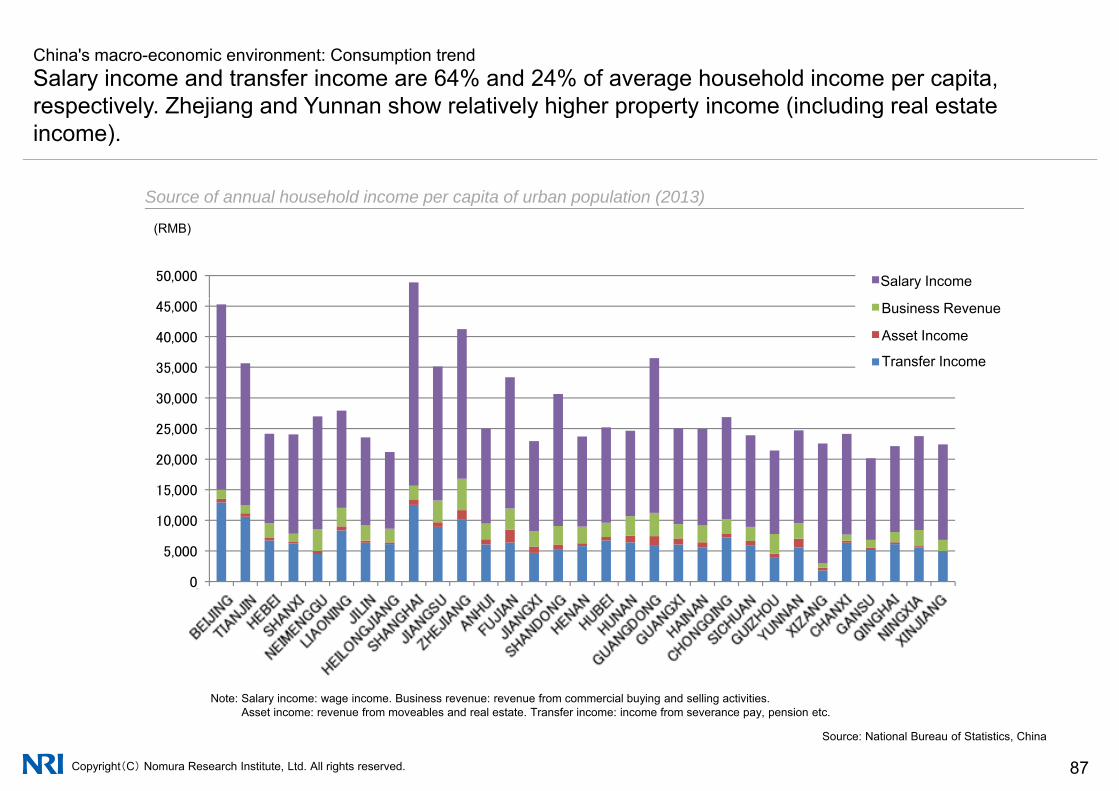
Salary income and transfer income are 64% and 24% of average household income per capita, respectively Zhejiang and Yunnan show relatively higher property income (including real estate
China's macro-economic environment: Consumption trend
respectively. Zhejiang and Yunnan show relatively higher property income (including real estate income).
Source of annual household income per capita of urban population (2013)
(RMB)
50,000 給料収入Salary Income
Source of annual household income per capita of urban population (2013)
30 000
35,000
40,000
45,000 経営収入
財産収入
転移収入
Asset Income
Transfer Income
Business Revenue
15 000
20,000
25,000
30,000
0
5,000
10,000
15,000
北京
天津
河北
山西
内モ
ンゴ
ル
遼寧
吉林
黑龍
江
上海
江蘇
浙江
安徽
福建
江西
山東
河南
湖北
湖南
広東
広西
海南
重慶
四川
貴州
雲南
チベ
ット
陝西
甘粛
青海
寧夏
新疆
Copyright(C) Nomura Research Institute, Ltd. All rights reserved. 87
Source: National Bureau of Statistics, China
Note: Salary income: wage income. Business revenue: revenue from commercial buying and selling activities. Asset income: revenue from moveables and real estate. Transfer income: income from severance pay, pension etc.
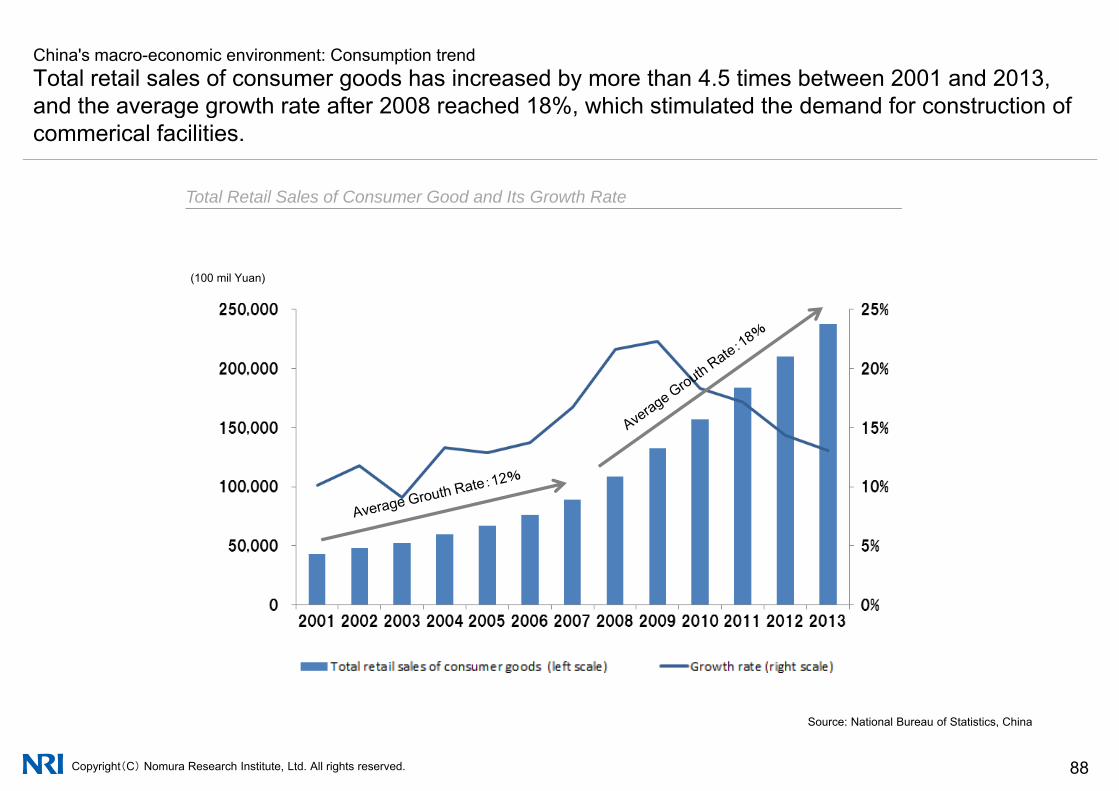
China's macro-economic environment: Consumption trend Total retail sales of consumer goods has increased by more than 4.5 times between 2001 and 2013,and the average growth rate after 2008 reached 18% which stimulated the demand for construction ofand the average growth rate after 2008 reached 18%, which stimulated the demand for construction of commerical facilities.
Total Retail Sales of Consumer Good and Its Growth Rate
(100 mil Yuan)
Total Retail Sales of Consumer Good and Its Growth Rate
Copyright(C) Nomura Research Institute, Ltd. All rights reserved. 88
Source: National Bureau of Statistics, China

China China’s real estate market has entered an adjustment period
1 Macro Economy and Real Estate Investment
2 China's Real Estate Investment
3 Residential Market
4 Commercial Development and Office Market
5 Movements of Chinese Real Estate Developers
Copyright(C) Nomura Research Institute, Ltd. All rights reserved. 89
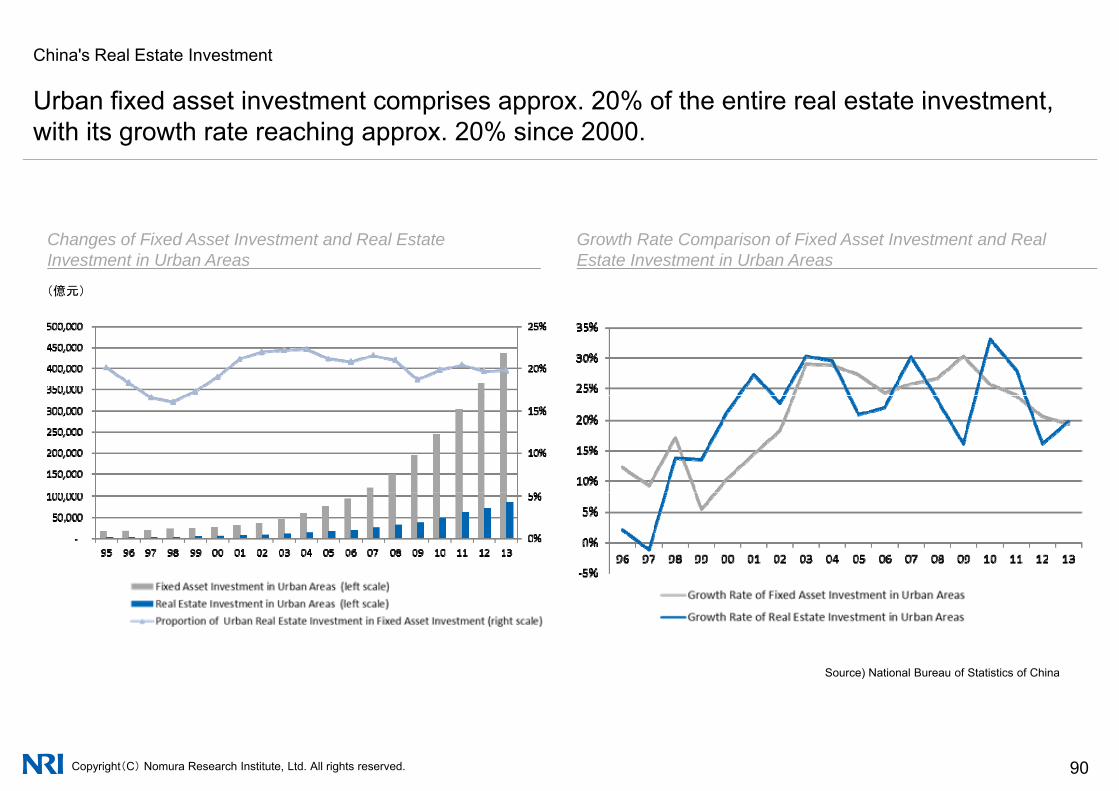
China's Real Estate Investment
Urban fixed asset investment comprises approx 20% of the entire real estate investmentUrban fixed asset investment comprises approx. 20% of the entire real estate investment, with its growth rate reaching approx. 20% since 2000.
(億元)
Changes of Fixed Asset Investment and Real Estate Investment in Urban Areas
Growth Rate Comparison of Fixed Asset Investment and Real Estate Investment in Urban Areas
Source) National Bureau of Statistics of China
Copyright(C) Nomura Research Institute, Ltd. All rights reserved. 90
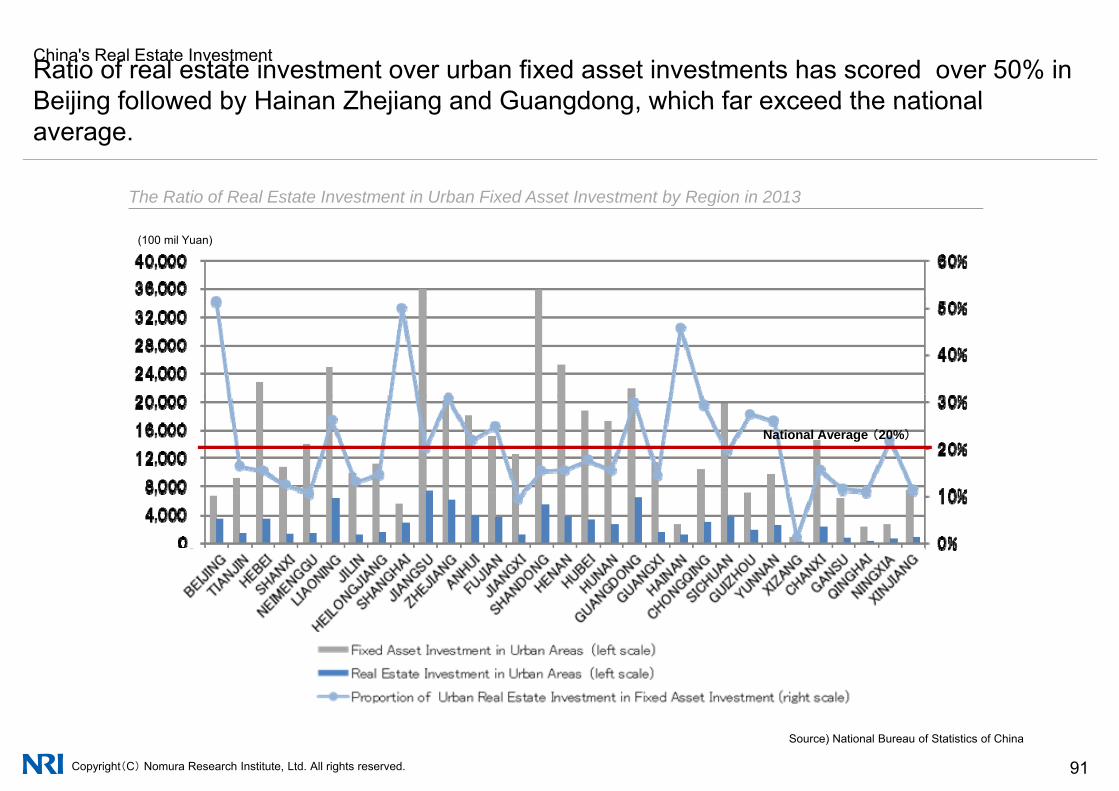
China's Real Estate InvestmentRatio of real estate investment over urban fixed asset investments has scored over 50% in Beijing followed by Hainan Zhejiang and Guangdong which far exceed the nationalBeijing followed by Hainan Zhejiang and Guangdong, which far exceed the national average.
The Ratio of Real Estate Investment in Urban Fixed Asset Investment by Region in 2013
(100 mil Yuan)
The Ratio of Real Estate Investment in Urban Fixed Asset Investment by Region in 2013
National Average (20%)
Copyright(C) Nomura Research Institute, Ltd. All rights reserved. 91
Source) National Bureau of Statistics of China

China's Real Estate InvestmentThe most vibrant region for real estate investment is Eastern Area, accounting for half of the total investment in China while the Western Area started to be vibrant as well in recenttotal investment in China, while the Western Area started to be vibrant as well in recent years.
Fixed Asset Investment and Real Estate Investment by Regionin 2013
Growth Rate of Proportion of Fixed Asset Investment in Real Estate Investment by region
(100 mil Yuan)
22%
24%
26%
16%
18%
20%
14%東部地域 中部地域 西部地域 東北地域
2012年 2013年2012 2013
※ Eastern Area: Beijing, Tianjin, Shanghai, Hebei, Jiangsu, Zhejiang, Fujian, Shandong, Guangdong, HainanMiddle Area: Shanxi, Anhui, Jiangxi, Henan, Hubei, Hunan
Western Area : Sichuan Guizhou Yunnan Shanxi Gansu Qinghai Neimenggu Guangxi Xizang Ningxia Xinjiang Chongqing
Copyright(C) Nomura Research Institute, Ltd. All rights reserved. 92
Western Area : Sichuan, Guizhou, Yunnan, Shanxi, Gansu,Qinghai, Neimenggu, Guangxi, Xizang, Ningxia, Xinjiang, ChongqingNortheast : Heilongjiang, Jilin, Liaoning
Source) National Bureau of Statistics of China

China's Real Estate Investment
Since the Housing Distribution System was abolished in 1998 the volume of real estateSince the Housing Distribution System was abolished in 1998, the volume of real estate investment in urban areas has increased, rigorously stimulating the country’s GDP growth.
Change in Growth Rates of GDP and of Real Estate Investment
The traditional housing distribution system was
The traditional housing distribution
distribution system was abolishedsystem was
abolished
Copyright(C) Nomura Research Institute, Ltd. All rights reserved. 93
Source) National Bureau of Statistics of China

China's Real Estate Investment
Housing investment comprises approx. 70% of the entire real estate investment.g
The Percentage of Ho sing/Commercial/Office In estments in Real Estate In estmentThe Percentage of Housing/Commercial/Office Investments in Real Estate Investment
Copyright(C) Nomura Research Institute, Ltd. All rights reserved. 94
Source) National Bureau of Statistics of China
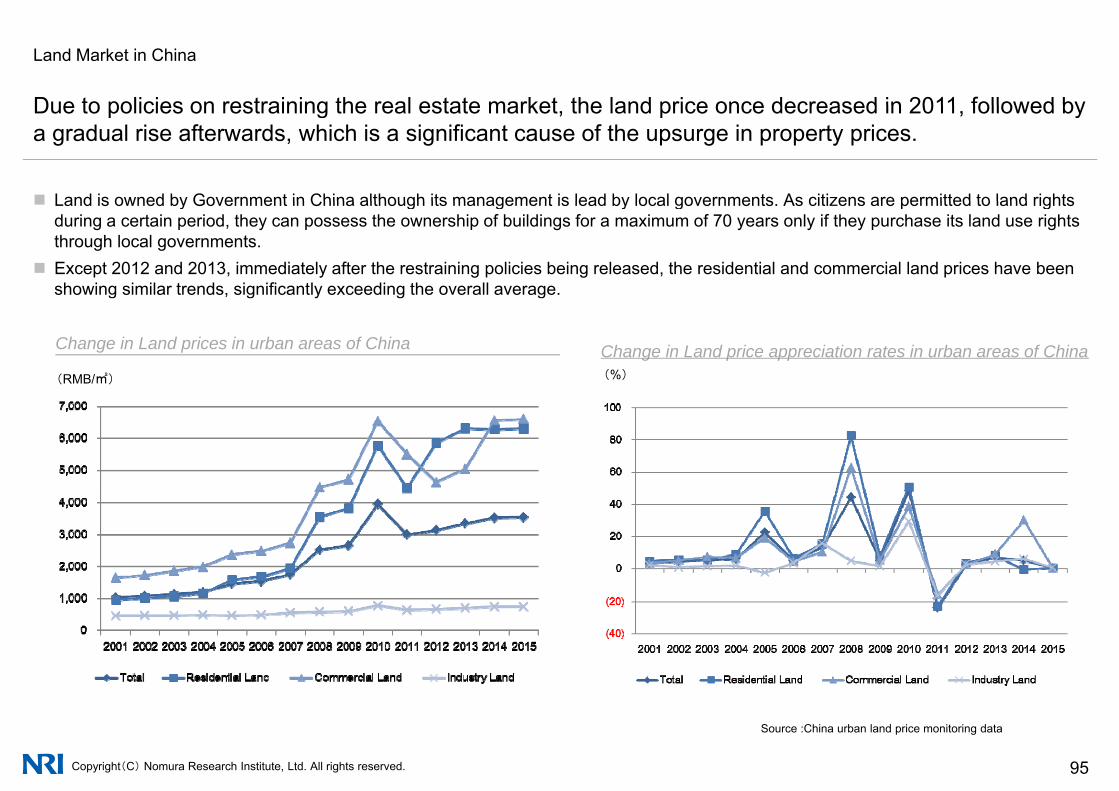
Land Market in China
Due to policies on restraining the real estate market the land price once decreased in 2011 followed by
Land is owned by Government in China although its management is lead by local governments As citizens are permitted to land rights
Due to policies on restraining the real estate market, the land price once decreased in 2011, followed by a gradual rise afterwards, which is a significant cause of the upsurge in property prices.
Land is owned by Government in China although its management is lead by local governments. As citizens are permitted to land rights during a certain period, they can possess the ownership of buildings for a maximum of 70 years only if they purchase its land use rights through local governments.
Except 2012 and 2013, immediately after the restraining policies being released, the residential and commercial land prices have been showing similar trends, significantly exceeding the overall average.
(RMB/㎡) (%)
Change in Land prices in urban areas of China Change in Land price appreciation rates in urban areas of China
Copyright(C) Nomura Research Institute, Ltd. All rights reserved. 95
Source :China urban land price monitoring data

China’s Real Estate Finance Market
In most cases real estate investment projects in China are financed by Real Estate
The current real estate finance market in China features of an extremely large primary market of housing loan but very small second
In most cases, real estate investment projects in China are financed by Real Estate Investment Trust through banks.
The current real estate finance market in China features of an extremely large primary market of housing loan but very small second market. i.e. securitization market of mortgage loan that supports the primary market.
Although there are almost 200 listed real estate development companies, few of them are utilizing private real estate funds or REIT. In 2010, the central government reviewed its policies on real estate market and limited direct financing from banks. As a result, real
estate investment trust and other tools became the main route for investment in real estate projectsestate investment trust and other tools became the main route for investment in real estate projects.
Real Estate Main
Investment structure of Real estate finance in China
Investor
Banks/insurance companies Asset management
Real Estate Investment Trust Private real estate fundsOther tools
Main
Few
Very few(Individuals, companies, investment organizations
products
Li d l
Other tools(Finance lease etc.) Real estate
development project
Very few
organizations etc.)
Listed real estate companiesStocks and bonds株式・債券Securitized products
Open market(stock exchange etc
Few
Trial
Copyright(C) Nomura Research Institute, Ltd. All rights reserved. 96
(ABN, REITS etc.)
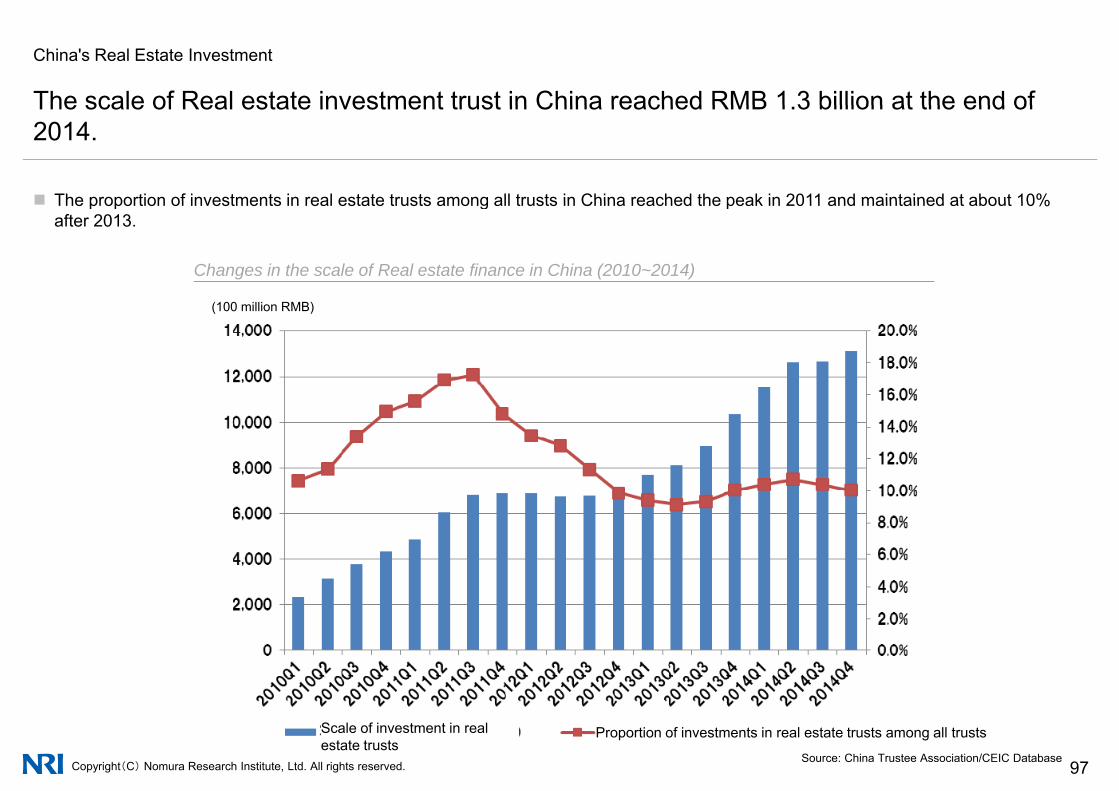
China's Real Estate Investment
The scale of Real estate investment trust in China reached RMB 1 3 billion at the end of
The proportion of investments in real estate trusts among all trusts in China reached the peak in 2011 and maintained at about 10%
The scale of Real estate investment trust in China reached RMB 1.3 billion at the end of 2014.
The proportion of investments in real estate trusts among all trusts in China reached the peak in 2011 and maintained at about 10% after 2013.
Changes in the scale of Real estate finance in China (2010~2014)
(100 million RMB)
Copyright(C) Nomura Research Institute, Ltd. All rights reserved. 97Source: China Trustee Association/CEIC Database
Proportion of investments in real estate trusts among all trusts Scale of investment in real estate trusts
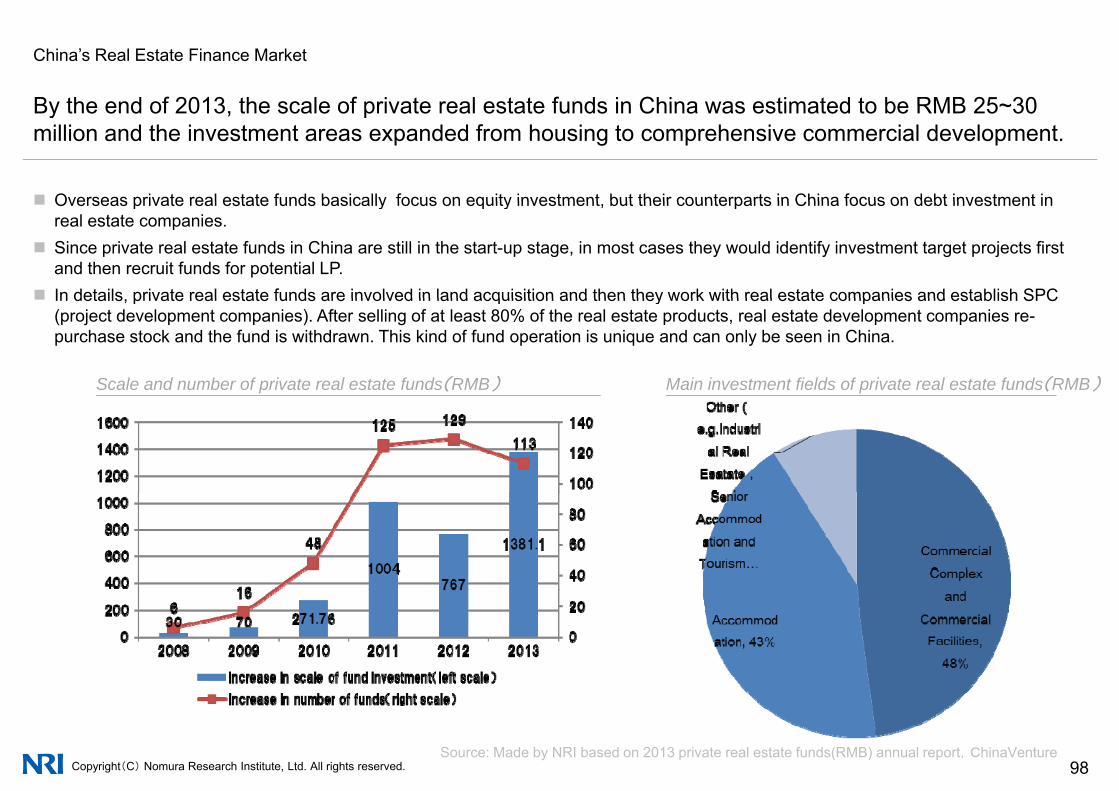
China’s Real Estate Finance Market
By the end of 2013 the scale of private real estate funds in China was estimated to be RMB 25~30
Overseas private real estate funds basically focus on equity investment but their counterparts in China focus on debt investment in
By the end of 2013, the scale of private real estate funds in China was estimated to be RMB 25~30 million and the investment areas expanded from housing to comprehensive commercial development.
Overseas private real estate funds basically focus on equity investment, but their counterparts in China focus on debt investment in real estate companies.
Since private real estate funds in China are still in the start-up stage, in most cases they would identify investment target projects first and then recruit funds for potential LP.
In details private real estate funds are involved in land acquisition and then they work with real estate companies and establish SPC In details, private real estate funds are involved in land acquisition and then they work with real estate companies and establish SPC (project development companies). After selling of at least 80% of the real estate products, real estate development companies re-purchase stock and the fund is withdrawn. This kind of fund operation is unique and can only be seen in China.
Scale and number of private real estate funds(RMB) Main investment fields of private real estate funds(RMB)
Copyright(C) Nomura Research Institute, Ltd. All rights reserved. 98Source: Made by NRI based on 2013 private real estate funds(RMB) annual report,ChinaVenture
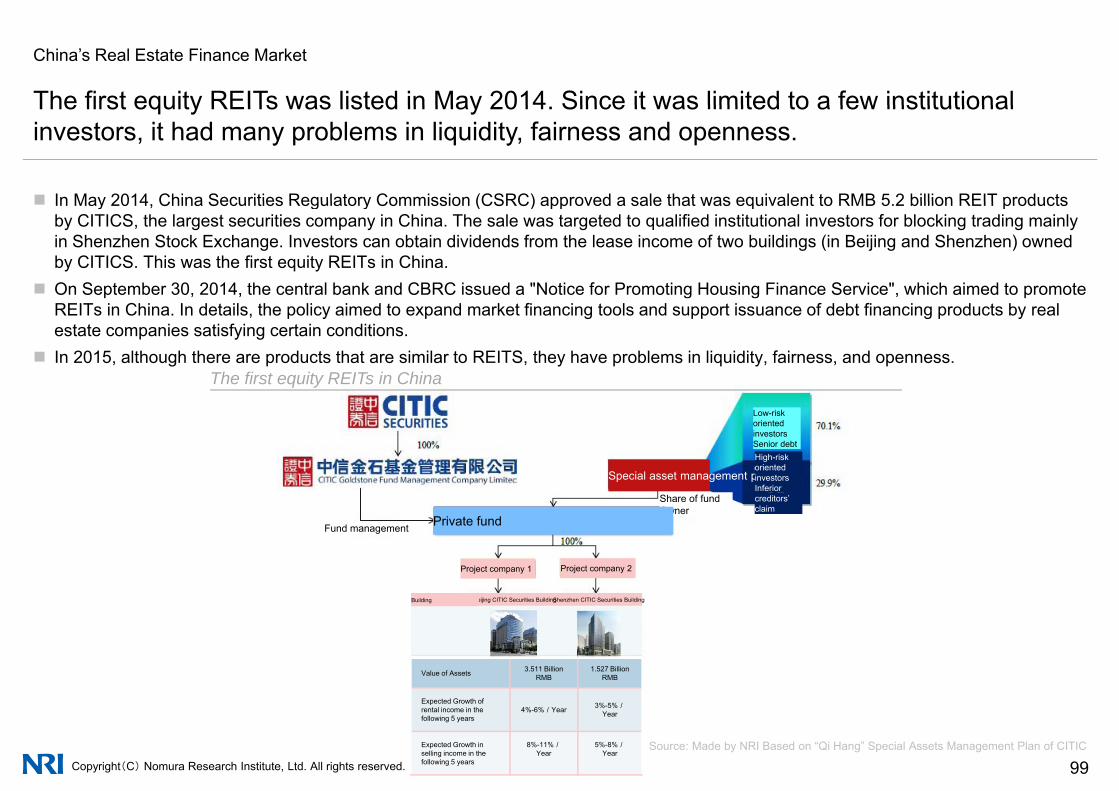
China’s Real Estate Finance Market
The first equity REITs was listed in May 2014 Since it was limited to a few institutional
In May 2014 China Securities Regulatory Commission (CSRC) approved a sale that was equivalent to RMB 5 2 billion REIT products
The first equity REITs was listed in May 2014. Since it was limited to a few institutional investors, it had many problems in liquidity, fairness and openness.
In May 2014, China Securities Regulatory Commission (CSRC) approved a sale that was equivalent to RMB 5.2 billion REIT products by CITICS, the largest securities company in China. The sale was targeted to qualified institutional investors for blocking trading mainly in Shenzhen Stock Exchange. Investors can obtain dividends from the lease income of two buildings (in Beijing and Shenzhen) owned by CITICS. This was the first equity REITs in China.
On September 30, 2014, the central bank and CBRC issued a "Notice for Promoting Housing Finance Service", which aimed to promoteREITs in China. In details, the policy aimed to expand market financing tools and support issuance of debt financing products by real estate companies satisfying certain conditions.
In 2015, although there are products that are similar to REITS, they have problems in liquidity, fairness, and openness. The first equity REITs in China
Special asset management plan
Low-risk oriented investors Senior debtHigh-risk oriented investors Inferior
Special asset management plan
Low-risk oriented investors Senior debtHigh-risk oriented investors Inferior
Fund management
Share of fund Owner
Private fund
Project company 1 Project company 2
Inferior creditors’ claim
Fund management
Share of fund Owner
Private fund
Project company 1 Project company 2
creditors’ claim
Shenzhen CITIC Securities BuildingBeijing CITIC Securities BuildingBuildingShenzhen CITIC Securities BuildingBeijing CITIC Securities BuildingBuilding
Value of Assets 3.511 Billion RMB
1.527 Billion RMB
Copyright(C) Nomura Research Institute, Ltd. All rights reserved. 99Source: Made by NRI Based on “Qi Hang” Special Assets Management Plan of CITIC
Expected Growth of rental income in the following 5 years
4%-6%/Year 3%-5%/Year
Expected Growth in selling income in the following 5 years
8%-11%/Year
5%-8%/Year
China China’s real estate market has entered an adjustment period
1 Macro Economy and Real Estate Investment
2 China's Real Estate Investment
3 Residential Market
4 Commercial Development and Office Market
5 Movements of Chinese Real Estate Developers
Copyright(C) Nomura Research Institute, Ltd. All rights reserved. 100

China's Residential Market
China’s urban housing can be classified into “commercial residence” and “low incomeChina s urban housing can be classified into commercial residence and low income housing” with the former accounting for approx. 90% of the supply.
Holiday house (Detached)eCommercial residence
(for the middle and high-income class)
Luxurycommercial residence
y ( )
Holiday house (Town house)
Luxury condominium
Sold atmarket prices
Urbanhousing
Ordinarycommercialresidence
Ordinary condominium
p
Low income housing (for the low-income class)
Affordable housing Sold at
preferential
P bli t l
Price-limitedhousing
Construction size is smallerthan ordinary condominiums
Installation requirementsof common areas as well
prices
Public rentalhousing
Low price public housing
Houses that can be freely resold
as the buildings’ finishingstandards are also slightly lower.
Leased atPreferentialprices
Houses that can be resold with
Copyright(C) Nomura Research Institute, Ltd. All rights reserved. 101
public housingconditions

Housing Policy in China
Low-income housing consists of a)resalable “Affordable” and “Price-limited” housings and
“Affordable” and “Price-limited” housings can be resold only in cases where conditions set on the resale of each housing types are met
Low income housing consists of a)resalable Affordable and Price limited housings, and b)unresalable “Public rental” and “Low price public” housings.
Affordable and Price-limited housings can be resold only in cases where conditions set on the resale of each housing types are met.
Classification Description Resalable or not
Overview of low-income housing
Affordable housing
• In order to achieve an affordable price, Government provides developers with various preferential treatments such as providing land at preferential price,diminishing their tax, contribution for urban infrastructures development and various administrative business expenses.
• Sizes are strictly controlled; e.g. medium-sized: around 80 ㎡, small-sized:d 60 ㎡around 60 ㎡.
• Families with the right to purchase are those with a household register as well as with income of 60,000 Yuan or less.
• Houses are resalable but only after five years have passed since the purchase.
• Purchaser possesses its limited ownership.• Used as one of the Government ‘s measures to control real estate
Price-limited housing
development market and to adjust the housing supply for a certain period.• State-owned companies take responsibility in its construction. • Its selling prices are determined by the government and are usually 20–25%
lower than commercial residences.
L d b G t i tit ti i it i i t l d iddlPublic rental housing
• Leased by Government or institutions in its commission to low and middle-income families at market prices
• Government provides a certain amount of housing allowance to its occupant families every month.
• Houses cannot be resold and only can be leased.
• Occupant does not possess its ownership• Leased to low-income families at the lowest lease price determined by
Copyright(C) Nomura Research Institute, Ltd. All rights reserved. 102
ownership.Low price publichousing
Leased to low income families at the lowest lease price determined by Government.
• Provided sizes: 35 ㎡ for 1LDKs, 45 ㎡ for 2LDKs, and 55 ㎡ for 3LDKs.

Housing Policy in China
Affordable housings can be provided at drastically cheaper price than ordinary commercial
It should be noted that affordable housing is sold under “Allocated land usage rights ” which does not require the payment of land grant
Affordable housings can be provided at drastically cheaper price than ordinary commercial housings as the price is set according to costs.
It should be noted that affordable housing is sold under Allocated land usage rights, which does not require the payment of land grant charges to the government, and that the percentage of profit allocated to developers from its development is politically controlled under 3% or less.
Comparison of price structure between ordinary commercial housing and affordable housing
Cost structure item Ordinary commercial housing Affordable housing
Eviction/compensation costs ○ ○
Planning/designing costs ○ ○
Construction costs for infrastructure within the housing ○ ○
Construction work costs for buildings and equipment ○ ○
SG&A ○ ○
T ○ ○Tax ○ ○
Profit Unlimited 3% or less
Land grant charge ○ ×
Copyright(C) Nomura Research Institute, Ltd. All rights reserved. 103
Land right type Land grant usage rights Allocated land usage rights

China’s Residential Market
Due to urbanization the housing demand in urban areas is hovering at a high level
Supply of commercial residences slowed down at times due to policy adjustments and fiscal tightening although the volume of both
Due to urbanization, the housing demand in urban areas is hovering at a high level, resulting in an increasing trend over the supply of commercial residences.
Supply of commercial residences slowed down at times due to policy adjustments and fiscal tightening, although the volume of both housing demand and construction area have been on the rise during recent 12 years.
(10,000 ㎡)
The area of commercial residences’ completion in China
Copyright(C) Nomura Research Institute, Ltd. All rights reserved. 104Source: China Statistical Yearbook
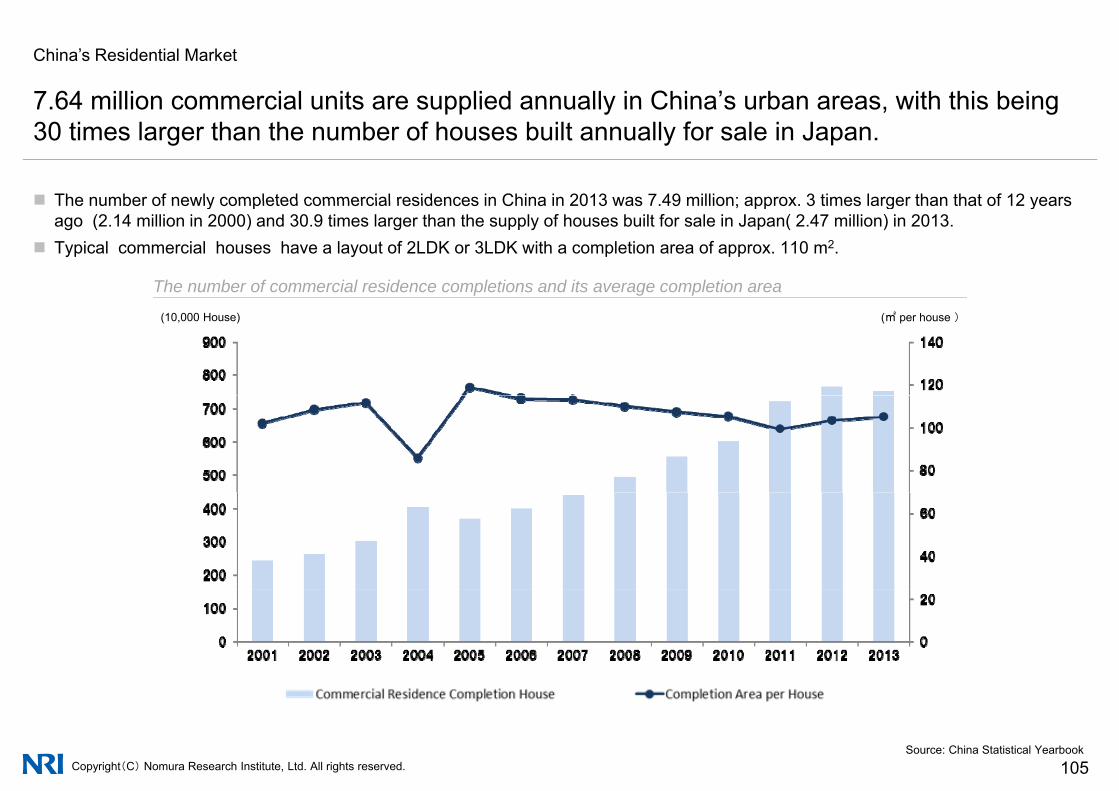
China’s Residential Market
7 64 million commercial units are supplied annually in China’s urban areas with this being
The number of newly completed commercial residences in China in 2013 was 7 49 million; approx 3 times larger than that of 12 years
7.64 million commercial units are supplied annually in China s urban areas, with this being 30 times larger than the number of houses built annually for sale in Japan.
The number of newly completed commercial residences in China in 2013 was 7.49 million; approx. 3 times larger than that of 12 years ago (2.14 million in 2000) and 30.9 times larger than the supply of houses built for sale in Japan( 2.47 million) in 2013.
Typical commercial houses have a layout of 2LDK or 3LDK with a completion area of approx. 110 m2.
The number of commercial residence completions and its average completion area
(10,000 House) (㎡ per house )
Copyright(C) Nomura Research Institute, Ltd. All rights reserved. 105Source: China Statistical Yearbook

Residential Market in China
Approx 90% of commercial housing is general residential property while the investmentApprox. 90% of commercial housing is general residential property while the investment towards the “Affordable housings” for low and middle income class is in extremely short supply.
Changes of the Ratio of Ho sing In estment b t pes
100%
Changes of the Ratio of Housing Investment by types
60%
80%
20%
40%
0%98 99 00 01 02 03 04 05 06 07 08 09 10 11 12 13
一般商品住宅 別荘、高級マンション 経済適用住宅
Note: Since numbers related to affordable housing after 2010 is not provided in the China Statistical Yearbook, the data here was calculated from selling price and actual construction household
Copyright(C) Nomura Research Institute, Ltd. All rights reserved. 106Source) National Bureau of Statistics of China

Housing market in China
To improve housing conditions of low-income population the government accelerated
In its 12th five-year planning the Chinese government plans to build 36 million new and affordable houses The purpose is to accelerate
To improve housing conditions of low income population, the government accelerated provision of affordable housing in 2011.
In its 12th five-year planning, the Chinese government plans to build 36 million new and affordable houses. The purpose is to accelerate provision of public housing. The government aims to build more low-rent houses and economically affordable houses for low-incomepopulation and increase supply of low-cost housing.
According to public data of China Index Research Institute, 60% (20.47 million) of 32 million affordable houses have been completed by September 2014. Quite an accomplishment within such a short period of time.
(10,000 houses)
Construction plan and completion of affordable housing (2011~2014)
Copyright(C) Nomura Research Institute, Ltd. All rights reserved. 107Source: China Index Research
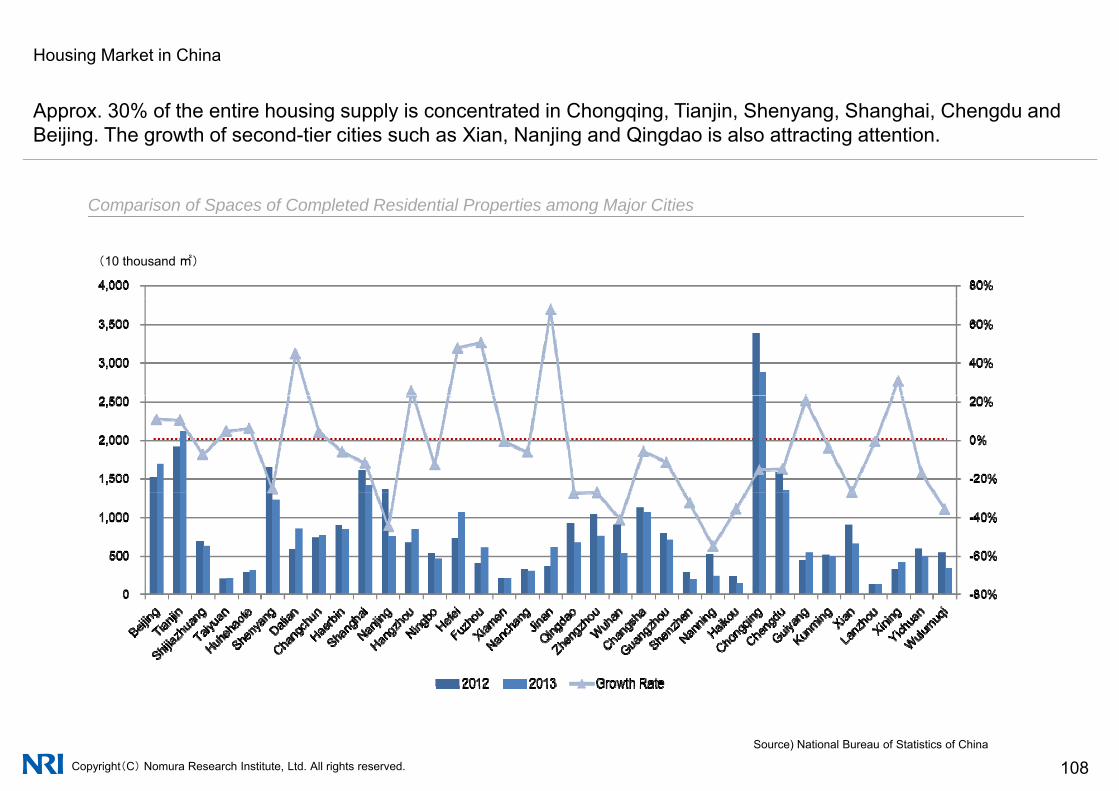
Housing Market in China
A 30% f th ti h i l i t t d i Ch i Ti ji Sh Sh h i Ch d dApprox. 30% of the entire housing supply is concentrated in Chongqing, Tianjin, Shenyang, Shanghai, Chengdu and Beijing. The growth of second-tier cities such as Xian, Nanjing and Qingdao is also attracting attention.
Comparison of Spaces of Completed Residential Properties among Major Cities
(10 thousand ㎡)
Comparison of Spaces of Completed Residential Properties among Major Cities
Copyright(C) Nomura Research Institute, Ltd. All rights reserved. 108Source) National Bureau of Statistics of China

China's Residential Market
Selling price of homes has risen by 2 9 times during the last 12 years with this trend beingSelling price of homes has risen by 2.9 times during the last 12 years, with this trend being especially evident among luxury properties.
Selling price of commercial residences in China
(元/㎡)
Copyright(C) Nomura Research Institute, Ltd. All rights reserved. 109
*Since sales prices of the economical housing for low-and-middle income earners in 2011 were not reported in China Statistical Yearbook 2012, the data here was calculated on the basis of data in 2010 by 110% growth rate.
Source) National Bureau of Statistics of China
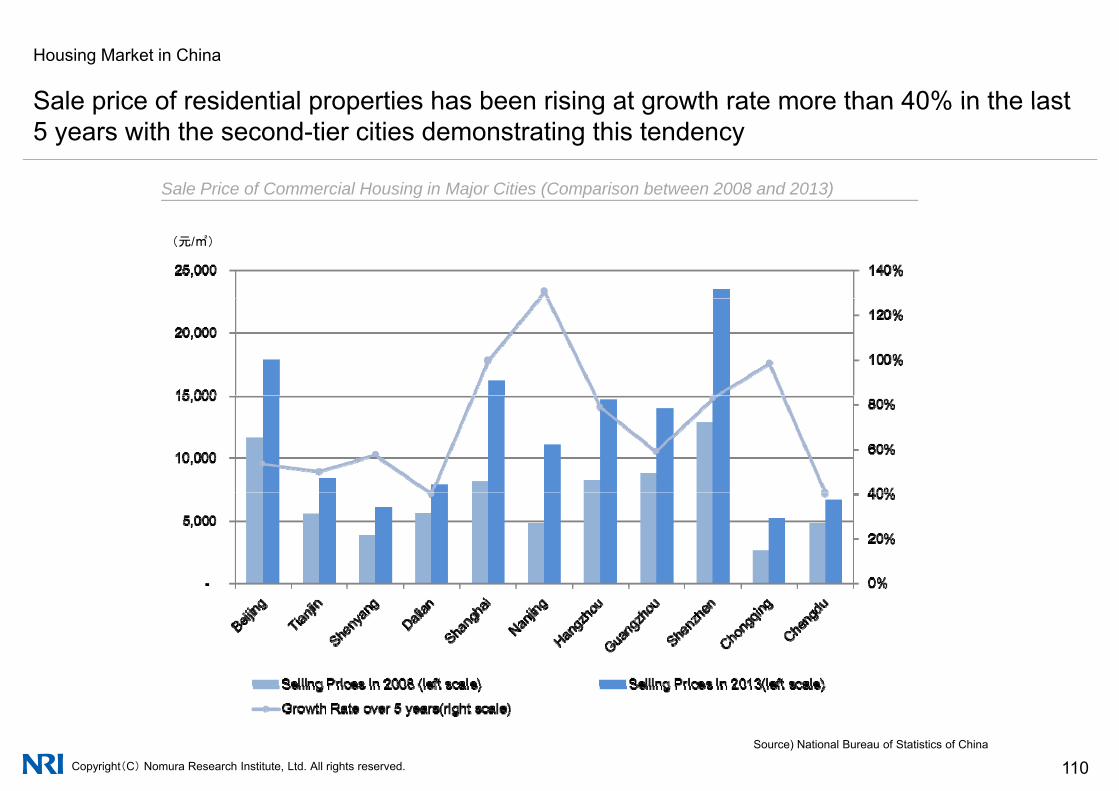
Housing Market in China
Sale price of residential properties has been rising at growth rate more than 40% in the lastSale price of residential properties has been rising at growth rate more than 40% in the last 5 years with the second-tier cities demonstrating this tendency
Sale Price of Commercial Housing in Major Cities (Comparison between 2008 and 2013)
(元/㎡)
Copyright(C) Nomura Research Institute, Ltd. All rights reserved. 110Source) National Bureau of Statistics of China

China's Residential Market
Housing price to income ratio is 12 times larger in coastal metropolis such as Shenzhen
Housing price to income ratio has risen by 6 to 8 times compared to 11 years ago
Housing price to income ratio is 12 times larger in coastal metropolis, such as Shenzhen, Hangzhou and Shanghai, significantly exceeding the national average.
Housing price to income ratio has risen by 6 to 8 times compared to 11 years ago, Ratio in metropolises has risen significantly, with Shenzhen seeing a rise from 5.8 times to 12.9 times.
(Times)
The housing selling prices to income ratio
Copyright(C) Nomura Research Institute, Ltd. All rights reserved. 111Source: Statistical material by the Ministry of Land and Resources and the National Bureau of Statistics

House supply policy of China Although the policy implemented by the government in 2009 had some effects in reducing housing price it caused increase of stock of houses and deterioration of the overall market conditions This is
Monetary easing policies implemented after the Lehman shock resulted in skyrocketing housing price in Beijing, Shanghai, and other major cities in China As a countermeasure the Chinese government implemented a series of policies that made it more difficult for
price, it caused increase of stock of houses and deterioration of the overall market conditions. This is why the government implemented easing policy in 2014.
major cities in China. As a countermeasure, the Chinese government implemented a series of policies that made it more difficult for acquisition of houses after October 2009.
However, since such policies resulted in increase of stock of houses and deterioration of the overall market conditions, the government had to cancel the housing restriction policies implemented in 43 cities (but not including Beijing, Shanghai, Shenzhen, and Sanya).
Monthly sales area of commercial housing compared with the previous year (after 2007)October 2009Implementation of housing price suppression policies Abolishment of tax incentives (real estate transaction tax and personal income tax) Implementation of differentiated housing loan policy
March ~ April 2010Purchase of house was limited in 48 cities. Higher down payment/interest of loan for the second house. Restriction of banking loan to developers
September 2014 Decrease of down payment/interest of loan for the second house by the central bank. (%)
Monthly sales area of commercial housing compared with the previous year (after 2007)
End of 2008 Economic recovery through reduction of interest rates and exemption of real estate acquisition tax etc.
loan policy
January 2011Further increase of down payment/interest of loan for the second house. Trial introduction of property tax for the third house in Shanghai
Policy for limiting house purchase was abolished in most cities. Promoted expansion of financing route and supported banks and other financial institutions for the third house in Shanghai
and Chongqing. Increase of house supply through provision of affordable houses.
to issue housing bonds and REITS.
Copyright(C) Nomura Research Institute, Ltd. All rights reserved. 112Source: National Bureau of Statistics, China
Restriction Easing Easing
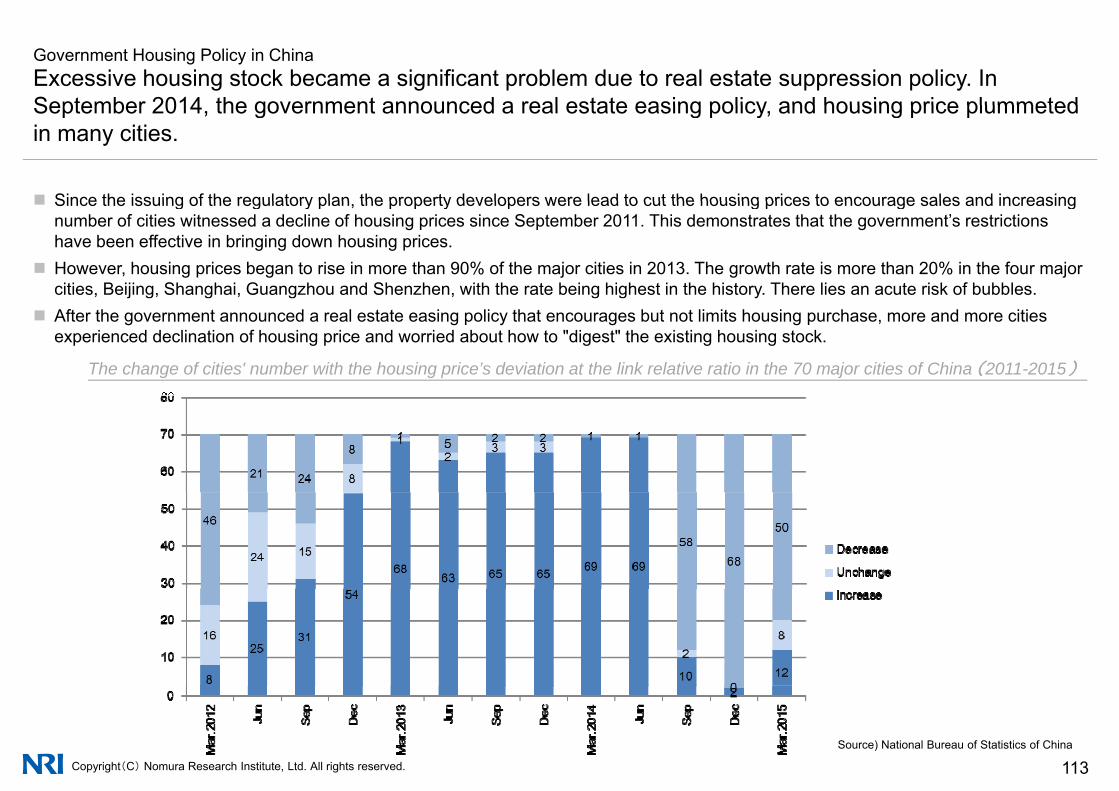
Government Housing Policy in ChinaExcessive housing stock became a significant problem due to real estate suppression policy. In September 2014 the government announced a real estate easing policy and housing price plummeted
Since the issuing of the regulatory plan the property developers were lead to cut the housing prices to encourage sales and increasing
September 2014, the government announced a real estate easing policy, and housing price plummeted in many cities.
Since the issuing of the regulatory plan, the property developers were lead to cut the housing prices to encourage sales and increasing number of cities witnessed a decline of housing prices since September 2011. This demonstrates that the government’s restrictions have been effective in bringing down housing prices.
However, housing prices began to rise in more than 90% of the major cities in 2013. The growth rate is more than 20% in the four major cities, Beijing, Shanghai, Guangzhou and Shenzhen, with the rate being highest in the history. There lies an acute risk of bubbles.
After the government announced a real estate easing policy that encourages but not limits housing purchase, more and more citiesexperienced declination of housing price and worried about how to "digest" the existing housing stock.
The change of cities' number with the housing price’s deviation at the link relative ratio in the 70 major cities of China (2011-2015)
Copyright(C) Nomura Research Institute, Ltd. All rights reserved. 113Source) National Bureau of Statistics of China

Prospects of China's housing market
Unlike the past the housing market in China in 2015 will be "consumer centered" instead of "developerUnlike the past, the housing market in China in 2015 will be consumer centered instead of developer centered", and the main stream will be provision of houses that can satisfy consumers' rigid demand.
Directions of China's housing market in 2015
Change from "investment" to "rigid
g
1Change from investment to rigid
demand"For increase of house sale
Affordable houses with high quality and habitability
Higher demand for better house that satisfy needs in higher life stage
Aging population and two-child policy result in further segmentation and
di ifi ti f h l
2
satisfy needs in higher life stage diversification of house supply market
Release of house purchase limit in tier Unlike tier 1 cities where land supplyUnlike tier 1 cities where land supply 3Release of house purchase limit in tier 1 and 2 cities
Excessive house supply in tier 3 and 4 cities
Unlike tier 1 cities where land supply is limited and tier 3 and 4 cities with
high stock of houses, tier 2 cities will become the main fighting field of
h i k t
3
Copyright(C) Nomura Research Institute, Ltd. All rights reserved. 114
citiescities housing market. housing market.
China China’s real estate market has entered an adjustment period
1 Macro Economy and Real Estate Investment
2 China's Real Estate Investment
3 Residential Market
4 Commercial Development and Office Market
5 Movements of Chinese Real Estate Developers
Copyright(C) Nomura Research Institute, Ltd. All rights reserved. 115
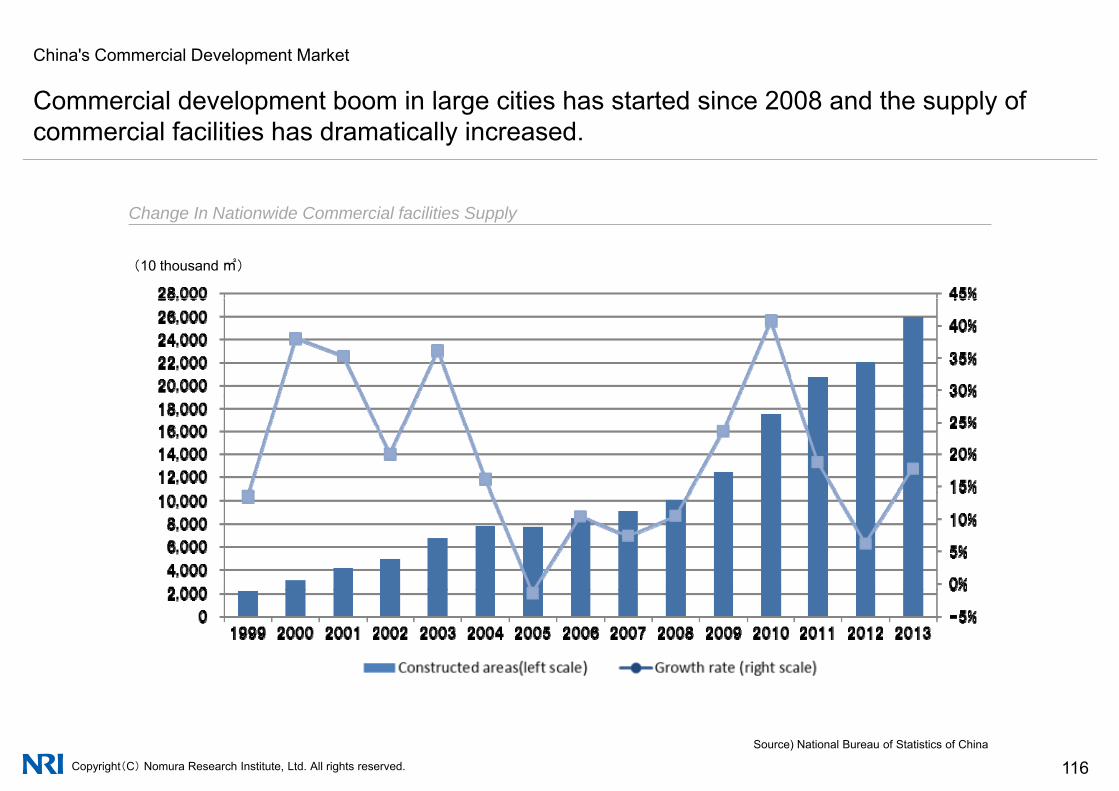
China's Commercial Development Market
Commercial development boom in large cities has started since 2008 and the supply ofCommercial development boom in large cities has started since 2008 and the supply of commercial facilities has dramatically increased.
(10 thousand ㎡)
Change In Nationwide Commercial facilities Supply
Copyright(C) Nomura Research Institute, Ltd. All rights reserved. 116Source) National Bureau of Statistics of China

China's Commercial Development Market
Investment for commercial development has been rapidly growing at an annual rate of 26% onInvestment for commercial development has been rapidly growing at an annual rate of 26% on average since 2000. The volume of investment in 2013 was 20 times larger than that of 2000.
Change in In estment Amo nt and Gro th Rate of Commercial Facilities
(100 mil Yuan)
Change in Investment Amount and Growth Rate of Commercial Facilities
Copyright(C) Nomura Research Institute, Ltd. All rights reserved. 117Source) National Bureau of Statistics of China

China's Commercial Development Market
Average unit sales price of offices in 2013 has risen by 3 times of that in 1998 and about 40% of theAverage unit sales price of offices in 2013 has risen by 3 times of that in 1998, and about 40% of the sales volume are concentrated in the eastern part of China, where it is economically developed.
Ch i S l S /U it S l P i f Ch i S l S /U it S l P i f
(10 thousand ㎡) (10 thousand ㎡)(RMB/㎡) (RMB/㎡)
Changes in Sales Spaces/Unit Sales Price of Commercial Facilities in China
Changes in Sales Spaces/Unit Sales Price of Commercial Facilities by Region (2012)
※ Eastern Area: Beijing, Tianjin, Shanghai, Hebei, Jiangsu, Zhejiang, Fujian, Shandong, Guangdong, Hainan
Middle Area: Shanxi, Anhui, Jiangxi, Henan, Hubei, HunanWestern Area : Sichuan, Guizhou, Yunnan, Shanxi, Gansu,
Copyright(C) Nomura Research Institute, Ltd. All rights reserved. 118
Qinghai, Neimenggu, Guangxi, Xizang, Ningxia, Xinjiang, ChongqingNortheast : Heilongjiang, Jilin, Liaoning
Source: China Statistical Yearbook

China’s Commercial Development Market
Commercial development in developing areas such as Henan Guizhou Xizang XinjiangCommercial development in developing areas such as Henan, Guizhou, Xizang, Xinjiang, Liaoning etc has been especially buoyant in the last 3 years.
Comparison of Sales Spaces of Commercial Facilities by Region(10 thousand ㎡)
Copyright(C) Nomura Research Institute, Ltd. All rights reserved. 119Source: China Statistical Yearbook

China's Office Market
Office supply in urban areas in China has experienced a downturn after the failure ofOffice supply in urban areas in China has experienced a downturn after the failure of Lehman Brothers in 2008, however, a growing trend continues as a whole.
Change in Nation ide Office S ppl
(10 thousand ㎡)
Change in Nationwide Office Supply
Copyright(C) Nomura Research Institute, Ltd. All rights reserved. 120Source: China Statistical Yearbook
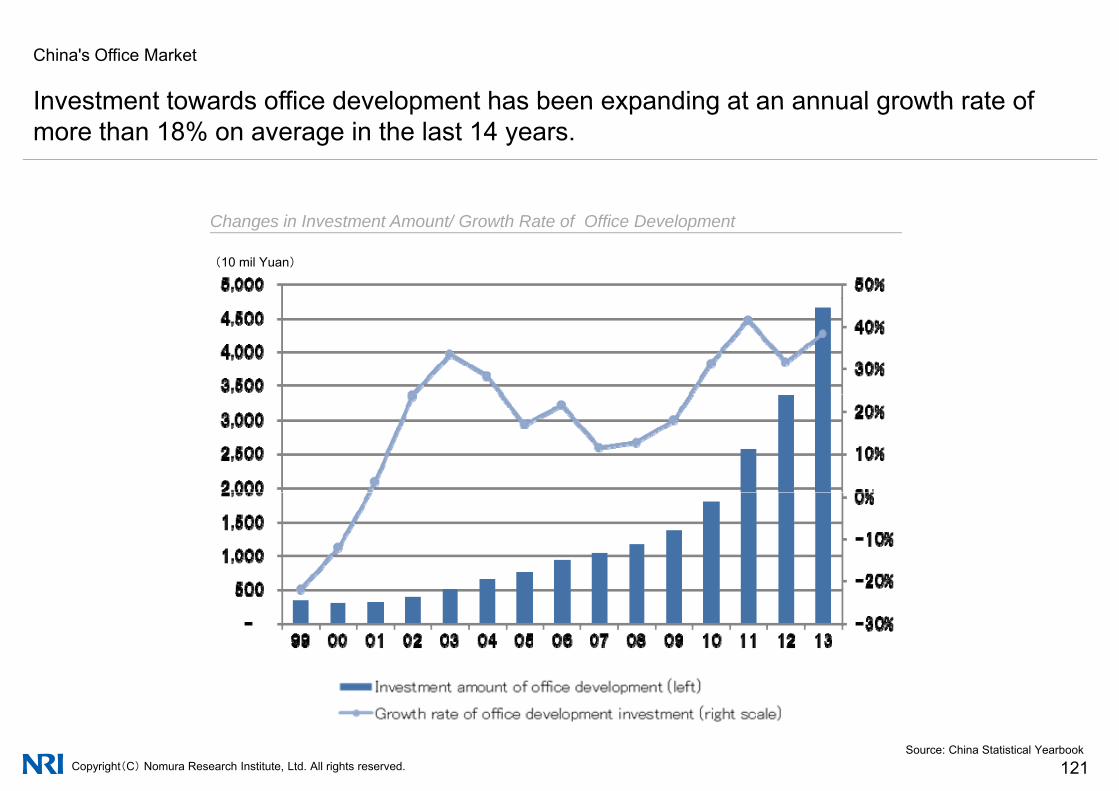
China's Office Market
Investment towards office development has been expanding at an annual growth rate ofInvestment towards office development has been expanding at an annual growth rate of more than 18% on average in the last 14 years.
(10 mil Yuan)
Changes in Investment Amount/ Growth Rate of Office Development
Copyright(C) Nomura Research Institute, Ltd. All rights reserved. 121Source: China Statistical Yearbook
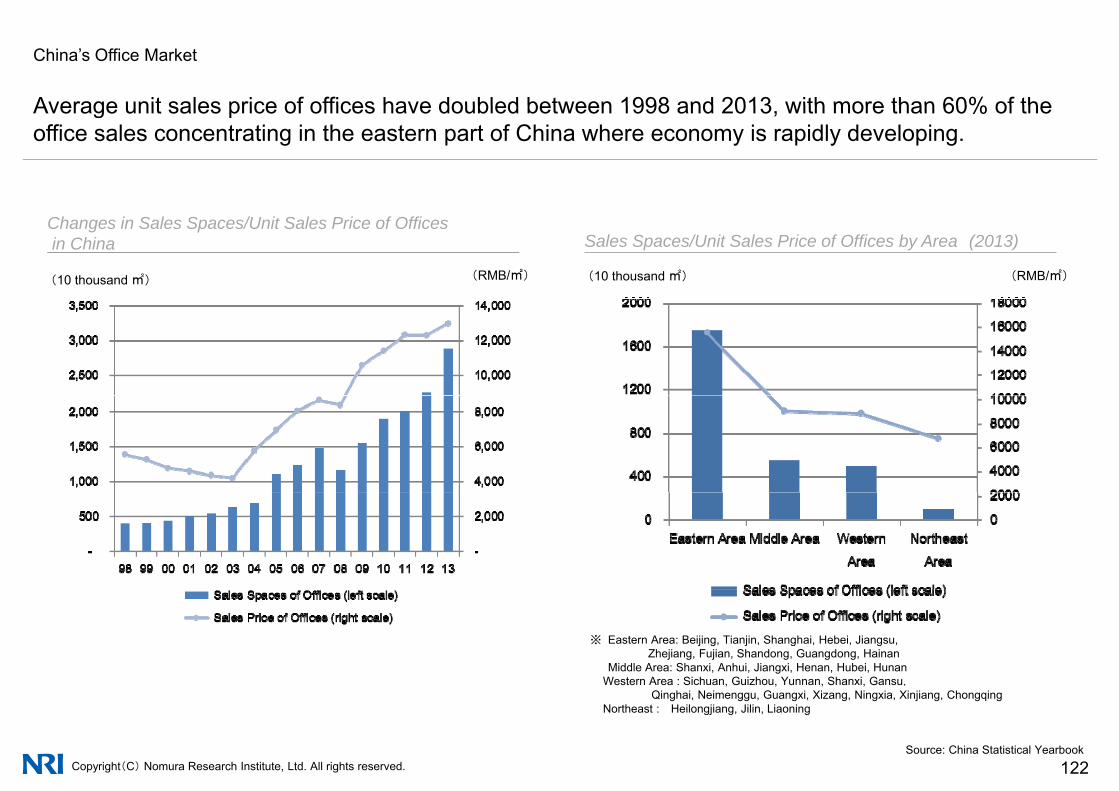
China’s Office Market
Average unit sales price of offices have doubled between 1998 and 2013 with more than 60% of theAverage unit sales price of offices have doubled between 1998 and 2013, with more than 60% of the office sales concentrating in the eastern part of China where economy is rapidly developing.
(RMB/㎡) (RMB/㎡)(10 thousand ㎡) (10 thousand ㎡)
Changes in Sales Spaces/Unit Sales Price of Officesin China Sales Spaces/Unit Sales Price of Offices by Area (2013)
※ Eastern Area: Beijing, Tianjin, Shanghai, Hebei, Jiangsu, Zhejiang, Fujian, Shandong, Guangdong, Hainan
Middle Area: Shanxi, Anhui, Jiangxi, Henan, Hubei, HunanWestern Area : Sichuan, Guizhou, Yunnan, Shanxi, Gansu,
Copyright(C) Nomura Research Institute, Ltd. All rights reserved. 122
, , , ,Qinghai, Neimenggu, Guangxi, Xizang, Ningxia, Xinjiang, Chongqing
Northeast : Heilongjiang, Jilin, Liaoning
Source: China Statistical Yearbook

China’s Office Market
Approx 30% of office sales in 2013 was concentrated in Yangtze River Delta Area (Shanghai JiangsuApprox. 30% of office sales in 2013 was concentrated in Yangtze River Delta Area (Shanghai, Jiangsu and Zhejiang). Office sales in regions such as Heilongjiang and Guizhou have dramatically increased.
(10 thousand ㎡)
Comparison of Office Sales Spaces by Region
Copyright(C) Nomura Research Institute, Ltd. All rights reserved. 123Source: China Statistical Yearbook

China's Office Market
Demand for offices in central Beijing has been increasing in the last 2 yearsDemand for offices in central Beijing has been increasing in the last 2 years. This has created low vacancy rate, and accordingly, the office rent has risen.
Changes in Office Rent in Each District of Central BeijingMap of Central Beijing
(RMB/㎡/Month)
Rent/Vacancy Rate of Offices in Central Beijing of Sep-Dec 2014Office Stock in Central Beijing as of Dec 2014(10 thousand ㎡)
(RMB/㎡/Month)
Rent/Vacancy Rate of Offices in Central Beijing of Sep Dec 2014j g
Copyright(C) Nomura Research Institute, Ltd. All rights reserved. 124Source) Made by NRI based on the published data of DTZ (Debenham, Tewson & Chinnocks)

China's Office Market
Vacancy rate is low in 3 districts of Shanghai Jingan Huangpu and Puding where the high-Vacancy rate is low in 3 districts of Shanghai, Jingan, Huangpu and Puding where the highrise office buildings are concentrated and the rent is high.
(RMB/㎡/Month)
Changes in Office Rent in Each District of Central ShanghaiMap of Central Shanghai(RMB/㎡/Month)
Rent/Vacancy Rate of Offices in Central Shanghai of Sep-Dec 2014Office Stock in Central Shanghai as of September 2013(万㎡)
(RMB/㎡/Month)
Rent/Vacancy Rate of Offices in Central Shanghai of Sep Dec 2014g p
Copyright(C) Nomura Research Institute, Ltd. All rights reserved. 125Source) Made by NRI based on the published data of DTZ

Commercial property market in China: Trend of large-scale comprehensive development
Large scale and comprehensive development of commercial properties was seen in many cities inLarge-scale and comprehensive development of commercial properties was seen in many cities in China in recent years, particularly in tier 2 and inland cities. There is a risk of excessive construction.
In recent years there was a fast development of "urban complex" which is a large-scale commercial building that includes houses In recent years, there was a fast development of urban complex , which is a large-scale commercial building that includes houses, stores, offices, hotels, and entertainment facilities, in many cities in China. Chengdu, Shenyang, and Chongqing are top three cities in terms of existing and future development volume.
D l t f b l i j iti i Chi D l t f b l i j iti i ChiDevelopment of urban complexes in major cities in China (as of end of 2013)
Development of urban complexes in major cities in China (Estimated development volume from 2014 to 2016)
Copyright(C) Nomura Research Institute, Ltd. All rights reserved. 126
Source: Public information of Qianzhan Industry Research Institute. Note: The label number is the number of urban complexes.

Prospects of commercial real estate market in China
In 2015 there will be higher needs for high-quality and efficient commercial facilitiesIn 2015, there will be higher needs for high quality and efficient commercial facilities, including E-business, which goes beyond comprehensive and large-scale complexes.
Directions of China's real estate market in 2015
U b i ti d d l t f th thi d i d t1
Urbanization and development of the third industry result in higher needs for improved urban service
functions
Instead of traditional commercial facilities, high-efficiency, high-quality commercial facilities are
highly needed.
Higher influence of E-business on consumers Higher needs for change of business category and introduction of E-business in commercial facilities
due to the increasing popularity of Internet
2
due to the increasing popularity of Internet shopping
3Higher risk of development of large-scale
commercial facilities due to high vacancy rate and difficulties in attracting tenants
Higher needs for medium-scale street-type commercial facilities (but not large-scale ones)
3
Copyright(C) Nomura Research Institute, Ltd. All rights reserved. 127
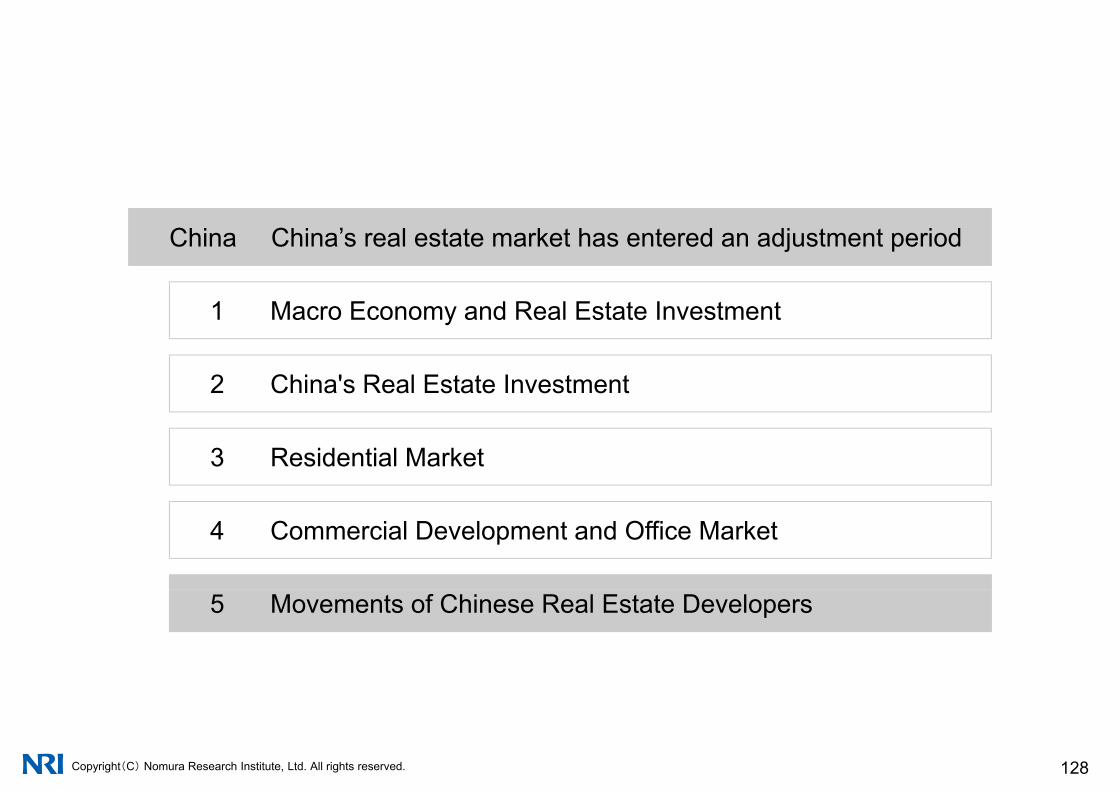
China China’s real estate market has entered an adjustment period
1 Macro Economy and Real Estate Investment
2 China's Real Estate Investment
3 Residential Market
4 Commercial Development and Office Market
5 Movements of Chinese Real Estate Developers
Copyright(C) Nomura Research Institute, Ltd. All rights reserved. 128

Movements of Chinese Real Estate Developers
Despite of the housing suppression policy top 10 players in housing development in tier 1Despite of the housing suppression policy, top 10 players in housing development in tier 1 and 2, and even tier 3 and 4 cities grew significantly and are enjoying higher market share.
Comparison of Developers Top 10(2010~2014)
Rank
2010 2011 2012 2013 2014
Company NameTotal Sales
(100 mil Yuan)
Company NameTotal Sales
(100 mil Yuan)
Company NameTotal Sales
(100 mil Yuan)
Company NameTotal Sales
(100 mil Yuan)
Company NameTotal Sales
(100 mil Yuan)
1 Vanke Group 1,026 Vanke Group 1,215 Vanke Group 1,452 Vanke Group 1,776 Vanke Group 2,120
2 Poly Group 660 Dalian Wanda Group 953 Poly Group 1020Shanghai Greenland
Group 1,625 Shanghai Greenland Group 2,080
3 Shanghai Greenland Group 650 Evergrande Group 804 Shanghai
Greenland Group 1013 Poly Group 1,251 DalianWanda Group 1,501
4 China Overseas Land 578 Shanghai
Greenland Group 770 China Overseas Land 945 China Overseas
Land 1,103 Evergrande Group 1,376Land Greenland Group Land Land
5 Evergrande Group 527 Poly Group 732 Dalian Wanda Group 938 Evergrande Group 1,073 Poly Group 1,362
6 China Greentown 522 China Overseas Land 708 Evergrande Group 925 Country Garden 1,068 Country Garden 1,250
Dalian Wanda China Overseas 7 Dalian Wanda
Group 369 Country Garden 432 China Greentown 547Dalian Wanda Group 844 Land 1,152
8 Longfor Group 336 Longfor Group 383 Crland China 505 Crland China 688 Shimao Property Holdings 708
9 Country Garden 330 China Greentown 353 Country Garden 491 Shimao Property Holdings 683 Crland China 700 Holdings
10 R&F Properties 321 Crland China 330 Shimao Property Holdings 461 China Greentown 660 Sunac China 658
Total Sales of Developers Top 10 5,319 6,680 8,297 10,771 12,907
The Percentage of Developers Top 10 10.1% 11.3% 12.9% 13.3% 16.9%
Copyright(C) Nomura Research Institute, Ltd. All rights reserved. 129
Forge Ahead Cities(Average of Developers Top 10
30.6Cites 40.5Cities 53.1Cites 67.2Cites 73.7Cites
Source) Made on the data of Each company’s Homepage
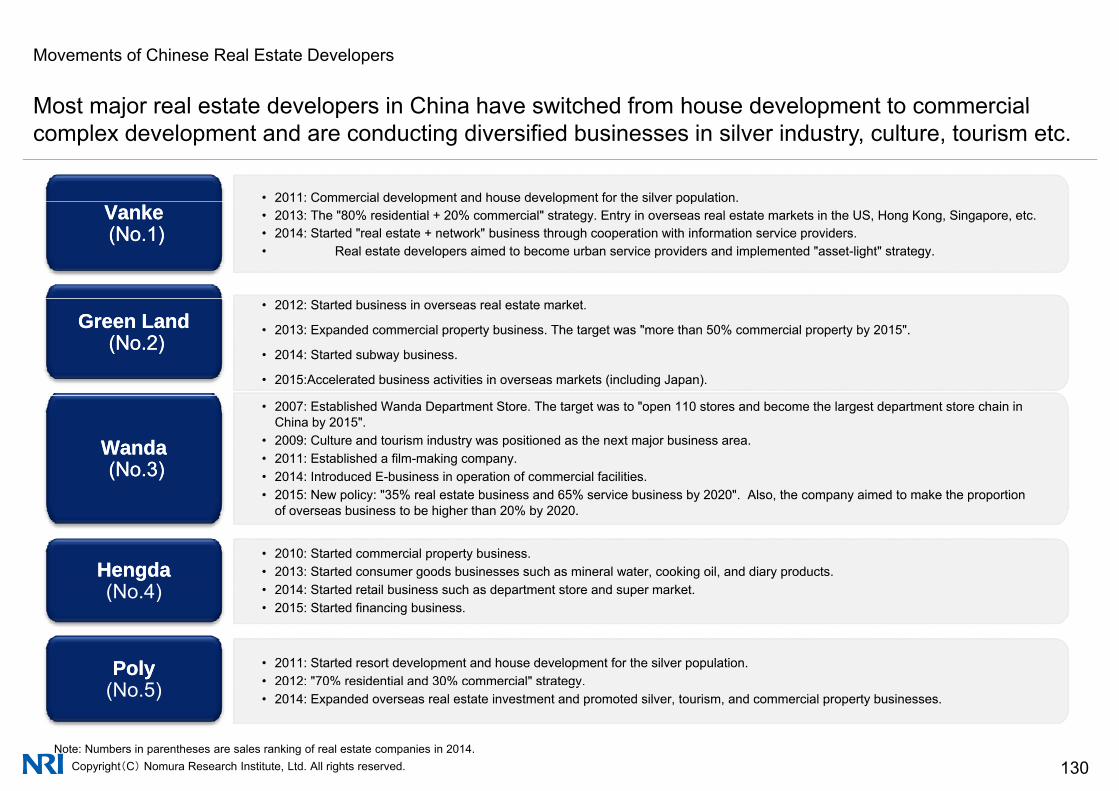
Movements of Chinese Real Estate Developers
Most major real estate developers in China have switched from house development to commercialMost major real estate developers in China have switched from house development to commercial complex development and are conducting diversified businesses in silver industry, culture, tourism etc.
• 2011: Commercial development and house development for the silver population.• 2011: Commercial development and house development for the silver population.2011: Commercial development and house development for the silver population. • 2013: The "80% residential + 20% commercial" strategy. Entry in overseas real estate markets in the US, Hong Kong, Singapore, etc. • 2014: Started "real estate + network" business through cooperation with information service providers. • Real estate developers aimed to become urban service providers and implemented "asset-light" strategy.
2011: Commercial development and house development for the silver population. • 2013: The "80% residential + 20% commercial" strategy. Entry in overseas real estate markets in the US, Hong Kong, Singapore, etc. • 2014: Started "real estate + network" business through cooperation with information service providers. • Real estate developers aimed to become urban service providers and implemented "asset-light" strategy.
VankeVanke(No.1) (No.1)
• 2012: Started business in overseas real estate market.
• 2013: Expanded commercial property business. The target was "more than 50% commercial property by 2015".
• 2014: Started subway business.
• 2015:Accelerated business activities in overseas markets (including Japan).
• 2012: Started business in overseas real estate market.
• 2013: Expanded commercial property business. The target was "more than 50% commercial property by 2015".
• 2014: Started subway business.
• 2015:Accelerated business activities in overseas markets (including Japan).
Green LandGreen Land(No.2) (No.2)
• 2007: Established Wanda Department Store. The target was to "open 110 stores and become the largest department store chain inChina by 2015".
• 2009: Culture and tourism industry was positioned as the next major business area. • 2011: Established a film-making company. • 2014: Introduced E-business in operation of commercial facilities.
2015: New policy: "35% real estate business and 65% service business by 2020" Also the company aimed to make the proportion
WandaWanda(No.3) (No.3)
• 2015: New policy: "35% real estate business and 65% service business by 2020". Also, the company aimed to make the proportion of overseas business to be higher than 20% by 2020.
• 2015: New policy: "35% real estate business and 65% service business by 2020". Also, the company aimed to make the proportion of overseas business to be higher than 20% by 2020.
HengdaHengda(No 4)
• 2010: Started commercial property business. • 2013: Started consumer goods businesses such as mineral water, cooking oil, and diary products. • 2014: Started retail business such as department store and super market
• 2010: Started commercial property business. • 2013: Started consumer goods businesses such as mineral water, cooking oil, and diary products. • 2014: Started retail business such as department store and super market(No.4)
PolyPoly(No 5)
• 2014: Started retail business such as department store and super market. • 2015: Started financing business. • 2014: Started retail business such as department store and super market. • 2015: Started financing business.
• 2011: Started resort development and house development for the silver population. • 2012: "70% residential and 30% commercial" strategy. • 2011: Started resort development and house development for the silver population. • 2012: "70% residential and 30% commercial" strategy.
Copyright(C) Nomura Research Institute, Ltd. All rights reserved. 130Note: Numbers in parentheses are sales ranking of real estate companies in 2014.
(No.5) gy• 2014: Expanded overseas real estate investment and promoted silver, tourism, and commercial property businesses.
gy• 2014: Expanded overseas real estate investment and promoted silver, tourism, and commercial property businesses.

Movements of Chinese Real Estate Developers: Overseas investment
Real estate is the third popular overseas business for Chinese companies Other two are
Looking at large-scale overseas investment projects (USD 100 million above) of Chinese companies from 2005 to 2013 it is able to see
Real estate is the third popular overseas business for Chinese companies. Other two are energy and mining businesses.
Looking at large-scale overseas investment projects (USD 100 million above) of Chinese companies from 2005 to 2013, it is able to see that 12.3% (67) of 545 projects were related to real estate development. The figure was 30.1% for energy and 22.8% for miningindustry.
Although insurance companies, commercial banks, and investment funds were also investing in overseas real estate. Major Chinese real estate developers are main players.
Most Chinese investors focus on overseas commercial properties, but not residential properties.
Overseas real estate investment of Chinese companies(2003-2013)
Overseas investment of China’s real estate companies (2003-2013)
Copyright(C) Nomura Research Institute, Ltd. All rights reserved. 131
Source: NRI analysis of open information.
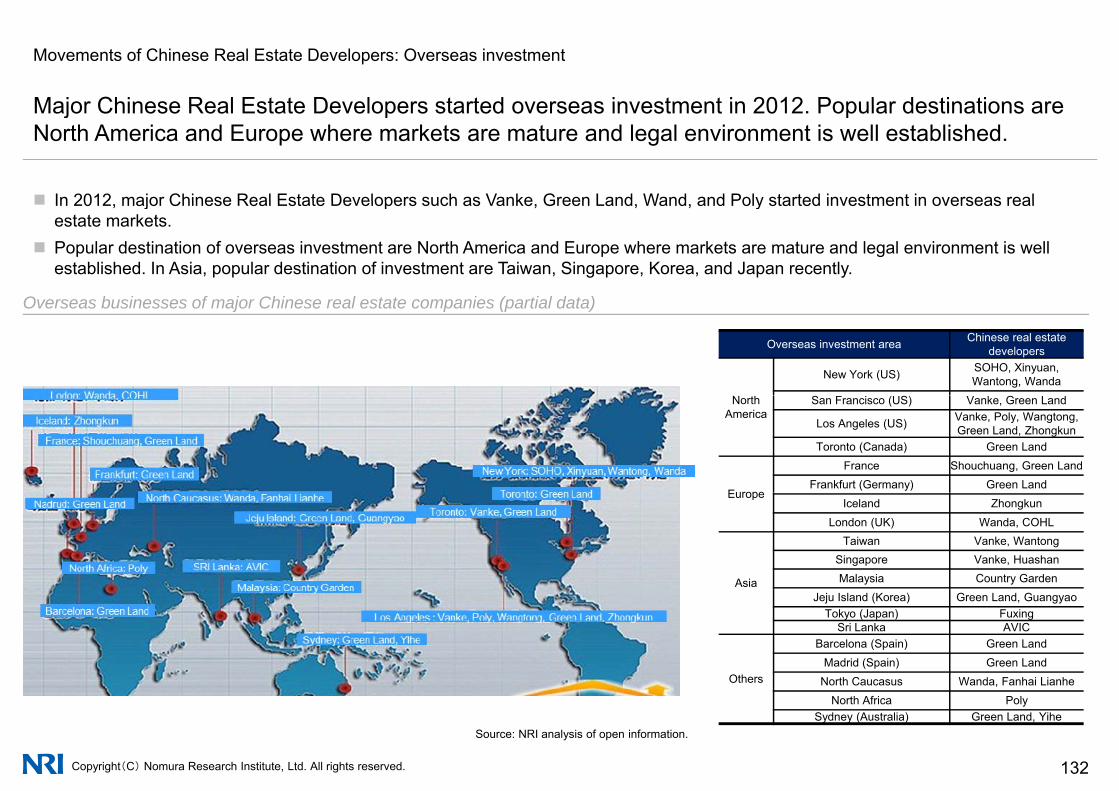
Movements of Chinese Real Estate Developers: Overseas investment
Major Chinese Real Estate Developers started overseas investment in 2012 Popular destinations are
In 2012 major Chinese Real Estate Developers such as Vanke Green Land Wand and Poly started investment in overseas real
Major Chinese Real Estate Developers started overseas investment in 2012. Popular destinations are North America and Europe where markets are mature and legal environment is well established.
In 2012, major Chinese Real Estate Developers such as Vanke, Green Land, Wand, and Poly started investment in overseas real estate markets.
Popular destination of overseas investment are North America and Europe where markets are mature and legal environment is well established. In Asia, popular destination of investment are Taiwan, Singapore, Korea, and Japan recently.
O b i f j Chi l t t i ( ti l d t )
Overseas investment area Chinese real estate developers
New York (US) SOHO, Xinyuan,Wantong, Wanda
Overseas businesses of major Chinese real estate companies (partial data)
North America
San Francisco (US) Vanke, Green Land
Los Angeles (US) Vanke, Poly, Wangtong, Green Land, Zhongkun
Toronto (Canada) Green Land
Europe
France Shouchuang, Green LandFrankfurt (Germany) Green Land
EuropeIceland Zhongkun
London (UK) Wanda, COHL
Asia
Taiwan Vanke, WantongSingapore Vanke, HuashanMalaysia Country Garden
Jeju Island (Korea) Green Land, GuangyaoTokyo (Japan) Fuxing
Sri Lanka AVIC
Others
Barcelona (Spain) Green LandMadrid (Spain) Green Land
North Caucasus Wanda, Fanhai Lianhe
Copyright(C) Nomura Research Institute, Ltd. All rights reserved. 132
,North Africa Poly
Sydney (Australia) Green Land, YiheSource: NRI analysis of open information.

Movements of Chinese Real Estate Developers
Future prospects of Chinese Real Estate Developers
Future prospects of Chinese Real Estate Developers
Reduction of profit rate of real estate Rapid growth in real estate business
p p p
1Reduction of profit rate of real estate
business Increased investment risk
Rapid growth in real estate business requires business review for strengthening
expertise etc.
Rapid growth in non-real estate businesses results in model change for diversified Cross-industry cooperation and inter-
company acquisition
2
gbusiness operation
company acquisition
3Higher pressure in return of fund of existing
businesses Discovery of new revenue/business
models (asset-light)
3
Copyright(C) Nomura Research Institute, Ltd. All rights reserved. 133

Japan Japanese Real Estate Investment Market
China China’s market entering an adjustment period
Korea Increase of liquidity within slow economic growthq y g
Taiwan Overview of Office, Residential and Hotel Markets
Singapore Domestic real estate market reaching its peak
India Real Estate Market in India – Residential, Office, etc.
Copyright(C) Nomura Research Institute, Ltd. All rights reserved. 134
Korea Increase of liquidity within slow economic growth
1 Business trends and Office Market Trends
1-1 Business Trends
1-2 Office Market Trend
2 Household Economy and Housing market trendsy g
3 Hotel Market trends
4 Indirect Investment Market Trends
Copyright(C) Nomura Research Institute, Ltd. All rights reserved. 135
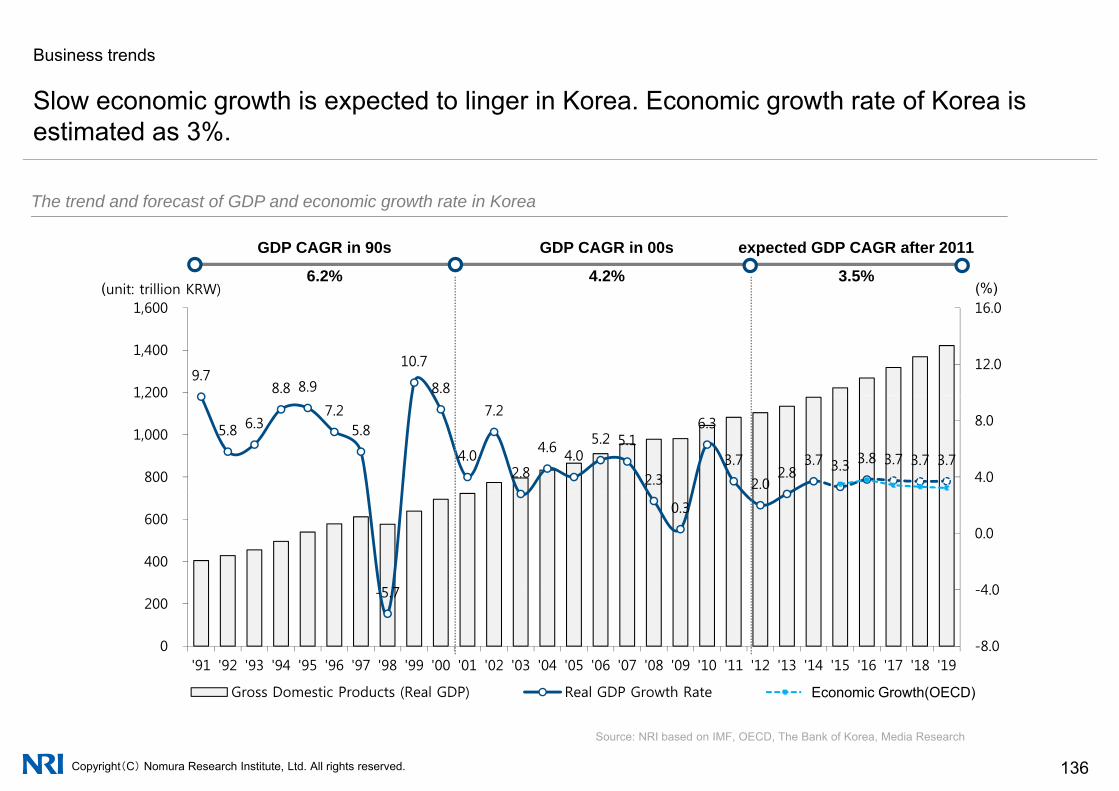
Business trends
Slow economic growth is expected to linger in Korea Economic growth rate of Korea isSlow economic growth is expected to linger in Korea. Economic growth rate of Korea is estimated as 3%.
The trend and forecast of GDP and economic growth rate in KoreaThe trend and forecast of GDP and economic growth rate in Korea
(unit: trillion KRW) (%)
GDP CAGR in 90s
6.2%
GDP CAGR in 00s
4.2%
expected GDP CAGR after 2011
3.5%
9.7 8.8 8.9
10.7
8.8
12.0
16.0
1 200
1,400
1,600
5.8 6.3 7.2
5.8
4.0
7.2
2.8
4.6 4.0 5.2 5.1
2.3
6.3
3.7
2.0 2.8
3.7 3.3 3.8 3.7 3.7 3.7 4.0
8.0
800
1,000
1,200
5 7
0.3
4 0
0.0
400
600
-5.7
-8.0
-4.0
0
200
'91 '92 '93 '94 '95 '96 '97 '98 '99 '00 '01 '02 '03 '04 '05 '06 '07 '08 '09 '10 '11 '12 '13 '14 '15 '16 '17 '18 '19
d l l h 경제성장
Copyright(C) Nomura Research Institute, Ltd. All rights reserved. 136
Source: NRI based on IMF, OECD, The Bank of Korea, Media Research
Gross Domestic Products (Real GDP) Real GDP Growth Rate 경제성장률(OECD)Economic Growth(OECD)

Business trends
Total industry revenue in Korea is 2 290 trillion KRW with manufacturing industryTotal industry revenue in Korea is 2,290 trillion KRW, with manufacturing industry comprising 55% of the total. Growth rate in all industries have been slowing down.
T t l d ti i d t l (’11 ’13)Total domestic industry sales (’11-’13)
Non-manufacturing
manufacturing
(unit: trillion KRW, %)
2,262 2,2902 103
AllManu-
facturingNon-manu-facturing
1,600814
983(43%)
1,030(45%)
1,849
907(43%)
2,103’09~’13 9% 10% 9%
737(46%)
(44%)
1 2601 2791 196
’11~’13 4% 3% 7%
864(54%)
1,036(56%)
1,260(55%)
1,279(57%)
1,196(57%)
’12~’13 1% -2% 5%
Copyright(C) Nomura Research Institute, Ltd. All rights reserved. 137
2009 2010 2011 2012 2013
Source: NRI based on National Statistical Office(KOSTAT)
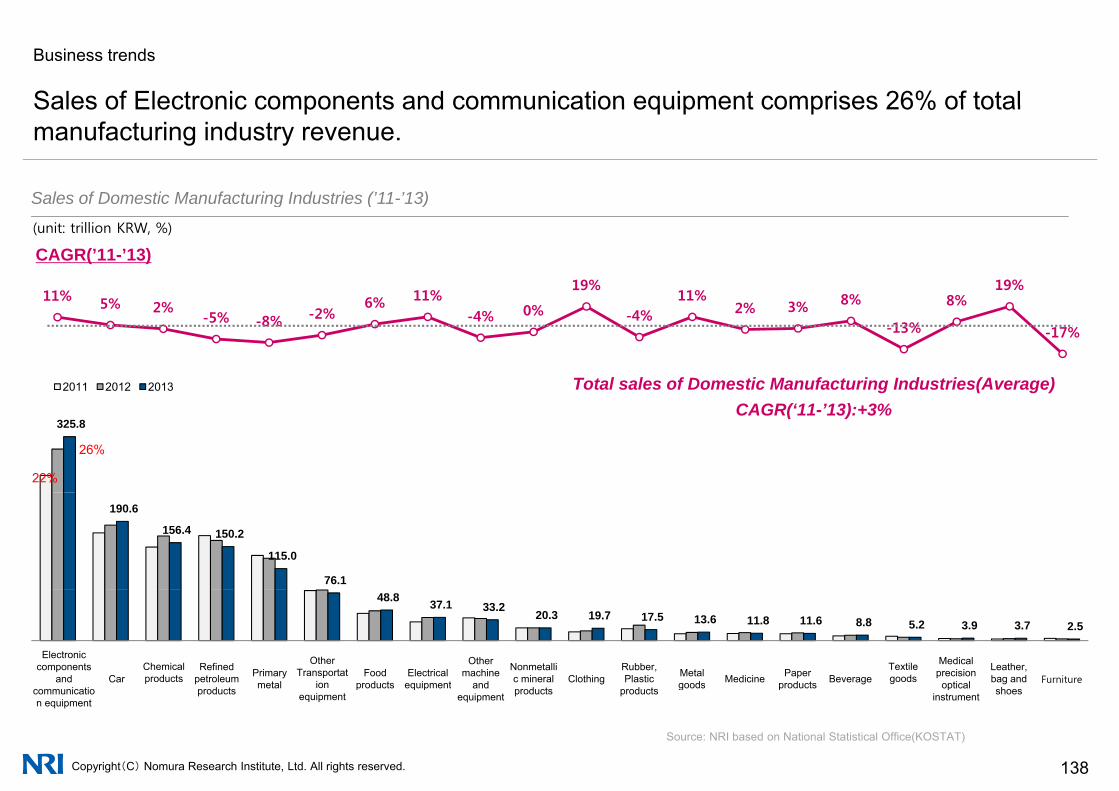
Business trends
Sales of Electronic components and communication equipment comprises 26% of totalSales of Electronic components and communication equipment comprises 26% of total manufacturing industry revenue.
Sales of Domestic Manufacturing Industries (’11-’13)
11% 5% 6% 11%19%
11% 8% 8%19%
Sales of Domestic Manufacturing Industries ( 11 13)
CAGR(’11-’13)(unit: trillion KRW, %)
11% 5% 2%-5% -8% -2%
6% 11%-4% 0% -4%
11%2% 3% 8%
-13%
8%
-17%
2011 2012 2013 Total sales of Domestic Manufacturing Industries(Average)
325.8 CAGR(‘11-’13):+3%
22%
26%
190.6
156.4 150.2
115.0
76.1 48.8 37.1 33.2
20.3 19.7 17.5 13.6 11.8 11.6 8.8 5.2 3.9 3.7 2.5
Electronic components
and CarChemical products
Refined petroleum Primary
metal
Other Transportat
ionFood
productsElectrical
equipment
Other machine
and
Nonmetallic mineral Clothing
Rubber, Plastic Metal
goods Medicine Paper products Beverage
Textile goods
Medical precision optical
Leather, bag and Furniture
Copyright(C) Nomura Research Institute, Ltd. All rights reserved. 138
communication equipment
products metal ion equipment
products equipment and equipment products products goods products optical
instrument shoes
Source: NRI based on National Statistical Office(KOSTAT)
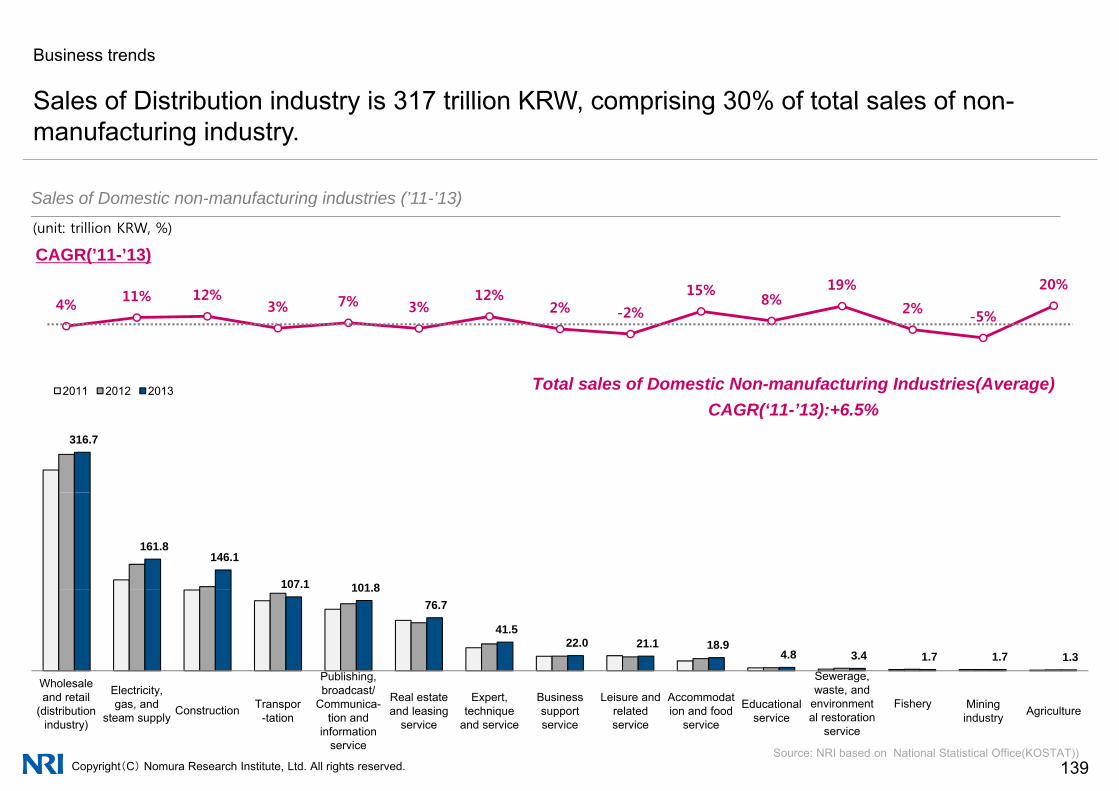
Business trends
Sales of Distribution industry is 317 trillion KRW comprising 30% of total sales of non-Sales of Distribution industry is 317 trillion KRW, comprising 30% of total sales of nonmanufacturing industry.
Sales of Domestic non-manufacturing industries (’11-’13)Sales of Domestic non manufacturing industries ( 11 13)
11% 12% 7% 12% 15%8%
19% 20%
CAGR(’11-’13)(unit: trillion KRW, %)
2011 2012 2013 Total sales of Domestic Non-manufacturing Industries(Average)
4%11% 12%
3% 7% 3%12%
2% -2%8%
2% -5%
316.7
CAGR(‘11-’13):+6.5%
161.8 146.1
107.1 101 8101.8 76.7
41.5 22.0 21.1 18.9
4.8 3.4 1.7 1.7 1.3
Wholesale El t i itPublishing, b d t/
Sewerage, t d
Copyright(C) Nomura Research Institute, Ltd. All rights reserved. 139
Wholesale and retail
(distribution industry)
Electricity, gas, and
steam supply Construction Transpor-tation
broadcast/Communica-
tion and information
service
Real estate and leasing
service
Expert, technique
and service
Business support service
Leisure and related service
Accommodation and food
service
Educational service
waste, and environmental restoration
service
Fishery Mining industry Agriculture
Source: NRI based on National Statistical Office(KOSTAT))

Business trendsIn terms of aggregate market value of listed companies, information and communication, and semi-conductor industry accounts for the highest That of healthcare industry in past 3 years demonstratesconductor industry accounts for the highest. That of healthcare industry in past 3 years demonstrates the highest growth rate at approx. 27%.
Aggregate Market Value by industry (KRX, ’11-’14)Aggregate Market Value by industry (KRX, 11 14)
15% 15%9%
27%
11% 10% 8% 6% 7%
Growth rate of aggregate market value of all industries: 4%CAGR(’11-’14)
(unit: trillion KRW, %)
-4%2%
9% 10%
-15%
8%
-18%
-6%-13%
0%6%
1%7%
Healthcarehighest growth rate of aggregate market value
242
320
250
319
237
330
240 2011
120
179
92 113
97
70
132
89 75 72
108
74 79
2012
2013
2014
29 11
31
57
11
39 20
36 56 65 66
17
46 30
14 33
67
13 37
22 38
55 67 70
19
48 40 17
40 62
12 28
18 41
51 75 72
16
53 31
17
47
74
23 24 25 20
46 61 65
79
18
56
자동차 소비자유통 레저 미디어/통신 필수소비재 헬스케어 정보통신 반도체 건설 운송 조선 철강 에너지/화학 은행 비은행금융 증권 보험
Car Distribution LeisureMedia/Telecommunica Consumer Health care ICT Semicon- Construc- Transpor- Ship
steelEnergy/ banking Non-bank Stock insurance
Copyright(C) Nomura Research Institute, Ltd. All rights reserved. 140
Source: NRI based on Financial Supervisory Service
Car Distribution Leisure communication goods Health care ICT ductor tion tation building steel
gychemical
banking financial Stock insurance
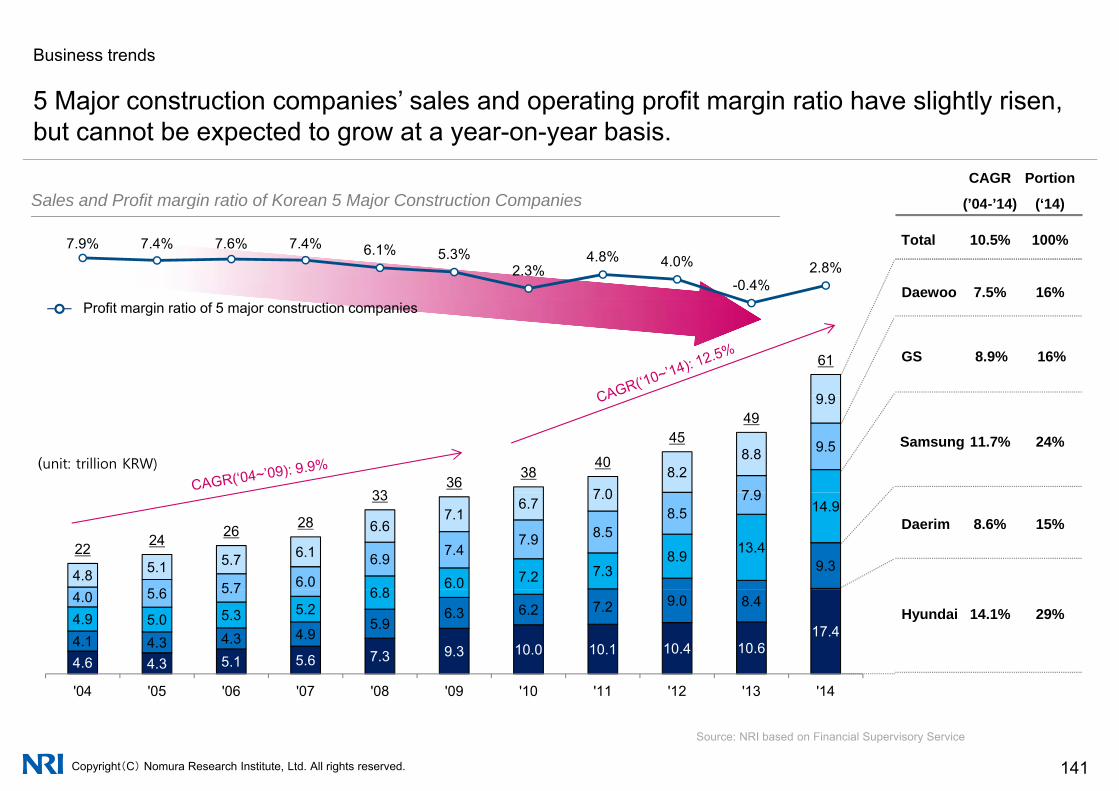
Business trends
5 Major construction companies’ sales and operating profit margin ratio have slightly risen5 Major construction companies sales and operating profit margin ratio have slightly risen, but cannot be expected to grow at a year-on-year basis.
Sales and Profit margin ratio of Korean 5 Major Construction CompaniesCAGR
(’04 ’14)
Portion
(‘14)Sales and Profit margin ratio of Korean 5 Major Construction Companies
Daewoo 7.5% 16%
7.9% 7.4% 7.6% 7.4% 6.1% 5.3%2.3%
4.8% 4.0%-0.4%
2.8%
(’04-’14) (‘14)
Total 10.5% 100%
9 9
61 GS 8.9% 16%
Profit margin ratio of 5 major construction companies
7 9
9.5
7 08.2
8.8
9.9
3336
3840
4549
Samsung 11.7% 24%(unit: trillion KRW)
9.3
6 86.0 7.2 7.3
8.9 13.4
14.9
5 6 5 7 6.0 6.9 7.4
7.9 8.5 8.5
7.9
4.8 5.1 5.7 6.1
6.6 7.1
6.7 7.0
22 24 26 28
33
Daerim 8.6% 15%
4.6 4.3 5.1 5.6 7.3 9.3 10.0 10.1 10.4 10.6 17.4
4.1 4.3 4.3 4.9 5.9
6.3 6.2 7.2 9.0 8.4 4.9 5.0 5.3 5.2
6.8 4.0 5.6 5.7
'04 '05 '06 '07 '08 '09 '10 '11 '12 '13 '14
Hyundai 14.1% 29%
Copyright(C) Nomura Research Institute, Ltd. All rights reserved. 141
Source: NRI based on Financial Supervisory Service
'04 '05 '06 '07 '08 '09 '10 '11 '12 '13 '14

Business trends
Investment in construction and facilities and its ratio to GDP has topped out in 2011.
Investment on Construction and Facilities, and its ratio to GDP
26.1%24.7%
25.9% 25.2% 25.4% 25.4% 24.6%22.7%
19 7% 19 3%
Since 1991, wane in construction and facilities investment Especially, falling rate of construction investment is high
19.7%18.1% 18.5% 18.3%
19.3% 18.7% 18.0% 17.2% 16.6% 15.7% 16.2%14.7%
13.5% 12.9% 13.5%13.1%11 3%10 8%
11.8%12.8% 13.1%
11 3% 10 8%
Construction Investment Ratio to GDP(Real)
Facilities Investment Ration to GDP(Real)
11.3%10.8% 10.2%11.3%
7.1%8.9%
10.8%9.5% 9.6% 9.2% 9.1% 9.2% 9.5% 9.8% 9.5%
8.6%10.1% 10.1% 9.7% 9.3% 9.5%
Construction Investment Facilities Investment
105 106 118 125 137 147 150 131 126 126 133 142 154 156 155 156 158 154 159 153 146 143 153 154
58 69 76 69 5775 69 74 73 76 80 86 94 93 84
106 109 107 106 112
(unit: trillion KRW)
46 46 46 58 41
57
'91 '92 '93 '94 '95 '96 '97 '98 '99 '00 '01 '02 '03 '04 '05 '06 '07 '08 '09 '10 '11 '12 '13 '14
Copyright(C) Nomura Research Institute, Ltd. All rights reserved. 142
Source: NRI based on The Bank of Korea, National Statistical Office(KOSTAT))

Business trends
Though foreign direct investment has dramatically soared since 2006 its total size of investmentThough foreign direct investment has dramatically soared since 2006, its total size of investment and average amount per investment has been reduced.
Size of Foreign Direct Investment
5.8 5 2
Size of Foreign Direct Investment
Average amount per investment
(unit: million USD)
2.2 2.2 2 1 2.2 2.2
3.5
2 0 1 92.5
3.5 4.1 4.2
5.2 4.5 4.3 Rapid increase in foreign direct
investment since 2006
2.2 1.4 1.4
2.1 2.0 1.6 1.6 1.4 1.2 1.2 1.1
1.9
30
37
3134
46
39
35 35
19
30 31
overseas direct investment
(Unit: billion USD)
2 2 2 4 5 7 6 6 5 6 6 7 6
9 10
Copyright(C) Nomura Research Institute, Ltd. All rights reserved. 143
'91 '92 '93 '94 '95 '96 '97 '98 '99 '00 '01 '02 '03 '04 '05 '06 '07 '08 '09 '10 '11 '12 '13 '14
Source: NRI based on National Statistical Office(KOSTAT))

Business trends
Interest rate consistently dropped to 1% after the bankruptcy of Lehman Brothers in 2008 LowInterest rate consistently dropped to 1% after the bankruptcy of Lehman Brothers in 2008. Low interest rate is expected to lead increment on liquidity.
Korea Interest Rate (‘97-’14)Korea Interest Rate ( 97- 14)
(단위: %)16
10yr Treasury Bond(average)
3yr Corporate Bond(average)
CD 91days
(단위: %)
12
14 CD 91days
Call Rate(1day,average)
Base Rate
3yr Treasury Bond(average)
5yr Treasury Bond(average)
8
10 5yr Treasury Bond(average)
Consistent downturn in benchmark rate since 1998
4.755.25
4 4.253 75 3 75
4.554
6
4 3.753.25
3.753
22.5
3.252.75 2.5
2 1.75
0
2
'97 '98 '99 '00 '01 '02 '03 '04 '05 '06 '07 '08 '09 '10 '11 '12 '13 '14 '15
Copyright(C) Nomura Research Institute, Ltd. All rights reserved. 144
Source: NRI based on The Bank of Korea
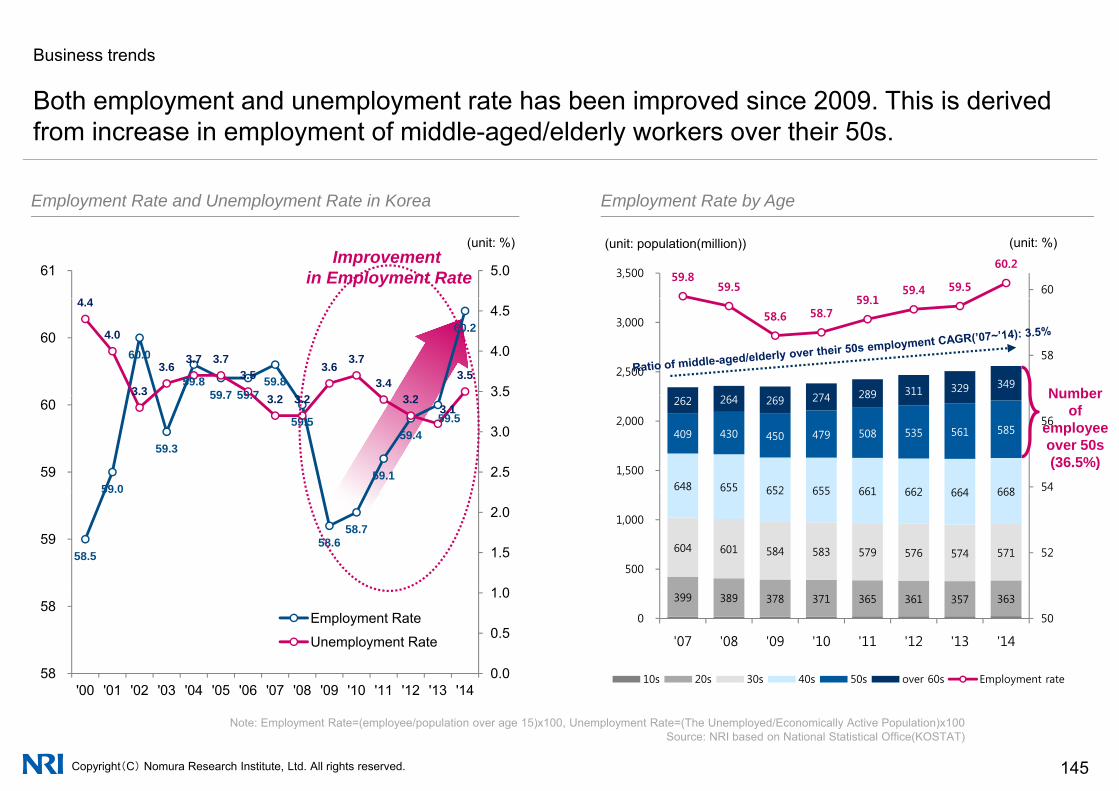
Business trends
Both employment and unemployment rate has been improved since 2009 This is derivedBoth employment and unemployment rate has been improved since 2009. This is derived from increase in employment of middle-aged/elderly workers over their 50s.
Employment Rate and Unemployment Rate in Korea Employment Rate by AgeEmployment Rate and Unemployment Rate in Korea Employment Rate by Age
4 4
5.061
(unit: %)
59.859.5
59 159.4 59.5
60.2
60 3,500
(unit: population(million)) (unit: %)Improvement
in Employment Rate
60.0
59.859 7 59 7
59.8
60.2
4.4
4.0
3.3
3.63.7 3.7
3.5
3 2 3 2
3.63.7
3.43 2
3.53.5
4.0
4.5
60
26 274 289 311 329 349
58.6 58.759.1
58 2,500
3,000
Number
59.0
59.3
59.7 59.7
59.5
59.1
59.459.5
3.2 3.2 3.23.1
2.5
3.0
3.5
59
60
648 655 652 655 661 662 664 668
409 430 450 479 508 535 561 585
262 264 269 274 289
54
56
1,500
2,000
Number of
employeeover 50s(36.5%)
58.5
59.0
58.658.7
1 0
1.5
2.0
59 604 601 584 583 579 576 574 571
652 655 661 662 664 668
52 500
1,000
0.0
0.5
1.0
58
58
'00 '01 '02 '03 '04 '05 '06 '07 '08 '09 '10 '11 '12 '13 '14
Employment Rate
Unemployment Rate
399 389 378 371 365 361 357 363
50 0
'07 '08 '09 '10 '11 '12 '13 '14
10s 20s 30s 40s 50s over 60s Employment rate
Copyright(C) Nomura Research Institute, Ltd. All rights reserved. 145
Source: NRI based on National Statistical Office(KOSTAT)Note: Employment Rate=(employee/population over age 15)x100, Unemployment Rate=(The Unemployed/Economically Active Population)x100
'00 '01 '02 '03 '04 '05 '06 '07 '08 '09 '10 '11 '12 '13 '14

Korea Increase of liquidity within slow economic growth
1 Business trends and Office Market Trends
1-1 Business Trends
1-2 Office Market Trend
2 Household Economy and Housing market trendsy g
3 Hotel Market trends
4 Indirect Investment Market Trends
Copyright(C) Nomura Research Institute, Ltd. All rights reserved. 146
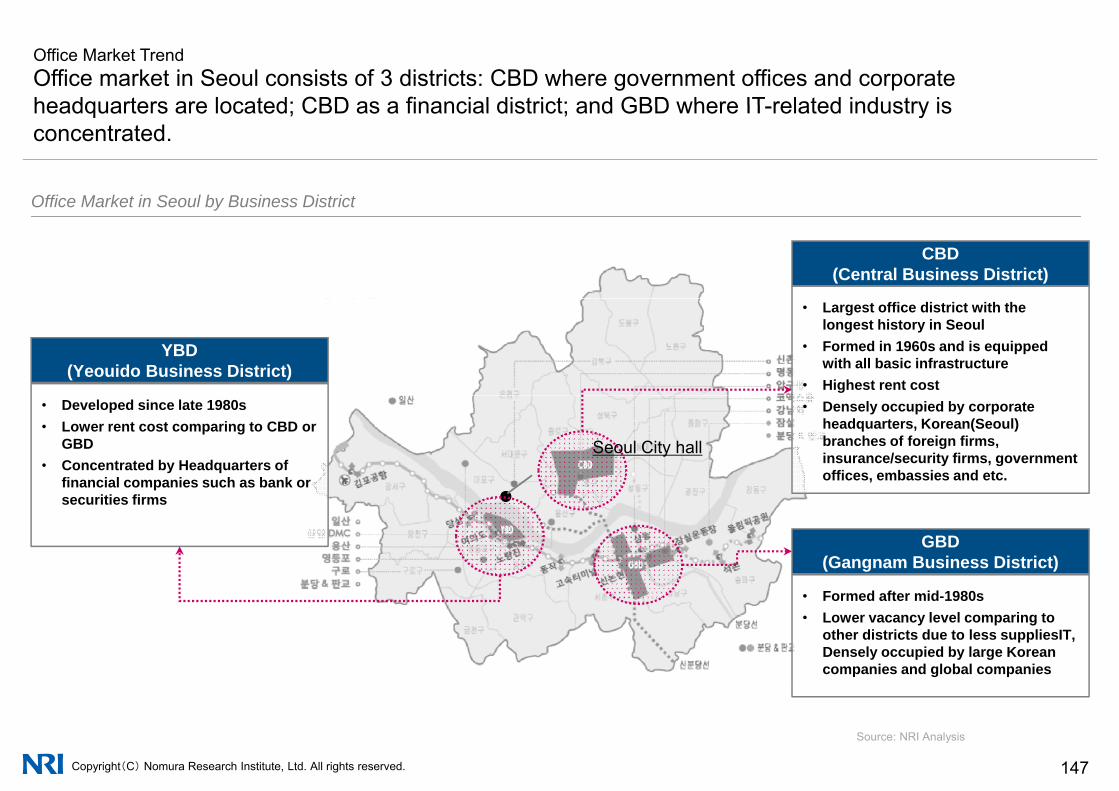
Office Market TrendOffice market in Seoul consists of 3 districts: CBD where government offices and corporate headquarters are located; CBD as a financial district; and GBD where IT related industry isheadquarters are located; CBD as a financial district; and GBD where IT-related industry is concentrated.
Office Market in Seoul by Business DistrictOffice Market in Seoul by Business District
CBD(Central Business District)
• Largest office district with the longest history in Seoul
• Formed in 1960s and is equipped with all basic infrastructure
• Highest rent cost
YBD(Yeouido Business District)
• Developed since late 1980s• Lower rent cost comparing to CBD or
GBD • Concentrated by Headquarters of
financial companies such as bank or
• Densely occupied by corporate headquarters, Korean(Seoul)branches of foreign firms, insurance/security firms, government offices, embassies and etc.
Seoul City hall
securities firms
GBD(Gangnam Business District)
• Formed after mid-1980s• Lower vacancy level comparing to
other districts due to less suppliesIT, Densely occupied by large Korean companies and global companies
Copyright(C) Nomura Research Institute, Ltd. All rights reserved. 147
Source: NRI Analysis
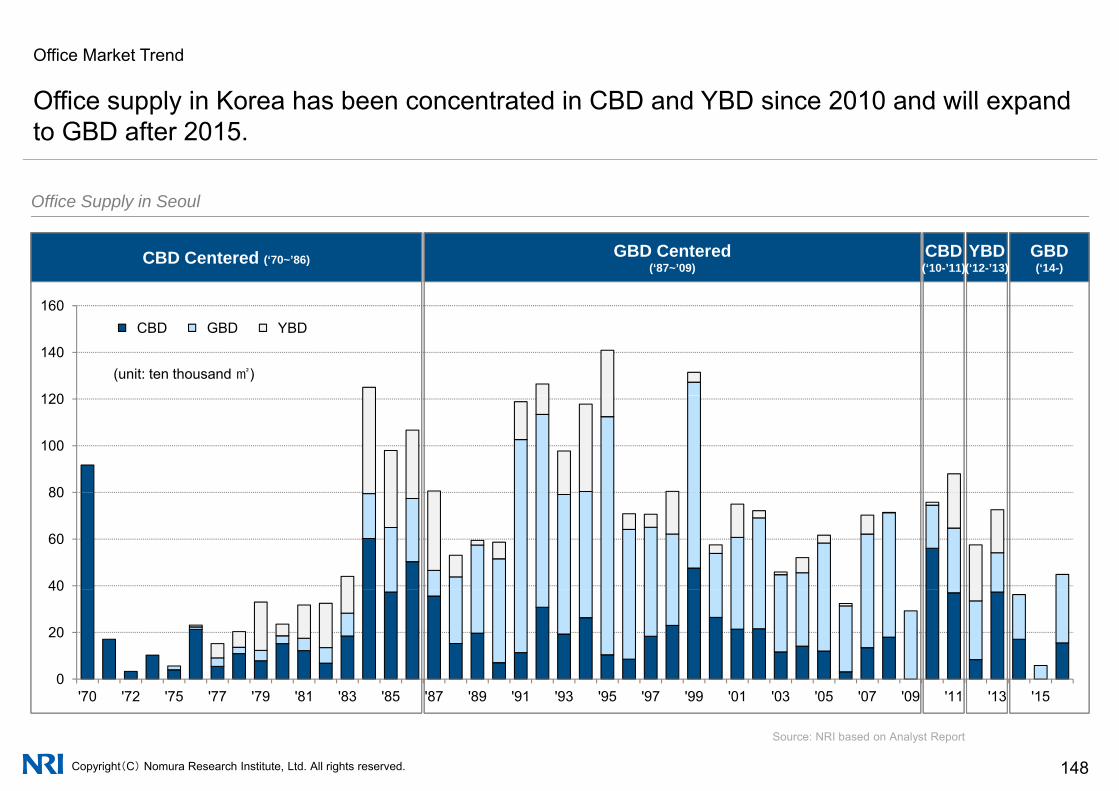
Office Market Trend
Office supply in Korea has been concentrated in CBD and YBD since 2010 and will expandOffice supply in Korea has been concentrated in CBD and YBD since 2010 and will expand to GBD after 2015.
Office Supply in SeoulOffice Supply in Seoul
CBD Centered (‘70~’86) GBD Centered(‘87~’09) ( )
CBD(‘10-’11)( )
YBD(‘12-’13)
GBD(‘14-)
120
140
160CBD GBD YBD
(unit: ten thousand ㎡)
80
100
120
40
60
80
0
20
40
Copyright(C) Nomura Research Institute, Ltd. All rights reserved. 148
Source: NRI based on Analyst Report
'70 '72 '75 '77 '79 '81 '83 '85 '87 '89 '91 '93 '95 '97 '99 '01 '03 '05 '07 '09 '11 '13 '15

Office Market Trend
Large amount of prime office space supply resulted in approx 9% of office vacancy rate andLarge amount of prime office space supply resulted in approx. 9% of office vacancy rate and 85,000 KRW/3.3㎡ of rental fee.
Vacancy Rate of Prime Office Space in Seoul Rental Fee of Prime Office in SeoulVacancy Rate of Prime Office Space in Seoul Rental Fee of Prime Office in Seoul
14 0%
16.0%
Total CBD GBD YBD
total 110 000
120,000
Total CBD GBD YBD
(unit: KRW/3.3㎡/Month)
12.0%
14.0% total
100,000
110,000
8.0%
10.0%
80,000
90,000
4.0%
6.0%
60,000
70,000
0.0%
2.0%
40,000
50,000
Copyright(C) Nomura Research Institute, Ltd. All rights reserved. 149
Source: NRI based on Analyst Report
'04 '05 '06 '07 '08 '09 '10 '11 '12 '13 '14,
'04 '05 '06 '07 '08 '09 '10 '11 '12 '13 '14

Office Market Trend
The number of major office transaction in Seoul was 51 in 2014 Transaction of large-sizedThe number of major office transaction in Seoul was 51 in 2014. Transaction of large sized buildings contributed to the increase in total transaction value reaching 7 trillion KRW.
Number of Office Transaction and Total Transaction Value in SeoulNumber of Office Transaction and Total Transaction Value in Seoul
7 0770
CBD GBD YBD Oth (S l) BBD T t l T ti V l
(unit: trillion KRW)(Unit: Number of Transaction)
57
52 53
48
57 5859
515.5 5.6
6.0
7.0
5
6
50
60
CBD GBD YBD Other (Seoul) BBD Total Transaction Value
35
42 4139 38
48
4.1 4.2
4.8 4.6
4
5
40
50
2526
1.7 1 9
2.6
2.2
2.8 2.6
2
3
20
30
80.4
1.9
1.2
0
1
0
10
Copyright(C) Nomura Research Institute, Ltd. All rights reserved. 150
Source: NRI based on Analyst Report
'99 '00 '01 '02 '03 '04 '05 '06 '07 '08 '09 '10 '11 '12 '13 '14

Office Market Trend
Sales price of office is approx. 4,600,000 KRW/㎡ and Cap. Rate is 5.9%.p pp p
Transacted Gross Area by Business District and Sales Price of Office Space per ㎡ in SeoulTransacted Gross Area by Business District and Sales Price of Office Space per ㎡ in Seoul
7000140CBD GBD YBD Other (Seoul) BBD Sales price per ㎡ Cap Rate
(unit: 10 thousand ㎡) (unit : thousand KRW)
4 632 5000
6000
100
120
( ) Sales price per ㎡
9.2%
p
2 818
3,658 4,034
3,513 3,760
4,103 4,284 4,297
4,632
4000807.9%
7.3%
6 7% 6.8%
2,344 2,488 2,818
2000
3000
40
606.7%
6.2% 6.3%6.6%
6.8%
6.0%
5.4%
5.9%
0
1000
0
20
Copyright(C) Nomura Research Institute, Ltd. All rights reserved. 151
Source: NRI based on Analyst Report
'04 '05 '06 '07 '08 '09 '10 '11 '12 '13 '14
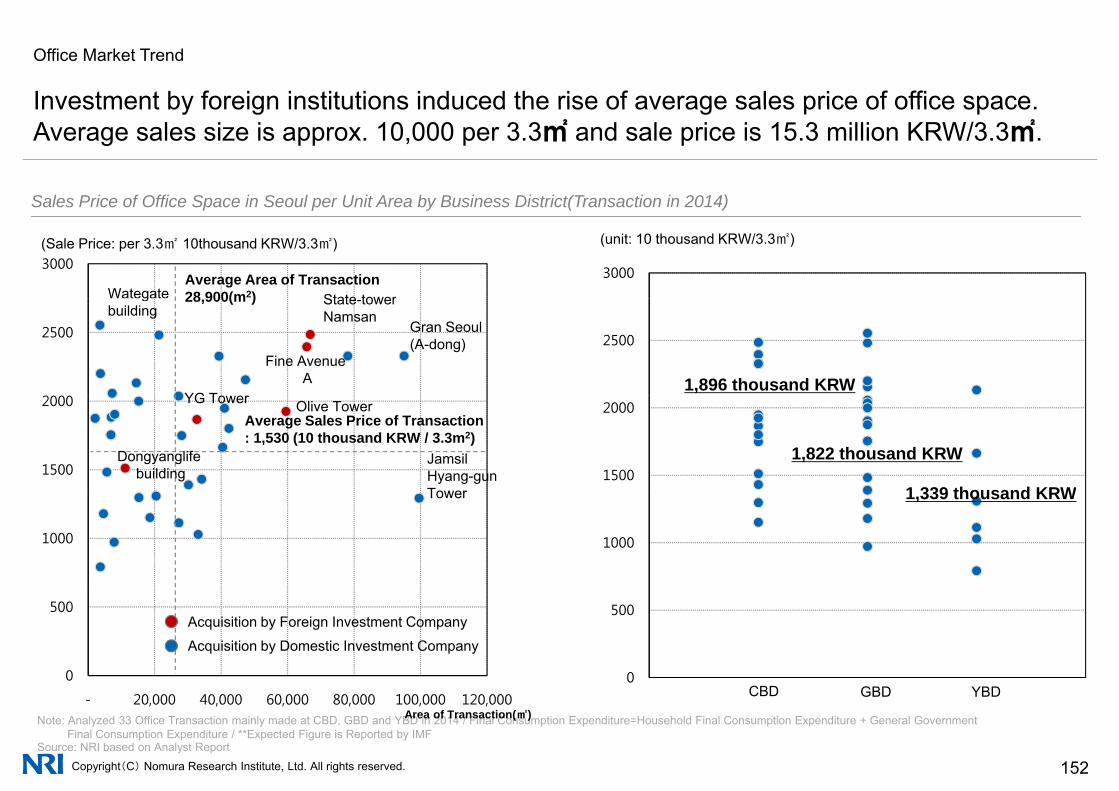
Office Market Trend
Investment by foreign institutions induced the rise of average sales price of office spaceInvestment by foreign institutions induced the rise of average sales price of office space. Average sales size is approx. 10,000 per 3.3㎡ and sale price is 15.3 million KRW/3.3㎡.
Sales Price of Office Space in Seoul per Unit Area by Business District(Transaction in 2014)Sales Price of Office Space in Seoul per Unit Area by Business District(Transaction in 2014)
30003000
(Sale Price: per 3.3㎡ 10thousand KRW/3.3㎡) (unit: 10 thousand KRW/3.3㎡)
Wategate State towerAverage Area of Transaction28 900(m2)
2500 2500
1,896 thousand KRW
gbuilding
State-towerNamsan
Gran Seoul(A-dong)
Fine AvenueA
28,900(m )
YG T
1500
2000
1500
2000
1,822 thousand KRW
1 339 thousand KRW
JamsilHyang-gunTower
Average Sales Price of Transaction: 1,530 (10 thousand KRW / 3.3m2)
Olive TowerYG Tower
Dongyanglifebuilding
1000 1000
1,339 thousand KRWTower
0
500
0
500
CBD
Acquisition by Foreign Investment Company
Acquisition by Domestic Investment Company
Copyright(C) Nomura Research Institute, Ltd. All rights reserved. 152
Note: Analyzed 33 Office Transaction mainly made at CBD, GBD and YBD in 2014 / Final Consumption Expenditure=Household Final Consumption Expenditure + General Government Final Consumption Expenditure / **Expected Figure is Reported by IMF
Source: NRI based on Analyst Report
- 20,000 40,000 60,000 80,000 100,000 120,000 CBD GBD YBDArea of Transaction(㎡)
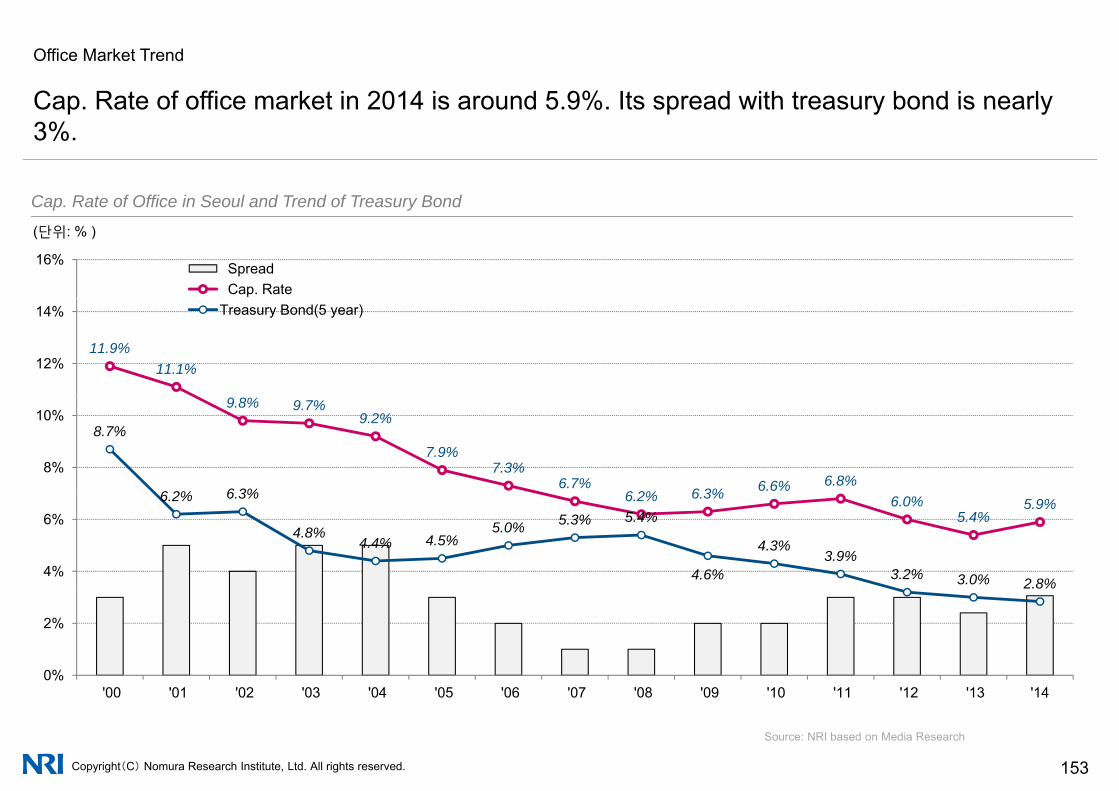
Office Market Trend
Cap Rate of office market in 2014 is around 5 9% Its spread with treasury bond is nearlyCap. Rate of office market in 2014 is around 5.9%. Its spread with treasury bond is nearly 3%.
Cap Rate of Office in Seoul and Trend of Treasury BondCap. Rate of Office in Seoul and Trend of Treasury Bond
16% SpreadCap. Rate
(단위: % )
11.9%11.1%12%
14% Treasury Bond(5 year)
9.8% 9.7%9.2%
7.9%7.3%
6.7%6 2% 6 3% 6.6% 6.8%
8.7%
6 2% 6 3%
8%
10%
6.2% 6.3% 6.0%5.4%
5.9%6.2% 6.3%
4.8%4.4% 4.5%
5.0% 5.3% 5.4%
4.6%
4.3%3.9%
3.2% 3.0% 2.8%4%
6%
0%
2%
Copyright(C) Nomura Research Institute, Ltd. All rights reserved. 153
Source: NRI based on Media Research
'00 '01 '02 '03 '04 '05 '06 '07 '08 '09 '10 '11 '12 '13 '14

Korea Increase of liquidity within slow economic growth
1 Business trends and Office Market Trends
1-1 Business Trends
1-2 Office Market Trend
2 Household Economy and Housing market trendsy g
3 Hotel Market trends
4 Indirect Investment Market Trends
Copyright(C) Nomura Research Institute, Ltd. All rights reserved. 154

Household Economy and Housing market trends
Population in Korea as well as in capital area is expected to downturn from 2018.
Population in Nationwide Population in Metropolitan AreaPopulation in Nationwide
(unit: household(thousand)) (unit: population(thousand))2018
Population in Metropolitan Area
(unit: population
(thousand))
비수도권인구 수도권인구 수도권비중Population in non-
Population in capital
ratio of capital
49500
50000
50500
17000
19000
21000 Household
population
2018 (thousand))
49.3%49.7%
50.0% 50.2% 50.2%
50%
51%
50 000
60,000
capital area
area area
47500
48000
48500
49000
13000
15000
46.3%
48.2%
47%
48%
49%
30 000
40,000
50,000
46000
46500
47000
47500
7000
9000
11000 45.3%
44%
45%
46%
10,000
20,000
30,000
45500
46000
5000
'00 '05 '10 '15 '20 '25 '3042%
43%
-
,
1995 2000 2005 2010 2015 2020 2025 2030
Copyright(C) Nomura Research Institute, Ltd. All rights reserved. 155
Source: NRI based on National Statistical OfficeNote: Data is estimated based on Population statistics of 2005 / Employees includes people who did searching activities for job for more than 4wekks

Household Economy and Housing market trends
Due to gradual increase in single person/two person households elderly households with financialDue to gradual increase in single person/two person households, elderly households with financial compatibility will become the most significant consumer group in real estate market.
Ratio of Household per number of membersRatio of Household per number of members
90%
100%
60%
70%
80%
40%
50%
60%
10%
20%
30%Increase of 1~2person household(41%)
0%
2000 2005 2010 2015 2020 2025 2030 2035
Single person household 2 person household 3 person household 4 person household Over 5 person household
(41%)
Copyright(C) Nomura Research Institute, Ltd. All rights reserved. 156
Source: NRI based on National Statistical Office(KOSTAT)Note: Predicted Data is estimated on the basis of Census in 2005

Household Economy and Housing market trends
Valorization Policy maintains Consumer Price Index at approximately 1%.y y
Changes in Consumer Price Index(CPI) Year-on-year Ratio
15.3
6 CPI
CPI for living necessities
Changes in Consumer Price Index(CPI) Year on year Ratio
(Unit : Year-on-Year, %)
4.7
3 7
5.1
4
4.9
4
4.4
4
5
4.1
3.5 3.6
3
4
3.7
2.5
3.1 3.23.4
3
4
2.3
2.8 2.8
2.22.5
2.83
2.2
2.1
1.7
0 8
2
1.3 1.30.7 0.8
0
1
'00 '01 '02 '03 '04 '05 '06 '07 '08 '09 '10 '11 '12 '13 '14
Copyright(C) Nomura Research Institute, Ltd. All rights reserved. 157
00 01 02 03 04 05 06 07 08 09 10 11 12 13 14
Source: NRI based on The Bank of Korea, Media Reserch
Note: CPI indicates monthly weighted average of 481product categories which standardizes year 2010 as 100CPI for living necessities indicates weighted average of 142 product categories out of 481 which are designated as daily necessities or purchased frequently
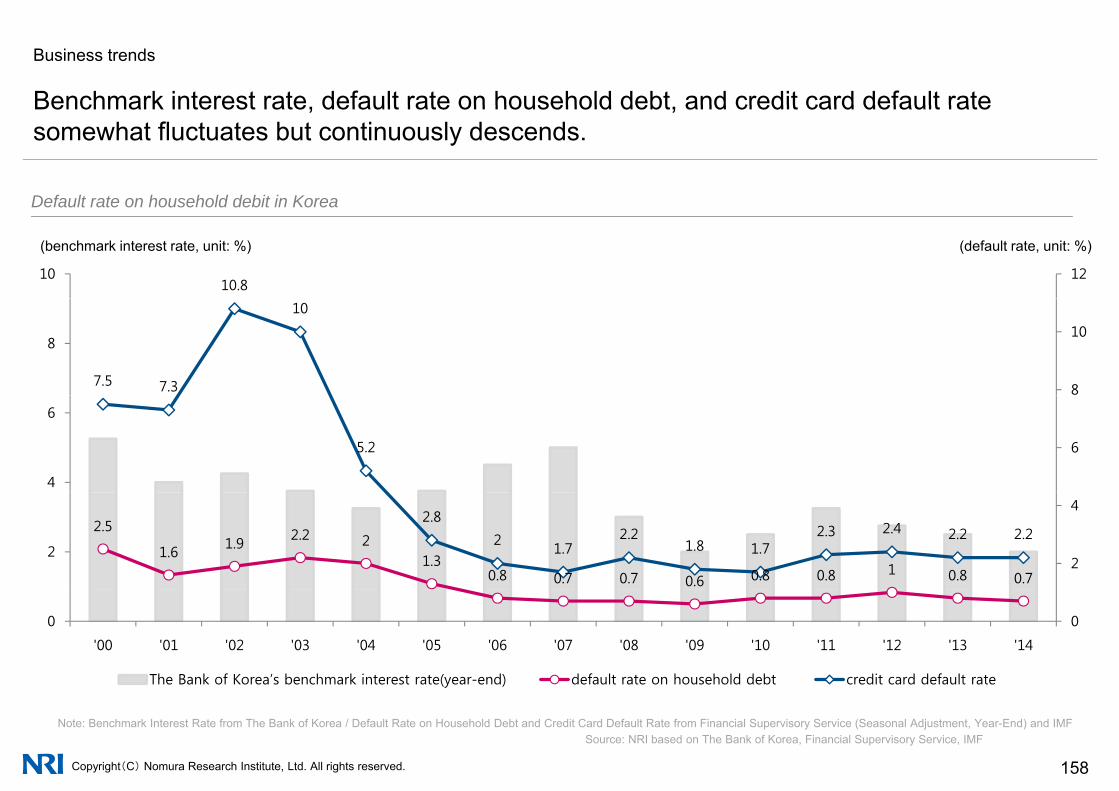
Business trends
Benchmark interest rate default rate on household debt and credit card default rateBenchmark interest rate, default rate on household debt, and credit card default rate somewhat fluctuates but continuously descends.
Default rate on household debit in Korea
10.81210
Default rate on household debit in Korea
(default rate, unit: %)(benchmark interest rate, unit: %)
7.5 7.3
10
8
108
5.2 6
4
6
2.5
1.61.9
2.2 21.3
0.8 0.7 0.7 0.6 0.8 0.8 1 0.8 0.7
2.8
21.7
2.21.8 1.7
2.3 2.4 2.2 2.2
2
4
2
00
'00 '01 '02 '03 '04 '05 '06 '07 '08 '09 '10 '11 '12 '13 '14
The Bank of Korea’s benchmark interest rate(year-end) default rate on household debt credit card default rate
Copyright(C) Nomura Research Institute, Ltd. All rights reserved. 158
(y )
Source: NRI based on The Bank of Korea, Financial Supervisory Service, IMFNote: Benchmark Interest Rate from The Bank of Korea / Default Rate on Household Debt and Credit Card Default Rate from Financial Supervisory Service (Seasonal Adjustment, Year-End) and IMF
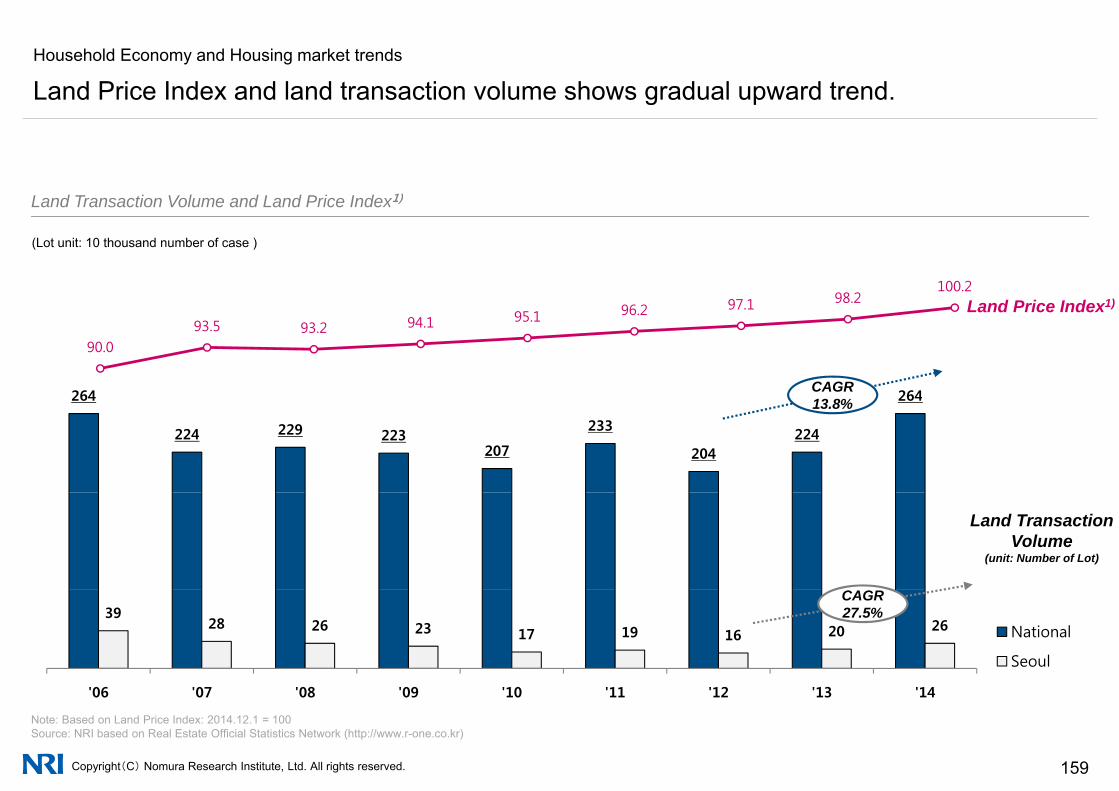
Household Economy and Housing market trends
Land Price Index and land transaction volume shows gradual upward trend.g
Land Transaction Volume and Land Price Index1)
98 2100.2
Land Transaction Volume and Land Price Index1)
(Lot unit: 10 thousand number of case )
90.0 93.5 93.2 94.1 95.1 96.2 97.1 98.2
264 264
Land Price Index1)
CAGR264
224 229 223207
233
204224
26413.8%
Land TransactionVolume
(unit: Number of Lot)
3928 26 23 17 19 16 20 26 National
Seoul
CAGR27.5%
Copyright(C) Nomura Research Institute, Ltd. All rights reserved. 159
Note: Based on Land Price Index: 2014.12.1 = 100Source: NRI based on Real Estate Official Statistics Network (http://www.r-one.co.kr)
'06 '07 '08 '09 '10 '11 '12 '13 '14

Housing transaction volume reached its peak in 2006. Though it had showed general declining Household Economy and Housing market trends
Housing Transaction Volume(National)
g p g g gtrend since 2007, it recently started to bounce back.
Housing Transaction Volume(National)
1,082,453800,0001,200,000
Nationwide Capital Area Seoul Rural Areas (unit: number of transaction) Transaction volume of capital area
accounts for 43% of that of nationwide
(unit: number of transaction)
1,082,453
867,933893,790 870,353
799,864
981,238
851,850
1,005,173
697,676
608 424600,000
700,0001,000,000
,735,414
482,533
449,867
462,111443,923
475,075517,361
608,424
463,459488,757
543,062
400,000
500,000
600,000
800,000
395,278
282,503
372,814
271,955
363,093
263,599
384,777 385,400
200,000
300,000400,000
159,396 147,023 138,016
88,737114,315
83,257111,889
148,266
0
100,000
0
200,000
Copyright(C) Nomura Research Institute, Ltd. All rights reserved. 160
Source: NRI based on data from Onnara Real Estates (http://www.onnara.go.kr)
'06 '07 '08 '09 '10 '11 '12 '13 '14

Household Economy and Housing market trends
Total supply of housing units is 730 000 units Supply of Apartment and Officetel increasedTotal supply of housing units is 730,000 units. Supply of Apartment and Officetel increased, whereas that of urban-type housing and multi-unit dwelling is on the decline.
Housing Supply By types of housingHousing Supply By types of housing
804 019
854,095 800,000 900,000 Total Apartment Multi-unit dwelling Officetel Urban-type housing
(unit: number of housing supply (unit: number of house)
644,512
804,019
658,025
726,726
600,000
700,000
700,000
800,000
544,909
459,887 468,642 504,481
412,891 476,462
356,762 376,086 347,687 400,000
500,000
400 000
500,000
600,000
263,153 297,183 276,989 278,739
106 251
152,042 219 823
349,661 340,477
277,594 274,869
124 000200,000
300,000
200,000
300,000
400,000
106,251 186,637
163,357
219,823
25,767 16,008 10,097 8,102 7,669 13,596 13,532 32,692 41,170
84,000 124,000
69,000 63,000
-
100,000
-
100,000
,
Copyright(C) Nomura Research Institute, Ltd. All rights reserved. 161
Source: NRI based on data from Onnara Real Estates (http://www.onnara.go.kr)
'06 '07 '08 '09 '10 '11 '12 '13 '14
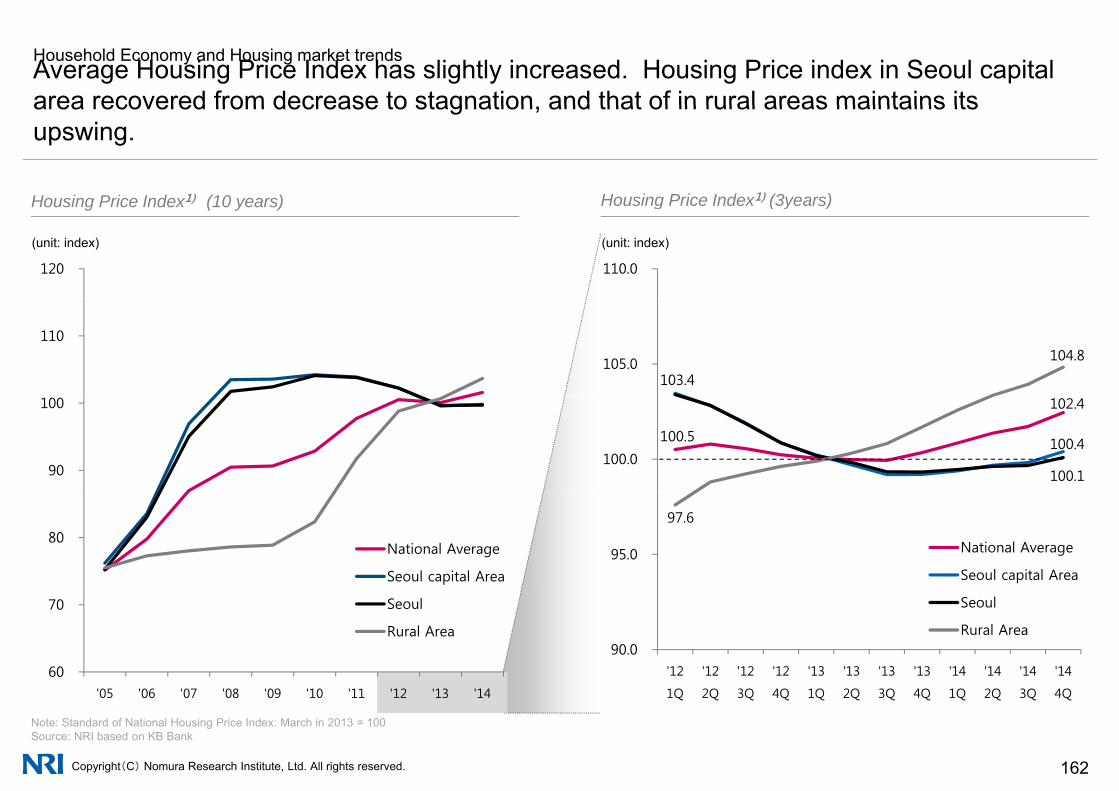
Household Economy and Housing market trendsAverage Housing Price Index has slightly increased. Housing Price index in Seoul capital area recovered from decrease to stagnation and that of in rural areas maintains itsarea recovered from decrease to stagnation, and that of in rural areas maintains its upswing.
Housing Price Index1) (10 years) Housing Price Index1) (3years)Housing Price Index1) (10 years) Housing Price Index ) (3years)
120
(unit: index)
110.0
(unit: index)
110
103.4
104.8 105.0
90
100
100.5
102.4
100.4
100.1 100.0
80 National Average
Seoul capital Area
97.6
95.0 National Average
Seoul capital Area
60
70 Seoul
Rural Area 90.0
'12 '12 '12 '12 '13 '13 '13 '13 '14 '14 '14 '14
Seoul
Rural Area
Copyright(C) Nomura Research Institute, Ltd. All rights reserved. 162
Note: Standard of National Housing Price Index: March in 2013 = 100Source: NRI based on KB Bank
'05 '06 '07 '08 '09 '10 '11 '12 '13 '14 1Q 2Q 3Q 4Q 1Q 2Q 3Q 4Q 1Q 2Q 3Q 4Q

Household Economy and Housing market trends
Size of auctioned assets has increased by 3 5 times in recent 10 yearsSize of auctioned assets has increased by 3.5 times in recent 10 years. Ration of sale value recovered to 70% in 2014.
Size of Auctioned Assets1) and ratio of sale value2)
70 8% 71.8%70 4%
73.2%71.8%
70 3% 70 4%
Size of Auctioned Assets1) and ratio of sale value2)
(Unit: trillion KRW)
70.8%
67.0% 66.8%
70.4% 69.6%67.7%
70.3%67.8% 68.1%
70.4%Ratio of sale value2)
21.5
0 8 0.8 0 9 1 0
1.2 1.3
1 21.0 1.0 0.9 0.9
1.1 1.1 3.6 3.3
5.7 4.9 4.7 4.9
5.7 4.6 ApartmentSingle/Multi Household House
Row House/Multiplex
4 95.4
5.4 5.0 4.1 4.1 3.8
1.9
2.3 2.3 2.4 2.7
4.0 3.6 3.6 3.5 4.2 4.5
1.7
2.1 1.9
1.0 0.7
0.8 0.9 1.0
0 6 0.7
1.2
1.4 1.2
1.0 0.8
0 71.6
2.8 2.6 3.4
Land/Forest/Field
Shopping Area/Office-tel/Neighboring Facilities6.4
1.6 2.0 2.8 3.6 3.4 2.4 2.4 3.9 4.6 4.6 5.1 6.2 6.2 1.9 1.9
2.7 4.2 4.9
4.5 4.0 1.2 1.4
1.9 0.4
0.7 0.6 0.7
ETC.
Copyright(C) Nomura Research Institute, Ltd. All rights reserved. 163
Note: 1) Size of Auctioned Assets is based on Assessed Value, 2) Ratio of sale value = (Sale value / Appraised Value) * 100Source: NRI based on Auction Statistics of Supreme Court
'02 '03 '04 '05 '06 '07 '08 '09 '10 '11 '12 '13 '14

Household Economy and Housing market trends
House lease index has consistently illustrated upward trend In particular house lease indexHouse lease index has consistently illustrated upward trend. In particular, house lease index in capital area is higher than nationwide average.
House Lease Index of Nationwide/capital Area (3 years) House Lease Index of Nationwide/capital Area (3 years)House Lease Index of Nationwide/capital Area (3 years) House Lease Index of Nationwide/capital Area (3 years)
(unit: index (unit: index)
115 120
108.4
110.5
109.9 110
100
110
105.8
100
105
90
100
96.3
97.4
95.2 95
100
National Average
Seoul capital Area
l
80 National Average
Seoul capital Area
l
90 '12
1Q
'12
2Q
'12
3Q
'12
4Q
'13
1Q
'13
2Q
'13
3Q
'13
4Q
'14
1Q
'14
2Q
'14
3Q
'14
4Q
Seoul
Rural Area
60
70
'05 '06 '07 '08 '09 '10 '11 '12 '13 '14
Seoul
Rural Area
Copyright(C) Nomura Research Institute, Ltd. All rights reserved. 164
Note: Based on National House Lease Index: October in 2012 = 100Source: NRI based on Korea Appraisal Board
1Q 2Q 3Q 4Q 1Q 2Q 3Q 4Q 1Q 2Q 3Q 4Q05 06 07 08 09 10 11 12 13 14
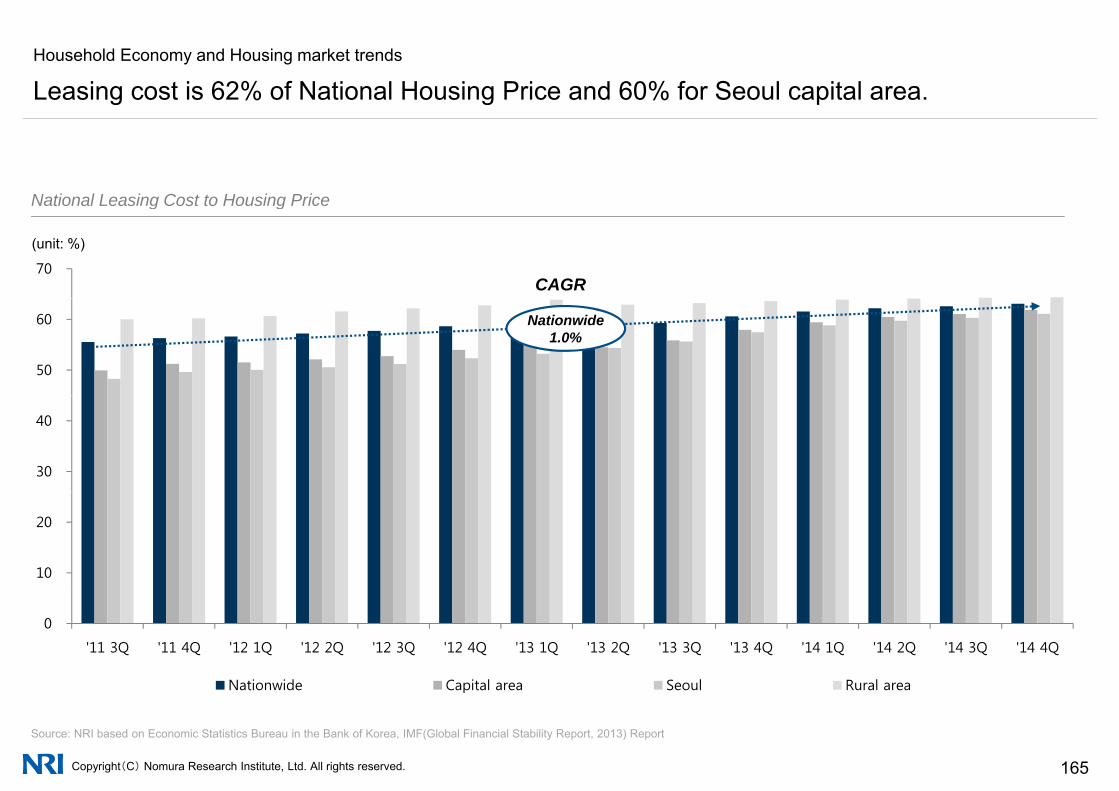
Household Economy and Housing market trends
Leasing cost is 62% of National Housing Price and 60% for Seoul capital area.g g
National Leasing Cost to Housing PriceNational Leasing Cost to Housing Price
70
(unit: %)
CAGR
50
60 Nationwide1.0%
30
40
10
20
0
'11 3Q '11 4Q '12 1Q '12 2Q '12 3Q '12 4Q '13 1Q '13 2Q '13 3Q '13 4Q '14 1Q '14 2Q '14 3Q '14 4Q
Nationwide Capital area Seoul Rural area
Copyright(C) Nomura Research Institute, Ltd. All rights reserved. 165
Source: NRI based on Economic Statistics Bureau in the Bank of Korea, IMF(Global Financial Stability Report, 2013) Report
Nationwide Capital area Seoul Rural area

Household Economy and Housing market trends
Monthly lease index in Seoul capital area has declined since 2013 Deposit (Jeonsei)-to-Monthly lease index in Seoul capital area has declined since 2013. Deposit (Jeonsei) toMonthly-Rent Conversion Rate also led to the decline of profitability.
Monthly Leasing Index and Deposit(Jeonsei) to Monthly Rent Conversion RateMonthly Leasing Index and Deposit(Jeonsei)-to-Monthly-Rent Conversion Rate
9.1 9.1 9 0 9 0 9 0 8 9Deposit(Chonsei)-to-Monthly-Rent Conversion Rate (%)
(unit: index)
9.0 9.0 9.0 8.9 8.8 8.8 8.8 8.8 8.8 8.8 8.8 8.8 8.7 8.6 8.5 8.4 8.3 8.3 8.3 8.3 8.3 8.3 8.2 8.2 8.1 8.1 8.0 7.9 7.8 7.7
105
100 100 100
105
98
96 95 95
N i l A C i l A S l 5 li i i
90
'12 '12 '12 '12 '12 '12 '12 '12 '13 '13 '13 '13 '13 '13 '13 '13 '13 '13 '13 '13 '14 '14 '14 '14 '14 '14 '14 '14 '14 '14 '14 '14
National Average Capital Area Seoul 5 metropolitan cities
Copyright(C) Nomura Research Institute, Ltd. All rights reserved. 166
Source: NRI based on Korea Appraisal Board
05 06 07 08 09 10 11 12 01 02 03 04 05 06 07 08 09 10 11 12 01 02 03 04 05 06 07 08 09 10 11 12
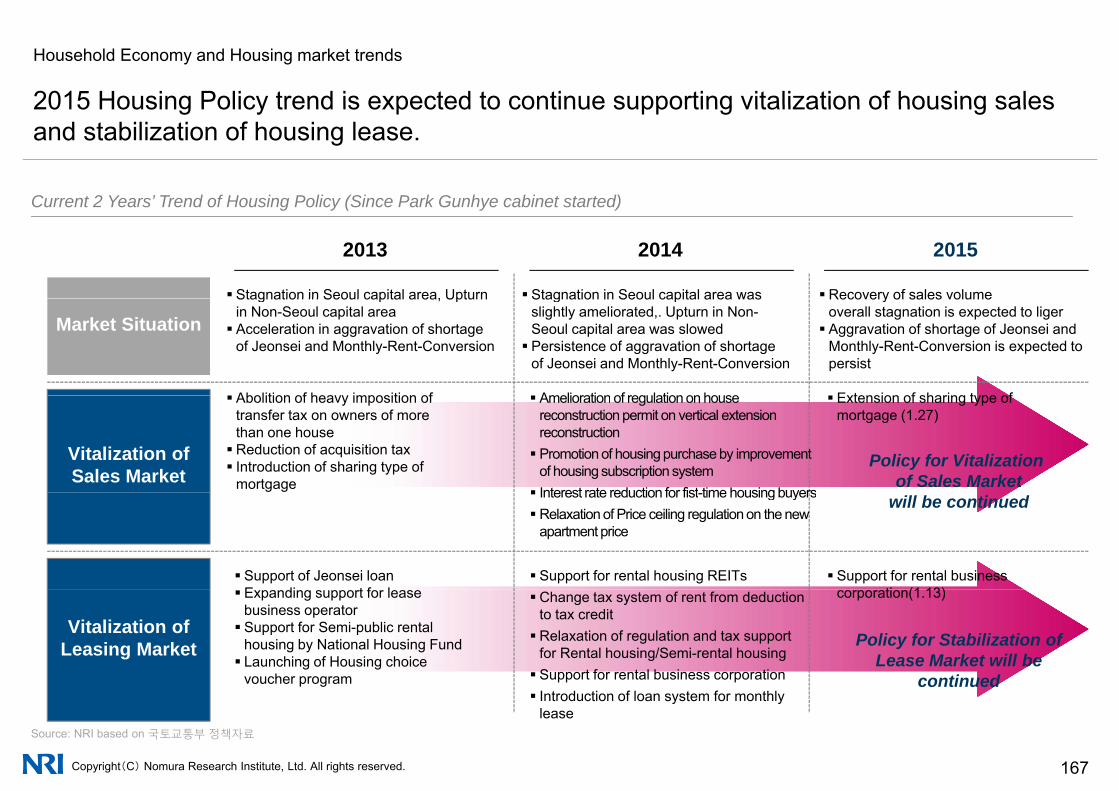
Household Economy and Housing market trends
2015 Housing Policy trend is expected to continue supporting vitalization of housing sales2015 Housing Policy trend is expected to continue supporting vitalization of housing sales and stabilization of housing lease.
Current 2 Years’ Trend of Housing Policy (Since Park Gunhye cabinet started)Current 2 Years Trend of Housing Policy (Since Park Gunhye cabinet started)
20142013 2015
Stagnation in Seoul capital area, Upturn Stagnation in Seoul capital area was Recovery of sales volume
Abolition of heavy imposition of Amelioration of regulation on house Extension of sharing type of
Market SituationStagnation in Seoul capital area, Upturn in Non-Seoul capital area Acceleration in aggravation of shortage
of Jeonsei and Monthly-Rent-Conversion
Stagnation in Seoul capital area was slightly ameliorated,. Upturn in Non-Seoul capital area was slowed Persistence of aggravation of shortage
of Jeonsei and Monthly-Rent-Conversion
Recovery of sales volumeoverall stagnation is expected to liger Aggravation of shortage of Jeonsei and
Monthly-Rent-Conversion is expected to persist
Vitalization of Sales Market
Abolition of heavy imposition of transfer tax on owners of more than one houseReduction of acquisition tax Introduction of sharing type of
mortgage
Amelioration of regulation on house reconstruction permit on vertical extension reconstruction Promotion of housing purchase by improvement
of housing subscription system Interest rate reduction for fist time housing buyers
Extension of sharing type of mortgage (1.27)
Policy for Vitalizationof Sales Market
Support of Jeonsei loan E di t f l
Interest rate reduction for fist-time housing buyersRelaxation of Price ceiling regulation on the new
apartment price
Support for rental housing REITs Support for rental business ti (1 13)
will be continued
Vitalization of Leasing Market
Expanding support for lease business operator Support for Semi-public rental
housing by National Housing Fund Launching of Housing choice
voucher program
Change tax system of rent from deduction to tax creditRelaxation of regulation and tax support
for Rental housing/Semi-rental housing Support for rental business corporation
corporation(1.13)
Policy for Stabilization of Lease Market will be
continued
Copyright(C) Nomura Research Institute, Ltd. All rights reserved. 167
Source: NRI based on 국토교통부 정책자료
p g Introduction of loan system for monthly
lease
continued

Korea Increase of liquidity within slow economic growth
1 Business trends and Office Market Trends
1-1 Business Trends
1-2 Office Market Trend
2 Household Economy and Housing market trendsy g
3 Hotel Market trends
4 Indirect Investment Market Trends
Copyright(C) Nomura Research Institute, Ltd. All rights reserved. 168
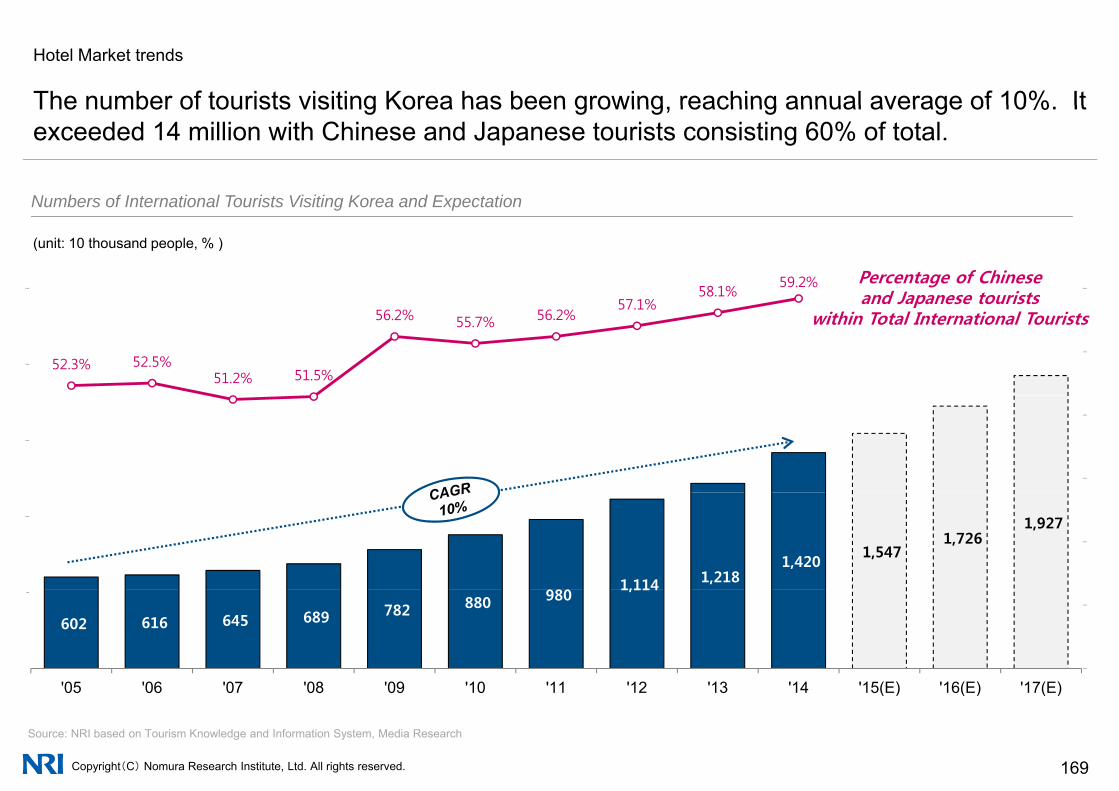
Hotel Market trends
The number of tourists visiting Korea has been growing reaching annual average of 10% ItThe number of tourists visiting Korea has been growing, reaching annual average of 10%. It exceeded 14 million with Chinese and Japanese tourists consisting 60% of total.
Numbers of International Tourists Visiting Korea and ExpectationNumbers of International Tourists Visiting Korea and Expectation
58.1%59.2%
60.0%2,500
Percentage of Chineseand Japanese tourists
(unit: 10 thousand people, % )
52.3% 52.5%51.2% 51.5%
56.2% 55.7% 56.2%57.1%
55.0%
2,000
and Japanese touristswithin Total International Tourists
45.0%
50.0%
1,500
1,114 1,218 1,420
1,547 1,726
1,927 40.0%
1,000
602 616 645 689 782 880 980 1,114
30.0%
35.0%
-
500
'05 '06 '07 '08 '09 '10 '11 '12 '13 '14 '15(E) '16(E) '17(E)
Copyright(C) Nomura Research Institute, Ltd. All rights reserved. 169
Source: NRI based on Tourism Knowledge and Information System, Media Research
05 06 07 08 09 10 11 12 13 14 15(E) 16(E) 17(E)

Hotel Market trendsEconomic growth led to an upsurge of Chinese tourists. They account for the largest percentage since 2013 The number of Japanese Tourist has been diminishing owing to diplomatic matters and change in2013. The number of Japanese Tourist has been diminishing owing to diplomatic matters and change in exchange rate since 2012.
Number of Japanese Tourists Visiting KoreaNumber of Chinese Tourists Visiting Korea Number of Japanese Tourists Visiting KoreaNumber of Chinese Tourists Visiting Korea
6,9597,572
8,000700
1,800
2,000 700
(unit: 10 thousand people)
The number of Chinese tourists is related with
(unit: 10 thousand people)
The number of Chinese tourists is highly associated
5,429
6,194
6,000
7,000
500
600
1,397
1,265
1,394 1,481
1,238 1,400
1,600
500
600 exchange rate (R2=69.8%)with economic power(R2=91.9%)
6132 652
3,4243,826
4,437
4,000
5,000
300
400
(GDP per Person($))
859 783
829
1,002 913
800
1,000
1,200
300
400 (KRW-100 YEN)
222284
4331,749
2,125
2,652
2,000
3,000
200
244 234 224 238305 302 329 352
275228
400
600
200
71 90 107 117 134188
222
0
1,000
0
100
'05 '06 '07 '08 '09 '10 '11 '12 '13 '14Financial Crisis
224 228
-
200
0
100
'05 '06 '07 '08 '09 '10 '11 '12 '13 '14Financial CrisisChina
Copyright(C) Nomura Research Institute, Ltd. All rights reserved. 170
Source: NRI based on Tourism Knowledge and Information System, Nara Indexes of National Statistical Office(KOSTAT), World Bank(World Economic Outlook)
Financial CrisisRelaxation of Visa Requirement
for Chinese visitors
Financial CrisisChina became the
firstA weak yen
beganKorean Wave
continued
Diplomatic tension between Korea
and Japan
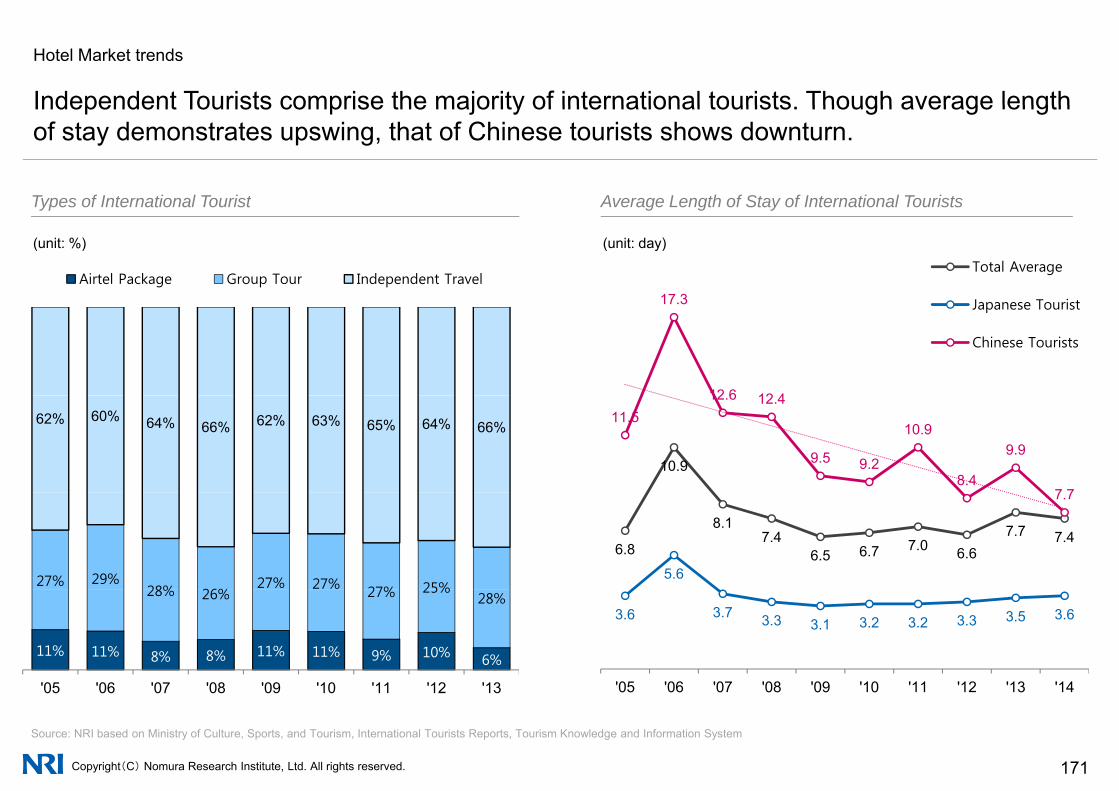
Hotel Market trends
Independent Tourists comprise the majority of international tourists Though average lengthIndependent Tourists comprise the majority of international tourists. Though average length of stay demonstrates upswing, that of Chinese tourists shows downturn.
Types of International Tourist Average Length of Stay of International TouristsTypes of International Tourist Average Length of Stay of International Tourists
17 3
Total Average
(unit: %) (unit: day)
Airtel Package Group Tour Independent Travel17.3
12 6 12 4
Japanese Tourist
Chinese Tourists
10.9
11.5 12.6 12.4
9.5 9.2
10.9
8.4
9.9
7 7
62% 60% 64% 66% 62% 63% 65% 64% 66%
6.8
8.1 7.4
6.5 6.7 7.0 6.6 7.7 7.4
5.6
7.7
27% 29%28% 26%
27% 27% 27% 25%
3.6 3.7 3.3 3.1 3.2 3.2 3.3 3.5 3.6
'05 '06 '07 '08 '09 '10 '11 '12 '13 '14
11% 11% 8% 8% 11% 11% 9% 10% 6%
28% 26% 27% 25%28%
'05 '06 '07 '08 '09 '10 '11 '12 '13
Copyright(C) Nomura Research Institute, Ltd. All rights reserved. 171
Source: NRI based on Ministry of Culture, Sports, and Tourism, International Tourists Reports, Tourism Knowledge and Information System
05 06 07 08 09 10 11 12 13 1405 06 07 08 09 10 11 12 13

Hotel Market trends
Female international tourists in their 20’s visiting Korea are largest in volume followed byFemale international tourists in their 20 s visiting Korea are largest in volume, followed by male international tourists in their 40’s and female international tourists in their 30’s.
International Tourists by Sex and AgeInternational Tourists by Sex and Age
Top 5 in 2012 (unit : 10 thousand people) Top 5 in 2013 (unit : 10 thousand people) Top 5 in 2014 (unit : 10 thousand people)
139 No. 1
Women in their 20s147
No. 1
Women in their 20s186
No. 1
Women in their 20s
109 No. 2
Men in their 40s
No. 3
119 No. 2
Women in their 30s
No. 3
153 No. 2
Men in their 40s
No. 3
106
108 Women in their 30s
No. 4
M i th i 30 111
112 Men in their 40s
No. 4
M i th i 30 123
126 Women in their 30s
No. 4
M i th i 30
99
106 Men in their 30s
No. 5
Women in their 40s 105
111 Men in their 30s
No. 5
Women in their 40s 119
123 Men in their 30s
No. 5
Women in their 40s
Copyright(C) Nomura Research Institute, Ltd. All rights reserved. 172
Source: NRI based on Ministry of Culture, Sports, and Tourism, International Tourists Reports, National Statistical Office(KOSTAT)

Hotel Market trends
Purpose of international tourists is sightseeing accounting for 60% Chinese tourists tend toPurpose of international tourists is sightseeing, accounting for 60%. Chinese tourists tend to mainly visit Seoul and Cheju, and Japanese tourists cover Seoul and Busan.
Purpose of international tourists visiting Korea (2013) Visit Place of International Tourists in Korea*(2013)
Religion
/Pilgrimage, ETC, 0.2%
100%
(unit : %, Duplicated Answers Adjusted)
Purpose of international tourists visiting Korea (2013) Visit Place of International Tourists in Korea (2013)
Leisure/
Education,
5.9%
Friend/
Family Visit,
9.7%
/ g g ,
1.0%
49% 47%60%70%
80%
90%
Seoul
Recreation/
Holiday,
48.2%
Business
/Professiona
l Activities,
23 4% 16% 16%
50%
60%
Incheon/
Shopping,
10 6%Beauty/
23.4%
7% 14%
10%21% 3%
16% 6%
10%
20%
30%
40%
Busan
Jeju
Gyunggi
10.6%Beauty/
Health/
Medical,
1.0%
Tourism Related59.8% 18%
12% 13%
7%
5%
14%
0%
10%
20%Busan
ETC
Copyright(C) Nomura Research Institute, Ltd. All rights reserved. 173
Source:: NRI based on Tourism Knowledge and Information System
International Tourists Chinese Tourists Japanese Tourists
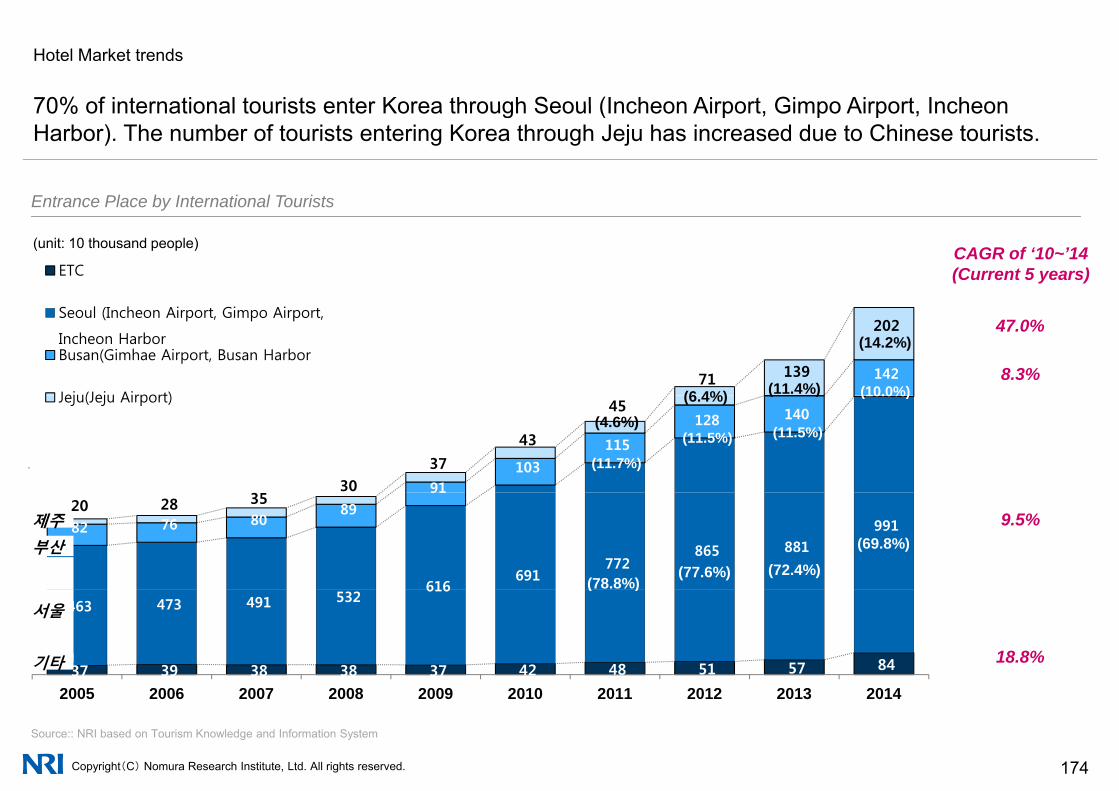
Hotel Market trends
70% of international tourists enter Korea through Seoul (Incheon Airport Gimpo Airport Incheon70% of international tourists enter Korea through Seoul (Incheon Airport, Gimpo Airport, IncheonHarbor). The number of tourists entering Korea through Jeju has increased due to Chinese tourists.
Entrance Place by International TouristsEntrance Place by International Tourists
1,600
ETC
(unit: 10 thousand people) CAGR of ‘10~’14(Current 5 years)
142 71 139
202
1,200
1,400 Seoul (Incheon Airport, Gimpo Airport,
Incheon HarborBusan(Gimhae Airport, Busan Harbor
Jeju(Jeju Airport)
47.0%
8.3%(10.0%)
(14.2%)
(11.4%)(6 4%)
91103
115
128 140
30 37
43
45
800
1,000
Jeju(Jeju Airport) (10.0%)
(11.5%)
( )
(11.5%)
(6.4%)
(11.7%)
(4.6%)
616691
772 865 881
991 82 76 80 89
91 20 28 35
400
600
부산
제주 9.5%(69.8%)
(72.4%)(77.6%)(78.8%)
37 39 38 38 37 42 48 51 57 84
463 473 491 532 616
-
200
서울
기타 18.8%
( )
Copyright(C) Nomura Research Institute, Ltd. All rights reserved. 174
2005 2006 2007 2008 2009 2010 2011 2012 2013 2014
Source:: NRI based on Tourism Knowledge and Information System

Hotel Market trends
Expenditure of Chinese tourists has shown upsurge to 2 300$ in 2013 whereas approxExpenditure of Chinese tourists has shown upsurge to 2,300$ in 2013, whereas approx. 66% of Japanese tourists spent less than 1,000$ in 2013.
Average Expenditure of international tourists per person Average Expenditure of Chinese/Japanese tourists per person(2013)g p p p g p p p p ( )
$2,272
(unit: $) (unit: %)
25% of Chinese Tourists spend over than 3 thousand dollars, and 20% of them do 1,000~1,500 dollars
15% 19% 16% 17%25%
$1,940
$2,154
8%15%
Under $500 $500~
$1,000
$1,000~
$1,500
$1,500
~$2,000
$2,000
~$3,000
Over $3,000
$1,558 $1,646
$1,224$1,298
$1,410 $1,530
$1,648
$1,073 $1,076 $1,081 $1,173 $990
$1,224
25%
41%
18%7% 5% 4%
'09 '10 '11 '12 '13
Chinese Tourist Japanese Tourists
International Tourists(Total)
60% of Japanese tourists spend less A weak yen Diplomatic
Copyright(C) Nomura Research Institute, Ltd. All rights reserved. 175
Source: NRI based on International Tourists Reports, Ministry of Culture, Sports, and TourismSource:
than 1 thousand dollarsA weak yen beganKorean Wave
continued
Diplomatic tension between
Korea and Japan

Hotel Market trends
Japanese tourists’ accommodation expenses is around 213$ (234 000 KRW)/double room/one dayJapanese tourists accommodation expenses is around 213$ (234,000 KRW)/double room/one day. This is higher than that of Chinese tourists, resulting in the rise of hotel room rate.
Expenditure of Chinese and Japanese Tourists by purpose (2013)Expenditure of Chinese and Japanese Tourists by purpose (2013)
(unit: $)
$1 431 Shopping $340
$386
$1,431
Accommodation
Shopping
$266
$340
Spend $115.2 per day for Accommodation(2
Spend $212.8 per day for Accommodation
$345 Food/Beverage $147
person/1 room)(1.9 person stayed at one room in
7.7 days in average (2013)Supposed that stayed 6.7 days using 2 person/1 room)
(2 person/1 room)(1.9 person stayed at one room in 3.6 days in average (2013)Supposed that stayed 2.6 days using 2 person/1 room)
$95
$201
Transportation
Recreation/Culture/Sports
$49
$73
using 2 person/1 room) g p )
$65
$95
ETC
(Including Korean Travel Agency)
Transportation
$56
$49
Spend $2,523 in Total
Spend $931 in Total
Copyright(C) Nomura Research Institute, Ltd. All rights reserved. 176
Note:* For group tourists, as accommodation fee is included in “expenditure before Leaving,” accommodation expenses is estimated based on individual touristSource: NRI based on International Tourists Reports, Ministry of Culture, Sports, and Tourism
( c ud g o ea a e ge cy)Total(per individual tourist)
Total(per individual tourist)

Hotel Market trends
Hotel reached 69% of accommodations where foreign tourists stayed in 2013 The ratio ofHotel reached 69% of accommodations where foreign tourists stayed in 2013. The ratio of non-hotel accommodations such as guest house demonstrates slow increase.
Annual Use Rate of Accommodation by International TouristsAnnual Use Rate of Accommodation by International Tourists
(unit: %)
78%
Hotel use rate(%)
78%75% 76% 75%
77%
74%
68%67%
69%
11%11%
67%
3%3% 3% 3%
2% 2%4%
4%6%8%
8% 7% 7%6%
8%
11%11%
11%
11% 14% 15% 16% 14% 15% 16% 18% 15%
'05 '06 '07 '08 '09 '10 '11 '12 '13
Copyright(C) Nomura Research Institute, Ltd. All rights reserved. 177
Note: : As types of answers changed from single choice to multiple one in 2011, the number of answers was re-adjusted to the ratioSource: NRI based on International Tourists Reports, Ministry of Culture, Sports, and Tourism
Youth Hostel/Guest House/Inn Resort/Pension/Residence ETC(Relatives/Friends/School/etc)

Hotel Market trendsThough international tourists travelling to Korea has risen, increase in room supply resulted in decline of occupancy rate In addition decrease of Japanese tourists to Korea led to decline of average roomof occupancy rate. In addition, decrease of Japanese tourists to Korea led to decline of average room rate in 2013.
The number of hotel rooms and Occupancy rate in Nationwide Nationwide Hotel Average Daily Rate 1)The number of hotel rooms and Occupancy rate in Nationwide Nationwide Hotel Average Daily Rate 1)
90,000 70.0% Number of Rooms(Room)
(Unit: 10 thousand people, %)1) Occupancy Rate(OCC: Occupancy)=Number of Rooms/Available Rooms×100
130,352
(unit: KRW)2) ADR(Average Daily Rate)=Room Revenue/Available Rooms
64.3%65.8% 65.9%
63.7%85,000
65.0%
Occupancy Rate(OCC, %)
112 378
119,592
,128,351
Chinese tourists’ average expenses for accommodation (127,000KRW)
74,737
79,393
57.3% 57.5%58.2%
60.4%
75,000
80,000
60.0% 104,809
100,234 99,363
106,325 109,435
112,378
Slight downturn in 2013 due to decrease in the number of
Japanese tourists and increase
67,171 68,583
70,763
53.3%
65,000
70,000
50.0%
55.0%
Japanese tourists and increase in that of Chinese tourists
60,000 45.0%
'05 '06 '07 '08 '09 '10 '11 '12 '13 '05 '06 '07 '08 '09 '10 '11 '12 '13Financial Crisis A weak yen Diplomatic Financial Crisis A weak yen Diplomatic
Copyright(C) Nomura Research Institute, Ltd. All rights reserved. 178
Source: NRI based on Tourism/Accommodation Industry Report, Tourism Knowledge and Information System, Korea Hotel Association
Financial CrisisRelaxation of Visa Requirement for Chinese visitors
A weak yen beganKorean Wave
continued
Diplomatic tension between Korea and Japan
Ratio of China became the first
Financial CrisisRelaxation of Visa Requirement for Chinese visitors
A weak yen beganKorean Wave
continued
Diplomatic tension between Korea and Japan
Ratio of China became the first
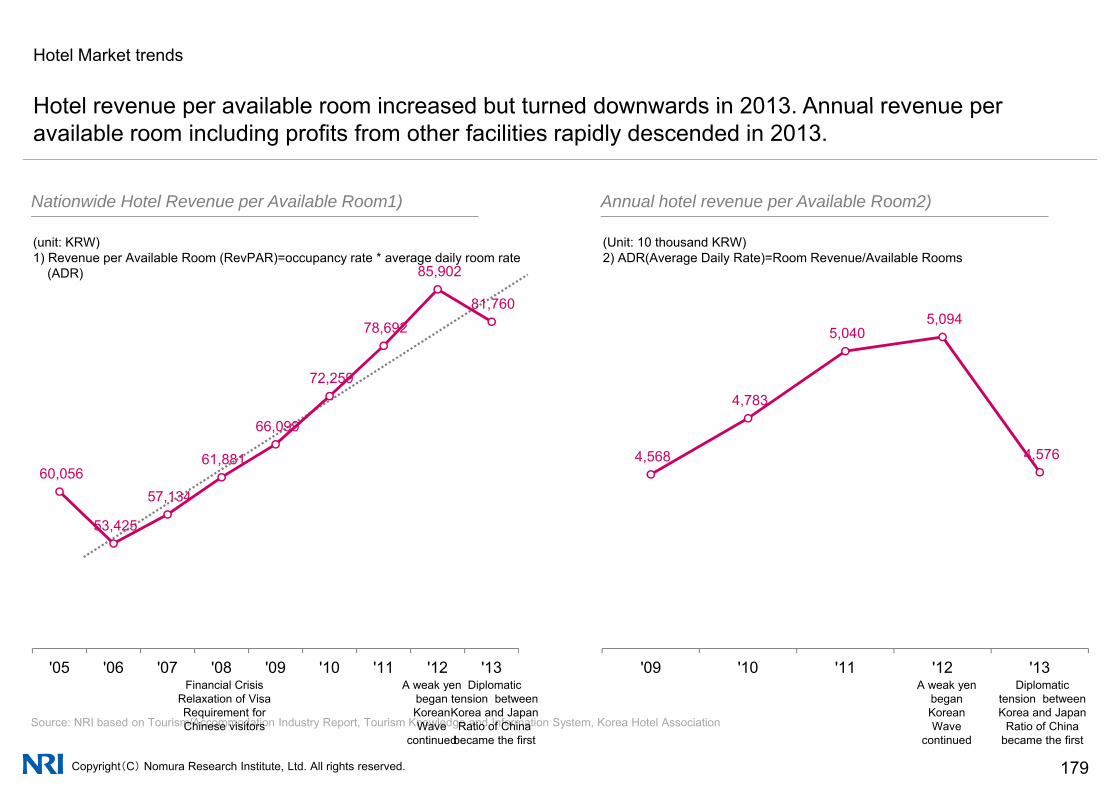
Hotel Market trends
Hotel revenue per available room increased but turned downwards in 2013 Annual revenue perHotel revenue per available room increased but turned downwards in 2013. Annual revenue per available room including profits from other facilities rapidly descended in 2013.
Nationwide Hotel Revenue per Available Room1) Annual hotel revenue per Available Room2)Nationwide Hotel Revenue per Available Room1) Annual hotel revenue per Available Room2)
85,902
81 760
(unit: KRW)1) Revenue per Available Room (RevPAR)=occupancy rate * average daily room rate
(ADR)
(Unit: 10 thousand KRW)2) ADR(Average Daily Rate)=Room Revenue/Available Rooms
72,259
78,692
81,760
4 783
5,040 5,094
60,056 57 134
61,881
66,099
4,568
4,783
4,576
53,425
57,134
'05 '06 '07 '08 '09 '10 '11 '12 '13 '09 '10 '11 '12 '13A weak yen DiplomaticFinancial Crisis A weak yen Diplomatic
Copyright(C) Nomura Research Institute, Ltd. All rights reserved. 179
Source: NRI based on Tourism/Accommodation Industry Report, Tourism Knowledge and Information System, Korea Hotel Association
A weak yen beganKorean Wave
continued
Diplomatic tension between Korea and Japan
Ratio of China became the first
Financial CrisisRelaxation of Visa Requirement for Chinese visitors
A weak yen beganKorean Wave
continued
Diplomatic tension between Korea and Japan
Ratio of China became the first

Hotel Market trends
While the number of room in luxury hotel (special first ratings) increased overall hotel room occupancyWhile the number of room in luxury hotel (special first ratings) increased, overall hotel room occupancy rate has decreased since 2012 which was followed by decline in average room rate in 2013.
Average Hotel Room rate by RatingsHotel Room Occupancy Rate by RatingsNumber of Hotel Room by Ratings Average Hotel Room rate by RatingsHotel Room Occupancy Rate by RatingsNumber of Hotel Room by Ratings
73% 73%special
(unit: 10 thousand KRW)
18.9special first
(unit: %)
25,949special first grade
special second grade
(unit: room)
69%
73% 73%72%
68%65%67%
72%70%
69%
first grade
15.7
14.7 14.4
15.6
15 7
16.3
17.6 18.9grade
21,78522,288
24,09624,991
special second grade
first grade
63%62% 65%
68%64% 65%67% 67%
61% 61% 61%
15.7
9 9
11.510.5
57%
53% 54%55% 54%
59% 9.0 9.08.6 8.9
9.4 9.7 9.9
7 27.8
8.5 8.113,983 14,05213 341 13 485
15,25514,282 14,280 13,992 14,292
15,779
53%
51%
'05 '06 '07 '08 '09 '10 '11 '12 '13Financial Crisis
6.1 6.1 6.36.7 7.1 7.2
'05 '06 '07 '08 '09 '10 '11 '12 '13A weak yenDiplomatic
13,341 13,485
'09 '10 '11 '12 '13A weak yen Diplomatic Financial Crisis A weak yenDiplomatic
Copyright(C) Nomura Research Institute, Ltd. All rights reserved. 180
Source: NRI based on Tourism Knowledge and Information System
Financial CrisisRelaxation of Visa Requirement for Chinese visitors
A weak yen beganKorean Wave
continued
Diplomatic tension between
Korea and Japan
A weak yen beganKorean Wave
continued
Diplomatic tension between
Korea and Japan
Financial CrisisRelaxation of Visa Requirement for Chinese visitors
A weak yen beganKorean Wave
continued
Diplomatic tension between
Korea and Japan

Hotel Market trends
Revenue per available room in every hotel ratings rose until 2012 with a modest decrease in 2013Revenue per available room in every hotel ratings rose until 2012 with a modest decrease in 2013. Annual revenue per available room including profits from sub-facilities decreased at a sharper rate.
Revenue per Available Room by Hotel Ratings Annual Revenue per Available Room by Hotel RatingsRevenue per Available Room by Hotel Ratings Annual Revenue per Available Room by Hotel Ratings
(unit: 10,000 KRW)
13 5
special first grade
special second grade
(unit: 10,000 KRW)
special first grade
special second grade
10.0 10.110.9
11.912.8
13.512.8
special second grade
first grade
9,158 9,801 10,071
10,556 9,841
first grade
9.1 9.2
5.8 5 6 5.9 6.3 6.57.1
8.17.2
4,466 4 2214,537 4,551 5.8
5.15.6
3 2 3 1 3.4 3.7 3.84.4
4.85.2
4.8
4,221 3,692
2 267 2,4773.2 3.1 3.4
'05 '06 '07 '08 '09 '10 '11 '12 '13엔저시작 한일관계
2,047 2,171 2,267 2,477 2,031
'09 '10 '11 '12 '13DiplomaticA weak yen began
Copyright(C) Nomura Research Institute, Ltd. All rights reserved. 181
Source: NRI based on Tourism Knowledge and Information System
엔저시작한류유지
한일관계냉각
Diplomatictension Between
Korea and Japan
A weak yen beganKorean Wave
continued

Hotel Market trends
Increase of hotel supply resulted in visible rise in room occupancy rate in Seoul This led toIncrease of hotel supply resulted in visible rise in room occupancy rate in Seoul. This led to sharp decrease in average hotel room rate in 2013.
Average Hotel Room Rate by RegionHotel Room Occupancy Rate by RegionNumber of Hotel Room by Region Average Hotel Room Rate by RegionHotel Room Occupancy Rate by RegionNumber of Hotel Room by Region
78%81%
79%
SeoulBusan28,342
Seoul
Busan
(unit: 10 thousand KRW)(unit: %)(unit: room)
17.1 Seoul
Busan
69% 69%71%
77%78% 79%
75%75% 76%
78%
78%Jeju
22,360 22,15023,824
25,710Jeju
13.6 13 2
13.7
14.9 15.6 15.9
13 1
Jeju
4,518 of rooms of hotel in Seoul increased between 69%
66%
69%
64% 64% 64%63%64% 65%
70%13.0
12.7 13.2
10.4 10 210.5 10.8
11.2
12.1
13.1
12.1
13.1
Seoul increased between‘11~’13
52%54%
56%
61%63%
6 449 6,729 6,688 6,936 6,950
6,676 6,676 6,676 6,810 7,464
10.0 10.4
9.7 10.2
9.5
8 5 8 3
9.6 9.5 10.0
11.1
52%
50%
52%51%
'05 '06 '07 '08 '09 '10 '11 '12 '13
6,449 6,729 6,688
'09 '10 '11 '12 '13
8.5 8.3
'05 '06 '07 '08 '09 '10 '11 '12 '13Financial Crisis Financial Crisis A weak yenDiplomaticA weak yenDiplomaticA weak yen Diplomatic
Copyright(C) Nomura Research Institute, Ltd. All rights reserved. 182
Source: NRI based on Tourism/Accommodation Industry Report, Tourism Knowledge and Information System, Korea Hotel Association
Financial CrisisRelaxation of Visa Requirement for Chinese visitors
Financial CrisisRelaxation of Visa Requirement for Chinese visitors
A weak yen beganKorean Wave
continued
Diplomatic tension between
Korea and Japan
A weak yen beganKorean Wave
continued
Diplomatic tension between
Korea and Japan
A weak yen beganKorean Wave
continued
Diplomatic tension between
Korea and Japan
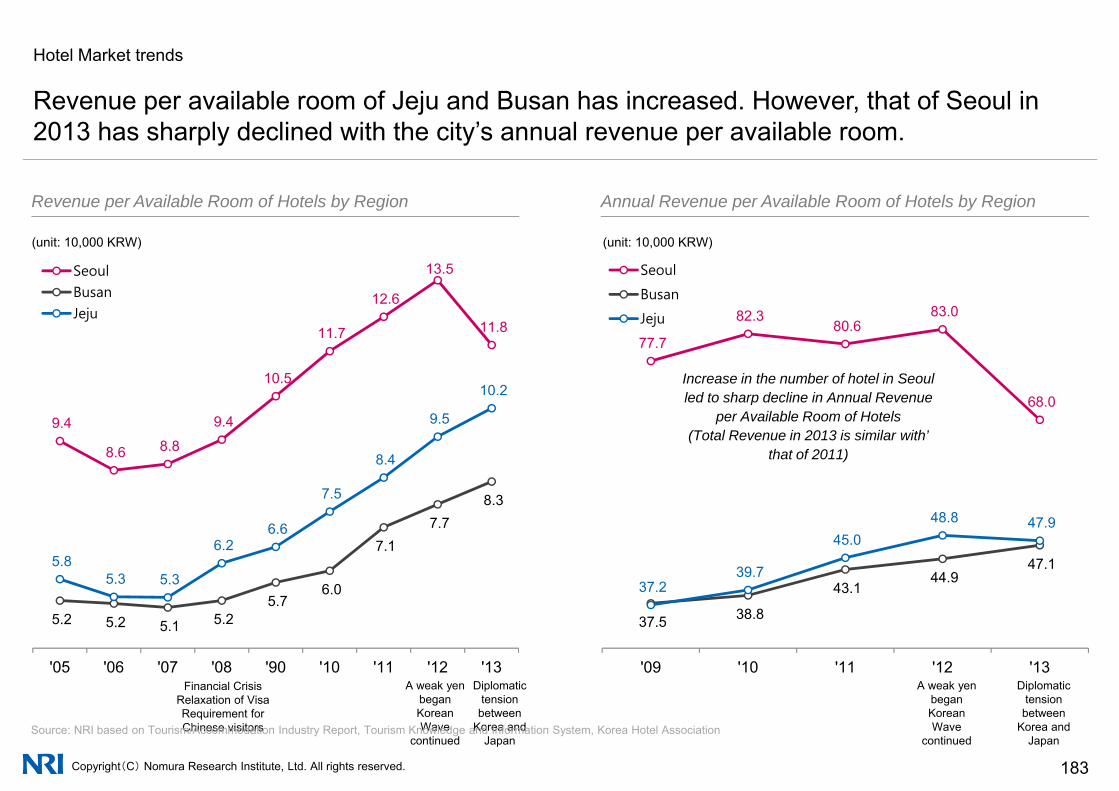
Hotel Market trends
Revenue per available room of Jeju and Busan has increased However that of Seoul inRevenue per available room of Jeju and Busan has increased. However, that of Seoul in 2013 has sharply declined with the city’s annual revenue per available room.
Revenue per Available Room of Hotels by Region Annual Revenue per Available Room of Hotels by RegionRevenue per Available Room of Hotels by Region Annual Revenue per Available Room of Hotels by Region
12 6
13.5 Seoul
Busan
(unit: 10,000 KRW) (unit: 10,000 KRW)
Seoul
Busan
10.5
11.7
12.6
11.8
10.2
Jeju
77.7
82.3 80.6
83.0 Busan
Jeju
Increase in the number of hotel in Seoul led to sharp decline in Annual Revenue
9.4
8.6 8.8
9.4
7 5
8.4
9.5 68.0 led to sharp decline in Annual Revenue
per Available Room of Hotels (Total Revenue in 2013 is similar with’
that of 2011)
6 0
7.1 7.7
8.3
5.8 5.3 5.3
6.2 6.6
7.5
43 144.9
47.1 37 2
39.7
45.0 48.8 47.9
5.2 5.2 5.1 5.2 5.7
6.0
'05 '06 '07 '08 '90 '10 '11 '12 '13
37.5 38.8
43.1 37.2
'09 '10 '11 '12 '13Financial Crisis A weak yen Diplomatic A weak yen Diplomatic
Copyright(C) Nomura Research Institute, Ltd. All rights reserved. 183
Financial CrisisRelaxation of Visa Requirement for Chinese visitors
A weak yen beganKorean Wave
continued
Diplomatic tension between
Korea and Japan
A weak yen beganKorean Wave
continued
Diplomatic tension between
Korea and Japan
Source: NRI based on Tourism/Accommodation Industry Report, Tourism Knowledge and Information System, Korea Hotel Association
Korea Increase of liquidity within slow economic growth
1 Business trends and Office Market Trends
1-1 Business Trends
1-2 Office Market Trend
2 Household Economy and Housing market trendsy g
3 Hotel Market trends
4 Indirect Investment Market Trends
Copyright(C) Nomura Research Institute, Ltd. All rights reserved. 184
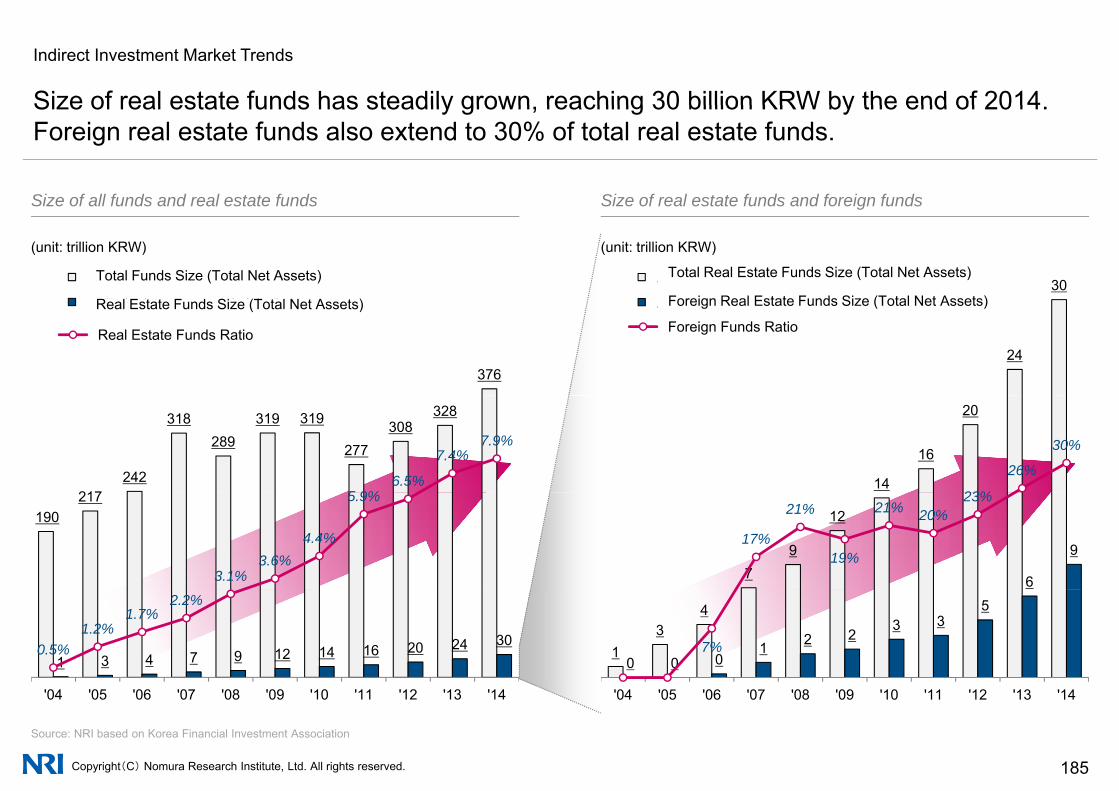
Indirect Investment Market Trends
Size of real estate funds has steadily grown reaching 30 billion KRW by the end of 2014Size of real estate funds has steadily grown, reaching 30 billion KRW by the end of 2014. Foreign real estate funds also extend to 30% of total real estate funds.
Size of all funds and real estate funds Size of real estate funds and foreign fundsSize of all funds and real estate funds Size of real estate funds and foreign funds
30부동산 펀드 규모 (순자산총액)
총
전체 펀드 규모 (순자산총액)
산 펀 자산총액
(unit: trillion KRW) (unit: trillion KRW)
Total Funds Size (Total Net Assets) Total Real Estate Funds Size (Total Net Assets)
Foreign Real Estate Funds Size (Total Net Assets)
24
부동산 해외 펀드 규모 (순자산총액)Foreign Funds Ratio
376
부동산 펀드 규모 (순자산총액)
Real Estate Funds Ratio
Real Estate Funds Size (Total Net Assets) Foreign Real Estate Funds Size (Total Net Assets)
14
16
20
23%
26%
30%
217242
318 289
319 319
277 308
328
5 9%6.5%
7.4%7.9%
79
12
6
917%
21%
19%
21% 20%23%
190 217
3.1%3.6%
4.4%
5.9%
13
4
0 0 01 2 2
3 35
7%1 3 4 7 9 12 14 16 20 24 300.5%
1.2%1.7%
2.2%
Copyright(C) Nomura Research Institute, Ltd. All rights reserved. 185
Source: NRI based on Korea Financial Investment Association
'04 '05 '06 '07 '08 '09 '10 '11 '12 '13 '14'04 '05 '06 '07 '08 '09 '10 '11 '12 '13 '14
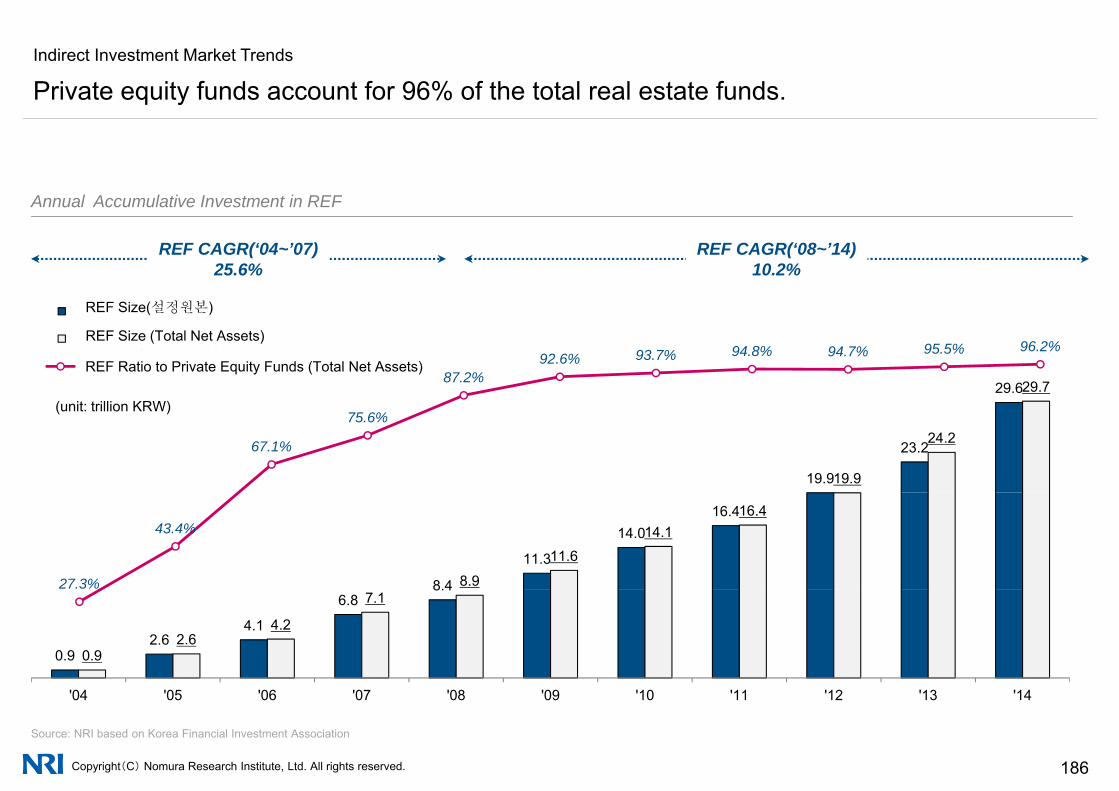
Indirect Investment Market Trends
Private equity funds account for 96% of the total real estate funds.y
Annual Accumulative Investment in REFAnnual Accumulative Investment in REF
REF CAGR(‘04~’07)25.6%
REF CAGR(‘08~’14)10.2%
29.6 29.7
REF 규모(설정원본)
REF 규모(순자산총액)
87.2%92.6% 93.7% 94.8% 94.7% 95.5% 96.2%
REF Ratio to Private Equity Funds (Total Net Assets)
REF Size(설정원본)
REF Size (Total Net Assets)
19.9
23.2
19.9
24.2 67.1%
75.6%(unit: trillion KRW)
8.4
11.3
14.0 16.4
8.9
11.6
14.1 16.4
27.3%
43.4%
0.9 2.6
4.1
6.8 8.4
0.9 2.6
4.2
7.1
Copyright(C) Nomura Research Institute, Ltd. All rights reserved. 186
Source: NRI based on Korea Financial Investment Association
'04 '05 '06 '07 '08 '09 '10 '11 '12 '13 '14
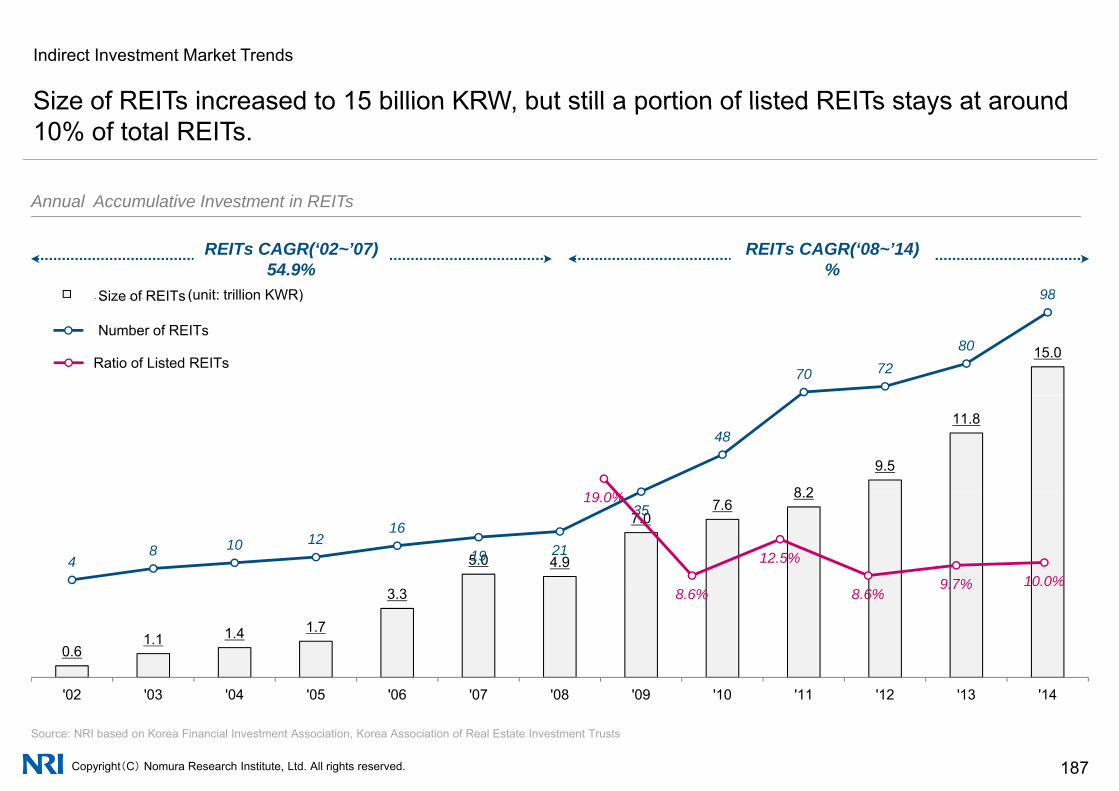
Indirect Investment Market Trends
Size of REITs increased to 15 billion KRW but still a portion of listed REITs stays at aroundSize of REITs increased to 15 billion KRW, but still a portion of listed REITs stays at around 10% of total REITs.
Annual Accumulative Investment in REITsAnnual Accumulative Investment in REITs
REITs 규모 98Size of REITs (unit: trillion KWR)
REITs CAGR(‘02~’07)54.9%
REITs CAGR(‘08~’14)%
15.0
REITs 규모
70 7280
98
REITs 수
Size of REITs
Number of REITs
Ratio of Listed REITs
(unit: trillion KWR)
8 2
9.5
11.8 48
19 0%
3 3
5.0 4.9
7.0 7.6
8.2
48 10 12
16
19 21
3519.0%
8 6%
12.5%
8 6%9.7% 10.0%
0.6 1.1 1.4 1.7
3.3 8.6% 8.6%
Copyright(C) Nomura Research Institute, Ltd. All rights reserved. 187
Source: NRI based on Korea Financial Investment Association, Korea Association of Real Estate Investment Trusts
'02 '03 '04 '05 '06 '07 '08 '09 '10 '11 '12 '13 '14

Indirect Investment Market Trends
REITs in Korea is mainly consisted of CR REITs and externally managed REITs due toREITs in Korea is mainly consisted of CR REITs and externally managed REITs, due to incorporation of distressed assets.
Size of Incorporated Assets by Types of REITs Number of REITs by Types of REITs
30
CR REITs
Externally Managed REITs
Self Managed REITs2
CR REITs
Externally Managed REITs
Self Managed REITs
Size of Incorporated Assets by Types of REITs Number of REITs by Types of REITs
(Unit: trillion KRW) (Unit: number of REITs)
25
Self Managed REITs
1 4
1.6
1.8g
15
20
1
1.2
1.4
100.6
0.8
0
5
0
0.2
0.4
Copyright(C) Nomura Research Institute, Ltd. All rights reserved. 188
0'05 '06 '07 '08 '09 '10 '11 '12 '13 14
0'05 '06 '07 '08 '09 '10 '11 '12 '13 '14
Source: NRI based on Korea Association of Real Estate Investment Trusts

Indirect Investment Market Trends
REITs have traditionally focused on office and housing however its focus area hasREITs have traditionally focused on office and housing, however, its focus area has diversified to retails, hotels and distribution in recent years.
Annual Investment Portfolio of REITs (numbers of REITs)Annual Investment Portfolio of REITs (numbers of REITs)
(unit: %)
8 5 7 9
6 4 3
ETC
50
25 29
17 9
18 19
6 9 5 5
8
7 9 23
ETC
Hotel
100 100
28 62
45 8
8
Distribution/Factory
50
75 71 31
50 40 Retail
Office44
31 32 23
16 22
House
Copyright(C) Nomura Research Institute, Ltd. All rights reserved. 189
Source: NRI based on Korea Financial Investment Association, Ministry of Land, Infrastructure and Transport, Korea Association of Real Estate Investment Trusts, KORAMCO
'04 '05 '06 '07 '08 '09 '10 '11 '12 '13 '14
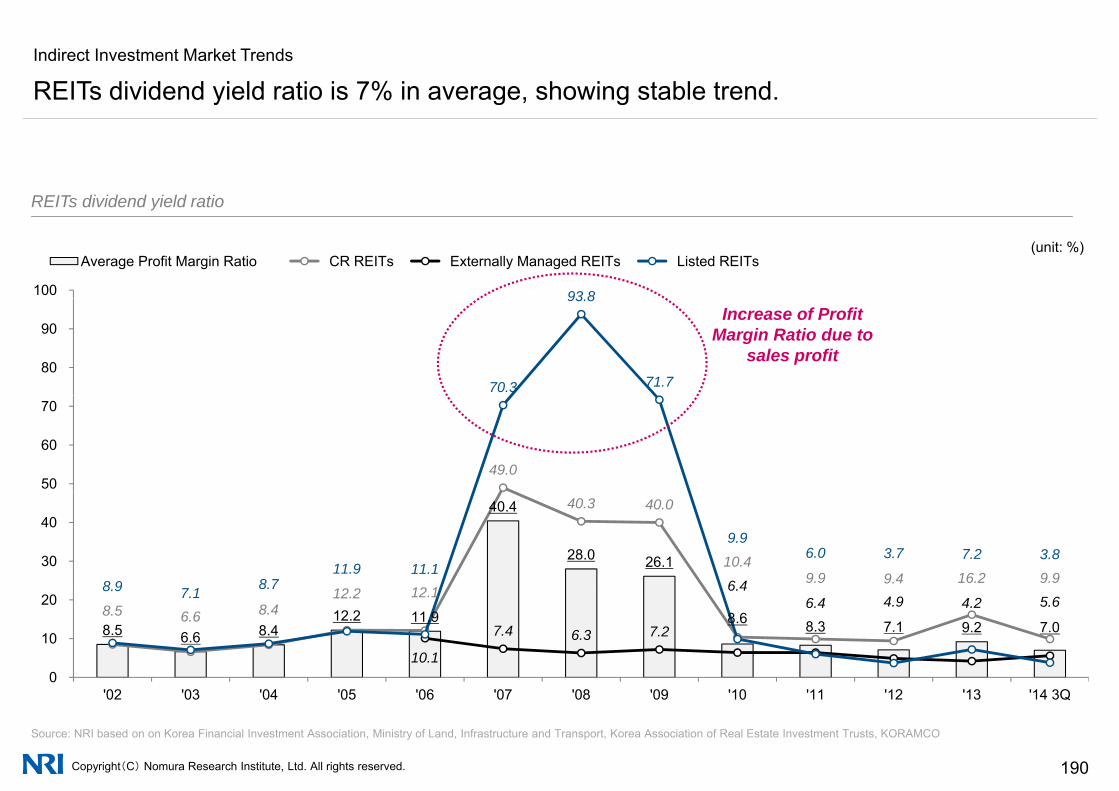
Indirect Investment Market Trends
REITs dividend yield ratio is 7% in average, showing stable trend.y g g
REITs dividend yield ratioREITs dividend yield ratio
93 8100
Average Profit Margin Ratio CR REITs Externally Managed REITs Listed REITs(unit: %)
70.3
93.8
71.7 80
90 Increase of Profit
Margin Ratio due to sales profit
49.0 50
60
70
40.4
28.0 26.1
12 2 12 1
40.3 40.0
10.4 9.9 9.4 16.2 9.9 6.48 9 7 1 8.7
11.9 11.1
9.9 6.0 3.7 7.2 3.8 30
40
8.5 6.6 8.4 12.2 11.9 8.6 8.3 7.1 9.2 7.0
8.5 6.6 8.4 12.2 12.1
10.1
7.4 6.3 7.2
6.4 6.4 4.9 4.2 5.6
8.9 7.1
0
10
20
Copyright(C) Nomura Research Institute, Ltd. All rights reserved. 190
Source: NRI based on on Korea Financial Investment Association, Ministry of Land, Infrastructure and Transport, Korea Association of Real Estate Investment Trusts, KORAMCO
'02 '03 '04 '05 '06 '07 '08 '09 '10 '11 '12 '13 '14 3Q

Japan Japanese Real Estate Investment Market
China China’s market entering an adjustment period
Korea Increase of liquidity within slow economic growthq y g
Taiwan Overview of Office, Residential and Hotel Markets
Singapore Domestic real estate market reaching its peak
India Real Estate Market in India – Residential, Office, etc.
Copyright(C) Nomura Research Institute, Ltd. All rights reserved. 191
Taiwan Overview of Office, Residential and Hotel Markets
1 M F d t l f T i1 Macro Fundamentals of Taiwan
2 Taiwan’s real estate trend (Office, Residence, Hotel)
Copyright(C) Nomura Research Institute, Ltd. All rights reserved. 192
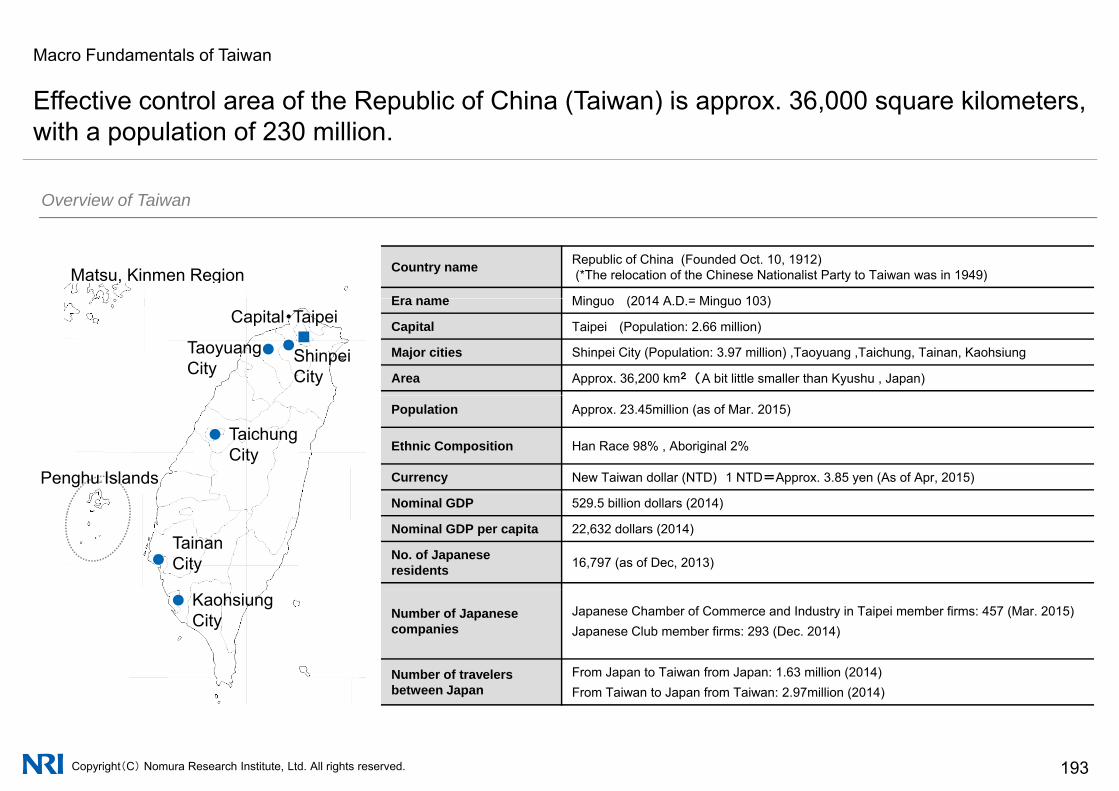
Macro Fundamentals of Taiwan
Effective control area of the Republic of China (Taiwan) is approx 36 000 square kilometersEffective control area of the Republic of China (Taiwan) is approx. 36,000 square kilometers, with a population of 230 million.
Overview of Taiwan
Country name Republic of China (Founded Oct. 10, 1912)(*The relocation of the Chinese Nationalist Party to Taiwan was in 1949)
Era name Minguo (2014 A D Minguo 103)
Matsu, Kinmen Region
Overview of Taiwan
Era name Minguo (2014 A.D.= Minguo 103)
Capital Taipei (Population: 2.66 million)
Major cities Shinpei City (Population: 3.97 million) ,Taoyuang ,Taichung, Tainan, Kaohsiung
Area Approx. 36,200 km2 (A bit little smaller than Kyushu , Japan)
Capital・Taipei
ShinpeiCity
TaoyuangCity
Population Approx. 23.45million (as of Mar. 2015)
Ethnic Composition Han Race 98% , Aboriginal 2%
Currency New Taiwan dollar (NTD) 1 NTD=Approx. 3.85 yen (As of Apr, 2015)Penghu Islands
TaichungCity
Nominal GDP 529.5 billion dollars (2014)
Nominal GDP per capita 22,632 dollars (2014)
No. of Japanese residents 16,797 (as of Dec, 2013)
Tainan City
Number of Japanese companies
Japanese Chamber of Commerce and Industry in Taipei member firms: 457 (Mar. 2015)Japanese Club member firms: 293 (Dec. 2014)
Number of travelers b t J
From Japan to Taiwan from Japan: 1.63 million (2014)
Kaohsiung City
Copyright(C) Nomura Research Institute, Ltd. All rights reserved. 193
between Japan From Taiwan to Japan from Taiwan: 2.97million (2014)

Macro Fundamentals of Taiwan
Population has been increasing, although is expected to peak out within the next 5 years.
The population is about to decrease, with the productive workers’ population expected to peak out in 2015 and the total in 2021.
g g y
Population in Taiwan by age-groupPopulation in Taiwan by age-group
←Actual Forecast→
25,000
15,000
20,000
ousand)
10,000
Populatio
n (th
o
0
5,000
1980 1985 1990 1995 2000 2005 2010 2015 2020 2025 2030
P
Copyright(C) Nomura Research Institute, Ltd. All rights reserved. 194Source: NRI based on the CEPD, Executive Yuan, R.O.C.(Taiwan)
1980 1985 1990 1995 2000 2005 2010 2015 2020 2025 2030
Ages0‐14 Ages15‐64 Age 65 or over

Macro Fundamentals of Taiwan
Population density in Taiwan is twice as high as Japan.y g
Comparison of Taiwan and Japan in population distributionComparison of Taiwan and Japan in population distribution
Land area Total population Population densityLand area Total population Population density
377,944
350 000
400,000 639
600
700 127
120
140
ousand
)
250,000
300,000
350,000
(squ
are km
)
337 400
500
600
er sq
uare km)
80
100
120income (NTD
tho
×1.9
100,000
150,000
200,000
Land
area
100
200
300
latio
n de
nsity
(pe
23 20
40
60
nnual hou
seho
ld i
36,192
0
50,000
Taiwan Japan
0
100
Taiwan Japan
Popu
l
0
20
Taiwan Japan
An
Copyright(C) Nomura Research Institute, Ltd. All rights reserved. 195
Source: NRI based on the Ministry of Interior of ROC and the Ministry of Internal Affairs and Communication of Japan
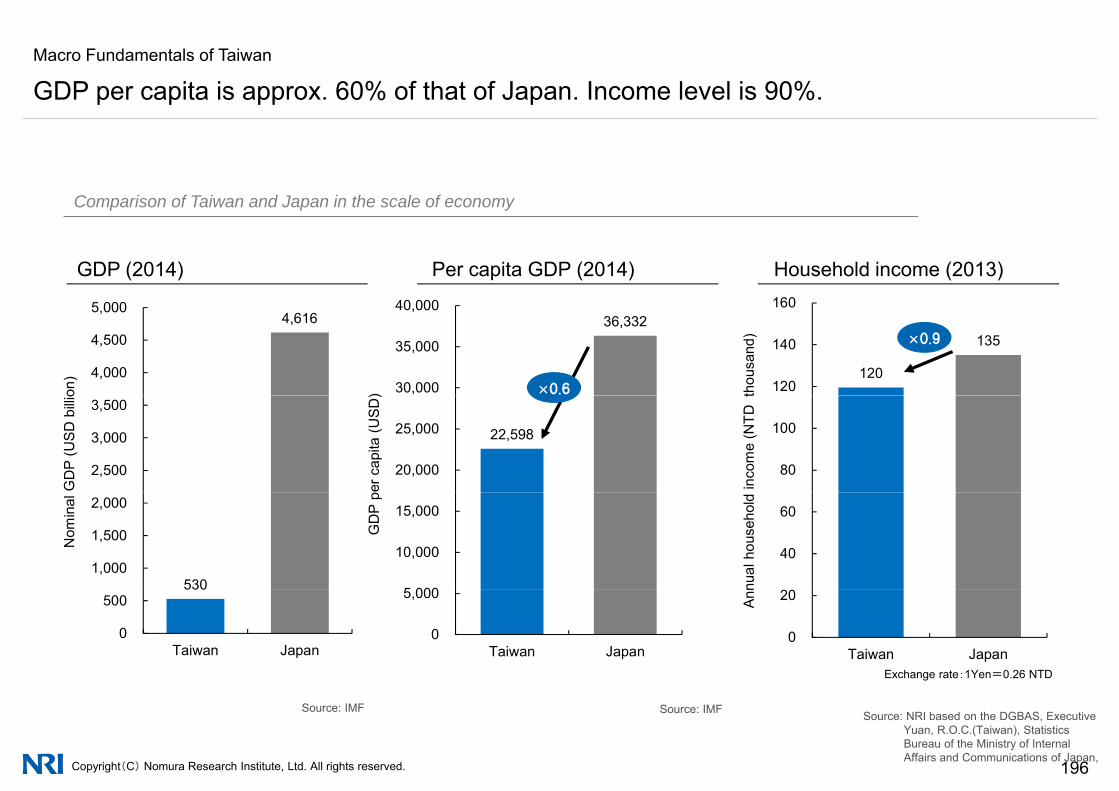
Macro Fundamentals of Taiwan
GDP per capita is approx. 60% of that of Japan. Income level is 90%.
Comparison of Taiwan and Japan in the scale of economy
160
Comparison of Taiwan and Japan in the scale of economy
GDP (2014) Per capita GDP (2014) Household income (2013)
120
135
120
140
160
thou
sand
)
36,332
30,000
35,000
40,000
)
4,616
4,000
4,500
5,000
on)
×0.6
×0.9
80
100
inco
me
(NTD
t
22,598
20,000
25,000
er c
apita
(USD
)
2,500
3,000
3,500
GD
P (U
SD b
illio
40
60
nual
hou
seho
ld
5 000
10,000
15,000
GD
P p
5301,000
1,500
2,000
Nom
inal
0
20
Taiwan Japan
Ann
0
5,000
Taiwan Japan
530
0
500
Taiwan JapanExchange rate:1Yen=0.26 NTD
Copyright(C) Nomura Research Institute, Ltd. All rights reserved. 196
Source: IMF Source: IMF Source: NRI based on the DGBAS, Executive Yuan, R.O.C.(Taiwan), Statistics Bureau of the Ministry of Internal Affairs and Communications of Japan,
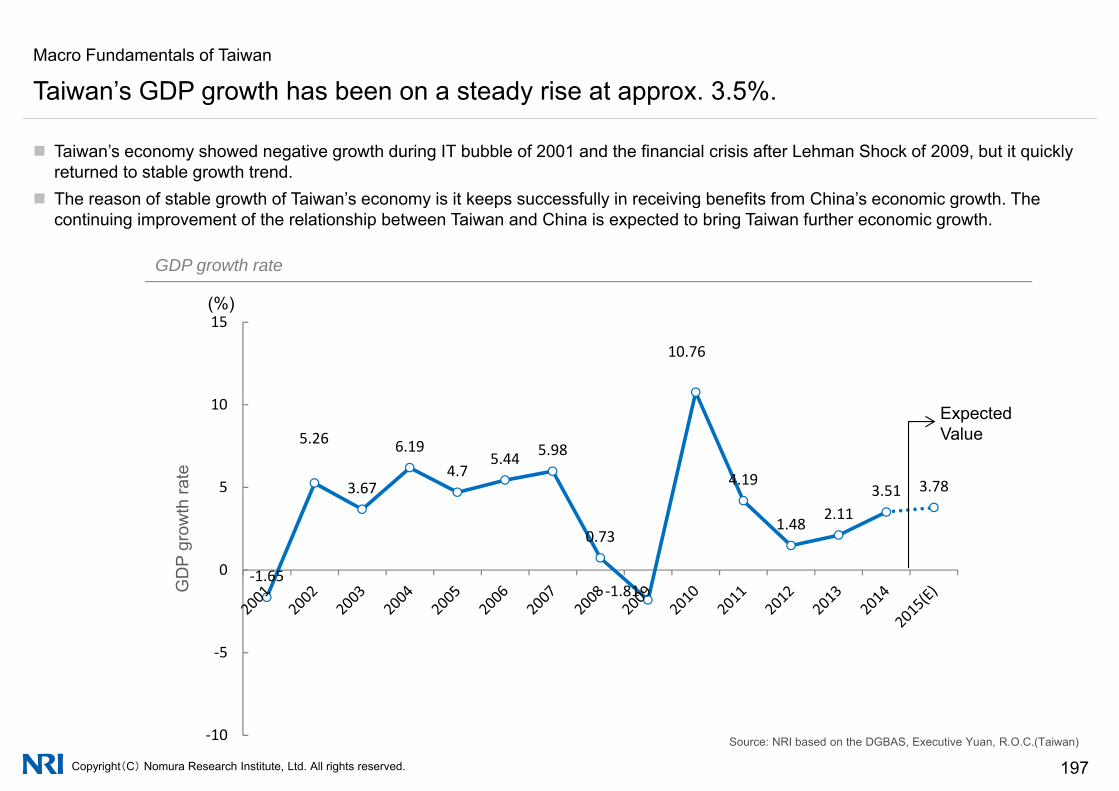
Macro Fundamentals of Taiwan
Taiwan’s GDP growth has been on a steady rise at approx. 3.5%.
Taiwan’s economy showed negative growth during IT bubble of 2001 and the financial crisis after Lehman Shock of 2009, but it quickly returned to stable growth trend.
The reason of stable growth of Taiwan’s economy is it keeps successfully in receiving benefits from China’s economic growth The
g y
The reason of stable growth of Taiwan s economy is it keeps successfully in receiving benefits from China s economic growth. Thecontinuing improvement of the relationship between Taiwan and China is expected to bring Taiwan further economic growth.
GDP growth rate
(%)(%)
10.76
15
rate
5.26
3.67
6.194.7
5.44 5.98
4.193 51 3.785
10 ExpectedValue
GD
P gr
owth
r
‐1.65
3.67
0.73
1 81
1.48 2.113.51
0
G ‐1.81
‐5
Copyright(C) Nomura Research Institute, Ltd. All rights reserved. 197Source: NRI based on the DGBAS, Executive Yuan, R.O.C.(Taiwan)‐10

Macro Fundamentals of TaiwanRelationship between Taiwan and China improved significantly after 2008. In recent years, however, Taiwan has been met with events which highlighted underlying discontent against China among itsTaiwan has been met with events which highlighted underlying discontent against China among its population.
History of “Cross-strait relationship” under Ma Ying-jiu regime
May 2008 Ma Ying-jiu of the Nationalist Party becomes the 12th President of Taiwan.
Jul.. Chinese tourists to Taiwan was deregulated. (Group tour)
Dec. The Three Links (Liberalization in commerce, transportation, and postal service) is implemented.( p p ) p
Dec. Cross-Strait Conference on the Cooperation and Exchange of the Chinese Medicine Industry, which is the project representing the cross-strait industrial bridge, was held in Taipei.
Apr. 2009 The third summit meeting of cross-strait contact points was held. A memorandum on cross-strait financial cooperation (concerning banks, securities and insurances) was signed and chartered flights were decided to be increased and become scheduled.Chinese investment into Taiwan was deregulated (63 kinds in manufacturing 24 in service and 11 in public works was released to be invested byJul. Chinese investment into Taiwan was deregulated. (63 kinds in manufacturing, 24 in service and 11 in public works was released to be invested by Chinese).
Nov. Cross-Strait financial MOU was signed. (Put into effect in January 2010)
Jun. 2010 Signed Economic Cooperation Framework Agreement ;ECFA. At the same time announced the list for bilateral tariff negotiation items.
Jan. 2011 Started waiving import tariffs (so-called Early Harvest list).
Nov. Both sides agreed on industry cooperation in following segments (LED. Municipal Wireless, Cold Chain Logistics, TFT-LCD, EV).
Aug 2012 The customs authorities of Taiwan and China signed a Cross-Strait Customs Cooperation Agreement regarding customs service, smuggling crackdown d t iff d tiAug. 2012 and tariff reduction.
Aug. Both sides reached a consensus to promote a mechanism of transparency information, loosing investment limitations to promote prosperity.
Jun. 2013 The Cross-Strait Agreement in Trade in Services based on WTO framework is signed. It proposes opening up over 100 services sectors in phases.
Copyright(C) Nomura Research Institute, Ltd. All rights reserved. 198
Mar 2014 The Cross-Strait Service Trade Agreement Law passed the diet. But anti-the law demonstration was happened on the next day.
April Legislative Speaker promised to postpone review of the law until legislation monitoring all cross-strait agreements has been passed

Macro Fundamentals of Taiwan
Taiwan-China relation was also reinforced in terms of transportation Taiwan is now listed asTaiwan China relation was also reinforced in terms of transportation. Taiwan is now listed as one of the Asian countries with the most densely air direct links with China.
No. of Destinations in China No. of flights to China
Wid i li k t “S d Ti ” iti Fli ht b t T i d ChiWidening links to “Second-Tier” cities even “Third-Tier” cities to build an extensive flight network.
Flights between Taiwan and China have already outnumbered Hong Kong’s.
840Taiwan55Taiwan
800HK44HK
0 200 400 600 800 1,000Linkages to China
0 10 20 30 40 50 60Direct links to China Unit: Flights/weekUnit: Destinations
Copyright(C) Nomura Research Institute, Ltd. All rights reserved. 199
Linkages to China Direct links to China
Source: NRI based on the Civil Aeronautics Administration of the MOTC, R.O.C.(Taiwan),
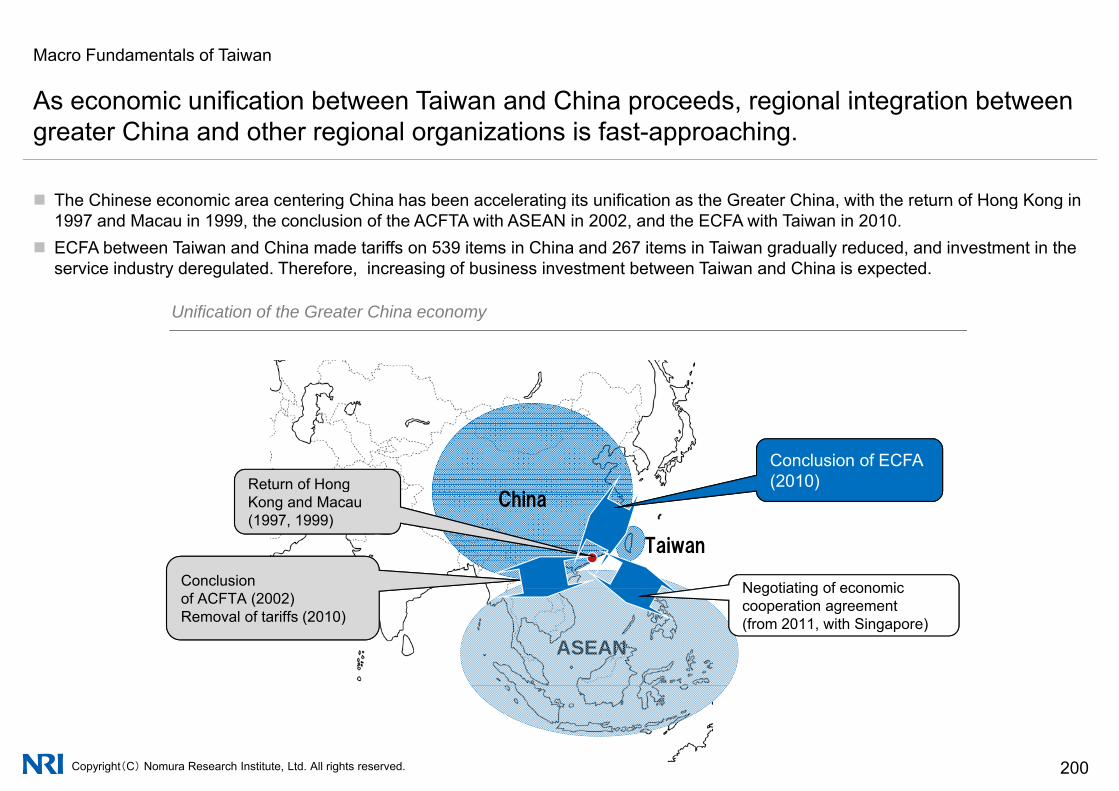
Macro Fundamentals of Taiwan
As economic unification between Taiwan and China proceeds regional integration between
The Chinese economic area centering China has been accelerating its unification as the Greater China with the return of Hong Kong in
As economic unification between Taiwan and China proceeds, regional integration between greater China and other regional organizations is fast-approaching.
The Chinese economic area centering China has been accelerating its unification as the Greater China, with the return of Hong Kong in 1997 and Macau in 1999, the conclusion of the ACFTA with ASEAN in 2002, and the ECFA with Taiwan in 2010.
ECFA between Taiwan and China made tariffs on 539 items in China and 267 items in Taiwan gradually reduced, and investment in the service industry deregulated. Therefore, increasing of business investment between Taiwan and China is expected.
Unification of the Greater China economy
ChiReturn of Hong
Conclusion of ECFA(2010)
China
Taiwan
Kong and Macau (1997, 1999)
Conclusion Negotiating of economic
ASEAN
of ACFTA (2002)Removal of tariffs (2010)
Negotiating of economic cooperation agreement (from 2011, with Singapore)
Copyright(C) Nomura Research Institute, Ltd. All rights reserved. 200

Taiwan Overview of Office, Residential and Hotel Markets
1 M F d t l f T i1 Macro Fundamentals of Taiwan
2 Taiwan’s real estate trend (Office, Residence, Hotel)
Copyright(C) Nomura Research Institute, Ltd. All rights reserved. 201

Taiwan’s real estate situation (Office, Residence, Hotel)
Following 7 areas compose major office districts of Taipei City.g j y
Neihu Science Park district
Major office areas in Taipei City
Neihu Science Park district• The area Government aims to develop as a science park
district• Holding a large concentration of IT industry
headquarters.• Its traffic convenience has improved due to the extension
of MRT
Songjiang Nanjing• Area with the highest office density in Taipei.• Holding a large number of offices of Japanese
firms as well as traditional industries, financial services, and travel industries. of MRT.services, and travel industries.
anjin
g
g
Neihu SciencePark district
n N
orth
Zhong Shan North• A large concentration of offices, commercial
Taipei SongShan Airport
Dun Hua N./Minsheng• Having the second largest concentration of luxury offices
(Hsin Yi area is the largest) and being home to many financial service industries.
• Traffic convenience significantly improved after the Song
jiang
Na
Dun
Hua
/M
ings
hen g
Zhon
g Sh
afacilities, and hotels.• Many offices of Japanese firms are also
located .
Hsin Yi/World Trade Center• Redeveloped under the Hsin Yi Development
Plan • Area with the highest office rent level in
T i i
SongShan airport became an international airport.Taipei stationarea
nan
Hsin Yi/Taipei.
• Highly convenient, due to the large concentration of administrative, financial, trade exhibitory, leisure, and residential functions.
• Offices of many global companies such as IBM and Microsoft located .
Dunnan• Holding a large number of well-known companies and
foreign firms.
Taipei station area• Area centering Taipei station, where the lines of
Taiwan Railways, MRT, and the High Speed Rail intersect.
• The first area in Taipei City where offices were
Dun
nWorld Trade Center
Copyright(C) Nomura Research Institute, Ltd. All rights reserved. 202
g• Holding many financial companies, as well as many
traditional industries.• With its traffic convenience, having developed to be
a complex of residential and commercial area.
p ydeveloped, with a large concentration of financial/ insurance industries and government institutions.
Source: NRI based on the Taiwan real estate yearbook and other materials

Taiwan’s real estate situation (Office, Residence, Hotel)
Office vacancy rates in Taipei City started to decline in 2010 however due significant
Recent years Overall the vacancy rates in Taipei were declining and is about 6% in end of 2013
Office vacancy rates in Taipei City started to decline in 2010, however, due significant increase of supply in 2014, vacancy rate exceeded 8%.
Recent years, Overall, the vacancy rates in Taipei were declining and is about 6% in end of 2013. in 2014, approximately 360,000sqm office floor completion in Nan-gang and Song-shang district. Therefore, vacancy rate were rising up to 8% in2014.
Supply of new offices and vacancy rates in Taipei City
14
16
140 000
160,000
180,000 Completion of Taipei 101
Taiwan Cooperative Bank : 32,000pingChina Trust Financial
8
10
12
100,000
120,000
140,000
空
単位
:坪
)su
pply
(Pin
g)
Vac
anc
China Trust Financial Holding:80,000ping
4
6
8
60,000
80,000
室率
(%)
新規
供給
面積
(単
Completion of FargloryFinancial Center
reas
of n
ew s
cy rate
(%)
0
2
4
0
20,000
40,000
新A
r
Copyright(C) Nomura Research Institute, Ltd. All rights reserved. 203
2002 2003 2004 2005 2006 2007 2008 2009 2010 2011 2012 2013 2014
00
Source: NRI based on the Taiwan real estate yearbook
Areas of New Supply (Ping) Vacancy Rate (%)
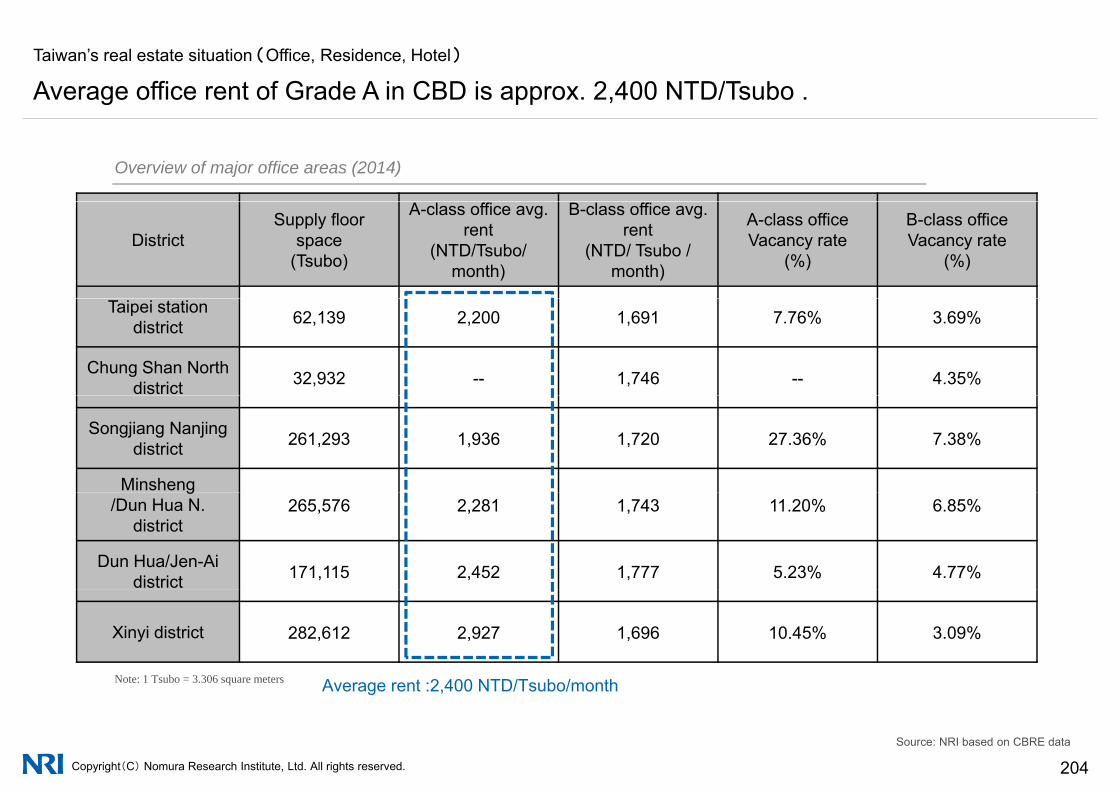
Taiwan’s real estate situation (Office, Residence, Hotel)
Average office rent of Grade A in CBD is approx. 2,400 NTD/Tsubo . g
Overview of major office areas (2014)
DistrictSupply floor
space (Tsubo)
A-class office avg. rent
(NTD/Tsubo/month)
B-class office avg. rent
(NTD/ Tsubo /month)
A-class office Vacancy rate
(%)
B-class office Vacancy rate
(%)
Taipei station district 62,139 2,200 1,691 7.76% 3.69%
Chung Shan North district 32,932 -- 1,746 -- 4.35%
Songjiang Nanjing district 261,293 1,936 1,720 27.36% 7.38%
Minshengg/Dun Hua N.
district265,576 2,281 1,743 11.20% 6.85%
Dun Hua/Jen-Ai district 171,115 2,452 1,777 5.23% 4.77%
Xinyi district 282,612 2,927 1,696 10.45% 3.09%
Note: 1 Tsubo = 3.306 square meters Average rent :2 400 NTD/Tsubo/month
Copyright(C) Nomura Research Institute, Ltd. All rights reserved. 204Source: NRI based on CBRE data
Average rent :2,400 NTD/Tsubo/month

Taiwan’s real estate situation (Office, Residence, Hotel)
Large number of new office spaces are expected to be supplied in 2016.
In 2016, numerous floor areas of office are expected to be supplied into real estate market.
g
1,200,00070
Number of office construction license issuanceand total floor space licensed for construction in Taipei City
1,000,000
50
60 建設
ライ
600,000
800,000
30
40
イセ
ンス
発行
延
ンス
発行
件数
400,00020
30
延べ
床面
積(m
2
建設
ライ
セン
0
200,000
0
10
2001 2002 2003 2004 2005 2006 2007 2008 2009 2010 2011 2012 2013 2014
2)
Copyright(C) Nomura Research Institute, Ltd. All rights reserved. 205
2001 2002 2003 2004 2005 2006 2007 2008 2009 2010 2011 2012 2013 2014
Source: NRI based on statistics by the CPAMI, R.O.C.(Taiwan)
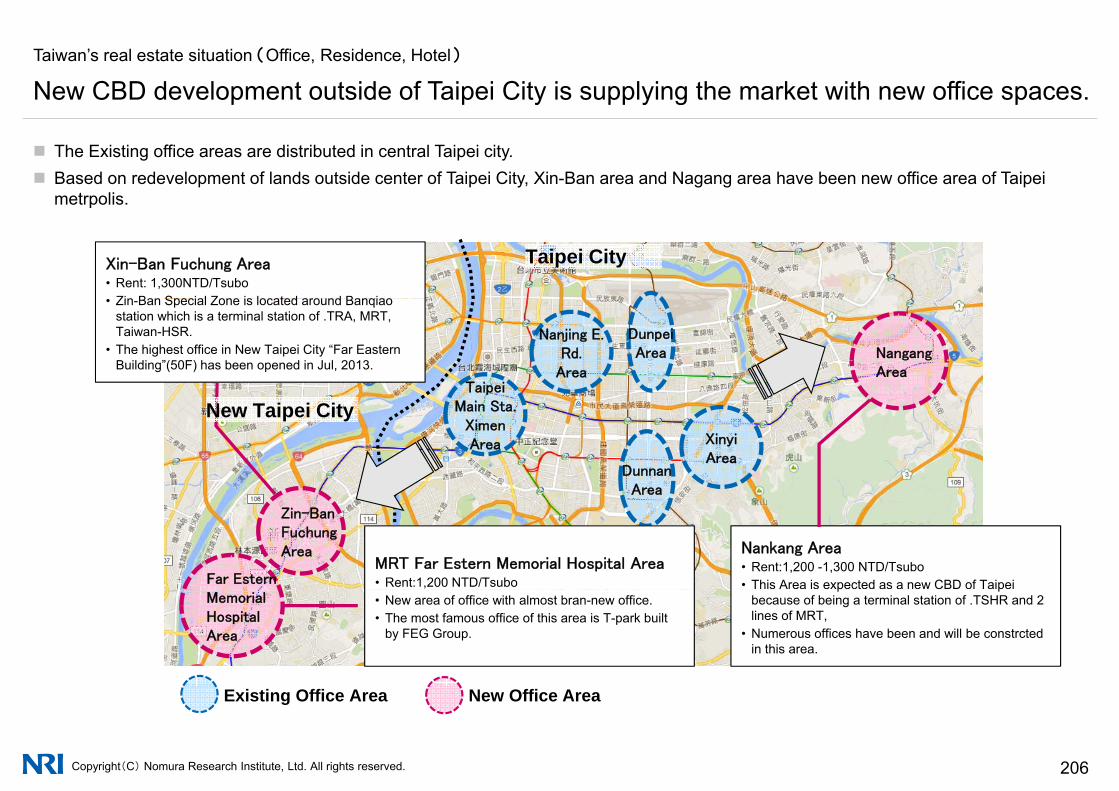
Taiwan’s real estate situation (Office, Residence, Hotel)
New CBD development outside of Taipei City is supplying the market with new office spaces.
The Existing office areas are distributed in central Taipei city. Based on redevelopment of lands outside center of Taipei City, Xin-Ban area and Nagang area have been new office area of Taipei
metrpolis
y y g
metrpolis.
Xin-Ban Fuchung Area• Rent: 1,300NTD/Tsubo
Zin Ban Special Zone is located around Banqiao
Taipei City
Taipei
DunpeiArea
Nanjing E.Rd.
AreaNangangArea
• Zin-Ban Special Zone is located around Banqiaostation which is a terminal station of .TRA, MRT, Taiwan-HSR.
• The highest office in New Taipei City “Far Eastern Building”(50F) has been opened in Jul, 2013.
Main Sta.XimenArea
DunnanArea
XinyiArea
New Taipei City
Area
Zin-BanFuchungArea
Far EsternMRT Far Estern Memorial Hospital Area• Rent:1,200 NTD/Tsubo
Nankang Area• Rent:1,200 -1,300 NTD/Tsubo• This Area is expected as a new CBD of Taipei
MemorialHospitalArea
• New area of office with almost bran-new office.• The most famous office of this area is T-park built
by FEG Group.
p pbecause of being a terminal station of .TSHR and 2 lines of MRT,
• Numerous offices have been and will be constrctedin this area.
Copyright(C) Nomura Research Institute, Ltd. All rights reserved. 206
Existing Office Area New Office Area
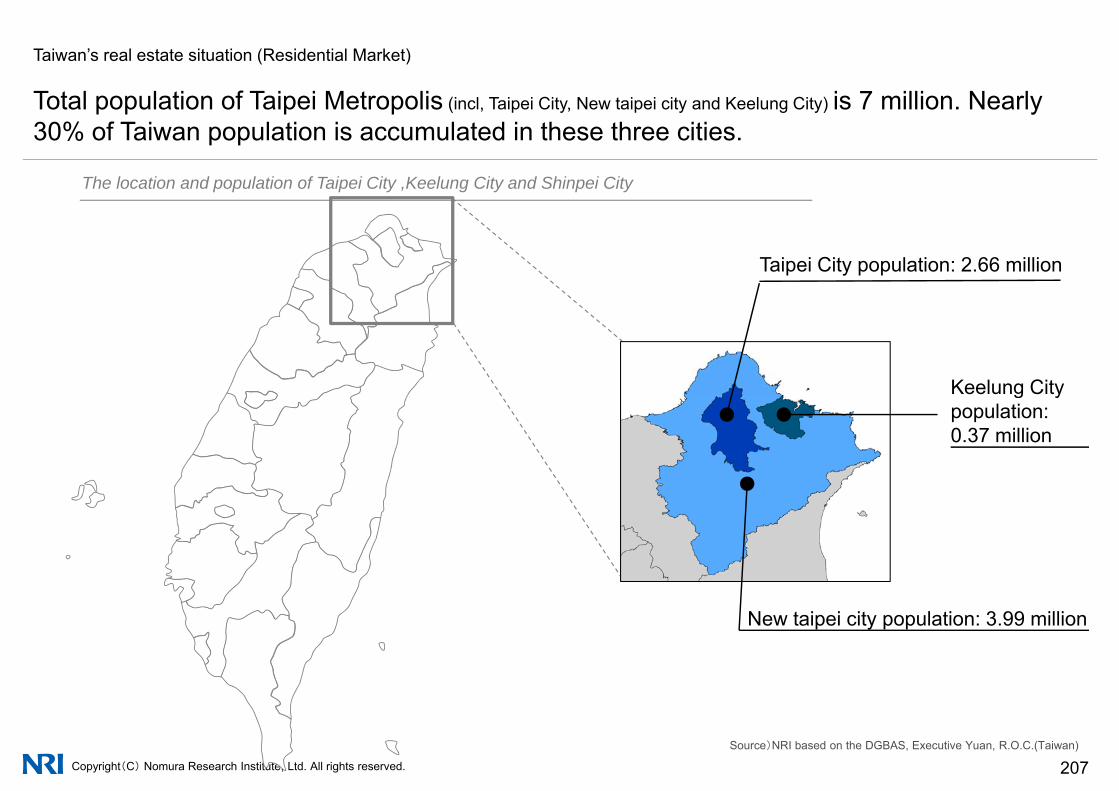
Taiwan’s real estate situation (Residential Market)
Total population of Taipei Metropolis (incl Taipei City New taipei city and Keelung City) is 7 million NearlyTotal population of Taipei Metropolis (incl, Taipei City, New taipei city and Keelung City) is 7 million. Nearly 30% of Taiwan population is accumulated in these three cities.
The location and population of Taipei City ,Keelung City and Shinpei City
Taipei City population: 2.66 million
Keelung City g ypopulation: 0.37 million
New taipei city population: 3.99 million
Copyright(C) Nomura Research Institute, Ltd. All rights reserved. 207Source)NRI based on the DGBAS, Executive Yuan, R.O.C.(Taiwan)

Taiwan’s real estate situation (Residential Market)
Over the past 5 years, Taipei metropolitan area has been gradually expanding to the west.y g y g
Population Changes in Taipei City and New Taipei City over the last five years
TaipeiKeelung City
New-Town region
Shimen
JinshanSanzhia pe
cityTaoyuanCounty
y
MRTdevelopment Taipei
Keelung City
Danshui
BaliLinkou
WuguL h
Wanli
Ruifang
ShinpeiCity
YilanCounty
region Taipei City
WuguLuzhou
SanchongTaishanXinzhuang
Shulin ZhongheYonghe
BanqiaoShenkeng
Xizhi
Pingxi
Ruifang
Shuangxi
Gongliao
New Taipei City
Legend: Average
Yingge
Sanxia Xindian
TuchengShiding
Pinglin
Legend: Average annual growth rate
WulaiNew-Town
region
Copyright(C) Nomura Research Institute, Ltd. All rights reserved. 208Source: NRI based on statistics by the Ministry of Interior, R.O.C.(Taiwan)
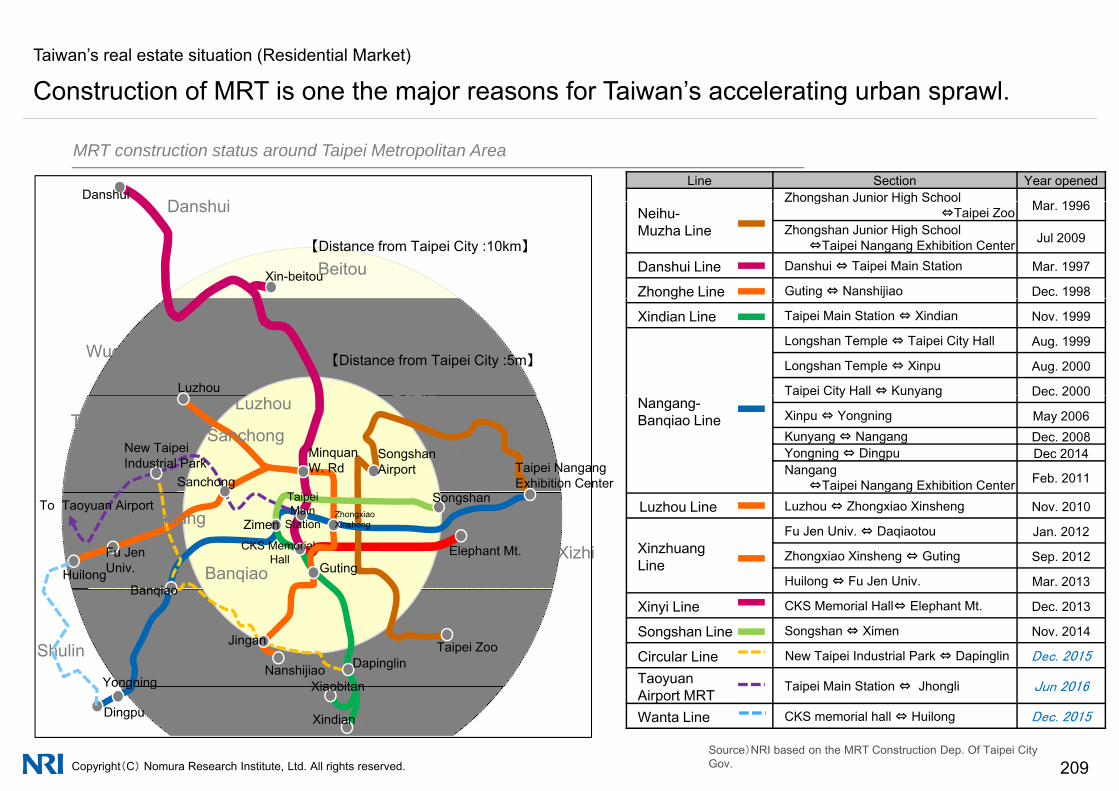
Taiwan’s real estate situation (Residential Market)
Construction of MRT is one the major reasons for Taiwan’s accelerating urban sprawl.j g
MRT construction status around Taipei Metropolitan Area
Line Section Year openedZhongshan Junior High School M 1996D h i
DanshuiNeihu-Muzha Line
Zhongshan Junior High School ⇔Taipei Zoo Mar. 1996
Zhongshan Junior High School ⇔Taipei Nangang Exhibition Center Jul 2009
Danshui Line Danshui ⇔ Taipei Main Station Mar. 1997
Zhonghe Line Guting ⇔ Nanshijiao Dec. 1998
【Distance from Taipei City :10km】
Danshui
BeitouXin-beitoug
Xindian Line Taipei Main Station ⇔ Xindian Nov. 1999
Longshan Temple ⇔ Taipei City Hall Aug. 1999
Longshan Temple ⇔ Xinpu Aug. 2000
Taipei City Hall ⇔ Kunyang Dec. 2000
Wugu
DazhiLuzhou
【Distance from Taipei City :5m】
Nangang-Banqiao Line
p y y g Dec. 2000
Xinpu ⇔ Yongning May 2006Kunyang ⇔ Nangang Dec. 2008Yongning ⇔ Dingpu Dec 2014Nangang
⇔Taipei Nangang Exhibition Center Feb. 2011
TaishanLuzhou
Neihu
Dazhi
SanchongNew Taipei Industrial Park
Sanchong
MinquanW. Rd
T i i
Taipei NangangExhibition Center
SongshanAirport
g g
Luzhou Line Luzhou ⇔ Zhongxiao Xinsheng Nov. 2010
XinzhuangLine
Fu Jen Univ. ⇔ Daqiaotou Jan. 2012
Zhongxiao Xinsheng ⇔ Guting Sep. 2012
Huilong ⇔ Fu Jen Univ. Mar. 2013
Xinzhuang
Banqiao
Nangang
XizhiFu Jen Univ.Huilong Guting
CKS MemorialHall
Zimen
Taipei Main
Station
SongshanTo Taoyuan Airport
Banqiao
Elephant Mt.
ZhongxiaoXinsheng
Xinyi Line CKS Memorial Hall⇔ Elephant Mt. Dec. 2013
Songshan Line Songshan ⇔ Ximen Nov. 2014
Circular Line New Taipei Industrial Park ⇔ Dapinglin Dec. 2015
Taoyuan Taipei Main Station ⇔ Jhongli Jun 2016
Zhonghe
Muzha
YongningNanshijiao
Jingan Taipei ZooDapinglin
Xiaobitan
Banqiao
Shulin
Copyright(C) Nomura Research Institute, Ltd. All rights reserved. 209
yAirport MRT Taipei Main Station ⇔ Jhongli Jun 2016
Wanta Line CKS memorial hall ⇔ Huilong Dec. 2015
Source)NRI based on the MRT Construction Dep. Of Taipei City Gov.
Xindian
Yongning
Dingpu
Xiaobitan
Xindian

Taiwan’s real estate situation (Residential Market)
Together with transition of population land price is also rising up in the west of Taipei’sTogether with transition of population, land price is also rising up in the west of Taipei s metropolitan area.
Land price growth rate at major areas in Taipei City and New Taipei City
Legend: Average annual growth rateg g g
Copyright(C) Nomura Research Institute, Ltd. All rights reserved. 210Source: NRI based on statistics by the Ministry of Interior, R.O.C.(Taiwan)
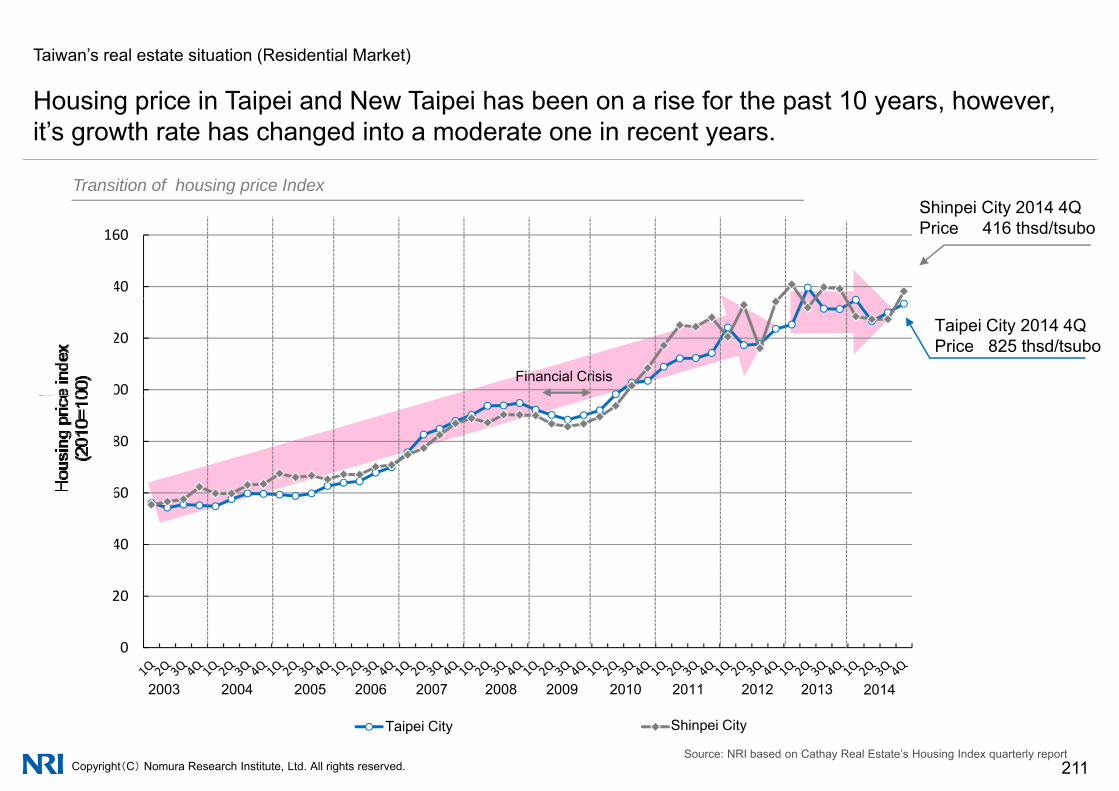
Taiwan’s real estate situation (Residential Market)
Housing price in Taipei and New Taipei has been on a rise for the past 10 years howeverHousing price in Taipei and New Taipei has been on a rise for the past 10 years, however, it’s growth rate has changed into a moderate one in recent years.
Transition of housing price IndexShi i Cit 2014 4Q
140
160
Shinpei City 2014 4QPrice 416 thsd/tsubo
100
120
指数
する
指数
)
Financial Crisis
Taipei City 2014 4QPrice 825 thsd/tsubo
60
80
住宅
価格
指
010年
を10
0とす
40
60
(2
0
20
201120102009200820072006200520042003 2012 2013 2014
Copyright(C) Nomura Research Institute, Ltd. All rights reserved. 211
台北市 新北市
201120102009200820072006200520042003 2012 2013 2014
Taipei City Shinpei City
Source: NRI based on Cathay Real Estate’s Housing Index quarterly report
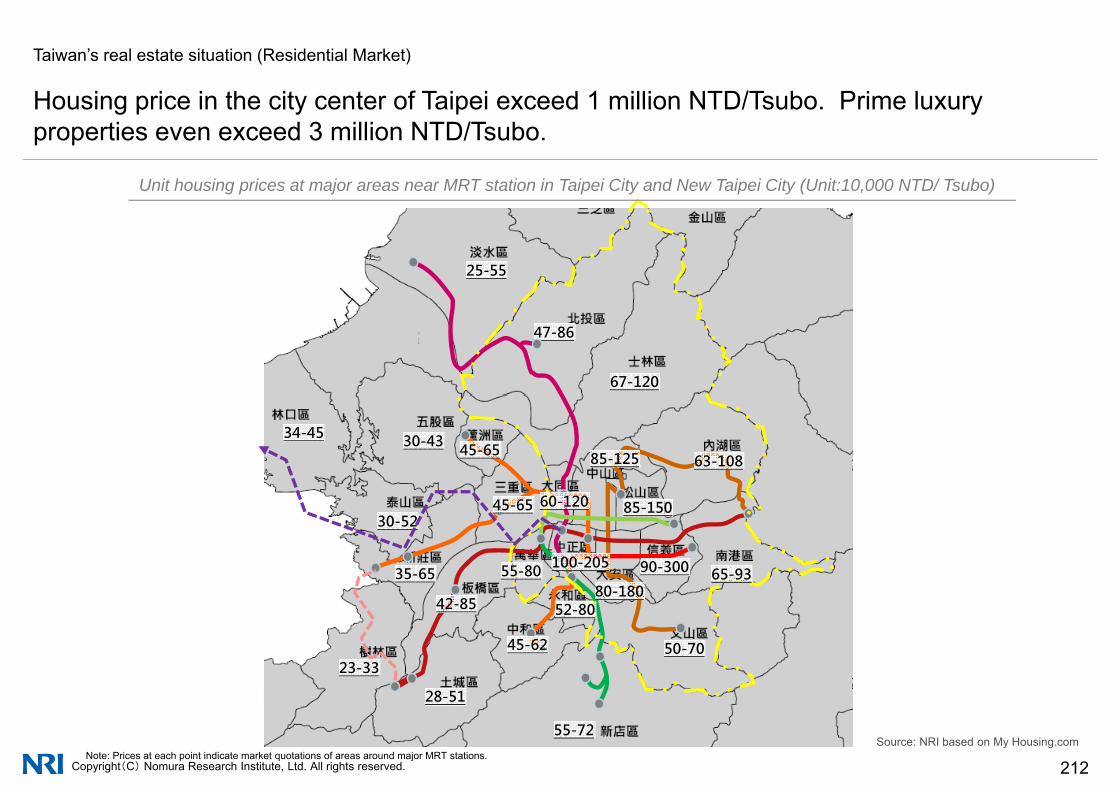
Taiwan’s real estate situation (Residential Market)
Housing price in the city center of Taipei exceed 1 million NTD/Tsubo Prime luxuryHousing price in the city center of Taipei exceed 1 million NTD/Tsubo. Prime luxury properties even exceed 3 million NTD/Tsubo.
Unit housing prices at major areas near MRT station in Taipei City and New Taipei City (Unit:10,000 NTD/ Tsubo)
25-55
47-86
67-120
45-6563-10885-125
30-4334-45
65-9355-80 100-20535-65
45-65 60-120 85-150
80 180
90-300
30-52
45-62 50-70
52-8042-8580-180
23-33
Copyright(C) Nomura Research Institute, Ltd. All rights reserved. 212Note: Prices at each point indicate market quotations of areas around major MRT stations.
Source: NRI based on My Housing.com55-72
28-51

Taiwan’s real estate situation (Residential Market)
Rent price is extremely low compared to selling price Cap rate of the majority of propertiesRent price is extremely low compared to selling price. Cap rate of the majority of properties in Taipei City even remain under 2%.
Cap rates of properties in Taipei City and New Taipei City
LocationZhongshan Dist
(Near MRT Zhongshan Neihu Dist(Near MRT Neihu Sta )
Wenshan Dist(Near MRT Xinhai Sta )
Taipei City New Taipei City
AddressBanqiao Dist
(Near MRT BanqiaoElementary School Sta.) (Near MRT Neihu Sta. ) (Near MRT Xinhai Sta.)
Layout 2 Room 2LDK 3LDK
Address (Near MRT BanqiaoSta.)
Layout 3LDK
Area 30 Tsubo 41 Tsubo 26 Tsubo
Age 5 year 2 years 18 years
Area 33 Tsubo
A 8Age 5 year 2 years 18 years
Price 18 million NTD 29million NTD 24 million NTD
Age 8 years
Price 41 million NTD
Rent 29,000 NTD 50,000 NTD 27,000 NTD Rent 65,000 NTD
Copyright(C) Nomura Research Institute, Ltd. All rights reserved. 213Source: NRI based on interviews with owners, material by 591.com,
etc.
Cap Rate 1.9% 2.0% 1.4% Cap Rate 1.9%
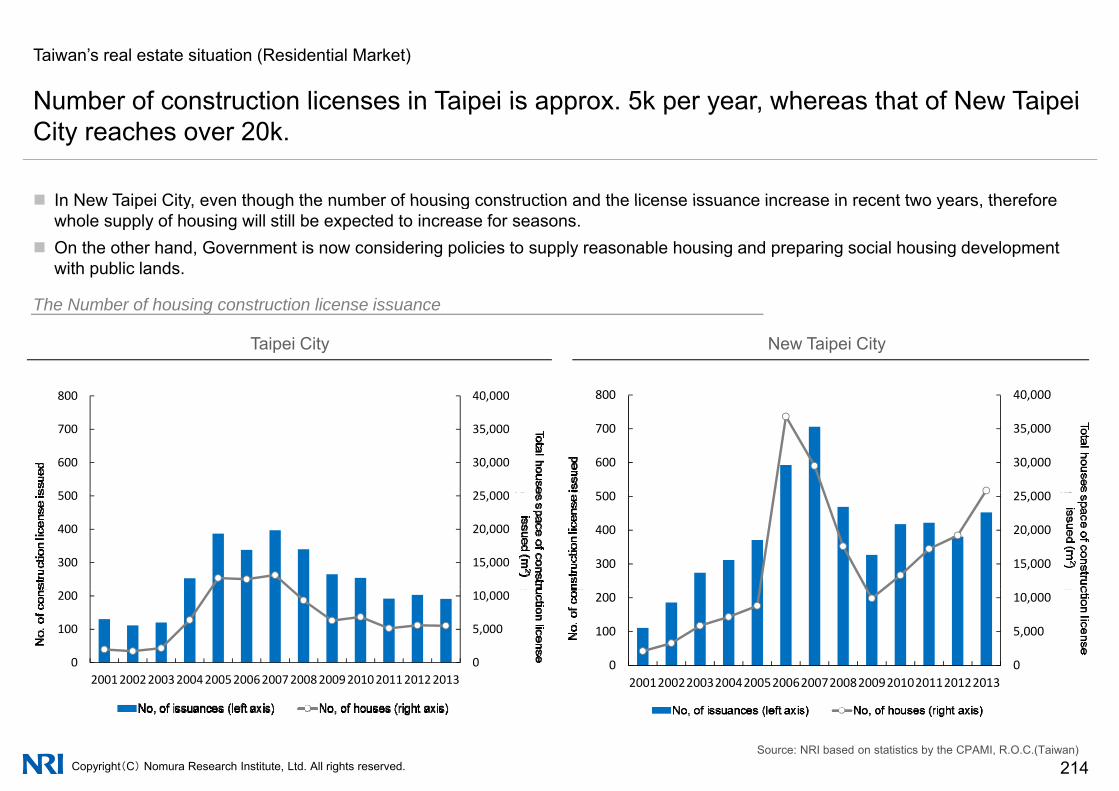
Taiwan’s real estate situation (Residential Market)
Number of construction licenses in Taipei is approx 5k per year whereas that of New Taipei
In New Taipei City even though the number of housing construction and the license issuance increase in recent two years therefore
Number of construction licenses in Taipei is approx. 5k per year, whereas that of New Taipei City reaches over 20k.
In New Taipei City, even though the number of housing construction and the license issuance increase in recent two years, therefore whole supply of housing will still be expected to increase for seasons.
On the other hand, Government is now considering policies to supply reasonable housing and preparing social housing development with public lands.
Th N b f h i t ti li iThe Number of housing construction license issuance
Taipei City New Taipei City
40 000800 40 000800
25 000
30,000
35,000
40,000
500
600
700
800
建設
件数
25 000
30,000
35,000
40,000
500
600
700
800
建設
件数
15,000
20,000
25,000
300
400
500
設ラ
イセ
ンス
発行
戸
設ラ
イセ
ンス
発行
件
15,000
20,000
25,000
300
400
500
設ラ
イセ
ンス
発行
戸
設ラ
イセ
ンス
発行
件
0
5,000
10,000
0
100
200
2001200220032004200520062007200820092010201120122013
戸数
建設
0
5,000
10,000
0
100
200
2001200220032004200520062007200820092010201120122013
戸数
建設
Copyright(C) Nomura Research Institute, Ltd. All rights reserved. 214Source: NRI based on statistics by the CPAMI, R.O.C.(Taiwan)
件数(左軸) 戸数(右軸)
2001200220032004200520062007200820092010201120122013
件数(左軸) 戸数(右軸)
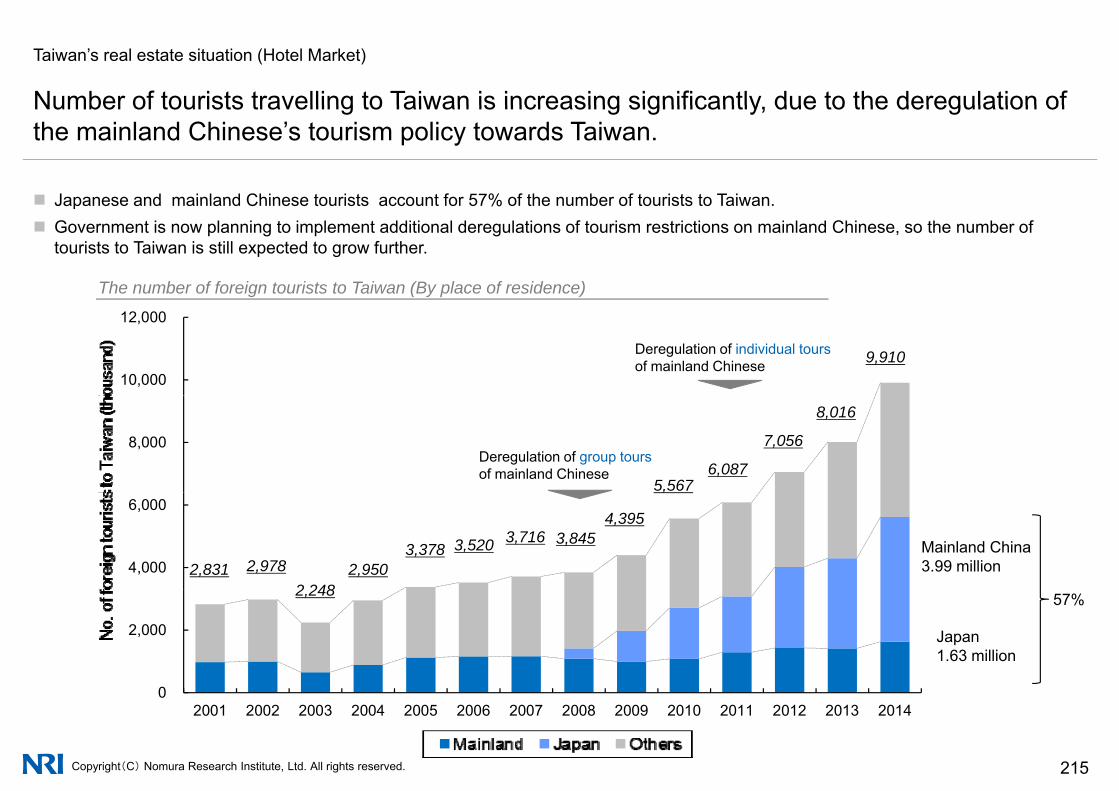
Taiwan’s real estate situation (Hotel Market)
Number of tourists travelling to Taiwan is increasing significantly due to the deregulation of
Japanese and mainland Chinese tourists account for 57% of the number of tourists to Taiwan
Number of tourists travelling to Taiwan is increasing significantly, due to the deregulation of the mainland Chinese’s tourism policy towards Taiwan.
Japanese and mainland Chinese tourists account for 57% of the number of tourists to Taiwan. Government is now planning to implement additional deregulations of tourism restrictions on mainland Chinese, so the number of
tourists to Taiwan is still expected to grow further.
The number of foreign tourists to Taiwan (By place of residence)
10,000
12,000
千人
) 9,910Deregulation of individual toursof mainland Chinese
8,000
の推
移(単
位:千
5,5676,087
7,056
8,016
Deregulation of group toursof mainland Chinese
4,000
6,000
海外
旅行
者数
の
Mainland China3.99 million2,831 2,978
2 2482,950
3,378 3,520 3,716 3,8454,395
,
2,000
訪台
湾海 57%
Japan1.63 million
2,248
Copyright(C) Nomura Research Institute, Ltd. All rights reserved. 215
02001 2002 2003 2004 2005 2006 2007 2008 2009 2010 2011 2012 2013 2014

Taiwan’s real estate situation (Residential Market)
Occupancy rate of hotels in Taipei City has kept its high level, exceeding 70%.y y g g
The number of guest rooms and occupancy rates of tourist hotels in Taipei City
12,000
76.8% 74.8% 75.2% 72.0% 71.1% 75.6% 75.5% 78.0% 73.6% 77.4%Occupancy rates ofInt’l Tourist Hotels
The number of guest rooms and occupancy rates of tourist hotels in Taipei City
1,2631,263 1,263 1 383 1 357
1,9742,040 2,040 2,275 2,330
10,000
,
+8.5%+5.0% -0.1% +2.3% +1.4%
, 1,383 1,357
6,000
8,000
客室
数
8,879 8,324 8,013 7,786 7,738 7,898 8,323 8,313 8,313 8,403
2,000
4,000
客
0
,
2005 2006 2007 2008 2009 2010 2011 2012 2013 2014
国際観光ホ 般観光ホ
Copyright(C) Nomura Research Institute, Ltd. All rights reserved. 216
国際観光ホテル 一般観光ホテルNote: Tourist hotels are hotels that meet the criteria set by the Tourism Bureau of the Ministry of Transportation and
Communications, and are broken down into international tourist hotels and general tourist hotels according to their levels. There are 25 international tourist hotels in Taipei as of the end of December 2011. Source: NRI based on statistics by the Tourism Bureau of
the MOTC,R.O.C.(Taiwan)
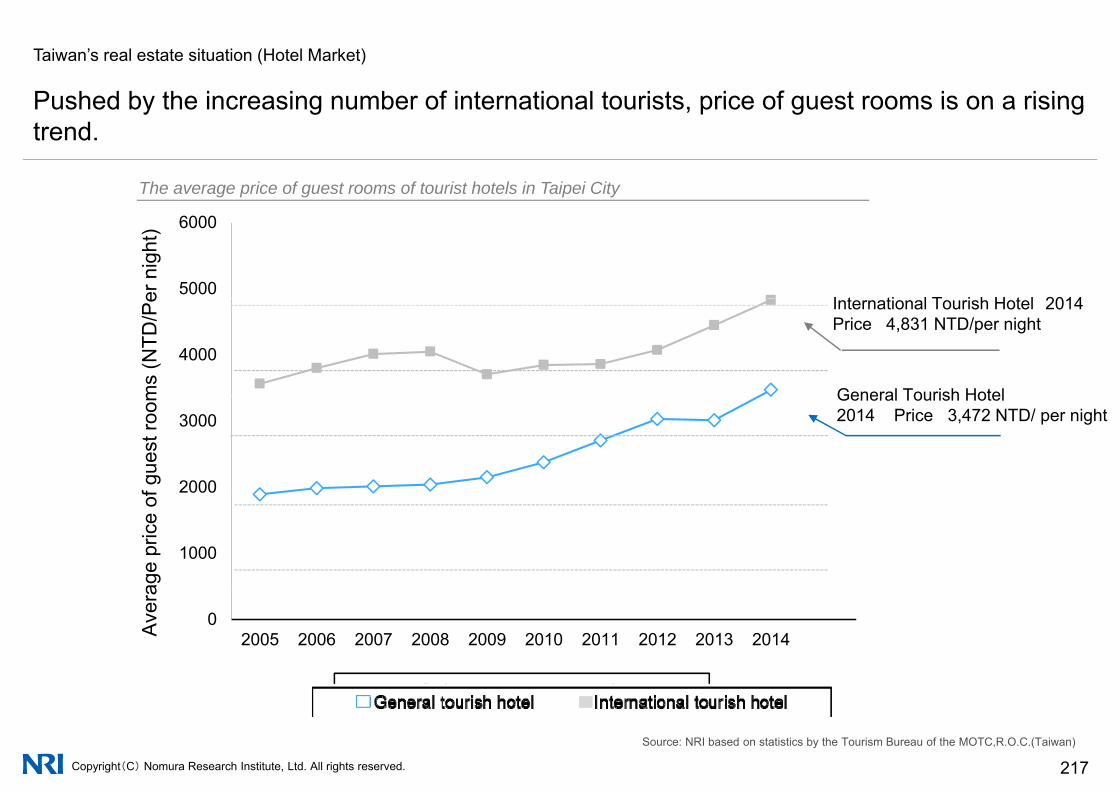
Taiwan’s real estate situation (Hotel Market)
Pushed by the increasing number of international tourists price of guest rooms is on a risingPushed by the increasing number of international tourists, price of guest rooms is on a rising trend.
The average price of guest rooms of tourist hotels in Taipei City
5000
6000
I t ti l T i h H t l 2014er n
ight
)
4000
International Tourish Hotel 2014 Price 4,831 NTD/per night
) General Tourish Hotelms
(NTD
/Pe
2000
3000
価格
(元/泊
General Tourish Hotel2014 Price 3,472 NTD/ per night
f gue
st ro
om
1000
2000
客室
平均
価ag
e pr
ice
of
02005 2006 2007 2008 2009 2010 2011 2012 2013 2014
觀光ホテル 般ホテル
Ave
ra
Copyright(C) Nomura Research Institute, Ltd. All rights reserved. 217
觀光ホテル 一般ホテル国際観光ホテル 一般観光ホテル
Source: NRI based on statistics by the Tourism Bureau of the MOTC,R.O.C.(Taiwan)
Japan Japanese Real Estate Investment Market
China China’s market entering an adjustment period
Korea Increase of liquidity within slow economic growthq y g
Taiwan Overview of Office, Residential and Hotel Markets
Singapore Domestic real estate market reaching its peak
India Real Estate Market in India – Residential, Office, etc.
Copyright(C) Nomura Research Institute, Ltd. All rights reserved. 218
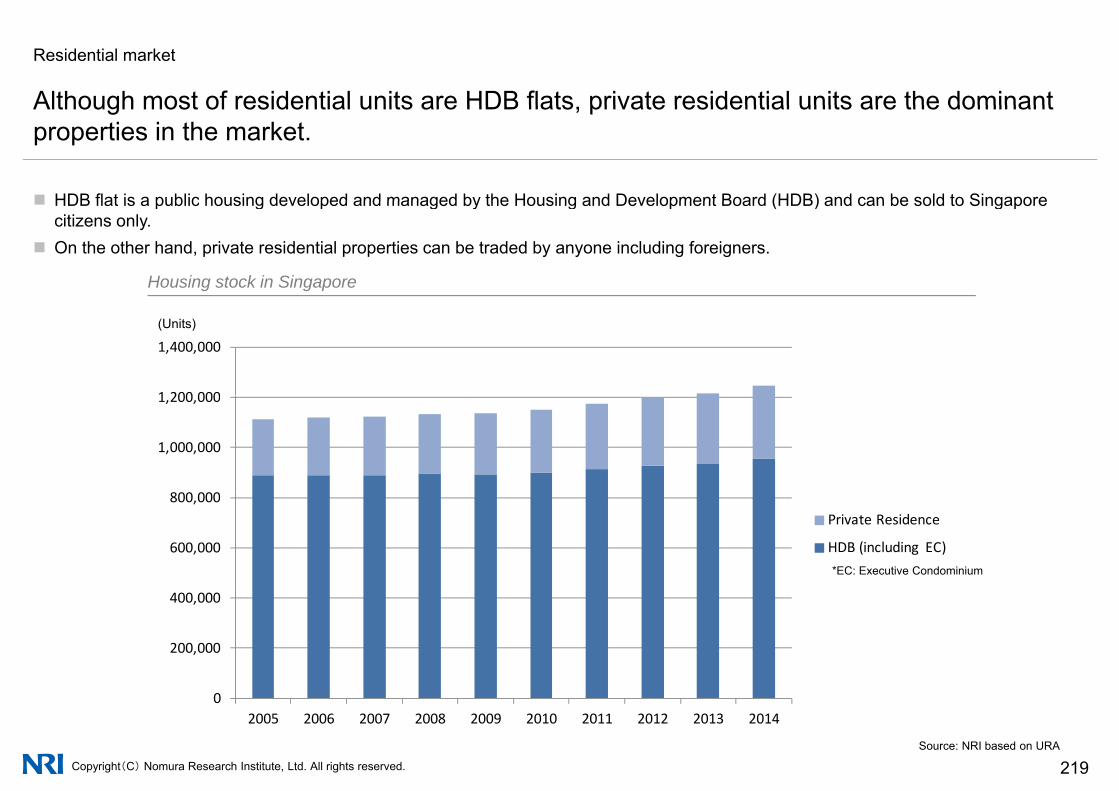
Residential market
Although most of residential units are HDB flats private residential units are the dominant
HDB flat is a public housing developed and managed by the Housing and Development Board (HDB) and can be sold to Singapore
Although most of residential units are HDB flats, private residential units are the dominant properties in the market.
HDB flat is a public housing developed and managed by the Housing and Development Board (HDB) and can be sold to Singapore citizens only.
On the other hand, private residential properties can be traded by anyone including foreigners.
Housing stock in Singapore
(Units)
1 200 000
1,400,000
800 000
1,000,000
1,200,000
600,000
800,000Private Residence
HDB (including EC)*EC: Executive Condominium
200,000
400,000
Copyright(C) Nomura Research Institute, Ltd. All rights reserved. 219Source: NRI based on URA
02005 2006 2007 2008 2009 2010 2011 2012 2013 2014
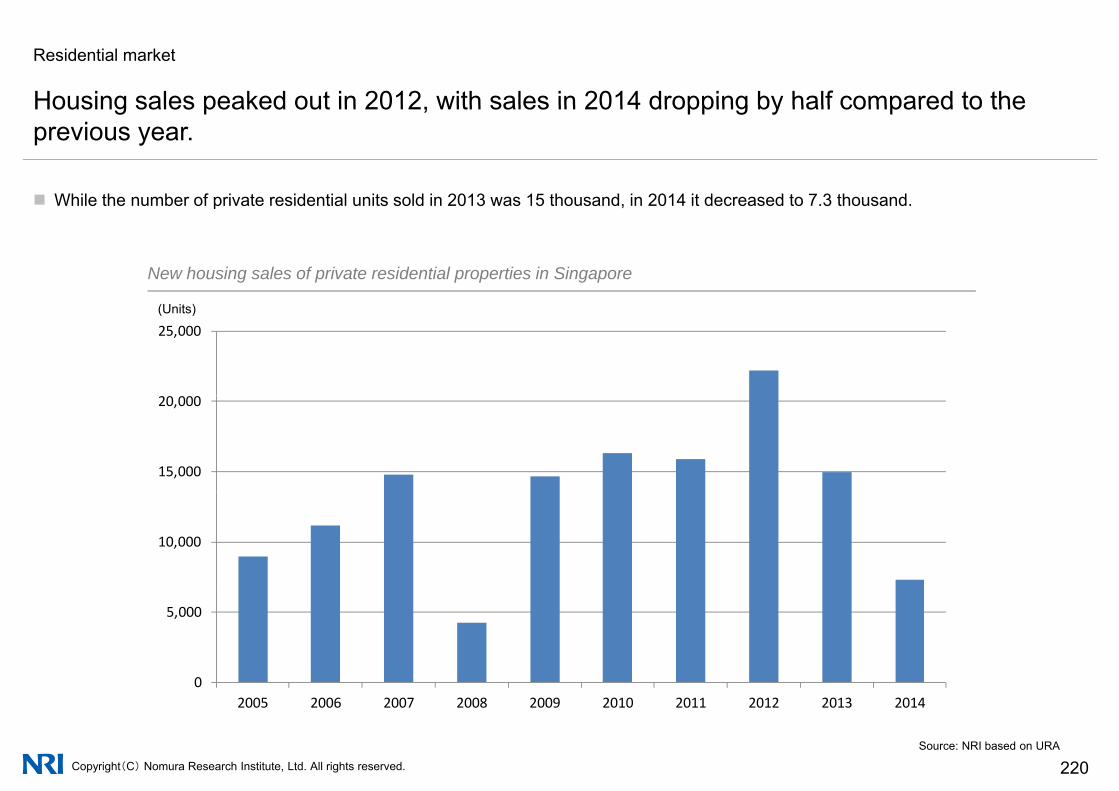
Residential market
Housing sales peaked out in 2012 with sales in 2014 dropping by half compared to the
While the number of private residential units sold in 2013 was 15 thousand in 2014 it decreased to 7 3 thousand
Housing sales peaked out in 2012, with sales in 2014 dropping by half compared to the previous year.
While the number of private residential units sold in 2013 was 15 thousand, in 2014 it decreased to 7.3 thousand.
New housing sales of private residential properties in Singapore
(Units)
25,000
15,000
20,000
10,000
0
5,000
Copyright(C) Nomura Research Institute, Ltd. All rights reserved. 220Source: NRI based on URA
02005 2006 2007 2008 2009 2010 2011 2012 2013 2014
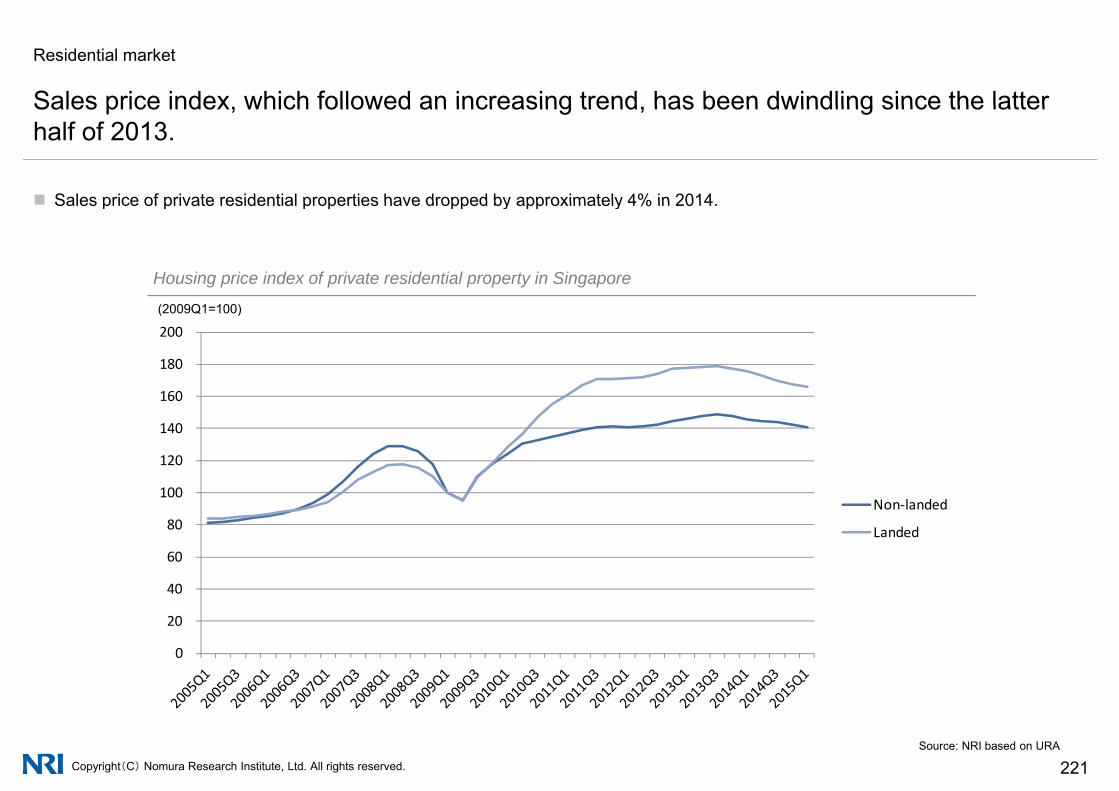
Residential market
Sales price index which followed an increasing trend has been dwindling since the latter
Sales price of private residential properties have dropped by approximately 4% in 2014
Sales price index, which followed an increasing trend, has been dwindling since the latter half of 2013.
Sales price of private residential properties have dropped by approximately 4% in 2014.
Housing price index of private residential property in Singapore
(2009Q1=100)
160
180
200
100
120
140
160
40
60
80
100 Non‐landed
Landed
0
20
40
Copyright(C) Nomura Research Institute, Ltd. All rights reserved. 221Source: NRI based on URA
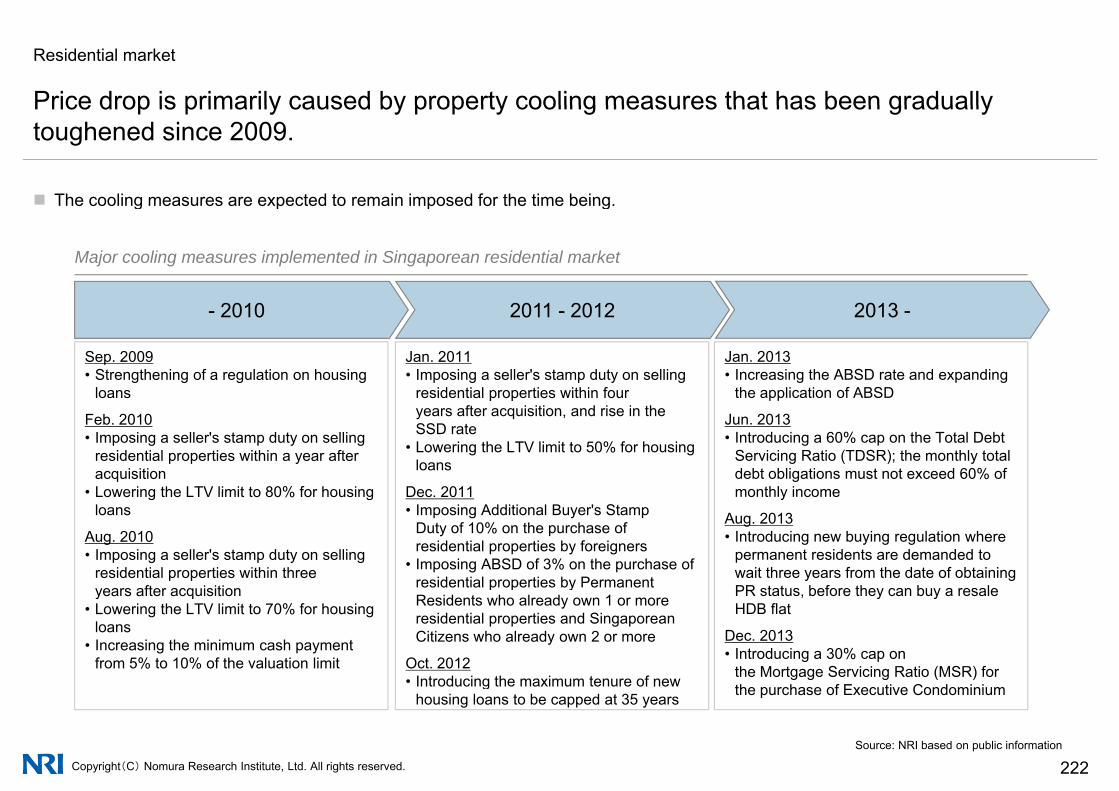
Residential market
Price drop is primarily caused by property cooling measures that has been gradually
The cooling measures are expected to remain imposed for the time being
Price drop is primarily caused by property cooling measures that has been gradually toughened since 2009.
The cooling measures are expected to remain imposed for the time being.
Major cooling measures implemented in Singaporean residential market
2013 -- 2010 2011 - 2012
Sep. 2009• Strengthening of a regulation on housing
loans
Jan. 2011• Imposing a seller's stamp duty on selling
residential properties within four
Jan. 2013• Increasing the ABSD rate and expanding
the application of ABSDloans
Feb. 2010• Imposing a seller's stamp duty on selling
residential properties within a year after acquisition
• Lowering the LTV limit to 80% for housing
residential properties within four years after acquisition, and rise in the SSD rate
• Lowering the LTV limit to 50% for housing loans
Dec 2011
the application of ABSD
Jun. 2013• Introducing a 60% cap on the Total Debt
Servicing Ratio (TDSR); the monthly total debt obligations must not exceed 60% of monthly income• Lowering the LTV limit to 80% for housing
loans
Aug. 2010• Imposing a seller's stamp duty on selling
residential properties within three years after acquisition
Dec. 2011• Imposing Additional Buyer's Stamp
Duty of 10% on the purchase of residential properties by foreigners
• Imposing ABSD of 3% on the purchase of residential properties by Permanent
monthly income
Aug. 2013• Introducing new buying regulation where
permanent residents are demanded to wait three years from the date of obtaining PR status before they can buy a resaleyears after acquisition
• Lowering the LTV limit to 70% for housing loans
• Increasing the minimum cash payment from 5% to 10% of the valuation limit
p p yResidents who already own 1 or more residential properties and Singaporean Citizens who already own 2 or more
Oct. 2012• Introducing the maximum tenure of new
PR status, before they can buy a resale HDB flat
Dec. 2013• Introducing a 30% cap on
the Mortgage Servicing Ratio (MSR) for th h f E ti C d i i
Copyright(C) Nomura Research Institute, Ltd. All rights reserved. 222Source: NRI based on public information
Introducing the maximum tenure of new housing loans to be capped at 35 years the purchase of Executive Condominium

Residential market
Vacancy rate of non-landed private homes turned upward while rent level started to decline
Although vacancy rate of non-landed private homes dropped in the latest quarter it is still on an upward trend
Vacancy rate of non landed private homes turned upward, while rent level started to decline in the latter half of 2013.
Although vacancy rate of non-landed private homes dropped in the latest quarter, it is still on an upward trend. Rent level continues to decrease with approximately 2.6% drop in 2014.
Rental index and vacancy rate of non-landed private homes in Singapore
(2009Q1=100) (%)
12
14
120
140
8
10
80
100
4
6
40
60 賃料(左軸)
空室率(右軸)
Rental Index (LHS)
Vacancy Rate (RHS)
0
2
0
20
Copyright(C) Nomura Research Institute, Ltd. All rights reserved. 223Source: NRI based on URA

Residential market
Number of foreign workers who would otherwise have been tenants is shrinking due to
It is clear that the number of tenants with capabilities to pay higher rent are running short since the number of foreigners on
Number of foreign workers, who would otherwise have been tenants, is shrinking due to the tightening foreign worker policies.
It is clear that the number of tenants with capabilities to pay higher rent are running short, since the number of foreigners onEmployment Passes (EP) who are subject to higher salary criteria has hardly increased.
Change of work visa holders in Singapore
(Thousand people)
140
160
80
100
120
Work Permit
40
60
Work Permit
S Pass
Employment Pass
‐20
0
20
Copyright(C) Nomura Research Institute, Ltd. All rights reserved. 224Source: NRI based on URA
202005 2006 2007 2008 2009 2010 2011 2012 2013 2014
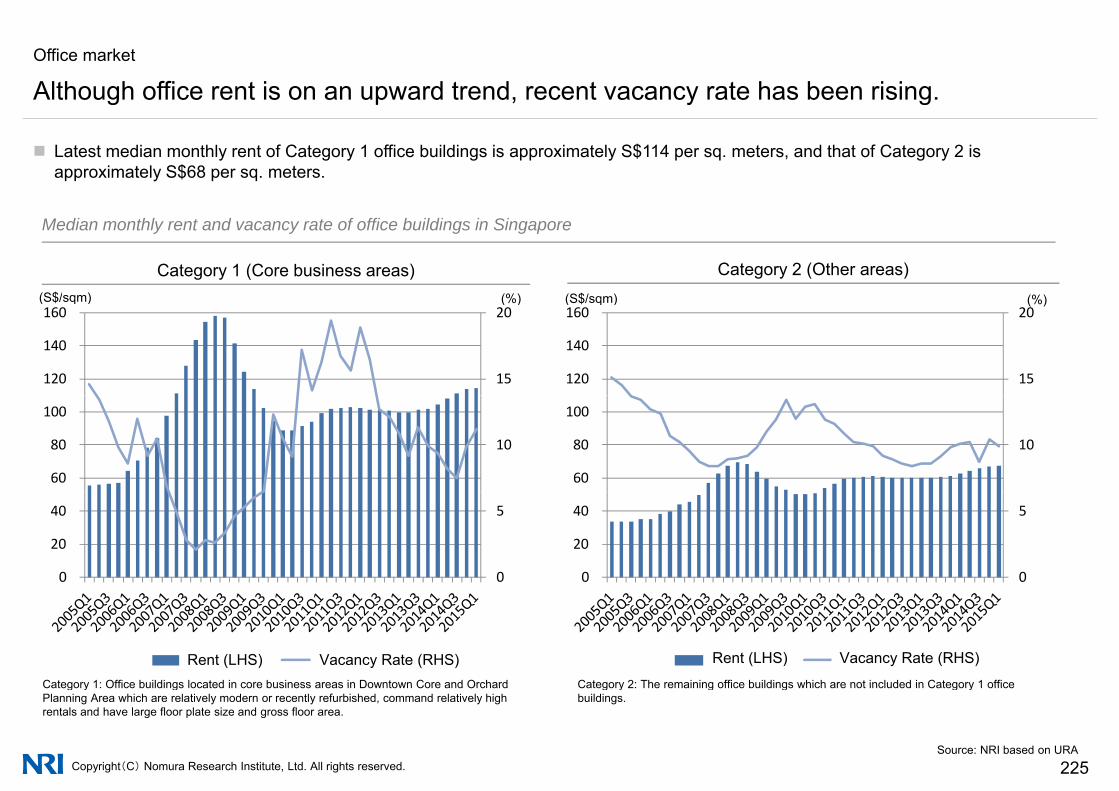
Office market
Although office rent is on an upward trend, recent vacancy rate has been rising.
Latest median monthly rent of Category 1 office buildings is approximately S$114 per sq. meters, and that of Category 2 is approximately S$68 per sq. meters.
g y g
Median monthly rent and vacancy rate of office buildings in Singapore
Category 1 (Core business areas) Category 2 (Other areas)(S$/sqm) (%) (S$/sqm) (%)(S$/sqm) (%) (S$/sqm) (%)
15
20
120
140
160
15
20
120
140
160
10
60
80
100
10
60
80
100
0
5
0
20
40
0
5
0
20
40
Category 1: Office buildings located in core business areas in Downtown Core and Orchard Category 2: The remaining office buildings which are not included in Category 1 office
賃料(左軸) 空室率(右軸) 賃料(左軸) 空室率(右軸)Rent (LHS) Vacancy Rate (RHS) Rent (LHS) Vacancy Rate (RHS)
Copyright(C) Nomura Research Institute, Ltd. All rights reserved. 225
Category 1: Office buildings located in core business areas in Downtown Core and Orchard Planning Area which are relatively modern or recently refurbished, command relatively high rentals and have large floor plate size and gross floor area.
Category 2: The remaining office buildings which are not included in Category 1 office buildings.
Source: NRI based on URA
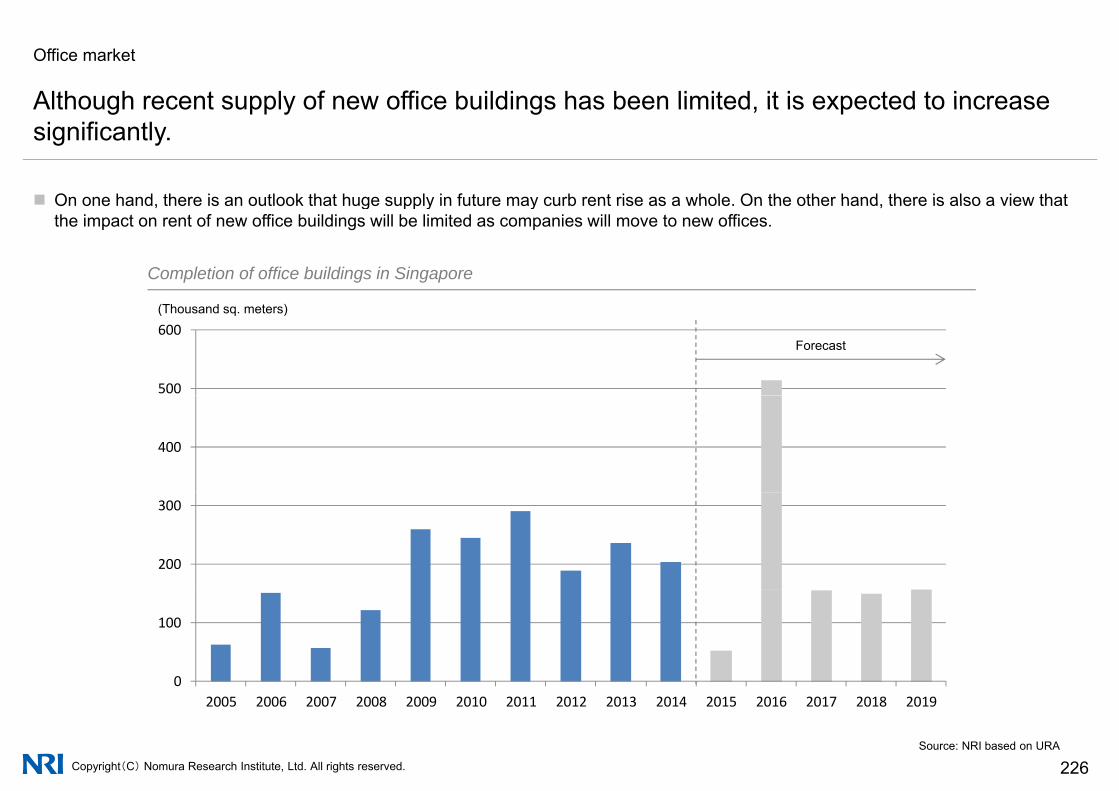
Office market
Although recent supply of new office buildings has been limited it is expected to increase
On one hand there is an outlook that huge supply in future may curb rent rise as a whole On the other hand there is also a view that
Although recent supply of new office buildings has been limited, it is expected to increase significantly.
On one hand, there is an outlook that huge supply in future may curb rent rise as a whole. On the other hand, there is also a view that the impact on rent of new office buildings will be limited as companies will move to new offices.
Completion of office buildings in Singapore
500
600(Thousand sq. meters)
Forecast
400
200
300
0
100
Copyright(C) Nomura Research Institute, Ltd. All rights reserved. 226
02005 2006 2007 2008 2009 2010 2011 2012 2013 2014 2015 2016 2017 2018 2019
2014年まではNet、2014年まではGross、2015年以降は2015年第1四半期時点での竣工時期の見込み
Source: NRI based on URA

Office market
Sales price of office buildings has been on an upward trend for more than five consecutive
Latest median sales price of office space in Central Area is approximately S$13 300 per sq meters and that of Fringe Area is
Sales price of office buildings has been on an upward trend for more than five consecutive years.
Latest median sales price of office space in Central Area is approximately S$13,300 per sq. meters, and that of Fringe Area is approximately S$9,300 per sq. meters.
Median sales price of office buildings in Singapore
(S$/sqm)(S$/sqm)
12,000
14,000
8,000
10,000
Central Area
2 000
4,000
6,000 Central Area
Fringe Area
0
2,000
Copyright(C) Nomura Research Institute, Ltd. All rights reserved. 227
Central Area: Outram, Museum, Newton, River Valley, Singapore River, Marina South, Marina East, Straits View, Rochor, Orchard and Downtown Core.Fringe Area: Bukit Merah, Bukit Timah, Queenstown, Kallang, Bishan, Marine Parade, Geylang, Toa Payoh, Tanglin, Novena and Southern Islands.
Source: NRI based on URA
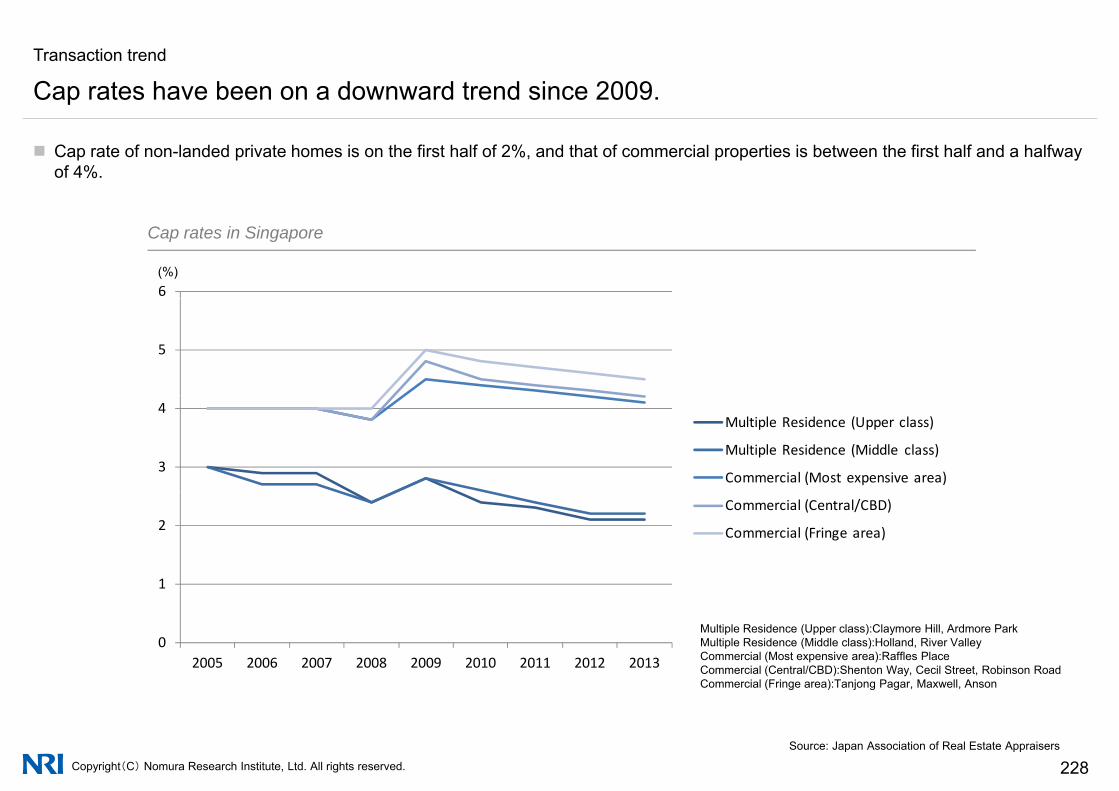
Transaction trend
Cap rates have been on a downward trend since 2009.
Cap rate of non-landed private homes is on the first half of 2%, and that of commercial properties is between the first half and a halfway of 4%.
Cap rates in Singapore
(%)6
5
3
4Multiple Residence (Upper class)
Multiple Residence (Middle class)
Commercial (Most expensive area)
1
2Commercial (Central/CBD)
Commercial (Fringe area)
Multiple Residence (Upper class):Claymore Hill, Ardmore ParkMultiple Residence (Middle class):Holland, River ValleyCommercial (Most expensive area):Raffles PlaceCommercial (Central/CBD):Shenton Way, Cecil Street, Robinson RoadCommercial (Fringe area):Tanjong Pagar Maxwell Anson
02005 2006 2007 2008 2009 2010 2011 2012 2013
Copyright(C) Nomura Research Institute, Ltd. All rights reserved. 228
Commercial (Fringe area):Tanjong Pagar, Maxwell, Anson
Source: Japan Association of Real Estate Appraisers

Development trend
There are fewer opportunities for new development in Singapore due to shrinking supply of
Singaporean government owns about 80% of country’s land and also controls the supply of development sites
There are fewer opportunities for new development in Singapore due to shrinking supply of new development sites.
Singaporean government owns about 80% of country s land and also controls the supply of development sites. The amount of development sites sold by the government has been on a downward trend since 2011.
Development sites sold by Singaporean government
(sq. m)
350,000
400,000
200 000
250,000
300,000
Others
Industrial
100,000
150,000
200,000 Hotel
Mixed
Commercial/Office
Residential (Non‐Landed)
*The figure of 1H2015 is based the Confirmed
0
50,000
Residential (Non Landed)
Copyright(C) Nomura Research Institute, Ltd. All rights reserved. 229
gList of Government Land Sales Program.
Source: NRI based on URA

Development trend
Singaporean developers are accelerating their overseas business due to a slowdown of and
They are expanding their business in ASEAN India China USA and UK
Singaporean developers are accelerating their overseas business due to a slowdown of and fewer development opportunities in domestic market.
They are expanding their business in ASEAN, India, China, USA and UK.
Major development plans in overseas by dominant Singaporean developers in recent years
Capitaland
Developing mix-used and retail properties in China Vietnam Indonesia Malaysia and
Keppel
Developing office and mix-used properties in I d i M Vi t dChina, Vietnam, Indonesia, Malaysia, and
India Developing Serviced apartments in China,
Korea, Vietnam, Philippines, Laos, Turkey, and France etc.
Indonesia, Myanmar, Vietnam, and Philippines
Developing residential and retail properties in US
UOL CDL
Developing properties in China and Malaysia Acquired sites, developing Hotel and mixed-
used properties in UK
Developing properties in US, UK, Japan, China, and Australia
Developing hotels in Japan
Copyright(C) Nomura Research Institute, Ltd. All rights reserved. 230Source: NRI based on public information
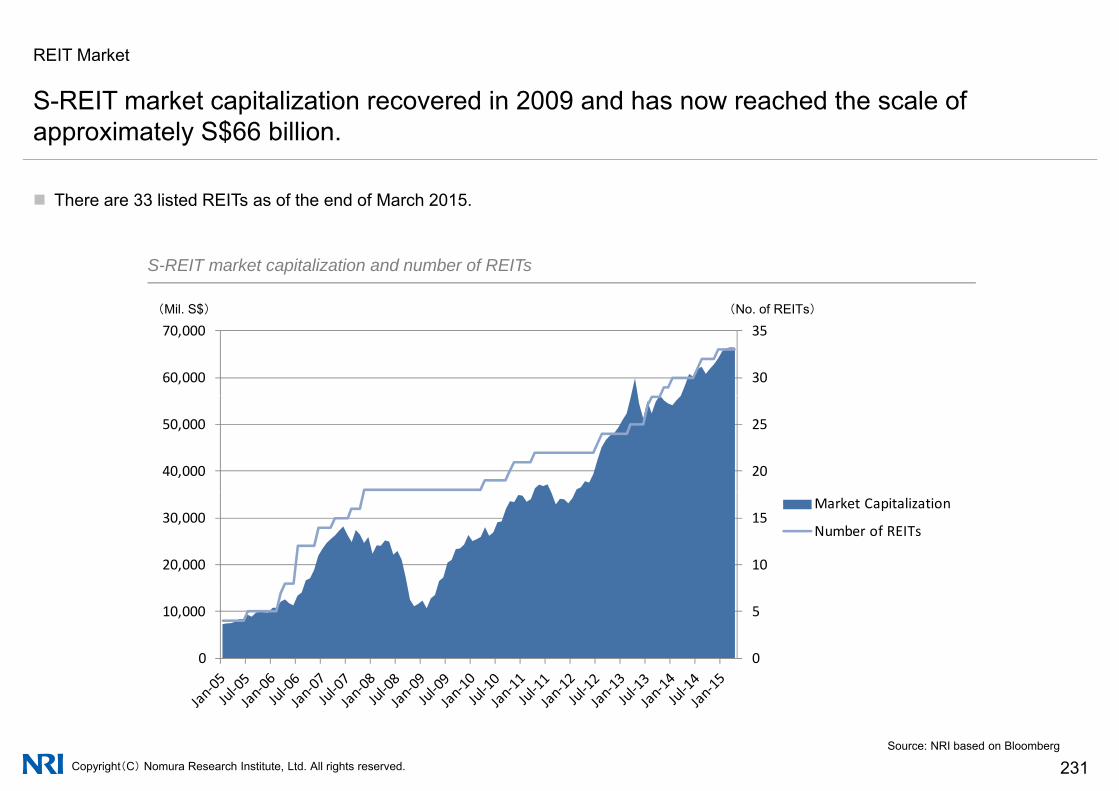
REIT Market
S-REIT market capitalization recovered in 2009 and has now reached the scale of
There are 33 listed REITs as of the end of March 2015
S REIT market capitalization recovered in 2009 and has now reached the scale of approximately S$66 billion.
There are 33 listed REITs as of the end of March 2015.
S-REIT market capitalization and number of REITs
(Mil. S$) (No. of REITs)
30
35
60,000
70,000
20
25
40,000
50,000
10
15
20,000
30,000Market Capitalization
Number of REITs
0
5
0
10,000
Copyright(C) Nomura Research Institute, Ltd. All rights reserved. 231Source: NRI based on Bloomberg
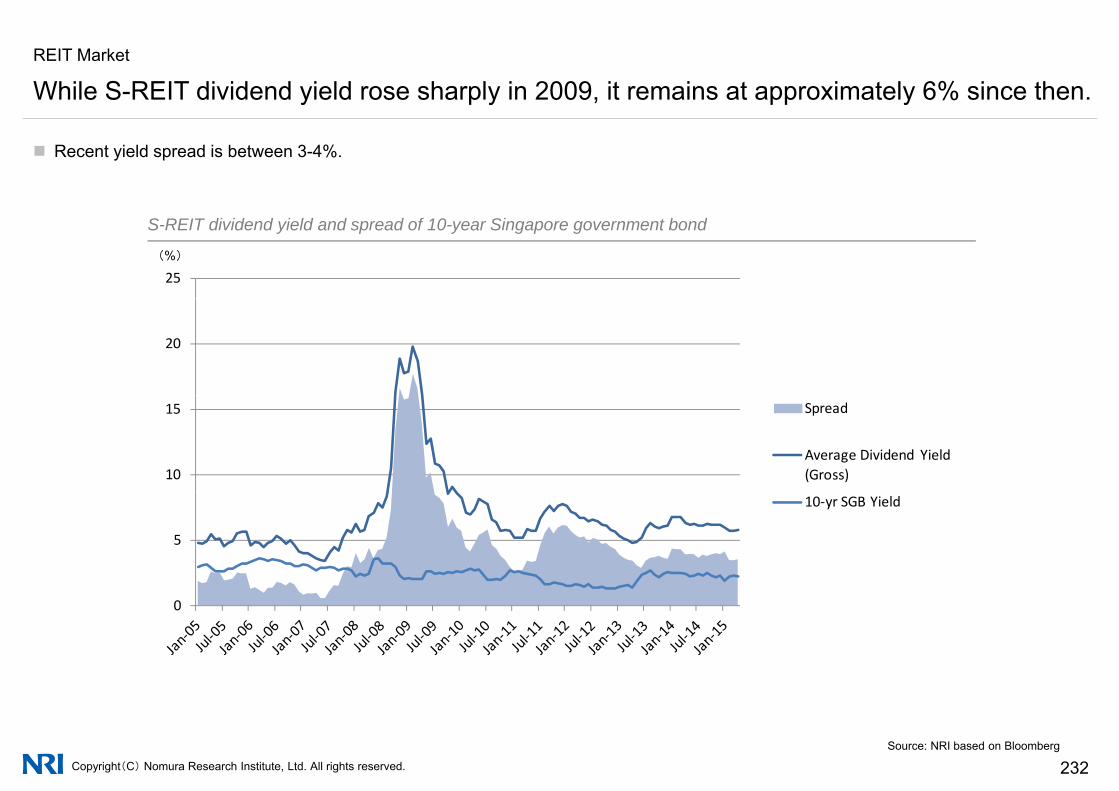
REIT Market
While S-REIT dividend yield rose sharply in 2009, it remains at approximately 6% since then.
Recent yield spread is between 3-4%.
y y y
S-REIT dividend yield and spread of 10-year Singapore government bond
(%)
25
20
10
15 Spread
Average Dividend Yield(Gross)
5
10‐yr SGB Yield
0
Copyright(C) Nomura Research Institute, Ltd. All rights reserved. 232Source: NRI based on Bloomberg

Japan Japanese Real Estate Investment Market
China China’s market entering an adjustment period
Korea Increase of liquidity within slow economic growthq y g
Taiwan Overview of Office, Residential and Hotel Markets
Singapore Domestic real estate market reaching its peak
India Real Estate Market in India – Residential, Office, etc.
Copyright(C) Nomura Research Institute, Ltd. All rights reserved. 233
I di R l E t t M k t i I di R id ti l Offi t
1 India’s Macro-economic Indicators
India Real Estate Market in India – Residential, Office, etc.
2 Real-estate Market Overview
3 Key Segments3 Key Segments
Copyright(C) Nomura Research Institute, Ltd. All rights reserved. 234

Macro-Economic Factor – Population Growth
India has one of the largest and rapidly growing population making it an attractive
World Population Trends Population growth forecast
India has one of the largest and rapidly growing population, making it an attractive consumer market.
China19%
India USAR t
1.50
2.00
%)2014 India
18% 4%
Indonesia4%
Brazil3%
Rest52%
0.50
1.00
grow
th ra
te (
%2014
World Population (2013) : 7238 mn
-0.50
—
Popu
latio
n g
India17%
-1.002000 2010 2020 2030 2040 2050
Time (years)
China14%
Nigeria4%
Rest57%
2050P
India China Russia BrazilKorea Japan USA UK
4%USA4%
Indonesia4%
World Population by 2050 : 9683 mn
Copyright(C) Nomura Research Institute, Ltd. All rights reserved. 235
As India’s population grows, the demand for infrastructure will grow further
Source: Population Reference Bureau, 2014 Datasheet USA
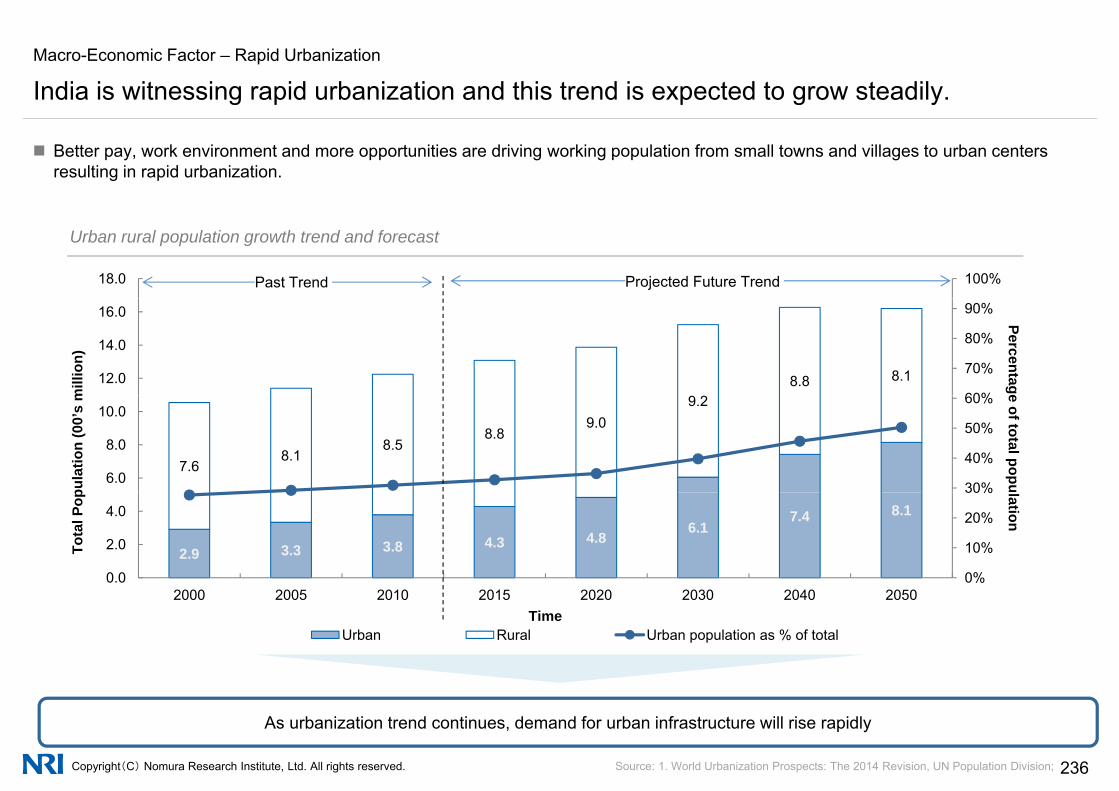
Macro-Economic Factor – Rapid Urbanization
India is witnessing rapid urbanization and this trend is expected to grow steadily.
Better pay, work environment and more opportunities are driving working population from small towns and villages to urban centers resulting in rapid urbanization.
g g y
Urban rural population growth trend and forecast
100%18.0 Past Trend Projected Future Trend
8.8 8.160%
70%
80%
90%
12.0
14.0
16.0 Percentagemill
ion)
7.68.1
8.58.8
9.09.2
30%
40%
50%
60%
6.0
8.0
10.0
e of total popu
pula
tion
(00’
s m
2.9 3.3 3.8 4.3 4.86.1
7.4 8.1
0%
10%
20%
30%
0.0
2.0
4.0
lation
Tota
l Pop
2000 2005 2010 2015 2020 2030 2040 2050Time
Urban Rural Urban population as % of total
Copyright(C) Nomura Research Institute, Ltd. All rights reserved. 236
As urbanization trend continues, demand for urban infrastructure will rise rapidly
Source: 1. World Urbanization Prospects: The 2014 Revision, UN Population Division;

Macro-Economic Factor – Rapid Urbanization
Rapid urbanization has happened across 7 major cities of India all of them having 4 million
India’s Top Urban Centres
Rapid urbanization has happened across 7 major cities of India, all of them having 4 million plus population.
City State Area Population AHI
Mumbai Maharashtra 1176 km2 12.47 mn INR 334,812
2 New Delhi Delhi 1483 km2 11.00 mn INR 360,893
Ch i T il N d 1189 k 2 8 42 INR 324 844
6
7
Chennai Tamil Nadu 1189 km2 8.42 mn INR 324,844
Hyderabad Andhra Pradesh 650 km2 6.80 mn INR 180,406
1
4
Bengaluru Karnataka 741 km2 5.57 mn INR 269,537
Ahmedabad Gujarat 464 km2 4.68 mn INR 192,1631 Mumbai
35
Kolkata West Bengal 1026 km2 4.48 mn INR 185,840
2
3
4
5
New Delhi
Chennai
Hyderabad
BengaluruT 7 b t lit b l ti d h h ld i
Copyright(C) Nomura Research Institute, Ltd. All rights reserved. 237
6
7
Ahmedabad
Kolkata
Top 7 by metropolitan area, urban agglomeration and household incomeAHI-Average Household Income per annumArea refers to City Metropolitan Area“INR”: Indian rupees, “mn” : million
Source: CMIE April 2015 Survey Data, Census of India 2011

Macro-Economic Factor – Age Demographics
Low median age and increasing working-age population are reducing dependability and
57% of India’s 1.2 billion population is below the age of 30 years in 2012 making it one of the youngest countries in the world.
A d i
Low median age and increasing working age population are reducing dependability and providing more hands to drive the economy.
Age structure dynamics
100
45
50 Most favorable period for development
60
80
25
30
35
40
Percenears
)
20
40
10
15
20
25 tage of populaA
ge (i
n ye
00
5
2000 2005 2010 2015 2020 2040 2060 2080 2100
ation
Time
Median age (years) Dependability ratio (%) Working age population (%)
Decreasing dependability is likely to further increase infrastructure demand specially housing
Copyright(C) Nomura Research Institute, Ltd. All rights reserved. 238Source: 1. World Urbanization Prospects, the 2011 Revision, UN Population Division; 2. U.S. Census Bureau
Note: Working age population refers to percentage of population between 20-65 years Dependability ratio is calculated as non-working population by working population
Decreasing dependability is likely to further increase infrastructure demand, specially housing

Macro-Economic Factor – Income levels
India’s per capita GDP and household savings are increasing indicating improvement in
GDP per capita at current prices Average Household Savings per annum
India s per capita GDP and household savings are increasing, indicating improvement in economic condition of society.
2000
2500
100
120
1500
2000
80
hous
ands
)
1000
US$
40
60
INR
(In
Th
0
500
2005 2006 2007 2008 2009 2010 2011 2012 2013 2014 20190
20
2011201220132014 2011201220132014 20112012201320142005 2006 2007 2008 2009 2010 2011 2012 2013 2014 2019
Time (years)
2011201220132014 2011201220132014 2011201220132014
Urban Rural Overall
Copyright(C) Nomura Research Institute, Ltd. All rights reserved. 239Source: IMF World Economic Outlook Oct’14
Improving economic condition of society will increase demand of better quality infrastructure specially housing
Source: CMIE Consumer Pyramid Retrieved 9th April, 2015
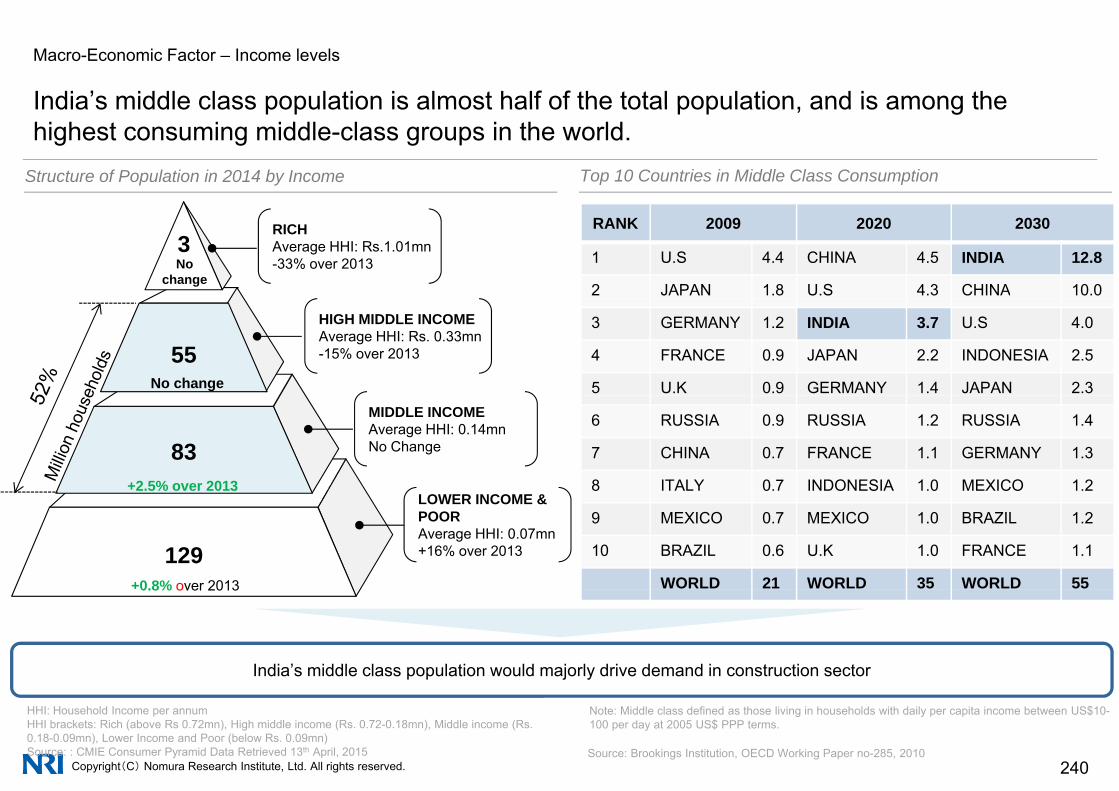
Macro-Economic Factor – Income levels
India’s middle class population is almost half of the total population and is among the
Structure of Population in 2014 by Income Top 10 Countries in Middle Class Consumption
India s middle class population is almost half of the total population, and is among the highest consuming middle-class groups in the world.
3RICHAverage HHI: Rs.1.01mn-33% over 2013
RANK 2009 2020 2030
1 U.S 4.4 CHINA 4.5 INDIA 12.8
2 JAPAN 1.8 U.S 4.3 CHINA 10.0
No change
55HIGH MIDDLE INCOMEAverage HHI: Rs. 0.33mn-15% over 2013
3 GERMANY 1.2 INDIA 3.7 U.S 4.0
4 FRANCE 0.9 JAPAN 2.2 INDONESIA 2.5
5 U.K 0.9 GERMANY 1.4 JAPAN 2.3No change
83
MIDDLE INCOMEAverage HHI: 0.14mnNo Change
6 RUSSIA 0.9 RUSSIA 1.2 RUSSIA 1.4
7 CHINA 0.7 FRANCE 1.1 GERMANY 1.3
8 ITALY 0.7 INDONESIA 1.0 MEXICO 1.2+2.5% over 2013
129
LOWER INCOME &POORAverage HHI: 0.07mn+16% over 2013
9 MEXICO 0.7 MEXICO 1.0 BRAZIL 1.2
10 BRAZIL 0.6 U.K 1.0 FRANCE 1.1
WORLD 21 WORLD 35 WORLD 55+0.8% over 20130.8% over 2013
India’s middle class population would majorly drive demand in construction sector
Copyright(C) Nomura Research Institute, Ltd. All rights reserved. 240
Note: Middle class defined as those living in households with daily per capita income between US$10-100 per day at 2005 US$ PPP terms.
HHI: Household Income per annumHHI brackets: Rich (above Rs 0.72mn), High middle income (Rs. 0.72-0.18mn), Middle income (Rs. 0.18-0.09mn), Lower Income and Poor (below Rs. 0.09mn)Source: : CMIE Consumer Pyramid Data Retrieved 13th April, 2015 Source: Brookings Institution, OECD Working Paper no-285, 2010

I di R l E t t M k t i I di R id ti l Offi t
1 India’s Macro-economic Indicators
India Real Estate Market in India – Residential, Office, etc.
2 Real-estate Market Overview
3 Key Segments3 Key Segments
Copyright(C) Nomura Research Institute, Ltd. All rights reserved. 241
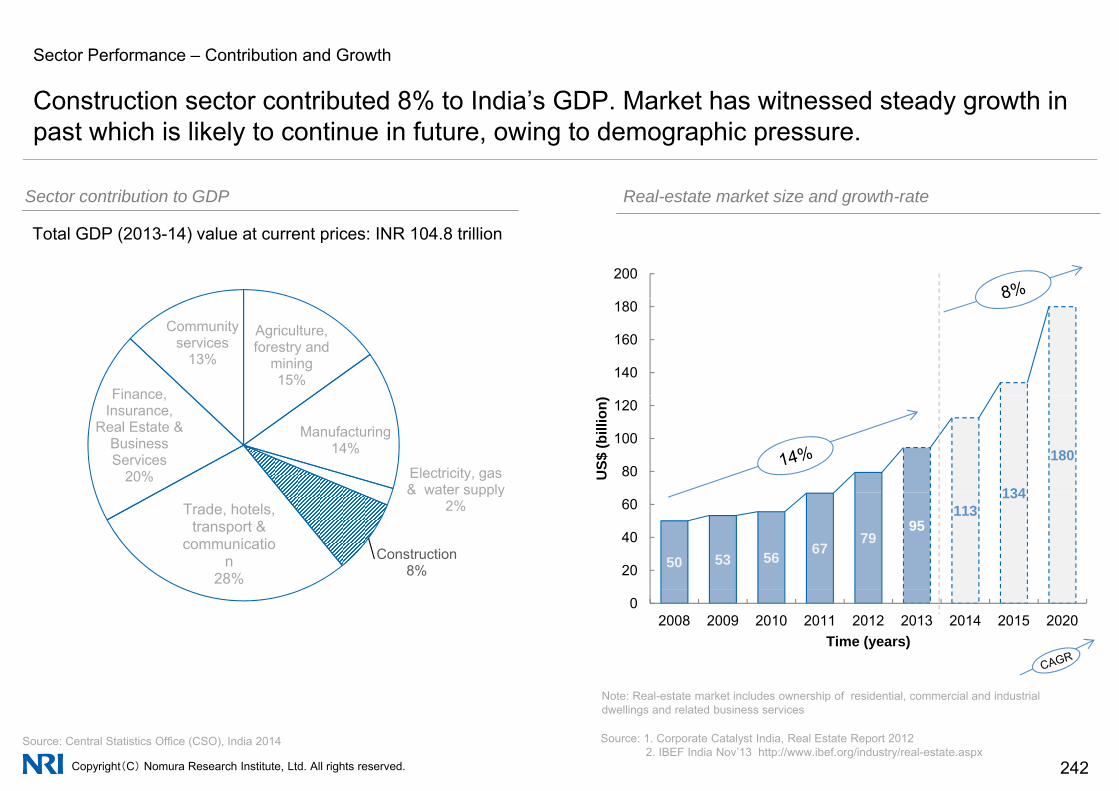
Sector Performance – Contribution and Growth
Construction sector contributed 8% to India’s GDP Market has witnessed steady growth in
Sector contribution to GDP Real-estate market size and growth-rate
Construction sector contributed 8% to India s GDP. Market has witnessed steady growth in past which is likely to continue in future, owing to demographic pressure.
Sector contribution to GDP Real estate market size and growth rate
200
Total GDP (2013-14) value at current prices: INR 104.8 trillion
Agriculture, forestry and
mining15%
Finance
Community services
13%140
160
180
Manufacturing14%
Electricity, gas & water supply
Finance, Insurance,
Real Estate & Business Services
20%134
18080
100
120
US$
(bill
ion)
& water supply2%
Construction8%
Trade, hotels, transport &
communication
28%50 53 56 67
7995
113134
20
40
60
02008 2009 2010 2011 2012 2013 2014 2015 2020
Time (years)
Copyright(C) Nomura Research Institute, Ltd. All rights reserved. 242Source: Central Statistics Office (CSO), India 2014 Source: 1. Corporate Catalyst India, Real Estate Report 2012
2. IBEF India Nov’13 http://www.ibef.org/industry/real-estate.aspx
Note: Real-estate market includes ownership of residential, commercial and industrial dwellings and related business services

Sector Performance – Major Players Performance
While most players have grown in size in FY13-14 maintaining profitability has been an
Performance of Top 15 Real-estate Developers in India by market capitalization
While most players have grown in size in FY13 14, maintaining profitability has been an area of concern for majority of country’s leading developers for second consecutive year.
Developer nameMarket Net Sales Net Sales Net Profit Net Profit
Cap (BSE) (2013-14) YoY% (2013-14) YoY%DLF Ltd. 2,88,405 23,859 11% 5,268 5%
Prestige Estates Projects Ltd. 1,04,306 20,052 169% 3,400 163%
Oberoi Realty Ltd. 99,949 6,226 5% 2,951 -10%
HDIL 56,000 7,708 -21% 2,449 68%
Godrej Properties Ltd. 54,684 6,640 56% 977 -20%
Sobha Developers Ltd 40 491 21 129 17% 2 065 5%Sobha Developers Ltd. 40,491 21,129 17% 2,065 5%
Indiabulls Real Estate Ltd. 30,577 849 -76% 1,446 -46%
Omaxe Ltd. 24,646 11,847 -12% 603 -30%
Brigade Enterprises Ltd. 17,678 8,952 15% 898 40%
S t k R lt Ltd 17 634 387 21% 1 373 1893%Sunteck Realty Ltd. 17,634 387 21% 1,373 1893%
Kolte Patil 17,542 1,872 3% 464 -29%
DB Realty Ltd. 17,271 452.6 -2% -411 -13807%
Purvankara Projects Ltd. 17,051 9,227 13% 1,060 -6%
Anant Raj Ltd. 12,881 4,384 39% 883 -19%
Parsvnath Developers Ltd. 8,769 4,283 -7% 234 -68%
Copyright(C) Nomura Research Institute, Ltd. All rights reserved. 243Note: Highlighted numbers indicate negative growthSource: BSE Company data fetched 08th Apr 2015 | All figures in INR Million | BSE- Bombay Stock Exchange
Fluctuating financial performance of leading developers explains the volatile state of the Indian real-estate market

Financing Developments – Project Financing Options
Private lending NBFC lending & PE funds have continued to be the primary sources of real-
List of project financing options Financing options by developers preference
Private lending, NBFC lending & PE funds have continued to be the primary sources of realestate financing. Recently REITs and InvITs have been allowed in Indian market.
Private Lending FCCB
QIPAvailable Real-estate financing options in India
• Bank Credit
• NBFC Credit
PE funds
NBFC Lending
g
AIF
• NBFC Credit
• Private Credit
• Public Listing (IPO)
REMF
Bank Lending
IPO• External Commercial Borrowings (ECB)
• Private Equity (PE)
• Foreign Direct Investments (FDI)
REIT
InvITg ( )
• Qualified Institutional Placement (QIP)
• Foreign Currency Convertible Bond (FCCB)
ECB
NBFC: Non-banking Financial Company QIP: Qualified Institutional PlacementFCCB F i b d
Preference (high to low)
• Real-estate Mutual Funds (REMF)
• Alternative Investment Fund (AIF)
• Real-estate Investment Trusts (REIT)
Copyright(C) Nomura Research Institute, Ltd. All rights reserved. 244
PE: Private EquityIPO: Initial Public OfferingECB: External Commercial Borrowing
FCCB: Foreign currency bondsREMF: Real Estate Mutual FundAIF: Alternative Investment FundREIT : Real Estate Investment TrustInvIT: Infrastructure Investment TrustSource: Content sourced from proprietary information of Jones Lang LaSalle India
• Infrastructure Investment Trusts (InvIT)
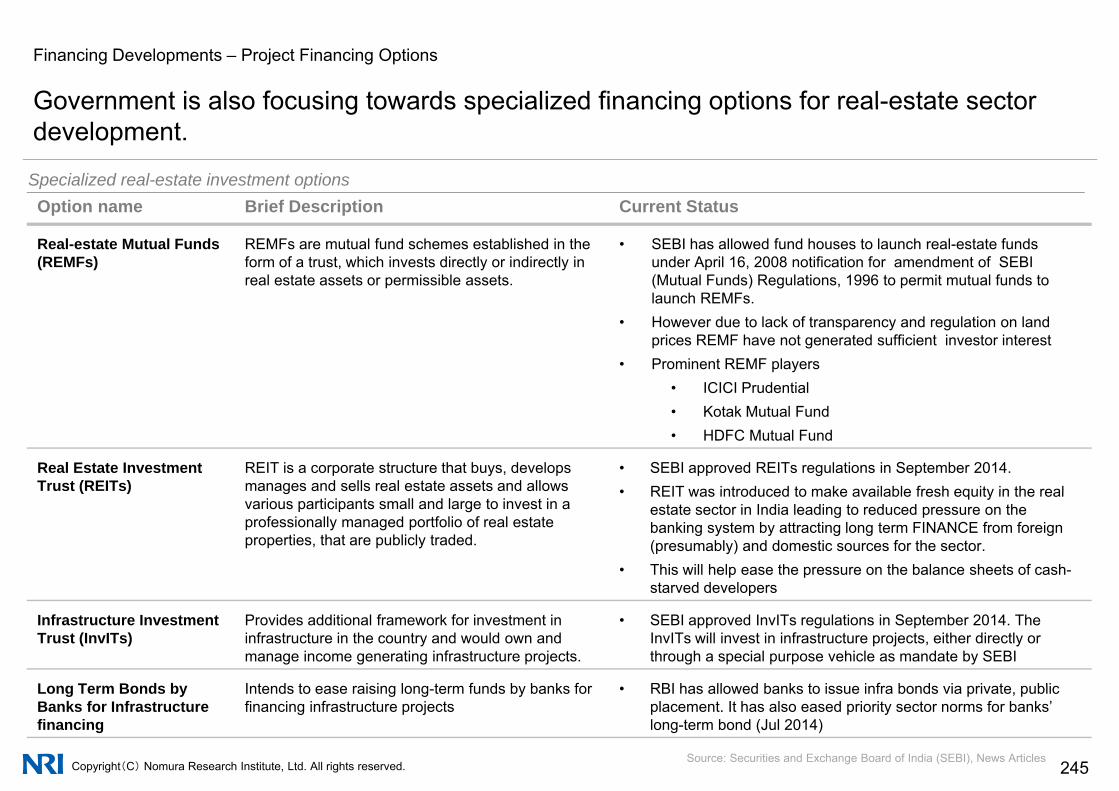
Financing Developments – Project Financing Options
Government is also focusing towards specialized financing options for real-estate sector
O ti B i f D i ti C t St tSpecialized real-estate investment options
Government is also focusing towards specialized financing options for real estate sector development.
Option name Brief Description Current Status
Real-estate Mutual Funds (REMFs)
REMFs are mutual fund schemes established in the form of a trust, which invests directly or indirectly in real estate assets or permissible assets.
• SEBI has allowed fund houses to launch real-estate funds under April 16, 2008 notification for amendment of SEBI (Mutual Funds) Regulations, 1996 to permit mutual funds to launch REMFslaunch REMFs.
• However due to lack of transparency and regulation on land prices REMF have not generated sufficient investor interest
• Prominent REMF players• ICICI Prudential• Kotak Mutual Fund• HDFC Mutual Fund
Real Estate Investment Trust (REITs)
REIT is a corporate structure that buys, develops manages and sells real estate assets and allows
• SEBI approved REITs regulations in September 2014. • REIT was introduced to make available fresh equity in the real( ) g
various participants small and large to invest in a professionally managed portfolio of real estate properties, that are publicly traded.
• REIT was introduced to make available fresh equity in the real estate sector in India leading to reduced pressure on the banking system by attracting long term FINANCE from foreign (presumably) and domestic sources for the sector.
• This will help ease the pressure on the balance sheets of cash-starved developersstarved developers
Infrastructure Investment Trust (InvITs)
Provides additional framework for investment in infrastructure in the country and would own and manage income generating infrastructure projects.
• SEBI approved InvITs regulations in September 2014. The InvITs will invest in infrastructure projects, either directly or through a special purpose vehicle as mandate by SEBI
Long Term Bonds by Intends to ease raising long term funds by banks for RBI has allowed banks to issue infra bonds via private public
Copyright(C) Nomura Research Institute, Ltd. All rights reserved. 245Source: Securities and Exchange Board of India (SEBI), News Articles
Long Term Bonds by Banks for Infrastructure financing
Intends to ease raising long-term funds by banks for financing infrastructure projects
• RBI has allowed banks to issue infra bonds via private, public placement. It has also eased priority sector norms for banks’ long-term bond (Jul 2014)
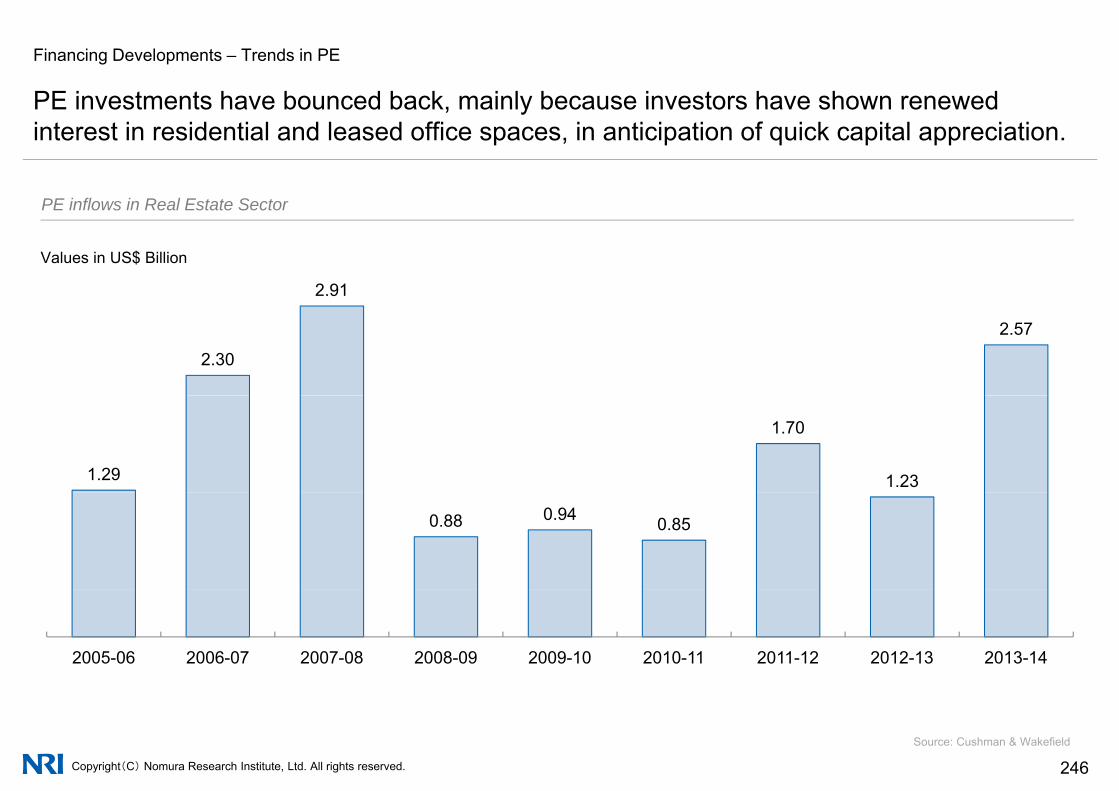
Financing Developments – Trends in PE
PE investments have bounced back mainly because investors have shown renewed
PE inflows in Real Estate Sector
PE investments have bounced back, mainly because investors have shown renewed interest in residential and leased office spaces, in anticipation of quick capital appreciation.
PE inflows in Real Estate Sector
2.91
Values in US$ Billion
2.30
2.57
1.29
1.70
1.23
0.88 0.94 0.85
2005-06 2006-07 2007-08 2008-09 2009-10 2010-11 2011-12 2012-13 2013-14
Copyright(C) Nomura Research Institute, Ltd. All rights reserved. 246Source: Cushman & Wakefield
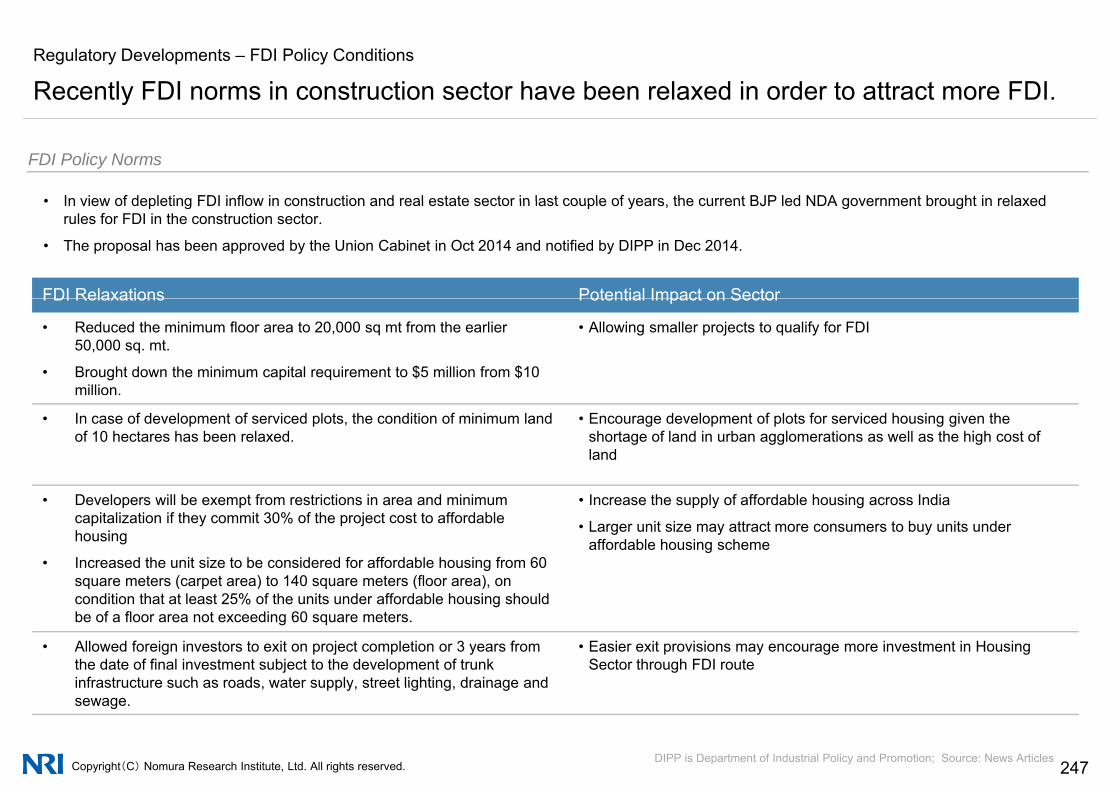
Regulatory Developments – FDI Policy Conditions
Recently FDI norms in construction sector have been relaxed in order to attract more FDI.
FDI Policy Norms
• In view of depleting FDI inflow in construction and real estate sector in last couple of years the current BJP led NDA government brought in relaxed
y
• In view of depleting FDI inflow in construction and real estate sector in last couple of years, the current BJP led NDA government brought in relaxed rules for FDI in the construction sector.
• The proposal has been approved by the Union Cabinet in Oct 2014 and notified by DIPP in Dec 2014.
FDI Relaxations Potential Impact on SectorFDI Relaxations Potential Impact on Sector
• Reduced the minimum floor area to 20,000 sq mt from the earlier 50,000 sq. mt.
• Brought down the minimum capital requirement to $5 million from $10 million.
• Allowing smaller projects to qualify for FDI
• In case of development of serviced plots, the condition of minimum land of 10 hectares has been relaxed.
• Encourage development of plots for serviced housing given the shortage of land in urban agglomerations as well as the high cost of land
• Developers will be exempt from restrictions in area and minimum capitalization if they commit 30% of the project cost to affordable housing
• Increased the unit size to be considered for affordable housing from 60 square meters (carpet area) to 140 square meters (floor area), on
• Increase the supply of affordable housing across India
• Larger unit size may attract more consumers to buy units under affordable housing scheme
condition that at least 25% of the units under affordable housing should be of a floor area not exceeding 60 square meters.
• Allowed foreign investors to exit on project completion or 3 years from the date of final investment subject to the development of trunk infrastructure such as roads water supply street lighting drainage and
• Easier exit provisions may encourage more investment in Housing Sector through FDI route
Copyright(C) Nomura Research Institute, Ltd. All rights reserved. 247
infrastructure such as roads, water supply, street lighting, drainage and sewage.
DIPP is Department of Industrial Policy and Promotion; Source: News Articles
I di R l E t t M k t i I di R id ti l Offi t
1 India’s Macro-economic Indicators
India Real Estate Market in India – Residential, Office, etc.
2 Real-estate Market Overview
3 Key Segments3 Key Segments
Copyright(C) Nomura Research Institute, Ltd. All rights reserved. 248

Residential Space – Average household member-size
Decreasing average household size and increasing total population is leading to household
Households growth rate Urban-rural housing shortage
Decreasing average household size and increasing total population is leading to household shortage in the country.
1200
1400
250
300
n)
34
30.135
40
mill
ion)
Urban Household Growth CAGR (1991-2014) : 3.64% Rural Household Growth CAGR (1991-2014) : 2.08%
169 172 176 180
600
800
1000
150
200
Population (mehol
ds (m
illio
n
15 118.4 19.3 20.5
18.722
26.7 2624.3
2020
25
30
olds
sho
rtag
e (
5681 84 87 91
112
138
200
400
600
50
100
million)
No.
of h
ouse 15.1
5
10
15
No.
of h
ouse
ho
40 56
001991 2001 2011 2012 2013 2014
Time (years)Average household size
02001 2005 2008 2010 2012 2014`
N
Time (years)
U b R l5.5 5.3 4.9 4.8 4.8 4.7
Urban Rural Total Population(members per household)
Urban Rural
Copyright(C) Nomura Research Institute, Ltd. All rights reserved. 249
Source: CMIE Consumer Pyramid Data Retrieved 9th April 2015 Source: 1. Ministry of Housing and Urban Poverty Alleviation2. Planning Commission working group on rural housing
With increasing population and decreasing family size per household, the housing demand is ought to grow

Residential Space – Supply Trends
Supply of new residential units in urban centers has been primarily in the mid-price segment
City-wise Residential launches in Top 7 cities (2009-13) Supply Trend by Price Band in Top 7 cities in 2013
Supply of new residential units in urban centers has been primarily in the mid price segment range with Delhi and Mumbai having the highest inventory.
y p ( ) pp y y p
90%
100% Delhi-NCR
Percentage share per price band
70%
80%
90%
w la
unch
es
Mumbai
Chennai
40%
50%
60%
ge s
hare
of n
ew
Bengaluru
Pune
10%
20%
30%
Perc
enta
g
Hyderabad
Kolkata
0%2009 2010 2011 2012 2013
Time (Yearly)
Delhi-NCR Mumbai Chennai Bengaluru
Kolkata
Affordable Low-mid Upper-mid High-end
Copyright(C) Nomura Research Institute, Ltd. All rights reserved. 250
Delhi NCR Mumbai Chennai BengaluruPune Hyderabad Kolkata
Source: Content sourced from proprietary information of Jones Lang LaSalle India
Note: Average capital values range- Affordable housing category: <INR 3.5 million- Affordable housing category: INR 3.5 - 7.5 million- Affordable housing category: INR 7.5 - 15 million- Affordable housing category: >INR 15 million
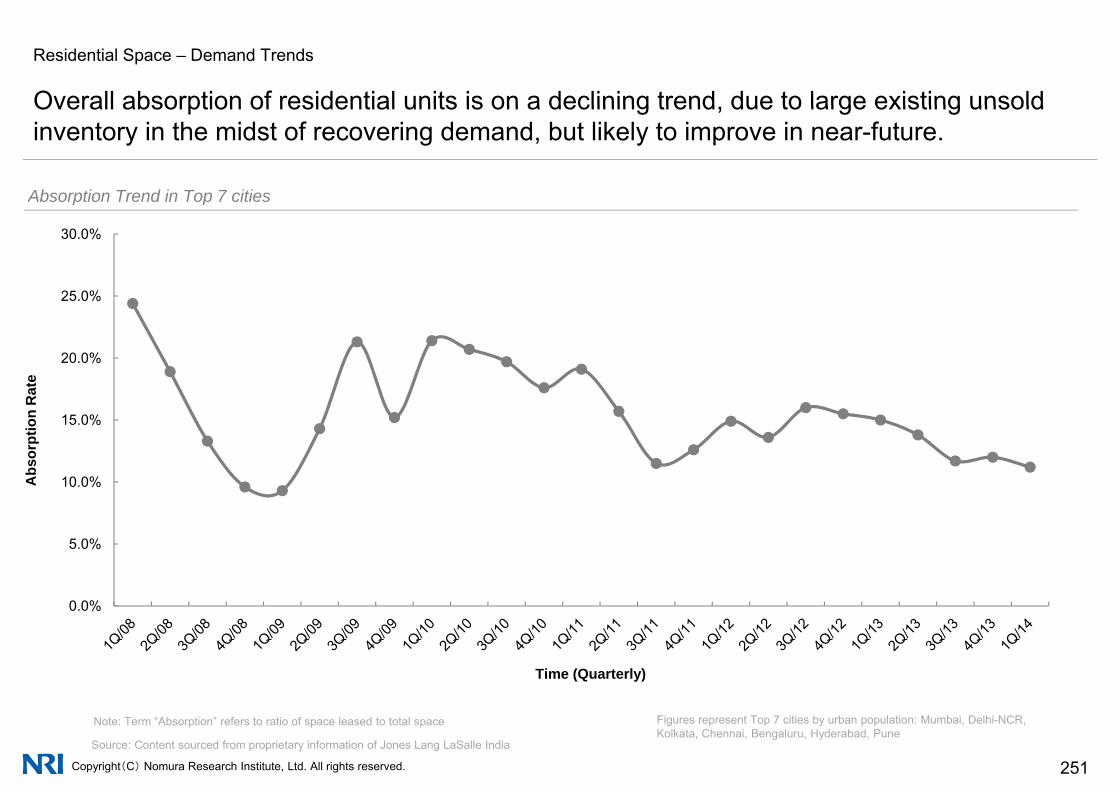
Residential Space – Demand Trends
Overall absorption of residential units is on a declining trend due to large existing unsold
Absorption Trend in Top 7 cities
Overall absorption of residential units is on a declining trend, due to large existing unsold inventory in the midst of recovering demand, but likely to improve in near-future.
Absorption Trend in Top 7 cities
25 0%
30.0%
20.0%
25.0%
Rat
e
10.0%
15.0%
Abs
orpt
ion
R
5.0%
0.0%
Time (Quarterly)
Copyright(C) Nomura Research Institute, Ltd. All rights reserved. 251
Figures represent Top 7 cities by urban population: Mumbai, Delhi-NCR, Kolkata, Chennai, Bengaluru, Hyderabad, Pune
Source: Content sourced from proprietary information of Jones Lang LaSalle India
Note: Term “Absorption” refers to ratio of space leased to total space
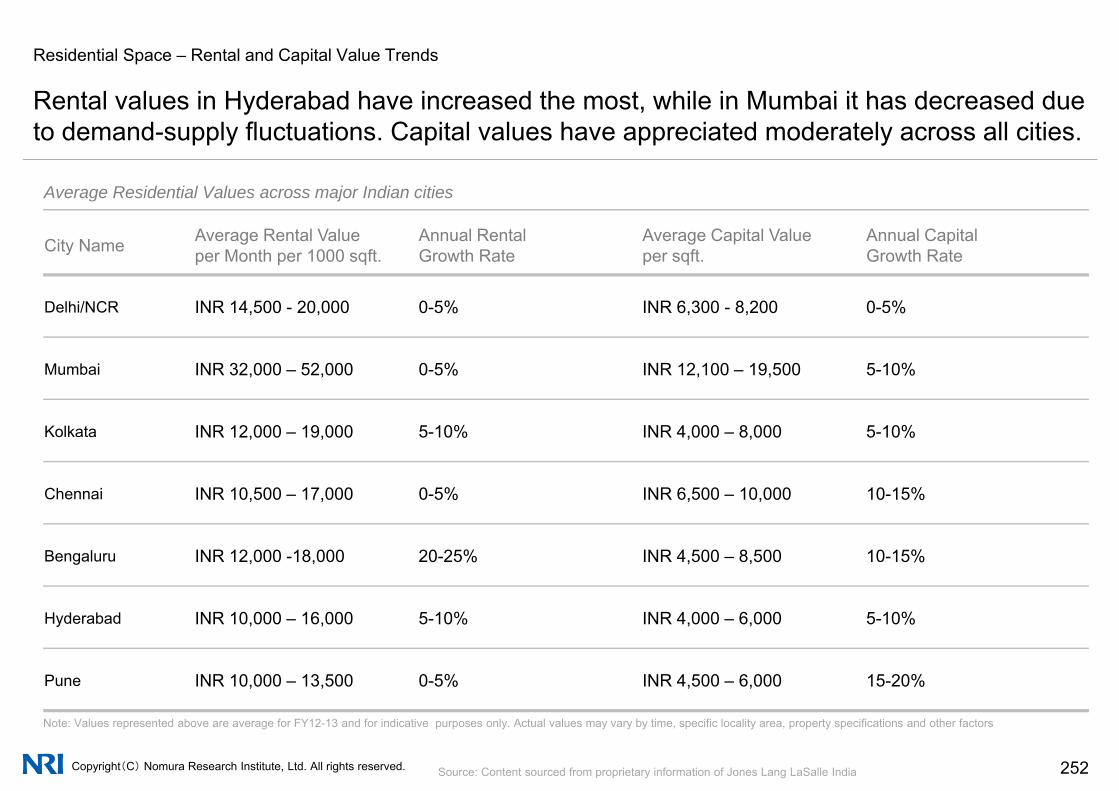
Residential Space – Rental and Capital Value Trends
Rental values in Hyderabad have increased the most while in Mumbai it has decreased due
Average Residential Values across major Indian cities
Rental values in Hyderabad have increased the most, while in Mumbai it has decreased due to demand-supply fluctuations. Capital values have appreciated moderately across all cities.
City Name Average Rental Valueper Month per 1000 sqft.
Annual Rental Growth Rate
Average Capital Valueper sqft.
Annual Capital Growth Rate
Delhi/NCR INR 14,500 - 20,000 0-5% INR 6,300 - 8,200 0-5%
Mumbai INR 32,000 – 52,000 0-5% INR 12,100 – 19,500 5-10%
Kolkata INR 12,000 – 19,000 5-10% INR 4,000 – 8,000 5-10%
Chennai INR 10 500 17 000 0 5% INR 6 500 10 000 10 15%Chennai INR 10,500 – 17,000 0-5% INR 6,500 – 10,000 10-15%
Bengaluru INR 12,000 -18,000 20-25% INR 4,500 – 8,500 10-15%
Hyderabad INR 10,000 – 16,000 5-10% INR 4,000 – 6,000 5-10%
Pune INR 10,000 – 13,500 0-5% INR 4,500 – 6,000 15-20%
Copyright(C) Nomura Research Institute, Ltd. All rights reserved. 252Source: Content sourced from proprietary information of Jones Lang LaSalle India
Note: Values represented above are average for FY12-13 and for indicative purposes only. Actual values may vary by time, specific locality area, property specifications and other factors
u e INR 10,000 13,500 0 5% INR 4,500 6,000 15 20%
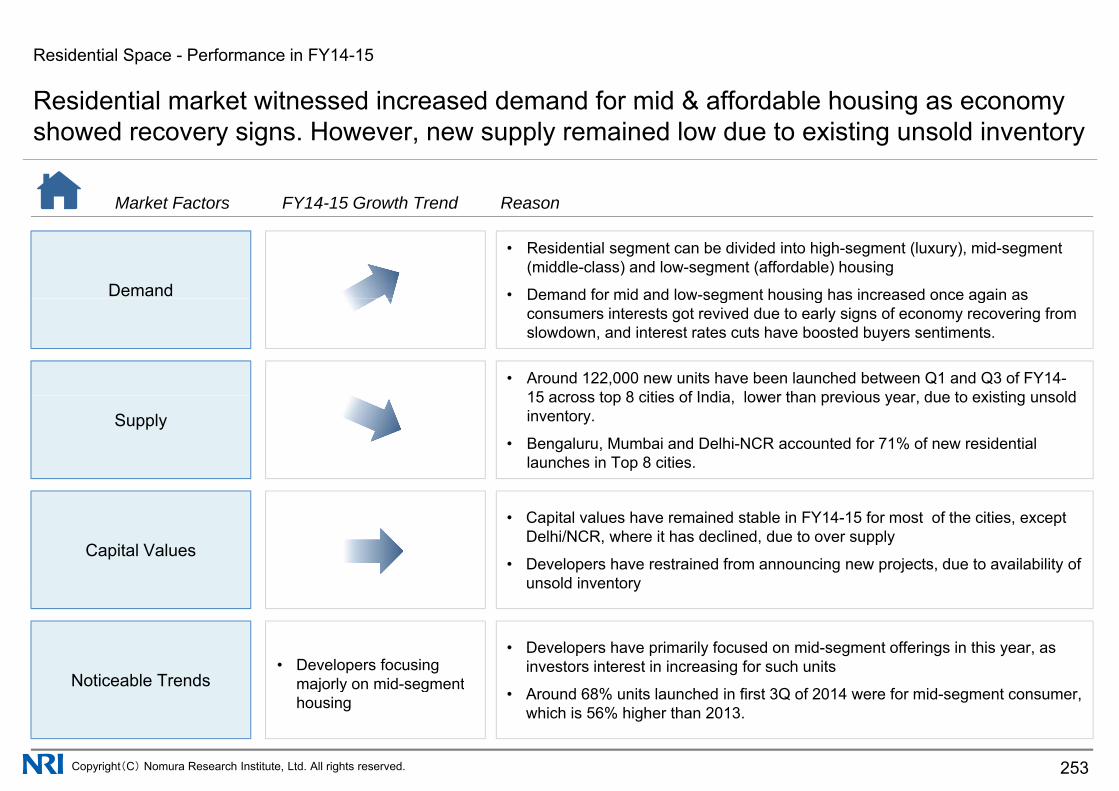
Residential Space - Performance in FY14-15
Residential market witnessed increased demand for mid & affordable housing as economy
Market Factors FY14 15 Growth Trend Reason
Residential market witnessed increased demand for mid & affordable housing as economy showed recovery signs. However, new supply remained low due to existing unsold inventory
Market Factors FY14-15 Growth Trend Reason
Demand
• Residential segment can be divided into high-segment (luxury), mid-segment (middle-class) and low-segment (affordable) housing
• Demand for mid and low-segment housing has increased once again asDemand for mid and low segment housing has increased once again as consumers interests got revived due to early signs of economy recovering from slowdown, and interest rates cuts have boosted buyers sentiments.
• Around 122,000 new units have been launched between Q1 and Q3 of FY14-15 across top 8 cities of India lower than previous year due to existing unsold
Supply15 across top 8 cities of India, lower than previous year, due to existing unsold inventory.
• Bengaluru, Mumbai and Delhi-NCR accounted for 71% of new residential launches in Top 8 cities.
Capital Values
• Capital values have remained stable in FY14-15 for most of the cities, except Delhi/NCR, where it has declined, due to over supply
• Developers have restrained from announcing new projects, due to availability ofunsold inventory
Noticeable Trends• Developers focusing
majorly on mid-segment
y
• Developers have primarily focused on mid-segment offerings in this year, as investors interest in increasing for such units
Copyright(C) Nomura Research Institute, Ltd. All rights reserved. 253
Noticeable Trends majorly on mid segmenthousing • Around 68% units launched in first 3Q of 2014 were for mid-segment consumer,
which is 56% higher than 2013.

Office Space – Supply and Demand Trends
Office space vacancy is forecasted to increase in 2015 due to higher completions in 2014 as
Office space supply and demand in Top 7 cities
Office space vacancy is forecasted to increase in 2015 due to higher completions in 2014 as compared to demand growth in this period
p pp y p
50%
60%
45
50
40%
50%
30
35
40
V(mill
ion
sq. f
t)
20%
30%
20
25
30
Vacancy (%)
on/A
bsor
ptio
n (
0%
10%
5
10
15
Com
plet
io
-10%0 2005 2006 2007 2008 2009 2010 2011 2012 2013 2014 2015F
New Completions Net Absorption Net Vacancy
Copyright(C) Nomura Research Institute, Ltd. All rights reserved. 254
Note: Figures represent Top 7 cities by urban population: Mumbai, Delhi-NCR, Kolkata, Chennai, Bengaluru, Hyderabad, Pune
Source: Content sourced from proprietary information of Jones Lang LaSalle India

Office Space – Office Rental and Capital Value Trends
Overall office rental values growth trend has been mixed while capital values have
Average Office Rental Values across major Indian cities
Overall, office rental values growth trend has been mixed, while capital values have appreciated across major centres.
City Name Average Rental Valueper sqft./month
Average Rental Growth Rate (FY13-14)
Average Capital Valueper sqft.
Average Capital Growth Rate (FY13-14)
Delhi/NCR INR 114 – 182 0-5% INR 19,000 – 23,000 0-5%
Mumbai INR 130 – 166 ▲0-5% INR 13,000 – 18,000 0-5%
Kolkata INR 65 – 79 ▲0-5% INR 7,000 – 10,000 ▲0-5%
Chennai INR 47 68 0 5% INR 7 000 10 000 0 5%Chennai INR 47 – 68 0-5% INR 7,000 – 10,000 0-5%
Bengaluru INR 52 – 72 ▲0-5% INR 6,000 – 10,000 5-10%
Hyderabad INR 38 – 48 0-5% INR 4,000 – 6,000 5-10%
Pune INR 50 – 68 5-10% INR 6,000 – 8,000 10-15%
Copyright(C) Nomura Research Institute, Ltd. All rights reserved. 255Source: Content sourced from proprietary information of Jones Lang LaSalle India
Pune INR 50 68 5 10% INR 6,000 8,000 10 15%
Note: Values represented above are average for FY12-13 and for indicative purposes only. Actual values may vary by time, specific locality area, property specifications and other factors
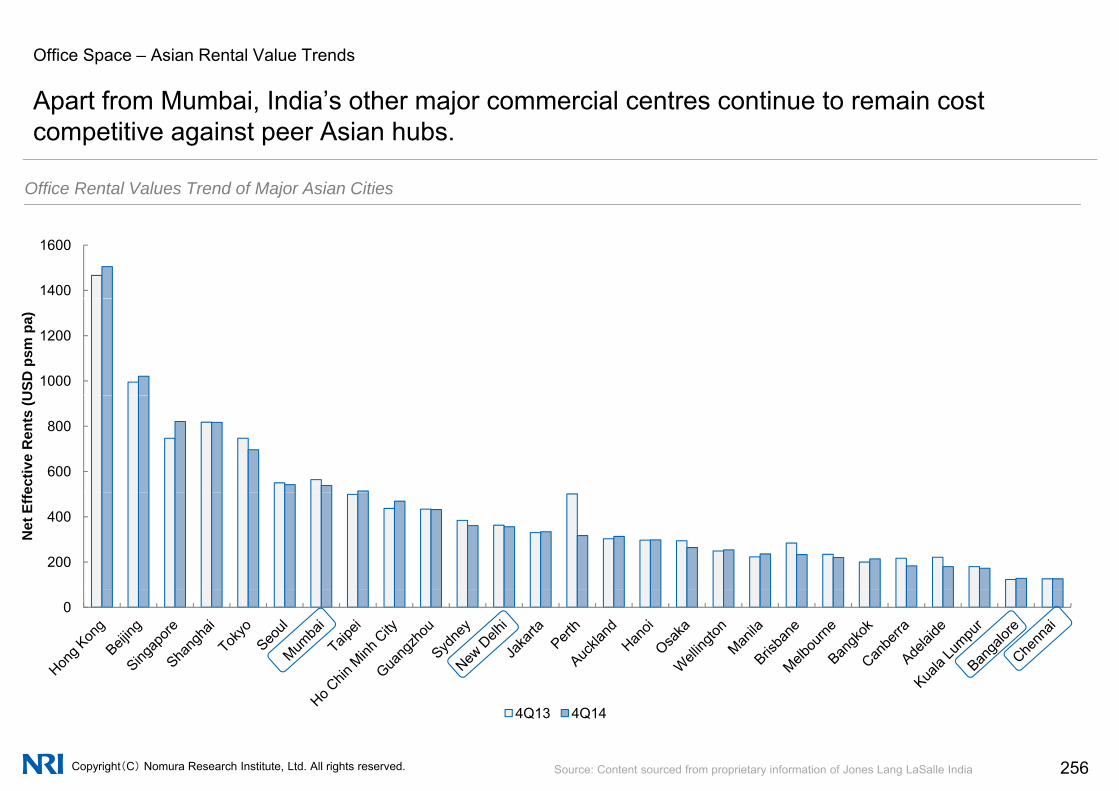
Office Space – Asian Rental Value Trends
Apart from Mumbai India’s other major commercial centres continue to remain cost
Office Rental Values Trend of Major Asian Cities
Apart from Mumbai, India s other major commercial centres continue to remain cost competitive against peer Asian hubs.
1400
1600
1000
1200
USD
psm
pa)
600
800
ectiv
e R
ents
(U
200
400
Net
Effe
0
Copyright(C) Nomura Research Institute, Ltd. All rights reserved. 256Source: Content sourced from proprietary information of Jones Lang LaSalle India
4Q13 4Q14

Office Space - Performance in FY14-15
Office space market has improved with both demand and supply witnessing an increase
Market Factors ReasonFY14-15 Growth Trend
Office space market has improved, with both demand and supply witnessing an increase. MNC companies have expanded office spaces due to renewed interest in India business.
Market Factors Reason
Demand
• Demand for office space picked up in most cities, and net absorption increased by 34% over previous year, on account of substantial pre-committed absorption in 2013.
FY14 15 Growth Trend
• Companies which had postponed office expansion plans bought new spaces to take advantage of decreasing rental/capital values
• Around 20.4 mn square ft of office space was supplied in 2014, around 9%
Supplyhigher than previous year. Delhi, Mumbai and B’luru being major beneficiaries
• Many delayed projects got completed in 2014, and improved absorption rate led developers to complete projects quickly, resulting in increased supply.
Rental Values
• Rental trends have been mixed, with rentals declining in 4 of top 8 cities due to over supply
• While in remaining, rentals have increased marginally due to fresh supply of Grade A office spaces at premium prices, and increase in rents in projects having high occupancies
Noticeable Trends
having high occupancies
• With new and stable union government in place, foreign investors sentiment is improving and MNCs are expanding office spaces in major cities, as a result of business expansion in India.
• Multi-national companiesare increasing
Copyright(C) Nomura Research Institute, Ltd. All rights reserved. 257
• This trend is more prominent for IT, BFSI and Consulting based MNC companies
ginvestments in India
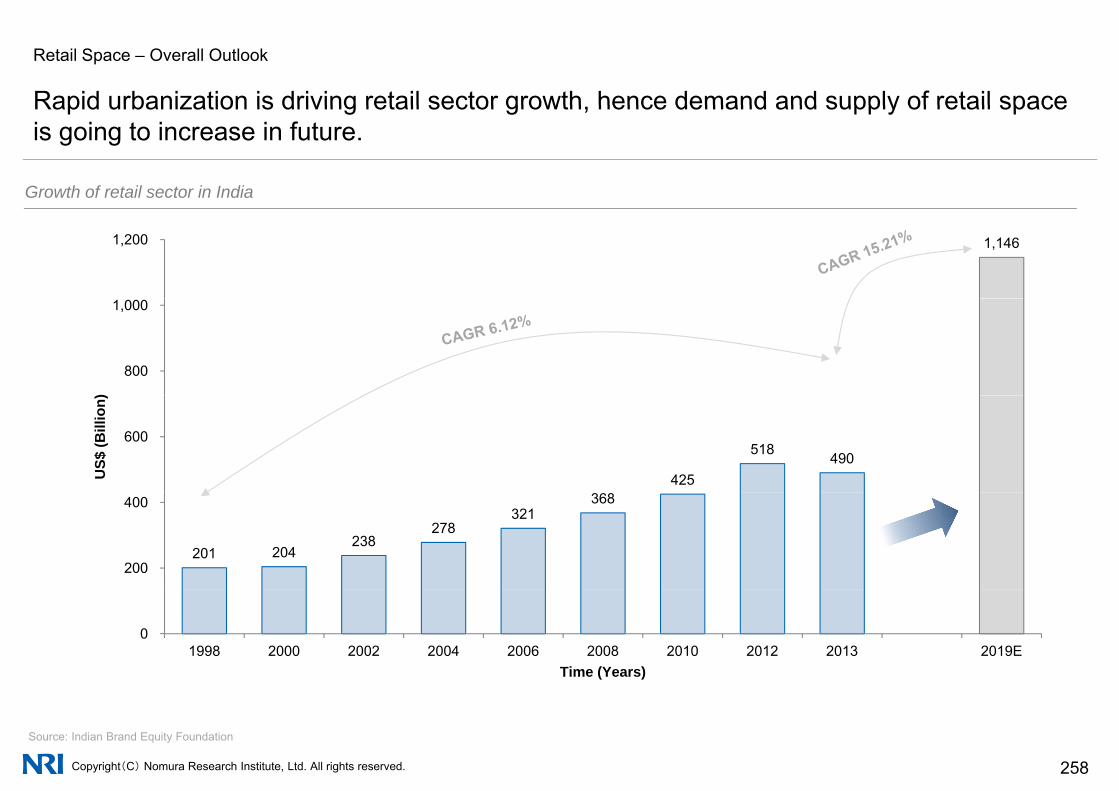
Retail Space – Overall Outlook
Rapid urbanization is driving retail sector growth hence demand and supply of retail space
Growth of retail sector in India
Rapid urbanization is driving retail sector growth, hence demand and supply of retail space is going to increase in future.
1,1461,200
800
1,000
)
425
518 490 600
US$
(Bill
ion)
201 204 238
278 321
368
200
400
0 1998 2000 2002 2004 2006 2008 2010 2012 2013 2019E
Time (Years)
Copyright(C) Nomura Research Institute, Ltd. All rights reserved. 258
Source: Indian Brand Equity Foundation
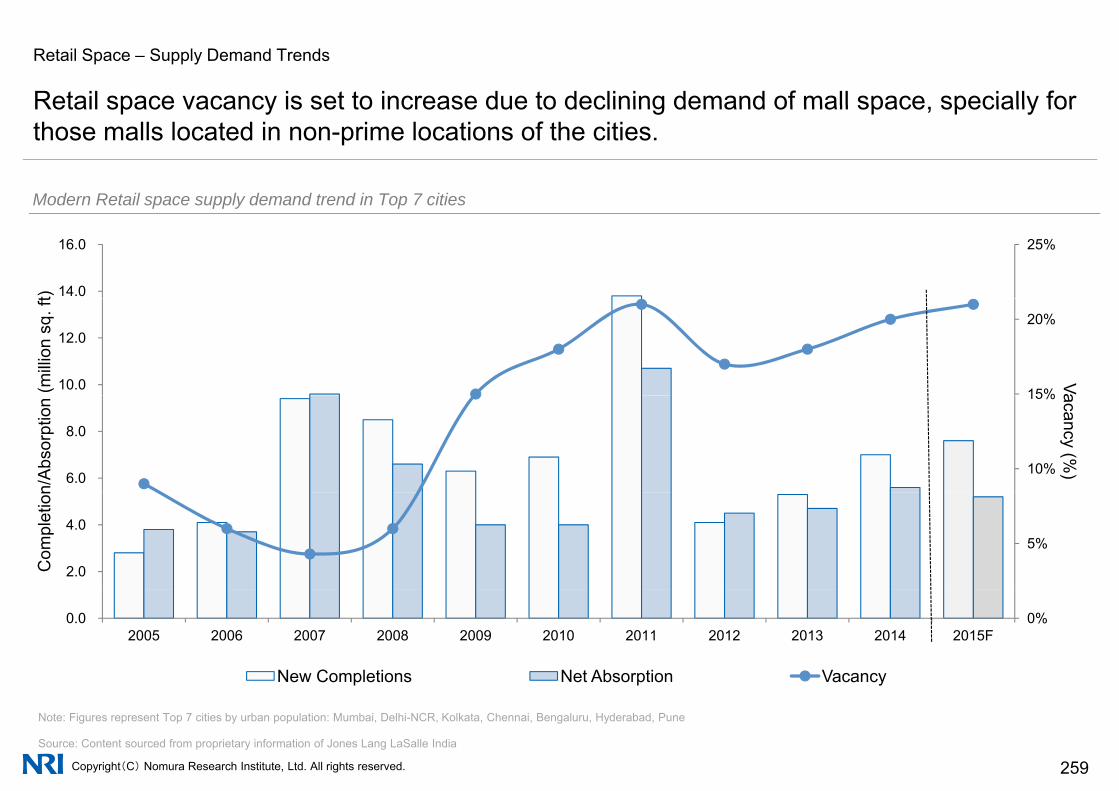
Retail Space – Supply Demand Trends
Retail space vacancy is set to increase due to declining demand of mall space specially for
Modern Retail space supply demand trend in Top 7 cities
Retail space vacancy is set to increase due to declining demand of mall space, specially for those malls located in non-prime locations of the cities.
Modern Retail space supply demand trend in Top 7 cities
25%
14.0
16.0
t)
15%
20%
10.0
12.0
Va(mill
ion
sq. f
t
10%
15%
6.0
8.0
acancy (%)
n/A
bsor
ptio
n
5%
2.0
4.0
Com
plet
ion
0%0.0 2005 2006 2007 2008 2009 2010 2011 2012 2013 2014 2015F
New Completions Net Absorption Vacancy
Copyright(C) Nomura Research Institute, Ltd. All rights reserved. 259
Note: Figures represent Top 7 cities by urban population: Mumbai, Delhi-NCR, Kolkata, Chennai, Bengaluru, Hyderabad, Pune
Source: Content sourced from proprietary information of Jones Lang LaSalle India
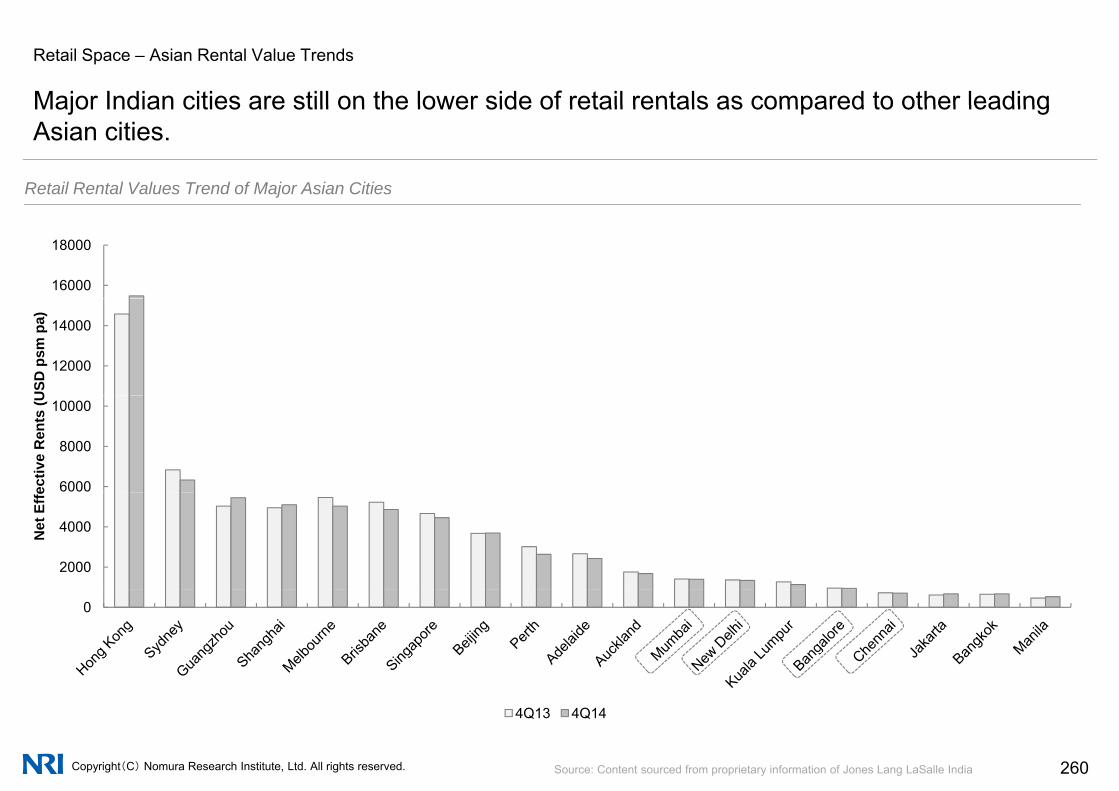
Retail Space – Asian Rental Value Trends
Major Indian cities are still on the lower side of retail rentals as compared to other leading
Retail Rental Values Trend of Major Asian Cities
Major Indian cities are still on the lower side of retail rentals as compared to other leading Asian cities.
16000
18000
12000
14000
USD
psm
pa)
6000
8000
10000
ectiv
e R
ents
(U
2000
4000Net
Effe
0
Copyright(C) Nomura Research Institute, Ltd. All rights reserved. 260Source: Content sourced from proprietary information of Jones Lang LaSalle India
4Q13 4Q14
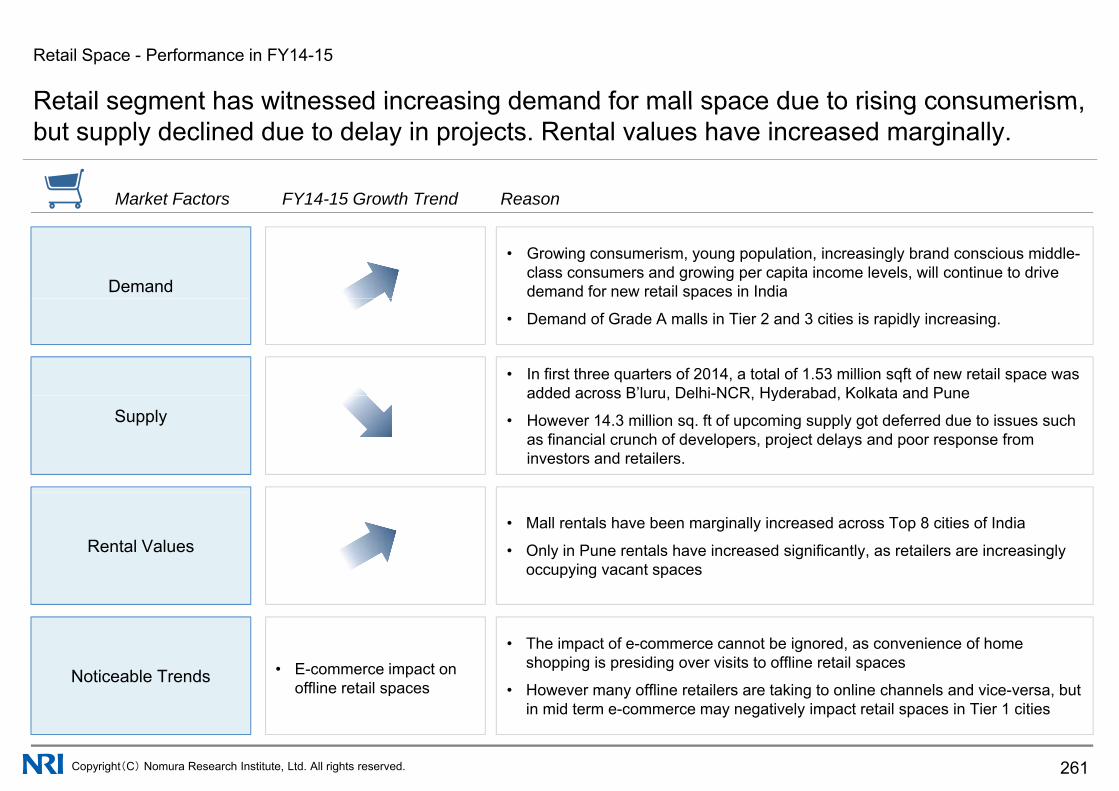
Retail Space - Performance in FY14-15
Retail segment has witnessed increasing demand for mall space due to rising consumerism
Market Factors ReasonFY14-15 Growth Trend
Retail segment has witnessed increasing demand for mall space due to rising consumerism, but supply declined due to delay in projects. Rental values have increased marginally.
Market Factors Reason
Demand
• Growing consumerism, young population, increasingly brand conscious middle-class consumers and growing per capita income levels, will continue to drive demand for new retail spaces in India
FY14 15 Growth Trend
p
• Demand of Grade A malls in Tier 2 and 3 cities is rapidly increasing.
• In first three quarters of 2014, a total of 1.53 million sqft of new retail space was added across B’luru Delhi-NCR Hyderabad Kolkata and Pune
Supplyadded across B luru, Delhi NCR, Hyderabad, Kolkata and Pune
• However 14.3 million sq. ft of upcoming supply got deferred due to issues such as financial crunch of developers, project delays and poor response from investors and retailers.
Rental Values• Mall rentals have been marginally increased across Top 8 cities of India
• Only in Pune rentals have increased significantly, as retailers are increasingly occupying vacant spaces
Noticeable Trends
• The impact of e-commerce cannot be ignored, as convenience of home shopping is presiding over visits to offline retail spaces
H ffli t il t ki t li h l d i b t• E-commerce impact on
offline retail spaces
Copyright(C) Nomura Research Institute, Ltd. All rights reserved. 261
• However many offline retailers are taking to online channels and vice-versa, but in mid term e-commerce may negatively impact retail spaces in Tier 1 cities
offline retail spaces

Logistics Space – Major Manufacturing Clusters in India
India’s manufacturing footprint and consumer markets are spread across the country thus
India’s Manufacturing Footprint and Major Markets
India s manufacturing footprint and consumer markets are spread across the country, thus arising need for domestic trade corridors and logistics hubs.
g p j
• AutomobileFMCG
New Delhi
• FMCG• Heavy Industries
• Life Sciences (Pharma & Bio-Tech)• Automobile
Ahmedabad
• Automobile• FMCG
• Automobile
MumbaiHyderabad
Kolkata
Pune• Life Sciences (Pharma & Bio-Tech)
• Life Sciences (Pharma & Bio-Tech)• Automobile• FMCG
• FMCG• Heavy Industries
ChennaiBengaluru
• Automobile• FMCG• Heavy Industries
• Heavy Industries
• Life Sciences (Pharma & Bio-Tech)• Automobiles
El t i d C i ti
Copyright(C) Nomura Research Institute, Ltd. All rights reserved. 262Source: Content sourced from proprietary information of Jones Lang LaSalle India
• Heavy Industries• Electronics and Communication• Aerospace
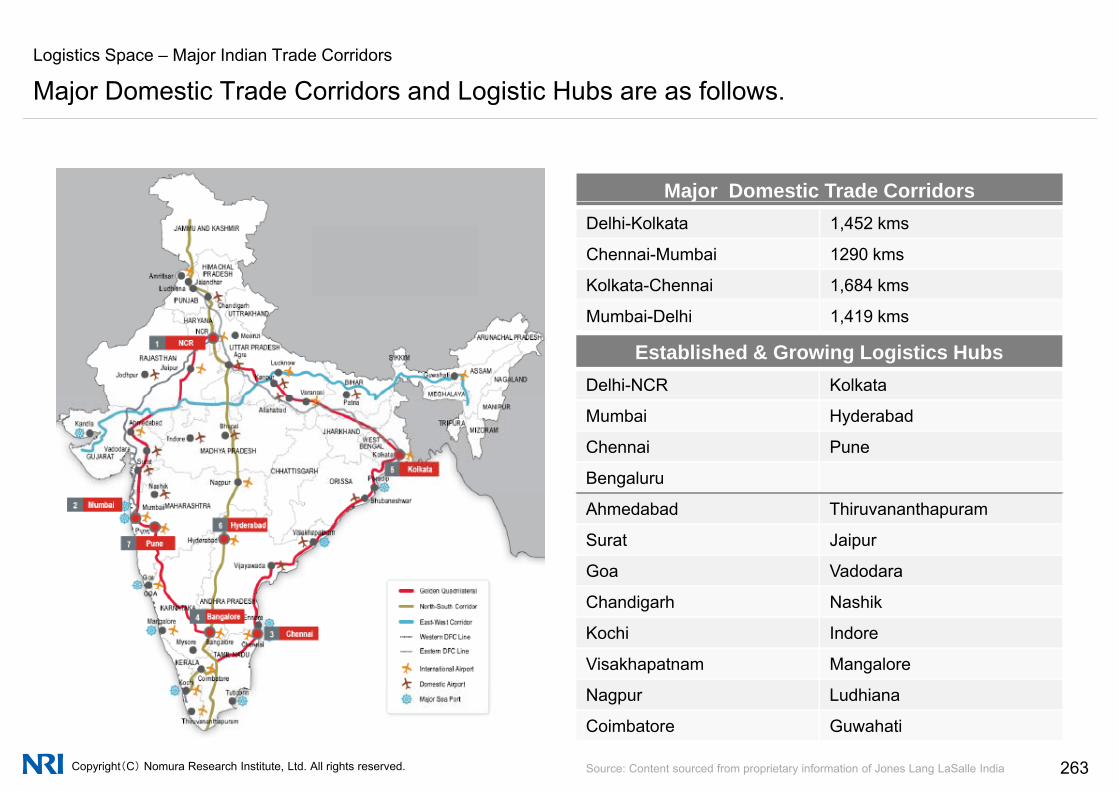
Logistics Space – Major Indian Trade Corridors
Major Domestic Trade Corridors and Logistic Hubs are as follows.
Major Domestic Trade Corridors
j g
jDelhi-Kolkata 1,452 kms
Chennai-Mumbai 1290 kms
Kolkata-Chennai 1,684 kms
Established & Growing Logistics HubsDelhi-NCR Kolkata
Mumbai-Delhi 1,419 kms
Mumbai Hyderabad
Chennai Pune
Bengaluru
Ahmedabad Thiruvananthapuram
Surat Jaipur
Goa Vadodara
Chandigarh Nashik
Kochi Indore
Visakhapatnam Mangalore
Copyright(C) Nomura Research Institute, Ltd. All rights reserved. 263
Nagpur Ludhiana
Coimbatore Guwahati
Source: Content sourced from proprietary information of Jones Lang LaSalle India

Logistics Space – Market Size and Rental Growth
India’s widely spread agricultural and industrial resources and lack of existing quality
Rentals of warehousing spaces across major industrial corridors are growing at an average of 5% per annum
India s widely spread agricultural and industrial resources and lack of existing quality storage infrastructure are driving Indian warehousing industry.
Rentals of warehousing spaces across major industrial corridors are growing at an average of 5% per annum Gurgaon-Manesar and Chennai-Bengaluru routes have shown double digit appreciation in rentals
Warehousing Market Size Warehousing Space Rental Growth Trends
228.3250.0
300.0
10%
10%
Gurgaon-Manesar
NH 4 (Chennai Bengaluru)
Rental Growth (%)
129 4148.8
171.1
197.3
150.0
200.0
(Bill
ion)
10%
6%
6%
NH-4 (Chennai-Bengaluru)
NH-91, NH-24, NH-58 (Noida)
NH-4 (Pune-Mumbai)
dors
112.5129.4
50 0
100.0
US$
(
6%
4%
3%
NH-6 (Dhulagarh)
NH-3 (Bhiwandi)
NH 2 (D k i Old D lhi)Logi
stic
Cor
rid
0.0
50.0
2013 2014 2015e 2016e 2017e 2018eTime (Years)
3%
2%
NH-2 (Dankuni-Old Delhi)
NH-7 (Hyderabad)
L
Y-o-Y rental growth (%)
Copyright(C) Nomura Research Institute, Ltd. All rights reserved. 264
( )
Source: Netscribes Report 2012 | USD 1 = INR 60 Source: Content sourced from proprietary information of Jones Lang LaSalle India
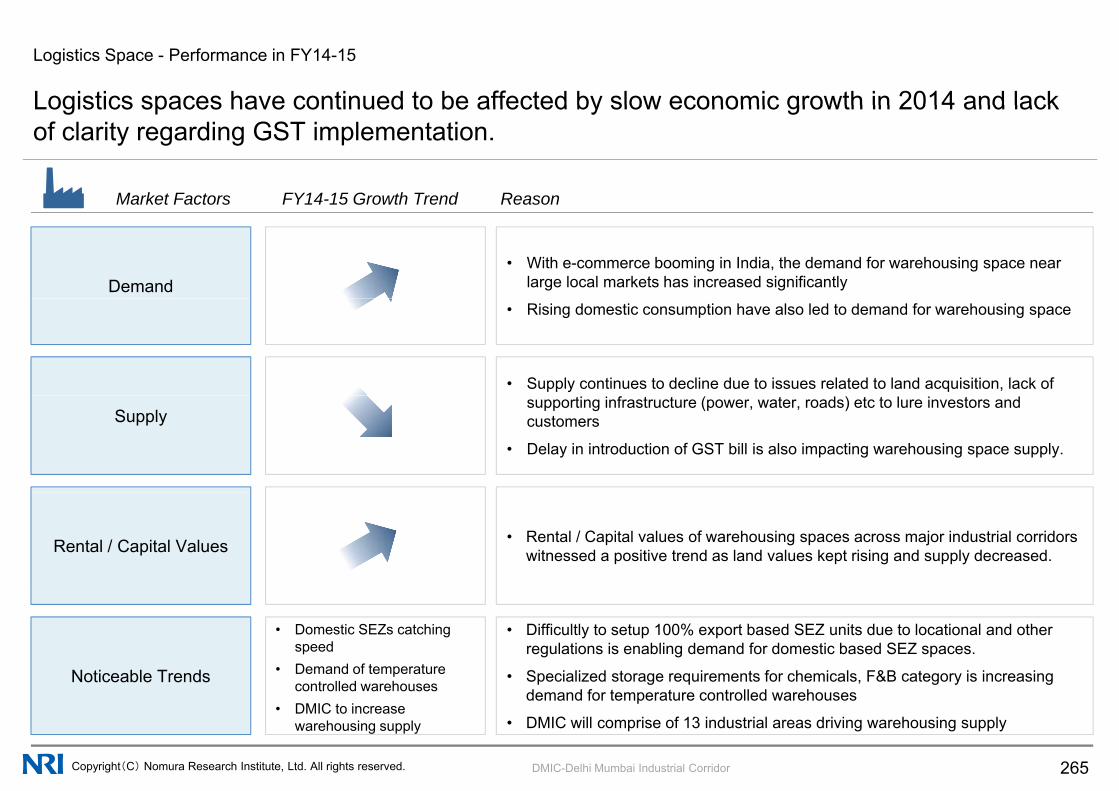
Logistics Space - Performance in FY14-15
Logistics spaces have continued to be affected by slow economic growth in 2014 and lack
Market Factors ReasonFY14-15 Growth Trend
Logistics spaces have continued to be affected by slow economic growth in 2014 and lack of clarity regarding GST implementation.
Market Factors Reason
Demand• With e-commerce booming in India, the demand for warehousing space near
large local markets has increased significantly
FY14 15 Growth Trend
• Rising domestic consumption have also led to demand for warehousing space
• Supply continues to decline due to issues related to land acquisition, lack of
Supplysupporting infrastructure (power, water, roads) etc to lure investors and customers
• Delay in introduction of GST bill is also impacting warehousing space supply.
Rental / Capital Values • Rental / Capital values of warehousing spaces across major industrial corridors witnessed a positive trend as land values kept rising and supply decreased.
Noticeable Trends
• Difficultly to setup 100% export based SEZ units due to locational and other regulations is enabling demand for domestic based SEZ spaces.
• Specialized storage requirements for chemicals, F&B category is increasing
• Domestic SEZs catching speed
• Demand of temperature controlled warehouses
Copyright(C) Nomura Research Institute, Ltd. All rights reserved. 265
demand for temperature controlled warehouses
• DMIC will comprise of 13 industrial areas driving warehousing supply
controlled warehouses• DMIC to increase
warehousing supply
DMIC-Delhi Mumbai Industrial Corridor

Hospitality Space – Market Size and Rental Growth
Travel and tourism industry is growing steadily but requires quality infrastructure support to
India’s Position in the World By Industry Competitiveness 65th By Hotel
Infrastructure 67th By Foreign Tourist Arrivals 42nd
Travel and tourism industry is growing steadily but requires quality infrastructure support to be competitive globally .
Domestic and International Tourists Arrivals Top 6 cities in Tourist Arrivals by Air
Competitiveness Infrastructure ArrivalsSource: Travel and Tourism Competitiveness Report 2013
1,036
1,152 1,200
1,400
llion
s)
18
16 16
18
20
ions
)
Contribution of travel & tourism to GDP: ~6.2%
568
674 753
864
800
1,000
sts
arriv
als
(mi
13
11 10
12
14
st a
rriv
als
(mill
532 568
400
600
umbe
r of t
ouris
7 7 6
4 5 5 5
3
5 5
4
6
8
umbe
r of t
ouris
0
200
2007 2008 2009 2010 2011 2012 2013
Nu
Ti (Y )
3 2 2 1 1
0
2
4
NCR Mumbai Chennai Bengaluru Kolkata Hyderabad
Nu
Copyright(C) Nomura Research Institute, Ltd. All rights reserved. 266
Time (Years)
Tourist arrivalsSource: Ministry of Tourism
Major Tourist Destinations
Total Domestic Foreign
Source: Airports Authority of India
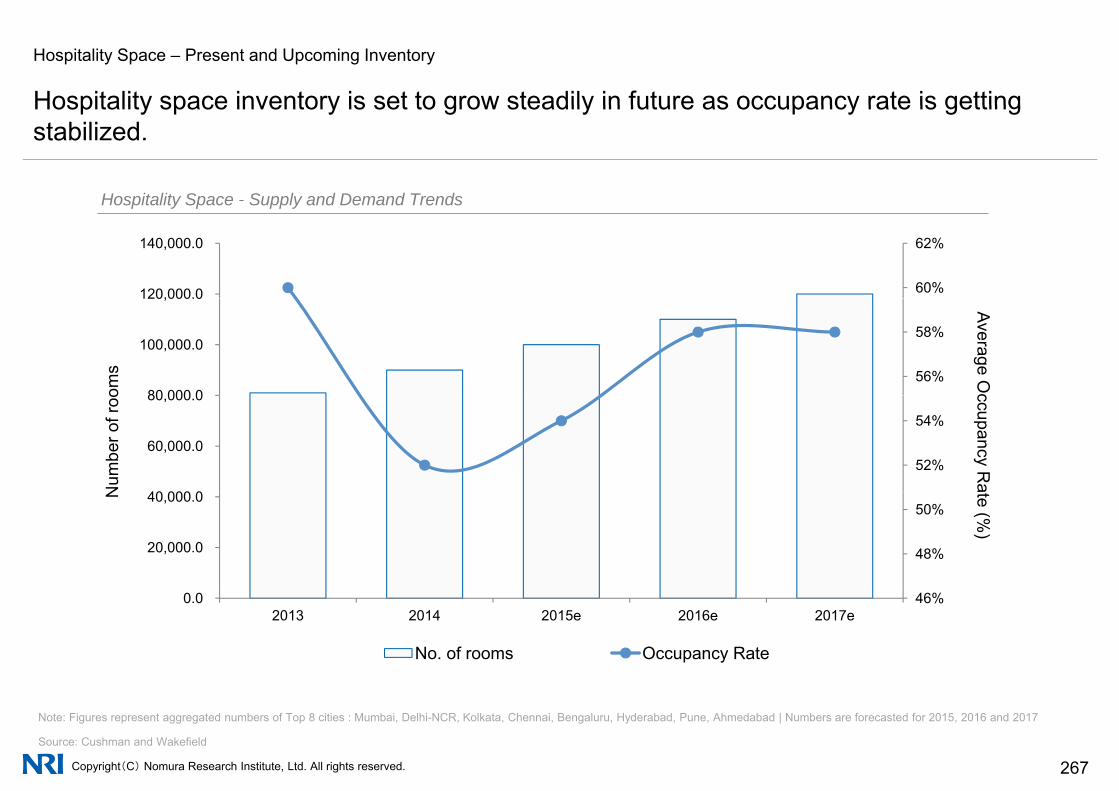
Hospitality Space – Present and Upcoming Inventory
Hospitality space inventory is set to grow steadily in future as occupancy rate is getting
Hospitality Space - Supply and Demand Trends
Hospitality space inventory is set to grow steadily in future as occupancy rate is getting stabilized.
Hospitality Space Supply and Demand Trends
60%
62%
120,000.0
140,000.0
56%
58%
80 000 0
100,000.0
120,000.0
Average Ocom
s
52%
54%
40 000 0
60,000.0
80,000.0 ccupancy Ra
Num
ber o
f roo
48%
50%
20,000.0
40,000.0 te (%)
N
46%0.0 2013 2014 2015e 2016e 2017e
No. of rooms Occupancy Rate
Copyright(C) Nomura Research Institute, Ltd. All rights reserved. 267Source: Cushman and Wakefield
Note: Figures represent aggregated numbers of Top 8 cities : Mumbai, Delhi-NCR, Kolkata, Chennai, Bengaluru, Hyderabad, Pune, Ahmedabad | Numbers are forecasted for 2015, 2016 and 2017
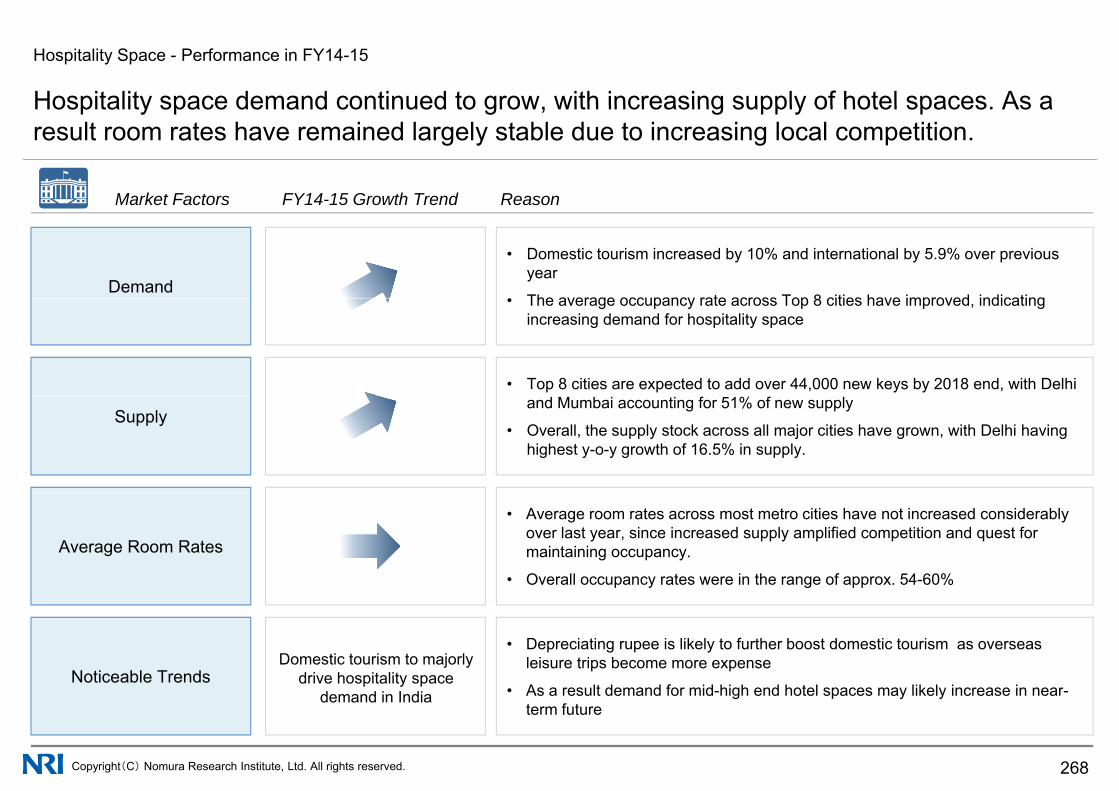
Hospitality Space - Performance in FY14-15
Hospitality space demand continued to grow with increasing supply of hotel spaces As a
Market Factors ReasonFY14-15 Growth Trend
Hospitality space demand continued to grow, with increasing supply of hotel spaces. As a result room rates have remained largely stable due to increasing local competition.
Market Factors Reason
Demand
• Domestic tourism increased by 10% and international by 5.9% over previous year
• The average occupancy rate across Top 8 cities have improved indicating
FY14 15 Growth Trend
• The average occupancy rate across Top 8 cities have improved, indicating increasing demand for hospitality space
• Top 8 cities are expected to add over 44,000 new keys by 2018 end, with Delhi
Supplyand Mumbai accounting for 51% of new supply
• Overall, the supply stock across all major cities have grown, with Delhi having highest y-o-y growth of 16.5% in supply.
Average Room Rates
• Average room rates across most metro cities have not increased considerably over last year, since increased supply amplified competition and quest for maintaining occupancy.
• Overall occupancy rates were in the range of approx. 54-60%
Noticeable Trends
• Depreciating rupee is likely to further boost domestic tourism as overseas leisure trips become more expense
A lt d d f id hi h d h t l lik l i i
Domestic tourism to majorlydrive hospitality space
Copyright(C) Nomura Research Institute, Ltd. All rights reserved. 268
• As a result demand for mid-high end hotel spaces may likely increase in near-term future
p y pdemand in India
Authors
Hirokazu SAOAuthor of Retail Property Market
Tomohiko TANIYAMAAuthor of Real Estate Investment Products
Akira DAIDOAuthor of Population Movements in
Sao is engaged in consulting and research projects, mainly on real estate, housing and infrastructure-related cases. Sao undertakes survey/research as well as business strategy planning.
Taniyama is engaged in consulting and research projects. His resent research theme is the analysis of alternative investment market including real estates and infrastructures, and the development of new financial instruments and new real estate economic models.
Japan and Residential Property Market
Daido is engaged in consulting and research projects such as real estate and housing, electric industry, and planning of business strategies.
Keita KAMEIAuthor of Logistics Property Market
Kamei is engaged in consulting and research projects, undertaking real estate, housing , housing loan, and infrastructure-related survey/research,
Seiya HARIMAAuthor of Macro Fundamentals of Japan
Harima is engaged in consulting and research projects such as real estate/infrastructure-related
Yinhua BAI, Ph.D.Lead Author of China
Bai is engaged in consulting and research projects such as urban and regional development, and l i f l t t b i t tloan, and infrastructure related survey/research,
as well as business strategy planning. survey/research, and planning of business strategies.
planning of real estate business strategy.
JaRyoung CHOILead Author of KoreaYue KANG
Author of ChinaJunWon SEOAuthor of Hotel Market Trend in Korea
As a Executive Director of Real Estate, Retail, Service Division at NRI Seoul, Choi is engaged in consulting and research projects such as urban and regional development, real estate business strategy and real estate investment strategy, business strategy planning.
Author of China
As a Consultant at NRI Shanghai, Kang is engaged in consulting and research projects such as urban and regional development, and planning of real estate business strategy.
Author of Hotel Market Trend in Korea
As a Senior Consultant of Infra Business develop Division at NRI Seoul, Seo is engaged in consulting projects related to Real estate business strategy and development, Urban Development.
YoonJi BAEAuthor of Household Economy and Housing market trends, Indirect Investment Market Trends in Korea
As a Consultant of Real Estate, Retail, Service
KangTae PARKAuthor of Office Market Trends in Korea
As a Consultant of Real Estate, Retail, Service Division at NRI Seoul Park is engaged in
DongHyun LEE Author of Business Trends in Korea
As a Consultant of Real Estate, Retail, Service Division at NRI Seoul, Lee is engaged in consulting
Copyright(C) Nomura Research Institute, Ltd. All rights reserved. 269
, ,Division at NRI Seoul, Bae is engaged in consulting projects related to Housing/Real estate business strategy, Making business plan.
Division at NRI Seoul, Park is engaged in consulting projects related to Distribution strategy, Plan of operation/ Execution support.
projects related to Distribution/Analysis of consumer's market and marketing.

Authors
Michihiro KONAGAILead Author of Taiwan
Yasuyuki ARAKIAuthor of Singapore
SungYun (Sonny) KIMAuthor of Japan and IndiaKim has been engaged in real estate related Lead Author of Taiwan
Konagai is engaged in consulting and research projects such as infrastructure development and business strategy planning in infrastructure market.
Araki is engaged in consulting and research projects such as investment environment analysis in real estate and infrastructure market, and planning the business strategies and overseas market strategy.
consulting projects and research for years. His current interest in real estate investment market includes behavioral investment, market cycle theory, demographic impact on real estate market, real estate securitization, global real estate investment, and financial crisis.
Amit KUMARLead Author of India
As a Division Head of Business Strategy Consulting Division at NRI India, Kumar is engaged in consulting and research projects such as infrastructure related business strategy M&A
Wataru KADOBAYASHIAuthor of Real Estate Market India
As a Group Manager at NRI India, Kadobayashi is engaged in consulting and research projects such as infrastructure-related business strategy,
Arpit MARTHURAuthor of Real Estate Market India
As a Consultant in Business Strategy Consulting Division at NRI India, Mathur is engaged in consulting and research projects such as infrastructure related business strategy andas infrastructure-related business strategy, M&A
and corporate alliances.
gy,overseas business, and corporate alliance or M&A. infrastructure-related business strategy and
alliances.
Anoop KUBBAAuthor of Real Estate Market India
Toshiro TAKEKOSHIManager, Consulting division Kengo MIZUNO
Managing DirectorAs a Business Analyst in Business Strategy Consulting Division at NRI Inida, Kubba is engaged in consulting and research projects related to infrastructure, real estate industry, economic policies and regulations.
Takekoshi specializes in infrastructure business, with particular focus on real estate and energy industries, advising clients on management and business strategies, as well as cross border alliance and M&A.
Managing DirectorNRI Thailand
Mizuno specializes in real estate and housing industry in Thailand.
Aya IMAIEditor
Imai is engaged in research and consulting with specific focus on real estate and housing i d t i i il d ti b d t
Kazuya SAITOEditorial assistant
Saito is engaged in research, particularly market forecasting, as well as consulting with specific f t ti S it l k
Contact: Nomura Research Institute, Ltd.Consulting Division
Copyright(C) Nomura Research Institute, Ltd. All rights reserved. 270
industries, primarily conducting cross border entry strategy planning.
focus on construction company. Saito also works on the reconstruction of earth quake hit cities.