the adequacy of the european social survey to measure values in 20 countries
TRANSCRIPT

Public Opinion Quarterly, Vol. 72, No. 3, Fall 2008, pp. 420–445
BRINGING VALUES BACK INTHE ADEQUACY OF THE EUROPEAN SOCIAL SURVEYTO MEASURE VALUES IN 20 COUNTRIES
ELDAD DAVIDOVPETER SCHMIDTSHALOM H. SCHWARTZ
Abstract The Schwartz (1992) theory of basic human values haspromoted a revival of empirical research on values. The semi-annual Eu-ropean Social Survey (ESS) includes a new 21-item instrument to mea-sure the importance of the 10 basic values of the theory. Representativenational samples in 20 countries responded to the instrument in 2002–3.We briefly describe the theory and the ESS instrument and assess itsadequacy for measuring values across countries. Using multiple-groupconfirmatory factor analyses, augmented with mean-structure informa-tion, we assess the configural and measurement (metric) invariance ofthe values—necessary conditions for equivalence of the meaning of con-structs and scalar invariance—a precondition for comparing value meansacross countries. Only if such equivalence is established can researchersmake meaningful and clearly interpretable cross-national comparisons ofvalue priorities and their correlates. The ESS values scale demonstratesconfigural and metric invariance, allowing researchers to use it to studyrelationships among values, attitudes, behavior and socio-demographiccharacteristics across countries. Comparing the mean importance of
ELDAD DAVIDOV is with the GESIS-Central Archive for Empirical Social Research, and Universityof Cologne, 50923 Cologne, Germany. PETER SCHMIDT is with the University of Giessen, Faculty ofSocial Sciences, Karl-Gloeckner Str. 22E, 35394, Giessen, Germany. SHALOM H. SCHWARTZ is withthe Department of Psychology, Hebrew University of Jerusalem, 91905 Jerusalem, Israel. Earlierversions of this article were presented at the RC33 conference, Amsterdam 2004, RC28 conference,Oslo 2005, first ESRA conference, Barcelona 2005, and two research seminars of QMSS1 heldby Willem Saris, Lugano 2004 and 2006, with the financial support of the European ScienceFoundation. We would also like to thank Willem Saris and Jaak Billiet for helpful comments onearlier versions of this study. Work on this article was conducted with the help of the GermanIsraeli Foundation (GIF), Project No. I-769–241.4. The work of the third author on this researchwas supported by the Israel Science Foundation Grant No. 921/02–1. Address correspondence toEldad Davidov; e-mail: [email protected], [email protected].
doi:10.1093/poq/nfn035 Advance Access publication August 21, 2008C© The Author 2008. Published by Oxford University Press on behalf of the American Association for Public Opinion Research.All rights reserved. For permissions, please e-mail: [email protected]

Measuring Values in the European Social Survey 421
values across countries is possible only for subsets of countries wherescalar invariance holds.
Introduction
Values are central to public discourse today. Competing groups demand priorityfor the values they hold dear, arguing that conflicting values are unworthy.Theorists have long considered values central to understanding attitudes andbehavior (e.g., Kluckhohn 1951; Allport, Vernon, and Lindsay 1960; Williams1968). They view values as deeply rooted, abstract motivations that guide,justify, and explain attitudes, norms, opinions, and actions (cf. Rokeach 1973;Schwartz 1992; Halman and de Moor 1994; Feldman 2003).
In practice, survey researchers distinguish little between values and attitudes(Halman and de Moor 1994, 22). The confounding of values and attitudesreflects, in part, the absence of a comprehensive theory of the basic motivationsthat are socially expressed as values. It also reflects the lack of reliable, theory-based instruments to measure basic values (Rohan 2000; Hitlin and Piliavin2004).
In 1992, Schwartz introduced a theory of basic human values, building oncommon elements in earlier approaches (e.g., Rokeach 1973). It includes 10motivationally distinct values presumed to encompass the major value orienta-tions recognized across cultures. He also presented a first instrument to measurethese values that he validated cross-culturally (Schwartz 1992). An alternativeinstrument, also validated across cultures, was presented in 2001 (Schwartzet al. 2001). This theory and two instruments have promoted a revival of em-pirical research on relations of values to attitudes and behavior, both withinand across cultures (overviews in Hitlin and Piliavin 2004; Schwartz 2005a,2005b). Recently, the European Social Survey (ESS) incorporated a third, shortinstrument to measure the 10 basic values in its semi-annual studies of atti-tudes and opinions. The 2006 pilot study of the American National ElectionsSurvey also includes a version of the values instrument. This article brieflydescribes the theory of basic values and the ESS instrument, and then as-sesses the adequacy of this instrument for measuring values within and acrosscountries.
Political attitudes and choices are one important domain to which basic valuesare relevant (e.g., Rokeach 1973; Zaller 1992; Knutsen 1995; Miller and Shanks1996). Values may enable people to organize their political evaluations in arelatively consistent manner; they may provide a general structure to politicalattitudes (Feldman 2003). This structuring process is one path through whichvalues may influence political preferences. Converse (1964) likened values to“a sort of glue to bind together many more specific attitudes and beliefs.”Schwartz (1994) argued that systematic variations in the priority individualsgive to different basic values underlie political ideologies. Thus, values mayinfluence political choice through their effects on ideologies.
422 Davidov, Schmidt, and Schwartz
The particular values that structure ideological discourse and underlie po-litical choice depend upon the issues that are central in a given politicalcontext. Consider three examples of studies based on the Schwartz (1992) the-ory and instruments. In the Israeli political arena of 1988, protection of religiouspractice competed with free expression of a secular life style. There, the keyvalues that differentiated party supporters were tradition versus self-direction(Barnea and Schwartz 1998).
In the Italian elections of 2001, the center-right placed particular emphasison entrepreneurship and the market economy, security, and family and nationalvalues. In contrast, the center-left advocated social welfare, concern for socialjustice, equality, and tolerance of diverse, even potentially disruptive groups.The basic values that related significantly to political preferences were securityand power (right) versus universalism and benevolence (left) (Caprara et al.2006).
In a study of political preferences in 14 countries, Barnea (2003) found twomain patterns. Where political competition revolved around issues of nationalsecurity versus equal rights and freedoms for all, the key values that struc-tured voters’ preferences were security and conformity versus universalismand self-direction. Where the focus of political competition revolved aroundthe distribution of material resources, the key values were universalism andbenevolence versus power and achievement.
Other studies have revealed systematic relations of basic values to a widevariety of attitudes and opinions in many countries, using one or another of theSchwartz instruments. For example, basic values exhibit predicted associationswith attitudes toward war, right-wing authoritarianism, and social dominanceorientation (Cohrs et al. 2005); attitudes toward human rights (Spini and Doise1998); interpersonal trust, political activism, and attitudes toward immigration(Schwartz 2007); environmental attitudes (Schultz and Zelezny 1999); andmaterialism (Burroughs and Rindfleisch 2002).
Not only are individual differences in basic value priorities important, butthe prevailing value emphases in societies also relate systematically to na-tional differences in widespread attitudes and public policy (Schwartz 2006b).Hence, basic values have predictive and explanatory potential both at theindividual and societal levels. Moreover, values can reflect major socialchange in societies and across nations. And values may influence the direc-tion of social change and its speed. A simple survey method for measur-ing basic values, such as the ESS instrument, may therefore prove widelyuseful.
The ESS values scale was administered to representative national sam-ples in 20 countries in 2002–3, in 25 countries in 2004–5, and willbe included in future ESS rounds (www.europeansocialsurvey.org). Thefull dataset from the first two ESS rounds, now in the public domain(http://ess.nsd.uib.no), includes a vast amount of information of interestto political scientists, sociologists, and others. Thousands of researchers
Measuring Values in the European Social Survey 423
have begun to use these data (reported in http://naticent02.uuhost.uk.uu.net/news).
Given the spreading impact of the ESS and the significant role the new humanvalues scale may play in research, it is crucial to examine its validity.1 Thecurrent article assesses how well the ESS human values scale measures the 10basic values in the Schwartz theory. It then examines the equivalence of meaningacross countries of the values that are measured. Only if such equivalence isestablished can researchers make meaningful and clearly interpretable cross-national comparisons of value priorities and their correlates (Billiet 2003). Weemploy multiple-group confirmatory factor analyses (MGCFAs) augmentedwith mean-structure information (see Sorbom 1974; Sorbom 1978) on the datafrom the first round of the ESS to address these issues.
The Theory of Basic Values
Before presenting the ESS values scale and assessing its validity, a briefoverview of the theory from which it derives is necessary. The theory de-fines values as desirable, trans-situational goals, varying in importance, thatserve as guiding principles in people’s lives. It derives 10 motivationally dis-tinct, broad and basic values from three universal requirements of the humancondition: needs of individuals as biological organisms, requisites of coordi-nated social interaction, and survival and welfare needs of groups (Schwartz1992, 2005a). For example, conformity values derive from the prerequisitesof interaction and of group survival. For interaction to proceed smoothlyand for groups to thrive, individuals must restrain impulses and inhibit ac-tions that might hurt others. Self-direction values derive from organismicneeds for mastery and from the interaction requirements of autonomy andindependence.
The 10 basic values cover the distinct content categories found in earlier valuetheories, in value questionnaires from different cultures, and in religious andphilosophical discussions of values. The core motivational goal of each basicvalue, presented in table 1, defines it. The theory also explicates the structureof dynamic relations among the 10 basic values. The main source of the valuestructure is the fact that actions in pursuit of any value have consequences thatconflict with some values and are congruent with other values.2 For example,pursuing achievement values may conflict with pursuing benevolence values.Seeking success for self is likely to obstruct actions aimed at enhancing thewelfare of others who need one’s help. But pursuing both achievement and
1. We discuss validity only in the sense of consistency (Bollen 1989), not in the sense of constructvalidity. The latter would require examining both antecedents and consequences of value priorities,an objective beyond the scope of this paper.2. For a discussion of other sources, see Schwartz (2006a).

424 Davidov, Schmidt, and Schwartz
Table 1. Definitions of the Motivational Types of Values in Terms of theirCore Goal
POWER: Social status and prestige, control or dominance over people andresourcesACHIEVEMENT: Personal success through demonstrating competence accordingto social standardsHEDONISM: Pleasure and sensuous gratification for oneselfSTIMULATION: Excitement, novelty, and challenge in lifeSELF−DIRECTION: Independent thought and action−choosing, creating,exploringUNIVERSALISM: Understanding, appreciation, tolerance and protection for thewelfare of all people and for natureBENEVOLENCE: Preservation and enhancement of the welfare of people withwhom one is in frequent personal contactTRADITION: Respect, commitment and acceptance of the customs and ideas thattraditional culture or religion provide the selfCONFORMITY: Restraint of actions, inclinations, and impulses likely to upset orharm others and violate social expectations or normsSECURITY: Safety, harmony and stability of society, of relationships, and of self
power values may be compatible. Seeking personal success for oneself tendsto strengthen and to be strengthened by actions aimed at enhancing one’s ownsocial position and authority over others.
The schematic circular structure in figure 1 portrays the pattern of relations ofconflict and congruity among values. The closer any two values in either direc-tion around the circle, the more similar their underlying motivations. The moredistant any two values, the more antagonistic their underlying motivations. Thedivision of the domain of value items into 10 distinct values is an arbitraryconvenience. The circular arrangement of values represents a continuum ofrelated motivations, like the circular continuum of colors, rather than a set ofdiscrete motivations. One could reasonably partition the domain of value itemsinto broader or more fine-tuned distinct value constructs, depending on howfinely one wishes to discriminate among motivations. Reflecting the indeter-minacy of the optimal number of value constructs, items from adjacent valuesoften intermix in empirical studies. Thus, the theory specifies the motivationalorder of value items around the circle and it suggests distinguishing 10 valueconstructs for scientific convenience. The theory leaves the width of the valueconstructs and the absolute distances among them unspecified; hence the widthof the slices in figure 1 is arbitrary.
Two dimensions summarize the structure of relations among the basic values(figure 1): The self-enhancement versus self-transcendence dimension opposespower and achievement values—that emphasize self-interest—to universalismand benevolence values—that entail concern for the welfare and interests of

Measuring Values in the European Social Survey 425
Universalism
Benevolence
ConformityTradition
Security
Self-Direction
Stimulation
Hedonism
Achievement
Power
Figure 1. Structural Relations Among the 10 Values and the Two Dimensions.
others. The openness to change versus conservation dimension opposes self-direction and stimulation values—that emphasize independent action, thought,and feeling and readiness for new experience—to security, conformity, andtraditional values—that emphasize self-restriction, order, and resistance tochange. The dashed lines around hedonism indicate that it shares elementsof both openness to change and of self-enhancement.
Research with two earlier instruments provides evidence supporting thisstructure in samples from 67 nations (Fontaine et al. (Forthcoming); Schwartz2005a, 2005b; Schwartz and Boehnke 2004). Although individuals differ inthe importance they attribute to various values, the same motivational structureapparently organizes these values across cultures. These studies provide nostrict tests of measurement invariance, however. The current study subjects thenew ESS human values scale to such tests.
The ESS Human Values Scale
The ESS human values scale is derived from the earlier 40-item Portrait ValuesQuestionnaire (PVQ; Schwartz et al. 2001; Schwartz 2005b). Space limitationsin the ESS required reducing the number of items. Some items were droppedand others were revised to encompass additional ideas to preserve coverage ofthe content of the 10 different values. The ESS scale includes verbal portraits

426 Davidov, Schmidt, and Schwartz
of 21 different people, gender-matched with the respondent. Each portraitdescribes a person’s goals, aspirations, or wishes that point implicitly to theimportance of a value. For example: “Thinking up new ideas and being creativeis important to her. She likes to do things in her own original way” describes aperson for whom self-direction values are important. Respondents’ own valuesare inferred from their self-reported similarity to people described implicitly interms of particular values.3
Regarding each portrait, respondents answer: “How much like you is thisperson?” Six labeled responses range from “not like me at all” to “very muchlike me.” The upper panel of table 2 presents the format of the survey and,below, in the first two columns, the items grouped by type of value. Twoportraits operationalize each value, with three for universalism because of itsvery broad content. The score for the importance of each value is the meanresponse to the items that measure it. Translation into each native languagefollowed procedures explained in Harkness, Van de Vijver, and Mohler (2003,Ch. 3).
Strict probability samples, representing the non-institutionalized populationaged 15 years and older in each of 20 countries, completed the human valuesscale in the first round of the ESS. The value scale was administered followinga face-to-face interview for approximately one hour in respondents’ homes ona wide variety of topics. Eighty-six percent of the respondents completed thesurvey in the presence of the interviewer (66 percent orally, 20 percent written).The interviewer picked up the written values scale later from 2 percent, and12 percent (almost all in Finland and Sweden and half in Norway) returned itby post. The countries, with numbers of respondents who completed the valuesscale and country-level response rates, are: Austria (2,257, RR 60.4), Belgium(1,899, RR 59.2), Czech Republic (1,360, RR 43.3), Denmark (1,506, RR67.6), Finland (2,000, RR 73.2), France (1,503, RR 43.1), Germany (2,919, RR55.7), Great Britain (2,052, RR 55.5), Greece (2,566, 79.9), Hungary (1,685,RR 69.9), Ireland (2,046, RR 64.5), Israel (2,499, RR 70.9), the Netherlands(2,364, RR 67.8), Norway (2,036, RR 65.0), Poland (2,110, RR 73.2), Portugal(1,511, RR 68.8), Slovenia (1,519, RR 70.5), Spain (1,729, RR 53.2), Sweden(1,999, RR 69.4), Switzerland (2,037, RR 33.5), total = 39,596. The first-roundresponse rate of the ESS is calculated according to AAPOR RR5. Detailedinformation on the population, selection procedure, response rates, dates of datacollection and exact question wording in the various languages are available athttp://ess.nsd.uib.no.
3. All the items are double-barreled because each includes two sentences. Schwartz (2003) dis-cusses the rationale for this and presents evidence suggesting that it does not create a problem inthis case.

Measuring Values in the European Social Survey 427
Tabl
e2.
The
ESS
Hum
anV
alue
sSc
ale:
Form
at,I
tem
Mea
nsan
dSt
anda
rdD
evia
tions
(N=
39,3
99)
Her
ew
ebr
iefly
desc
ribe
som
epe
ople
.Ple
ase
read
each
desc
ript
ion
and
thin
kab
outh
owm
uch
each
pers
onis
oris
notl
ike
you.
Tic
kth
ebo
xto
the
righ
ttha
tsho
ws
how
muc
hth
epe
rson
inth
ede
scri
ptio
nis
like
you.
HO
WM
UC
HL
IKE
YO
UIS
TH
ISPE
RSO
N?
Ver
ym
uch
like
me
Lik
em
eSo
mew
hat
like
me
Alit
tlelik
em
eN
otlik
em
eN
otlik
em
eat
all
1.T
hink
ing
up..
..1
23
45
6V
alue
Item
#(a
ccor
ding
toits
orde
rin
the
ESS
ques
tionn
aire
)an
dw
ordi
ng(M
ale
vers
ion)
Mea
n(S
td.D
ev.)
Self
-dir
ectio
n(S
D)
1.T
hink
ing
upne
wid
eas
and
bein
gcr
eativ
eis
impo
rtan
tto
him
.He
likes
todo
thin
gsin
his
own
orig
inal
way
.2.
5(1
.2)
11.I
tis
impo
rtan
tto
him
tom
ake
his
own
deci
sion
sab
outw
hath
edo
es.H
elik
esto
befr
eeto
plan
and
notd
epen
don
othe
rs.
2.1
(1.1
)
Uni
vers
alis
m(U
N)
3.H
eth
inks
itis
impo
rtan
ttha
teve
rype
rson
inth
ew
orld
betr
eate
deq
ually
.He
belie
ves
ever
yone
shou
ldha
veeq
ualo
ppor
tuni
ties
inlif
e.2.
1(1
.0)
8.It
isim
port
antt
ohi
mto
liste
nto
peop
lew
hoar
edi
ffer
entf
rom
him
.Eve
nw
hen
hedi
sagr
ees
with
them
,he
still
wan
tsto
unde
rsta
ndth
em.
2.4
(1.1
)
19.H
est
rong
lybe
lieve
sth
atpe
ople
shou
ldca
refo
rna
ture
.Loo
king
afte
rth
een
viro
nmen
tis
impo
rtan
tto
him
.2.
2(1
.0)
Ben
evol
ence
(BE
)12
.It’s
very
impo
rtan
tto
him
tohe
lpth
epe
ople
arou
ndhi
m.H
ew
ants
toca
refo
rth
eir
wel
l-be
ing.
2.3
(1.0
)
18.I
tis
impo
rtan
tto
him
tobe
loya
lto
his
frie
nds.
He
wan
tsto
devo
tehi
mse
lfto
peop
lecl
ose
tohi
m.
2.0
(0.9
)

428 Davidov, Schmidt, and Schwartz
Tra
ditio
n(T
R)
9.It
isim
port
antt
ohi
mto
behu
mbl
ean
dm
odes
t.H
etr
ies
nott
odr
awat
tent
ion
tohi
mse
lf.
2.8
(1.3
)20
.Tra
ditio
nis
impo
rtan
tto
him
.He
trie
sto
follo
wth
ecu
stom
sha
nded
dow
nby
his
relig
ion
orhi
sfa
mily
.2.
7(1
.4)
Con
form
ity(C
O)
7.H
ebe
lieve
sth
atpe
ople
shou
lddo
wha
tthe
y’re
told
.He
thin
kspe
ople
shou
ldfo
llow
rule
sat
all
times
,eve
nw
hen
no-o
neis
wat
chin
g.3.
1(1
.4)
16.I
tis
impo
rtan
tto
him
alw
ays
tobe
have
prop
erly
.He
wan
tsto
avoi
ddo
ing
anyt
hing
peop
lew
ould
say
isw
rong
.2.
7(1
.3)
Secu
rity
(SE
C)
5.It
isim
port
antt
ohi
mto
live
inse
cure
surr
ound
ings
.He
avoi
dsan
ythi
ngth
atm
ight
enda
nger
his
safe
ty.
2.3
(1.2
)
14.I
tis
impo
rtan
tto
him
that
the
gove
rnm
ente
nsur
ehi
ssa
fety
agai
nsta
llth
reat
s.H
ew
ants
the
stat
eto
best
rong
soit
can
defe
ndits
citiz
ens.
2.4
(1.2
)
Pow
er(P
O)
2.It
isim
port
antt
ohi
mto
beri
ch.H
ew
ants
toha
vea
loto
fm
oney
and
expe
nsiv
eth
ings
.4.
1(1
.3)
17.I
tis
impo
rtan
tto
him
toge
tres
pect
from
othe
rs.H
ew
ants
peop
leto
dow
hath
esa
ys.
3.2
(1.4
)A
chie
vem
ent(
AC
)4.
It’s
impo
rtan
tto
him
tosh
owhi
sab
ilitie
s.H
ew
ants
peop
leto
adm
ire
wha
the
does
.3.
2(1
.4)
13.B
eing
very
succ
essf
ulis
impo
rtan
tto
him
.He
hope
spe
ople
will
reco
gniz
ehi
sac
hiev
emen
ts.
3.2
(1.4
)H
edon
ism
(HE
)10
.Hav
ing
ago
odtim
eis
impo
rtan
tto
him
.He
likes
to“s
poil”
him
self
.2.
9(1
.4)
21.H
ese
eks
ever
ych
ance
heca
nto
have
fun.
Itis
impo
rtan
tto
him
todo
thin
gsth
atgi
vehi
mpl
easu
re.
3.0
(1.4
)
Stim
ulat
ion
(ST
)6.
He
likes
surp
rise
san
dis
alw
ays
look
ing
for
new
thin
gsto
do.H
eth
inks
itis
impo
rtan
tto
dolo
tsof
diff
eren
tthi
ngs
inlif
e.3.
0(1
.4)
15.H
elo
oks
for
adve
ntur
esan
dlik
esto
take
risk
s.H
ew
ants
toha
vean
exci
ting
life.
3.9
(1.5
)
Measuring Values in the European Social Survey 429
Testing Invariance
When applying a theory and an instrument in different countries or over time,a key concern is to ensure that measurement of the relevant constructs isinvariant cross-nationally or over-time (Cheung and Rensvold 2000, 2002;Harkness, Van de Vijver, and Mohler 2003). The meaning of measurement in-variance is “Whether or not, under different conditions of observing and study-ing phenomena, measurement operations yield measures of the same attribute”(Horn and McArdle 1992, 117). If invariance is not tested, interpretations ofbetween-group comparisons are problematic (Vandenberg and Lance 2000).Absent invariance, observed differences in means or other statistics might re-flect differences in systematic biases of response across countries or differentunderstanding of the concepts, rather than substantive differences (Steenkampand Baumgartner 1998). Equally important, findings of no difference betweencountries do not ensure the absence of “real” differences.
MGCFA (Joreskog 1971) is among the most powerful techniques for testingmeasurement invariance.4 We draw upon the Steenkamp and Baumgartner(1998) procedural guidelines for assessing measurement invariance in cross-national studies with a confirmatory factor analysis (CFA) approach. We followa step-wise procedure from the least to the most demanding form of invariance.
The lowest level of invariance is “configural” invariance, which requiresthat the items in an instrument exhibit the same configuration of loadings ineach of the different countries (Horn and McArdle 1992). That is, the analysisshould confirm that the same items measure each construct in all countries inthe cross-national study.5 Configural invariance is supported if a single modelspecifying which items measure each construct fits the data well in all countries,all item loadings are substantial and significant, and the correlations betweenthe factors are less than one. The latter requirement guarantees discriminantvalidity between the factors (Steenkamp and Baumgartner 1998).
Configural invariance does not ensure that people in different countries un-derstand each of the items the same way. Although the same items form a factorthat represents each construct, the factor loadings may still be different acrosscountries. The next higher level of invariance, “measurement” or “metric” in-variance, assesses a necessary condition for equivalence of meaning. This level
4. Lubke and Muthen (2004) argue that an analysis of Likert data under the assumption ofmultivariate normality may distort the factor structure differently across groups. They proposefitting a model for ordered categorical outcomes. However, De Beuckelaer (2005) demonstratesin simulation studies that using Likert scales and skewed data does not significantly affect theprobability of incorrect conclusions in MGCFA. Moreover, the values scale has six categoriesrather than the usual five in Likert scales. Although the proportional odds model (POM) techniquehas more statistical power (low type II error) than MGCFA, recent studies suggest that POM hasan inflated type I error, and that MGCFA is more flexible (Welkenhuysen-Gybels and Billiet 2002;Welkenhuysen-Gybels 2004).5. The test allows sequentially adding cross-loadings if indicated by the program so long as thesame cross-loadings are allowed across all countries.

430 Davidov, Schmidt, and Schwartz
requires that the factor loadings between items and constructs are invariantacross countries (Rock, Werts, and Flaugher 1978). It is tested by restrictingthe factor loading of each item on its corresponding construct to be the sameacross countries. Measurement invariance is supported if this model fits thedata well in an MGCFA.
Configural and metric invariance are tested by examining information onlyabout covariation among the items. A third level of invariance is necessary tojustify comparing the means of the underlying constructs across countries. Thisis often a central goal of cross-national research. Such comparisons are mean-ingful only if the items exhibit “scalar” invariance (Meredith 1993; Steenkampand Baumgartner 1998). Scalar invariance signifies that cross-country differ-ences in the means of the observed items result from differences in the meansof their corresponding constructs. To assess scalar invariance, one constrainsthe intercepts of the underlying items to be equal across countries, and tests thefit of the model to the data.
In sum, meaningful comparison of construct means across countries requiresthree levels of invariance, i.e., configural, metric and scalar. Only if all theselevels of invariance are supported, can we assume that scores are not biased andconfidently carry out mean comparisons. We adopt a “bottom-up” test strategy,starting with the weakest constraints and proceeding to the most severe. Thisenables us to establish first whether even weak forms of invariance are absent.We test all countries together because theory implies that the measurementmodel should hold for them all.6
Data Analysis
The data analysis starts with 20 separate CFAs. This is followed by a simul-taneous MGCFA in order to assess configural invariance. We then modify themodel slightly, following the modification indices that are compatible withtheory, in order to specify an acceptable model that is invariant across the20 countries. Next, we conduct metric and scalar invariance tests. Finally, wetest for invariance of the structural covariances across countries (which is not anecessary condition for the comparison of means).
First, we computed a Pearson (product moment) intercorrelation matrix plusstandard deviations for each country. We then converted these into covariancematrices as input for estimating CFAs. We used pairwise deletion for miss-ing values because, with fewer than five percent missing values as observedhere, pairwise deletion is better than listwise and is adequate (see Brown1994; Schafer and Graham 2002).7 Correlations among the items ranged from
6. Several sources provide details on measuring invariance (e.g., Vandenberg and Lance 2000;Steenkamp and Baumgartner 1998; Cheung and Rensvold 2002; Vandenberg 2002; De Beuckelaer2005).7. Simulations demonstrate that results of pairwise deletion are robust when there are fewer than 5percent missing values and that the improvement of newer methods is minimal (Schafer and Graham

Measuring Values in the European Social Survey 431
negative for indicators of value constructs that are theoretically opposed tohighly positive for indicators of adjacent value constructs or of the same con-struct (see figure 1).
Our first question is: How well does the ESS human values scale measure the10 basic values in the Schwartz theory across the 20 countries? Byrne (2001,175–6) notes the importance of conducting single-group analyses prior to testsof multi-group invariance. We therefore began by performing separate CFAs ineach country on the a priori model of 10 values with their respective indicators.We used the Amos 6.0 software package in all of the analyses (Arbuckle 2005).The analyses revealed that all of the items had a factor loading of .4 or higheron their respective factors in each of the countries. However, in every country,at least two pairs of constructs were dependent on each other.
In order to solve the problem of the non-positive definite covariance matrices8
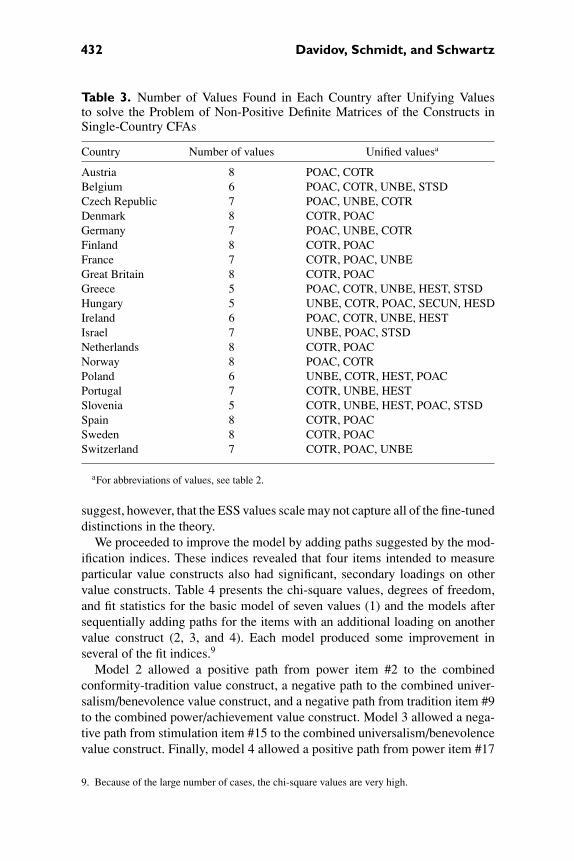
of the constructs, we unified the pairs of strongly associated values. Table 3reports the number of distinct values found in each country and lists the pairs ofvalues that were unified into one construct. After unifying strongly associatedvalue constructs, the formal test of dimensionality suggested that there werebetween five and eight distinct values in the different countries. Of the 71 pairsof value constructs that were unified across the 20 countries, 69 are pairs ofvalues that are adjacent in the value circle of the Schwartz theory (figure 1).Thus, they represent closely linked motivations and do not violate the theorizedcircular motivational structure. They do, however, suggest that the ESS valuesscale may not capture all of the fine-tuned distinctions in the theory.
We next tested for configural invariance across the 20 countries by computingthe CFA for all the countries simultaneously. We expected to find approximatelythe average number of distinguishable values found in the 20 separate countryanalyses. We started with the a priori model of 10 values with their respec-tive indicators. Three pairs of values were highly intercorrelated, power withachievement, conformity with tradition, and universalism with benevolence.This produced a problem of non-positive definite matrices of the constructs.The high intercorrelations indicated that the pairs of values were too close tobe modeled separately. We therefore unified each pair into a single construct toform seven distinct values that we tested in all subsequent analyses.
Figure 2 shows the model with the seven value constructs and the relationsbetween indicators and constructs. Note that the value constructs that wereunified represent values that are adjacent in the value circle of the Schwartztheory; each unified construct shares a broad basic motivational goal. Thus,these findings support the theorized circular motivational structure. They again
2002). Therefore, the gain from using full information maximum likelihood for the problem ofmissing values is minimal here. Comparing our results with the FIML procedure produced nodifferences in the unstandardized regression coefficients until the third place after the comma.8. The problem of non-positive definite covariance matrix of the constructs means that someconstructs are associated with each other so strongly that they cannot be separated.
432 Davidov, Schmidt, and Schwartz
Table 3. Number of Values Found in Each Country after Unifying Valuesto solve the Problem of Non-Positive Definite Matrices of the Constructs inSingle-Country CFAs
Country Number of values Unified valuesa
Austria 8 POAC, COTRBelgium 6 POAC, COTR, UNBE, STSDCzech Republic 7 POAC, UNBE, COTRDenmark 8 COTR, POACGermany 7 POAC, UNBE, COTRFinland 8 COTR, POACFrance 7 COTR, POAC, UNBEGreat Britain 8 COTR, POACGreece 5 POAC, COTR, UNBE, HEST, STSDHungary 5 UNBE, COTR, POAC, SECUN, HESDIreland 6 POAC, COTR, UNBE, HESTIsrael 7 UNBE, POAC, STSDNetherlands 8 COTR, POACNorway 8 POAC, COTRPoland 6 UNBE, COTR, HEST, POACPortugal 7 COTR, UNBE, HESTSlovenia 5 COTR, UNBE, HEST, POAC, STSDSpain 8 COTR, POACSweden 8 COTR, POACSwitzerland 7 COTR, POAC, UNBE
aFor abbreviations of values, see table 2.
suggest, however, that the ESS values scale may not capture all of the fine-tuneddistinctions in the theory.
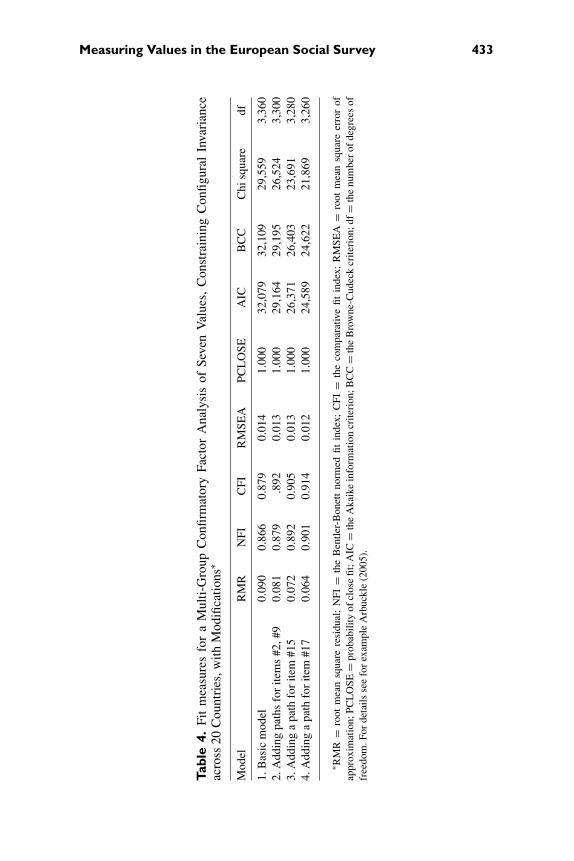
We proceeded to improve the model by adding paths suggested by the mod-ification indices. These indices revealed that four items intended to measureparticular value constructs also had significant, secondary loadings on othervalue constructs. Table 4 presents the chi-square values, degrees of freedom,and fit statistics for the basic model of seven values (1) and the models aftersequentially adding paths for the items with an additional loading on anothervalue construct (2, 3, and 4). Each model produced some improvement inseveral of the fit indices.9
Model 2 allowed a positive path from power item #2 to the combinedconformity-tradition value construct, a negative path to the combined univer-salism/benevolence value construct, and a negative path from tradition item #9to the combined power/achievement value construct. Model 3 allowed a nega-tive path from stimulation item #15 to the combined universalism/benevolencevalue construct. Finally, model 4 allowed a positive path from power item #17
9. Because of the large number of cases, the chi-square values are very high.
Measuring Values in the European Social Survey 433
Tabl
e4.
Fit
mea
sure
sfo
ra
Mul
ti-G
roup
Con
firm
ator
yFa
ctor
Ana
lysi
sof
Seve
nV
alue
s,C
onst
rain
ing
Con
figur
alIn
vari
ance
acro
ss20
Cou
ntri
es,w
ithM
odifi
catio
ns∗
Mod
elR
MR
NFI
CFI
RM
SEA
PCL
OSE
AIC
BC
CC
hisq
uare
df
1.B
asic
mod
el0.
090
0.86
60.
879
0.01
41.
000
32,0
7932
,109
29,5
593,
360
2.A
ddin
gpa
ths
for
item
s#2
,#9
0.08
10.
879
.892
0.01
31.
000
29,1
6429
,195
26,5
243,
300
3.A
ddin
ga
path
for
item
#15
0.07
20.
892
0.90
50.
013
1.00
026
,371
26,4
0323
,691
3,28
04.
Add
ing
apa
thfo
rite
m#1
70.
064
0.90
10.
914
0.01
21.
000
24,5
8924
,622
21,8
693,
260
∗ RM
R=
root
mea
nsq
uare
resi
dual
;N
FI=
the
Ben
tler-
Bon
ett
norm
edfit
inde
x;C
FI=
the
com
para
tive
fitin
dex;
RM
SEA
=ro
otm
ean
squa
reer
ror
ofap
prox
imat
ion;
PCL
OSE
=pr
obab
ility
ofcl
ose
fit;A
IC=
the
Aka
ike
info
rmat
ion
crite
rion
;BC
C=
the
Bro
wne
-Cud
eck
crite
rion
;df=
the
num
ber
ofde
gree
sof
free
dom
.For
deta
ilsse
efo
rex
ampl
eA
rbuc
kle
(200
5).

434 Davidov, Schmidt, and Schwartz
HE
ST
SD
UNBECOTR
SEC
POAC
ac1
d3
1
ac2
d4
1
he1
d5
1
1
he2
d6
1
st1 d71 1
st2 d81po1d1
11po2d2
1
sec1d2011
sec2d211
co1d1811
co2d191
tr1
d16
1tr2
d17
1be1
d14
1be2
d15
1
un1 d1111
un2 d121
sd1 d91
sd2 d101
un3 d131
1
Figure 2. A Confirmatory Factor Analysis with Seven Value Constructs.NOTE.—Broken lines indicate paths added subsequently based on the modifi-cation indices (see text). In order to set the metric for a factor, it is necessary tofix the factor loading of one of the indicators to one.
to the combined conformity/tradition value construct. These paths appear asbroken lines in figure 2.
Following these modifications, the various fit indices indicate a fit betweenthe model and the data that is satisfactory for not rejecting a model accordingto Hu and Bentler (1999); Marsh, Hau, and Wen (2004) (RMR = 0.06, NFI =0.90, CFI = 0.91, RMSEA = 0.01, PCLOSE = 1 and AIC and BCC lower thanin previous models). Hence, the configural invariance of the 7-factor modelcannot be rejected. That is, we can treat the specification of the items that indexeach of the seven factors as invariant across the 20 countries.
Interestingly, all the modifications introduced in models 2–4 entail addingpaths between single indicators and motivationally opposed latent factorsthat were formed by combining two value constructs. The negative paths in-dicate that the association between the opposing latent value constructs didnot capture all of the opposition for three items. The positive paths indicatethat these associations overestimated the opposition for two items. The needfor these modifications may be due to the reduction from 10 original factors

Measuring Values in the European Social Survey 435
to 7. For example, the unified power-achievement latent construct yielded anoverall association with the conformity-tradition construct that required addingpositive paths for the two power items. In the theorized motivational circle ofvalues, power is closer to conformity-tradition than achievement is. We wouldtherefore expect the power items to correlate less negatively with conformity-tradition than the achievement items with which they were combined. Perhaps,had the number of indicators in the ESS scale not been reduced to two perconstruct (three for universalism), permitting retention of all 10 factors, theadded paths would not have been necessary.
As noted, the ESS values scale captures the order of motivations postulatedby the value theory, but the CFAs do not support all of the fine-tuned dis-tinctions in the theory. On the other hand, multi-dimensional scaling analysesof the same values data in each of the countries do support these distinctions(Schwartz 2007). These analyses also yielded structures that correspond withthe theorized circular motivational structure of values. Moreover, in 15 of the 20countries, it was possible to partition the two-dimensional MDS (Multidimen-sional Scaling) space into distinct regions for each of the 10 values. Partitioningin the remaining countries yielded distinct regions for eight values and a jointregion for two values adjacent in the value circle. Whereas MDS focuses on thedifferences among items, CFA focuses on what they have in common. This mayexplain why CFA supports fewer distinctions. It is apparently more sensitiveto the very limited number of items per construct, especially because items in-tended to measure theoretically adjacent constructs are necessarily substantiallycorrelated.
We next turn to our second question: To what extent do the values thatare measured have equivalent meanings across countries? We address thisquestion by testing measurement or metric invariance in a second step ofthe analysis with MGCFA. This step constrains the factor loadings betweenthe indicators and the constructs in the model to be the same in all of thecountries. If the factor loadings are invariant, we can conclude that the meaningof the values, as measured by the indicators in the ESS, may be identical inthe 20 countries. Because configural invariance is a prerequisite for metricinvariance, we conducted this test on the model of seven value factors includingthe modifications made in the test of configural invariance (see broken lines infigure 2).
Table 5 summarizes the fit indices for sequentially more constrained models.The first row repeats the indices for the unconstrained, configural invariancemodel. The second row provides the indices for the metric invariance modelthat constrains the loadings of each item on its respective factor to be thesame in each of the 20 countries. These indices suggest a reasonable fit forthe metric invariance model too, a fit sufficient not to reject the model. Theincrease in AIC and BCC shows that one does better allowing variation inthe loadings, but the constrained model is quite good itself (Hu and Bentler1999; Marsh, Hau, and Wen 2004) (RMR = 0.08, NFI = 0.89, CFI = 0.91,

436 Davidov, Schmidt, and Schwartz
Tabl
e5.
Fit
Mea
sure
sfo
ra
Mul
ti-G
roup
Con
firm
ator
yFa
ctor
Ana
lysi
sof
Seve
nV
alue
s,C
onst
rain
ing
Met
ric
(Mea
sure
men
t),
Scal
ar,a
ndSt
ruct
ural
Cov
aria
nces
Inva
rian
ceac
ross
20C
ount
ries
∗
Mod
elty
peR
MR
NFI
CFI
RM
SEA
PCL
OSE
AIC
BC
CC
hisq
uare
df
1.U
ncon
stra
ined
:con
figur
alin
vari
ance
only
0.06
40.
901
0.91
40.
012
1.00
024
,589
24,6
2221
,869
3,26
02.
Met
ric
(mea
sure
men
t)in
vari
ance
0.07
50.
890
0.90
50.
012
1.00
026
,227
26,2
5124
,229
3,62
13.
Scal
arin
vari
ance
–∗∗0.
802
0.81
60.
016
1.00
045
,894
45,9
2143
,588
3,88
74.
Stru
ctur
alco
vari
ance
sin
vari
ance
0.11
50.
860
0.87
60.
013
1.00
031
,805
31,8
1630
,871
4,15
3
∗ RM
R=
root
mea
nsq
uare
resi
dual
;N
FI=
the
Ben
tler-
Bon
ett
norm
edfit
inde
x;C
FI=
the
com
para
tive
fitin
dex;
RM
SEA
=ro
otm
ean
squa
reer
ror
ofap
prox
imat
ion;
PCL
OSE
=pr
obab
ility
ofcl
ose
fit;A
IC=
the
Aka
ike
info
rmat
ion
crite
rion
;BC
C=
the
Bro
wne
-Cud
eck
crite
rion
;df=
the
num
ber
ofde
gree
sof
free
dom
.For
deta
ilsse
efo
rex
ampl
eA
rbuc
kle
(200
5).
∗∗T
heR
MR
inde
xis
notp
rovi
ded
byth
epr
ogra
mA
mos
whe
nm
eans
and
inte
rcep
tsar
ees
timat
ed.

Measuring Values in the European Social Survey 437
Table 6. Unstandardized Regression Coefficients for 20 Countries in the Mea-surement Invariant Model (All Coefficients are Significant, p < 0.01)
SD UNBE COTR SEC POAC HE ST
SD1 1.00SD11 0.87UN3 1.00UN8 1.14UN19 1.11BE12 1.03BE18 1.19TR9 0.87 −0.29TR20 0.85CO7 1.00CO16 1.11SEC4 1.00SEC15 0.99PO2 −0.50 0.03 1.00PO17 0.37 0.78AC4 1.19AC13 1.28HE10 1.00HE21 1.01ST6 1.00ST15 −0.99 1.35
The path coefficients added to the original model in the modification process are in bold. Emptycells represent no direct relation between the values and the indicators.
RMSEA = 0.01 and PCLOSE = 1.0).10 All factor loadings in the configurallyinvariant model are high, including those that are statistically differentacross countries. The statistical differences and similarities may supportpartial measurement invariance of some of the constructs in some countries.However, the constrained (metrically invariant) model is substantially moreparsimonious and meaningful than the model with only configural invariance,and it is reasonable to accept it (Little 1997).
Table 6 summarizes the invariant factor loadings between indicators and val-ues for the 20 countries in the metric invariance model. All the item loadings forthe metric invariance model are significant. Appendix reports the standardizedfactor loadings for each country separately. The items with added paths basedon the modification indices are at the bottom of the table.
The third step of the MGCFA tests for scalar invariance, a necessary condi-tion for comparing value means across countries. This step is augmented with
10. As the sample size is very large, we do not apply the chi-square difference test (Cheung andRensvold 2002).

438 Davidov, Schmidt, and Schwartz
mean-structure information (see Sorbom 1974; Sorbom 1978).11 It constrainsthe intercepts of the indicators in the model, in addition to the factor loadingsbetween the indicators and the constructs, to be the same in all of the 20 coun-tries. If the factor loadings and the intercepts are invariant, one can legitimatelycompare value means. Where scalar invariance holds, value means should becomputed as parameters of the Structural Equation Modeling (SEM) modeland not from composite scores calculated from the observed variables. Thisis because SEM controls for measurement errors of the observed indicators(Sorbom 1974).
The fit indices for the scalar invariance model suggest that one should rejectthis more restrictive model. The increase in AIC and BCC is very large, and bothCFI and NFI decrease substantially. Only PCLOSE and RMSEA suggest a goodfit (NFI = 0.80, CFI = 0.82, RMSEA = 0.02 and PCLOSE = 1.0). We thereforeconclude that the scale does not meet the requirements of scalar invariance. Inother words, one cannot use these data to compare priorities on all seven valuesacross the full set of 20 countries. However, partial scalar invariance may holdfor some or all of the values across subsets of countries.12 This would allowmean comparisons of these values across the countries in the subset (Byrne,Shavelson, and Muthen 1989; Steenkamp and Baumgartner 1998).
To illustrate, consider the subset of Denmark and Spain. To assess partialscalar invariance, we first set all intercepts to be equal in both countries(i.e., we constrain full scalar invariance). Then, following the modificationindices suggested by the program, we released the equality constraints forthe intercepts of the indicators TR9, CO16, UN3, BE18, and AC13. Thisresulted in an acceptable model fit (CFI = 0.92, NFI = 0.90, RMSEA =0.04, Pclose = 1.00), permitting mean comparisons of all seven values.13
The comparisons reveal that people in Spain attribute significantly moreimportance to power/achievement (mean difference 0.42), security (0.91),conformity/tradition (0.10), and universalism/benevolence (0.12) values. Bycontrast, Danish people attribute significantly more importance to hedonism(0.40) and self-direction (0.11) values. People in the two countries do notdiffer in their mean level of stimulation values.
Following similar procedures, one can find the items whose equality con-straints should be released to obtain partial scalar invariance across varioussubsets of countries. We found, for example, that it is legitimate to comparethe importance to Danes and to Belgians of all seven values. Partial scalar
11. This type of MGCFA is often referred to in the literature as Mean and Covariance Structure(MACS) modeling.12. In partial scalar invariance, the intercepts of at least two indicators per construct must beequal.13. In MGCFA, mean comparison of latent variables is done by setting the mean values of theconstructs to zero in one group and then estimating the mean difference in the other groups.Mean differences are on the original scale net of measurement error. Arbuckle (2005) providescomputation details. Alternatives are proposed by Little, Slegers and Card (2006).
Measuring Values in the European Social Survey 439
invariance also allows mean comparisons between Belgium and Spain for fivevalues (security, self-direction, power/achievement, conformity/tradition, anduniversalism/benevolence). Researchers interested in comparisons among par-ticular countries can test which values show full or partial scalar invariance forthose countries and may be compared. In sum, although one should not com-pare the seven values simultaneously across the 20 countries, one can comparemeans for some values across subsets of countries where scalar invariance orpartial scalar invariance hold.
As noted above, the value theory does not specify the distances of the valueconstructs from one another around the circle. As a further question, we askedwhether the pattern of distances is the same across countries. We tested thispossibility by constraining the covariances among the factors to be the same.The fourth row in table 5 reports the fit statistics for this model. The RMR andNFI fit indices indicate a relatively poor fit (RMR = 0.12, NFI = 0.86, CFI =0.88), and substantial increases in AIC and BCC also indicate a significant lossof fit. We reject therefore a model which postulates equivalence of structuralcovariances across countries. The relations among the seven values are notinvariant. The pattern of distances between the values is not the same in allcountries. This finding suggests that societal factors may influence the strengthof opposition and/or congruence among the different values.14
Discussion and Conclusion
The semi-annual ESS is a major source of data for researchers across the socialsciences. Its 21-item human values scale, designed to measure the full range ofdistinct, basic values in population surveys, has quickly attracted interest. Sixpresentations at the 1st European Association for Survey Research Conferencediscussed data using the scale. Given the interest in this new scale and itspotential use in surveys around the world, it is crucial to assess its validity.This article examined the fit of the ESS values instrument to the theory onwhich it was based. It then investigated the appropriateness of this instrumentfor studying values across 20 countries, using data from the first round of theESS. We addressed three questions:
(1)How well does the ESS human values scale measure the 10 basic valuesin the Schwartz theory?
(2)To what extent do the values that are measured have equivalent meaningsacross countries?
(3)To what extent can the values scale be used to compare latent means acrossthe 20 countries?
14. For example, using MDS to assess the value structure, Fontaine et al. (2008) find that theopposition of self-direction and universalism values to power and security values is greater insocieties with a more autonomous culture and with higher socio-economic development.

440 Davidov, Schmidt, and Schwartz
Separate CFAs in each country supported the adequacy of the ESS scalefor measuring the 10 values of the Schwartz theory. However, very high cor-relations between some pairs of values in these analyses and in the MGCFAacross countries caused a problem of non-positive definite covariance matrices.To solve this problem, we unified these pairs into single value constructs.This yielded seven distinct values in the MGCFA: security, self-direction,stimulation, hedonism and combined tradition/conformity, universalism/benevolence, and power/achievement values. We further modified the multi-group model by adding paths from four items to other constructs. This modelsupported the configural invariance of the seven value factors across the20 countries.
The three combined value constructs were formed by unifying values thatare adjacent in the value structure. Hence, the ESS human values scale cap-tures the motivational circle of values in the theory on which it is based. Theemergence of only seven distinguishable values may be a consequence of thefact that the ESS included only 21 items to measure all 10 value constructs,constructs that are correlated according to the theory. This compares with 40items in the full PVQ and 45 in the Schwartz Value Survey, both of whichdiscriminated the 10 values successfully (Schmidt et al. 2007); Schwartz andBoehnke 2004). As noted, MDS analyses of the ESS scale in 20 countries, anapproach less sensitive to high correlations among items, supported discrim-ination of the 10 value constructs (Schwartz 2007). Nonetheless, the currentanalyses suggest one can use the scale to measure only seven distinct values withconfidence.
The critical question for use of the values scale in different countries andfor comparing value relations in one country to those in another is whether thevalues it measures have similar meanings in each country. The test of mea-surement (metric) invariance addressed this question. It led to the conclusionthat the meaning of the values, as measured by the indicators of the ESS, isprobably the same in the 20 countries. Thus, the ESS human values scale, whenused to measure seven distinct values, meets the tests of configural and metricinvariance of the latent factors across countries. In spite of cultural differences,people in Europe appear to understand the meaning given to the values by theirindicators in a similar manner.15
The final question concerned the comparability of value means acrosscountries. The test of scalar invariance addressed this question. The scalefailed to exhibit scalar invariance across the 20 countries. Hence, one shouldnot compare the mean importance of the values across all 20 countries
15. The current research reveals the levels of configural, metric, and scalar invariance of theESS values instrument only in the countries studied here. One cannot generalize from this tofuture studies in these or other countries. Such studies should repeat the current analyses toreassess invariance. The statistical method presented here can establish necessary conditions forequivalence of meaning. Cognitive interviews offer a supplementary tool to assess the equivalenceof meaning of the value instrument in various countries.

Measuring Values in the European Social Survey 441
simultaneously. However, as illustrated for Denmark and Spain, one can com-pare means for values across subsets of countries where scalar invariance orpartial scalar invariance are found.
The findings of the current research justify employing the human value scalein survey research for numerous purposes. One can examine change in valuescores across time as an indicator of fundamental societal change in responseto historical, demographic, and social structural developments (e.g., impactson peoples’ basic values of wars, dropping birthrates, and inflation). Values,measured with the ESS scale may also be used to understand differences amongnational populations in their responses to government policies (e.g., towardimmigration) and to major events (e.g., terror attacks). Future studies mayalso address the way different values mediate the effects of individuals’ socio-demographic characteristics (e.g., age, education, occupation) on their attitudesand opinions (e.g., prejudice against out-groups, trust in institutions).
Because the human value scale demonstrates meaning equivalence acrosscountries, researchers can also legitimately assess and draw conclusions aboutsimilarities and differences in the relations of value priorities to other vari-ables across countries (Van de Vijver and Leung 1997; De Beuckelaer 2005,Ch. 5). Within country studies have shown many meaningful associations be-tween individuals’ value priorities and their attitudes (e.g., political preferences,left-right orientation, views on abortion, marriage, and religion) and behavior(e.g., voting, political activism, membership in voluntary organizations) (seesummaries in Schwartz 2005b, 2006a, 2007). Researchers can now test whetherthese and other patterns of value/attitude and value/behavior relations general-ize across countries. If they find differences between countries in relations ofvalue priorities to attitudes and behavior, the evidence for meaning equivalencemakes it legitimate to seek explanations for such country differences.16
Without establishing configural and metric invariance, as done in the currentresearch, none of the above applications of the ESS human values scale couldbe undertaken with confidence. This study provides the critical legitimacyfor such comparative work—evidence for equivalence of the meanings of thevalues across countries. As interdependence among nations increases, suchcomparative work becomes more and more important. Indeed, the problem ofmeaning equivalence applies to within country studies of diverse ethnic groupsas well. The current research can serve as an example of what needs to be doneto assess equivalence of meaning, rather than to assume it, as has been typicalin comparative survey research.
16. In studies that relate individuals’ values to other variables, it is crucial to correct in-dividual differences in use of the response scale, as explained in Schwartz (2003, 275)and Schwartz (2006a). The ESS website describes procedures for making this correction(http://www.europeansocialsurvey.org/).

442 Davidov, Schmidt, and Schwartz
App
endi
x:S
tand
ardi
zed
Fact
or
Lo
adin
gsan
dC
ross
Lo
adin
gsfo
rea
chC
oun
try
(Bas
edo
nth
eM
etri
cIn
vari
ance
Mo
del)
Item
Val
uefa
ctor
AT
BE
CH
CZ
DE
DK
ES
FIFR
GB
GR
HU
IEIL
NL
NO
PLPT
SESL
HE
10H
E0.
710.
680.
750.
760.
800.
690.
800.
820.
750.
770.
590.
600.
730.
760.
610.
760.
810.
800.
730.
68H
E21
HE
0.62
0.66
0.65
0.73
0.75
0.71
0.80
0.83
0.66
0.78
0.64
0.68
0.75
0.75
0.64
0.77
0.80
0.67
0.75
0.69
ST6
ST0.
720.
660.
610.
640.
660.
720.
680.
740.
630 .
700.
710.
600.
690.
690.
680.
740.
670.
730.
720.
64ST
15ST
0.92
0.79
0.79
0.86
0.84
0.96
0.91
0.89
0.83
0.92
0.80
0.74
0.91
0.84
0.89
0.98
0.87
0.93
0.95
0.74
PO2
POA
C0.
600.
590.
600.
660.
630.
560.
580.
670.
620.
660.
550.
590.
630.
490.
630.
660.
550.
590.
650.
52PO
17PO
AC
0.47
0.45
0.41
0.51
0.45
0.43
0.45
0.54
0.42
0.48
0.45
0.44
0.47
0.40
0.49
0.50
0.40
0.44
0.50
0.44
SEC
5SE
C0.
720.
660.
660.
610.
670.
600.
750.
650.
740.
610.
720.
700.
630.
560.
640.
620.
580.
680.
640.
61SE
C14
SEC
0.70
0.64
0.67
0.57
0.65
0.57
0.69
0.60
0.73
0.59
0.71
0.66
0.61
0.59
0.68
0.60
0.60
0.67
0.58
0.62
CO
7C
OT
R0.
610.
510.
530.
570.
590.
600.
540.
630.
550.
630.
460.
460.
600.
560.
590.
620.
600.
580.
590.
54C
O16
CO
TR
0.74
0.64
0.59
0.69
0.71
0.65
0.74
0.70
0.70
0.75
0.66
0.66
0.73
0.71
0.72
0.67
0.71
0.70
0.64
0.69
UN
3U
NB
E0.
600.
450.
420.
500.
470.
370.
620.
520.
510.
470.
580.
460.
560.
490.
490.
460.
550.
630.
540.
49U
N8
UN
BE
0.63
0.51
0.54
0.57
0.54
0.48
0.66
0.58
0.59
0.58
0.60
0.56
0.60
0.51
0.57
0.57
0.49
0.65
0.59
0.51
SD1
SD0.
680.
540.
470.
630.
600.
570.
680.
520.
510.
600.
650.
530.
540.
460.
530.
620.
530.
670.
580.
54SD
11SD
0.69
0.54
0.52
0.60
0.60
0.54
0.67
0.47
0.44
0.58
0.64
0.56
0.56
0.50
0.55
0.52
0.60
0.68
0.52
0.55
UN
19U
NB
E0.
670.
490.
520.
640.
550.
490.
660.
560.
580.
550.
660.
670.
590.
470.
560.
500.
620.
680.
540.
57A
C4
POA
C0.
710.
650.
610.
740.
690.
620.
670.
760.
660.
720.
670.
680.
720.
650.
700.
710.
640.
670.
710.
64A
C13
POA
C0.
770.
710.
690.
770.
750.
700.
760.
820.
700.
770.
720.
750.
770.
740.
790.
780.
740.
770.
790.
74T
R20
CO
TR
0.56
0.46
0.47
0.45
0.51
0.49
0.51
0.49
0.47
0.50
0.58
0.48
0.57
0.47
0.51
0.48
0.57
0.59
0.47
0.54
TR
9C
OT
R0.
570.
480.
520.
490.
550.
470.
580.
500.
560.
540.
480.
540.
540.
560.
470.
490.
460.
590.
520.
62B
E18
UN
BE
0.69
0.56
0.58
0.61
0.60
0.62
0.67
0.56
0.60
0.57
0.61
0.60
0.61
0.58
0.59
0.54
0.62
0.70
0.62
0.49
BE
12U
NB
E0.
680.
580.
560.
590.
590.
580.
720.
590.
610.
620.
650.
630.
640.
570.
610.
600.
620.
770.
640.
60T
R9
POA
C−0
.17
−0.1
8−0
.17
−0.2
0−0
.18
−0.1
5−0
.21
−0.1
9−0
.18
−0.1
8−0
.20
−0.2
0−0
.19
−0.1
6−0
.17
−0.1
7−0
.18
−0.1
9−0
.18
−0.1
9PO
2U
NB
E−0
.23
−0.1
6−0
.18
−.21
−0.2
0−0
.17
−.22
−0.2
0−0
.22
−0.2
1−0
.19
−0.2
2−0
.21
−0.1
7−0
.20
−.21
−.18
−.25
−0.2
3−0
.18
PO2
CO
TR
0.02
0.02
0.02
0.02
0.02
0.02
0.02
0.02
0.02
0.02
0.01
0.02
0.02
0.02
0.02
0.02
0.02
0.02
0.02
0.02
ST15
UN
BE
−0.4
2−0
.28
−0.3
0−0
.38
−0.3
6−0
.31
−0.4
0−0
.34
−0.4
0−0
.39
−0.3
2−0
.38
−0.3
8−0
.31
−0.3
7−0
.36
−0.3
2−.
43−0
.41
−0.3
3PO
17C
OT
R0.
250.
200.
210.
200.
230.
230.
200.
230.
210.
240.
180.
190.
220.
230.
220.
230.
170.
230.
230.
23
The
last
5ro
ws
indi
cate
the
path
coef
ficie
nts
adde
dto
the
orig
inal
mod
elin
the
mod
ifica
tion
proc
ess.

Measuring Values in the European Social Survey 443
References
Allport, Gordon W., Philip E. Vernon, and Gardner A. Lindzey. 1960. A Study of Values. Boston:Houghton Mifflin.
Arbuckle, James L. 2005. Amos 6.0 User’s Guide. Chicago, IL: SPSS.Barnea, Marina. 2003. Personal Values and Party Orientations in Different Cultures. Unpublished
doctoral dissertation, Israel: The Hebrew University of Jerusalem.Barnea, Marina, and Shalom H. Schwartz. 1998. “Values and Voting.” Political Psychology 19:17–
40.Billiet, Jaak. 2003. “Cross-Cultural Equivalence with Structural Equation Modeling.” In Cross-
Cultural Survey Methods, eds. J. A. Harkness, F. J. R. Van de Vijver, and P. Ph. Mohler, pp.247–64. New York: John Wiley.
Bollen, Kenneth A. 1989. Structural Equations with Latent Variables. New York: Wiley.Brown, Roger L. 1994. “Efficacy of the Indirect Approach for Estimating Structural Equation
Models with Missing Data: A Comparison of Five Methods.” Structural Equation Modeling1:287–316.
Burroughs, James E., and Aric Rindfleisch. 2002. “Materialism and Well-Being: A ConflictingValues Perspective.” Journal of Consumer Research 29:348–70.
Byrne, Barbara M. 2001. Structural Equation Modeling with AMOS. Basic Concepts, Application,and Programming. London: Lawrence Erlbaum Associates.
Byrne, Barbara, Richard J. Shavelson, and Bengt Muthen. 1989. “Testing for the Equivalenceof Factor Covariance and Mean Structures: The Issue of Partial Measurement Invariance.”Psychological Bulletin 105:456–66.
Caprara, Gian Vittorio, Shalom H. Schwartz, Cristina Capanna, Michele Vecchione, and ClaudioBarbaranelli. 2006. “Personality and Politics: Values, Traits, and Political Choice.” PoliticalPsychology 27:1–28.
Cheung, Gordon W., and Roger B. Rensvold. 2000. “Assessing Extreme and Acquiescence Re-sponse Sets in Cross-Cultural Research Using Structural Equations Modeling.” Journal ofCross-Cultural Psychology 31:187–212.
Cheung, Gordon W., and Roger B. Rensvold. 2002. “Evaluating Goodness-of-Fit Indexes forTesting Measurement Invariance.” Structural Equation Modeling 9:233–55.
Cohrs, J. Christopher, Barbara Moschner, Jurgen Maes, and Sven Kielmann. 2005. “Personal Valuesand Attitudes Toward War.” Peace and Conflict: Journal of Peace Psychology 11:293–312.
Converse, Philip E. 1964. “The Nature of Belief Systems in Mass Publics.” In Ideology andDiscontent, ed. D. Apter, pp. 206–61. New York: Free Press.
De Beuckelaer, Alain. 2005. Measurement Invariance Issues in International Management Re-search. PhD dissertation. Limburg: Limburgs Universitair Centrum.
Feldman, Stanley. 2003. “Values, Ideology, and Structure of Political Attitudes.” In Oxford Hand-book of Political Psychology, eds. D. O. Sears, L. Huddy, and R. Jervis, pp. 477–508. New York:Oxford University Press.
Fontaine, Johnny R. J., Ype H. Poortinga, Luc Delbeke, and Shalom H. Schwartz. 2008. “StructuralEquivalence of the Values Domain Across Cultures: Distinguishing Sampling Fluctuations fromMeaningful Variation.” Journal of Cross-Cultural Psychology 39: 345–65.
Halman, Loek, and Ruud deMoor. 1994. “Value Shift in Western Societies.” In The IndividualizingSociety: Value Change in Europe and North America, eds. P. Ester, L. Halman, and Ruud deMoor, pp. 1–20. Tilburg, the Netherlands: Tilburg University Press.
Harkness, Janet A., Fons J. R. Van de Vijver, and Peter Ph. Mohler (eds). 2003. Cross-CulturalSurvey Methods. New York: John Wiley.
Hitlin, Steven, and Jane Allyn Piliavin. 2004. “Values: Reviving a Dormant Concept.” AnnualReview of Sociology 30:359–93.
Horn, John L., and J. J. McArdle. 1992. “A Practical and Theoretical Guide to MeasurementInvariance in Aging Research.” Experimental Aging Research 18:117–44.

444 Davidov, Schmidt, and Schwartz
Hu, Litze, and Peter M. Bentler. 1999. “Cutoff Criteria for Fit Indexes in Covariance StructureAnalysis: Conventional Criteria Versus New Alternatives.” Structural Equation Modeling 6:1–55.
Joreskog, Karl G. 1971. “Simultaneous Factor Analysis in Several Populations.” Psychometrika36:409–26.
Kluckhohn, Clyde K. M. 1951. “Values and Value Orientations in the Theory of Action.” In Towarda General Theory of Action, eds. Talcott Parsons, and Edward Shils. Cambridge, MA: HarvardUniversity Press.
Knutsen, Oddbjørn. 1995. “Party Choice.” In The Impact of Values, eds. J. W. van Deth, and E.Scarborough, pp. 460–91. New York: Oxford University Press.
Little, Todd D. 1997. “Mean and Covariance Structures (MACS) Analyses of Cross-Cultural Data:Practical and Theoretical Issues.” Multivariate Behavioral Research 32:53–76.
Little, Todd D., David W. Slegers, and Noel A. Card. 2006. “A Non-arbitrary Method of Identifyingand Scaling Latent Variables in SEM and MACS Models.” Structural Equation Modeling 13:59–72.
Lubke, Gitta H., and Bengt O. Muthen. 2004. “Applying Multigroup Confirmatory Factor Modelsfor Continuous Outcomes to Likert Scale Data Complicates Meaningful Group Comparisons.”Structural Equation Modeling 11:514–34.
Marsh, Herbert W., Kit-Tai Hau, and Zhonglin Wen. 2004. “In Search of Golden Rules: Commenton Hypothesis-Testing Approaches to Setting Cutoff Values for Fit Indexes and Dangers inOvergeneralizing Hu and Bentler’s (1999) Findings.” Structural Equation Modeling 11:320–41.
Meredith, William. 1993. “Measurement Invariance, Factor Analysis and Factorial Invariance.”Psychometrika 58:525–43.
Miller, Warren E., and J. Merrill Shanks. 1996. The New American Voter. Cambridge, MA: HarvardUniversity Press.
Rock, Donaid A., Charles E. Werts, and Ronald L. Flaugher. 1978. “The Use of Analysis ofCovariance Structures for Comparing the Psychometric Properties of Multiple Variables acrossPopulations.” Multivariate Behavioral Research 13:403–18.
Rohan, Meg J. 2000. “A Rose by Any Name? The Values Construct.” Personality and SocialPsychology Review 4:255–77.
Rokeach, Milton. 1973. The Nature of Human Values. New York: Free Press.Schafer, Joseph L., and John W. Graham. 2002. “Missing Data: Our View of the State of the Art.”
Psychological Methods 7:147–77.Schmidt, Peter, Bamberg, Sebastian, Davidov, Eldad, Herrmann, Johannes, and H. Schwartz
Shalom. 2007. “Wie lassen sich Werte messen? Validierung des neuen Messinstruments ‘Por-traits Value Questionnaire’.” Zeitschrift fur Sozialpsychologie 38(4):249–63.
Schultz, P. Wesley, and Lynette Zelezny. 1999. “Values as Predictors of Environmental Attitudes:Evidence for Consistency across 14 Countries.” Journal of Environmental Psychology 19:255–65.
Schwartz, Shalom H. 1992. “Universals in the Content and Structure of Values: Theoretical Ad-vances and Empirical Tests in 20 Countries.” Advances in Experimental Social Psychology25:1–65.
Schwartz, Shalom H. 1994. “Are there Universal Aspects in the Content and Structure of Values?”Journal of Social Issues 50:19–45.
Schwartz, Shalom H. 2003. A Proposal for Measuring Value Orientations across Nations. Chapter7 in the ESS Questionnaire Development Report. http://www.europeansocialsurvey.org.
Schwartz, Shalom H. 2005a. “Basic Human Values: Their Content and Structure Across Countries.”In Valores e Comportamento nas Organizacoes [Values and Behavior in Organizations], eds.A. Tamayo, and J. B. Porto, pp. 21–55. Petropolis, Brazil: Vozes.
Schwartz, Shalom H. 2005b. “Robustness and Fruitfulness of a Theory of Universals in Individ-ual Human Values.” In Valores e comportamento nas organizacoes [Values and Behavior inOrganizations], eds. A. Tamayo, and J. B. Porto, pp. 56–95. Petropolis, Brazil: Vozes.

Measuring Values in the European Social Survey 445
Schwartz, Shalom H. 2006a. “Basic Human Values: Theory, Measurement, and Applications.”Revue Francaise de Sociologie 47:249–88.
Schwartz, Shalom H. 2006b. “A Theory of Cultural Value Orientations: Explication and Applica-tions.” Comparative Sociology 5:137–82.
Schwartz, Shalom H. 2007. “Value Orientations: Measurement, Antecedents and Consequencesacross Nations.” In Measuring Attitudes Cross-Nationally – Lessons from the European SocialSurvey, eds. Roger Jowell, Caroline Roberts, and Rory Fitzgerald, pp. 161–93. London: Sage.
Schwartz, Shalom H., Gila Melech, Arielle Lehmann, Steven Burgess, Mari Harris, and VickiOwens. 2001. “Extending the Cross-Cultural Validity of the Theory of Basic Human Valueswith a Different Method of Measurement.” Journal of Cross Cultural Psychology 32:519–42.
Schwartz, Shalom H., and Klaus Boehnke. 2004. “Evaluating the Structure of Human Values withConfirmatory Factor Analysis.” Journal of Research in Personality 38:230–55.
Sorbom, Dag. 1974. “A General Method for Studying Differences in Factor Means and FactorStructure between Groups.” British Journal of Mathematical and Statistical Psychology 27:229–39.
Sorbom, Dag. 1978. “An Alternative to the Methodology for Analysis of Covariance.” Psychome-trika 43:381–96.
Spini, Dario, and Willem Doise. 1998. “Organizing Principles of Involvement in Human Rights andtheir Social Anchoring in Value Priorities.” European Journal of Social Psychology 28:603–22.
Steenkamp, Jan-Benedict E. M., and Hans Baumgartner. 1998. “Assessing Measurement Invariancein Cross National Consumer Research.” Journal of Consumer Research 25:78–90.
Vandenberg, Robert J. 2002. “Towards a Further Understanding of and Improvement in Measure-ment Invariance Methods and Procedures.” Organizational Research Methods 5:139–58.
Vandenberg, Robert J., and Charles E. Lance. 2000. “A Review and Synthesis of the Measure-ment Invariance Literature: Suggestions, Practices and Recommendations for OrganizationalResearch.” Organizational Research Methods 3:4–69.
Van de Vijver, Fons J. R., and Kwok Leung. 1997. “Methods and Data Analysis of ComparativeResearch.” In Handbook of Cross-Cultural Psychology, eds. J. W. Berry, Y. H. Poortinga, andJ. Pandey, pp. 257–300. Chicago, IL: Allyn and Bacon.
Welkenhuysen-Gybels, Jerry. 2004. “The Performance of Some Observed and Unobserved Con-ditional Invariance Techniques for the Detection of Differential Item Functioning.” Quality &Quantity 38:681–207.
Welkenhuysen-Gybels, Jerry, and Jaak Billiet. 2002. “A Comparison of Techniques for DetectingCross-Cultural Inequivalence at the Item Level.” Quality & Quantity 36:197–218.
Williams, Robin M., Jr. 1968. “Values.” In International Encyclopedia of the Social Sciences, ed. Edward Sills. New York: Macmillan.
Zaller, John R. 1992. The Nature and Origins of Mass Opinion. Cambridge, UK: CambridgeUniversity Press.
