the mean : a measure of centre the mean (often referred to as the average). mean = sum of values...
TRANSCRIPT
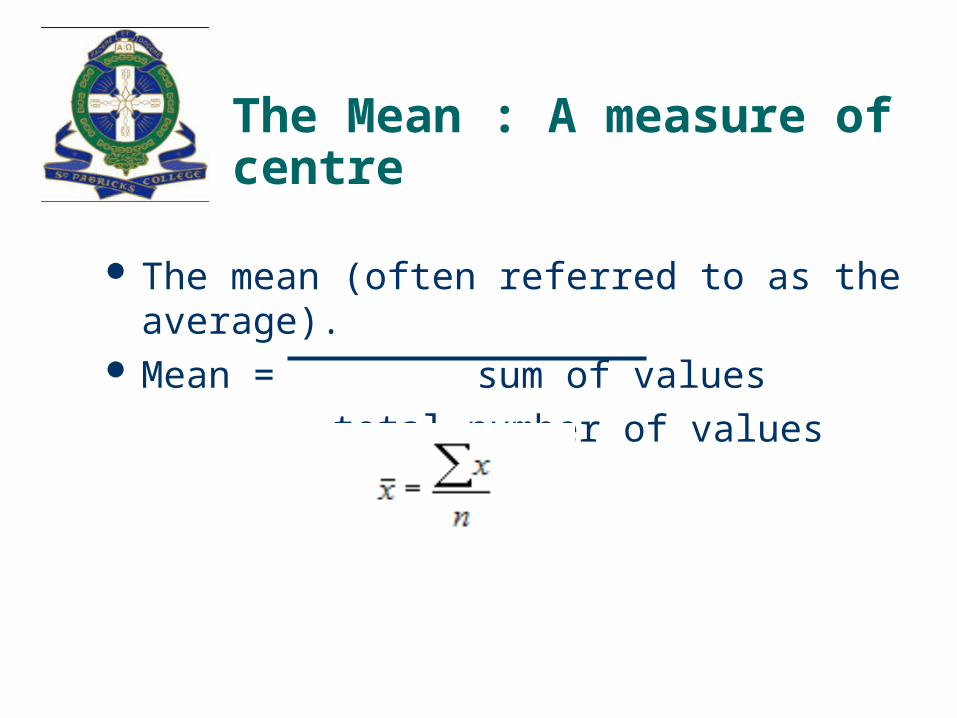
The Mean : A measure of centre
The mean (often referred to as the average). Mean = sum of values
total number of values

Calculate the mean of the following numbers
4 6 7 8 9 11
The mean
= 45 = 6
7.5
14 20 25 30 32 133

The mean
1 2 3 3 2 3 4 5 7 8 3 0 1 3 8 4 5 6 0
Calculator display

Choosing between the mean and the median
mean = median = mode =

Choosing between the mean and the median
mean = median = mode =

Choosing between the mean and the median
mean = median = mode =

Choosing between the mean and the median
When the data is symmetrical and there are no outliers, either the mean or the median can be used to measure the centre
When the data is clearly skewed and/or there are outliers, the median should be used to measure the centre.
Exercise 3A Pages 59-60 Questions 1-8

The Standard Deviation : A measure of Spread about the Mean
To measure the spread of data about the mean, the standard deviation is used.
The formula for the standard deviation is
Calculate the standard deviation for the following numbers 46 7 8 9 11
Calculator display
2

Estimating the Standard Deviation
The standard deviation is approximately equal to the range divided by 4.
Exercise 3B Pages 63-64 Questions 1 - 7

The normal distribution
Ball drop

The 68%, 95%, 99.7% rule for normal distributions
x

The 68%, 95%, 99.7% rule for normal distributions

The 68%, 95%, 99.7% rule for normal distributions

The 68%, 95%, 99.7% rule for normal distributions

The 68%, 95%, 99.7% rule for normal distributions
2.35%2.35%
0.15%0.15%13.5%13.5%

Example
The heights of 200 boys was found to be normally distributed with a mean of 180 cm and a standard deviation of 10 cm.
68% of the heights will lie between 95% of the heights will lie between 99.7% of the heights will lie between

Example
What percentage of the heights will lie between 180 cm and 190 cm?
What percentage of the heights will lie below 200 cm? What percentage of the boys will have a height
between 160 cm and 190 cm? How many boys should have a height above 190 cm?
Exercise 3C Pages 69-70 Questions 1-5

Z scores ( standardised scores)
Two students compare their scores for a test for two different subjects. One student scored 73 out of 100 for an English test. The other student scored 65 out of 100 for a Mathematics test. Which student performed better?

Z scores ( standardised scores)The plot thickens
Unbeknownst to the students the results for the English test were normally distributed with a mean of 80 and a standard deviation of 5. The results for the Mathematics test were normally distributed with a mean of 60 and a standard deviation of 8. Which student now performed better?
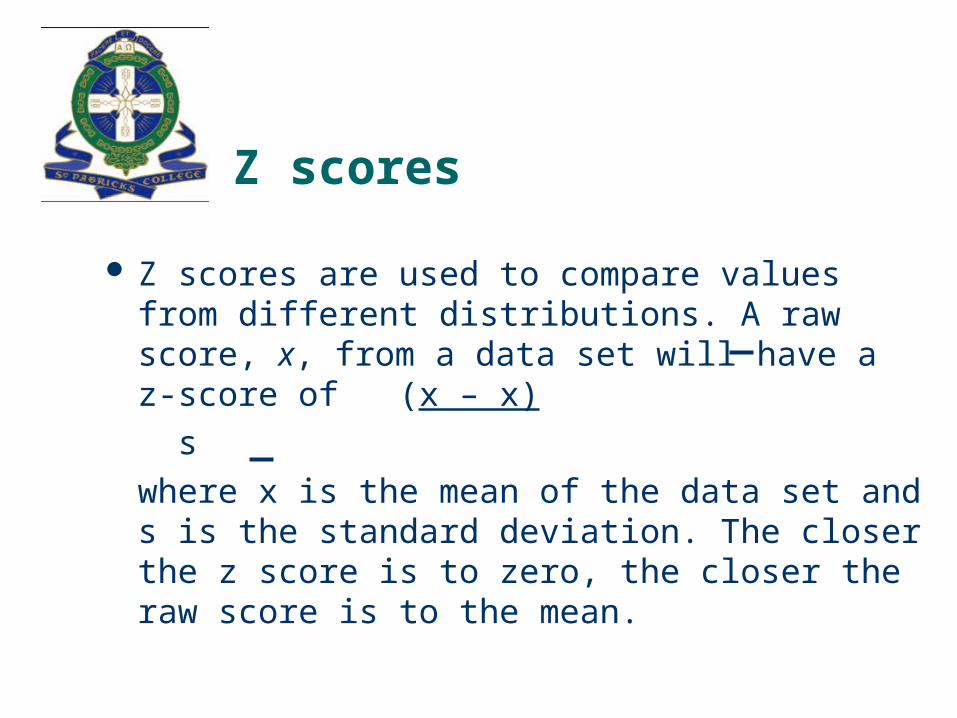
Z scores
Z scores are used to compare values from different distributions. A raw score, x, from a data set will have a z-score of (x – x)
s
where x is the mean of the data set and s is the standard deviation. The closer the z score is to zero, the closer the raw score is to the mean.
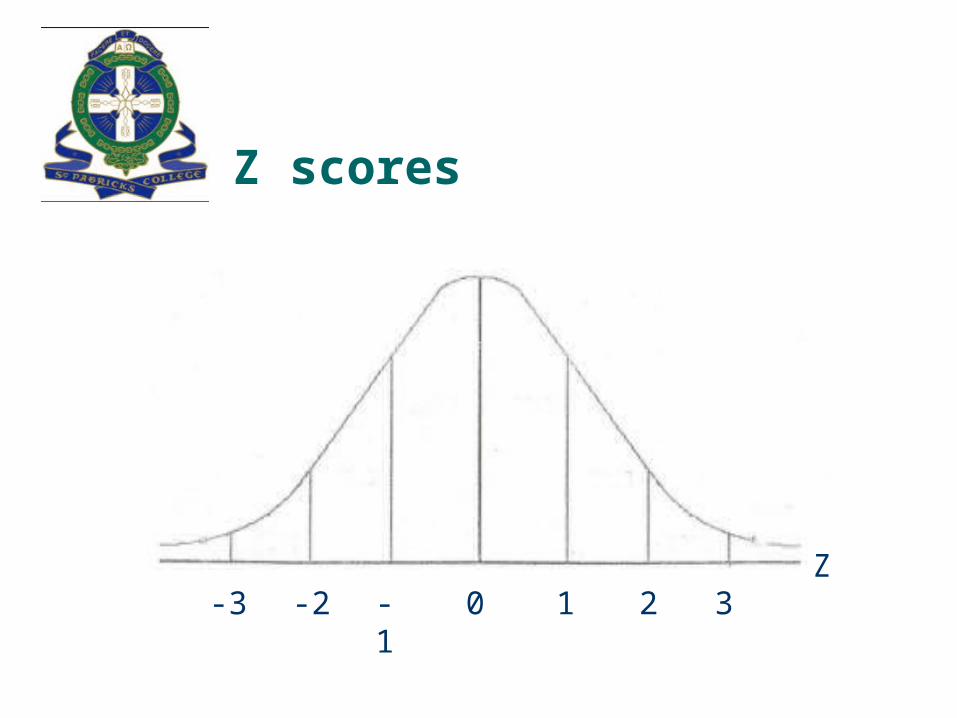
Z scores
Z0-3 -2 -1 1 2 3

Z scores
English z = (73 – 80) = - 7 = - 1.2
5 5
Maths z = (65 – 60) = 5 = 0.625
8 8

Questions
Exercise 3D Page 72 Questions 1-2

Generating a random sample
Draw numbers out of a hat A spinner Select every 2nd or 3rd person Use technology

Using your calculator to generate a simple random sample
TI 89 Rand(25) will generate numbers from 1 to 25
Calculator demonstration

Displaying and calculating the summary statistics for grouped data using a calculator
Handspan (mm)
Frequency
200- 1
210- 6
220- 8
230- 2
240- 1
250- 1