the 515nm electrochromic absorption … · the 515nm electrochromic absorption change and...
TRANSCRIPT

THE 515NM ELECTROCHROMIC ABSORPTION CHANGE
AND PHOTOSYNTHETIC ELECTRON TRANSPORT
LINDA BEATRICE GIORGI
A thesis submitted to the University of London for the degree of Doctor of Philosophy
January 1984- Imperial College
Department of Pure and Applied Biology London

2
ABSTRACT
The factors controlling the generation of the fast (phase a) and
slow (phase b) rises of the flash-induced 515nm electrochromic absor
ption change (AA^j.) in chloroplasts have been investigated.
Redox potentiometric titrations indicate that phase a (complete
in < ms) is apparent over the redcx potential span of the initial
photochemical reactions of photosystems 1 and 2. Three waves in
the low potential titration of phase a with 7 5 °f +60mV, -190mV
and < -4-OOmV can be detected. From the insensitivity to the inhibi
tor DCMU, it is proposed that the species with E „ r of -190mVm , /. 5and < -4-OOmV are both related to photosystem 1. A much slower phase,
which occurs in the millisecond time domain, can be detected at positive
redox potentials. It is enhanced in amplitude over the +100mV redox
potential range, in which the plastoquinone pool is chemically re
duced, but is attenuated at redcx potentials in which the cytochrome
b-563 is reduced. Changes in the amplitude of both phase a and phase
b are incurred upon the destacking of the thylakoid grana.
To determine the underlying mechanism generating phase b, flash-
induced studies of the and of the cytochrome b -563 and cytoch
rome f redox reactions, have been carried out, using different reduc-
tants and under different salt conditions. These indicate that phase
b can be correlated with cytochrome b-563 re oxidation, via a Q-cycle
type mechanism. This conclusion is further supported by studies of the
effect of electron transfer inhibitors on phase b, and their effect on
cytochrome redox changes and proton uptake/release.
ACKNOWLEDGEMENTS
I would like to thank Prof. James Barber, my supervisor, for
introducing me to the fascinating world of photosynthesis, for his
help and encouragement throughout the course of this work, and for
his constructive comments during the preparation of this thesis.
I am indebted to Dr. Nigel Packham for many useful and stimulat
ing discussions, for his time and interest and for his constant
encouragement. I would also like to thank him for his many construc
tive comments on the manuscript.
I am grateful for many other useful discussions with various members
of the ARC Photosynthesis group but in particular I would like to thank
Drs. Lars Olsen, Alison Telfer, Bob Ford and Barry Rubin. I also ac
knowledge the invaluable technical support of Jchn De-Felice and Kathy
Wilson.
I thank my family and David for their constant encouragement through
out the course of this project and for their patience during the writing
up period.
My thanks to Lyn Barber for her help with the diagrams and to
Patrizia Stanzione for her careful typing of the manuscript.
Finally, I would like to thank the University of London for their
financial support.

CONTENTS 1
Abstract
Ac knowledge merits
List of figures
List of tables
Symbols and Abbreviations 22
1 Introduction 15
1.1
1.2
1.3
1.1
1.5
1.6
The overall conceptStructure and function of the photosynthetic membrane1.2.1 Components of the thylakoid membrane1.2.2 Organization of components within the thylakoid
membrane1.2.3 Functional consequences resulting from the organi
zation of the thylakoid membraneElectron transport mechanisms involving the cytochrome b^/f complex1.3.1 Properties of quinol oxidation1.3.2 The Q-cycle and the alternative b-cycle1.3.3 Inhibitors1.3.4- Cyclic electron transportMeasurement of the electric field by electrochromism1.4- .1 Detection by electr ochromism1.4- .2 Kinetic and spectral characteristics of flash-induced
electrochromic absorption changes1.4- .3 Consequences of simple electr ochromic theory1.4- .4- Electr ochromic absorption changes induced by steady-
state light1.4- .5 Electr ochromic absorption changes induced by extrinsic
electric field transients1.4- .6 Calibration of the flash-induced electric field1.4- .7 Limitations of the electrochromic methodElectrical events indicated by the flash-induced electr ochromic absorption change: the fast phaseElectrical events indicated by the flash-induced electro- chromic absorption change: the slew phase
151717
21
21
26
26
323739104-0
u15
18
515253
55
58

5
1.6.1 Properties of the slow phase 581.6.2 Conditions required for the generation of the
slow phase 601.6.3 Possible interpretations of the slow phase 61
1.7 Objectives of this thesis 64-
2 Materials and Methods 66
2.1 Chloroplast preparation 66
2.1.1 Preparation of Class I intact chlcroplasts 66
2.1.2 Determination of chlorophyll 672.2 Flash-induced absorption measurements 68
2.2.1 Apparatus 68
2.2.2 Flash-induced 515nm electrochromic absorptionchange s 70
2.2.3 Flash-induced cytochrome and P700 absorption changes 712.2.4- Redox titrations of the flash-induced 515nm
absorption change 712.2.5 Flash-induced proton uptake from the outer
aque ous phase 772.2.6 Flash-induced proton release into the inner
aqueous phase 782.3 Steady state chlorophyll fluorescence measuremsnts 79
3 The electr ochr omic properties of the 515nm absorptionchange 81
3.1 Physical features of the 515nm absorption change 813.2 Evidence for the electrochromic nature of the AA-,^ 8351o3.3 Localized and delocalized electric fields 913.4- Discussion 94-
4. Redox potentiometric titrations of the 515nm absorptionchange 97
4-.1 The salt dependence of the 515nm electr ochr omic shift 974-.2 Redox potential titrations of phase a 1014-.3 Redox potential titrations of phase b H I4-. 4- Discussion H 3

6
5 The electrochromic absorption change related to electrontransport 123
5.1 A comparative study of the AA^*. with different re-ductants 323
5.2 Dithionite induced electron transport 1285.3 Ferredoxin/NADPH induced electron transport 14-35.4- Duroquinol induced electron transport 1505.5 Ascorbate/DCPIP induced electron transport 1535.6 Discussion 155
6 The electr ochr omic absorption change related to protonuptake/release 163
6.1 The effect of pH on the AA^^ and cytochrome absorption changes 163
6.2 Plash-induced proton uptake 1666.3 Plash-induced proton release 1726.4- Discussion 179
7 Inhibitor studies 183
7.1 Inhibitor effects on the AA,.nr 1835157.2 Inhibitor effects on cytochromes b-563 and f 1857.3 Inhibitor effects on proton uptake/release 1917.4- Discussion 195
8 Summary and final discussion 2 01
References 215
7
16
18
23
27
28
33
4-2
U
50
57
69
75
82
LIST OF FIGURES
The Z-scheme
Schematic representation of the protein complexes of photosynthesis arranged as required for electron and proton transport
A model for the distribution of the thy la ko id complexes within the thylakoid membrane
Six of the nine possible redox and protonation states of quinones in solution
Possible mechanisms of reduction of cytochrome c by quinols: the electron- and proton - transfer mechanisms
Possible schemes for the Q- and b-cycles
Schematic representation of the principle of electro- chr omism
Time course of the fie Id-indicating absorption change; and scheme of the electric events on the thylakoid membrane, with the electrica1 analogue
Schematic drawing of the electric potentials of the thylakoid membrane before and after steady illumination
Topology of electrogenic and protolytic reactions in chr omat oph ore s
Schematic diagram of the single-beam flash spectrophotometer
The Nernst curves for one- and two-electron redox couples; and the theoretical E^/pH relationship
Flash-induced under pseudocyclic conditions, withdithionite as reductant; to resolve the extent and kinetics of phase a and phase b

3.2 Semilogarithmic plots of the kinetics of phase aand phase b 84-
3.3 To induce phase a and phase b of the flash-inducedwith dithionite, in DCMU-treated chloroplasts 86
3.4- Spectra of phase a and phase b of the flash-induced 88
3.5 Titrations of the flash-induced AA,-. . with valinomycin,and at different actinic light intensities 89
4-.1 The salt-induced fluorescence increase 98
4.. 2 The effect of different salt concentrations on the flash-induced AA^^, under pseudocyclic conditions with dithionite as reductant 100
4-.3 Redox titrations of the flash-induced AAr-_, detectedtipat 3ms, for stacked thylakoid membranes 102
4-.4- pH dependence of the E^ for the low potential componentof phase a 106
4.. 5 Redcx titrations of the flash-induced AAc-._, detectedpipat 3ms, for unstacked thylakoid membranes 108
4-. 6 Redox titration of the flash-induced AA-., detectedpipat 10ms, for stacked thylakoid membranes 112
4-.7 Redox titrations of phase b, under different conditions H4-
4-.8 pH dependence of the for the high potential andlow potential components of phase b 116
5.1 The flash-induced AA-..- obtained in the presence ofdifferent reductants 124-
5.2 Titration of the flash-induced AA_-.r with dithionite 129515
5.3 The effect of different concentrations of MV on theflash-induced AA^^ obtained under pseud ocyclic conditions, with dithionite as reductant 130
8
9
131
132
134
139
144
146
148
151
152
154
156
Spectra of phase a and the delayed slow rise of theflash-induced AA--C515
The effect of different salt concentrations on the flash-induced under conditions for a delayedslow rise
Flash-induced spectra through the cytochrome a-band region, under pseudocyclie conditions, with dithionite as reductant, and at different MV concentrations
Flash-induced electrochromic and cytochrome AA, under pseudocyclic conditions, with dithionite as reductant, and for stacked/unstacked thylakoid membranes
Flash-induced AA*. . under pseudocyclic conditions, with Fd/NADPH as reductant, for stacked/unstacked thylakoid membranes, and in the absence and presence of MV
Flash-induced electrochromic and cytochrome AA, under the conditions of Fig. 5.8
The effect of pH on the flash-induced electrochromic and cytochrome AA under pseudocyclic conditions, with Id/NADPH as reductant, and in the presence of MV
Flash-induced AA^^ under pseudocyclic conditions, with DQH^ as reductant (at different concentrations) and for stacked/unstacked thylakoid membranes
Flash-induced electrochromic and cytochrome AA under the conditions of Fig. 5.11
Flash-induced electrochromic and cytochrome AA under pseudocyclic conditions, with Asc/DCPIP as reductant
Flash-induced electrochromic and cytochrome AA under pseudocyclic conditions, with DQH^ as reductant, and in the presence of Asc/DCPIP
10
6.1 pH titration of the flash-induced AA^^ under pseu-docyclic conditions, with dithicnite as reductant I64.
6.2 The effect of pH on the flash-induced electrochr omicand cytochrome AA, under the conditions of Fig. 6.1 165
6.3 Flash-induced proton uptake AA, under various conditions 167
6.4 pH titration of the calibrated extent of the protonuptake AA, and estimated H+/P700 ratios 170
6.5 Flash-induced P700 AA, under various conditions 171
6 .6 Flash-induced proton release AA: the effect of imidazole and nigericin 173
6.7 Flash-induced proton release AA in the presence ofthe reductant Fd/NADPH 17A
6 .8 Flash-induced proton release AA in the presence of the reductant DQH^
7.1 The effect of inhibitors on the flash-induced AA_>-515under pseudocyclic conditions, with DQH^ as reductant
7.2 Titration of the flash-induced AA d it ions of Fig. 7.1, with UHDBT
515' under the con-
178
184
186
7.3 Titration of the flash-induced AA_n_, under the con-51?d it ions of Fig. 7.1, with antimycin 187
7.4 The effect of inhibitors on the flash-induced cytochrome b-563 AA, under the conditions of Fig. 7.1 188
7.5 The effect of inhibitors on the flash-induced cytochrome f AA, under the conditions of Fig. 7.1 189
7.6 The effect of inhibitors on the flash-induced protonuptake AA, under similar conditions to those of Fig. 7.1 192

11
7.7 The effect of inhibitors on the flash-induced proton release AA, under similar conditions to those of Fig. 7.1 193
8.1 A modified Q-cycle mechanism in chloroplasts 211
LIST OF TABLES
1.1 Estimated Eq values for couples of plastcquinol-1 in ethanol 30

SYMBOLS AND ABBREVIATIONS
Asc ascorbate
ATP adenosine triphosphate
BChl ba c ter i och 1 or ophy 1 1
BSA bovine serum albumin
Chi chlorophyll
C.R. eresol red
cyt. cytochrome
DAD 2 ,3,5,6-tetramethyl-p-phenylenediamine
DBMIB 2 ,5-dibromo-3-methyl-6-isopropyl-p-benzoqui' none
DC MU 3- (3 , k -d ich lor opheny 1 ) - 1 ,1 -d ime thy lurea
DCPIP 2 ,6-dichlorophenolindophenol
DNP-INT 2 -iodo-6-isopropyl-3-methy 1 -2 ' , trinitrodiphenyl ether
dqh2 dur oquinol
hA absorption change
A£ extinction coefficient
ambient redox potentialambient redox potential

Em,7.5 midpoint redox potential (at pH 7.5)
m ferredoxin
FeS iron-sulphur centre
HEPES N-2 -hydroxyethylpiperazine-N '-2 -ethanesul- phcnic acid
HQNO 2-heptyl-4.-hydrcxyquinoline N-oxide
X wavelength
MES 2 -(N-morph olino)ethane sulph onic ac id
MV methyl viologen
NADP+ nicotinamide adenine dinucleotide phosphate
NADPH reduced NADP+
N.R. neutral red
P680 reaction centre of PS2
P700 reaction centre of PS1
PC plastocyanin
PQ, PQK2 , PQH-, PQH*" plastcquinone, plastcquinol, plastosemi- quinone, anionic plastosemiquinone
PS photosystem ( 1 or 2 )
RFeS
Tr ic ine
Rieske iron-sulphur centre
N-tr is (hydr oxy me thy 1 ) me thy lgly c ineTr ic ine

u
Tris tr is (hydr oxy me thy 1 ) me thy la mine
UHDBT 5-(n-undecyl)-6-hydroxy-!,7-dioxobenz othiaz ole

15
CHAPTER 1
Introduction
1 . 1 The overall concent:
Photosynthesis is the process by which plants and bacteria convert
light energy to chemical energy. During the light-driven reactions
of green plants, which take place in and across the chloroplast thy-+
lakoid membrane, oxygen is evolved from water, NADP is reduced and
ATP is synthesized. These reactions are followed by a second series
of reactions, which are independent of light, during which NADPH and
ATP are used to power the assimilation and reduction of carbon dioxide
to the level of carbohydrate.
The current understanding of the light reactions of photosynthesis has
developed from the concept of two photosystems interacting in series
to drive electrons and protons from water to NADP+. This idea was
originally proposed by Hill and Bendall (i960). Their scheme, the
familiar Z-scheme, is based on the relationship of the various photo
synthetic components in terms of their redox potentials and has re
ceived considerable support from a very wide range of experimental
data. An updated version of the Z-scheme is given in Fig. 1.1
A modification of the Z-scheme, which takes into account the
organization of the components within the thy lakoid membrane, was
required in the chemiosmotic hypothesis of Mitchell (1961). This
hypothesis provides a logical explanation for the mechanism by which
photosynthetic electron flow is coupled to photophosphorylation.

PS1
-1000
-500
eh 0
mV
500
1000
1500L
PS2
2H90
X'A.B
P700/ ATo
P700*
hv
hv
Fig. 1.1. The Z-scheme, in which the components of photosynthetic electron transport are placed on a redox scale.The major protein complexes involved are drawn as blocks. OEC, oxygen evolving complex; PS2, photosystem 2 complex; cyt b^-f complex, cytochrome b^-f complex; PSI, photosystem I complex; Sq, s ., s , s , s , s-states for water oxidation; b-559^, high potential cytochrome b-559; Ph, pheo- phytin; Aq, A^, X, postulated PSI electron acceptors of unidentified chemical identity; A, B, iron-sulphur centres; other symbols as in Symbols and Abbreviations.

Of importance is that the electron transport components are necessari
ly assymmetrically located across the thylakoid membrane such that
their cooperative interactions not only bring about the reduction
of NADP+, but also cause a vectorial transport of protons. The elec
trochemical potential gradient thus generated is then able to power
the synthesis of ATP, via the coupling factor enzyme.
The work presented in this thesis is concerned with the light
reactions of photosynthesis. It concentrates particularly on the
electric field generated across the chloroplast thylakoid membrane,
due to the vectorial charge separation at the reaction centre of each
photosystem, upon light activation. Detailed analyses of the properties
of the electric field (Witt, 1971; 1979) have already led to a consider
able amount of information concerning the distribution of molecules
within the membrane, proton translocation and photopho’sphorylation.
In this study, the properties of the electric field are further examined
in order to probe, and hence elucidate more clearly, the mechanism and
control of the photosynthetic electron transport chain.
1.2 Structure and function of the photosynthetic membrane:
1.2.1 Components of the thylakoid membrane:
The components involved in light-harvesting, electron transport
and proton translocation can be arranged into five major membrane-
spanning complexes, three of which are directly involved in electron
transport, see Fig. 1.2
The photosystem 2 (PS2) complex contains the reaction centre chloro
phyll P680, together with a core of antenna chlorophyll a (Anderson, 1980).

stroma H*
inside
Fig. 1.2. Schematic representation of the protein complexes of photosynthesis, arranged as required for electron flow and proton translocation. (Taken from Anderson and Andersson, 1982).
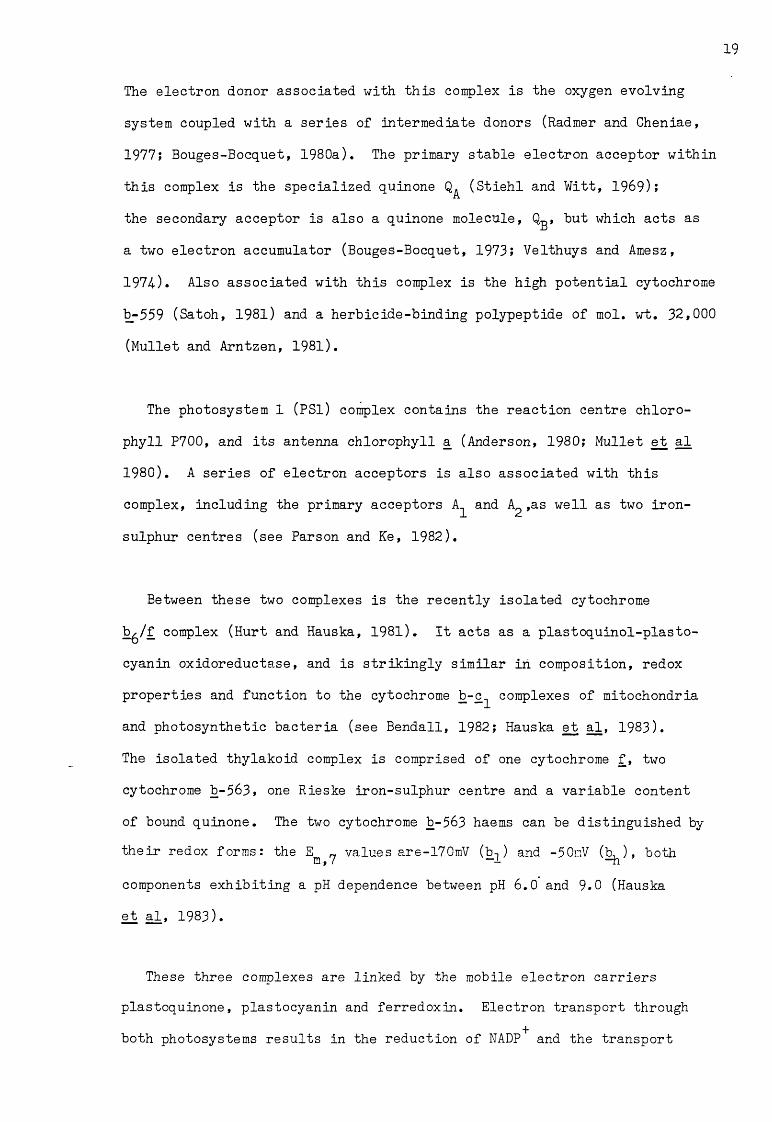
The electron donor associated with this complex is the oxygen evolving
system coupled with a series of intermediate donors (Radmer and Cheniae,
1977; Bouges-Bocquet, 1980a). The primary stable electron acceptor within
this complex is the specialized quinone (Stiehl and Witt, 1969);
the secondary acceptor is also a quinone molecule, Qg, but which acts as
a two electron accumulator (Bouges-Bocquet, 1973; Velthuys and Amesz,
1971). Also associated with this complex is the high potential cytochrome
b_-559 (Satoh, 1981) and a herbicide-binding polypeptide of mol. wt. 32,000
(Mullet and Arntzen, 1981).
The photosystem 1 (PSl) complex contains the reaction centre chloro
phyll P700, and its antenna chlorophyll a (Anderson, 1980; Mullet et al
1980). A series of electron acceptors is also associated with this
complex, including the primary acceptors A^ and A^ ,as well as two iron-
sulphur centres (see Parson and Ke, 1982).
Between these two complexes is the recently isolated cytochrome
b^/f complex (Hurt and Hauska, 1981). It acts as a plastoquinol-plasto-
cyanin oxidoreductase, and is strikingly similar in composition, redox
properties and function to the cytochrome b-c^ complexes of mitochondria
and photosynthetic bacteria (see Bendall, 1982; Hauska et al, 1983).
The isolated thylakoid complex is comprised of one cytochrome f, two
cytochrome b-563» one Rieske iron-sulphur centre and a variable content
of bound quinone. The two cytochrome b-563 haems can be distinguished by
their redox forms: the E n values are-170mV (b-,) and -50nV (b, ), bothm, / —1 -hcomponents exhibiting a pH dependence between pH 6.0 and 9.0 (Hauska
et al, 1983).
These three complexes are linked by the mobile electron carriers
plastoquinone, plastocyanin and ferredoxin. Electron transport through
both photosystems results in the reduction of NADP+ and the transport
19
of protons from the outside to the intrathylakoid space. This proton
gradient is used by a fourth complex, the ATPase complex, for making
ATP. This complex consists of a hydrophobic component CFq , which acts
as a proton conducting channel across the membrane, and a peripheral
coupling factor CF^ (see McCarty and Carmeli, 1982).
The fifth complex, the light-harvesting chlorophyll protein (LHCP)
complex, has no catalytic activity itself; its primary function is to
capture solar energy and efficiently transfer the excitation energy
to the specialized membrane bound chlorophyll reaction centre. It
contains up to half the total chlorophyll a and nearly all the chloro
phyll b molecules (Thornber, 1975; Thornber and Barber, 1979). Since
it is specifically associated with PS2, it is termed LHCP2. Recent
evidence, however, suggests that another form of light-harvesting com
plex, with low chlorophyll b content, is associated with PS1 (Woolman
and Bennoun, 1982); this has been designated LHCP1 (Brauman et al, 1982).
These supramolecular complexes are highly organized within the fluid
lipid bilayer of the thylakoid membrane. An important feature of these
thylakoid membranes is that they are arranged in such a way as to have
distinguishable inner and outer surfaces: this is essential for the
production of electrical and chemical gradients across their structure
in order to drive the synthesis of ATP. A further important feature
of the thylakoid membrane is that it differentiates into stacked (granal
or appressed) and unstacked (stromal or non-appressed) regions (Coombs
and Greenwood, 1976). The outer membrane surfaces of the two regions
are thus different: only the stroma thylakoids and the end membranes
and margins of the grana stacks are in direct contact with the chloro-
plast stroma while the closely appressed membranes of the grana have

21
limited contact with the stroma. As will be discussed below, such a
structural differentiation is accompanied by a functional differentiation.
1.2.2 Organization of components within the thylakoid membrane:
Much of the information concerning the organization of components
within the thylakoid membrane has been obtained from fractionation studies.
The stromal lamellae and granal stacks can be separated by mechanical
and detergent fractionation procedures (Anderson and Boardman, 1966;
Boardman, 1970). Analyses of these fractionated membranes, together with
freeze-fracture studies and fluorescence studies of excitation energy
distribution between the two photosystems, has led to a variety of
models for the organization of components within the thylakoid membrane
(Seely, 1973; Thornber, 1975; Butler, 1978 ). However, only recently,
with the introduction of an aqueous polymer two-phase partition technique
for separating fragmented thylakoid membranes (Andersson et al, 1981),
has concrete experimental evidence been provided for the lateral and
transverse organization of components within the thylakoid membrane.
The technique resolves out two membrane vesicle populations from thylakoid
membranes: one exhibiting normal right-side-out properties while the
other is turned inside-out, as judged by reversed proton and electrical
gradients and by freeze-fracture electronmicroscopy (Andersson et al,
1981). In order to explain how the inside-out vesicles had been formed,
Andersson (1978) has argued that they are specifically derived from the
appressed membranes of the grana.
Analysis of these inside-out vesicles, in combination with electro
phoretic methods, (Andersson and Anderson, 1980) has indicated that
most of the photosystem 2 and light-harvesting complexes are located in the
stacked thylakoid membrane regions. On the other hand, studies using right-
side-out vesicles (Andersson and Haehnel, 1982), have provided evidence that

these vesicles, which are derived from stroma exposed thylakoids con
tain mainly photosystem 1 and ATP synthetase complexes. An extreme
lateral separation of PS2 from PS1 had also been suggested by Barber
(19 8 0, 198 2) based on considerations of electrical surface charge diff
erences between appressed and non-appressed lamellae and on a detail
ed analysis of salt induced chlorophyll fluorescence changes.
The location of the cytochrome b^/f complex, within the thylakoid
membrane, has been more controversial. Fragmentation studies suggest
that, in contrast to the lateral assymmetry of the two photosystems
and the ATP synthetase, the cytochrome b^/f complex is uniformly dis
tributed between the two different thylakoid regions (Cox and Anderss-
on, 1981). Recently, however, another possible site for its location
has been suggested. In view of the electrical charge properties of
both the cytochrome b^/f complex itself and particular thylakoid mem
brane regions, it has been suggested (Barber, 1983a) that the complex is
located at the boundaries between the appressed and non-appressed regions.
Support for this model also derives from the recent detergent-aided
isolation of partition membranes (Berthold et al, 1982) which have high
O^-evolving capacity but contain no cytochrome b^/f complex. A model
for the distribution of the thylakoid complexes between appressed and
stroma-exposed thylakoids, with the cytochrome b^/f complex located at
the boundaries, as discussed above, is depicted in Fig. 1.3.
Initial evidence for the vectorial arrangement of electron transport
carriers, within the thylakoid membrane (see Fig. 1.2), resulted from
analyses of the properties of the light-induced electric field (Witt,
1975). It was suggested that the electron donor sites for both PS1 and
PS2 were located towards the inner thylakoid surface and the electron

norvappressed membrane
oppressed grana membrane
margin—non-oppressed stroma membrane
O LHCP-PS2 pigment protein # PS1 pigment protein
^ coupling factor (CFj ♦ CF0) Q cyt bg-f protein
Fig. 1.3. A model for the distribution of the thylakoid complexes between appressed and stroma-exposed thylakoid membranes, with the cytochrome b^/f complex located at the boundaries between the appressed and non-appressed regions. (Taken from Barber, 1983a).
acceptors at the outer surface. Such an orientation is required to
explain vectorial electron transport by each photosystem and the
inward direction of proton pumping.
Recently, however, further evidence for this transverse assymmetry
has resulted from studies using both inside-out and right-side-out
thylakoid membrane vesicles. Reconstitution studies and analyses of
the accessibility of specific reductants and inhibitors (Andersson et
al, 1 9 8 1) have provided further evidence in support of the hypothesis
that the water-splitting enzyme is located at the inner thylakoid sur
face. Also, it has been shown that the extrinsic protein plastocyanin
is loosely bound to the inner thylakoid membrane (Haehnel et al, 1981)
and that the light-harvesting chlorophyll protein complex is indeed a
membrane-spanning complex (Andersson et al, 1982).
1.2.3 Functional consequences resulting from the organization of the
thylakoid membrane:
There are two main functional consequences resulting from the extreme
lateral assymmetry of the protein complexes between appressed and stroma
exposed thylakoids. One involves electron transport between laterally
separated components and the other transfer of light energy between the
two photosystems.
Since the protein complexes involved in electron transport are not
uniformly distributed between appressed and non-appressed regions, this
emphasizes the necessity of long range diffusional processes for electron
transport to occur. It has thus been proposed (Anderson, 1982; Anderson
and Andersson, 1982) that plastoquinone acts as the mobile carrier in

transporting electrons from the photosystem 2 complex to the cyto
chrome b^/f complex. The transfer of electrons from the cytochrome
b^/f complex, whether it be located in the non-appressed or appress-
ed regions, to nearby photosystem 1 complexes in the non-appressed
thylakoids, is suggested to be facilitated by the extrinsic protein
plastocyanin, possibly by diffusing laterally while attached to the
inner membrane surface (Anderson, 1982; Anderson and Andersson, 1982;
Haehnel, 1982). Cyclic electron flow around PS1 involving the cyto
chrome b^/f complex would require the diffusion of ferredoxin along
the outer membrane surface . Changes in the lateral spatial relationship
of these protein complexes (Barber, 1980) could result in an alter
ation of the balance between cyclic and non-cyclic electron flow. Also,
changes in the fluidity of the lipid matrix of the thy la ko id membrane
could affect the rate of electron transport by affecting the diffusional
rates of the mobile electron carriers (Ford and Barber, 1983).
Concerning the transfer of light energy between the two photosystems,
the large distances separating the complexes tends to hinder efficient
energy transfer. One possible mechanism to regulate this distribution
of light energy between the two photosystems has recently been suggest
ed by Barber (1982; 1983a; 1983b). Phosphorylation of some of the PS2
light-harvesting complexes (Bennett, 1977; Allen ejb al, 1981) would
increase their net negative charge, thereby causing them to move
from the appressed to the non-appressed membrane regions. This would
affect the relative distribution of light to the two photosystems by
allowing more of the light harvesting complex to interact with the
photosystem 1 complex. Recent evidence suggests (Haworth et al,
1982; Horton, 1983) that during the phosphorylation process,
in vivo, movement of the light-harvesting chlorophyll a/b protein

26
does occur. Hence, lateral separation of the two photosystems, in
combination with phosphorylation, would be one way for the controlled
regulation of light energy distribution between the two photosystems.
1.3 . Electron transport mechanisms involving the cytochrome b^/f complex:
1.3.1 Properties of quinol oxidation:
Quinols play an essential role in the reduction of cytochromes in
vivo. The reduced and oxidized forms of the quinol/quinone couple
differ by two electrons and two protons. This inevitably means that
semiquinones (resulting from single electron redox reactions) are in
volved in the reaction mechanism, as well as a variety of protonated
species. Of the nine theoretically possible species in the quinol/
quinone system (see Rich and Bendall, 1979) , the six shown in Fig. 1.4-
are of most importance in biochemical systems. Determination of the
characteristic potentials of these redox couples enables definition of
equilibrium positions, and can often be useful in the determination of
rates of redox reactions (Rich and Bendall, 1980b). With this, exten
sive studies have been carried out to determine the mechanism of quinol
oxidation by cytochromes (Yamazaki and Ohnishi, 1966; Rich and Bendall,
1979; 1980b). At low pH,it has been found (Rich and Bendall, 1979;
1980b) that the oxidation of benzoquinol by mammalian cytochrome c can
take place by two possible mechanisms: the electron transfer mechanism
or the H-atom transfer mechanism, depicted in Fig. 1.5 (a) and (b),
respectively. In both mechanisms, the rate-limiting step is the transfer
of the first reducing equivalent from the quinol to cytochrome c, with the
transfer of a second equivalent from the semiquinone following rapidly.
By examining the effect of ionic strength on the reaction rate of each
mechanism (one of the reactants is uncharged in the case of the H-atom
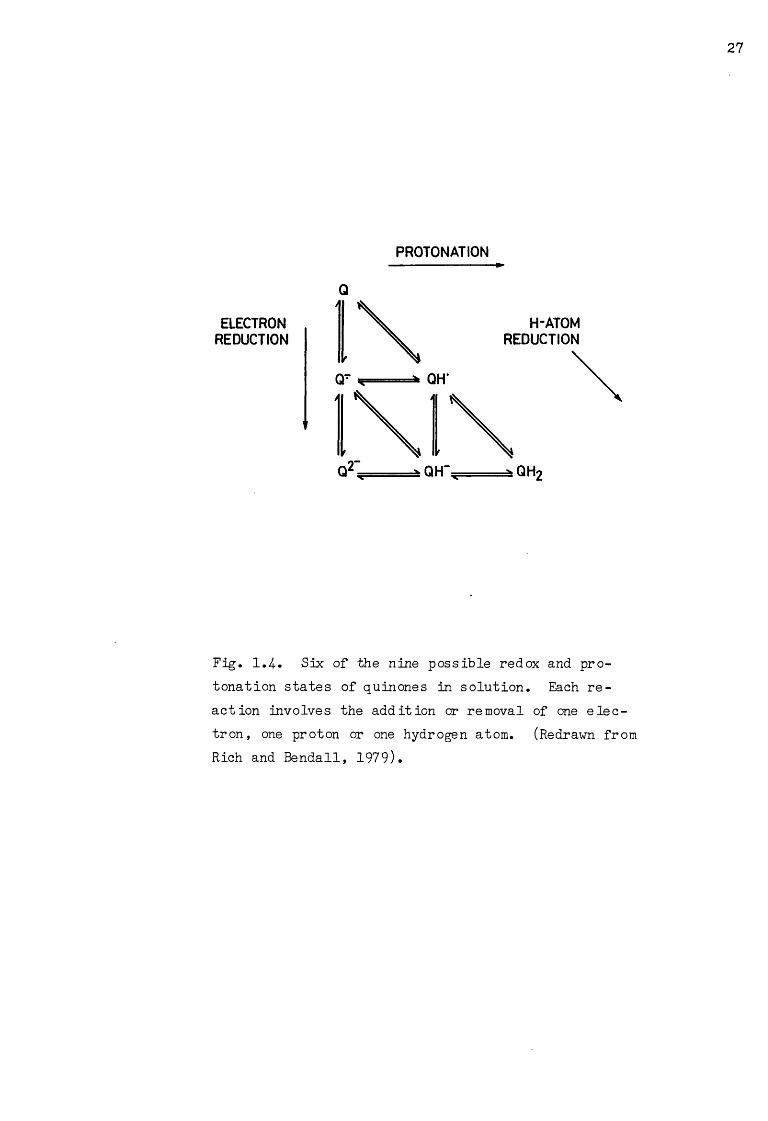
PROTONATION
ELECTRONREDUCTION
Fig* 1*4. Six of the nine possible redox and protonation states of quinones in solution. Each reaction involves the addition or removal of one electron, one proton or one hydrogen atom* (Redrawn from Rich and Bendall, 1979).

(a) (b)
Overall: QH2*2H*cytfi3* -------- - Q ♦ 2H*cyU2**2H*
Fig. 1.5. Possible mechanisms of reduction of cytochrome c by quinols at acid pH. (a) Electron-transfer mechanism,(b) H-atom transfer mechanism. Machanism a is preferred, as discussed in the text. (Redrawn from Bendall, 1982).

transfer) it was found that the electron transfer mechanism was most
favoured.
Other possible evidence that such an electron transfer mechanism,
rather than an H-atom transfer, operates for quinol oxidation in chloro-
plasts, comes from a comparison of the midpoint redox potential, E ,
values of the various quinol/quinone couples shown in Table 1.1, with
the E n values of cytochrome b-563 and the Rieske FeS centre, -lOOmVm, / —(Rich and Bendall, 1980a) and +290mV (Malkinand Aparicio, 1975), res
pectively. This indicates that it is the Eq values of the QH*/QH
and Q/Q* couples that correlate with the E values of the Rieske FeSmcentre and cytochrome b-563, respectively. Thus, a possible scheme for
quinol oxidation in chloroplasts, which incorporates an electron-trans
fer mechanism, is as shown below. The species involved in H+ release
are also indicated.
cyt bQx cyt bred
Experimentally, Q* has been detected by EPR in mitochondrial prepara
tions, thus suggesting the couples involved in electron transport to
be Q/Q*~ and QH^/Q* (Ohnishi and Trumpower, 1980). Note, the work
done by Rich and Bendall (1979, 1980b) has been carried out in pro
tonic solvents where Q* stability would be poor.
Apart from these mechanistic features of quinol oxidation, the de
gree to which quinol/quinone molecules are bound or mobile is also of
importance. Classically, models for mitochondrial electron flow based
upon the presence of a diffusible pool of ubiquinone molecules were
proposed (Kroger and Klingenberg, 1973). More recently, however,

Couple n E (mV) 0
Electron Transfers
Q/Q"' 1 -165
Q,'/Q2" 1 -19 6
q/q2‘ 2 -181
QH-/QH' 1 +239
H-atom transfer
Q/QH- 1 +190
Q-'/QH* 1 +575
Q/QH" 2 +383
QH'/QH2 1 +870
q /qh2 2 +530
Table 1.1 Estimated E^ values for couples of plastoquinone- 1 in
ethanol (sources of data are given in Rich and Bendall, 1980b).

evidence has suggested, instead, a role for large numbers of
protein bound quinone (Yu and Yu, 1981). Inlinewith this, Bouges-
Bocquet (1981a) has proposed, in chloroplasts, that both the primary
acceptor of PS2, Q^, and the secondary acceptor Qg are bound quinone
molecules. Also, Bouges-Bocquet (1981b) has proposed the existence
of a third bound form of quinone, U, that acts as the immediate donor
to the cytochrome b^/f complex, in a fashion analogous to that of com
ponent Z postulated in the cyclic electron transport system of bacterial
chromatophores (Prince and Dutton, 1977; Dutton and Prince, 1978);
she suggests that direct electron flow can occur more rapidly between
two bound quinones, namely Qg and U, than via the diffusible piasto-
quinone pool.
A way of reconciling these two extreme views on the degree of bind
ing of quinol/quinone molecules has been suggested by Rich (1981).
In his model, the pool contains a relatively large number of mobile
diffusible quinone and quinol molecules. The electron donor and
acceptor molecules may possess quinone or quinol molecules which are
loosely bound, in the manner of enzyme-substrate intermediates; these
molecules then equilibrate with the pool by association or dissociation
reactions. Experimental evidence for such a dissociable intermediate
has come from investigations of the inhibition properties of DCMU and
other herbicides (Velthuys, 1981; Bowes & Crofts, 1981). These led
to the proposal that the mechanism of inhibition was that of com
petition at the site of the secondary acceptor of PS2, Q~, between Q-D Band the inhibitor, thus invoking Qg as a dissociable intermediate.
The primary acceptor Q^, on the other hand, probably remains firmly
bound, and has a highly stabilized semiquinone: although quinones

usually display two electron redox react ions,when associated with the
reaction centre iron, their redox reactions are modified such that they
display only single electron reduction. Concerning the immediate donor
of the cytochrome b^/f complex, U, and in view of the model proposed by
Rich (1981) above, it has been suggested (Bendall, 1982) that U could
be regarded as an intermediate enzyme substrate complex as well. The
rate-limiting step in plastoquinol oxidation would then be the binding
of quinol to an acceptor site, possibly the Rieske FeS protein (see
Trumpower, 1981),to form U. Oxidation of U would be relatively rapid
provided an oxidized acceptor was available. The only problem with this
suggestion, though, is whether the semiquinone subsequently formed, would
need to be released from its binding site in order to reduce cytochrome
b-563. Such PQ binding sites on the cytochrome b^/f complex have indeed
been identified by photoaffinity labelling studies (Oettmeier et al, 1982)
1.3.2 The Q-cycle and the alternative b-cycle:
Various models have been put forward to explain both (a) the mechan
ism by which quinol oxidation occurs with the concomitant release of
protons into the inner membrane space and (b) the involvement of a
quinone species, nominally a semiquinone, in both the reduction and
oxidation of a b-type cytochrome.
The model which has received most attention to date is Mitchell’s
(1976) "protonmotive quinone cycle" or "Q-cycle". However, an alterna
tive model to this is Wikstrom’s "b-cycle" (Wikstrom and Krab, 1980;
Wikstrom et al, 1981). Versions of both of these models are depicted
in Fig. 1.6 (a) and (b), respectively. Supportive evidence for the
role of such a cycle comes from the observation of the oxidant-induced
reduction of cytochrome b. This reaction was initially observed in

a) Q -C Y C L E
outside 2H*
°A
P680
inside
b) b -C Y C L E
outside H* H*
Fig. 1.6. Possible schemes for the (a) Q-cycle and (b) b-cycle.Q Q g , Q^, Qq, represent bound forms of plastoquinone ; Q/QH^, the plastoquinone pool; b^, low potential cytochrome b—563; b^, high potential cytochrome b-563* FeS, the Rieske iron-sulphur centre; f, cytochrome f; PC, plastocyanin. Single headed arrows, electron or proton transfer; double-headed arrows, binding, dissociation and diffusion of quin one /quinol molecules. Site i, site of unstable semiquinone ; site o, site of stable quinone. Numbers indicate site of inhibitor action (see section 1.3.3 ).
mitochondria but has also been observed in bacteria and chloroplasts,
and, using the respective isolated cytochrome b-c complexes, in con
junction with reconstitution studies.
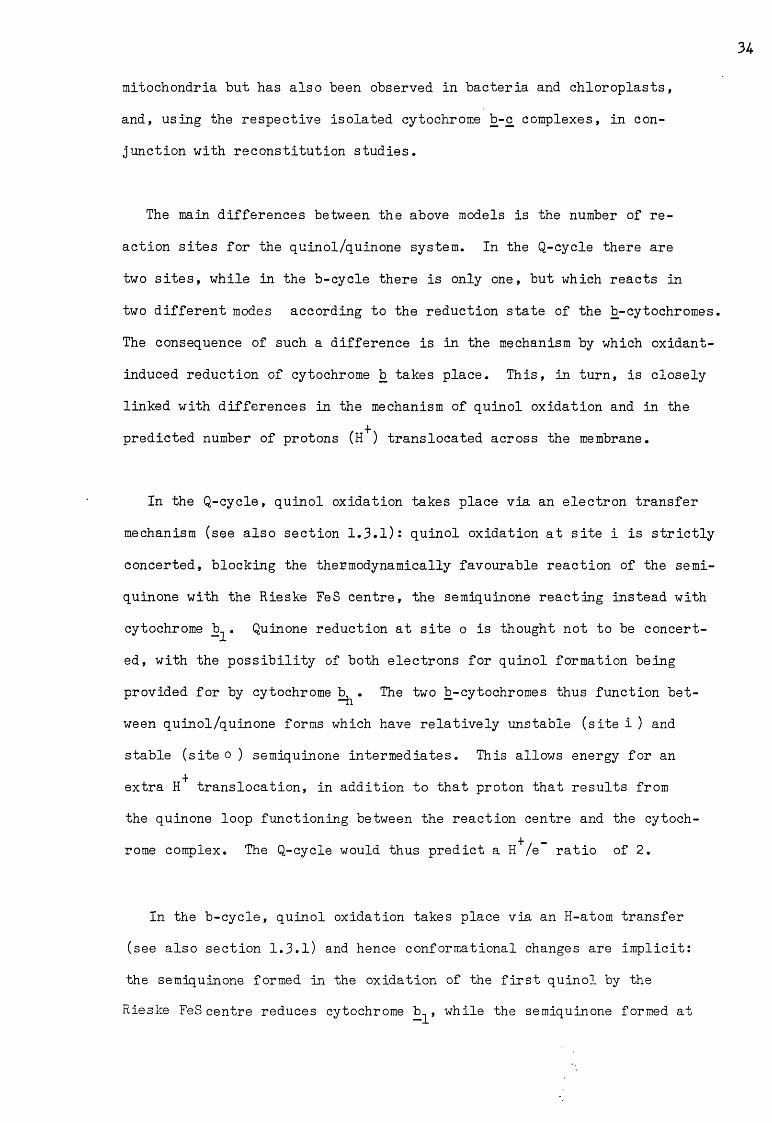
The main differences between the above models is the number of re
action sites for the quinol/quinone system. In the Q-cycle there are
two sites, while in the b-cycle there is only one, but which reacts in
two different modes according to the reduction state of the b-cytochromes.
The consequence of such a difference is in the mechanism by which oxidant-
induced reduction of cytochrome b takes place. This, in turn, is closely
linked with differences in the mechanism of quinol oxidation and in the
predicted number of protons (H+) translocated across the membrane.
In the Q-cycle, quinol oxidation takes place via an electron transfer
mechanism (see also section 1.3.1): quinol oxidation at site i is strictly
concerted, blocking the thermodynamically favourable reaction of the semi-
quinone with the Rieske FeS centre, the semiquinone reacting instead with
cytochrome b^. Quinone reduction at site o is thought not to be concert
ed, with the possibility of both electrons for quinol formation being
provided for by cytochrome b^ . The two b-cytochromes thus function bet
ween quinol/quinone forms which have relatively unstable (site i ) and
stable (site o ) semiquinone intermediates. This allows energy for an
extra H+ translocation, in addition to that proton that results from
the quinone loop functioning between the reaction centre and the cytoch
rome complex. The Q-cycle would thus predict a H+/e ratio of 2.
In the b-cycle, quinol oxidation takes place via an H-atom transfer
(see also section 1.3.1) and hence conformational changes are implicit:
the semiquinone formed in the oxidation of the first quinol by the
Rieske FeS centre reduces cytochrome b^, while the semiquinone formed at
34

35
the same site from a second quinol, oxidizes cytochrome b^. The extra
H+ that would have been translocated in a Q-cycle, is instead, intimate
ly associated with the cytochrome b redox reactions. The b-cycle would
thus predict a H+/e ratio of 1. The b-cycle, however, would yield a
H+/e ratio of 2 if .a specific mechahdsm, by which an extra H could
be pumped across the membrane, were incorporated: one possibility would
be the involvement of the b-cytochromes with their redox-linked pK changes
(von Jagow and Engel, 1980; Wikstrbm and Krab, 1980; Wikstrom et al, 1981).
The main argument in favour of the Q-cycle mechanism has already been
given in the discussion of section 1.3.1, where the electron transfer
mechanism, which is operative in a Q-cycle,is favoured for quinol oxida-+ —tion. The initial experimental requirement to explain the observed H /e
ratio of 2 in mitochondria (Wikstrom et al, 1981) would favour both a
Q-cycle and a b-cycle, in which an extra site of H+ translocation had
been incorporated. However, even so, in favour of the Q-cycle is that
it exhibits a clear concept of how the extra H+ is translocated.
The use of a H+/e ratio of 2 as a criterion for deciding which is
the more suitable model is, however, dubious, since, experimentally,
clarification of H+/e ratios is still required. Evidence for a H+/e
ratio of 2 has been provided both for mitochondria (Papa et al, 1975;
Wikstrom et al, 1981) and for photosynthetic bacteria (Petty et al,
1977; 1979). This has also been the case for chloroplast electron
transport, from plastoquinol to plastocyanin, (Fowler and Kok, 1976;
Olsen and Cox, 1979; Velthuys, 1980 ). Other authors (Olsen ejt al,
1980), however, could not demonstrate the extra proton translocation in
chloroplasts, at all, and hence a b-cycle mechanism, with no extra site +of H translocation, was suggested.

A prediction made by the Q-cycle, and by the b-cycle in which a
mechanism for extra H+ translocation is incorporated, is that of an
additional charging of the membrane by an electrogenic step, during
oxidant-induced reduction of cytochrome b, which is relatively slow
compared to the charging by the reaction centres. In the case of a
Q-cycle, this slow electrogenic step would be the result of an electron
moving outwardly across the membrane , while for a b-cycle, it would be
the result of the inward translocation of the (extra) proton. An ex
tra slow electrogenic step has indeed been observed both in bacterial
chromatophores (Prince and Dutton, 1977; Crofts et al, 1983) and in
chloroplasts (Joliot and Delosme, 1974.; Velthuys, 1978; Crowther and
Hind, 1980; Bouges-Bocquet, 1981b). Experimental evidence that this
slow electrogenic step is indeed indicative of a Q-cycle mechanism, has
been well documented for bacterial chromatophores, although, modifica
tions of such a mechanism have been proposed (Crofts et al, 1983). In
the case of chloroplasts, however, although various modified Q-cycles
and b-cycles have been put forward to explain the slow electrogenic
step, alternative interpretations have also been suggested (see section
1.6.3). Further evidence in favour of the predicted electrogenic step
comes from recent reconstitution studies in which the isolated cytochrome
b^/f complex is reincorporated into lipid vesicles and has been found to
be an electrogenic proton translocator (Hurt et al, 1982), as is the
mitochondrial b-c complex (Guerrieri and Nelson,1975; Leung and Hinkle,
1975).
One other criterion that has been used as evidence of a Q- or b- type
cycle operating, rather than a straightforward linear electron transport
scheme between quinol and cytochrome f, is that the kinetics for the
reduction of cytochrome b-563 should match those of the re-
reduction of cytochrome f. However, kinetic studies of the flash-
induced cytochrome redox changes show that cytochrome b-563 reduction
is considerably faster than the rereduction of cytochrome f (Dolan
and Hind, 1974-; Velthuys, 1979» Crowther and Hind, 1980). The situa
tion is similar in bacterial chromatophores (Crofts et al, 1974-;
Prince and Dutton, 1975; 1977). This was thought to be incompatible
with a Q-cycle/b-cycle type mechanism, until more recently the pre
sence of the Rieske FeS centre, delaying electron flux from quinol
to cytochrome f, was taken into account.
1.3.3 Inhibitors:
As indicated in Fig. 1.6, three different sites of oxidoreductase
inhibition can be discerned, giving rise to three different types of
inhibitors: type 1 inhibitors block the reoxidation of cytochrome b;
type 2 block at the Rieske FeS centre and type 3 block the reduction
of cytochrome b.
Antimycin and HQNO are type 1 inhibitors. Their effect is to in
hibit the reoxidation of cytochrome b and hence cause an apparent in
creased extent in its oxidant-induced reduction. As such, antimycin
is very effective in mitochondria (Wikstrom and Berden, 1972; Erecinska
et al, 1972) and photosynthetic bacteria (Dutton and Prince, 1978;
Gabellini et al, 1982). Although antimycin is not so effective in chlo-
roplasts (Hurt and Hauska, 1981; Bendall, 1982), it does inhibit, albeit
at higher concentrations, cyclic electron flow around PS1 (Huber and
Edwards, 1977), which also involves the oxidoreductase. However, the
site of action of antimycin here is probably not equivalent to that in

mitochondria and photosynthetic bacteria, since, although cytochrome
f rereduction and cytochrome b-563 reoxidation are inhibited (Slovacek
et al, 1979), in accordance with a type 1 inhibitor, inhibition of
the extent of oxidation of cytochrome f and of reduction of cytochrome
b-563 was also observed.
UHDBT, DBMIB and DNP-INT are all type 2 inhibitors. They bind, in
some form, to the Rieske FeS centre, thus inhibiting its reduction.
UHDBT is a hydroxyquinone which was introduced by Folkers (see Roberts
et al, 1979). It is an efficient inhibitor of all the quinol/cytochrome
c (plastocyanin) ox-idoreductases (see Hauska et al, 1983). DBMIB, which
is also a quinone analogue, and DNP-INT, which is structurally related
to DBMIB, were introduced by Trebst et al (1970; 1978) as inhibitors
of plastoquinol oxidation in chloroplasts. Both are h.ighly efficient
inhibitors of the Isolated plastoquinol-plastocyanin oxidoreductase
(Hurt and Hauska, 1981) and also inhibit oxidant-induced reduction of
cytochrome b-563 (Hurt and Hauska, 1982). Although some inhibitory
effect has been observed with DBMIB in mitochondria (Trumpower, 1981)
and in photosynthetic bacteria (Baltscheffsky, 1974.), this might rather
be explained in terms of DBMIB rapidly diverting electrons from trans
iently formed ubisemiquinone (Surkov and Konstantinov, 1980). DNP-INT,
which has no redox properties, is as efficient as DBMIB in the chloro-
plast system, but is inert in the bacterial system.
Myxothiazol is a type 3 inhibitor. It is highly efficient in block
ing the reduction of cytochrome b in both mitochondria (von Jagow and
Engel, 1981) and photosynthetic bacteria (Meinhardt and Crofts, 1982;
Gabellini and Hauska, 1983). Like antimycin, however, it is ineffect
ive in the chloroplast system (Hauska et al, 1983).
1.3.4- Cyclic electron transport:
Cyclic electron flow occurs when an electron is returned from the
reduced to the donor side of PS1, via a suitable "cofactor", to three
possible sites: (a) plastoquinone (e .g. with the natural cofactor ferre-
doxin), (b) plastocyanin (with permeant cofactor-.s such as 2,3,5,6 - te-
tramethyl-p-phenylenediamine) and (c) P700 (with the cofactor phenazine
methosulphate). When only the plastoquinone input site for electrons
from PS1 is considered, more than one type of cofactor can be used.
With the natural cofactor ferredoxin, phosphorylation and electron flow
are characterized by being antimycin sensitive (Binder and Selman, 1980),
being associated with the slow phase of the electrochromic effect (Slo-
vacek and Hind, 1978; Crowther et al, 1979) and being inhibited by DBMIB
(Hauska et al, 1974-) , the latter effect indicating the involvement of
plastoquinone. Anthraquinone-2-sulphonate is an alternative cofactor,
which in some ways is similar to ferredoxin in that it is non-permeant
and its reaction is sensitive to DBMIB, but on the other hand, its re
action is insensitive to antimycin (Hauska et al, 1974-* Binder and Selman,
1980; Robinson and Yocum, 1980).
A crucial question is how electrons pass back to a carrier within the
membrane from non-permeant cofactors. Although plastoquinone is involved
in the cyclic pathway, the nature of the primary acceptor, and the role
of the pool are uncertain. Concrete evidence that ferredoxin can reduce
the pool has recently been obtained. NADPH and ferredoxin were shown
to reduce both C-550 (Arnon and Chain, 1975) and the fluorescence quencher
Qa (Mills et al, 1979).
Initially, it was thought that the direct acceptor of electrons, from
ferredoxin, was cytochrome b-563 (Cramer and Butler, 1967; Bohme and
Cramer, 1972). However, recently, this has been shown not to be the case,

since ferredoxin does not cause an acceleration of the very slow reduction
of cytochrome b-563 by dithionite (Cox, 1979). Non-permeant mediators
(anthraquinone-2-sulphonate) are similarly ineffective, whereas permeant
mediators (anthraquinone, methyl viologen) do cause an acceleration:
thus, the cytochrome seems to be buried in the hydrophobic phase of the
membrane and hence is inaccessible to hydrophilic reagents.
On thermodynamic grounds, ferredoxin would be expected to reduce plas-
toquinone at a reasonable rate, but in practice the direct reaction is
slow, probably through lack of accessibility. It seems more likely that
the membrane contains an unidentified ferredoxin-plastoquinone oxidore-
ductase , denoted nVn,(Bouges-Bocquet, 1980b; Growther and Hind, 1980)
located on the outer side of the thylakoid membrane. This enzyme pro
bably works as a two-electron accumulator, similar to the Q„ protein ofD
PS2: these two proteins are not identical since DCMU does not inhibit
cyclic phosphorylation. Inhibitor studies suggest that the flavoprotein
ferredoxin-NADP oxidoreductase mediates electron flow between ferredoxin
and the plastoquinone reductase (Shahak et al, 1981), even though a
flavoprotein antiserum does not inhibit cyclic electron flow (Bohme, 1977)
Cyclic electron flow with other non-permeant cofactors, however, does
not necessarily follow the same route as that of ferredoxin: for example,
with anthraquinone-2-sulphonate as cofactor, electrons may be donated to
plastoquinone directly,thus by-passing V (see Benda11, 1982).
1.4- Measurement of the electric field by electrochromism:
1.4.1 Detection by electrochromism:
Detection of voltages across the thylakoid as well as the bacterial
chromatophore membranes, such as those set up by the primary charge se
paration upon light activation, has been possible by spectrophotometrie
measurements of electrochromic absorption changes. The term "electro-
chromism" describes the influence of strong electric fields, light-induced
or otherwise, on the absorption spectra of pigments, which results in an
almost homogeneous shift of the absorption band.
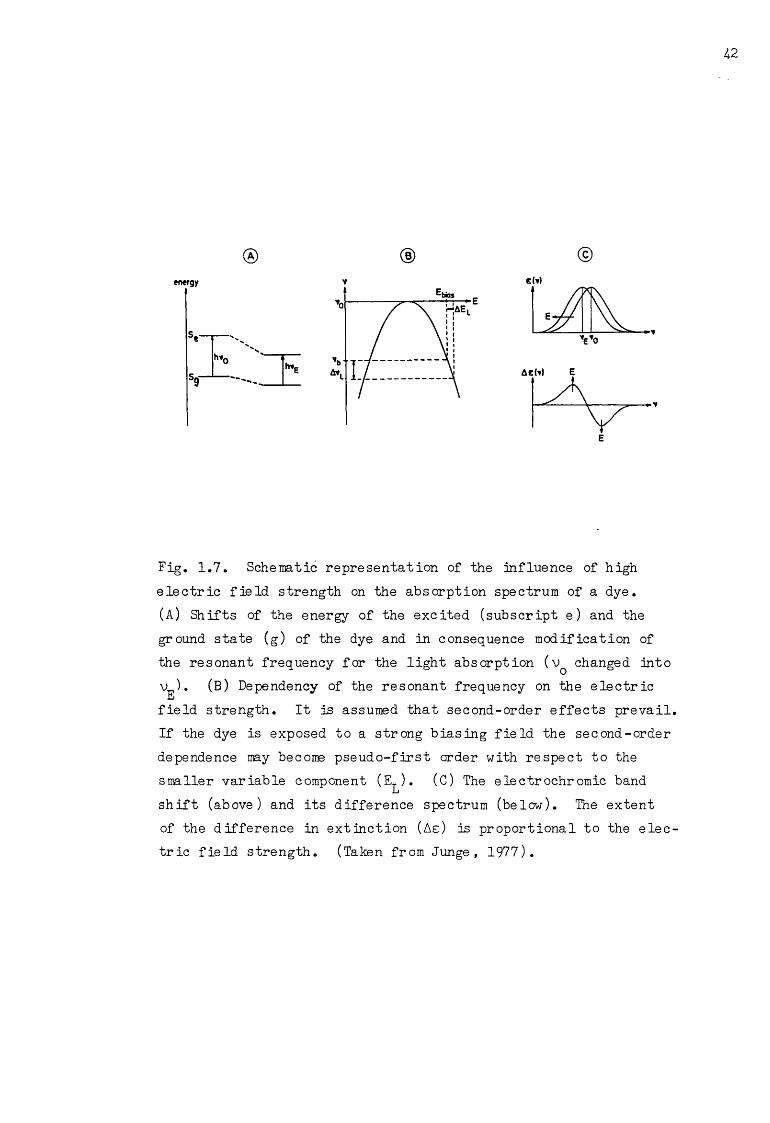
Fig. 1.7 shows, in a simplified form, the principle of electrochromism
(a more detailed discussion of its consequences is given later; for theore
tical descriptions see Liptay, 1969 and Reich and Sewe, 1977). Absorption
of light transforms a pigment molecule from its ground state to an excited
state. If an electric field is applied, and if the ground or excited state
either have a different permanent dipole moment or a different polarizability,
then the energy difference between these states will be altered. Such a
change in transition energy, which is dependent on the magnitude of the
electric field, results in a shift of the absorbance maximum and hence a
shift of the whole absorbance band. This band-shift causes "field-indi
cating absorbance changes", A A. Such absorbance changes were initially
used by Junge and Witt (1968) to provide the first experimental evidence
for the existence of an electric field across the functional membrane
of photosynthesis.
1.4-.2 Kinetic and spectral characteristics of flash-induced electrochromic
absorption changes:
The flash-induced fieId-indicating absorption change is characterized
by a rise time shorter than 20ns (Wolff et al, 1969) and a decay time in
the range of 10ms to Is, depending on the membrane permeability and pH
gradient.
41
©
Fig. 1.7. Schematic representation of the influence of high electric field strength on the absorption spectrum of a dye.(A) Shifts of the energy of the excited (subscript e) and the ground state (g) of the dye and in consequence modification of the resonant frequency for the light absorption (v changed into V ). (B) Dependency of the resonant frequency on the electricfield strength. It is assumed that second-order effects prevail. If the dye is exposed to a strong biasing field the second-order dependence may become pseudo-first order with respect to the smaller variable component (E ). (C) The electrochromic bandshift (above) and its difference spectrum (below). The extent of the difference in extinction (Ae) is proportional to the electric field strength. (Taken from Junge , 1977).
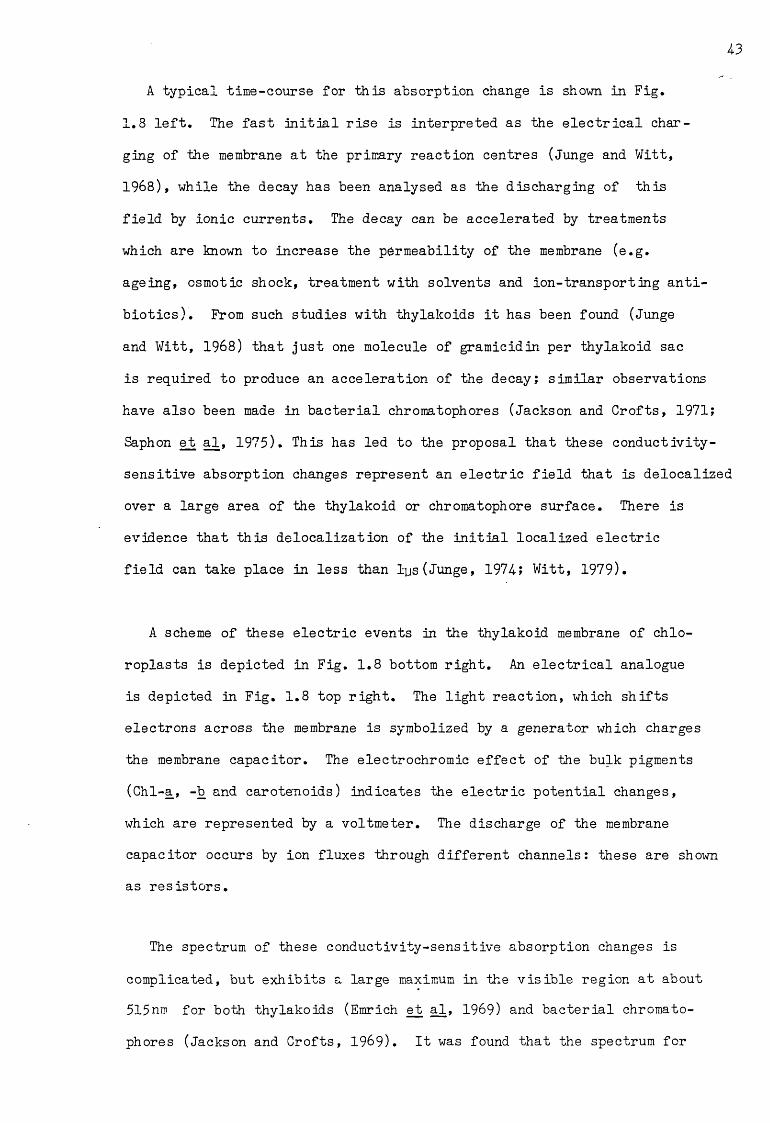
A typical time-course for this absorption change is shown in Fig.
1.8 left. The fast initial rise is interpreted as the electrical char
ging of the membrane at the primary reaction centres (Junge and Witt,
1968), while the decay has been analysed as the discharging of this
field by ionic currents. The decay can be accelerated by treatments
which are known to increase the permeability of the membrane (e.g.
ageing, osmotic shock, treatment with solvents and ion-transporting anti
biotics). From such studies with thylakoids it has been found (Junge
and Witt, 1968) that just one molecule of gramicidin per thylakoid sac
is required to produce an acceleration of the decay; similar observations
have also been made in bacterial chromatophores (Jackson and Crofts, 1971;
Saphon et aJ., 1975). This has led to the proposal that these conductivity-
sensitive absorption changes represent an electric field that is delocalized
over a large area of the thylakoid or chromatophore surface. There is
evidence that this delocalization of the initial localized electric
field can take place in less than lys (Junge, 1974.; Witt, 1979).
A scheme of these electric events in the thylakoid membrane of chlo-
roplasts is depicted in Fig. 1.8 bottom right. An electrical analogue
is depicted in Fig. 1.8 top right. The light reaction, which shifts
electrons across the membrane is symbolized by a generator which charges
the membrane capacitor. The electrochromic effect of the bulk pigments
(Chl-a, -b and carotenoids) indicates the electric potential changes,
which are represented by a voltmeter. The discharge of the membrane
capacitor occurs by ion fluxes through different channels: these are shown
as resistors.
The spectrum of these conductivity-sensitive absorption changes is
complicated, but exhibits a large maximum in the visible region at about
515nm for both thylakoids (Emrich et al, 1969) and bacterial chromato
phores (Jackson and Crofts, 1969). It was found that the spectrum for

field
ind
icatin
g ab
sorp
tion
chan
ge
Fig. 1.8. Left. Time course of the fieId-indicating absorption change. Right. Scheme of the electric events on the thylakoid membrane of chlor oplasts, with the electrical analogue. (Taken from Witt, 1979).

thylakoids could be approximately mimicked by the electrochromic diff
erence spectra of isolated carotenoids and chlorophylls, measured in
microcapacitors (Schmidt et al, 1971a; also see Witt, 1975); a similar
reconstruction compared even more accurately with the chromatophore
absorption changes (see Schmidt et al, 1971b; Witt, 1975). These
studies clearly showed that it was the carotenoids that were the pig
ments sensitive to the transmembrane electric field and that gave rise
to the absorbance changes. However, from further detailed spectral
analyses in chromatophores (de Grooth and Amesz, 1977b; Symons et al,
1977) and chloroplasts (Sewe and Reich, 1977; de Grooth et al, 1980),
it was found that only a small fraction of the total carotenoid pool
in membranes was electrochromically sensitive. Experiments suggest
that the sensitive carotenoids in thylakoids are associated mainly
with the PS2 complex: this has been inferred from the involvement
of chlorophyll b (Sewe and Reich, 1977) and indirectly from the low
temperature behaviour of the electrochromic response (Conjeaud et al,
1976). In chromatophores, the sensitive carotenoids have been suggest
ed to be associated with only one of the two light-harvesting pigment-
protein complexes, either the B870 complex or the B800-850 complex:
selective removal of the B800-850 complex (Matsuura et al, 1980; Web
ster et al, 1980) results in the loss of the electrochromic absorp-
t ion change.
1.4-.3 Consequences of simple electrochromic theory:
A simplified equation which describes the theory of electrochromism
(Reich and Sewe, 1977) is as follows:
AAm = V l [( Hg " ile ). ^ + 5 ( a g - a e) E 2 ]he
is the absorption peak (m) in the absence of the field, h is Planck’3 A 8 1constant (6.63 x 10 4 Js ), c is the speed of light (3 x 10 ms" ),
U and lJe are the permanent dipole moments in the ground and excited
states (Cm), and qlq are the polarizabilities of the ground and ex-
cited states (Cm V ) and E is the electric field (Vm ). For mole
cules which have a permanent dipole, the main effect is a linear shift
in the absorbance maximum to the red with change in field strength.
For moleoules with no permanent dipole, the main effect is a quadratic
relationship between the extent of the shift and the field strength.
This arises from a linear effect of the field on the induced dipole
(a - a ). E , which results from the polarizing effect of the field.& ®The scalar product contains the dependence on the angle between the per
manent dipole and that of the field.
There are three effects which can be predicted from the above simpli
fied electrochromic theory: (l) the carotenoids, which have no permanent
dipole moment but which are polarizable, should exhibit a quadratic shift
with respect to the applied electric field; (2) the red-shift of the
carotenoid absorption should be small (of the order of a few tenths of a5 “1nanometer for typical field strengths of lCr V cm ) and hence the mag
nitude of the electrochromic absorption change should also be small;
and (3) the carotenoid absorption peak will shift progressively along
the wavelength axis with increasing field strength.
Using several independent techniques, in both thylakoids and chro-
matophores (Jackson and Crofts, 1969; Witt and Zickler, 1974; Schapen-
donk and Vredenberg, 1977), it has been found that the carotenoids ex
hibit a linear shift with applied electric field, rather than the ex
pected quadratic shift. To explain this discrepancy, the following
hypothesis has been' proposed (Reich and Sewe, 1977; Sewe and Reich,
1977). The electrochromically sensitive carotenoids are contained in
an environment in which they experience a strong local field (E^ in Fig.
1.7), possibly as the result of complex formation with neighbouring
chlorophyll molecules. The effect of this local field is to polarize
the carotenoids giving them an induced dipole of (a - a ) E_ and henceg e 12shift their spectrum to the red by (a - a ) E . The small addition-o e -Lal field due to a membrane potential (E ) now gives rise to a linear
—m
shift of (a^ - ag) E^. E^. Thus, the constant background polarization
of the carotenoids, by the chlorophyll molecules, results in a pseu-
dolinear relation between the absorption change and the electric field
transient (see middle of Fig. 1.7).
Attempts to observe a progressive shift of the carotenoid absorp
tion spectrum with increasing field strength have been successful with
single turnover flashes (Crofts et al, 1974.; Holmes and Crofts, 1977).
A small but clearly resolved progressive shift to the red in the isos-
bestic point of the difference spectrum can be observed on successive
flashes: the change represents a shift of approximately 0.7nm. When
similar attempts were initially made to measure this shift using con
tinuous illumination, no progressive change could be detected. How
ever, recently, by coaling chromatophore suspensions to -35°C and pro
moting electron transport with redox dyes, de Grooth and Amesz (1977a;
b) have been able to observe both an unusually large carotenoid absorp
tion change and a clear shift of its spectrum,as expected, to longer
wavelengths, and which was proportional to the change in amplitude of
the difference spectrum. This difference spectrum, however, had its
initial inflection point several nanometers towards the red of the main
absorption band. Their interpretation of these results was that (l)
the carotenoid undergoing a change has a spectrum already shifted to
the red with respect to the expected carotenoid absorption spectrum,
and (2) the bulk spectrum is due to overlapping contributions from this
red-shifted population and a population with a A^ to the blue of the bulk spectrum, which results from the contribution of the non-responding
carotenoids. Such a hypothesis complements rather well with that of
Reich, above, which would also predict a red shift in the spectrum of
the electrochromically sensitive carotenoids.
1.4.4 Electrochromic absorption changes induced by steady-state light:
Under continuous illumination,the 515nm electrochromic absorption
change, AA^]_5» exhibits a different time course to that observed upon
flash activation (Graber and Witt, 1974). Initially, the electrochro
mic change rises up to a relatively high level: it reaches between
two and four times higher values than that under single flash excitation.
Under the influence of this large electric potential difference, cations
move outwards and anions move inwards. Simultaneously, the protolytic
reactions, which occur as a result of the induced electron transport,
cause an active inward translocation of protons. This results in a
decrease in the pH of the internal phase and a subsequent increase in
the field-driven proton efflux (see Graber and Witt, 1976): in the
steady state, the proton efflux fully compensates the active, inward
proton pumping. The internal acidification also causes a retardation
of the electron transport. This latter effect, together with the in
crease in proton efflux, leads to a decrease of the initial high elec
tric field towards a relatively low steady-state value.
During the time course of these events, changes in the bulk potential
(A'P ) and surface potential (A^) also occur (Rumberg, 1977): the
bulk potential can be calculated from the Nernst-Planck relation while
the surface potential can be calculated from the Gouy-Chapman theory.
These potentials are of importance since the electric field strength
within the membrane is proportional to their sum:
49
E (AT, + AT ) b sd d
where AT^ is the transmembrane potential and d is the thickness of
the membrane (see Fig. 1.9).
Under steady state light illumination, the bulk potential is small.
However, the continuous inwardly directed proton pumping may lower the
internal pH to such an extent that the negatively charged groups on the
inner membrane surface become neutralized. If the external pH remains
high, well above the pK of the external surface negative charges, then
an electrical gradient will be created across the membrane, in addition
to that created by electrogenic or ionic diffusion processes (Barber,
1982). This would then result in a large surface potential difference
between the inner and outer side of the membrane. Hence, under steady
state conditions, the transmembrane potential difference may contain a
large contribution from the surface potential difference (Witt, 1979;
Huber ejfc al, 1980). In fact calibration of the electric field in thy-
lakoids and under continuous illumination, as measured by the electro-
chromic method, does yield a large value of lOOmV, positive inside
(Graber and Witt, 1974). This particular method senses the electric
field within the membrane and hence is proportional to the transmembrane
potential, which includes the large surface potential contribution.
Calibration by alternative methods which are only sensitive to the elec
tric potential difference between the bulk phases e.g. microelectrodes
(Bulychev and Vredenberg , 1976) yields a lew value of lOmV. Similar dis
crepancies have also been found for the steady state value of the chroma -
tophore membrane potential (see Jackson and Crofts, 1969; Michels and
Kcnings, 1978). Such surface potential differences are negligible in
studies of flash-induced voltage changes.

outside membrane inside outside membrane inside
Fig. 1.9. Schematic drawing of the thy la ko id membrane before and after steady state illumination, with the electric potentials in the bulk phases (^)» at the surfaces (vy ) and the potential difference across the membrane ( A ). It has been assumed that initially, the surface potentials are the same and that, under steady illumination, the internal acidification creates a small positive surface potential on the thylakoid interior.
1.4..5 Electrochromic absorption changes Induced by extrinsicelectric field transients:
In bacterial chromatophores, electrochromic absorption changes
have been induced by the exposure of the vesicles to nsalt jumps”
in the presence of cations (or anions) and specific ionophores
(Jackson and Crofts, 1969): this results in a diffusion potential
being set up across the membrane. The extent of the resulting absorp
tion change can be linearly related to the extent of the diffusion
potential, calculated assuming a Nernst-Planck relation to be valid:
At = -RT In [i]-; .........................ZF [I]Q
where [i] is the concentration of the permeable ion on the inner (i)
and outer (o) side of the membrane. Similar attempts with thylakoids
have been hampered by the pronounced light-scattering changes of (the
much larger) thylakoids (Strichartz and Chance, 1972). Elimination of
these light-scattering transients has, however, also allowed salt-jump
induced absorption changes in thylakoids to be observed (Schapendonk
and Vredenberg, 1977). These exhibit the expected spectral properties of
a field-induced electrochromic absorption change and yield the expect
ed linear relation between the absorption change and the calculated
diffusion potential. The use of this technique has led to the calibra
tion of the flash-induced electrochromic absorption change (see later).
An alternative method of inducing electrochromic absorption changes
is that of exposing the membranes to an externally applied electric
field (de Grooth et al, 1980; Schlodder and Witt, 1980). Large, swollen
thylakoid vesicles, called ”blebs”, (see de Grooth et aJL, 1980) have
often been used in these studies since large electric fields can be
induced across their membranes with comparatively small (by a factor of

52
10 ) external electric fields (Ellenson and Sauer, 1976; Witt et al,
1976). In contrast to the light-driven membrane voltage, where the
polarity is always positive inside, the externally induced voltage drop
across these blebs is outwardly directed in 50$ of the membrane area
and inwardly directed in the other 50$. The linear and pseudolinear el-
ectrochromic effects thus cancel in the observed ensemble, while the
quadratic effects remain visible. Thus, the observed electrochromic
absorption change, induced by an external electric field, is proportion
al to the square of the transmembrane potential difference: it thus re
sults from that population of carotenoids that do not respond to a local
permanent electric field. Although this technique complements the pre
dictions made by the electrochromic theory, it cannot really be used to
calibrate the light-induced voltage jumps since they result from a diff
erent set of carotenoids.
1.4-.6 Calibration of the flash-induced electric field:
Early estimates for the magnitude of the electric field set up across
the thylakoid membrane, upon flash activation, were based on the follow-
ing assumptions (Schliephake et al, 1968): a surface area of 2.2nm per
chlorophyll, 600 chlorophylls per electron transport chain (i.e. PS2 +
PS1 reaction centres) and an estimated specific capacitance of the thy-_2lakoid membrane of 0.5 yF cm . This yielded a value of 4.8mV for a single
turnover which is, in fact, quite close to the accepted measured values
described below.
Schapendcnk and Vredenberg (1977), taking care to avoid light scatter
ing artefacts, attempted to calibrate the light induced electrochromic
changes by comparison with the absorption changes induced by salt jumps
in the presence of the ioncphore valinomycin (analogous to the work
of Jackson and Crofts, 1969, with chromatophores). A maximum voltage
_3
of 58.5mV was initially calculated, but this was then reduced to 35mV,
after taking into account the permeability ratio between K+ and Gl in
their experiments. The variation of the voltage among different sam
ples was 15-35mV. A much higher estimate, however, for this single
turnover voltage, has resulted from the use of the voltage-gated
channel-forming antibiotic, alamethicin (Zickler et al, 1976). Compar
ing the observed extent of the electrochromic absorption change, when
gating occurs, with the known gating voltage from studies with arti
ficial membranes, a single turnover voltage of 105-135mV was proposed.
Similarly high values have also resulted from measurements using
the technique of delayed fluorescence (Jurinsic et_ al, 1978). In
view of the indirect nature of all these estimates, it is difficult
to favour one over the other. However, a figure ranging between 30mV
and 50mV does seem probable.
In the case of chromatophores, two different calibration procedures
for the electrochromic absorption changes have yielded similar values
for the magnitude of the membrane potential generated by short flashes.
The use of potassium diffusion potentials (after Jackson and Crofts,
1969) has yielded a value of 48mV. This results in a value of approx
imately lOOmV for the transport of an electron through two electro-
genic sites (see section 1.5). Calibration with alamethicin (after
Zickler et ad., 1976), however, has yielded the slightly lower values
of 58-86mV, for the latter total transmembrane electron transport
(Packham ejb al, 1978).
1.4-.7 Limitations of the electrochromic method:
Analyses of the field-indicating absorption changes are mostly
carried out at 515nm. However, measurements at this wavelength can

be confused with absorption and light scattering changes which are
due to non-electrochromic events, with different kinetics. Possible
complicating factors are :
(a) Fast changes at 515nm (rise time less than 20ns, decay 3ys )
due to the formation of carotenoid triplets: these originate from
a reaction that protects the antenna chlorophyll from photooxidation
(Wolff and Witt, 1969; Cogdell et al, 1975).
(b) Slow optical changes (in thylakoids) at 515nm (in the range of
seconds to minutes) due to light scattering changes, caused by the
drastic structural changes induced by the electrochemical events.
Double beam spectrophotometry does not entirely eliminate the problem:
the difference spectrum of the apparent absorption changes due to
light scattering, is rather similar to that of electrochromism (Thorne
et al, 1975). Such scattering changes may have interfered in experi
ments with prolonged illumination (e.g. Larkum and Bonner, 1972), how
ever, they are negligible during flash excitation of chloroplasts,
where low repetition rates are used. Attempts to exclude such scatter
ing artefacts in continuous illumination have, however, been success
ful in measurements with chlorella cells, by using careful calibration
techniques (Graber and Witt, 1974.). Chromatophores, on the other hand,
do not suffer from such light scattering interference, even during
continuous illumination, since their vesicle diameter, approximately o
360 A (Packham et al, 1978), is much less than the wavelength of the
measuring light.
(c) The location of the electrochromically-sensitive pigments in
relation to the fieId-generating reaction centres, may also introduce
artefacts. These, however, are pronounced in low temperature studies.

A transmembrane charge separation that occurs in a remote portion
of the membrane, will only be sensed if the electric field is dis
tributed evenly over the membrane: such a charge delocalization
will only occur at temperatures where the electric conductivity of
the aqueous phases is high enough (for low temperature effects, see
Conjeaud at al, 1976; de Grooth and Amesz, 1977a).
1.5 Electrical events indicated by the flash-induced electrochro-
mic absorption change: The fast phase.
In chloroplasts, the initial rise (phase a) of the electrochromic
shift is very fast (t, < 20ns), and can be ascribed to the fieldacreated by the primary charge separation in the two photosystems (Witt,
1971; Junge, 1977). Since the polarity of this electric field is
positive on the inner surface of the membrane (conclusively demonstrated
by ion redistribution studies: Deamer and Packer, 1969; Schroder et
al, 1971), charge separation occurs with an electron being transferred
from the inner to the outer side of the membrane, from donor to accept
or, and fully crossing the dielectric core of the thylakoid membrane
(Witt, 1979). Since the electric field generated at each photosystem
contributes about equally to phase a (Schliephake et al, 1968; Malkin,
1978; Diner and Delosme, 1983), it is inferred that both P700 and P680,
the primary electron donors of PS1 and PS2, respectively, are located
towards the inner membrane surface, while the primary acceptors are
located on the outer surface. Such a vectorial arrangement of compo
nents, within the thylakoid membrane, has since been supported by studie
with inside-out vesicles (Andersson et al, 1981).
How the electron is rapidly channelled across the thylakoid membrane
is not clear. Possibly, quantum mechanical tunnelling via overlapping

7T -electron systems is involved (Mangel et al, 1975; Kuhn, 1979).
Alternatively, the protein interior could act as an injection semicon
ductor (Tributsch, 1972). These hypotheses, however, remain specula
tive and have gained no experimental support.
In the case of bacterial chromatophores, the fast phase of the elec-
trochromic absorption change comprises of two, kinetically distinct com
ponents (Jackson and Dutton, 1973): these are called phase I and phase
II, and their contributions are approximately equal. In bacterial chro
matophores, there is only one photosynthetic reaction centre, containing
a specialized bacteriochlorophyll dimer, P870,and a quinone acceptor’Q^,
and the light-driven electron transport reactions function as a closed
cycle (Prince and Dutton, 1975; also see Fig. 1.10). The reaction centre
serves to oxidize a c-type cytochrome and to reduce the ubiquinone pool,
UQ. The cycling of the electron from UQ back to the c_-type cytochrome
then proceeds via the cytochrome b-c-^ complex, under optimal redox poise
conditionstthis cycling being complete within tens of milliseconds.
The very rapid rise kinetics of phase I (t^ < 50ns, Jackson and Crofts,
1971) thus associate it with the reaction [BChlj^-^Q^; this has also been
inferred from a correlation between the redox potential dependence
(Jackson and Dutton, 1973) and the temperature dependence (de Grooth and
Amesz, 1977a) of this reaction and phase I. Phase II, on the other hand ,
is generated within lOOps and has been associated with the reaction cyt c^
(Dutton et al, 1975): phase II is found to be missing in mut
ants lacking cytochrome c^ (Zannoni et al, 1980).
This two component reaction (corresponding to phases I and II), con
tained within the fast electrogenic phase, has been interpreted as in
dicating that the reaction centre bacteriochlorophyll is located towards
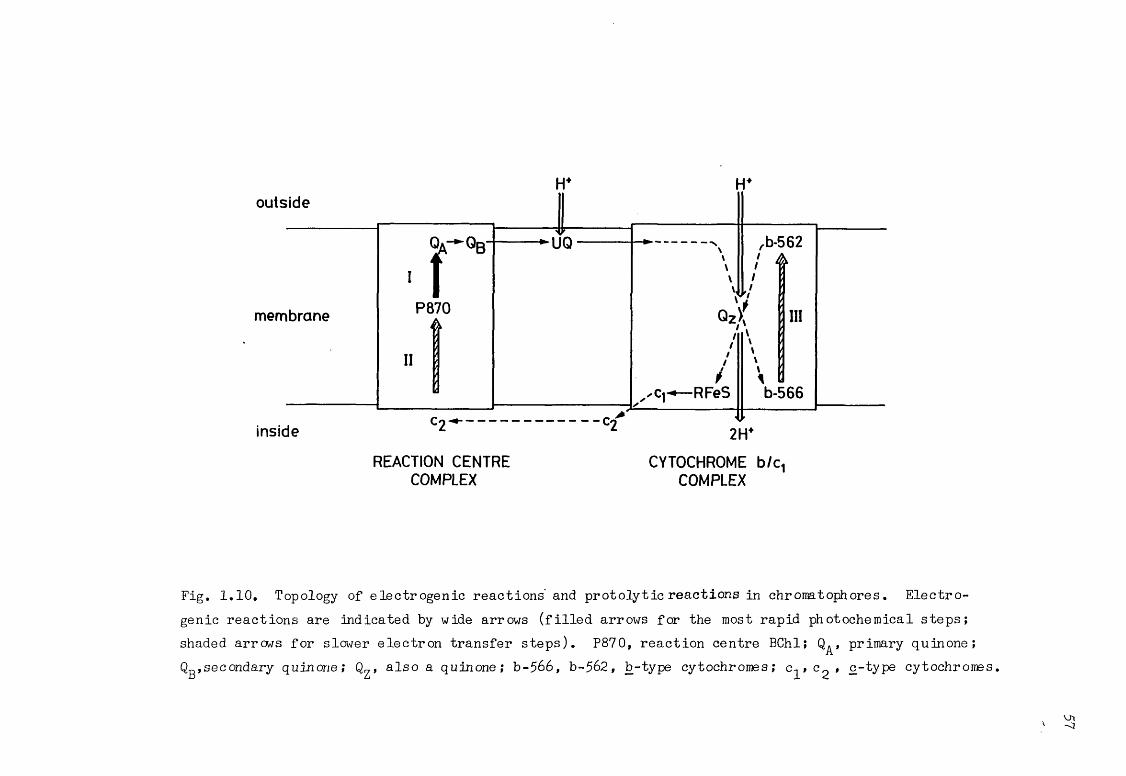
REACTION CEN TRE COMPLEX
CYTOCHROME b/c, COMPLEX
Fig. 1.10. Topology of electrogenic reactions and protolytic reactions in chromatophores. Electro- genic reactions are indicated by wide arrows (filled arrows for the most rapid photochemical steps; shaded arrows for slower electron transfer steps). P870, reaction centre BChl; Q^, primary quinone;Qg,secondary quinone; Q^, also a quinone; b-566, b-562, b-type cytochromes; c- » c^ » c-type cytochromes.

the centre of the membrane dielectric (Takamiya and Dutton, 1977):
this is very different to the situation in thylakoids. From this,
and from the fact that the membrane potential, generated in light-
activated chromatophores, is positive inside, it has been shown that
the primary electron donor to the reaction centre, cytochrome c^, is
located on the inside of the chromatophore membrane (Prince et al, 1975),
while the proton binding reaction accompanying the reduction of UQ,
takes place on the outside of the membrane (Petty and Dutton, 1976b).
Further evidence for such an organization of components (in Rp. sphaer-
oides and Rp.. capsulata, at least) comes from diffusion potential studies
(Jackson and Crofts, 1969), and reconstitution studies of purified re
action centres with artificial membranes (Crofts et al, 1977; Packham
et al, 1980). In different species of photosynthetic bacteria, however,
the organization of components may vary. For example, in Chromatium,
the photochemical reaction centre appears to span a much smaller fraction
of the dielectric because it contributes little, if any, to the carote
noid change (Case and Parson, 1973): the main electrogenic process
appears to be the reduction of the oxidized reaction centre by a c-type
cytochrome. Hence, it is suggested that the p-type cytochrome is located
on the inside of the chromatophore membrane, while the reaction centre
chlorophyll donor is located towards the outside.
1.6 Electrical events Indicated by the flash-induced electrochromic
absorption change: The slow phase.
1.6.1 Properties of the slow phase:
Initially, the slow phase of the electrochromic response was only
observed to occur in algae (Joliot and Delosme, 1971; Bouges-Bocquet
1980b) and bacterial chromatophores (Jackson and Dutton, 1973).

However, more recently, it has also been observed in chloroplasts
(Velthuys, 1978, 1979; Crowther et al, 1979; Slovacek et al, 1979).
At present, evidence favours the concept that this slow absorption
change represents an electrogenic step in the electron transport chain,
outside the photochemical reaction centres: this would thus be in
accordance with Mitchell!s Q-cycle hypothesis (Mitchell, 1976; also see
section 1.3.2). In chloroplasts, however, other interpretations for
the origin of the slow phase have also been put forward (see section
1.6.3).
Under optimal conditions (see later), the slow phase has a rise time
of approximately 2ms in bacterial chromatophores and 10ms in chloroplasts.
Its amplitude is equal to that of the fast phase in bacterial chromato
phores; in chloroplasts the amplitude of the slow phase is equal to
that of the fast phase due to PSI alone (although this ratio can vary).
In both systems the absorption spectrum of the slow phase matches that
of the fast phase (Dutton et al, 1975; Crowther and Hind, 1980): this
indicates that the slow phase does indeed reflect a transmembrane elec
tric field, but subsequent to that generated at the photochemical reac
tion centres.
An effective inhibitor of the slow phase in bacterial chromatophores
is antimycin (Jackson and Dutton, 1973). From the earlier discussion
in section 1.3.3,this suggests that cytochrome b-563 is involved in the
generation of the slow phase. On the other hand, in chloroplasts,
DBMIB inhibits the slow phase (Crowther et al, 1979) : this implicates
the involvement of plastoquinone in its generation.
1.6.2 Conditions required for the generation of the slow phase:
In chloroplasts, it was initially thought that the slow phase,
phase b, was solely driven by those reactions associated with PSI
cyclic electron flow (Crowther et al, 1979). This was because phase
b was only observed in chloroplasts that had been prepared with intact
outer membranes, and which contained bound soluble ferredoxin, and
other stromal cofactors necessary for the cyclic process to occur
(Horvath et al, 1979; Shahak et al, 1980). Furthermore, the obser
vation that addition of DCMU, after the reduction of the PQ pool, did
not inhibit the generation of phase b or its amplitude (Crowther and
Hind, 1980), inferred that phase b might be associated with the oxi
dation of plastoquinol by PSI.
Recently, the ambient redox poise, in the thylakoid membrane, has
been found to be critical for the generation of phase b (Bouges-Bocquet,
1981b) more so than the presence of cyclic electron flow. It has been
suggested that phase b can operate under conditions of non-cyclic elec
tron flow, provided that a component U, probably a bound quinone, has
been pre-reduced. The E of U has been calculated to be 10mV more
positive than the bulk PQ pool i.e. the for U/UH^ would be approx
imately +14-0mV (Bouges-Bocquet, 1981b).
Some of the observations that have led to the above proposal are
given below. Reducing equivalents are required, in the presence of
DCMU, to observe phase b (Crowther and Hind, 1980). Oxidizing con
ditions diminish the extent of phase b, although over-reduction of
the system also causes a loss in its amplitude (Bouges-Bocquet, 1981b).
Preillumination of broken chloroplasts with PS2 light, in the absence
of DCMU, under aerobic conditions and without ferredoxin, generates

a condition in which phase b can be induced (Velthuys, 1978): such
chloroplasts would be unable to sustain cyclic electron transport.
Finally, the amplitude of phase b, in the absence of DCMU, exhibits
a two-flash periodicity (Bouges-Bocquet, 1980b; Velthuys, 1980):
although the change in amplitude is small, this effect is indicative
of a component requiring electron flow through the secondary acceptor
gating component, Q^, described earlier.
A further condition required for phase b generation is that, when
successive flashes are used, reduced U is allowed to be regenerated
between flashes (Bouges-Bocquet, 1981b). It has been found that the
slow phase is strongly inhibited after several closely spaced flashes
(Bouges-Bocquet, 1977; 1981b) and that under these conditions, a lower
ambient redox potential of -54-mV is required to observe phase b (Crowther
and Hind, 1980). However, a further possible contribution to the in
hibition of phase b, using closely spaced flashes, is that a proton
electrochemical potential builds up: this would also inhibit the
formation of the slow phase (Bouges-Bocquet, 1981b).
In the case of bacterial chromatophores, the importance of ambient
redox potential in the generation of the slow phase, called phase III
here, has already been established (Jackson and Dutton, 1973; Prince
and Dutton, 1977): typically an ambient redox poise of +100mV, pH 7.0,
is required. Also postulated, is the involvement of a specialized
ubiquinone, Q (Bashford et al, 1979). In fact, the quinone U, pre-zdieted above in chloroplasts, has many of the properties of Q .
Zr
1.6.3 Possible interpretations of the slow phase:
The site for the generation of the slow phase has been well establi
shed in the case of bacterial chromatophores, but is still a matter of
controversy in the case of chloroplasts.

In bacterial chromatophores, phase III correlates with the re
action involving the rereduction of cytochrome c^ by cytochrome
b (Jackson and Dutton, 1973; see also Fig. 1. 10). This reaction
is specifically antimycin sensitive (Jackson and Dutton, 1973;
van den Berg et al, 1979), suggesting that it is the oxidation of
cytochrome b, in which one electron is transferred across the membrane
dielectric, that generates the electrogenic phase III. From this,
and other observations, a Q-cycle type mechanism has been inferred to
operate in bacterial chromatophores (for example, see Crofts et al,
1983).
In the case of chloroplasts, however, experimental evidence con
cerning the origin of phase b has been less clear cut. The ineffective
ness of antimycin to completely inhibit phase b (Crowther et al, 1979)
has hampered any correlations that would otherwise have been made with
the analogous phase III in bacterial chromatophores. One possibility
is that the generation of phase b, in chloroplasts, is closely linked
with the electron transfer reactions either via the cyclic flow of
electrons around PS1 (Crowther and Hind, 1980), or by some other
mechanism which requires the pre-reduction of a bound form of quinone
(Bouges-Bocquet, 1980a).
Alternative interpretations of the slow phase in chloroplasts, which
indirectly correlate it with electron transport, have also been presented.
Olsen and Barber (1981) have suggested that this slow component appears
as a consequence of the neutralization of the fixed dipole on the re
action centre (as induced by the initial charge separation), due to the
electron transport linked release of H+ and OH into the aqueous phases.
It was proposed that, initially, the field is localized (phase a) and
that only a small absorption change will be observed if the distance
between the field generator (the reaction centre) and the field indi
cator (the P515 complex) is large. Upon neutralization of the fixed
charge on the reaction centre, due to proton exchange, the electric
field becomes fully delocalized and the P515 complex is exposed to
an increased electric field which is manifested by the generation
of the slow phase.
Zimanyi and Garab (1982), however, have interpreted the slow rise
in terms of the actual translocation of light-induced charges from
the dielectric membrane into the surrounding conductive phases. Their
model calculations indicate that such an event induces an enhanced
electrochromic response of the photosynthetic pigments. The slow rise
is associated with the slow redox-cha'in-related charge transport pro
cesses, where the neutralization of the localized charge on cytochrome
f+ is concomitant with the release of a proton. It is this proton
translocation through the boundaries of the membrane, which is argued
to induce an increase in the electric field and hence the generation
of a slow phase.
Schapendonk et al (1979) have taken another different view on the
origin of the slow phase. By correlating their flash-induced absorp
tion changes with previous measurements of the transmembrane potential
using microelectrodes (Vredenberg and Tonk, 1974), they have observed,
instead, a much slower rise, of approximately 100-150ms, in the elec-
trochromic absorption change. This very slow phase has been inter
preted to reflect slow intra-membranal changes induced by field-depen
dent charge displacement in the vicinity of the P515 complex. Further
more this slow phase has been shown to be activated by PS1 alone
(Schapendonk and Vredenberg, 1979).
1.7 Objectives of this thesis:
The work presented in this thesis is primarily directed towards
a clearer understanding of the underlying mechanism generating the
slow phase (phase b) of the flash-induced 5l5nm electrochromic shift
in chloroplasts. The approach taken in this study is similar to that
taken in bacterial chromatophores, where the slow phase (phase III)
is thought to be a manifestation of a secondary electrogenic event
associated with electron transport. The results are thus analysed in
terms of distinguishing between a Q-type cycle (which would include a
Mitchellian Q-cycle and Wikstroms b-cycle: see section 1.3.2) or a
simple linear electron transport scheme (see section 5 .6 ).
The dependence of phase b on ambient redox poise is initially
characterized (chapter 4-) and its occurrence under different electron
transport conditions investigated, concomitant with a study of the
flash-induced cytochrome redox reactions (chapter 5). The involvement
of proton uptake and proton release is also investigated (chapter 6 ),
with the final results section (chapter 7) concentrating on the effect
of inhibitors. Redox titrations of the fast phase (phase a) of the
515nm electrochromic shift are also carried out (chapter 4-). These
are subsequently used (chapter 5 ) to monitor the ambient redox state
under the particular conditions imposed to observe phase b. Together,
these results suggest that phase b is a manifestation of the state of
electron transport in a similar manner that phase a records the acti
vity of the primary reaction centres. Alterations in the organization
of the photosynthetic components within the thylakoid membrane, as in
duced by changes in cation concentrations, are also found to affect
both phase a and phase b (chapters 4- and 5 ).

The alternative interpretations of the origin of phase b, presented
in section 1 .6.3 , have been considered in the first results section
(chapter 3 ) where the electrochromic nature of phase b is characterized.
The validity of these interpretations are discussed both in this chap
ter and in chapter 8, where the results presented in this thesis are
summarized and inter-related.
66
CHAPTER 2
Materials and Methods
2.1 Chloroplast preparation:
The chloroplast preparation used in this study yielded Class I type
chloroplasts: these have their outer envelope intact and are able to
maintain electron flow with CO^ as the terminal electron acceptor.
Such chloroplasts are suitable for studying the flash-induced absor
bance changes of the electron transport reactions since they contain a
full complement of soluble redox components (e.g. ferredoxin), and they
possess thylakoid membranes with low ionic conductivity (i.e. not leaky)
and which are stable over long periods of time after isolation. For
experiments, these intact chloroplast were subjected to osmotic shock.
The chloroplast preparation described below is a modification of that
used by Nakatani and Barber (1977).
Throughout this study, the leaves of 10-day old peas (Pisum sativum ,
variety: Feltham First) grown from micoldusted seeds in Vermiculite under
supplementary lighting conditions (16 hour day), in a greenhouse, were
used.
2.1.1 Preparation of Class I intact chloroplasts:
70g of freshly harvested pea leaves were macerated, using a Polytron
(type PT 35 OD), in 20Og ice-cold grinding medium consisting of 0.33M
sorbitol, 0.2mM MgCl^» 20mM MES, adjusted to pH 6.5 with Tris. The
resulting homogenate was filtered through 10 layers of muslin cloth,

the first two layers being separated by a thin layer of cotton wool. ■
The filtrate was collected on ice and then subjected to centrifugation
at 2200 xg for 4-5 seconds at 4°C* The supernatant was removed, and
the hard and soft pellets were resuspended carefully, using a paint
brush, in a medium containing low levels of cation (0.33M sorbitol,
adjusted to pH 7.5with Tris), before being subjected to centrifugation
at 2200 xg for 20 seconds at 4-°C. This time both the supernatant and
soft pellet were removed carefully by aspiration, and the hard pellet
was resuspended at high chlorophyll concentration in the low cation
medium, 3mM MgCl^subsequently being added. These intact chloroplasts
were then stored on icej'
2 .1 . 2 Determination of chlorophyll:
The amount of chlorophyll present in the chloroplast suspension,
prepared as detailed above, was determined by the method of Arnon (194-9),
and was 'typically 2 -3 mg/ml.
An aliquot of the chloroplast suspension, nominally 20 pi, was add
ed to 80$ acetone in a volumetric flask, such that the final total
volume was 10ml: the chloroplast suspension was thus diluted by a
factor of 500. This mixture was then shaken well and subsequently
passed through a filter, into a test-tube, so as to remove any coagula
ted protein particles. The light absorption of the resultant superna
tant was then measured in a Perkin-Elmer 554- spectrophotometer, against
a blank (of 80$ acetone), at 64-5, 663 and 750nm. The measurement at
750nm was used to determine the degree of light scattering in the sample.
The chlorophyll concentration was then determined using the following
formula, which also takes into account the chlorophyll dilution factor
(see earlier):
* Footnote, Intactness estimated by comparing the ability of potassium ferricyanide to accept electrons before and after osmotic shock and was typically 50-60%.
67

Total chlorophyll = { [8,02 x AA^^] + [20.2 x AA^*.] } x 500 (pg/ml)
The absorption values, AA, at both 64.5nm and 663nm are corrected for
scattering by subtracting the absorption value at 750nm.
2.2 Flash-induced absorption measurements;
The main theme of this study has been to probe electron transport
related events, occurring in the millisecond time domain, induced by
a short (lOys) pulse of saturating light. The events of interest have
been electric field generation, cytochrome redox changes, P700 redox
changes and proton uptake/release.
2.2.1 Apparatus;
Flash-induced absorption measurements were made with a single-beam
flash apparatus constructed by Applied Photophysics Ltd.; a schematic
diagram of the apparatus is given in Fig. 2.1. The measuring beam was
provided by a 100W tungsten halogen lamp and passed through an M300
high radiance monochromator (slit widths 1.25mm). The intensity of_2the measuring beam was less than 0.2Wm . After passing through a 10mm
path length cuvette, containing the sample, the measuring beam fell
directly onto the photomultiplier head, which had been placed right
up to the side of the cuvette so as to minimize loss of light due to
scattering from the sample. Saturating light pulses, of ICps pulse
duration (width at half height), were provided by a xenon flash tube
placed at right angles to the measuring beam. For most absorption
measurements, the actinic flash was filtered through a 2mm Schott
RG665 filter and the photomultiplier was protected by a 4-mm Corning
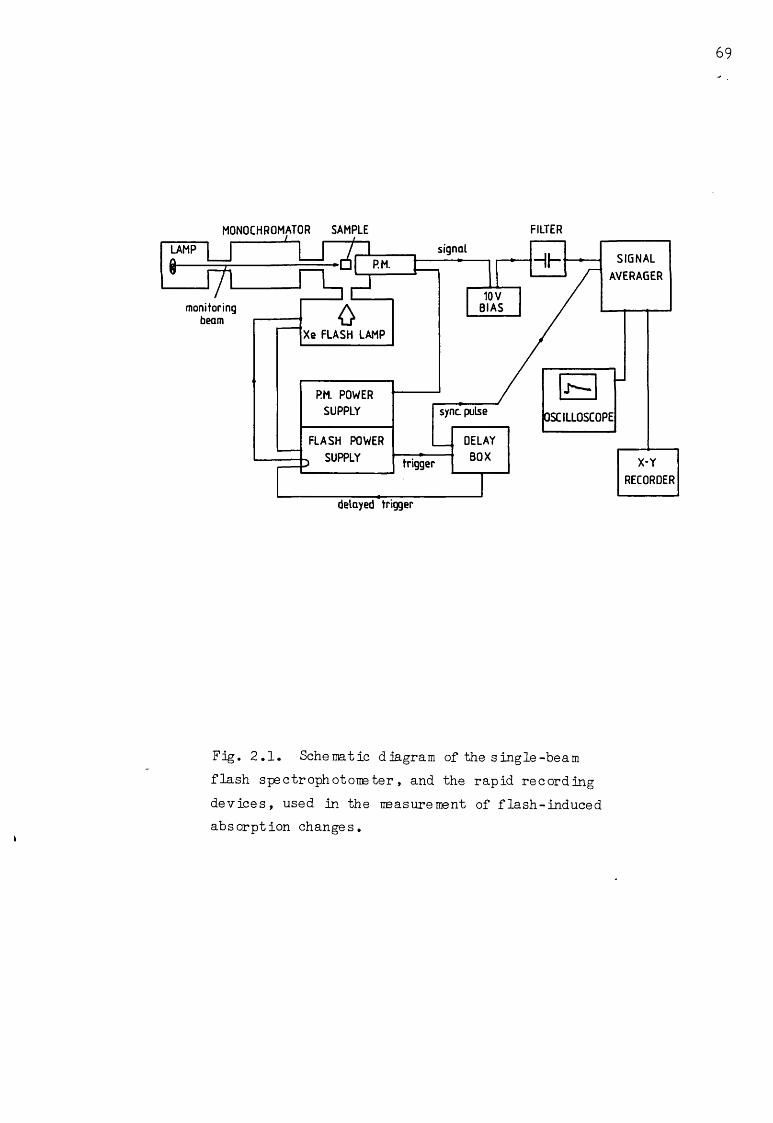
MONOCHROMATOR SAMPLE FILTER
delayed trigger
Fig. 2 .1 . Schematic diagram of the s ingle-be am flash spectrophotometer, and the rapid recording devices, used in the measurement of flash-induced absorption changes.

4.-96 filter. For the measurement of P700 absorption changes,
however, the actinic flash was filtered through a 4-nim Corning 4-96
filter and the photomultiplier was protected by a 2mm Schott RG665
filter. The signal from the photomultiplier was biased against a 10V
direct current output and was thenfed into a signal averager (Nuclear
Measurements, model 54-6C). The number of signals averaged (repeti
tion rate 0.1Hz) depended on the absorption change being recorded (see
later). The final signal could be viewed on an oscilloscope (Tele-
quipment model S51B) and plotted on an X-Y recorder for further analy
sis. The time constant of the apparatus was normally 3ms and experi
ments were in general performed at 20°C.
2.2.2 Flash-induced 515nm electrochromic absorption changes:
The electrochromic shift was measured at 515nm by taking an average
of 8 single sweeps (unless otherwise stated).
Intact chloroplasts, equivalent to 50yM chlorophyll in 2ml, were
osmotically shocked in the cuvette, on ice, for 30 seconds, in 1 .0ml
distilled water containing either lOmM MgCl^(for stacked membranes)
or 20mM KCl(for unstacked membranes) (see Barber, 1980). An equal
volume of double strength buffer was then added to give a final con
centration of 0.33M sorbitol, lOmM tricine/KOH (pH 8.3)and either 2+ +5mM Mg or lOmM K . Also present in the sample was a fixed back
ground level of lOmM K+ from the buffer medium.
For experiments involving linear and cyclic electron flow through
PS1, DCMU (25UM) was added together with a suitable reluctant. The
reductants used in this study were: sodium dithionite (lmM) made up in
the above buffer medium; the couple ferredoxin (5uM) and NADPH (0.5mM),

in the presence of the oxygen trap glucose (5mM), glucose oxidase
(O.lmg/ml) and catalase (0.2mg/ml); and duroquinol (0.5mM), prepared
by the method of Izawa and Pan (1978). The reductants dithionite
and duroquinol gave rise to pseudocyclic electron flow, while the
couple, ferredoxin and NADPH maximized the endogenous cyclic electron
flow. In addition to these reductants, the effect of the reducing
couple ascorbate (0.5mM) and DCPIP ($0mM) was also investigated.
Linear electron flow alone through PS1 was achieved by using the
same conditions as above, i.e. + DCMU + reductant, but also in the
presence of methyl viologen (50yM).
2.2.3 Flash-induced cytochrome and P700 absorption changes:
Cytochrome f and cytochrome b-563 were measured at 554-nm minus
54-Onm and at 563nm minus 54-Onm, respectively, by averaging 16 sweeps
at the measuring wavelength and subtracting the same number of sweeps
at the reference wavelength. Similarly, P700 was measured at 703nm
minus 730nm; an average of 16 sweeps was also recorded. For these
measurements the samples were prepared as described in section 2 .2 .2
except that valinomycin (2yM) and nigericin (2yM) were also present:
this ensured that any contribution from the relatively large electro-
chromic shift at 515nm was eliminated.
2.2.4- Redox titrations of the flash-induced 515nm absorption change:
Redox titrations of the flash-Induced 515nm absorption change were
carried out at 20°C using the standard criteria required for redox
potentiometry (see Dutton, 1978). A similar cuvette to that described
* Footnote. Pseudocyclic electron flow is defined as the electron transport induced,in the presence of DCMU, by exogenous reductants. ** Footnote. Ferredoxin, purified from Spirulina maxima, was the kind gift of Dr.K.K.Rao, Kings College, London.
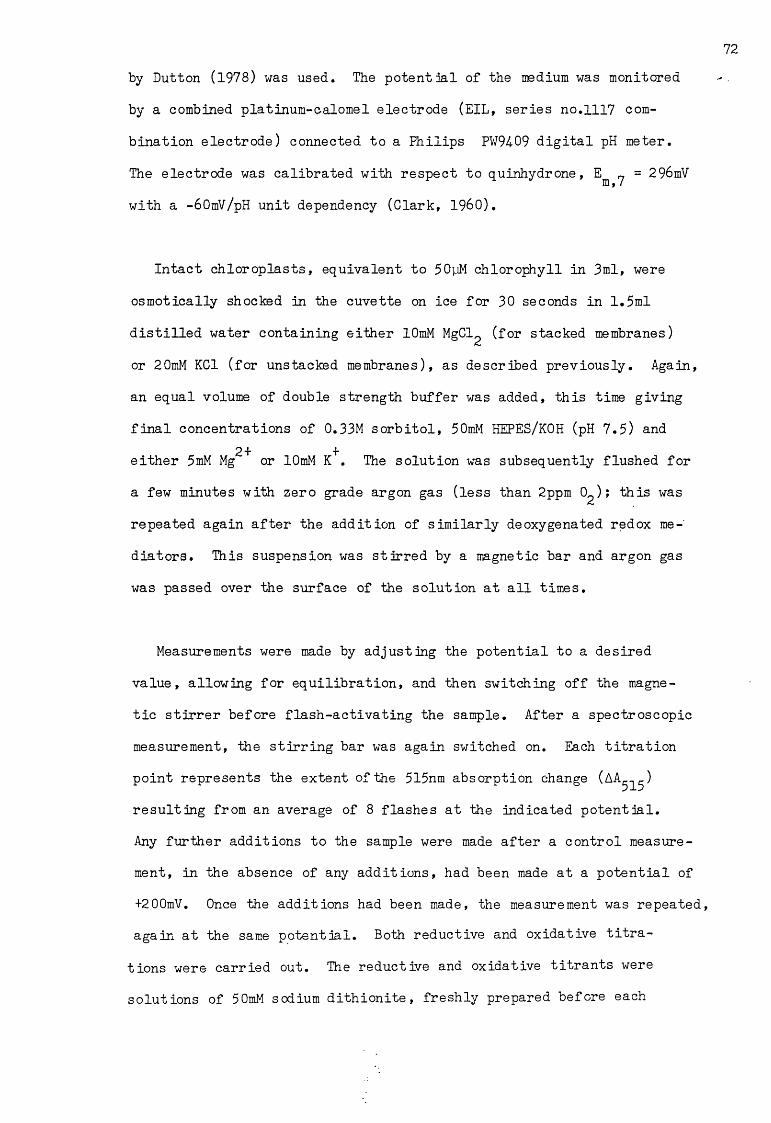
by Dutton (1978) was used. The potential of the medium was monitored
by a combined platinum-calomel electrode (EIL, series no.1117 com
bination electrode) connected to a Philips PW94-09 digital pH meter.
The electrode was calibrated with respect to quinhydrone, = 296mV
with a -60mV/pH unit dependency (Clark, I960).
Intact chloroplasts, equivalent to 50yM chlorophyll in 3ml, were
osmotically shocked in the cuvette on ice for 30 seconds in 1 .5ml
distilled water containing either lOmM MgCl^ (for stacked membranes)
or 20mM KC1 (for unstacked membranes), as described previously. Again,
an equal volume of double strength buffer was added, this time giving
final concentrations of 0.33M sorbitol, 50mM HEPES/KOH (pH 7.5) and 2+ ieither 5mM Mg or lOmM K . The solution was subsequently flushed for
a few minutes with zero grade argon gas (less than 2ppm 0^); this was
repeated again after the addition of similarly deoxygenated redox me
diators. This suspension was stirred by a magnetic bar and argon gas
was passed over the surface of the solution at all times.
Measurements were made by adjusting the potential to a desired
value, allowing for equilibration, and then switching off the magne
tic stirrer before flash-activating the sample. After a spectroscopic
measurement, the stirring bar was again switched on. Each titration
point represents the extent of the 515nm absorption change (AA^^^)
resulting from an average of 8 flashes at the indicated potential.
Any further additions to the sample were made after a control measure
ment, in the absence of any additions, had been made at a potential of
+200mV. Once the additions had been made, the measurement was repeated,
again at the same potential. Both reductive and oxidative titra
tions were carried out. The reductive and oxidative titrants were
solutions of 50mM sodium dithionite, freshly prepared before each

titration in 0.1M Tris-HCl(pH 9.0) and 50mM ferricyanide, respectively
A single titration took approximately 1-2 hours and care was taken
to avoid misleading artefacts due to ehloroplast degradation.
A list of Hie redox mediators employed is given below. They were
all used at a concentration of 25pM except phenazine methosulphate
which was used at 5pM. The number in parenthesis is the E „ of them, /mediator: ferricyanide (+430mV), DAD (t220mV), 1,2-naphthoquinone
(+14-3mV), phenazine methosulphate (+80mV), 1,4--naphthoquinone (+36mV)
duroquinone (+5mV), 2 ,5-dihydroxybenzoquinone (-60mV), 2-hydroxy-1,4-
-naphthoquinone (-130mV), anthraquinone-2,6-disulphate (-185mV) and
anthraquinone-2-sulphonate (-225mV). Control experiments with the
omission of individual mediators or changes in mediator concentration
demonstrated that there were no significant contributions of the
mediators to the absorbance changes.
Redox titrations were also carried out at different ambient pH.
The chloroplasts were suspended as described above but in the appro
priate buffer media. The media (double strength) used were of the
general form 0.66M sorbitol, lOOmM buffer/KOH (pH x). The buffers
were MES for pH6.7and HEPES for pH'7.0, 7.5 and 7.95.
The redox titration curves were fitted to the Nernst equation:
Eh = Em x + 2.303 RT log [ox].................. 2.1nF [ red]
where E is the midpoint redox potential: E, - E at half re- m,x h m,xduct ion point i.e. when [ox] = [red]. x is the ambient pH of the
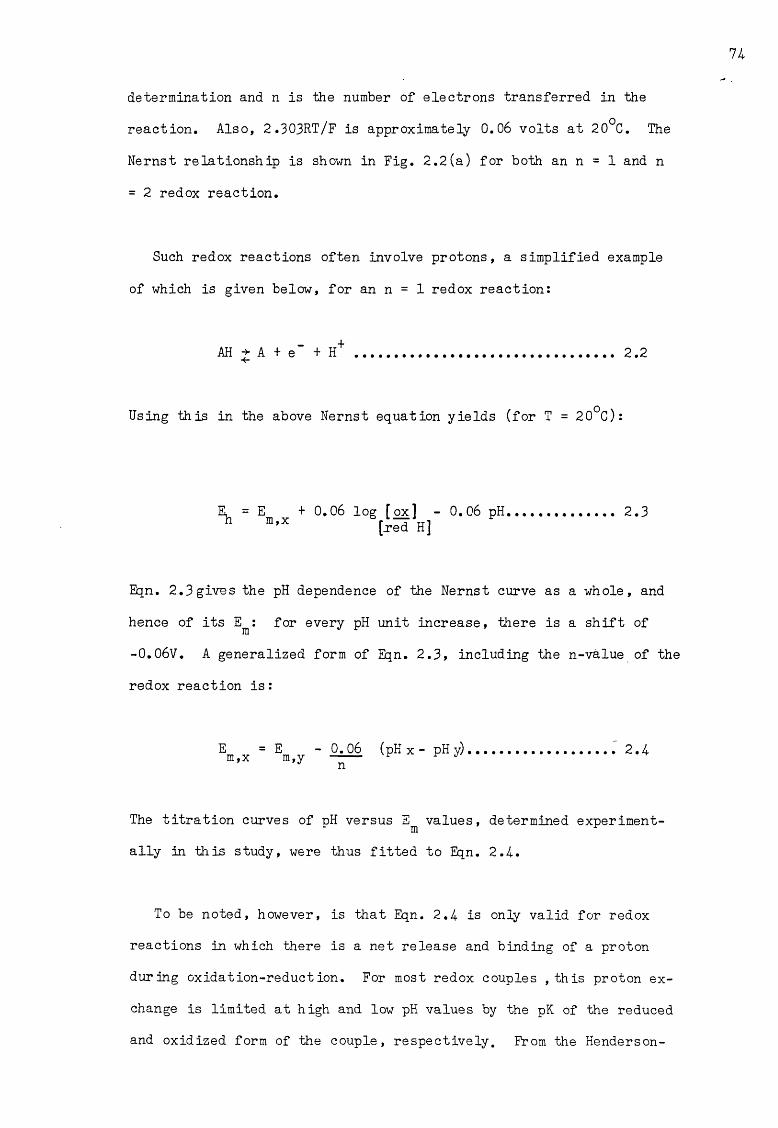
determination and n is the number of electrons transferred in the
reaction. Also, 2.303RT/F is approximately 0.06 volts at 20°C. The
Nernst relationship is shown in Fig. 2.2(a) for both an n = 1 and n
= 2 redox reaction.
Such redox reactions often involve protons, a simplified example
of which is given below, for an n = 1 redox reaction:
AH j A + e" + H+ ................................ 2.2
Using this in the above Nernst equation yields (for T = 20°C):
E, = E + 0.06 log [ox] - 0.06 pH...... . 2.3“ m,X [red H]
Eqn. 2.3 gives the pH dependence of the Nernst curve as a whole, and
hence of its E^: for every pH unit increase, there is a shift of
-0.06V. A generalized form of Eqn. 2.3, including the n-value of the
redox reaction is:
E = E -0.06 (pH x - pH y)................. .'2.4m,x m,y — — ^ ^ J
The titration curves of pH versus E^ values, determined experiment
ally in this study, were thus fitted to Eqn. 2.4.
To be noted, however, is that Eqn. 2.4 is only valid for redox
reactions in which there is a net release and binding of a proton
during oxidation-re duct ion. For most redox couples , this proton ex
change is limited at high and low pH values by the pK of the reduced
and oxidized form of the couple, respectively. From the Henderson-

Fig. 2 .2 (a). The Nernst curves for one- and two-electronredox couples. Under conditions when the measured extentof reduction is 50$ the redox couple is at its midpoint. Inthis example, the n=l or 2 redcx component is given atE of lOOmV. m
Fig. 2 .2 (b). The E^/pH relationship. Three regions are shown: pH<pK^, where E^ approaches pH independence; pKQx < pH <pK^^, where E^ varies approximately -60mV/pH unit; and pH > pK^e ,-where E^ again becomes pH independent. Dashed lines extrapolate to the respective pXs.

Em (mV)
(mV)
fraction reducedP
ON
Hasselbalch expression, pH = pK + log .{ [base.] / [acid] } , which is the
proton analogue of the Nernst equation,the pK is defined as the pH
when [base] = [acid]. The pKs of a redox couple can be revealed from
a plot of E^ values versus pH values: above and below the pKs, the
reaction in Eqn. 2.2 becomes simplified since there is no net proton
exchange, the value thus losing its dependency on the ambient pH»
see Fig. 2.2 (b).
There are therefore three distinct pH regions, to be kept in mind,
where different redox reactions predominate:
(a) at pH values > "the redox reaction is:
A + A + e ..... ..... .........................2.5
(b) at pH values between pKQX and pKre(j the predominant reaction
is as described in Eqn. 2.2
(c) at pH values < pK ox» the redox reaction is:
AH j A+H + e".......................... ..... 2.6
2.2.5 Flash-induced proton uptake from the outer aqueous phase:
Flash-induced proton uptake was measured in an unbuffered suspension
of chloroplasts by the absorption change of the pH-indicating dye
cresol red at 574-nm, pH 7.3(Junge and Auslander, 1973). This in
dicator dye is thought to be located in the outer aqueous phase and
not bound to the membrane (Petty and Dutton, 1976a). An average of
8 single sweeps was recorded: non-specific responses were virtually
absent at 574-nm as revealed by the zero signal after the addition
of 50mM tricine to the suspension, see Fig. 6.3(e). An alternative
dye to cresol red is phenol red, which has an absorption maximum at
558nm, pH 7.3.
Intact chloroplasts, equivalent to 50mM chlorophyll in 2ml, were
osmotically shocked in the cuvette on ice for 30 seconds in 1 .0ml
distilled water containing lOmM MgCl^. An equal volume of double -
strength buffer-free medium was then added to give a final concentra
tion of 0.33M sorbitol, 50mM KC1 andlOmM MgCl^, pH 7.3. Cresol red
(or phenol red) was subsequently added at a concentration of 4.0pM. The
pH of the sample was checked and, when required, readjusted to pH 7.3
by the addition of small aliquots of HC1 (1M) or KOH (1M).
The absorption changes of cresol red were calibrated into the num
ber of protons bound or released, by measuring the steady state absor
ption change on the mixing of a known amount of acid into the suspen
sion. Typically, lyl of ImM HC1 was added to 2ml: this is equivalent
to the addition of 1 nmole H+. A rise in absorption at 574-nm indicates
alkalinazation of the outer aqueous phase.
pH titrations of the cresol red absorption change were carried out
by altering the pH of the sample to the desired value by the direct
addition of aliquots of HC1 (1M) or KOH (1M).
2.2.6 Flash-induced proton release into the inner aqueous phase:
Flash-induced proton release was monitored by the absorption change
of the dye neutral red at 54-Onm, pH 7.3 (Junge et al, 1979). An average
of 8 single sweeps was recorded. Neutral red distributes itself over
the inner and outer phases of the thylakoid membrane, and hence can
indicate pH changes in both aqueous phases. The use of neutral red

as an indicator specific for pH changes in the internal phase can thus
be achieved by selectively buffering the pH changes in the outer phase
by a non-permeating buffer such as bovine serum albumin, BSA (Auslander
and Junge, 1975).
The chloroplast sanple was prepared as described in section 2.2.5 ,
but BSA was also present in the double strength medium at a final con
centration of 2mg/ml. Neutral red was then added at a concentration
of 4-OjjM. Also present was valinomycin (2yM) to eliminate the large
contribution from the 515nm electrochromic absorption change. No
further artefacts contributed to the neutral red absorption change as
indicated by the null signal observed upon the addition of the permea
ting buffer imidazole (20mM), see Fig. 6.6 (b). A rise in absorption
at 54-Onm is indicative of acidification of the inner aqueous phase. A
method used for the calibration of this signal will be discussed later.
2.3 Steady state chlorophyll fluorescence measurements:
Chlorophyll fluorescence was induced by broad band actinic light
obtained from a tungsten-halogen light source passed through a com
bination of Schott BG18 (2mm) and Schott BG38 (2mm) cut-off filters:_2this resulted in a light intensity of 30Wm . The fluorescence was
detected at right angles by an EMI 9558B S20 photomultiplier protected
by a Balzar B-4-0 693 interference filter and a Schott RG695 cut-off
filter. The output from the photomultiplier was displayed directly
onto a pen chart recorder. All chlorophyll fluorescence yield measure
ments were carried out at room temperature.
The membranes were suspended as described in section 2 .2 .2 , in
either the stacked or unstacked condition, but giving a final total
volume of 3ml; DCMU (20yM)was subsequently added. To observe salt-

induced chlorophyll fluorescence, MgCl^^mM) was added to a chloroplast
suspension, initially prepared in the unstacked state, and rapidly
mixed in.

CHAPTER 3
The electrochromic -properties of the 515nn absorption change
The central feature of this thesis is the use of the intrinsic phot
synthetic voltmeter, the 515nm electrochromic absorption change,
AA^.^, to monitor flash-induced electron transport processes. As
stated in the introduction (sections 1 . 5 and 1 .6 ), under certain
conditions, the flash-induced AA,.. is comprised of two kinetically
distinct rise components: an initial fast phase (phase a) and a
subsequent slow phase (phase b). The basic physical features of these
two phases are presented in this chapter, and of fundamental import
ance, their electrochromic nature is emphasized. Also characterized
is the nature of the underlying electric field (i.e. localized or
delocalized) responsible for the rise and decay properties of phase a
and phase b.
Except where stated, the experiments discussed here were carried
out with stacked thylakoid membranes, under the condition of pseudo-
cyclic electron flow (see section 2.2.2): high concentrations of DCMU
were added so that electron input from PS2 was blocked, and reductant
was supplied to obtain suitable redox poise for PS1 turnover.
3.1 Physical features of the 515nm absorption change:
Fig. 3.1(a) shows a typical flash-induced absorption change with
biphasic rise kinetics. The addition of DBMIB, at a concentration
which blocks plastoquinol oxidation, has little effect on the extent
of the fast phase (phase a) but results in a loss of the slow phase
(phase b), Fig. 3.1(b). From a comparison of the decay kinetics of
Figs. 3.1(a) and (b) it is noted that DBMIB also introduces a slight

Fig. 3.1. Flash-induced for stacked thylakoidmembranes. Conditions are as described in section 2.2.2 for pseudocyclic electron flow, with dithionite as re- ductant. (a) control, with no further additions; (b) as (a) + 15yM DBMIB: this reveals the extent and kinetics of phase a; (c) subtraction (a) - (b): this reveals the extent and kinetics of phase b.

increase in the relaxation rate of the electric field. Since the
contribution of phase b is revealed by the subtraction of the signals
t DBMIB, see Fig. 3.1(c), this latter effect may introduce an arte
fact in both the extent and the subsequent decay kinetics of phase b.
The ratio of the extent of phase a to phase b, under these conditions
of pseudocyclic electron flow, is, at maximum 1 :1 , but depending on
the sample, this ratio can be lower.
The rise of phase a is very rapid, occurring within the nanosecond
timescale (see Wolff et al, 1969). The decay of phase a occurs with
a half-time, t^, of approximately 100ms and is exponential, as reveal- 2
ed by its semilogarithmic plot, Fig. 3.2(a); phase a is thus said to
exhibit 1st order decay kinetics. Both the rise and decay of phase
b are also 1st order reactions, Fig. 3.2(b), and have a tx of approx-2
imately 10ms and 150ms, respectively. Both the decay of phase a and
that of phase b can be accelerated,in parallel, in the presence of
ionophores (see later).
3.2 Evidence for the electrochromic nature of the AA„„:---------------------------- — ----------------------------515
The electrochromic nature of the fast phase a has been well charac
terized (Witt, 1975): it can be attributed to the electric field
generated at the reaction centres upon flash activation. An analysis
of phase a can thus provide some information concerning the state
of electron transport. An example is given in Fig. 3.3. When no
inhibitor or reductant is present, the magnitude of phase a is large,
Fig. 3.3(a); presumably the electric field generated at both PS1 and
PS2 contributes to its extent. Addition of DCMU, an inhibitor of
electron transport, results in an almost complete disappearance of
the flash-induced AA^ 5 , Fig. 3.3(b). This effect of DCMU is, however,
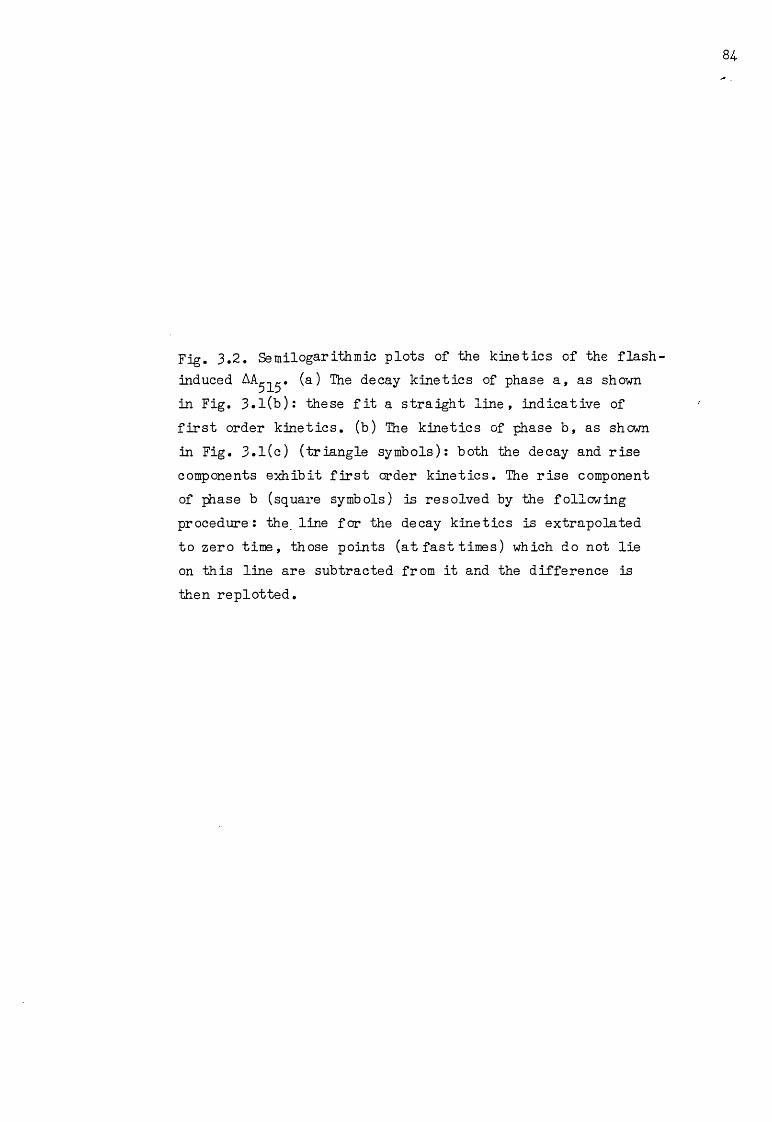
Fig. 3.2. Semilogarithmic plots of the kinetics of the flash- induced (a) The decay kinetics of phase a, as shownin Fig. 3.1(b): these fit a straight line, indicative of first order kinetics, (b) The kinetics of phase b, as shown in Fig. 3.1(c) (triangle symbols): both the decay and rise components exhibit first order kinetics. The rise component of phase b (square symbols) is resolved by the following procedure: the. line for the decay kinetics is extrapolated to zero time, those points (at fast times) which do not lie on this line are subtracted from it and the difference is then replotted.

85
40 160
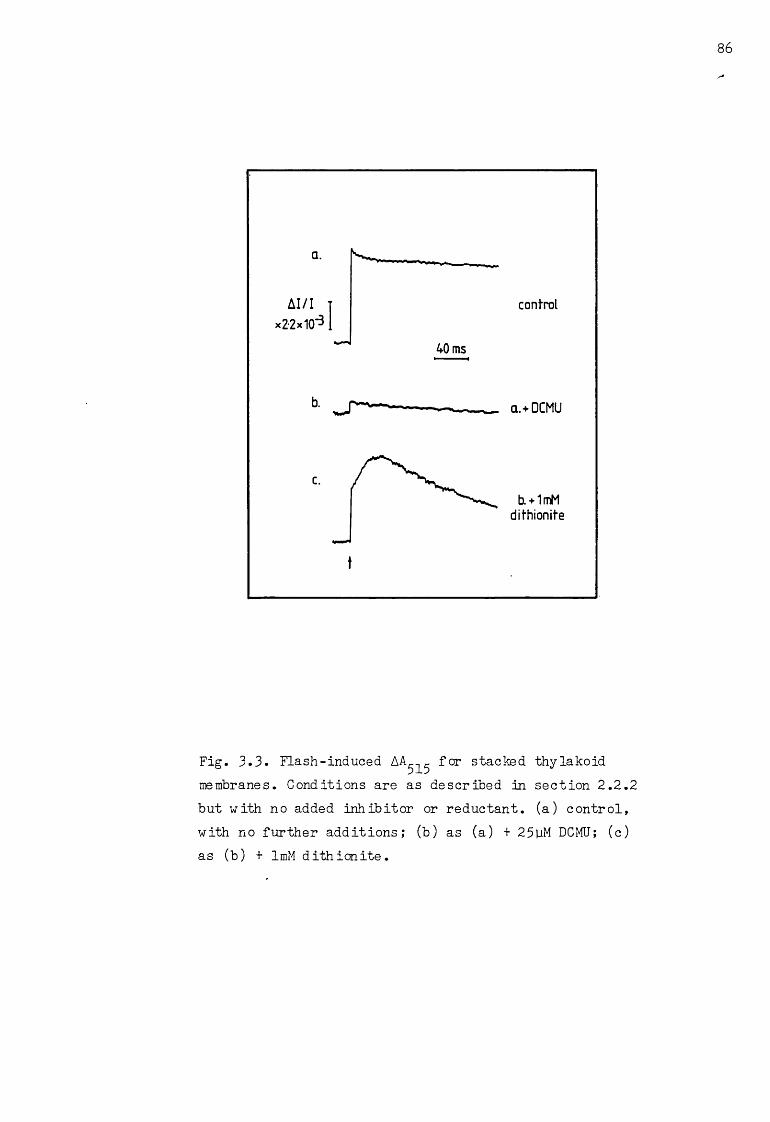
Fig. 3.3. Flash-induced AA^,. for stacked thylakoid membranes. Conditions are as described in section 2.2.2 but with no added inhibitor or reductant. (a) control, with no further additions; (b) as (a) + 25yM DCMU; (c) as (b) + lmM dith icnite.

not immediate; several flashes are required to enable the removal of
electrons from the inter-electron transport chain. Addition of re-
ductant (dithionite) restores phase a to about 50$ of its original am
plitude, Fig. 3.3(c); also, phase b is now apparent. Dithionite is
able to reactivate electron transport through PS1 by providing reduc
ing equivalents for the plastoquinone pool, PS2 turnover being blocked
by DCMU.
The flash-induced absorption spectrum of the dithionite-restored
phase a is given in Fig. 3.4-. It exhibits the characteristic electro-
chromic difference spectrum, see VJitt (1975), with a maximum at 515nm
and a minimum at 4-75nm. The spectrum of phase b, as monitored by the
extent of the AA^,. at 10ms, is also given in Fig. 3.4-»and matches
that of phase a very closely. This suggests that phase b also re
sults from an electrochromic phenomenon. The fact that the extent of
phase b is comparable with that of phase a indicates that phase b may
be generated by a single charge moving across the membrane (per reac
tion centre). These observations are in agreement with previous work
(Crowther and Hind, 1980; Olsen and Barber, 1981).
Further evidence concerning the electrochromic nature of phase
a and phase b, comes from studies with the electrophoretic ionophore
valinomycin (in the presence of K+). The criterion behind such a
study is as follows. The electric field generated across the thylakoid
membrane is dissipated by the passive efflux of cations and influx of
anions (see section 1.4-.2). Valinomycin accelerates the passive efflux
of K+ and consequently the rate of dissipation of the electric field
is increased. If phase a and phase b do reflect rises in membrane pot
ential, then valinomycin should affect their decay rates similarly.
The results are shown in Figs. 3.5(a) and (b): valinomycin is found
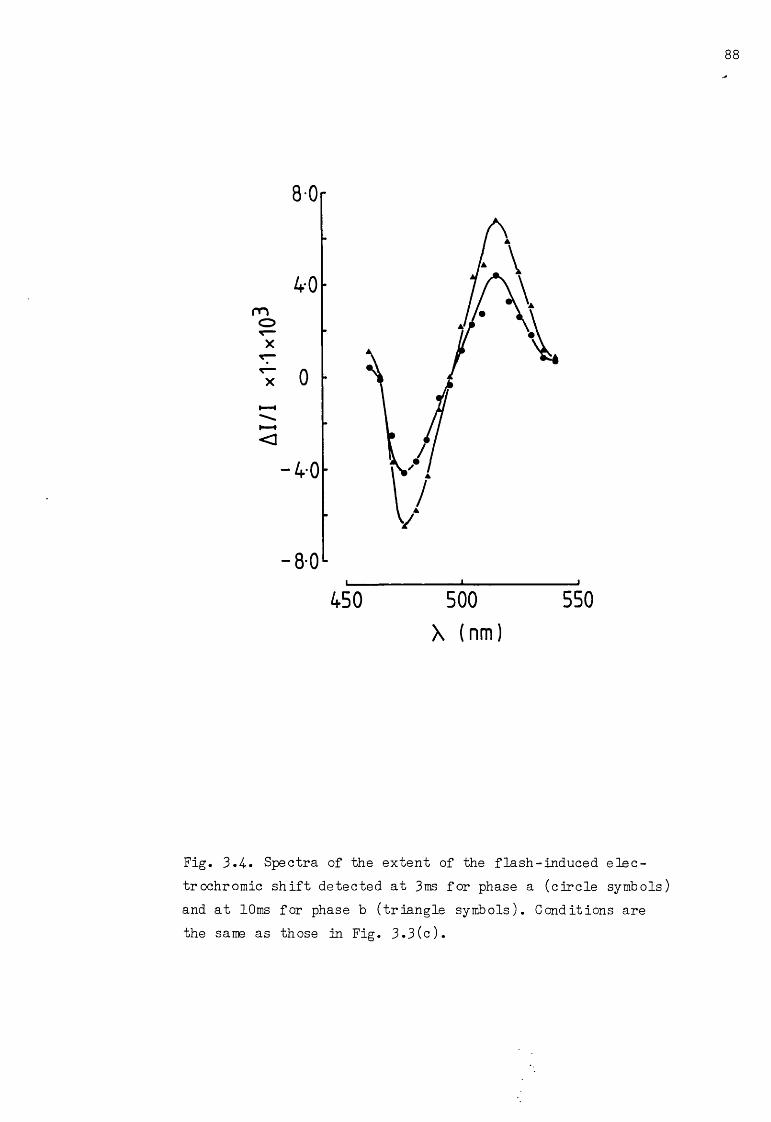
88
X (nm)
Fig. 3.4-. Spectra of the extent of the flash-induced elec- trochromic shift detected at 3ms for phase a (circle symbols) and at 10ms for phase b (triangle symbols). Conditions are the same as those in Fig. 3.3(c).

Fig. 3.5. Titrations of the flash-induced AA_,r with515valinomycin (val.) , and at different actinic light intensities. Conditions are those for stacked thylakoid membranes and of pseudocyclic electron transport (see section 2.2.2),with DQH^ as reductant. The extent and kinetics of phase a and phase b are resolved by the procedure given in Fig. 3.1. Valinonycin titrationof the t^ for the decay of (a) phase a and (b) phase
2b. Valinomycin titration of the maximum extent of (c) phase a and (d) phase b. (e) Valinomycin titration of the tjL for the rise of phase b. 100$ actinic
2light intensity (closed symbols); 25$ actinic light intensity (open symbols).

90
val. conc.(nM) val.conc. (nM)
val.conc. (nM) val. cone. (nM)
val. cone. (nM)
to accelerate the decay rate of both phase a and phase b, and over
the same concentration range. The consequence of the valinomycin
concentration required to cause an acceleration of the field decay
and that of the effect of lowering the actinic flash intensity will
be discussed in the next section. To be noted here, though, is that
the valinomycin titration curve for phase b does not drop quite as
rapidly as that for phase a: this is most probably a result of the
slight uncoupling effect of DBMIB discussed earlier. The difference
is not significant enough to suggest that the electric fields of phase
a and phase b are dissipated by different mechanisms.
3.3 Localized and delocalized electric fields:
The electric field generated across the thylakoid membrane, as
a result of charge separation at the reaction centres (phase a),
although initially localized, is thought to be rapidly delocalized.
This subsequent delocalization is experimentally supported by the ob
servation that less than one molecule of valinomycin is required per
10 electron transport chains to accelerate the rate of decay of phase
a by a factor of 2, see Fig. 3.5(a). This calculation assumes that
there are 600 chlorophyll molecules per electron transport chain; also
assumed is that the movement of a valinomycin molecule, between elec
tron transport chains, is slow. The above result is in agreement with
similar studies that have been carried out with bacterial chromatophores
(Jackson and Crofts, 1969), which conclude that the rapidly generated
electric field is also subsequently delocalized. If the electric field
responsible for phase a had remained completely localized for a very
long time, e.g. tens of ms, a minimum requirement to observe an accele
ration of its decay would have been one valinomycin molecule per elec
tron transport chain.

The decay rate of phase b is affected by valinomycin over the same
concentration range as in the case of phase a (compare Figs. 3.5(a)
and (b)). This suggests that the electric field monitored by phase b,
although generated on a slow timescale, is also subsequently delo
calized.
Lowering the actinic light intensity does not affect the decay
rate constant, i.e. tx, of either phase a or phase b, in the absence2
of valinomycin; nor does it affect the valinomycin titration curves
obtained in Figs.3.5(a) and (b), (note in each figure the curves
are superimposable). This is interpreted as further evidence for
the 1 st order nature of the reactions involved in the dissipation
of the electric fields generating phase a and phase b. Since such
decay reactions are exponential, their values are independent2
of the magnitude of the electric field (see later for the effect of
actinic light intensity), but are determined by the membrane permea
bility.
The effect of valinomycin on the amplitude of phase a is shown
in Fig. 3.5(c). Valinomycin is observed to have no effect, except
at high concentrations, when the field decay is very rapid (i.e.
faster than the 3ms time response of the apparatus). Such a rapidly
decaying field appears to cut into the amplitude of phase a, thus
reducing its extent. This particular effect is in fact usefully
employed in the study of flash-induced cytochrome redox changes (see
later): these experiments are carried out in the presence of high
concentrations of valinomycin (typically l-2uM), to eliminate the
contribution from the larger

The extent of phase b is, however, reduced, even at low valinomycin
concentrations, Fig. 3.5(d). Since the maximum extent of phase b
occurs at 20ms and not promptly, as for phase a, the field decay effect
on amplitude, discussed above, will be apparent at lower valinomycin
concentrations. Moreover, this effect must occur»to a small extent,
in the absence of any valinomycin, since the electric field generating
phase b ’’grows”, simultaneous to the electric field dissipation.
The effect of lowering the actinic light intensity on the amplitude
of phase a and phase b is also shown in Figs. 3.5(c) and (d). It is
assumed that such an effect will decrease the number of reaction cen
tres that are activated per flash. Experimentally, this can be obser
ved as a decrease in the amplitude of phase a. A similar decrease in
amplitude is also observed for phase b, indicating that the electric
field generating phase b is also dependent on the number of electron
transport chains activated. This intensity effect on the amplitude of
phase a and phase b, is independent of valinomycin concentration, as
observed by the parallel titration curves for the different actinic
light intensities, Figs. 3.5(c) and (d). A point to note in these
light intensity experiments is that while the intensity was dimini
shed by a factor of 75$, the amplitude of phase a was only reduced
by 30$. This shows that the 100$ actinic light intensity used in
all subsequent experiments is saturating.
Finally, Fig. 3.5(e) shows the effect of valinomycin on the rise
kinetics of phase b. Although the scatter of points is rather large,
(note the faster timescale), the general trend is that valinomycin
is effective over the same concentration range that it has an effect
on the decay. From the above arguments, this is indicative of a de
localized electric field: although phase b might initially be a lo
calized electric field, what is observed on a ms timescale is apparent
ly a delocalized electric field.
3.4- Discussion:
The results presented in this chapter indicate that phase a and
phase b, of the 515nm electrochromic absorption change, share analo
gous electrical properties. They exhibit similar absorption spectra,
Fig. 3.4-, the t^ values of their decay are similarly accelerated by
increasing valinomycin concentrations, Figs. 3.5(a) and (b), and their
extents are similarly dependent on the number of activated reaction
centres, Figs. 3.5(c) and (d). Concerning phase a, these results
would agree with its already well established electrochromic nature.
Phase a represents a rapidly formed localized electric field across
the thylakoid membrane which is subsequently delocalized by the redis
tribution of ions: it is attributed to the primary charge separation
occurring at the photochemical reaction centres upon light activation.
Although the electrical properties of phase b appear to mimick those
of phase a quite closely, it is observed that the generation of phase
b represents a delocalized electric field created across the thylakoid
membrane, Fig. 3.5(e). Phase b is also possibly associated with the
electron transfer reactions, especially since its inhibition by DBMIB
indicates the involvement of PQH0 oxidation. Hence, the use of phasea-
a and phase b, in subsequent chapters, as empirical indicators of trans
membrane electrical events, seems justified.
The validity of the alternative interpretations for the generation of
phase b, that were presented in section 1.6.3, are briefly discussed
below. A fuller discussion will be given in chapter 8. The Olsen and
Barber (1981) model would predict that the generation of phase b is
due to the delocalization of the electric field, generated by the fixed
dipole at PS1, by the release of the proton upon PQH^ oxidation. In

the absence of further experimental data, at this stage, it is not
possible to comment critically on this model. The Zimanyi and Garab
(1982) model proposes that it is the actual translocation of the
charged proton, upon PQH^ oxidation, across the membrane boundaries,
that generates phase b. This would seem to suggest that the rise of
phase b would be highly dependent on the membrane permeability and
hence strongly attenuated in the presence of low concentrations of
valinomycin. Such a marked effect on either amplitude or rise kine
tics of phase b is not observed in Figs. 3.5(d) and (e).
The slow phase observed by Schapendonk and Vredenberg (1979) has
instead been suggested to result from field-dependent conformational
changes. It must be noted here, though, that their analysis of the
is very different to that presented in Fig. 3.1. Their slow
phase, called reaction II, is obtained by subtracting the component
due to the fast electric field, called reaction I, as recorded with
microelectrodes, from that electric field registered by the P515 com
plex. In this way reaction II has been found to have rise kinetics
which are an order of magnitude slower than those of phase b. React
ion II and phase b cannot thus be correlated directly. What is of
interest here, though , is their interpretation of the effect of vali
nomycin. In the presence of valinomycin (20GpM) they also observe an
acceleration of the flash-induced However, again on the basis
of microelectrode studies, they assume that the decay of reaction I
is unaltered under these conditions. The subsequent subtraction to
yield reaction II indicates that its decay kinetics also remain un
altered, and that it is apparently the suppression of the magnitude
of reaction II that is responsible for the acceleration of the total
AA^-^. They therefore propose that reaction II cannot be directly
related to a transmembrane potential. The assumptions made in the
interpretation of their results and the conclusions they reach,con
cerning the nature of reaction II, are in complete contrast to those
presented in this chapter regarding phase b. However, as stated above,
the main reason for such a discrepancy, is in the analysis of the
components of the AA .. : Schapendonk and Vredenberg (1979) do not
consider the slow phase as defined in Fig. 3.1(c). A problem with
their particular analysis in fact concerns the interpretation of the
effect of DBMIB: their analysis would, seem to suggest that reaction
II still occurred in the presence of DBMIB. This is in contrast to
the results presented here and also to the assumptions made in the
alternative models discussed above.
The various models presented here, will be discussed more critically
later (chapter 8), by taking into account the results to be presented
in the following chapters. However, one particular feature that none
of these alternative models can really account for, is the redox depen
dence, observed by different groups, for the generation of phase b
(see section 1 .6 .2 ). This property is investigated more fully, in
the next chapter, for both phase a and phase b.
CHAPTER 4-
Redox potentiometric titrations of the 515nm absorption change
In this chapter the effect of salt on phase a and phase b of the
flash-induced 515nm electrochromic absorption change is characterized.
This property is further investigated in redox titrations of the AA^^.
The purpose of these redox titrations is to define more clearly the
reactions involved in the generation of phase a and phase b.
4-. 1 The salt dependence of the 515nm electrochromic shift:
Changes in salt concentration are known to bring about changes in
the degree of stacking of the thylakoid membranes and in the distri
bution of intrinsic protein complexes (Barber, 1980). The electro
static screening of the fixed negative charges on the thylakoid mem
brane, brought about by the addition of cations, induces changes in
the chlorophyll fluorescence emitted by PS2, and changes in energy
transfer from PS2 to PS1 which can be correlated with changes in mem
brane stacking and with alterations in the spatial separation between
the two photosystems.
Fig. 4-.l(a) shows the classical salt-induced fluorescence increase.
In the presence of low levels of monovalent cations, approximately
10mM K+, the chlorophyll fluorescence yield is low. Under these con
ditions the membranes are unstacked and energy transfer between PS2 and
PS1 is good, little energy being lost as fluorescence. Addition of low
concentrations of divalent cations, approximately 5mM MgCl^, results in
a large increase in chlorophyll fluorescence. Under these conditions
the thylakoid membranes reorganize into stacked and unstacked lamellae:
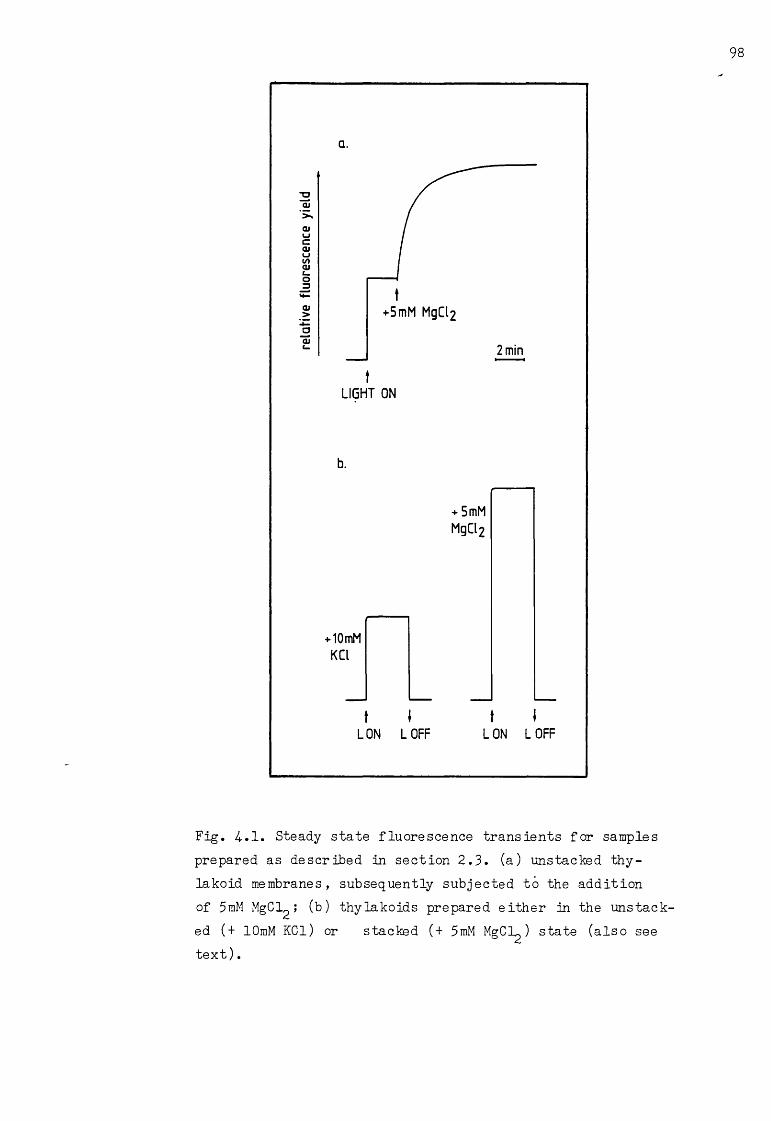
Q.
LIGHT ON
b.
LON LOFF LON L OF
Fig. 4..1, Steady state fluorescence transients for samples prepared as described in section 2 .3 . (a) unstacked thy- lakoid membranes, subsequently subjected to the addition of 5mM MgCl^; (b) thylakoids prepared either in the unstacked (+ lOmM KCl) or stacked (+ 5mM MgCl^) state (also see text).

energy transfer between PS2 and PS1 is decreased and a larger amount of
energy is lost in the form of fluorescence. A detailed analysis of this
phenomenon (Barber, 1980; 1982) has indicated that the decrease in PS2
to PS1 energy transfer is due to the separation of the two photosystems
into two discrete domains. These arguments, coupled with direct measure
ments on membrane fragments (Andersson and Anderson, 1980; Andersson
and Haehnel, 1982) indicate that PS2 is located in the appressed regions
of the thylakoid membranes, while PS1 is localized in the unstacked,
exposed membranes (also see sections 1 .2 .2 and 1 .2 .3 ).
To obtain the stacked or unstacked condition directly, the chloro-
plasts are shocked in the presence of lOmM Mg Cl^ (high salt) or 2 0mM KC12 4(low salt), respectively, giving final concentrations of 5mM Mg or
lOmM K+, as described in section 2 .2 .2. Fig. 4-. 1 (b) shows that this
procedure does indeed induce the required stacking condition: the chlo
rophyll fluorescence promptly rises to either a high or low level, as
determined in Fig. 4-. 1(a).
Such changes in salt concentrations,and hence the stacking condition,
also induce changes in the flash-induced electrochromic shift. These
are shown in Fig. 4-.2, where pseudocyclic electron transport is opera
tive, with dithionite as the reductant. Under low salt conditions phase
a is approximately 20$ larger than under high salt conditions, see
Fig. 4..2(b) . For phase b, however, this effect is reversed: its am
plitude is larger in the presence of high salt than in the presence
of low salt, see Fig. 4..2(c). To be noted, though, is that this effect
of 5mM MgCl^on the amplitude of phase b is not the result of an arte
fact introduced by an increase in membrane conductivity under this salt
condition: more pertinent is a slight increase in the decay rate of
phase a in the presence of lOmM KCl,see Fig. 4..2(b).

Fig. 4-*2. Flash-induced AA_-._ for stacked (full line) and unstacked (broken line) thylakoid membranes. Conditions are as described in section 2 .2 .2 for pseudocy- clic electron flow, with dithionite as reductant. (a) control, with no further additions; (b) as (a) + 15yM DBMIB; (c) subtraction (a) - (b).

Such an antagonistic behaviour of phase a and phase b to different
levels of mono-and divalent cations has also been observed by-
Olsen and Barber (1981). Their interpretation of these results (see
section 1 .6.3 ) led them to propose a delocalization model for the ge
neration of phase b. Alternative interpretations of the data are, how
ever, possible. In fact, use of this salt effect in the redox titra
tions to follow and in the results presented in chapter 5 enables
correlations to be made between phase a and phase b of the AAr-.r andpitelectron transport related events.
4.2 Redox potential titrations of phase a:
Redox potential titrations were carried out as described in section
2.2.4. Fig.4.3(a) shows the redox titration of the extent of phase a
(detected at 3ms) under stacked conditions and in the absence of inhi
bitors. At low redox potentials (less than + 200mV) phase a exhibits
a double wave in its titration. Each wave follows an n=l Nernst curve
(see section 2.2.4» Eqn. 2.1) and contributes a third to the total ex
tent of the AAr,,r. The midpoint potentials (E „ ,-) of each wave are PIP m,/ . p
+60mV and -195mV. The -195mV wave has a -60mV/pH unit dependency, as
shown in Fig. 4.4. A residual 515nm absorption change exists at redox
potentials < -400mV and presumably constitutes a third, non-titratable
wave. Such a double wave titration curve, at low potentials, is simi
lar to that observed by Malkin (1978) and to that very recently repor
ted by Diner and Delosme (1983) for detection times greater than 3ms.
Also observed in Fig. 4.3(a) is that at E^ values > + 300mV, the AA^^
becomes smaller: presumably this is due to the chemical oxidation of
the P700 electron donor of PS1. This component contributes more than
one third to the total extent of the A A 53.5 , and the data fits a single

Fig. 4.3. Redox titrations of the flash-induced AAc^rfolodetected at 3ms, for stacked thylakoid membranes suspended as described in section 2 .2 .4 . (a) in the absence of any inhibitors; (b) + 25yM DCMU; (c) + 25uM DCMU + 50yM MV. Reductive titrations (open circles); oxidative titrations (closed circles).
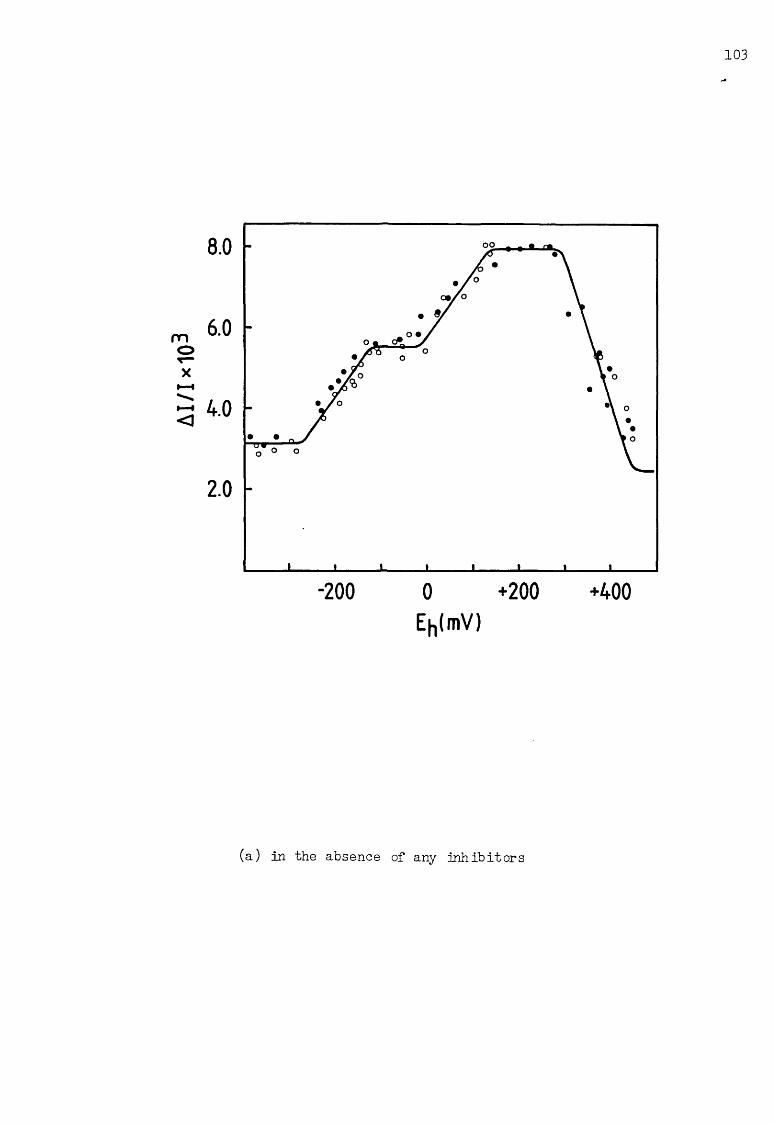
AI/
I*1
03
Eh(mV)
(a) in the absence of any Inhibitors
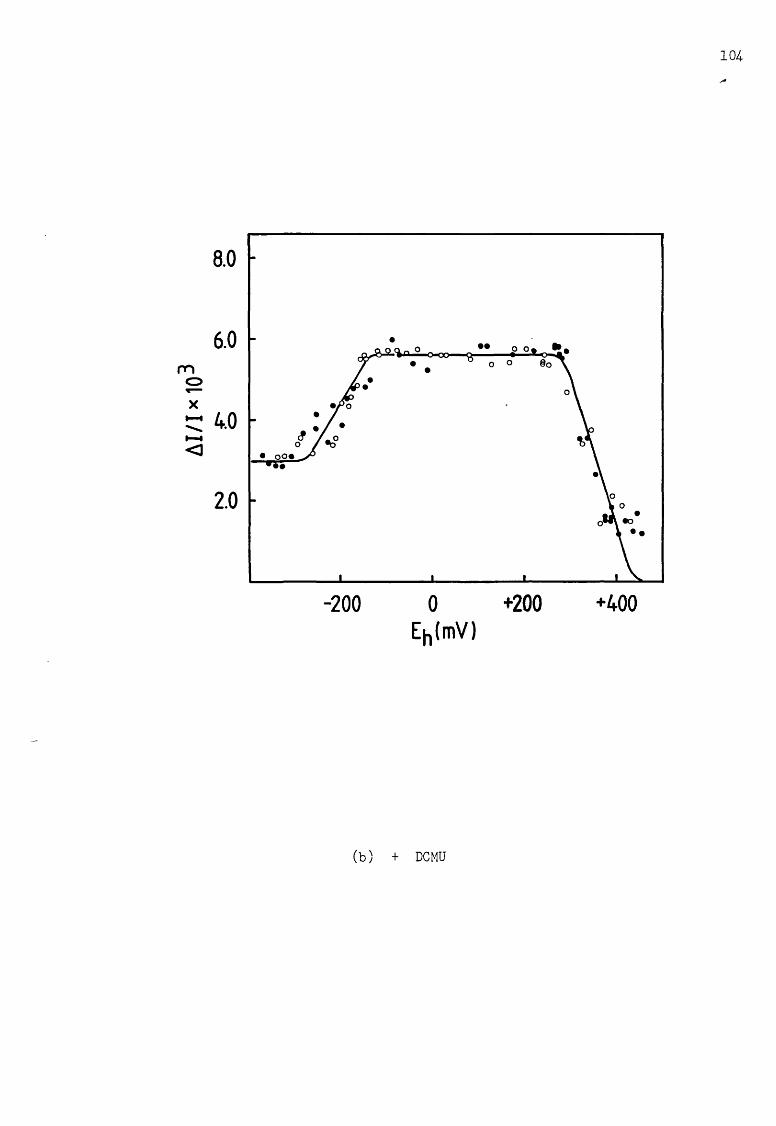
Eh(mV)
(b) + DC MU

105
E lmV)
(c) + DC MU + MV

pH
Fig. 4-«4-. pH dependence of the E^ for the low potential component of phase a (E^ 7 = -195mV), as determined under the conditions of Fig. 4..3(b). The required ambient pH was obtained by suspending the chloroplasts in the appropriate buffer medium, as described in section 2 .2 .4 .
n = 1 Nernst curve with an E = +37 OmV.m,7.5
In the presence of DCMU, which is known to inhibit PS2 photoche
mical activity, only the +6OmV component is completely inhibited,
Fig. 4..3(b). This suggests that the +60mV component is responsible
for the PS2 contribution to phase a. Both the -190mV and +370mV
titration waves are still observed in the presence of DCMU and re
tain unaltered amplitudes. Also, the extent of the residual 515nm
absorption change at redox potentials < -4.00mV is unchanged. This
implicates these three components as manifestations of the PS1 con
tribution to phase a. Further evidence for this conclusion comes
from a similar redox titration of phase a, but in the presence of
DCMU and methyl viologen; methyl viologen is thought to accept elec
trons from PS1. Fig. 4..3(c) shows that, under these conditions, the
-190mV wave is replaced by a non-titratable component, whose contri
bution at these low potentials is two-thirds of the total extent of
the AA . j in Fig. 4..3(a). From the relative extents of the compon
ents titrated in Fig. 4-.3, the PS1 contribution to phase a would
thus seem to be twice that of PS2. Possible explanations for this
observation will be discussed later.
Fig. 4-.5 shows similar redox titrations of phase a, but carried
out in the presence of low salt to ensure that the membranes are
fully unstacked. In the absence of DCMU, Fig. 4..5(a), a double
wave in the titration is still observed, but the relative contri
butions of each component are now altered. The -190mV component
is present with an unaltered extent, suggesting that it does not
result from an artefact due to the physical structure of the stack
ed membrane interfering with the equilibration of the redox media
tors. The remaining contribution to phase a at very low potentials

Fig. 4-. 5. Redox titrations of the flash-induced AA___, detected at 3ms, for unstacked thylakoid membranes suspended as described in section 2.2.4-. (a) in the absenceof any inhibitors; (b) + 25yM DCMU. Reductive titrations (open circles); oxidative titrations (closed circles).

Eh(mV)
(a) in the absence of any inhibitors

a o 2 <=:
-200 0 +200 +400Eh(mV)
• •
AI/
Ix10
ro o-F"*
OC7N O
8 •
oo <o “T”
no
is increased by approximately 12$. The most striking feature to
note in Fig. 4..5(a), though, is the shift in potential of the +60mV
component to -lOOmV and that its contribution has decreased by approx
imately 12$. Both the -190mV and -lOOmV titration waves can be fitt
ed to n = 1 Nernst curves. The -lOOmV component is a manifestation
of the PS2 contribution for unstacked membranes since the addition
of DC MU results in its loss, Fig. 4..5(b). The remaining components
in Fig. 4..5(b), are thus the PS1 contribution. Since the extent of
the -l90mV component remains unaltered in Fig. 4..5(b), it is the com
ponent with a midpoint redox potential < -4.00mV that is responsible
for the increase in phase a observed in Fig. 4..2(b) under low salt
conditions.
4-.3 Redox potential titrations of phase b:
Fig. 4-.6 shows the redox titration curve for phase b obtained with
stacked membranes, by plotting the 10ms amplitude of the Aa^.^ measured
in the presence of DCMU. An increase in the amplitude of the AA^^
is observed at potentials < + 150mV, correlating with the reduction
of the plastoquinone pool. At lower redox potentials, the Aa^ ^ is
attenuated with waves at -75mV and -195mV (pH 7.5). The titration
wave with an E „ r = -75mV is presumably associated with the loss of
phase b since it is not detected in the titration curve recorded at 3
ms, Fig. 4..3(b). Furthermore, it is absent from the 10ms titration
curve in chloroplasts supplemented with DBMIB, Fig. 4-.6. To be noted,
however, is that at these lower redox potentials, the extent of phase
b may be under-estimated due to an increased relaxation rate of the
absorption change. With DBMIB present, a titration wave with an
E n c ~ +250mV is also observed, Fig. 4-.6. The nature of this wave m, /. 5is uncertain, but may originate from the redox properties of DBMIB

8 0
_____i___________ ■ ■ «___________ i___________ i___________ i_____-3 0 0 -2 0 0 -100 0 *100 *200 *300
Eh(mV)
Fig. 1.6. Redox titration of the flash-induced AA^^, detected at 10ms, for stacked thylakoid membranes suspended as described in section 2.2.1. In the presence of 25yM DCMU (open triangles);in the presence of 25yM DCMU + 15yM DBMIB (closed triangles). Both redox titrations are reductive. The subtraction of these titrations yields the redox titration curve for phase b (see Fig. 1.7).

itself, and possibly indicates that the reduced form is an effective
uncoupler of the thylakoid membrane.
Fig. 4-.7(a) shows the phase b redox titration curve, obtained by the
subtraction of the two curves of Fig. 4-.6. Phase b is observed to
appear with an E _ _ = +100mV and to disappear with an E n c ~ -75mV;
both these waves can be fitted to an n = 1 Nernst curve and have a
-60mV/pH unit dependency, as shown in Fig. 4-.8. The +250mV wave due to
DBMIB introduces a slight complication.
As shown in Fig. 4..7(b), the addition of methyl viologen does not
inhibit the generation of phase b, indicating that cyclic electron flow
around PS1 is not an essential requirement for its generation (see
section 1.6.2): this is in agreement with the work of Selak and Whit-
marsh (1982). Redox potential titrations of phase b in the absence of
BCMU are complicated by the fact that the addition of DBMIB appears to
have an added effect of behaving as an inhibitor of PS2 (Trebst ejh al,
1979), and hence these results have not been presented.
The redox titration for phase b in the presence of DCMU and under
low salt conditions, Fig. 4..7(c), is very similar to that for the high
salt condition, Fig. 4..7(a). The expected decrease in amplitude of
phase b is not very large in comparison to that observed in Fig. 4..2(c)
this could be due to an increased rate of decay of phase a, in the
presence of the redox mediators and under the low salt conditions.
4-. 4- Discussion:
The redox titrations presented in this chapter characterize the
components responsible for the generation of phase a and those res-

Fig. 4-.7. Redox titrations of phase b, obtained as described in the legend of Fig. 4-.6 (also see text). The samples were prepared as described in section2.2.4- for (a) stacked thylakoid membranes, + 25yM DCMU; (b) stacked thylakoid membranes, + 25yM DCMU + 50yM MV; (c) unstacked thylakoid membranes, + 25yM DCMU.

115
a.
b.
c.

116
b .
Fig. 1.8. pH dependence of the for (a) the high potential component (E „ K = +100mV) and (b) the low potential component (E^ = -75mV) of phase b, as determined under the conditions of Fig. 1.7(a). The required ambient pH was obtained by suspending the chloroplasts in the appropriate buffer medium, as described in section 2.2.1.

ponsible for phase b. The effect of salt is also found to have some
interesting features.
The potentiometrie titration of phase a, Fig. 4-.3,indicates that
it is the light-induced reduction of three low potential acceptor ty
pes that generate the full transmembrane electric field. These three
acceptors have ^ of +60mV, -195mV and< -4-OOmV, respectively.
Only the titration wave with an E „ - = +60mV is inhibited by the
addition of DCMU. This species is probably the primary bound plasto-
quinone acceptor, designated Q^» and is equivalent to the high redox
potential quencher of chlorophyll fluorescence Q„ (Horton and Croze,n1979; Malkin and Barber, 1979). This same conclusion has been reached
both by Malkin (1978) and by Diner and Delosme (1983).
The DCMU -insensitive titration waves, see Fig. 4-.3(b), are presum
ably electron acceptors of PS1. Support for this conclusion comes
from the observation that, in DCMU-treated chloroplasts, the whole
absorption change is lost upon the chemical oxidation of the P700
donor, E _ _ = +350mV. This thus implicates the -19$mV wave as a m, /.5manifestation of part of the PS1 contribution to the Further
evidence for this conclusion comes from the observation that, at re
dox potentials where the -195mV component is reduced, the inhibition
of the can be overcome by the addition of methyl viologen, Fig.
4..3(c).
Malkin (1978), however, attributes a -235mV wave (pH 7.6)to the
low potential PS2 fluorescence quencher, (Horton and Croze, 1979),
due to its partial sensitivity to DCMU. Diner and Delosme (1983) also
observe a low potential wave with ^ = -24-OmV, but suggest that it
does not arise from the primary electrogenic reaction as it is not ob
served at 50]js. They find, instead, that the full extent of this -24-OmV

wave, observed at 3ms, is still apparent upon excitation with far-red
light, thus suggesting that it could be attributed to PS1. This latter
finding is in agreement with the results presented here. However,
limitation of the time resolution of the apparatus used in this pres
ent study (time resolution approximately 3ms) does not permit a more
detailed analysis of the risetimes of phase a of the electrochromic
shift, especially the -195mV component.
The identity of the two acceptor species of PS1 is uncertain. The
species with an E „ r < -4.00mV is probably a bound iron-sulphur m, /• ocentre (ferredoxin?), although sufficiently low redox potentials have
not been attained in these experiments to determine its actual mid
point. The origin of the AA*-. due to the light-induced reduction of
the -195mV species is even more difficult to determine. Its midpoint
potential is difficult to reconcile with the "classic” views of low
midpoint potential acceptors of PS1. Moreover, its involvement in the
generation of phase a, which is surprising, leads to the suggestion
that the PS1 contribution to the transmembrane electric field is twice
that of PS2. There is as yet no direct experimental evidence in sup
port of this. Indeed, most other types of studies favour a PS2: PS1
ratio of approximately 2:1 (Melis and Harvey, 1981).
A tentative model to account for the occurrence of the -195mV com
ponent in association with PS1 is that two acceptor types operate
in parallel in two functionally distinct PS1 reaction centres: one
would be involved in linear electron flow, resulting in the reduction
of NADP+, while the other could be associated with cyclic electron
flow, a possible candidate for its primary acceptor being a b-type
cytochrome. It is interesting to note that, from its midpoint redox
potential, the -195mV component could be a b-type cytochrome, similar

to the low potential form detected by Hauska et al(l983). The impli
cation of such a model, however, is that, apart from the expected
ratio of 1:2 for PS2:PS1, the population of PS1 reaction centres would
necessarily be heterogeneous: 50$ being involved in linear electron
flow and 50% being involved in cyclic electron flow. There is,how
ever, no experimental evidence in support of this.
An alternative explanation for the unexpectedly large contribution
of PS1 to the transmembrane electric field, is that, as a result of
the (relatively long) duration of the actinic flash used in these
experiments, double turnovers occur in the PS1 reaction centre. Delos
me et al (1978) observed that, using xenon actinic flashes lasting a
few microseconds, the fast rise of the electrochromic absorption change
was followed by a ’’slow” rise in the time range of 4-lOOus, and with
a half-rise time of 15-20ys. This slower phase was found to be speci
fically activated by PS1 alone. However, no such slow rise was obser
ved following a short actinic flash (of the order of ns), in agree
ment with the observations of Wolff et al (1969).
In the redox titrations carried out here, the actinic flash used
had a duration of 10us at half maximum amplitude. In view of the ob
servations by Delosme et al (1978), this would be sufficient to induce
double turnovers in PS1. One possible mechanism by which such double
turnovers could be envisaged to generate an electric field at PS1,
with two different acceptor species operative, is as follows. The
first turnover would generate the expected electron transport path
way from P700 through to ferredoxin. The photooxidized P700 would
then be rereduced by electron transfer from plastocyanin, with an
approximate t^ = 20ys (Delosme et al, 1978) and hence be able to turn
over again. In a second turnover, if the re oxidation of ferredoxin
is relatively slow, the electron cannot proceed via the same route as
before. Perhaps under such conditions a cytochrome acceptor, possibly

the low potentdal cytochrome b-563, is favoured. This could explain
why Diner and Delos me (1983) only detect the -24-OmV component at times
greater than 3ms since this would thus be the half time required for
the reduction of the low potential cytochrome b-563. To be noted,
however, is that since the contribution of the -195mV component matches
that of the < -4-OOmV component, for high salt conditions, Fig. 4..3(b),
all the flash-activated PS1 reaction centres would need to turnover
twice.
Turning now to the redox titrations of phase b, these indicate that
phase b is apparent over a redox potential span between +100mV and
-75mV, at pH 7.5 (see Fig. 4-.7). The high potential value is probably
set by the chemical reduction of the plastoquinone pool, E^ = + lOOmV
(Goldbeck and Kok, 1979). A similar result has also recently been
obtained by Girvin and Cramer (1983), and is consistent with the earlier
work on the generation of the slow phase in bacterial chromatophore
membranes (Prince and Dutton, 1977). In contrast, Crowther and Hind
(1980) found that, in chloroplasts, the appearance of phase b required
a much lower ambient potential, E^ 8 1 = ” 55mV. They suggested that
phase b is due to the reduction of an unknown low potential species,
designated V, which is not correlated with the reduction of the plasto
quinone pool.
The attenuation of phase b occurs with an E _ _ = - 75mV, Fig. 4-.7m, / o(a). This potential corresponds to that of the high potential cyto
chrome b-563 located in the cytochrome b^/f complex (Hauska e_b al, 1983)
It is thus suggested that the chemical reduction of this cytochrome
inhibits the generation of phase b. This observation is in contrast
to that of Girvin and Cramer (1983)• they observe that phase b can
still be detected at redox potentials significantly lower than -75mV
(pH7.5) and hence suggest that it cannot be related to cytochrome b-563

oxidation or to Q-cycle activity. In this context it should be noted
that,in the case of bacterial chromatophores, both the slow and fast
phases of the electrochromic absorption change titrate out with the in
hibition of photochemical activity, E^ ^ = OmV, and not with the che
mical reduction of the high potential cytochrome b-562, E^ ^ = + 50mV
(O’Keefe and Dutton, 1981). In these membranes, the equilibrium
midpoint potential of the reaction centre couple is higher
than that of the cytochrome b-566 with its E „ = -90mV.— m, /
The redox potential titration curves for phases a and b in the un
stacked condition are similar to those obtained in the presence of
divalent cations, except for two main differences:
- a shift in the E^ c of the DCMTJ-sensitive phase a component is
observed, from +60mV in stacked to -lOOmV in unstacked thylakoid mem
branes ;
- the contribution of PS2 to the 3ms extent of the electrochromic
shift is decreased, whereas that due to PS1 is increased, when un
stacked membranes are compared to stacked.
The shift in the equilibrium E^ of the quinone acceptor of PS2
may indicate that the redox couple is susceptible to changes in
surface potential. Such a shift may be mediated by a decrease in the
pK of the redox couple, (see section 2.2.4-).
Concerning the observed amplitude changes, there are a number of
possible contributing factors. One is that changes in the salt level
could induce changes in the surface charge density. Such an effect
might interfere with the delocalization of the electric field, generated
by each reaction centre, along the surface of the membrane . In
addition to this there are the known changes in the spatial sepa
ration between PS2, PS1 and the cytochrome b^/f complex (see section
1.2.2). Furthermore, the conductance properties of the membrane might
also be altered: changes in salt concentrations are accompanied by
changes in the relative amount of stacked and unstacked regions
and hence in the amount of exposed regions. An alternative possi
bility that such salt-induced amplitude changes in the AA^,, ref
lect changes in the redistribution of energy between the photosystems
can be discounted, since these experiments were performed using sat
urating light flashes.
CHAPTER 5
The electrochromic absorption change related to electron transport
The effectiveness of different reductants to generate phase a and
phase b of the flash-induced 515nm electrochromic absorption change is
characterized. The related flash-induced cytochrome redox reactions
are studied and the effect of salt levels on these signals investigat
ed. Furthermore, an attempt is made to correlate the generation of
phase b with specific electron transport reactions.
5.1 A comparative study of the with different reductants:
In this study a number of different reductants (see section 2.2.2)
are used to poise the electron transport system. Redox mediators have,
however, been omitted since their presence may alter the cytochrome
absorption changes examined later. On the other hand, in their absence,
equilibrium E^ may not be attained with the various reductants used;
this will be especially true for "artificial" reductants e.g. dithionite.
Fig. 5.1 shows that, according to the particular reductant used, the
extents of phase a and phase b of the AA^,. can vary. Such changes in
the AA^fj can be compared with the changes observed in the redox titra
tions of the AA^^, Figs. 1.3 and 1.7.
Fig. 5.1(a) shows the control AA___, in the absence of added in-515hibitor or reductant. As discussed earlier (section 3.2), both PS1
and PS2 are presumably operative under these conditions'and hence phase
a of the AA,.. . is large. Addition of DCMU inhibits electron transport
and subsequently inhibits charge separation in the reaction centres:
this thus leads to the inhibition of the generation of phase a.

Fig. 5.1. Flash-induced for stacked thylakoidmembranes. Conditions are as described in section2.2.2 but with no added inhibitor or reductant. (a) control, with no added reductant; (b) as (a) + ImM dithionite; (c) as (a) + 5]_N Fd + 0.5mM NADPH + 0^ trap (see section 2.2.2); (d) as (a) + 0.5mM DQH^J (e) as (a) + 0.5mM Asc + 50mM DCPIP. The traces obtained in the presence of these various reductants + 25yM DCMU are labelled.
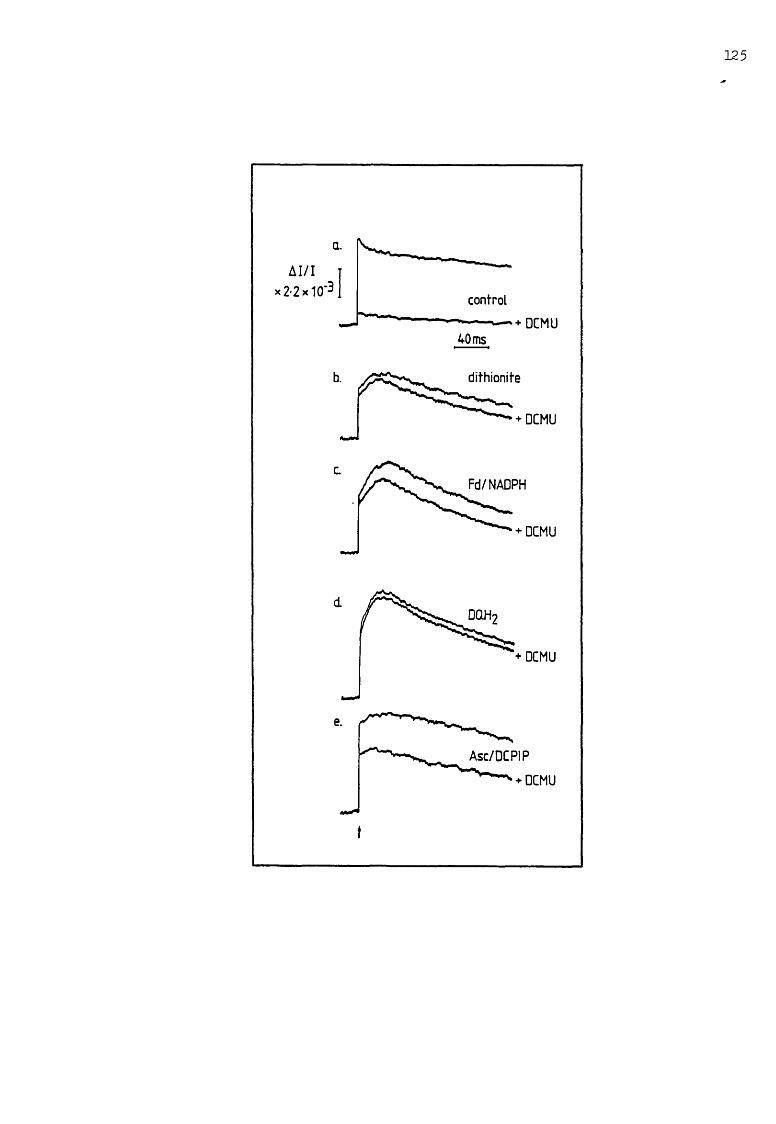
a.AI/I
x 2-2x 10'3 control■ + DCMU
40 ms

In the presence of dithionite, Fig. 5.1(b), and in the absence
of DCMU, the extent of phase a is inhibited by approximately 40%.
The addition of DCMU results in a further small decrease in the ex
tent of phase a. In view of the redox titrations presented in Fig.
4.3, the results in Fig. 5.1(b) suggest that, in the absence of
DCMU, dithionite acts partially on PS1, as well as on PS2, PS2 being
fully inhibited on the subsequent addition of DCMU. A possible ex
planation for this is that, in the absence of redox mediators, equi
librium is not fully attained in the presence of dithionite. Since
dithionite is apparently able to reduce chemically part of the -195mV
component, then from Fig. 4.7(a), phase b would be expected to be
inhibited at such low redox potentials. There is, however, a dis
crepancy since phase b is observed. A possible explanation for this
contradiction is that the control in Fig. 5.1(a) is an overestimation
of the true contribution from PS1 and PS2. Alternatively, the redox
titration of phase b shown in Fig. 4.7(a) is underestimated at these
low redox potentials. To be noted is that the extent of phase b is
unaltered by the addition of DCMU.
In the presence of the Fd/NADPH couple, Fig. 5.1(c), and in the
absence of DCMU, the extent of phase a is again inhibited, but only
by approximately 30%. This immediately suggests that the redox poise
set up by the Fd/NADPH couple is more positive than that in the pre
sence of dithionite. The Fd/NADPH couple is thus only able to reduce
part of the +60mV component, Fig. 4.3(a): this is subsequently totally
inhibited in the presence of DCMU, the remaining contribution to phase
a being due to PS1. The extent of phase b generated by the Fd/NADPH
couple is larger than that observed in the presence of dithionite.
This is in accordance with the redox titration of phase b, Fig. 4.7(a)

as the redox potential becomes more positive, the extent of phase b
increases. Again, the extent of phase b is unaltered by the addition
of DCMU.
The addition of duroquinol (DQH^), Fig. 5.1(d), in the absence
of DCMU, results in an approximate 25% inhibition of phase a. Only
by the addition of DCMU is the extent of phase a further decreased
to reveal the PS1 contribution alone. By comparison with the redox
titrations in Figs. 4..3(a) and (b), this suggests that DQH^ is a
milder reductant than the Fd/NADPH couple. Also, the large extent
of phase b, which is unaltered by the addition of DCMU, is in accord
ance with this.
The Asc/DCPIP couple is the mildest reductant investigated here.
In the absence of DCMU, approximately 90% of the control phase a is
still apparent, see Fig. 5.1(e). The addition of DCMU decreases this
extent to approximately 60% of the control, as is observed with DQH^ >
see Fig. 5.1(d). A rather small phase b is now generated, which is
still apparent upon the addition of DCMU. From the redox titration of
phase b, Fig. 4..7(a), it can be observed that, at redox potentials above
OmV, the extent of phase- b starts to decrease. The small extent of
phase b observed in Fig. 5.1(e) is an indication that the Asc/DCPIP
couple is unable to reduce the PQ pool.
By correlating the extent of phase a with the redox titration
curve for the A A ^ i n Fig. 4-.3(a), as described above, the following
ambient redox potentials are estimated for the particular reductant
present: dithionite, -200mV; Fd/NADPH, -lOOmV; DQH^, OmV; and
Asc/DCPIP, +10OmV. In the remaining part of this chapter, these
different reductants are used in an attempt to correlate the gener
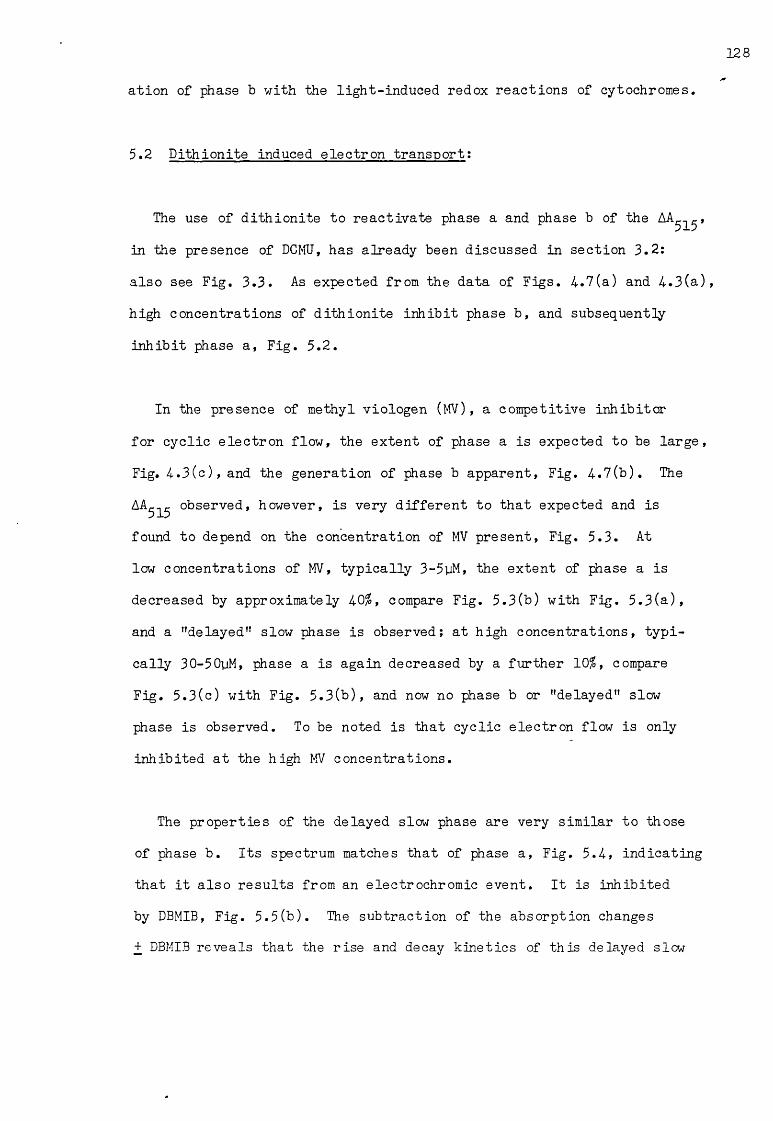
ation of phase b with the light-induced redox reactions of cytochromes.
5.2 Dithionite induced electron transport:
The use of dithionite to reactivate phase a and phase b of the
in the presence of DCMU, has already been discussed in section 3.2:
also see Fig. 3.3. As expected from the data of Figs. 1.7(a) and 1.3(a),
high concentrations of dithionite inhibit phase b, and subsequently
inhibit phase a, Fig. 5.2.
In the presence of methyl viologen (MV), a competitive inhibitor
for cyclic electron flow, the extent of phase a is expected to be large,
Fig. 1.3(c), and the generation of phase b apparent, Fig. 1.7(b). The
A^515 observed, however, is very different to that expected and is
found to depend on the concentration of MV present, Fig. 5.3. At
low concentrations of MV, typically 3-5yM, the extent of phase a is
decreased by approximately 10$, compare Fig. 5.3(b) with Fig. 5.3(a),
and a "delayed” slow phase is observed; at high concentrations, typi
cally 30-50yM, phase a is again decreased by a further 10$, compare
Fig. 5.3(c) with Fig. 5.3(b), and now no phase b or "delayed" slow
phase is observed. To be noted is that cyclic electron flow is only
inhibited at the high MV concentrations.
The properties of the delayed slow phase are very similar to those
of phase b. Its spectrum matches that of phase a, Fig. 5.1, indicating
that it also results from an electrochromic event. It is inhibited
by DBMIB, Fig. 5.5(b). The subtraction of the absorption changes
+ DBMIB reveals that the rise and decay kinetics of this delayed slow

B O
difhionite cone. (mM)
Fig. 5.2. Titration of the extent of the flash - induced AA^^» detected at 3ms for phase a (circle symbols) and at 10ms for phase b (triangle symbols), with dithionite. Conditions are as described in section 2.2.2 for stacked thylakoid membranes and for pseudocyclic electron flow, where the concentration of dith ionite is varied.

+ DCMU + dith.
c. 30|jM MV
t
Fig. 5.3. Flash-induced AA^*. for stacked thylakoid membranes. Conditions are as described in section2.2.2 for pseudocyclic electron flow, with dithionite (dith.) as reductant. (a) control, with no further additions; (b) as (a) + 3pM MV; (c) as (a) + 30yM MV.

131
mox
x
<3
Fig. 5.4-. Spectra of the extent of the flash-induced electrochromic shift detected at 3ms for phase a (circle symbols) and at 20ms for the delayed slow rise (triangle symbols). Conditions are as for Fig. 5.3(b).
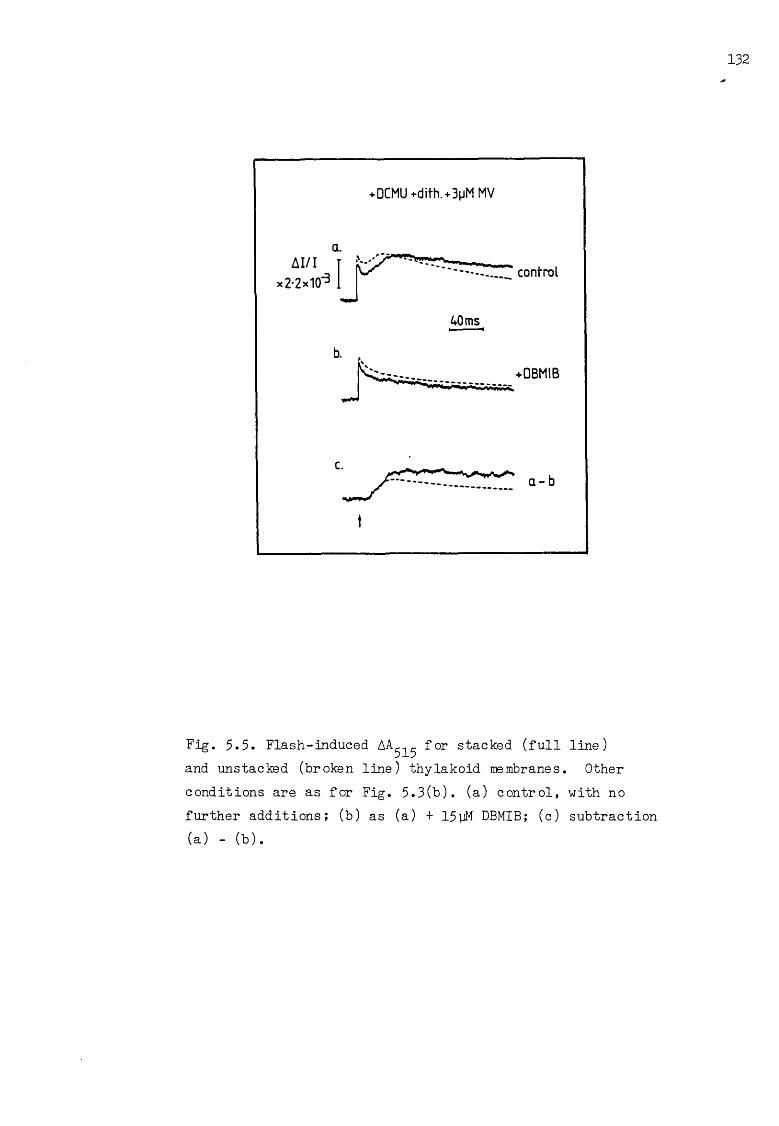
+DCMU +ditti.+3[jM MV
t
Fig. 5.5. Flash-induced AAe-,c for stacked (full515and unstacked (broken line) thylakoid membranes conditions are as for Fig. 5.3(b). (a) control, further additions; (b) as (a) + 15yM DBMIB; (c) (a) - (b).
line)Other
with no subtraction

phase are very similar to those of phase b, compare Fig. 5.5(c) with Fig.
3.1(c), except that the rise occurs 10 ms after flash activation. The
magnitude of the delayed slow phase is altered by different salt condi
tions, Fig. 5.5(c), in a manner comparable to the salt effect on the
extent of phase b, Fig. 1.2. In the discussion to follow, this delayed
slow phase is assumed to be the manifestation of phase b, the generation
of which has been delayed. The nature of this delay is discussed later.
Time resolved spectra, under the different conditions depicted in
Fig. 5.3, were carried out in the cytochrome absorption region, i.e.
between 54-Onm and 590nm. These are shown in Fig. 5.6. The figures
were obtained by measuring at discrete wavelengths the extent of the
absorbance transients relative to the initial dark level at selected
time intervals following the flash; the extents of the transients were
then plotted against the wavelength of the measurement.
From these spectra, it can be observed that the dominant spectral
species in this time range are the transients due to the oxidation
and reduction of cytochrome f (\ = 554-nm) and cytochrome b-563
( raax = 563nm). From the sequence of electron carriers shown in Fig.
1.2 (also see Haehnel, 1977; Bouges-Bocquet and Delosme, 1978), absorp
tion changes due to plastocyanin might be expected in these spectra.
Such changes, however, would only appear as small displacements through
this spectral region since the spectrum of plastocyanin (Katoh et al,
1962) is relatively featureless and of low extinction coefficient 3 1 1(5 x lCr M cm , oxidized minus reduced).
When dithionite and DCMU alone are present, Fig. 5.6(a), the main
features of the spectrum 3ms after flash activation, are the reduction
of cytochrome b-563 and the concomitant oxidation of cytochrome f.

Fig. 5.6. Flash-induced spectra through the cytochrome a-band region. Kinetic traces at the indicated wavelengths were obtained far stacked thylakoid membranes under conditions of pseudocyclic electron transport (see section 2.2.2), with dithionite as reductant. Valinomycin (2uM) and nigericin (2yM) were also present (see section2.2.3). An average of 32 traces was taken. The extents of the change relative to the initial dark level were measured at the following times after a flash: 5ms (circle symbols); 20ms (triangle symbols); 60ms (square symbols), (a) control, with no further additions; (b) as (a) + 3yM MV; (c) as (a) + 30uM MV.
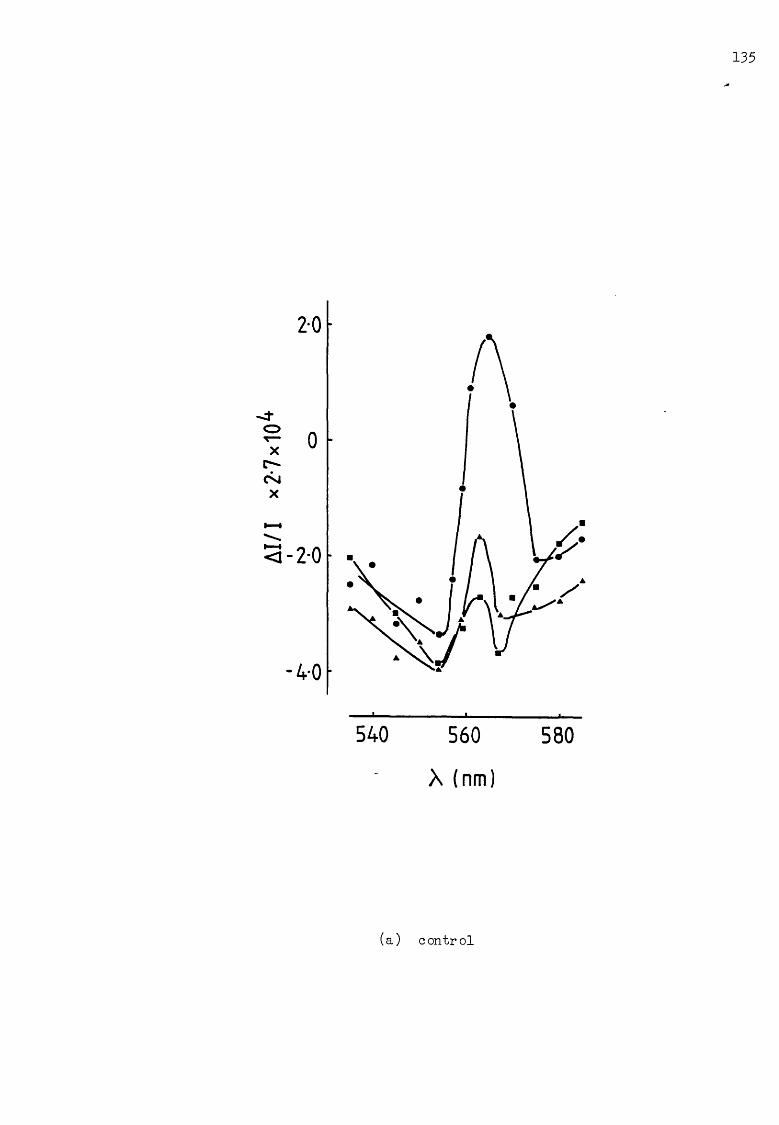
*jOl*LZ* I/IV
540 560 580
X (nm)
(a) control
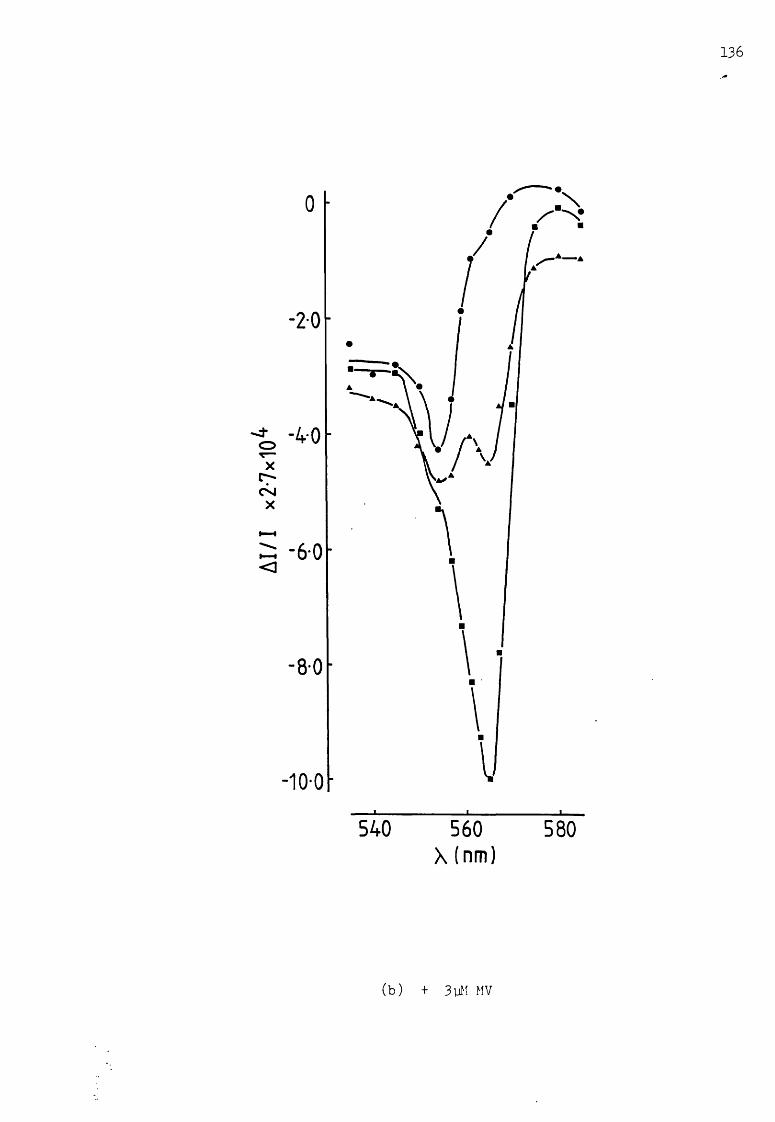
136
540 560 580X (nm)
(b) + 3uM MV
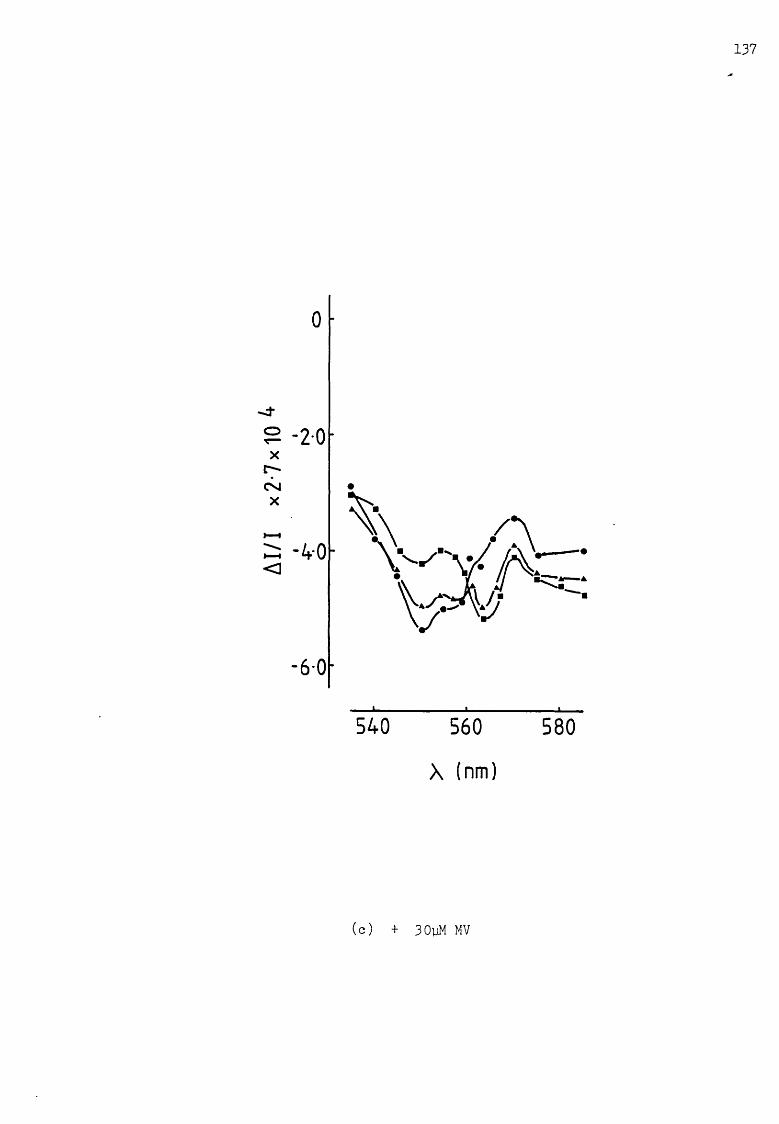
X (nm)
(c) + 30yM MV
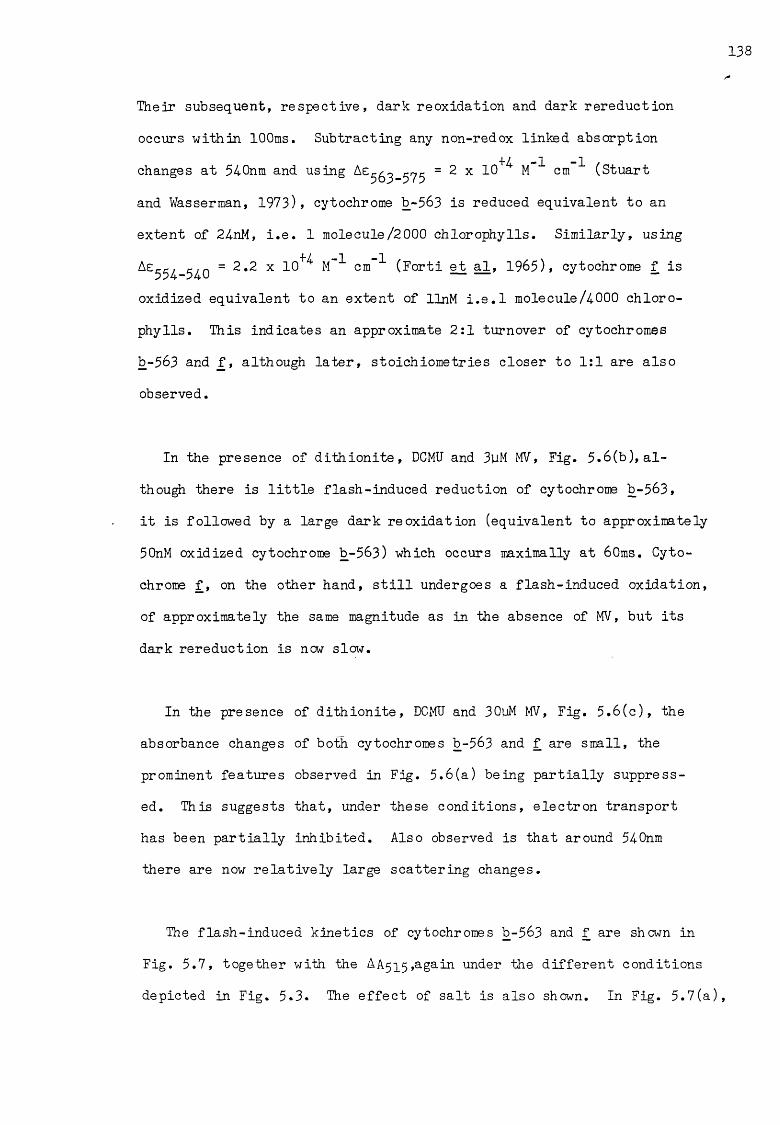
138
Their subsequent, respective, dark reoxidation and dark rereduction
occurs within 100ms. Subtracting any non-redox linked absorption
changes at 54-Onm and using = 2 x 10+^ M ^ cm ^ (Stuart
and Wasserman, 1973). cytochrome b-563 is reduced equivalent to an
extent of 24-nM, i.e. 1 molecule/2 000 chlorophylls. Similarly, using
^£554- 54.0 = x cm ^ (Forti ejfc al, 1965), cytochrome f is
oxidized equivalent to an extent of llnM i.e.l molecule/4-000 chloro
phylls. This indicates an approximate 2:1 turnover of cytochromes
b -563 and f , although later, stoichiometries closer to 1 : 1 are also
observed.
In the presence of dithionite, DCMU and 3bM MV, Fig. 5.6(b), al
though there is little flash-induced reduction of cytochrome b-5 6 3,
it is followed by a large dark re oxidation (equivalent to approximately
50nM oxidized cytochrome b-563) which occurs maximally at 60ms. Cyto
chrome f , on the other hand, still undergoes a flash-induced oxidation,
of approximately the same magnitude as in the absence of MV, but its
dark rereduction is now slow.
In the presence of dithionite, DCMU and 30uM MV, Fig. 5.6(c), the
absorbance changes of both cytochromes b -563 and f are small, the
prominent features observed in Fig. 5.6(a) being partially suppress
ed. This suggests that, under these conditions, electron transport
has been partially inhibited. Also observed is that around 54-Onm
there are now relatively large scattering changes.
The flash-induced kinetics of cytochromes b-563 and f are shown in
Fig. 5.7, together with the AA51 5 ,again under the different conditions
depicted in Fig. 5.3. The effect of salt is also shown. In Fig. 5.7(a),

Fig. 5.7. Flash-induced electrochromic and cytochroiiE absorption changes for stacked (full line) and unstacked (broken line) thylakoid membranes. Conditions are as described in section 2.2.2 for pseudocyclic electron flow, with dithionite as reductant. For the cytochrome AA, valinonycin (2uM) and nigericin (2yM) were also present (see section 2.2.3)• (To be noted, for the cytochrome AA, the AA at the reference A was subtracted manually from that at the measuring A), (a) no furtheradditions; (b) as (a) + 3pM MV; (c) as (a) + 30uM MV.

L inx1-2x10“3
t
515nm
563-540nm
554-540 nm
the cytochrome absorption changes for pseudocyclic conditions, with
dithionite as reductant, are shown. Considering the high salt con
dition, the flash-induced reduction of cytochrome b-563 occurs within
a few ms, and its dark re oxidation occurs with an approximate t^ = 10ms.
In the case of cytochrome f , its flash-induced oxidation is too rapid
to be resolved by the apparatus used, but its dark rereduction occurs
with an approximate tx = 5ms. These results are in accordance with2
the time-resolved spectra depicted in Fig. 5.6(a) and agree with the
observations of Crowther and Hind (1980) and Olsen et al (1980).
The interesting feature, though, in Fig. 5.7(a) is the effect of
salt. As discussed earlier, the salt level alters the extent of both
phase b (and phase a): low salt (= lOmM K+) results in a small phase b
( and a large phase a), while high salt ( = 5mM Mg ) results in a large
phase b (and a small phase a), see Fig. J+.2. In the case of cytochrome
b-563, although the extent of its flash-induced reduction remains unal
tered when the salt level is lowered, the extent of its dark re oxidation
is decreased. The amount by which the extent of this oxidation is de
creased (approximately 20$), matches the amount by which the extent
of phase b is decreased under similar conditions, compare Fig. 5.7(a)
with Fig. 4-.2(c). Coupled to the decrease in extent, there is also
observed a deceleration in the rate of oxidation of cytochrome b-563:
compare = 15ms for the oxidation of cytochrome b-563 in the low2
salt condition, to tx = 10ms in the high salt condition. This again2
mimicks a similar effect observed in the rise kinetics of phase b,
Fig. 4-.2(c): compare t, = 10ms in the low salt condition with a tx2 2= 7ms in the high salt condition. No such salt effects are apparent
in the absorption kinetics of cytochrome f. From these salt effects,
the oxidation of cytochrome b-563 might be implicated in association

with the generation of phase b f as predicted by a Q-cycle type
mechanism (see section 1.3.2). However, on a kinetic basis, cyto
chrome b-563 oxidation is apparently slower than the rise of phase
b.
In Fig. 5.7(b), the cytochrome absorption changes in the pre
sence of dithionite, DCMU and 3yM MV, are shown. Under these con
ditions, for which a delayed phase b is observed, the redox poise
of the system is, apparently, such that .cytochrome b-563 is in a re
duced state prior to flash activation. After a single flash, a small
transient reduction is observed, but the prominent feature of the
absorption change is the net oxidation of cytochrome b-563. Under
the high salt condition, the actual extent of this absorption change
matches that observed for the oxidation of cytochrome b-563 in Fig.
5.7(a), although the rate of reoxidation is slightly slower. In
the case of cytochrome f, however, although its flash-induced oxida
tion is still fast, and its extent is unaltered, when compared with
Fig. 5.7(a), its rate of dark rereduction is decelerated. Again,
only the extent of cytochrome b-563 oxidation is affected by salt ,
Fig. 5.7(b), such as would suggest that it correlated with the gene
ration of the delayed phase b, see Fig. 5.5(c).
In the presence of dithionite, DCMU and high concentrations of MV,
such that inhibit phase b, Fig. 5.7(c), only a flash-induced oxida
tion of cytochrome b-563 is observed: the extent of this oxidation
is approximately half that observed in Figs. 5.7(a) and (b). The
cytochrome f kinetics are very similar to those observed in Fig. 5.7(b).
These absorption changes suggest that, under these conditions, turn
over of photosynthetic electron transport has slowed considerably.

5 .3 Ferredoxin/NADPH induced electron transport:
From Fig. 5.1, the Fd/NADPH couple was concluded to be almost as
strong a reductant as dithionite. The use of Fd/NADPH to reactivate
electron transport, and hence regenerate the AA^^^, in the presence
of DCMU, requires the presence of an oxygen trap; otherwise ferre-
doxin is rapidly oxidized in the presence of oxygen. Also, several
pre-flashes are required to observe a maximal phase b: in these par
ticular experiments it was found that 16 pre-flashes were sufficient
to attain optimal reducing conditions, as manifested by the large ex
tent of -phase b.
Fig. 5.8(a) shows the effect of salt on the extents of phase a and
phase b of the AA^^, in the presence of DCMU and Fd/NADPH. In the
high salt condition, the AA^,. observed is similar to that in Fig.
5.1(c) where phase b is large. In the low salt condition, however,
the expected increase in phase a is only very small, while the de
crease in the extent of phase b is rather-large. These results suggest
that, apart from the expected effect of salt on the AA^^^, there is
a further effect of salt on the reducing ability of the Fd/NADPH
couple: under the low salt condition this reducing couple is apparent
ly less effective. In agreement with this, Shahak e^ al (1980) found2 +that divalent cations, especially Mg , were required to bind ferre-
doxin to the membrane and hence increase its effectiveness, in the
presence of NADPH, as a reductant.
In the presence of Fd/NADPH, DCMU and 50yM MV, Fig. 5.8(b), the
extent of phase a in the low salt condition is now significantly lar
ger than that in the high salt condition, as would be expected follow
ing Fig. A.2. A possible explanation for the now apparent salt effect
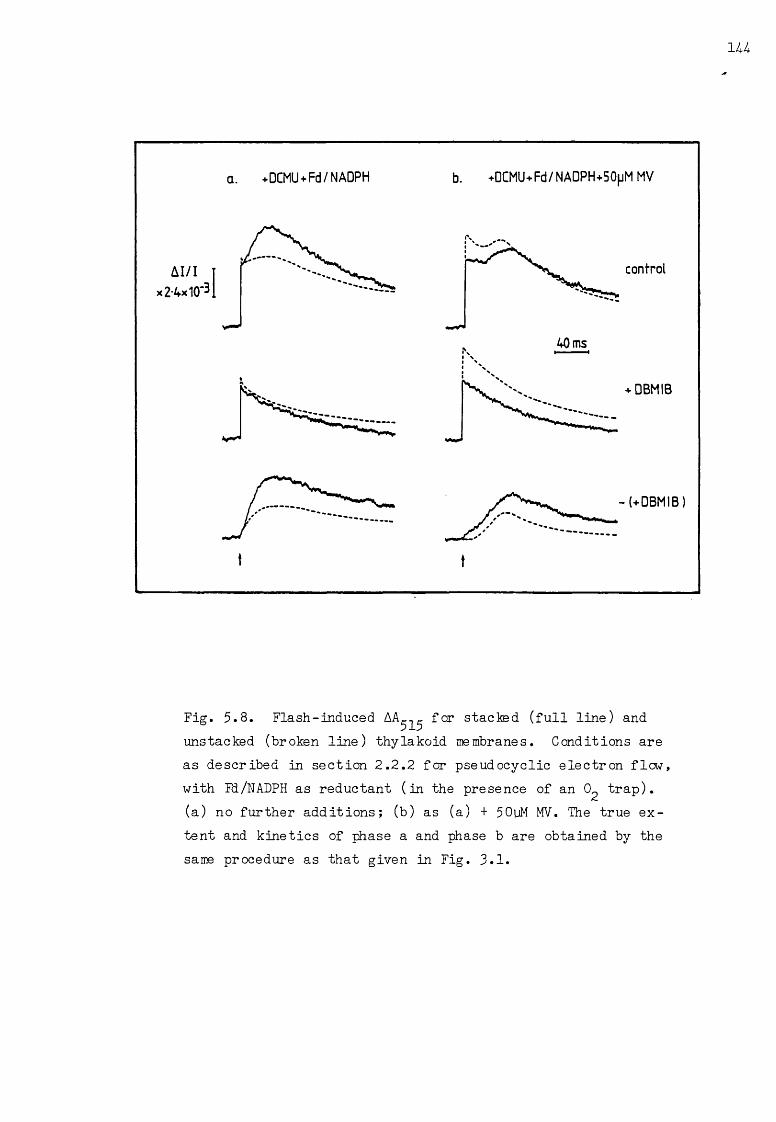
Fig. 5.8. Flash-induced for stacked (full line) andunstacked (broken line) thylakoid membranes. Conditions are as described in section 2.2.2 for pseudocyclic electron flow, with Fd/NADPH as reductant (in the presence of an 0^ trap), (a) no further additions; (b) as (a) + 50pM MV. The true extent and kinetics of phase a and phase b are obtained by the same procedure as that given in Fig. 3.1.
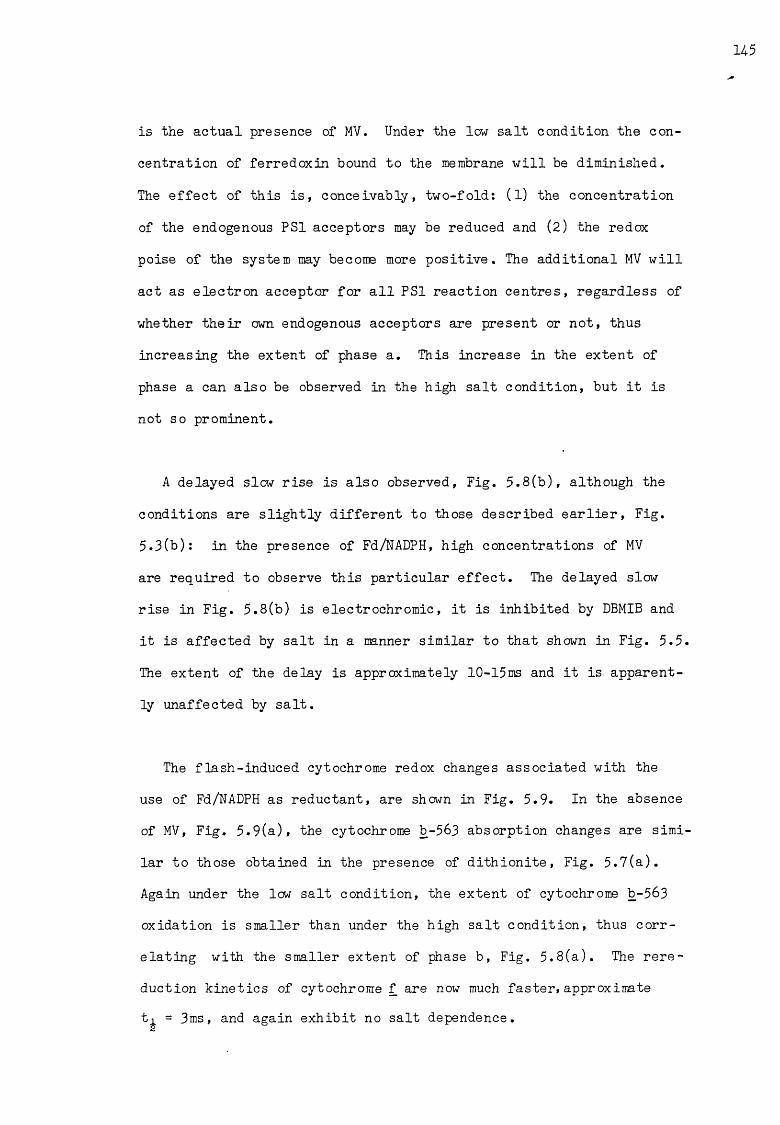
is the actual presence of MV. Under the low salt condition the con
centration of ferredoxin bound to the membrane will be diminished.
The effect of this is, conceivably, two-fold: (1) the concentration
of the endogenous PS1 acceptors may be reduced and (2) the redox
poise of the system may become more positive. The additional MV will
act as electron acceptor for all PS1 reaction centres, regardless of
whether their own endogenous acceptors are present or not, thus
increasing the extent of phase a. This increase in the extent of
phase a can also be observed in the high salt condition, but it is
not so prominent.
A delayed slow rise is also observed, Fig. 5.8(b), although the
conditions are slightly different to those described earlier, Fig.
5.3(b): in the presence of Fd/NADPH, high concentrations of MV
are required to observe this particular effect. The delayed slow
rise in Fig. 5.8(b) is electrochromic, it is inhibited by DBMIB and
it is affected by salt in a manner similar to that shown in Fig. 5.5
The extent of the delay is approximately 10-15ms and it is apparent
ly unaffected by salt.
The flash-induced cytochrome redox changes associated with the
use of Fd/NADPH as reductant, are shown in Fig. 5.9. In the absence
of MV, Fig. 5.9(a), the cytochrome b-563 absorption changes are simi
lar to those obtained in the presence of dithionite, Fig. 5.7(a).
Again under the low salt condition, the extent of cytochrome b-563
oxidation is smaller than under the high salt condition, thus corr
elating with the smaller extent of phase b, Fig. 5.8(a). The rere
duction kinetics of cytochrome f are now much faster, approximate
t_L = 3ms, and again exhibit no salt dependence.
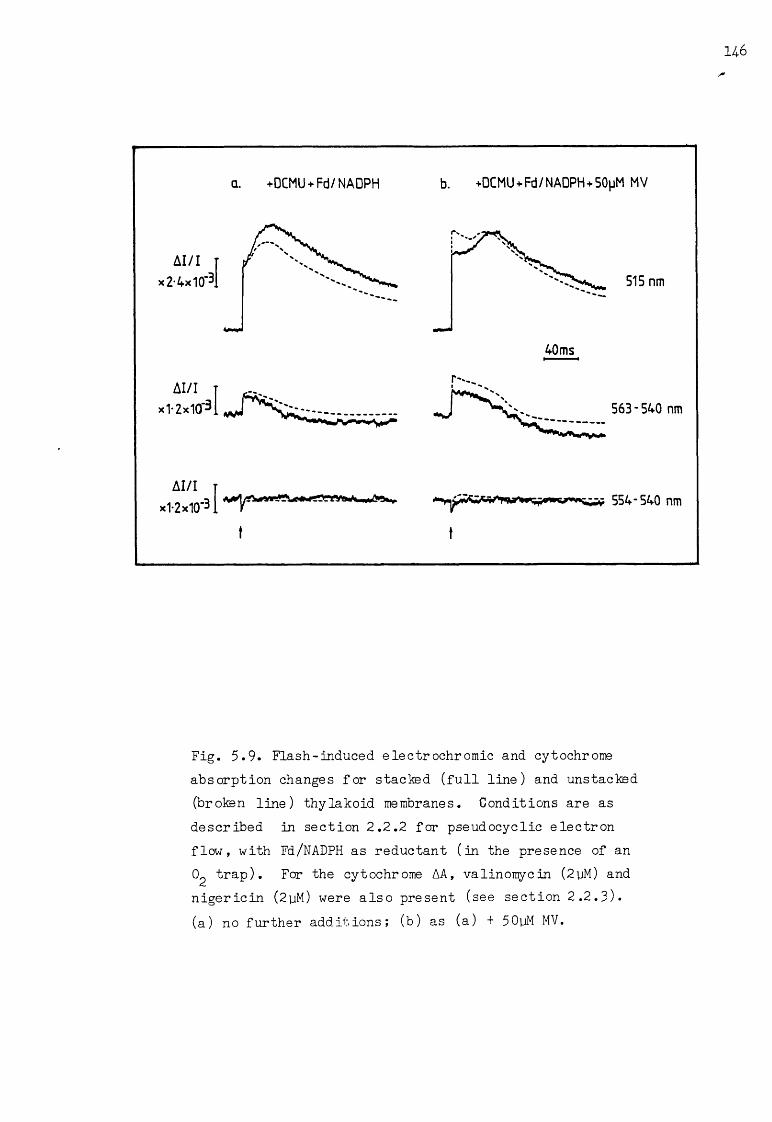
Fig. 5.9. Flash-induced electrochromic and cytochrome absorption changes for stacked (full line) and unstacked (broken line) thylakoid membranes. Conditions are as described in section 2.2.2 for pseudocyclic electron flow, with Fd/NADPH as reluctant (in the presence of an 0^ trap). For the cytochrome AA, valinomycin (2yM) and nigericin (2yM) were also present (see section 2.2.3). (a) no further additions; (b) as (a) + 50yM MV.

In the presence of Fd/NADPH and 50yM MV, Fig. 5.9(b), the ambientredox poise remains, apparently, unaltered. However, although the
flash-induced reduction of cytochrome b-563 is still observed, the
rate of its reoxidation has become slower,with an approximate t^ =260ms, and its total amplitude has increased. Also, while the ex
tent of the delayed phase b is reduced under the low salt condition,
Fig. 5.8(b), no such change in the extent of the oxidation of cyto
chrome b-563 is observed, as would be expected in view of previous
results; instead, the extent of the flash-induced reduction of cyto
chrome b-563 is increased. The rereduction kinetics of cytochrome
f are still fast, as in the absence of MV, and again no salt effect
is observed.
The role of protons in the deceleration of cytochrome b-563 ox
idation in the presence of Fd/NADPH and 50uM MV is shown in Fig. 5.10:
the effect of pH on the extent of the delay of the delayed phase b,
under these conditions, is shown together with its effect on the redox
kinetics of cytochromes b-563 and f. At low pH, no delayed phase b
is observed, and the kinetics of cytochrome b-563 oxidation are simi
lar to those in Fig. 5.9(a), where no MV is present. As the pH is in
creased, the length of the delay in the increases and the kinetics
of cytochrome b-563 oxidation are slowed down. The cytochrome f kine
tics are, evidently, unaffected by pH. These pH effects are not arte
facts due to the changing redox properties of MV: its is pH inde
pendent (Prince e_fc ad., 1981). Although the underlying mechanism of
this effect is unclear (a possible suggestion is discussed later), its
actual observation again points to a correlation between the oxida
tion of cytochrome b-563 and the generation of phase b.

Fig. 5.10. The effect of pH on the flash-induced electrochromic and cytochrome absorption changes, for stacked thylakoid membranes under the conditions of Fig. 5.9(b). For the cytochrome AA, vali- nomycin (2uM) and nigericin (2yM) were also present (see section 2.2.3). The required ambient pH was obtained by suspending the chloroplasts in the appropriate buffer medium, see section 2.2.4-.
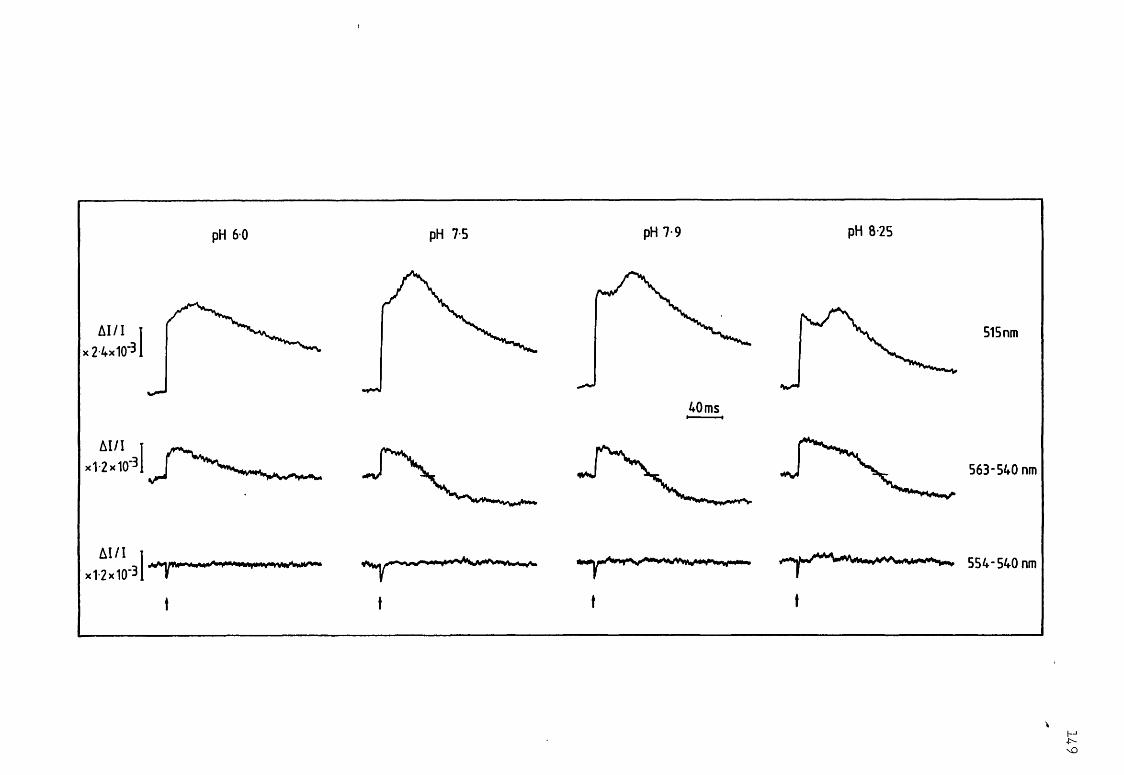
pH 6 0 pH 7-5
AI/Ix1-2x10'3
AI/I
:1-2x10'3.
t ♦
M

5.4- Duroquinol induced electron transport:
Duroquinol, like dithionite, is able to reduce the PQ pool,
although it is not as strong a reductant as dithionite, see section
5.1. Fig. 5.11(a) shows the effect of salt on the AAcn_ induced
by the addition of DQH^, in the presence of DCMU. The changes in
duced in the extents of phase a and phase b are now not so large:
compare an approximate 10-15# change in Fig. 5.11(a) to an approx
imate 20-25% change observed previously, see Figs. 4-.2, 5.5 and 5.8(b).
Furthermore, the extent of phase b, under these particular reducing
conditions, is slightly larger than that induced by dithionite, compare
Figs. 5.11(a) and 4..2(c).
The addition of 50yM MV has no effect on either the extent of phase
a or that of phase b, the AA^,, traces being superimposable in the
presence or absence of MV; similarly, the effect of salt is not alter
ed upon the addition of MV. Hence, it suffices that the results pre
sented in Fig. 5.11, (a) and (b), hold for both+MV. The unaltered ex
tent of phase a in the presence of MV is further evidence for the
positive ambient redox poise set by DQH^: from Fig. 4-.3(c), MV causes
an increase in the extent of phase a only at low redox potentials.
The unaltered extent of phase b is that predicted by the redox titra
tion in Fig. 4..7(c).
Fig. 5.12(a) shows the flash-induced cytochrome redox changes when
DQH^ is present as the reductant. In the presence or absence of MV
the cytochrome absorption changes are very similar to those obtained
in the presence of dithionite alone, Fig. 5.7(a). To be noted is that,
although the extent of phase b induced by DQH is larger than that in-

Fig. 5.11.Flash-induced AArnr for stacked (full line)tipand unstacked ("broken line) thylakoid membranes. Conditions are as described in section 2.2.2 for pseudo- cyclic electron flow, with DQH,_, as reductant. (a) in the presence of 0.5mM DQH^; (b) in the presence of O.lmM DQH^. The true kinetics and extent of phase a and phase b are obtained by the same procedure as that given in Fig. 3.1. The addition of 50yM MV does not alter these traces.
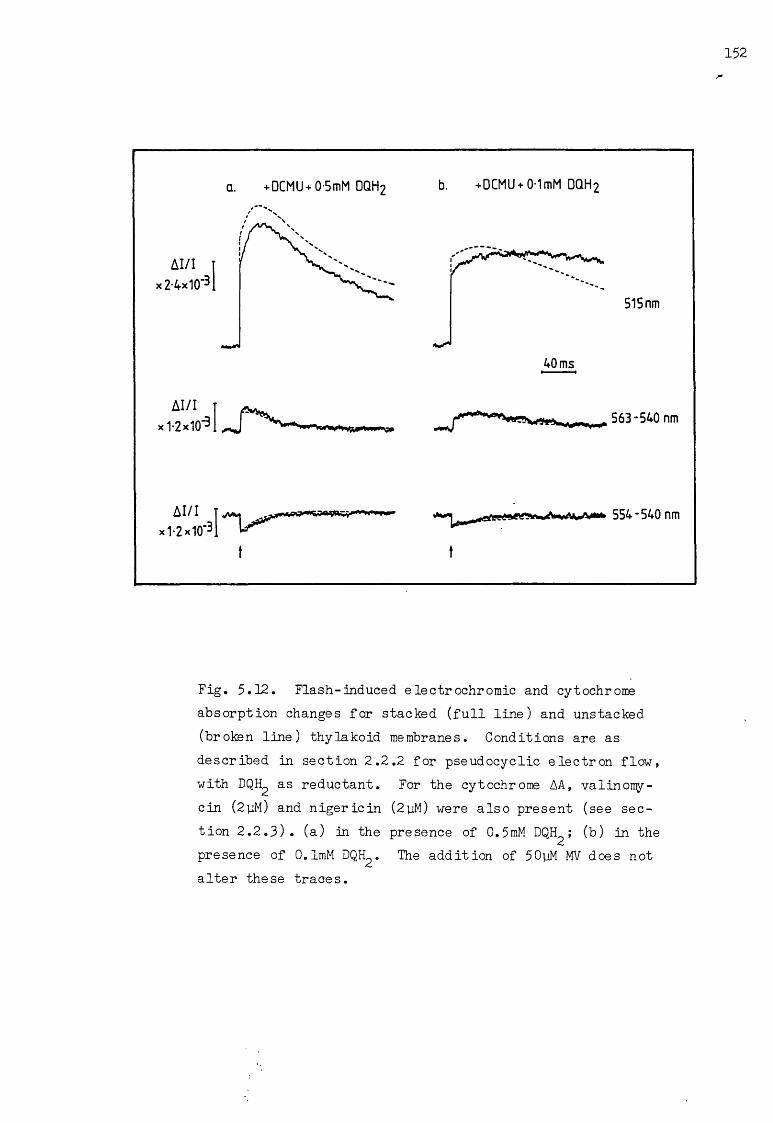
+ DCMU+0-5mM DQH2 b. +DCMU + 0-1mM DQH2
554-540 nm
t
Fig. 5.12. Flash-induced electrochromic and cytochrome absorption changes for stacked (full line) and unstacked (broken line) thylakoid membranes. Conditions are as described in section 2.2.2 for pseudocyclic electron flow, with DQH^ as reductant. For the cytochrome AA, valin ony- cin (2pM) and nigericin (2yM) were also present (see section 2.2.3). (a) in the presence of 0.5mM DQH^; (b) in the presence of O.lmM DQH^. The addition of 50yM MV does not alter these traces.
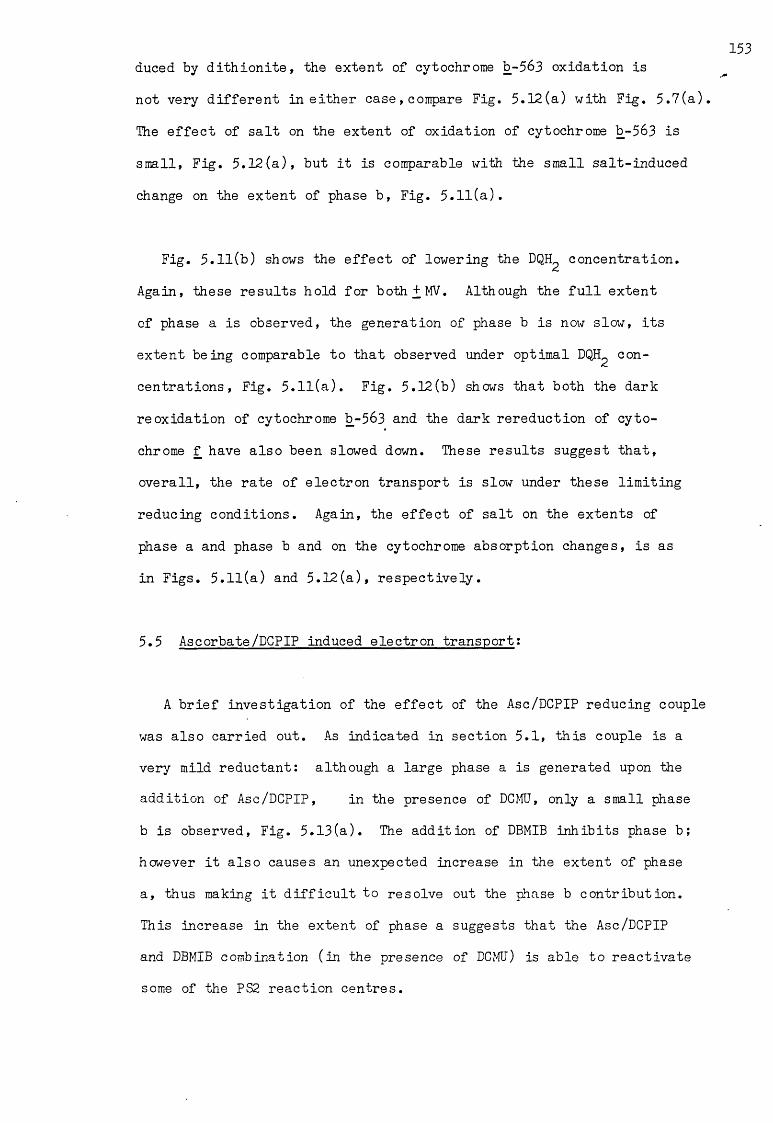
duced by dithionite, the extent of cytochrome b-563 oxidation is
not very different in either case, compare Fig. 5.12(a) with Fig. 5.7(a).
The effect of salt on the extent of oxidation of cytochrome b-563 is
small, Fig. 5.12(a), but it is comparable with the small salt-induced
change on the extent of phase b, Fig. 5.11(a).
Fig. 5.11(b) shows the effect of lowering the DQH^ concentration.
Again, these results hold for both + MV. Although the full extent
of phase a is observed, the generation of phase b is now slow, its
extent being comparable to that observed under optimal DQH^ con
centrations, Fig. 5.11(a). Fig. 5.12(b) shows that both the dark
re oxidation of cytochrome b-563 and the dark rereduction of cyto
chrome f have also been slowed down. These results suggest that,
overall, the rate of electron transport is slow under these limiting
reducing conditions. Again, the effect of salt on the extents of
phase a and phase b and on the cytochrome absorption changes, is as
in Figs. 5.11(a) and 5.12(a), respectively.
5.5 Ascorbate/DCPIP induced electron transport:
A brief investigation of the effect of the Asc/DCPIP reducing couple
was also carried out. As indicated in section 5.1, this couple is a
very mild reductant: although a large phase a is generated upon the
addition of Asc/DCPIP, in the presence of DCMU, only a small phase
b is observed, Fig. 5.13(a). The addition of DBMIB inhibits phase b;
however it also causes an unexpected increase in the extent of phase
a, thus making it difficult to resolve out the phase b contribution.
This increase in the extent of phase a suggests that the Asc/DCPIP
and DBMIB combination (in the presence of DCMU) is able to reactivate
some of the PS2 reaction centres.
Fig. 5.13. (a) Flash-induced AA_n_ for stacked thy-515lakoid membranes. Conditions are as described in section 2.2.2 for pseudocyclic electron flow, with Asc/DCPIP as reductant. Control, with no further additions (full line); control + 15yM DBMIB (broken line), (b) Flash-induced cytochrome absorption change under the "control" conditions of (a), and in the pre sence of valinomycin (2yM) and nigericin (2yM), see section 2.2.3.

The cytochrome absorption changes in the presence of Asc/DCPIP
are shown in Fig. 5.13(b): these are unaltered by the addition of
DCMU. Cytochrome b-563 undergoes a rapid flash-induced reduction,
whose magnitude is comparable to that observed in the presence of
either dithionite, Fd/NADPH or DQE,. Its dark re oxidation, however,
is more rapid and occurs rather promptly. Both the flash-induced
oxidation and dark rereduction of cytochrome f are rapid: Asc/DCPIP
is thought to donate electrons after the Rieske FeS centre.
An interesting effect of Asc/DCPIP is shown in Fig. 5.14-. The
addition of Asc/DCPIP in the presence of DCMU and DQH^ results in the
partial loss of phase b, although there is an increase in the decay
rate of the AA^,^. This is accompanied by an inhibition of cytochrome
b-563 dark re oxidation and an acceleration in the rate of cytochrome
f dark rereduction, compare Fig. 5.14- with Fig. 5.12(a).The addition of
Asc/DCPIP, in the presence of an alternative reductant, possibly acts
as a competitive electron donor to cytochrome f : in this way the re
oxidation of cytochrome b-563 is inhibited. This effect, again em
phasizes a correlation between cytochrome b-563 oxidation and the
generation of phase b, thus invoking the involvenent of a Q-cycle
type me chan is m.
5.6 Discussion:
In this chapter, the use of different reductants, in the presence
of DCMU, is found to generate phase a and phase b of the flash-induced
515nm electrochromic absorption change with differing extents. The
effect of MV on both the AA*.. - and the cytochrome redox changes is
also found to depend on the reductant present. This latter effect
has interesting consequences in terms of electron transport operation.
Also, it leads to the suggestion that the generation of phase b can

Fig. 5.14-. (a) Flash-induced AA,- . for stacked thylakoidmembranes. Conditions are as described in section 2.2.2 for pseud ocyclic electron flow, with DQH^ (0.5mM) as reductant. Control, with no further additions (full line); control + 0.5mM Asc + 50mM DCPIP (broken line). (b) Flash-induced cytochrome absorption changes under the "control + Asc/ DCPIP" condition of (a), and in the presence of valinomycin (2yM) and nigericin (2yM) , see section 2.2.3.
be correlated to electron transport in which a Q-cycle type mechanism
is operative.
The reducing strengths of the reductants used in this study are
well characterized in section 5.1. The extents of phase a and phase
b, obtained in the presence of the different reductants, are compar
ed with the redox titrations in Figs. 4-.3 and 4-.7. On this basis,
the reductants can be placed in order of their reducing ability:
dithionite > Fd/NADPH > DQH^ > Asc/DCPIP. In the discussion to foll
ow only those results which have been obtained in the presence of
dithionite, Pi/NADPH and DQH^ will be included; the effect of Asc/
DCPIP will only be briefly mentioned.
In the presence of the above reductants, and in the absence of
any further additions, cytochrome b-563 is oxidized in the dark while
the high potential PS1 donor pool, which includes the FeS centre,
cytochrome f and plastocyanin, is reduced. A single turnover flash
oxidizes P700. An electron from the high potential donor pool rapid
ly reduces P700, leaving the FeS centre mostly oxidized and cyto
chrome f partially oxidized. It is this light-induced oxidation of
the FeS centre that instigates the reduction of cytochrome b-563.
The kinetics of these events following an actinic flash are:
(1) cytochrome f oxidation (ti< 1ms); (2) cytochrome b-563 reduc-2
tion(tx 'u lms); (3) cytochrome f rereduction(t^ 5ms);and (4-) cyto-2 2chrome b-563 reoxidation (tA ^ 10ms).From these kinetics, however,“ 2it is difficult to determine whether cytochrome b-563 is involved in
a Q-cycle type mechanism (see Fig. 1.6) or in a simple linear elec
tron transport scheme (see below):
158
PQH2 cyt b-563 -*■ RFeS -> cyt f -> PC + PS1
In a Q-cycle type scheme, the flash-induced reduction of cytochrome
b-563 would be expected to match the dark rereduction of cytochrome
f. In a linear type scheme, however, it is the dark re oxidation of
cytochrome b-563 that would be expected to match the dark rereduction
of cytochrome f. No such correlations in favour of either model can
be made from the results presented in Figs. 5.7(a) and 5.12(a). A
possible distinction is, however, discussed later, in view of the
results obtained in the presence of MV.
To be noted is that in the presence of Fd/NADPH, the dark rereduc
tion kinetics of cytochrome f are very rapid, Fig. 5.9(a); as such,
these kinetics would match the kinetics of the flash-induced reduc
tion of cytochrome b-563, in accordance with a Q-cycle type mechanism.
However, why such kinetics should become apparent under these par
ticular conditions is unclear. The possibility that Fd/NADPH is able
to reduce cytochrome f directly, can be discounted since PQH^ oxida
tion would be expected to be slow and hence cytochrome b-563 reduc
tion would also be slow: this, however is not observed.
There is no apparent salt effect on the extent of the flash-
induced cytochrome b-563 reduction or on the cytochrome f absorption
change. Changes in the ionic strength, however, do appear to affect
the extent of cytochrome b-563 dark re oxidation, see Figs. 5.7(a),
5.9(a) and 5.12(a), in a similar manner to that observed regarding
the extent of phase b. This effect of salt on the extent of phase b
and that of cytochrome b-563 oxidation is possibly dependent on am
bient redox poise. TXhen comparing the salt induced effect in the

presence of DQH^ with that in the presence of dithionite, it is
found not to be so large in the case of phase b, compare Figs. 5.11(a)
and 4..2(c), and even less apparent for the oxidation of cytochrome
b-563, compare Figs. 5.12(a) and 5.7(a).
The addition of MV, a competitive PS1 electron acceptor, in the
presence of certain reductants apparently alters the sequence of
electron transport events. This thus gives further insight into the
possible mechanism of electron transport. In the presence of dithion
ite, high concentrations of MV are found to have an inhibitory effect
on both the extent of phase a and that of phase b, Fig. 5.3(c). As
discussed previously, this observation is contrary to that expected
in view of the redox titrations presented in Figs. 4-.3(b) and 4..7(c).
It does however suggest that an unusually low ambient redox potential
has been attained. A possible explanation for this is as follows.
The ability of MV to inhibit cyclic electron flow relies on the fact
that it can donate the electrons it accepts from PS1, to oxygen. In
this way the oxidized form of MV is regenerated, from the reduced form,
provided there is an indefinite supply of oxygen present. Dithionite,
on the other hand, is an efficient oxygen trap (hence its effectivenes
as a reductant). In the presence of dithionite, therefore, the system
will be relatively anaerobic. The oxidized form of MV will thus not
be regenerated by molecular oxygen, but MV itself may possibly become
an efficient reductant, thus inhibiting phase b and also part of phase
a (in Fig. 5.3(c) it is part of the PS1 contribution to phase a that
is inhibited). The partial inhibition of electron transport, by this
particular combination of dithionite and MV, is also indicated by
the flash-induced cytochrome absorption changes, Fig. 5.7(c). Further
evidence for the presence of the reduced form of MV (which is blue
in colour), under these conditions, is the relatively large scattering
changes observed in the spectra of Fig. 5.6(c).

The appearance of a delayed phase b in the presence of dithionite
and low concentrations of MV, Fig. 5.3(b), must also result from the
altered properties of MV induced by the anaerobic conditions in the
presence of dithionite. A possible explanation for the occurrence
of this delayed slow phase comes from an analysis of the flash-induced
cytochrome absorption changes observed under these conditions, Fig.
5.7(b): these cytochrome redox changes would be in favour of a Q-
cycle type mechanism. Cytochrome b-563 is apparently fully reduced,
prior to flash activation, under these particular conditions: in
view of the earlier discussion concerning the operation of MV in the
presence of dithionite, low redox potentials are to be expected. The
particular redox potential achieved in this case will not be inhibit
ing, as in the presence of high MV concentrations. In accordance
with this, and considering a Q-cycle type mechanism to be operative,
it can be envisaged that both b^ and b^ in Fig. 1.6 will be pre-
reduced. For PQH0 oxidation to occur, b.,, and hence b. , need to be d —± - noxidized, b, oxidation will occur when bound Q is available; sub- -n osequently, the oxidation of b^ and PQH^ will also occur, but on a time-
scale that is comparable with b^ oxidation. The rereduction of cyto
chrome f would thus be expected to be slow (for an operational Q-cycle)
this is indeed observed, Fig. 5.7(b). If a linear electron transport
scheme were operative, and cytochrome b-563 pre-reduced, as is indicat
ed by these particular conditions, then both the reoxidation of cyto
chrome b-563 and the rereduction of cytochrome f would be expected to
be very rapid: this, however, is not observed.
The above argument can thus be extended to explain the occurrence
of a delayed phase b. If phase b occurs as the result of b^ oxida
tion (the redox titration in Fig. 4.7(a) seems to suggest that the
chemical reduction of a high potential b-type cytochrome is respon
sible for the inhibition of phase b) then the observed delay would
be a measure of the Qq binding time constant, which in some way
has been modified by the state of reduction of the system. If, on
the other hand, phase b occurs as the result of b^ oxidation, then
the delay will be a measure of the time required for b^ oxidation
to occur (which will also include the Qq binding time constant).
In the case of Fd/NADPH and high concentrations of MV, similar
arguments to those above can be used to explain the occurrence of a
delayed slow phase and the concomitant slow cytochrome b-563 oxida
tion ,Fig. 5.9(b). To be noted, though, is that the ambient redox
poise in this particular case is very different to that in the pre
sence of dithionite and low concentrations of MV. In the presence
of Fd/NADPH and MV, reducing conditions prior to flash activation
are similar to those in the absence of MV, in that cytochrome b-563
is only partially reduced. The results presented in Fig. 5.9(b),
however, would still favour the Q-cycle type mechanism. Since cyto
chrome b-563 is only partially reduced, PQH^ oxidation can still occur
and hence the rereduction kinetics of cytochrome f will be unaffect
ed, compare Figs. 5.9(b) and 5.9(a). It is the subsequent re oxida
tion of cytochrome b-563 that is temporarily inhibited. This is mani
fested in the AA^^. as a delayed phase b, and, as discussed above,
possibly reflects a slowness in Qq binding as a consequence of the
unusual mode of action of MV under anaerobic conditions.
The results presented in Fig. 5.10 would suggest that the partial
inhibition of cytochrome b-563 oxidation, and the resultant delayed
slow phase in the Aa , is associated with a restricted supply of
protons. Conceivably, if protons are not available, the reduction
of Q , by the oxidation of b, , will be limited, o * -h

nor the cytochromeIn the presence of DQH~, neither the AA__. _t)±Dredox changes are altered in the presence of MV. Such observations
are in agreement with those predicted by the redcx titrations in
Figs. 4-.3(c) and 4..7(b). The role of MV as an inhibitor of cyclic
electron transport is apparently unaffected by this particular re-
ductant: there is now a continuous supply of oxygen.
The effect of salt in the presence of MV and a reductant is very
similar to that discussed earlier where MV was absent. An exception
to this, however, is in the case of Fd/NADPH and MV, Fig. 5.9(b).
In the presence of low salt, no decrease in the extent of cytochrome
b-563 oxidation is observed; instead the extent of its flash-induced
reduction is increased. This could merely reflect the salt-dependent
binding properties of ferredoxin, as discussed earlier, which in
turn alter its effectiveness as a reductant ( in the presence of NADPH).
In conclusion, two main features are apparent from these results.
Firstly, a correlation between the generation of phase b and the ox
idation of cytochrome b-563 appears to be favoured, where cytochrome
b-563 is involved in a Q-cycle type mechanism. The inhibitory effect
of Asc/DCPIP on the extent of phase b , generated in the presence of
DCMU and DQH^, and the concomitant inhibition of cytochrome b-563 ox
idation, Fig. 5.14-f is further evidence for this conclusion. Second
ly, the sensitivity of electron transport, as monitored by cytochrome
b-563 and cytochrome f redox reactions, to changes in ambient redox
poise, is emphasized by the results obtained in the presence of MV.
Such a sensitivity to redox potential poise has also been observed
for electron transfer in bacterial chromatophores (O'Keefe et al, 1981).

CHAPTER 6
The electrochromic absorption change related to proton uptake/release
The effect of pH on the 515nm electrochromic absorption change
and on the cytochrome absorption changes is investigated. A study
of the flash-induced proton uptake and proton release, which both
occur as the result of electron transport, is also carried out.
An attempt is made to determine the associated H+/e ratio.
6.1 The effect of pH on the AA^,. and cytochrome absorption changes:
Fig. 6.1 shows the pH titration curve for the extent of phase
a and that of phase b. The conditions are those f orpseudocyclic
electron flow, where the reductant is dithionite. The extent of
phase a is observed to be pH independent. This is to be expected
since the charge separation within the reaction centres is known
not to involve the uptake or release of protons. The extent of
phase b is, however, pH dependent: its pH titration curve follows
a classical Henderson-Hasselbalch equation (see section 2.2.4.)
with a pK of 8.7.
Fig. 6.2(a) shows the AA^^^ at high and low pH values and under
the same electron transport conditions as in Fig. 6.1. Although
the decay rate of the AA,, . at pH8.6 is faster than that at pH 7.4-,
the actual extent of phase b is markedly decreased. The related
cytochrome absorption changes are shown in Figs. 6.2(b) and (c).
Both the extent of the flash-induced reduction of cytochrome b-563,
and that of its dark re oxidation, are decreased when the pH is
increased, Fig. 6.2(b). On the other hand, the rate of cytochrome
b-563 dark re oxidation remains unaltered by these changes in pH.
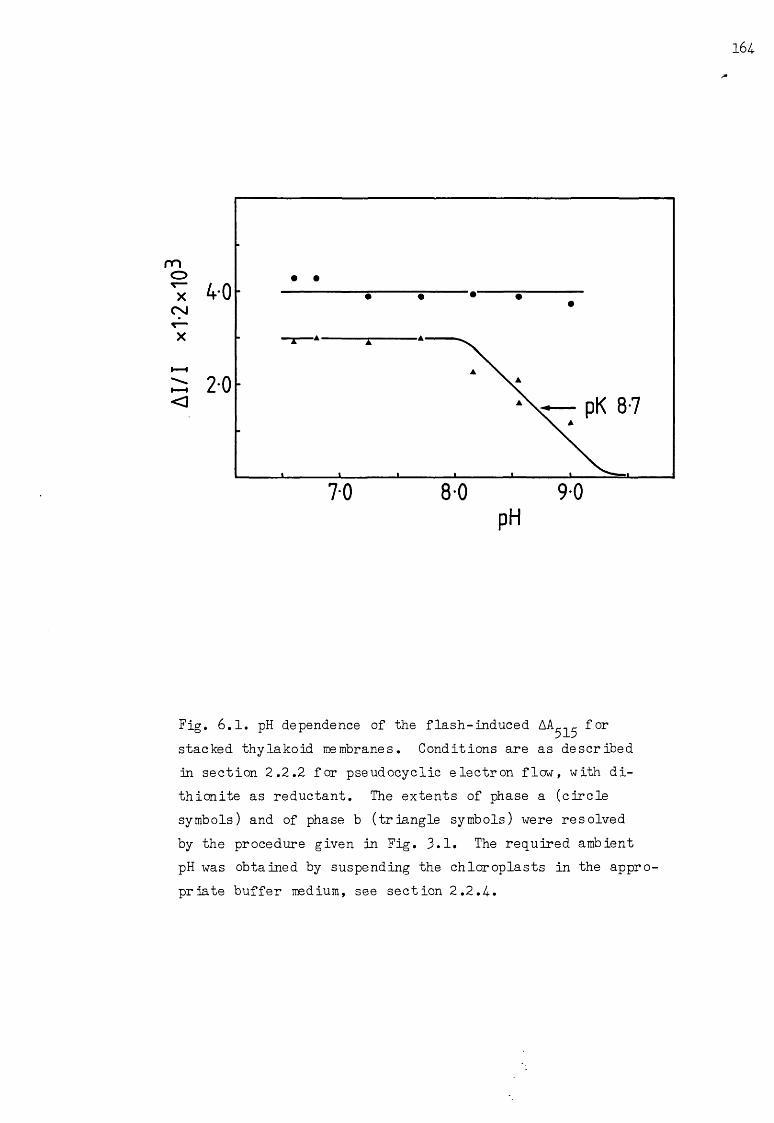
E0l*
3l.*
I/IV
164-
PH
Fig. 6.1. pH dependence of the flash-induced AA ,. for stacked thylakoid membranes. Conditions are as described in section 2.2.2 for pseudocyclic electron flow, with di- thicnite as reductant. The extents of phase a (circle symbols) and of phase b (triangle symbols) were resolved by the procedure given in Fig. 3.1. The required ambient pH was obtained by suspending the chloroplasts in the appropriate buffer medium, see section 2.2.4.
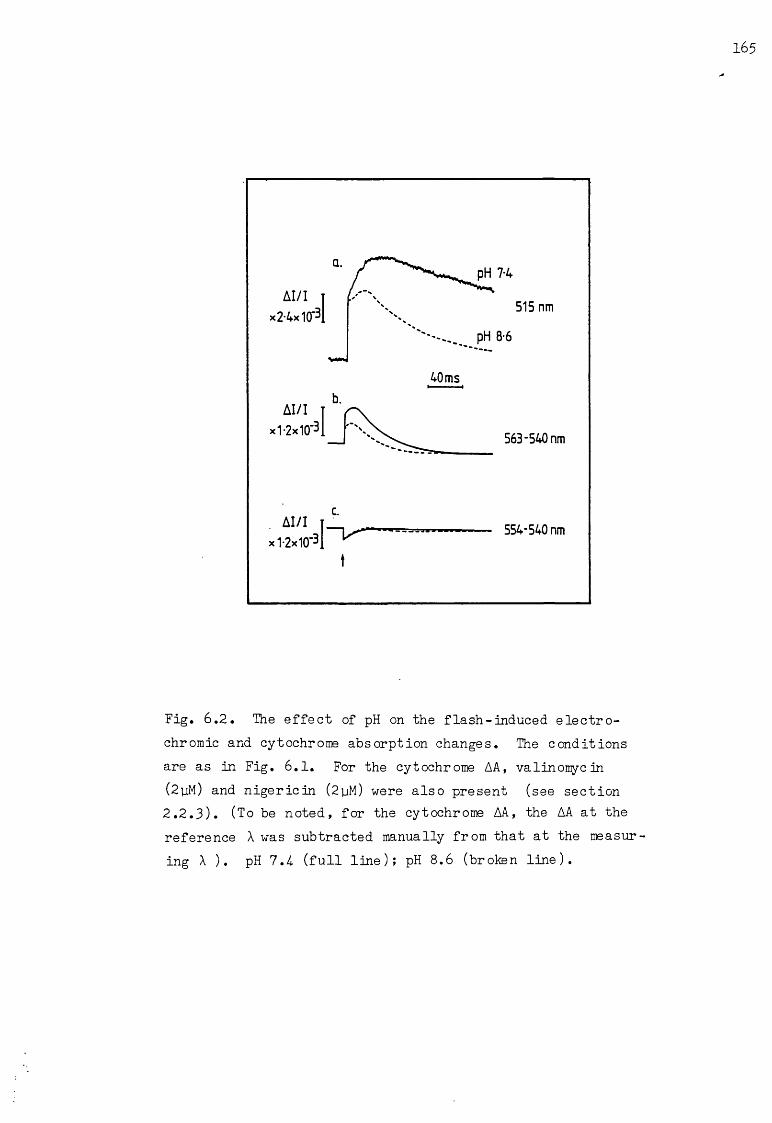
Fig. 6.2. The effect of pH on the flash-induced electro- chromic and cytochrome absorption changes. The conditions are as in Fig. 6.1. For the cytochrome AA, valinomycin (2pM) and nigericin ( 2 jjM) were also present (see section2.2.3). (To be noted, for the cytochrome AA, the AA at the reference A was subtracted manually from that at the measuring X ). pH 7.4- (full line); pH 8.6 (broken line).

In the case of cytochrome f, however, no such pH changes are obser
ved in either the extent or in the kinetics of its redox absorption
changes, Fig. 6.2(c). These results would again favour the involve
ment of cytochrome b-563 in the generation of phase b.
6.2 Flash-induced proton uptake:
Fig. 6.3 shows the kinetics of flash-induced proton uptake, measur
ed at 574-nm using cresol red. The traces (a)-(d) display an increase
in absorption, indicating that the outer aqueous phase has become
more alkaline due to the uptake of protons by the thylakoid membrane.
In the absence of any reductant or inhibitor, Fig. 6.3(a), proton
uptake is slow, occurring with an approximate tx of kOms. This in-2
dicates that, under these conditions, the rate of electron transport
is not optimal. The extent of the absorption change in Fig. 6.3(a)
represents the uptake of approximately 160 pmoles of protons, as
determined by the calibration method described in section 2.2.5.
Later, this particular concentration of protons will be related to
the concentration of P700 present, and hence a H+/e ratio determined
The addition of DCMU results in the complete inhibition of the
AA-„., Fig. 6.3(b). This corresponds to the condition depicted by 2/4the AA^.^ in Fig. 3.3(b): electron transport is inhibited and con
sequently neither the reduction of PQ nor the uptake (or release) of
protons will take place.
The subsequent addition of a reductant, in this case DQH^ ,
restores the AA^^, Fig. 6.3(c), concomitant with the reappearance
of the in Fig. 3.3(c). The AA^.^ now exhibits an initial

167
Fig. 6.3. Flash-induced proton uptake absorption changes recorded with the dye cresol red (C.R.) at 57Anm (pH 7.3). The sample was prepared as described in section 2.2.5, with stacked thylakoid membranes, the control condition in (a) being with no further additions. Subsequent additions are as stated in the figure, the concentrations of which are: DCMU (25pM), DQH^ (0.5mM), MV (50pM), tricine (50mM) and valinomycin (2mM), The dotted lines in traces (c) and (d) are the result of subtracting the buffered (+50mM tricine) signal, as shown in (e). For the calibration of these AA, see section 2.2.5 and text.
small rapid increase, followed by a larger slow increase. The ini
tial rapid increase is due to non-specific absorption changes at 574.nm:
it can still be observed in the presence of 50mM tricine, Fig. 6.3(e).
Cresol red records pH absorption changes in the outer unbuffered aqu
eous phase; any buffer subsequently added will thus eliminate such
pH changes. In accordance with this, since the slow increase of
the AA^^, Fig. 6.3(c), is totally inhibited by the addition of tri
cine, this suggests that it represents proton uptake. Subtraction
of the buffered signal, Fig. 6.3(e), from the unbuffered signal, Fig.
6.3(c), reveals the true kinetics of proton uptake, as manifested by
the dotted line shown in Fig. 6.3(c), the maximum extent of proton
uptake remaining unaltered. Thus, in the presence of DCMU and DQH^*
proton uptake occurs with an approximate tA of 20ms: this is compar-2
able with the rise kinetics of phase b, Fig. 5.11(a), and the kinetics
of cytochrome b-563 dark reoxidation, Fig. 5.12(a). Calibration of
the extent of the AA^^ in Fig. 6.3(c) also yields a value of approx
imately 160 pmoles of protons taken up from the outer aqueous phase.
To be noted is that similar results to those in Fig. 6.3(c) are obtained
in the presence ofDQH^ alone. The addition of MV, in the presence of
DCMU and DQH^, does not alter the kinetics or the calibrated extent of
the AA^^, compare Figs. 6.3(d) and (c). Similarly, most of the absorp
tion change is eliminated by the addition of tricine, except for the
initial rapid increase.
A point to note is that there is the possibility that cresol red
does not monitor total proton uptake due to the build up of an electrical
gradient, across the thylakoid membrane, that cannot be dissipated in-
between flashes. This, however, is not the case since the addition of
valinqmycin, in the presence of K+, which would dissipate any electrical
gradients present, does not enhance the total extent of the LkKn .,j 14Fig. 6.3(f). Furthermore, it is noted that the decay rate of the AA_„.t /4
is slow. This indicates that the extrusion of protons into the
outer phase, via the ATPase complex,is slow compared with the time-
scale required for electron transport.
Use of the dye phenol red, instead of cresol red, to monitor proton
uptake,yields similar results to those presented in Fig. 6.3. Further
more, the series of experiments carried out in Fig. 6.3, were also attemp
ted using the reductants dithionite and Fd/NADPH. However, the com
bination of anaerobic conditions, as imposed by these reductants, and
the absence of any buffering capacity in the sample, in order to meas
ure proton uptake, resulted in a rather unstable sample. This thus
made reliable measurements difficult.
Fig. 6.4- shows the pH titration for the calibrated extent of the
cresol red absorption changes; the conditions are as in Fig. 6.3(d).
As to be expected, a similar pH titration curve is obtained in the
absence of any added reductant or inhibitor, in the presence of 50yM MV
alone and using the dye phenol red in the presence of DCMU + DQH^t MV.
The data in Fig. 6 .4. can be fitted to a classical Henderson-Hasselbalch
equation with a pK of 7.5.
The axis on the right hand side of Fig. 6 .4. indicates the approx
imate number of protons taken up per P700, and hence per electron trans
ported along the electron transport chain. The concentration of P700
present in the sample was calculated from the extent of the flash-
induced P700 oxidation, obtained in the absence of reductant or inhibitor,
see Fig. 6.5(a). The extent of P700 oxidation is unaltered in the
presence of DBMIB, but its dark rereduction is inhibited, Fig. 6.5(b).
Furthermore, the total P700 absorption is inhibited in the presence
of DCMU, Fig. 6.5(c). Using 725 = 6.4 x 10+ M ^ cm (Hiyama

170
pH
Fig. 6.4-. pH dependence of the calibrated extent (left- hand axis) of the flash-induced protcn uptake absorption change, AA_„,, under the conditions of Fig. 6.3(d). For calibration procedure, see section 2.2.5. Also shown (on the right-hand axis) is the H+/P700 ratio: for calculationof the concentration of P700 present in the sample, see text. The required ambient pH was obtained as described in section 2.2,5.
00Z,
d /+
H

Q.AI/I T
x2*4x 10'3J
b. ,40 ms
control
Q.+ DBMIB
c. --I_t
cl+DCMU
Fig. 6.5. Flash-induced P700 absorption change, recorded at 703-725nm (see section 2.2.3), for stacked thylakoid membranes. The sample was prepared as described in section 2.2.3, with no added inhibitor or reductant. (a) control, with no further additions; (b) as (a) + 15uM DBMIB; (c) as (a) + 25pM DCMU.

ple this is equivalent to 70 pmoles of P700. Hence, under the con
ditions of Fig. 6.3(d), namely at pH 7.3, the approximate H+/e ratio
is 2. To be noted, however, is that the above experimentally calcu
lated concentration of P700 corresponds to 1 P700 per 1200 chlorophylls
this is rather smaller than the expected 1 P700 per 600 chlorophylls.
Concomitant with the pH titration carried out in Fig. 6.4., a pH
titration of the extent of phase b was also carried out: this yields
the same curve as that depicted in Fig. 6.1.
6.3 Flash-induced proton release:
and Ke, 1972), P700 is oxidized to an extent of 35nM: in a 2ml sam
Fig. 6.6 shows the kinetics of the flash-induced proton release
measured at 54-Onm using the dye neutral red. In the absence of any
added reductant or inhibitor, Fig. 6.6(a), an increase in absorption
is observed. This indicates that the inner aqueous phase has become
more acidic due to the release of protons from the thylakoid membrane.
The proton release detected in Fig. 6.6(a) is slow, occurring with an
approximate t^ of 60ms,and no rapid phase is observed. This absorp
tion change is totally inhibited in the presence of the permeable
buffer imidazole, Fig. 6.6(b), and in the presence of nigericin,
Fig. 6.6(c): nigericin dissipates any proton gradient that builds
up across the thylakoid membrane. Both these results suggest that the
total extent of the neutral red response in Fig. 6.6(a) is due to pro
ton release. To be noted is that the decay rate of the A A ^ q is slow.
This is in accordance with the earlier observation of a slow decay
rate for the Fig. 6.3.
Fig. 6.7 shows the AAc .n in the presence of the reducing couple
Fd/NADPH. An attempt was also made to record similar absorption

+N.R. + val.
control
b. j t o Q.+imidazole
c.t
a.+ nig.
Fig. 6.6. Flash-induced proton release absorption changes recorded with the dye neutral red (N.R.), in the presence of valinomycin, at 540nm (pH 7.3). The sample was prepared as described in section 2.2.6, with stacked thylakoid membranes, and with no added inhibitor or reductant. (a") control, with no further additions ; (b) as (a) + 20mM imidazole; (c) as (a) + 2pM nigericin.
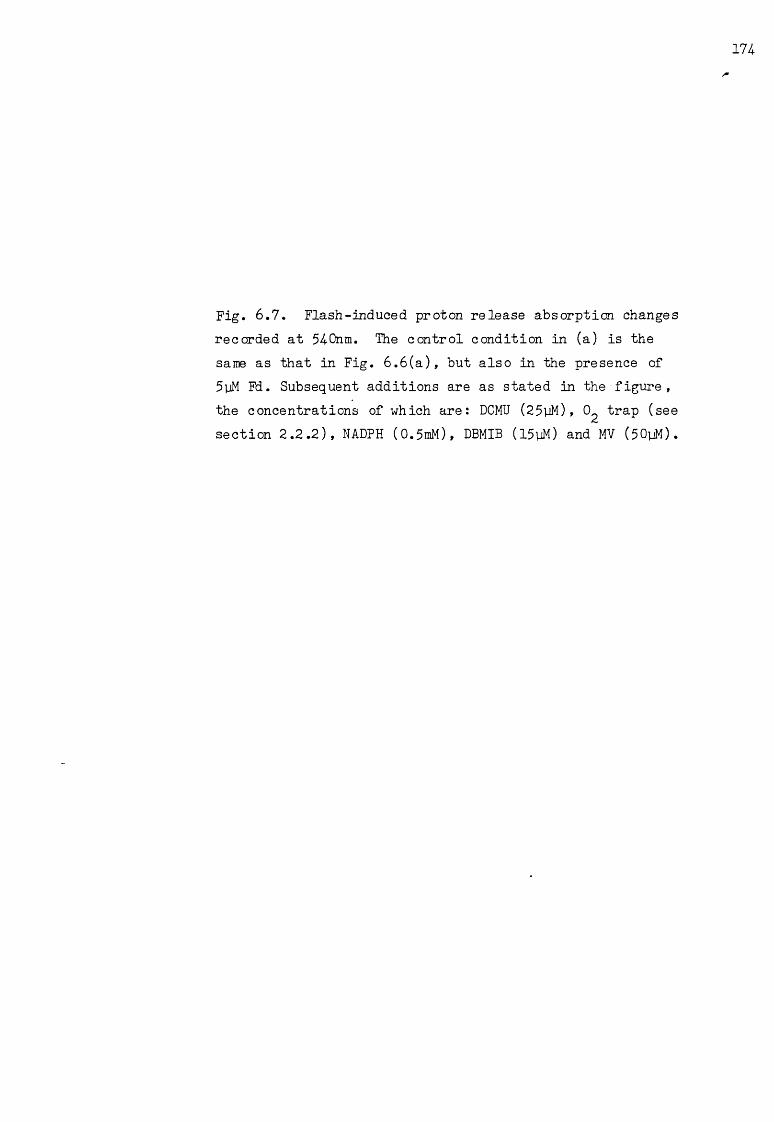
Fig. 6.7. Flash-induced proton release absorption changes recorded at 54-Onm. The control condition in (a) is the same as that in Fig. 6.6(a), but also in the presence of 5yM Fd. Subsequent additions are as stated in the figure , the concentrations of which are: DCMU (25yM), 0^ trap (see section 2.2.2), NADPH (0.5mM), DBMIB (l5yM) and MV (50yM).
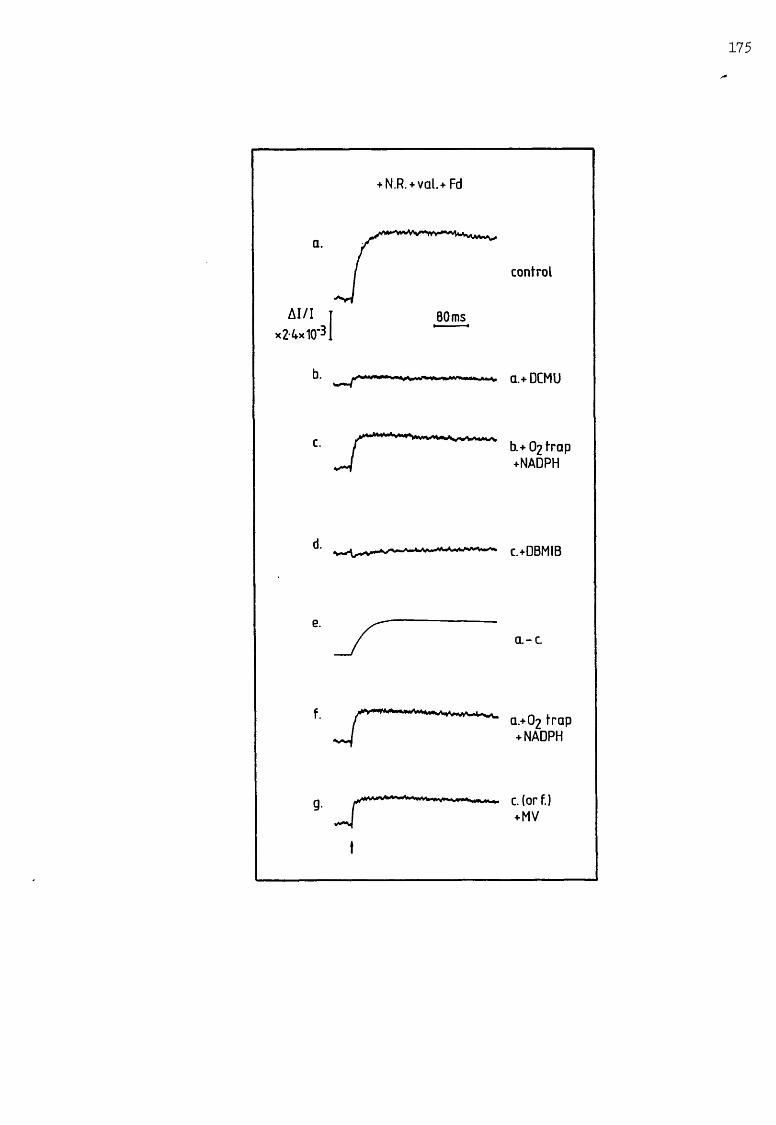
+ N.R. + val.+ Fd
control
b. a.+ DCMU
c. b.+ 02 trap +NADPH
■ £ +DBMIB
a-c.
f. a.+02 trap +NADPH
9- M i y ji»< c. (or f.) +MV
I

changes in the presence of dithionite. However, problems were again
encountered in keeping the pH of the sample stable, this time due to
the highly reducing conditions imposed by dithionite.
When ferredoxin is present as a PS1 electron acceptor, thus in
ducing non-cyclic conditions, the A A ^ q consists of an initial rapid
increase followed by a slower increase, which has an approximate tjLsof 15ms, Fig. 6.7(a). It has been suggested that the rapid increase
can be attributed to the oxidation of water by PS2, while the slower
increase can be attributed to the oxidation of PQH^ by PS1 (Auslander
and Junge, 1975). The following observations are in agreement with
this. In the presence of DCMU, the AA<- q in Fig. 6.7(a) becomes al
most non-existent after a few flashes, Fig. 6.7(b), in accordance with
the inhibition of electron transport. The subsequent addition of an
oxygen trap and NADPH restores the ability of the DC MU-inhibited chlo-
roplasts to release protons, Fig. 6.7(c), and also to generate phase
a and phase b of the AA^^^, Fig. 5.8. The proton release under the
conditions of Fig. 6.7(c) is completely inhibited by the addition of
DBMIB, Fig. 6.7(d).
Since the proton released by the oxidation of water is inhibited
by the presence of DCMU, the remaining contribution to the neutral red
response in Fig. 6.7(c) will be due to the proton release by PQH^ ox
idation. Subtracting trace (c) from trace (a), in Fig. 6.7, reveals
the full extent of proton release due to water oxidation, Fig. 6.7(e):
this extent matches that of the AAc.n in the presence of DCMU and04 uthe Fd/NADPH couple, Fig. 6.7(c), even at relatively long times. Thus,
assuming that only one proton is released, per flash, due to water
oxidation, PQH^ oxidation also appears to be associated with the release
of one proton per electron transferred to P700. Similar observations
have been made by Olsen et al (1980).

A feature to be noted in the subtracted trace of Fig. 6.7(e), how
ever, is that proton release due to water oxidation apparently occurs
with very slow kinetics, much slower than those expected from the
rapid kinetics observed in Fig. 6.7(a). Instead, the kinetics of
proton release due to PQH^ oxidation are now very rapid, Fig. 6.7(c).
This indicates that the rate of PQH^ oxidation is rapid under these
particular reducing conditions. Furthermore, in the absence of DCMU,
Fig. 6.7(f), the kinetics and extent of proton release induced by the
addition of the Fd/NADPH couple, are similar to those in the presence
of DCMU, Fig. 6.7(c). In accordance with the observations made in
Fig. 5.1(c) and the discussion of section 5.1, the Fd/NADPH couple
is able to reduce the PS2 electron acceptor chemically: the proton
thus released due to water oxidation will also be inhibited. The
addition of 50yMMV does not alter the neutral red response in Figs.
6.7(c) or (f), see Fig. 6.7(g): this condition would correspond to
the appearance of a delayed slow rise, Fig. 5.8(b). To be noted is
that all the traces in Fig. 6.7 are abolished in the presence of the
permeable buffer imidazole, as in Fig. 6.6(b).
Fig. 6.8 shows a similar series of experiments to those presented
in Fig. 6.7, but induced in the presence of DQH^. The addition of
DQH^ alone to the conditions of Fig. 6.6(a) results in a rapid absorp
tion increase, with an approximate t^ of 12ms, Fig. 6.8(a). Theamaximum extent of this A A ^ q is comparable to that in Fig. 6.7(a).
The addition of DCMU results in a deceleration in the kinetics of
proton release, and a small decrease in the total extent of the *
Fig. 6.8(b). In the absence of DCMU, DQH^ does not inhibit PS2 com
pletely, see Fig. 5.1(d). The AA^^ in Fig. 6.8(a) thus probably con
tains a small contribution from the proton released by water oxidation,
which is subsequently inhibited in the presence of DCMU.
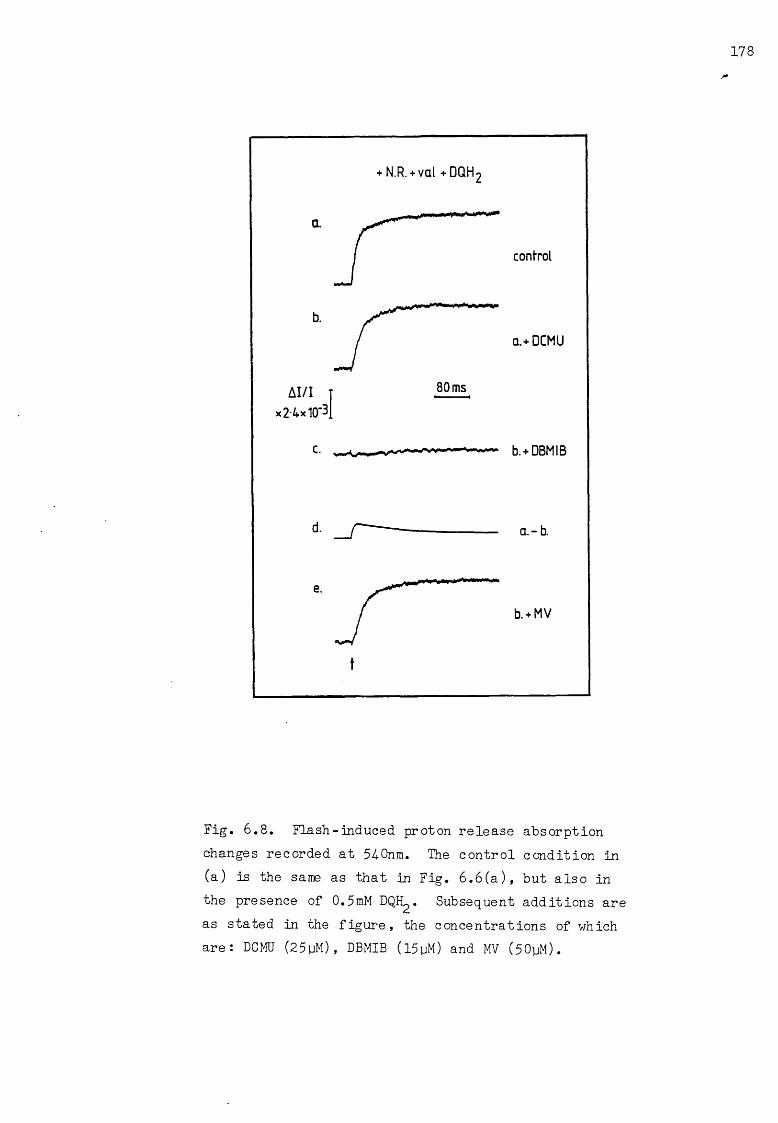
Fig. 6.8. Flash-induced proton release absorption changes recorded at 54-Onm. The control condition in (a) is the same as that in Fig. 6.6(a), but also in the presence of 0.5mM DQH^. Subsequent additions are as stated in the figure, the concentrations of which are: DCMU (25yM) , DBMIB (l5yM) and MV (50yM).

179
Subtraction of trace (b) from trace (a), in Fig. 6.8, reveals the
contribution from the proton due to water oxidation, Fig. 6.8(d):
this exhibits the expected rapid rise kinetics. However, what per
centage this is of the total contribution from the water oxidation
proton is unknown. In order to estimate a possible H+/e ratio with
DQH^ as reductant, it is worthwhile to compare the extent of the
A A ^ q in Fig. 6.8(b) with that in Fig. 6.7(c): it is twice as large.
It could thus be suggested that the H+/e ratio for PQH^ oxidation,
under these particular reducing conditions, is 2. Again, the addition
of MV does not alter the kinetics or the extent of proton release,
compare Figs. 6.8(e) and (b). Furthermore, all the traces in Fig. 6.8
are abolished in the presence of imidazole.
6.4 Discussion:
The results presented in the previous chapter suggest that the
generation of phase b is associated with the re oxidation of cytochrome
b-563, where cytochrome b-563 appears to be involved in a Q-cycle type
mechanism. The results presented in this chapter would be in support
of this finding. Furthermore, they indicate an association of phase b
with the transfer of protons, as is expected for a Q-cycle type me
chanism.
From Figs. 6.1 and 6.2, the involvement of protons is apparent.
It is such that the extent of phase b and that of the flash-induced
redox reactions of cytochrome b-563 are diminished at high pH values,
where the availability of protons for the reduction of PQ is limited.
This not only supports the previous observation that the generation
of phase b and the redox reactions of cytochrome b-563 can be closely
associated, but also indicates a requirement for protons, as expected
(but see later).

The kinetics of proton uptake, in the presence of reductant, Fig.
6.3(d), can be correlated with those for the occurrence of phase b,
Fig. 5.11(a), under similar conditions. The pH titrations presented
in Figs. 6.1 and 6.4-, however, do reveal a paradox. The component
responsible for proton uptake has a pK of 7.5, Fig. 6.4-, while that
responsible for the occurrence of phaseb has a pK of 8.7, Fig. 6.1.
This might suggest that, contrary to the earlier observation, proton
uptake cannot be correlated with the generation of phase b, since
the components responsible for each process are different. However,
the consequence of such a difference in pK values is that, although
very little proton uptake is observed at pH 8.0,the full extent of
phase b is still observed. The implication of this is that electron
transport is still operational despite the lack of proton uptake.
Such an observation is difficult to reconcile either with a typical Q-
or b-cycle mechanism. Furthermore, a similar anomaly has also been
noted in bacterial chromatophores (Petty et al, 1979) but without
clear explanation. The pH titration in Fig. 6.4- does, however, suggest
a H+/e ratio of 2 at pH 7.5, in accordance with the expected uptake
of 2H+ upon the reduction of PQ (see section 1.3.1). Furthermore, it
is noted that a diffusion barrier exists which slows the uptake of
protons (Auslander and Junge, 1974.) : this thus limits the optimal rate
of electron transfer.
Turning to the proton release measurements, it is interesting to
observe that, in the absence of added reductant or inhibitor, Fig.
6.6(a), there is no rapid phase due to the water oxidation proton. This
could indicate that, under these conditions, electron transport is slow,
possibly due to the loss of endogenous components required for the cor
rect redox poising of the system. The addition of ferredoxin alone,
Fig. 6.7(a), is able to restore the appropriate conditions required for

the observation of rapid proton release due to water oxidation. To
be noted, though, is that recent evidence suggests hindered lateral
mobility of protons within the internal aqueous phase (Hong and Junge,
1983). This could explain why the water oxidation proton is not al
ways observed as a rapid transient in the neutral red absorption trace.
In the presence of the Fd/NADPH couple, the kinetics of proton re
lease , Figs. 6.7(c) or (f), do not match those for the generation
of phase b, Fig. 5.8(a). They would instead match more closely with
the kinetics of cytochrome f rereduction under similar reducing con
ditions, Fig. 5.9(a). Furthermore,in the presence of Fd/NADPH and
MV, no delayed kinetics are observed in proton release, Fig. 6.7(g),
that would correlate with the occurrence of a delayed phase b, Fig.
5.8(b). This latter result would, instead, be evidence for the dis
cussion given in section 5.6: PQH^ oxidation, and hence proton re
lease, will occur despite the occurrence of a delayed phase b. The
results thus presented in Fig. 6.7 would suggest that proton release
is only indirectly involved in the generation of phase b.
In the presence of DQH^ and DCMU, however, the kinetics of proton
release, Fig. 6.8(b), would match those for the generation of phase
b, Fig. 5.11(a), thus implicating a correlation, had it not been for
the Fd/NADPH result in Fig. 6.7(g). A point worth noting, however,
is that the addition of MV, in the presence of DQH^ and DCMU, does
not alter the kinetics or extent of proton release, compare Figs. 6.8(e)
and (b); this suggests that proton release is not specifically associat
ed with cyclic electron flow, under these particular reducing conditions.
The H /e ratios, as determined by proton release measurements,
apparently vary with redox poise. In the presence of the Fd/NADPH
couple, Fig. 6.7, the estimated H+/e ratio is 1; in the case of
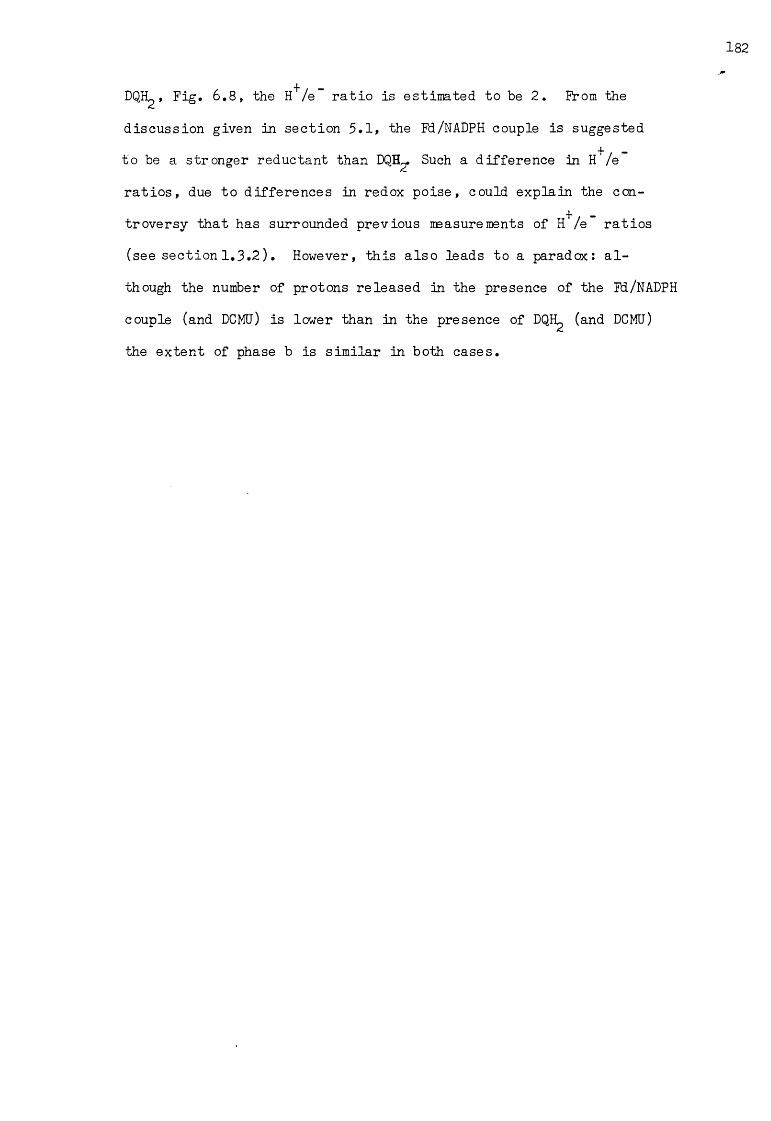
DQH^, Fig. 6.8, the H /e ratio is estimated to be 2. From the
discussion given in section 5.1, the Fd/NADPH couple is suggested
to be a stronger reductant than DQH . Such a difference in H'/e
ratios, due to differences in redox poise, could explain the con
troversy that has surrounded previous measurements of H+/e ratios
(see section 1.3.2). However, this also leads to a paradox: al
though the number of protons released in the presence of the Fd/NADPH
couple (and DCMU) is lower than in the presence of DQH^ (and DCMU)
the extent of phase b is similar in both cases.

CHAPTER 7
Inhibitor studies
In this final results chapter, the effect of inhibitors on the
515nm electrochromic absorption change is reported in conjunction with
their effect on the cytochrome redox reactions and proton uptake/
release. The conditions used are those for pseudocyclic electron
flow, where DQH^ is the reductant, see Fig. 5.11(a). Three diff
erent classes of inhibitors are used:
(1) DBMIB and UHDBT. These correspond to the type 2 inhibitors des
cribed in section 1.3.3: they have been reported to act by binding
to the Rieske FeS centre and thus inhibit its reduction by PQH^.
(2) HQNO and antimycin. These correspond to the type 1 inhibitors of
section 1.3.3: they inhibit the re oxidation of the high potential
cytochrome b-563.
(3) o-phenanthr oline. This is thought to inhibit the oxidation of the
primary acceptor Q^, at the same site as DCMU (Satch, 1974-).
The aim of these inhibitor studies is to provide further evidence for
the previous conclusions concerning (a) the involvement of cytochrome
b-563 in the generation of phase b, and (b) the involvement of a
Q-type cycle in photosynthetic electron transport.
7.1 Inhibitor effects on the AA„ ,.:---------------------------olo
Fig. 7.1 shows the effect of different inhibitors on the AA_.,_.bitThe control AA^^ is shown in Fig. 7.1(a) and is analogous to that
shown in Fig. 5.11(a): the generation of both phase a and phase b
is observed under the pseudocyclic conditions imposed. On the sub
sequent addition of either DBMIB (l5yM) , HQNO (0.2mM) or o-phenanthro-
line (2mM), Figs. 7.l(b)-(d), only the generation of phase b is in-

+d c m u +d q h 2
Q.
AI/I [ xZ^xKR
control
+ DBMIB
+ HQN0
+ o-phen.
Fig. 7.1. The effect of inhibitors on the flash-induced AA,.^, for stacked thylakoid membranes. Conditions are as described in section 2.2.2 for pseudocyclic electron flow, with DQH^ (0.5mM) as reductant. (a) control, with no further additions; (b) as (a) + 15pM DBMIB; (c) as (a) + 0.2mM HQNO; (d) as (a) + 2mM o-phenanthroline (o-phen.).

hibited; the extent of phase a remains unaltered. To be noted is
that, at the particular inhibitor concentrations used, uncoupling
artefacts are small. The underlying mechanism by which phase b
is suppressed by these various inhibitors, is different in each case
due to their different sites of action: this is investigated more
fully in the next section.
The effect of UHDBT or antimycin, however, appears to be twofold.
Apart from their known inhibitory action on electron transfer reactions
(see section 1.3.3), they also cause uncoupling, see Figs. 7.2 and
7.3. Furthermore, in the presence of UHDBT, at concentrations that
do not totally inhibit phase b, a delayed slow phase is observed,
Fig. 7.2. Such a delayed effect is not so apparent with antimycin at
similarly low concentrations, Fig. 7.3. In the presence of DBMIB, it
can be clearly observed, in Figs. 7.2 and 7.3, that the rate of decay
of the is enhanced as the concentration of UHDBT, or antimy
cin, is increased. Concomitantly, a decrease in both the extent of
phase a and that of phase b is observed. The decrease in the extent
of phase a is probably due to the uncoupling effect masking its full
amplitude, as described earlier in reference to Fig. 3.5(c); it is
unlikely to be due to an inhibitory effect of UHDBT or antimycin on
the electrogenic step in the PS1 reaction centre. It is noted that
concentrations of UHDBT above lOpM apparently inhibit phase b, Fig. 7.2;
in the case of antimycin, concentrations above 30yM are required,
Fig. 7.3.
7.2 Inhibitor effects on cytochromes b-563 and f :
The control absorption changes of cytochromss b-563 and f are
shown in Figs. 7.1(a) and 7.5(a),respectively: the conditions are
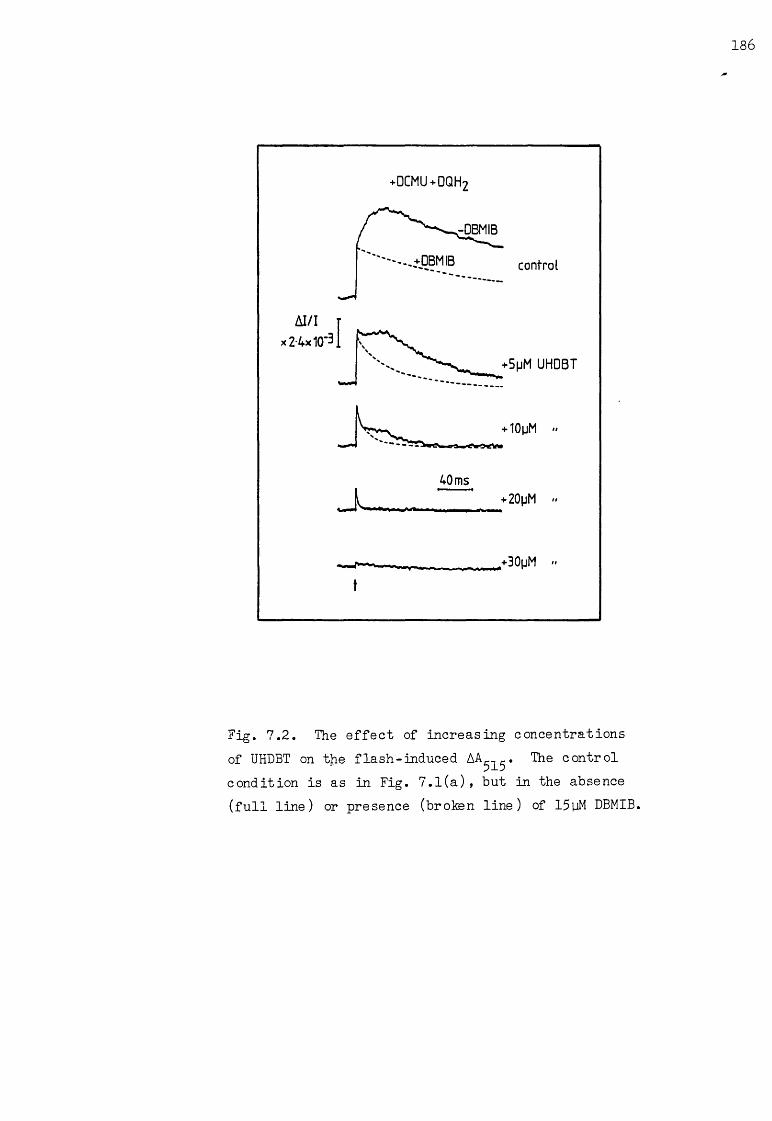
+d c m u +d q h 2
t+30\iM f t
Fig. 7.2. The effect of increasing concentrations of UHDBT on the flash-induced AAC-,C. The control condition is as in Fig. 7.1(a) , but in the absence (full line) or presence (broken line) of 15pM DBMIB.
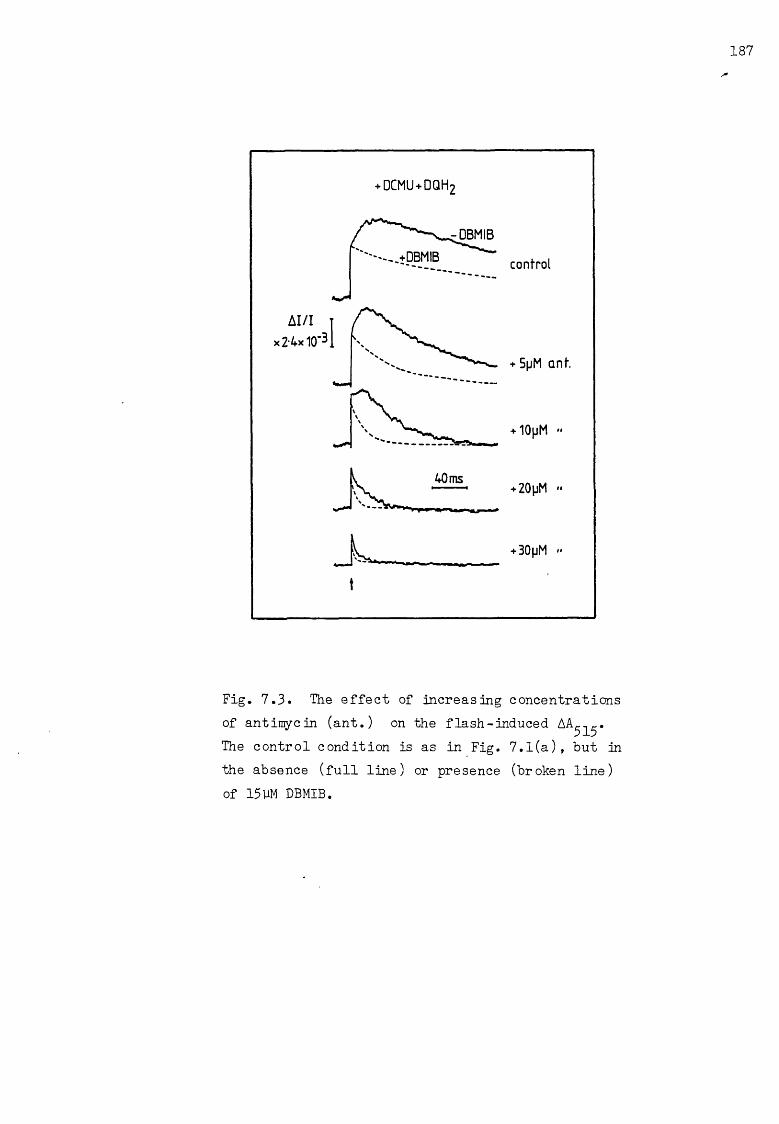
+d c m u +d q h 2
Fig. 7.3. The effect of increasing concentrations of antimycin (ant.) on the flash-induced AA^^. The control condition is as in Fig. 7.1(a), but in the absence (full line) or presence (broken line) of 15 \M DBMIB.

+d c m u +d q h 2
563-540 nm]
AI/I
x1-2x10‘3
control
+ DBMIB
c. ***1 nn~ n > i mj,i iiurf~~i „ +UHDBT
•HQNO
f-
t
+ antimycin
+ o-phen.
Fig. 7.4-. The effect of inhibitors on the flash- induced absorption change of cytochrome b-563, as recorded at 563-54-Onm. Conditions are as in Fig. 7.1(a), but in the presence of valinomycin (2yM) and nigericin (2yM), see section 2.2.3. (a) control, with no further additions; (b) as (a) + 15yM DBMIB; (c) as (a) + 20yM UHDBT; (d) as (a) + 0.2mM HQNO; (e) as (a) + 10yM antimycin; (f) as (a) + 2mM o-phe nan thro line .

189
•d c m u +d q h 2
(554-5A.0nm!
A I / I
x1-2x10
v
4 A-Oms
b. n —
control
■DBMIB
c. -~ L ■UHDBT
d. —*« -* •* --* • +HQN0
e. • » * +antimycin
f. o-phen.
Fig. 7.5. The effect of inhibitors on the flash- induced absorption change of cytochrome f , as recorded at 554--54-Onm. The control condition in trace (a) is as in Fig. 7.U (a). The inhibitor concentrations are as in Fig. 7.4-.

the same as those in Fig. 7.1(a). The kinetics are similar to those
observed in Fig. 5.12(a): the kinetics of cytochrome b-563 reoxidation
and those of cytochrome f rereduction match. A similar observation
is made in bacterial chromatophores (Prince and Dutton, 1975; 1977).
Both the flash-induced reduction of cytochrome b-563, Fig. 7.1(a),
and the flash-induced oxidation of cytochrome f, Fig. 7.5(a), corres
pond to the turnover of approximately 1 molecule/1000 chlorophylls.
It is noted again that all the inhibitors used in this section inhi
bit the generation of phase b at the concentrations employed, see
section 7.1.
In the presence of DBMIB, both the flash-induced reduction, and
the subsequent dark reoxidation, of cytochrome b-563 are inhibited,
Fig. 7.1(b). In the case of cytochrome f, however, although its
flash-induced oxidation is still observed, Fig. 7.5(b), and to the
same extent as in the control, Fig. 7.5(a), its dark rereduction is
very slow. Similar cytochrome absorption changes are observed in
the presence of UHDBT, Figs. 7.1(c) and 7.5(c).
In the presence of HQNO, the extent of the flash-induced reduction
of cytochrome b-563 is increased to twice that observed in the con
trol, Fig. 7.1(a). Also,the rate of reduction is now apparently re
latively slow, Fig. 7.1(d): it occurs with an approximate tL of 8ms,2
compared to that of 1ms in the control. The subsequent dark re oxida
tion of cytochrome b-563 is, however,inhibited. Cytochrome f, on the
other hand, still undergoes the full extent of its flash-induced
oxidation, Fig. 7.5(d), although its rereduction kinetics have slowed:
to that of 5ms in the control, Fig. 7.5(a). It would thus appear that
now»the rate of cytochrome b-563 reduction matches that of cytochrome
f rereduction.
compare an approximate t^ of 13ms in the presence of HQNO, Fig. 7.5(d)2
In the presence of antimycin, the cytochrome redox reactions are
different to those expected: the antinycin site of inhibition is
thought to be similar to that of HQNO (see section 1.3.3). The
kinetics and extent of cytochrome b-563 flash-induced reduction, Fig.
7.4(e), are, instead, similar to those in the control, Fig. 7.4(a).
Its dark re oxidation is, however, inhibited. The cytochrome f redox
reactions are apparently unaltered in the presence of antimycin,
compare Figs. 7.5(e) and 7.5(a).
In the presence of o-phenanthroline, the cytochrome absorption
changes, Figs. 7.4(f) and 7.5(f), are similar to those observed in
the presence of antimycin, Figs. 7.4(e) and 7.5(e).
7.3 Inhibitor effects on proton uptake/release:
Figs. 7.6 and 7.7 show the effect of certain inhibitors on proton
uptake and proton release, respectively. The control traces, Figs.
7.6(a) and 7.7(a), are under the same electron transport conditions
as in Fig. 7.1(a). The AAcr7. in Fig. 7.6(a) represents the uptake of
l60pmoles of protons which, from Fig. 6.4, suggests that 2H are taken
up, per flash, from the outer aqueous phase. The A A ^ q in Fig. 7.7(a)
suggests that 2H+ are released, per flash, into the inner aqueous
phase since its magnitude is similar to that observed in Fig. 6.8(b).
A detailed analysis of proton uptake/release absorption changes is

- c .r .+d c m u +d q h 2
Fig. 7.6. The effect of inhibitors on the flash-induced proton uptake absorption changes, as recorded at 574-nm.The sample was prepared as described in section 2.2.5, with stacked thylakoid membranes. The control condition in trace (a) is in the presence of 25yM DCMU + 0.5mM DQH^. The inhibitor concentrations are as in Fig. 7.1. The calibrated extent of the AA, as determined by the method given in section 2.2.5, is also given. The dotted line in each trace represents the AAcr7, obtained upon the addition of 5 OmM tr ic ine .

+N.R.+ v q L+DCMU+DQH2
Fig. 7.7. The effect of inhibitors on the flash- induced proton release absorption change, as recorded at 54-Onm. The sample was prepared as described in section 2.2.6, with stacked thylakoid membranes. The control condition in trace (a) is in the presence of 25yM DC MU + 0.5mM DQH^. The inhibitor concentrations are as in Fig. 7.4.

given in sections 6.2 and 6.3. To be noted is that, the extents of
the A A i n Fig. 7.6 are not altered upon the subtraction of that
AAcr7. in the presence of 50mM tricine (see dotted lines in Fig. 7.6).
Furthermore, the rise kinetics are only altered minimally by this
procedure. Similarly, the A A ^ q in Fig. 7.7 are abolished in the
presence of the permeating buffer imidazole, as previously shown in
Fig. 6.6(b).
In the presence of DBMIB, proton uptake occurs, Fig. 7.6(b).
The actual concentration of protons taken up is over half that in
the control, Fig. 7.6(a); this suggests that at least 1H+ is taken
up per flash. The rate of proton uptake is faster than in the con
trol, although the rates of dissipation are similar. No proton re
lease is observed in the presence of DBMIB, Fig. 7.7(b).
In the presence of HQNO, proton uptake also occurs, Fig. 7.6(c).
Although the actual extent of the is smaller than the control,
Fig. 7.6(a), its calibration yields the same number of protons. The
kinetics of proton uptake are rapid, as in the presence of DBMIB,
Fig. 7.6(b); furthermore, the dissipation of the AA^^ is rapid.
Fig. 7.7(c) indicates that proton release also occurs in the presence
of HQNQ. Assuming that the extent of the A A ^ q in Fig. 7.7(c) can
be compared directly with that in the control, Fig. 7.7(a), this
suggests that less than 1H+ is released. The rate of proton release
is similar to that of the control, occurring with an approximate tL2
of 10ms; the dissipation of the A A ^ q is, instead, now rapid.
In the presence of o-phenanthroline, proton uptake again occurs,
Fig. 7.6(d). Its calibrated extent is similar to that in the presence
of DBMIB, Fig. 7.6(b): it is approximately half that of the control,
i.e. 1H+ is taken up. The kinetics of proton uptake are similar to

the control, Fig. 7.6(a), as are the kinetics for the dissipation of 195
the A A574-* Proton release is also observed to occur in the presence
of o-phenanthroline, Fig. 7.7(d): its extent would suggest that only
1H+ is released per flash. The kinetics of proton release are slow,
occurring with an approximate of 30ms; the dissipation kinetics2of the AAc.n are similar to those of the control.
04U
7.4 Discussion:
The compounds used in this study all inhibit the generation of phase
b. The mechanism of inhibition is, however, different for each class
of inhibitor; this can be deduced from the related cytochrome and pro
ton uptake/release absorption changes. A full analysis of these results,
as is given below, would appear to favour the generation of a slow
electrogenic phase coupled to a Q-cycle type mechanism.
DBMIB is a well known inhibitor of the Rieske FeS centre (see section
1.3.3); its resultant effect is to prevent the oxidation of PQH^. The
inhibition of phase b, by DBMIB, Fig. 7.1(b), thus suggests that PQH^
oxidation is involved in the generation of phase b. This would compare
with the result presented in Fig. 4.7(a) which shows that the genera
tion of phase b correlates with the chemical reduction of a component,
probably the PQ pool, with an E „ r of + lOOmV.m, / . 2
The cytochrome absorption changes, observed in the presence of
DBMIB, Figs. 7.4(b) and 7.5(b), are most easily explained by a Q-
cycle type mechanism. The blocking of PQH^ oxidation, by DBMIB,
prevents the photo-reduction of cytochrome b-563; its subsequent
re oxidation will thus also be inhibited, as observed in Fig. 7.4(b).
Cytochrome f, however, is pre-reduced in the dark, and hence it will
undergo a flash-induced oxidation, Fig. 7.5(b) . Its rereduction,
however, should be inhibited, since its supply of electrons from
PQH0 is blocked in the presence of DBMIB. Instead, a slow dark re-
reduction is observed: the time lag between actinic flashes is long
enough to allow the rereduction of cytochrome f by the added reducing
agent, DQH^. If a simple linear electron transport scheme were to
operate, (see section 5.6), then the flash-induced reduction of cyto
chrome b-563 would be observed, in the presence of DBMIB, but its
subsequent oxidation would be inhibited. From the cytochrome absorp
tion changes observed in Figs. 7.4(b) and 7.5(b), three possible sites
for the generation of a slow electrogenic phase can be envisaged:
the reduction of cytochrome b-563, the reoxidation of cytochrome b-563
.or the rereduction of cytochrome f. A clearer distinction between the
possible sites is made later.
The proton uptake/release measurements in the presence of DBMIB,
Figs. 7.6(b) and 7.7(b), are surprising. As might be expected, if
PQH^ oxidation is inhibited, as it is in the presence of DBMIB, pro
ton release will not occur; this is indeed observed in Fig. 7.7(b).
However, following the same argument, the uptake of protons might
also be expected to be inhibited. Instead, at least 1H+ per flash
is taken up, Fig. 7.6(b). One possible explanation is that under
these particular conditions, cyclic electron flow is associated with
the uptake of 1H+: PS1 can still turnover in the presence of DBMIB
(phase a is still observed under these conditions, see Fig. 3.1(b) )
and no PS1 electron acceptors are present.
UHDBT is thought to act at the same site as DBMIB (see section
1.3.3), namely at the Rieske FeS centre. The inhibition of phase b,
in the presence of UHDBT is, however, not as obvious as in the pre-

sence of DBMIB: uncoupling artefacts are now quite prominent, Fig,
7.2. This thus poses the possibility that the inhibition of phase
b is only an apparent effect: a similar Inhibition of phase b is
observed in the presence of the uncoupler valinomycin, Fig. 3.5(d).
However, the cytochrome absorption changes observed in the presence
of UHDBT, Figs. 7.4(c) and 7.5(c), are similar to those observed in
the presence of DBMIB. This thus suggests that UHDBT and DBMIB do
have a similar site of inhibition, and hence that the inhibitory effect
of UHDBT on phase b is not just caused by an increased relaxation
rate in the decay. To be noted, the delayed phase b observed in
Fig. 7.2 is similar to that in Fig. 5.7(b).
HQNO inhibits the oxidation of the high potential cytochrome b-563
(see section 1.3.3). The inhibition of phase b, in the presence of
HQNO, thus suggests the involvement of cytochrome b-563 in the gene
ration of phase b. A similar suggestion has already been put forward
in chapters 4 and 5. The cytochrome absorption changes presented in
Figs. 7.4(d) and 7.5(d) support the proposed HQNO site of inhibition.
In the presence of HQNO, the full extent of cytochrome b-563 flash-
induced reduction is observed while its dark re oxidation is slow,
Fig. 7.4(d). This indicates that HQNO only inhibits the oxidation
of cytochrome b-563 and not its reduction. In this way» the true
kinetics of the flash-induced reduction of cytochrome b-563 are re
vealed. To be noted is that the small extent of cytochrome b-563
turnover observed in the control, Fig. 7.4(a), can be most simply
accounted for by the competing reduction and re oxidation reactions.
The observed flash-induced reduction of cytochrome b-563 in Fig.
7.4(d) indicates that PQHn oxidation still occurs in the presence
of HQNO. For a Q-type cycle it can be postulated that, apart from
the expected flash-induced oxidation of cytochrome f , its dark

rereduction will also occur. This is, in fact, observed in Fig. 7.5(d).
Such an effect would not be expected for a simple linear electron
transport scheme. The kinetics of cytochrome f dark rereduction
are, however, slightly slower than those in the control, Fig. 7.5(a):
it is likely that the rereduction rate of the Rieske FeS centre, and
hence that of cytochrome f, is slowed, in the presence of HQNO, due
to cytochrome b-563 remaining in the reduced state. To be noted,
though, is that the kinetics of the flash-induced reduction of cyto
chrome b-563 and those of the dark rereduction of cytochrome f now
match, thus favouring a Q-type cycle.
Since neither the reduction of cytochrome b-563, nor the rereduc
tion of cytochrome f are inhibited (totally) in the presence of HQNO,
they can be eliminated as possible sites for the generation of phase
b, as suggested earlier in view of the DBMIB results. It is, however,
possible to correlate the reoxidation of (the high potential) cyto
chrome b-563 with the generation of phase b.
Since both PQ reduction and PQH^ oxidation are still able to occur
in the presence of HQNO, it is expected that proton uptake and proton
release also occur uninhibited. The calibrated extent of the AA_„.5 / 4in Fig. 7.6(c) suggests that proton uptake does indeed occur max
imally, with 2H+ being taken up per flash. However the extent of the
A A ^ q in Fig. 7.7(c) would suggest that only 1H+ is released by PQH^
oxidation. These results are difficult to reconcile with a Q-cycle
type scheme. It is, however, worthwhile noting that while the rate
of proton release is slow, Fig. 7.7(c), the rate of dissipation of
the A A ^ q is fast: this could mask the true extent of proton release.
Furthermore, in the case of the measurement of proton uptake,
Fig. 7.6(c), it is observed that, although the extent of the AA57rin the presence of HQNO, is approximately half that of the control,
Fig. 7.6(a), its calibration yields the same proton concentration.
This suggests that HQNO has altered the buffering capacity of the
suspension. A similar effect could be induced, by HQNO,in the presence
of neutral red. A direct calibration, in terms of extent, and hence
number of protons released, between the A A i n the presence of HQNO,
Fig. 7.7(c), and that of the control, Fig. 7.7(a), could not, there
fore be made.
Antimycin is thought to act at the same site of inhibition as
HQNO. Like UHDBT, however, antimycin causes uncoupling, Fig. 7.3:
this is manifested by the increased rate of decay of the AA*.^. The
effectiveness of antimycin to inhibit phase b is thus not as obvious
as with HQNO. Furthermore the cytochrome b-563 absorption changes in
the presence of antimycin are different, compare Figs. 7.4(e) and (d).
The full extent of the flash-induced reduction of cytochrome b-563
is not observed, Fig. 7.4(e), as in the presence of HQNO, Fig. 7.4(d),
although the inhibition of its dark reoxidation is still apparent.
This observation could be taken as evidence for an alternative anti
mycin inhibition site. Possibly, antinycin inhibits the oxidation of
the low potential b-type cytochrome, b^ in Fig. 1.6, rather than the
high potential form, as would be expected. The inhibition of the re
oxidation of b^ would thus inhibit the reduction and subsequent ox
idation of b^; hence the inhibition of phase b. This’ interpretation,
however, may be complicated by the slow re oxidation kinetics of cyto
chrome b-563, as observed in the presence of antimycin. Such an effect
could mask the full extent of the flash-induced reduction of cytochrome
b-563. In bacterial chromatophores , antimycin does act like HQNO in
inhibiting the oxidation of b, (Hauska et al, 1983). The cytochrome
f flash-induced absorption changes, in the presence of antimycin,
support the idea that antimycin only inhibits certain redox reactions
of a component involved in a Q-type cycle: the cytochrome f redox
reactions are observed to be unaffected, compare Figs. 7.5(e) and
(a). A linear electron transport scheme can be ruled out follow
ing the earlier discussion concerning HQNO.
O-phenanthroline is thought to act at the same site of inhibition
as DCMU, by competing for the Qg binding site (see section 1.3.1).
The inhibition of phase b, in the presence of o-phenanthroline, Fig.
7.1(d), is thus surprising. To be noted, is that the addition of
DCMU leaves the extent of phase b unaffected, Fig. 5.1(d). The cyto
chrome absorption changes in the presence of o-phenanthroline, Figs.
7.4(f) and 7.5(f)» are,however, very similar to those observed in the
presence of ant-imycin, Figs. 7.4(e) and 7.5(e). This thus suggests
that o-phenanthr oline has a secondary site of inhibition which is
within the cytochrome b^/f complex and which is similar to that of
antinycin. Namely, it inhibits the oxidation of one of the b-type
cytochromes. The inhibition of phase b, by o-phenanthr oline , would
thus be expected in view of the earlier observations. In accordance
with this predicted site of inhibition, both proton uptake and proton
release are observed in Figs. 7.6(d) and 7.7(d), although only 1H+
is taken up or released per flash. This could indicate that, in the
presence of o-phenanthroline, electron transport is slow.
To summarize, these inhibitor studies would confirm the earlier
suggestions that the generation of phase b is associated with the
oxidation of cytochrome b-563, and more specifically, to its high
potential form. Furthermore, they indicate that this cytochrome is in
volved in a Q-cycle type scheme. These results also suggest possible
alternative sites of inhibition for antimycin and o-phenanthr oline.

CHAPTER 8
Summary and final discussion
The aim of this study has been an attempt to resolve the con
troversy concerning the mechanism by which the slow phase (phase b)
of the flash-induced 515nm electrochromic shift is generated in
chloroplasts. In this chapter, the main conclusions drawn from
chapters 3,4-»5,6 and 7 are summarized and interrelated. The re
levance of these conclusions are discussed in terms of the current
ideas on the mechanism of electron transport in the cytochrome b
containing enzyme complexes.
Physical features of phase b:
The observation that phase b represents an electrical phenomenon
has been well established in the literature (Velthuys, 1981; Crowther
and Hind, 1980; Olsen and Barber, 1981). The results presented in
chapter 3 would also appear to be in agreement with such a conclusion.
A slow ”electrogenicMstep has indeed been predicted both in
Mitchell's Q-cycle and Wikstrom's b-cycle (see section 1.3.2).
In the former model it is the outward movement of an electron, sub
sequent to that due to primary charge separation, that would generate
a transmembrane potential; in the latter model it would be the in
ward translocation of a proton. Such an electrical event, as re
corded by the electrochromically-sensitive carotenoid pigments, might
be expected to exhibit a magnitude similar in extent to that of
phase a due to PS1 alone, if the membrane is of uniform capacitance:
both these processes represent the movement of a single charge
across the membrane dielectric (albeit on different timescales).
Olsen and Barber (1981) have in fact made such a correlation.

The ratio of the extent of phase a (with only PS1 active) to that of
phase b, as resolved by a procedure similar to that depicted in Fig.
3.1, was found to be close to 1:1. The results presented in Fig. 3.1
are in agreement with this observation. However, in view of this,
and of other experimental data, alternative interpretations for the
generation of phase b have also been put forward (Olsen and Barber,
1981; Zimanyi and Garab, 1982): these only indirectly relate phase
b to electron transport. To be noted, the above ratio of 1:1 for the
extent of phase a (due to PS1 alone) to that of phase b, is only
obtained under "optimal" conditions (e.g. as in Fig. 3.1); the observ
ed extent of phase b is highly dependent on the membrane conductivity,
see Fig. 3.5(d), and on the ambient redox potential (see chapter 4-
and below).
The role of plastoquinol:
The requirement of particular reducing conditions to observe phase
b is already evident from the work of a number of different groups.
Either a chemical reductant is required (Bouges-Bocquet, 1977; Crcwther
et al, 1979; Olsen et ad., 1980; also see Fig. 3.3) or specific pre
illumination with PS2 light is required (Velthuys, 1978). Crowther
and Hind (1980) suggest that the chemical reduction of a component
with an g ^ of -55mV is required to observe phase b. Bouges-Bocquet
(1981b) has gone further to suggest that it is the reduction of a
special quinone species that is required. Also, Bouges-Bocquet (1981b)
observes that highly oxidizing or highly reducing conditions inhibit
the generation of phase b.
The redox titration presented in Fig. 1.7(a) defines more clearly
the above ambient redox potential dependence of phase b. At potentials

more positive than +150mV, phase b is either very small or not ob
servable at all. As the potential is lowered, the extent of phase
b increases such that it titrates in with an E „ _ that matchesm,7.5
that of the PQ pool (see section 4-.4-). A further decrease in the
ambient potential and the extent of phase b decreases with an ^
of -75mV. This latter midpoint potential would correspond to that
for the chemical reduction of the high potential cytochrome b-563
located within the cytochrome b^/f complex (Hauska et al, 1983).
Girvin and Cramer (1983) have also recently carried out redox
titrations of the extent of phase b. Although they would agree
that the appearance of phase b requires the chemical reduction of
the PQ pool, they instead observe the full extent of phase b at
potentials as low as -200mV. At these low redox potentials, cytochrome
b-563 is fully reduced. Girvin and Cramer (1983) thus suggest that
it is the rereduction of the flash-oxidized Rieske FeS centre, by
FQH^, which could be linked to a proton pump, that is responsible
for the formation of phase b. In accordance with such a conclusion,
is the earlier observation made by Bouges-Bocquet (1980b) that , in
intact Chlorella cells, phase b correlates with the absorbance changes
of an unknown carrier, probably an FeS centre, but not the Rieske FeS
cluster. The above suggestion of Girvin and Cramer (1983) would im
plicate the operation of a b-cycle mechanism, see Fig. 1.6(b), in the
electron transport chain. Despite an obvious discrepancy between the
results presented in Fig. 4-.7(a) and those of Girvin and Cramer (1983),
concerning the component responsible for the generation of phase b,
the results presented in chapters 5 and 7 (to be summarized below)
provide a clear distinction.

Before proceeding further, however, it is worthwhile to note that,
whereas originally it had been thought that cyclic electron flow
was necessary to generate phase b (Crowther et al, 1979; Shahak et al,
1980), the redox titration presented in Fig. 4..7(b) shows that, in
the presence of MV, a competitive electron acceptor for PS1, and
under equilibrated conditions, the full extent of phase b can be ti
trated, as if in the absence of MV, Fig. 4..7(a). Selak and Whit marsh
(1982) have, in fact, recently shown that the full extent of phase b
is observed in the presence of DQH^ and MV (and in the absence of any
redox mediators). Furthermore, the result presented in Fig. 5.11(a)
is also in agreement with this. It is therefore apparent that cyclic
electron flow is not an absolute requirement for the generation of
phase b; a more stringent requirement is that of reduced PQ, Fig. 4-.7.
Correlation of phase b with electron transport:
The spectroscopic measurements of the slow phase of the electro-
chromic effect and of the redox kinetics of cytochromes b-563 and f,
under pseudocyclic conditions, presented in chapter 5, are not enough
in themselves to predict which component is responsible for the gene
ration of phase b and by what mechanism. The cytochrome absorption
changes obtained in the presence of dithionite, Fig. 5.7(a), or DQH^,
Fig. 5.12(a), would implicate the rereduction of cytochrome f with
the generation of phase b, on the basis of the similarity in kinetics.
Such a correlation has previously been suggested by Crowther and
Hind (1980). Also, the results presented here could be interpreted
in terms of a simple linear electron transport scheme (see section
5.6). On the other hand, in the presence of Fd/NADPH, Fig. 5.9(a),
the reoxidation kinetics of cytochrome b-563 would match more closely
those for the generation of phase b. Furthermore, a Q-type cycle (as
defined in section 1.7) would now be more appropriate. To clarify

this apparent discrepancy, both the effect of salt and the appear
ance of a delayed phase b, under certain conditions, have been
analysed.
Changes in salt concentration alter both the extent of phase b
and that of cytochrome b-563 reoxidation (see chapter 5), the kine
tics and extent of the redox reactions of cytochrome f remain un
altered. Olsen and Barber (1981) have observed a similar effect of
salt on the extent of phase b and have suggested a delocalization model
for its generation. However, such a model could not explain the con
comitant salt effect on the extent of cytochronB b-563 re oxidation.
Possible explanations for this salt effect have been put forward in
section 5.6. Briefly, although changes in salt concentration alter
the spatial separation of the complexes within the thylakoid membrane
(see sections 1.2.2 and 1.2.3), an alternative property might more
appropriately explain the effect of salt on the extents of phase a,
phase b and cytochrome b-563 oxidation, as observed in chapters 4- and
5.
A delay in the generation of phase b can be observed when strongly
reducing reductants, under anaerobic conditions, are used in the pre
sence of MV. The observed cytochrome absorption changes, together
with the effect of salt, seem to suggest that the generation of phase
b is closely related to the oxidation of cytochrome b-563, where cyto
chrome b-563 is involved in a Q-type cycle. This suggestion would be
in accordance with the observation made earlier, from the redcx tit
rations, Fig. 4.7, that the chemical reduction of the high potential
cytochrome b-563 is responsible for the inhibition of phase b. To be
noted, such a delayed phase b has not been previously reported in the
literature. Furthermore, in the presence of DQH^ and MV, no delay in
the generation of phase b is induced, Fig. 5.11(a): anaerobic condi
tions are not necessary for this reductant.

Correlation of phase b with proton translocation:
Protons also appear to be involved in the generation of phase b.
Farineau et ad. (1980) have observed that the kinetics of both the
rise and decay of phase b are decelerated by the replacement of
H^O by H^O. In this study, it has been shown that an increase in
the concentration of protons results in a decrease in the extent
of the delay in the delayed phase b and of that in the re oxidation
of cytochrome b-563, under similar conditions, see Fig. 5.10. The
magnitude of phase b is diminished at high pH values, Fig. 6.1, and
the redox reactions of cytochrome b-563 exhibit a similar pH depen
dency, Fig. 6.2.
From the proton uptake/release measurements presented in chapter
6, the kinetics for the generation of phase b appear to correlate
more directly with those for proton uptake than for proton release.
The proton uptake results suggest that 2H are taken up per flash, at
pH 7.3, Fig. 6./. However, there is the paradox that at higher pH
values, where only 1H+ is taken up, a maximal extent of phase b is
still observed: this result is difficult to reconcile with any Q-
cycle type mechanism. Such an observation, however, could indicate
that one proton is specifically necessary for the generation of phase
b, in a manner analogous to the bacterial system, where one of the
protons taken up is antimycin-sensitive, while the second is antimycin-
insensitive (Petty et ad., 1979; also see Fig. 1.10). If this were the
case, it could thus be envisaged that, under conditions when a delay
ed phase b is observed, the uptake of this proton is also delayed.
To be noted, though, at very high pH values a large phase b is still
observed, although no proton uptake occurs. This has also been ob
served in bacterial chromatophores (Petty et ad., 1979) and is a further
paradox in terms of a Q-cycle type mechanism. 2 07
For proton release, and in the presence of Fd/NADPH, Fig. 6.7,
the kinetics match more closely these for cytochrome f rereduction
than for phase b generation. Also, under conditions where a delayed
phase b is apparent, no delayed proton release is observed. In the
presence of DQH^, Fig. 6.8, the kinetics of proton release and cyto
chrome f rereduction again match, but they are now slow. In the
literature,however, it has been suggested that it is, in fact, proton
release due to PQH^ oxidation that is responsible for the generation
of phase b (Olsen and Barber, 1981; Zimanyi and Garab, 1982). The
models that are subsequently proposed, hcwever, cannot be reconciled
with the observation made here, that the number of protons released
by PQII^, per flash, appears to be redox dependent: in the presence of
Fd/NADPH only 1H+ appears to be released, while in the presence of
DQH^, 2H+ appear to be released. Such an observation could be describ
ed in terms of a redox dependence similar to that found for the gene
ration of phase b, Fig. 4-.7, although from this study, proton release
only appears to be indirectly involved with phase b. To be noted,
though, the extent of phase b in the presence of Fd/NADPH is not dimi
nished by the same amount that the extent of proton release is, when
compared to that in the presence of DQH^.
Such a redox dependent proton release has also been observed by
Crowther and Hind (1982). Using increasing concentrations of ferri-
cyanide, they found that under non-oxidizing conditions (i.e. in the
absence of ferricyanide) approximately 2H+ were released by PQH^ per+flash, while under mildly oxidizing conditions this value fell to 1H .
Although these results cannot be directly compared to those presented
in chapter 6, it must be noted that, in their study, Crowther and
Hind (1982) did not estimate the effect of ferricyanide on P700: in
creasing concentrations of ferricyanide chemically oxidize P700 and

hence the concentration of photo-oxidized P700 also decreases. Their
computed changes in H+/e ratios might therefore be incorrect.
The action of inhibitors within the cytochrone b^/f complex:
The results discussed so far seem to point to a correlation between
the generation of phase b and the oxidation of cytochrome b-563, where
the underlying mechanism is possibly a Q-type cycle. The inhibitor
studies presented in chapter 7, to be discussed briefly below, lend
further support for such a conclusion.
The inhibition of phase b in the presence of DBMIB or UHDBT indi
cates the involvement of PQH^ oxidation. Also inhibited are the redox
reactions of cytochrome b-563 and the rereduction of cytochrome f.
These results thus implicate a Q-cycle type mechanism for the reduc
tion of cytochrome b-563.
HQNO, antimycin and o-phenanthroline also inhibit the generation of
phase b, as well as the reoxidation of cytochrome b-563» they hardly
affect the rereduction kinetics of cytochrome f. The consequence of
these results is that cytochrome f cannot be directly implicated in the
generation of phase b, as suggested by Growther and Hind (1980). Further
more, these results would contradict the model proposed by Girvin and
Cramer (1983) in which the formation of phase b is related to the re-
reduction of the Rieske FeS centre. If the redox reactions of cyto
chrome f are unaffected in the presence of these particular inhibitors,
then PQH^ oxidation must still occur (although the actual number of
protons released may be altered) and hence the Rieske FeS centre must
also be able to turnover. By a similar argument, the classical b-cycle
model depicted in Fig. 1.6(b), and implicated by Girvin and Cramer (1983)
in the formation of phase b, can be ruled out. However, this is not

to say that protons are not closely involved in the generation of
phase b, as has been discussed above.
In the presence of HQNO, apart from the inhibition of phase b,
the extent of cytochrome b-563 flash-induced reduction is enhanced
2-fold, while its re oxidation is inhibited, Figs. 7.1 and 7.4-. This
observation implicates the re oxidation of the high potential cyto
chrome b-563 in the generation of phase b. Since the kinetics of
cytochrome b-563 reduction and cytochrome f rereduction, now match
quite closely, this is further evidence for a Q-cycle type mechanism
in operation. Similar observations, in the presence of HQNO, have
also recently been made by Selak and Whitmarsh (1982).
The effect of inhibitors on proton uptake /re lease are also shown
in chapter 7. For the particular conditions used here (in the absence
of inhibitors) the uptake of 2H+ and the release of 2H+, per flash,
has been calculated (see chapter 6). In the presence of o-phenanthro- + +line, only 1H is taken up and 1H is released. In accordance with
an earlier suggestion made in this discussion, the inhibited proton
taken up could be implicated in close association with the reduction
of PQ by the oxidation of the high potential cytochrome b-563, via a
Q-cycle mechanism, as is observed in bacterial chromatophores (Petty
et al, 1979; also see Fig. 1.10). However, the observation that 2H+
are still taken up in the presence of HQNO, is inconsistent with the
above suggestion. Finally, the particular effect of HQNO and o-phenan
throline on the generation of phase b and on proton uptake/re lease ,
provides further evidence against the models proposed by Olsen and Bar
ber (1981) and Zimanyi and Garab (1982): proton release still occurs
due to PQH^ oxidation, albeit with the inhibition of phase b.
A -possible mechanism far the ulastoquinol-plastocyanin oxidoreduct-
ase in chloroplasts:
The results presented in this thesis appear to suggest that the
oxidation of the high potential cytochrome b-563 is responsible for
a secondary electrogenic step, as manifested by the generation of a
slow phase in the 515nm electrochromic absorption change. A modi
fied Q-cycle, depicted in Fig. 8.1, is proposed to account for the
observed electron transfer reactions. The involvement of protons
in the formation of phase b, as is evident from this study, is through
the redox reactions of PQ, the dark reduction of which is required
to observe phase b. The implication of these results, as summarized
in the model of Fig. 8.1, is that the cytochrome b^/f complex acts
as an electrogenic translocates, closely coupled to a proton pump.
Evidence along these lines has,in fact, already been presented for
the isolated cytochrome b^/f complex reconstituted into phospholipid
vesicles (Hurt et, al, 1982).
The mechanism of electron transport, as depicted in Fig. 8.1,can
be described as follows. There is a plastosemiquinone-generating site
located at the inner side of the thylakoid membrane, as well as quinol/
quinone binding sites located at the inner and outer sides of the
membrane, Q ^ and Qq, respectively. Once plastcquinol oxidation has
occurred at the Qj_site, the electron is transferred serially, through
the two b-cytochromes, to the Qq site. Full reduction of the quinone to
quinol at this latter site, however, can only occur once two electrons
have been stored. One electron will be provided by cytochrome b-563
(located within the cytochrome b^/f complex). The second electron can
be provided either by cyclic electron flow around PS1, an endogenous re-
ductant or by a second turnover of the cytochrome b^/f complex. The
eventual reduction of quinone to quinol at the Qq site is accompanied

P S 2 COM PLEX CYTO CH R O M E bg/f PS1 C O M PLEXC O M PLEX
Fig. 8.1. A modified Q-cycle proposed to account for most of the data presented in this thesis. Electrogenic reactions are indicated by wide arrows (filled arrows for the most rapid photochemical steps; shaded arrows for slower electron transfer steps). Other symbols as in Fig. 1.6. The proposed sites of inhibition are; HQNO at site 1; DBMIB, UHDBT at site 2; antimycin and o-phenanthroline at site 3.
211

by the uptake of 2H . The number of protons translocated per elec
tron arriving at P700 is thus 2:1. The electrogenic step is linked
to the oxidation of the high potential cytochrome b-563, as indicat
ed by the work presented in this thesis. Also shown in Fig. 8.1 are
the various inhibitor sites, as proposed by this study. DBMIB and
UHDBT inhibit the reduction of the Rieske IbS centre; HQNO inhibits
the oxidation of the high potential cytochrome b-563; antimycin and
o-phenanthroline inhibit the oxidation of the low potential cytochrome
b-563.
A similar model to that depicted in Fig. 8.1, has recently been
proposed by Selak and Whitmarsh (1982). A variation of this model
had, however, been put forward earlier by Velthuys (1979). A feature
of the Velthuys model is that the two b-cytochromes are arranged in
parallel within the cytochrome b^/f complex, rather than in series.
The electrogenic step is thus suggested to be linked to the oxidation
of only one of the b-cytochromes, but a clear distinction as to which
one, is not made. Moreover, the recent detection of the different
midpoint redox potentials of the cytochrome b-563 (see section 1.2.1)
is difficult to incorporate into such a model which implicates two
equivalent haems. Crofts e_t al (1983) have, in fact, recently put for
ward a model, based on that proposed by Velthuys (1979), but for the
bacterial electron transport chain. In the Crofts’ model (1983) the
b-cytochromes are now, instead, placed in series. Furthermore»this
model takes into account-more recent experimental data concerning the
role of the ubiquinone pool in the b-cytochrome redox reactions.
The similarity between the models that can be proposed for the
mechanism of electron transport in ch lor op lasts and in bacterial
chromatophores, as well as in mitochondria (see below), derives from

the universality that has been found for their respective quinol-
cytochrome c oxidoreductases (Hauska et ad.,1983). These oxidore-
ductases have recently been purified and have been found to contain
similar redox components and subunit topographical arrangement. Fur
thermore, these isolated complexes all exhibit the phenomenon of ox
idant-induced reduction of cytochrome b and when re incorporated into
lipid vesicles, function as electrogenic proton translocators. The
most suitable models, to date, to explain the reaction mechanism
of the different quinol-cytochrome c oxidoreductases are MitchellTs
Q-cycle and Wikstrom's b-cycle (see section 1.3.2), although the
work presented here, as well as other studies, would favour variants
of the Q-cycle. The similarity in the models depicted in Fig. 8.1
and Fig. 1.10, for the chloroplast and bacterial oxidoreductases,
respectively, emphasize the common function of the oxidoreductases.
In fact, throughout this thesis, it has been possible to draw compari
sons between the chloroplast and bacterial systems.
A universal Q-cycle model has recently been suggested by Slater
(1983). This is the double Q-cycle as proposed by de Vries et ad.
(1983) for the mitochondrial oxidoreductase. One of the main arguments
in favour of the Q-cycle in the mitochondrial system is the detection,
by EPR, of two anionic semiquin ones, Q* , one of which is destabili
zed by antimycin (Ohnishi and Trumpower, 1980; also see section
1.3.1). These signals, however, have not yet been detected in the
chlaroplast or bacterial oxidoreductases. Perhaps the presence of
excessive quinones in these complexes, has made it difficult to detect
the proposed Q* species. A second important argument for the opera
tion of a double Q-cycle in mitochondria is the existence of two
pathways for the reduction of cytochrome b. Again,this particular
feature has not yet been demonstrated in the photosynthetic systems.
However, it should be noted that, the models proposed by Velthuys
(1979) and Crofts et al (1983) are, in fact, along the lines of a
double Q-cycle.
It is thus apparent that further experiroental evidence is requir
ed to determine the ultimate model to describe the mechanism of the
quinol-plastocyanin oxidoreductase in chloroplasts. It would be
nice if the mechanism were that of a double Q-cycle, as suggested by
Slater (1983). In fact the chloroplast (and the bacterial) system
offers the experimental advantage, over the mitochondrial system,
far the study of the single turnover kinetics of the reduction of
electron-carrying centres: electrons can be brought into the system
by the action of a light flash directed at the photochemical reaction
centres. Although a great deal of work has already been carried out
using such flash-induced spectroscopic studies, further work is re
quired in this area, of an even more detailed nature, to understand
fully the delicate mechanistic properties of the electron transport
chain.

REFERENCES
Allen, J.F., Bennett, J., Steinback, K.E. and Arntzen, C.J. (1981) Chloroplast protein phosphorylation couples plastoquinone redox state to distribution of excitation energy between photosystems. Nature 291, 25-29.
Anderson, J.M. (1980) Chlorophyll-protein complexes of higher plant thylakoids: distribution stoichiometry and organization in the photosynthetic unit. FEBS Lett. 117, 327-331.
Anderson, J.M. (1982) The significance of grana stacking in chlorophyll b - containing chloroplasts. Fhotobiochem. Photobiophys. 3, 225-241.
Anderson, J.M. and Andersson, B.(1982) The architecture of photosynthetic membranes: lateral and transverse organizations. TIBS 7,2 88-292.
Anderson, J.M. and Boardman, N.K. (1966) Fracticnation of the photochemical systems of photosynthesis, I. Chlorophyll contents and photochemical activities of particles isolated from spinach chlor oplasts. Biochim. Biophys. Acta 112, 4-03-421.
Andersson, B. (1978) Separation of spinach chloroplast lamellae fragments by phase partition including the isolation of inside-out thylakoids. Thesis, University of Lund, Sweden.
Andersson, B. and Anderson, J.M. (1980) Lateral heterogeneity in the distribution of chlorophyll-protein complexes of the thylakoid membranes of spinach chloroplasts. Biochim. Biophys. Acta 593, 427-44-0.
Andersson, B. and Haehnel, W. (1982) Location of photosystem I and photosystem II reaction centres in different thylakoid regions of stacked chloroplasts. FEBS Lett. 146, 13-17.
Andersson, B., Akerlund, H.-E. and Albertsson, P.-A. (1981) Isolation and studies on inside-out thylakoid vesicles, in: Proc. 5th Int. Congr. Photosynth. (Akoyunoglou, G., ed.), Vol. 3, pp 55-66, Balaban Int. Sci. Serv. , Philadelphia.
Andersson, B. , Anderson, J.M. and Ryrie , I ,J. (1982) Transbilayerorganization of the chlorophyll-proteins of spinach thylakoids. Eur. J. Biochem. 123, 465-472.
Arnon, D.I. (1949) Copper enzymes in isolated chloroplasts .Polypheno- loxidase in Beta vulgaris. Plant Physiol. 24, 1-15.
Arnon, D.I. and Chain, R.K. (1975) Regulation of ferredoxin-catalysed photosynthetic phosphorylations. Proc. Natl. Acad.Sci. USA 72, 4961-4965.
Auslander, W. and Junge, ¥. (1974) The electric generator in the photosynthesis of green plants. II Kinetic correlation between proto- lytic reactions and redox reactions. Biochim. Biophys. Acta 357, 285-298.
Auslander, W. and Junge, W. (1975) Neutral red, a rapid indicatorfor pH-changes in the inner phase of thy la ko ids. FEBS Lett. 59, 310-315.
Baltscheff sky, M. (1974.) The effect of dibromothymoquinone on light induced reactions in chr omatophores from Rhodospirilium rubrum. in: Proc. 3rd Int. Congr. Photosynth., Rehovot, Israel (Avron,M., ed.), Vol. 1, pp 799-806, Elsevier/North Holland, Amsterdam.
Barber, J. (1980) An explanation for the relationship between salt- induced thylakoid stacking and the chlorophyll fluorescence changes associated with changes in spillover of energy from photosystem II to phot osy stem I. FEBS Lett. 118, 1-10.
Barber, J. (1982) Influence of surface charges on thylakoid structure and function. Ann. Rev. Plant Physiol. 33, 261-295.
Barber, J. (1983a) Photosynthetic electron transport in relation to thylakoid membrane composition and organization. Plant, Cell and Environ. 6, 311-322.
Barber, J. (1983b) Membrane conformational changes due to phosphorylation and the control of energy transfer in photosynthesis. Photobiochem. Photobiophys. 5f 181-190.
Bashford, C.L., Prince, R.C., Takamiya, K. and Dutton, P.L, (1979)Electrogenic events in the ubiquinone-cytochrome b/c^ oxidoreduc- tase of Rhodonseudomonas sphaer oides. Biochim. Biophys. Acta 545, 223-235.
Bendall, D.S. (1982) Photosynthetic cytochromes of oxygenic organisms. Biochim. Biophys. Acta 683, 119-151.
Bennett, J. (1977) Phosphorylation of chloroplast membrane polypeptides. Nature 269, 34-4.-34.6.
Berthold, D. A., Babcock, G.T. and Yocum, C.F. (1982) A highly resolved, oxygen-evolving photosystem II preparation from spinach thylakoid membranes. FEBS Lett. 134-, 231-234-.
Binder, R.G. and Selman, B.R. (1980) Quinones as mediators of both artificial and cyclic phosphorylation in spinach chloroplasts.Biochim. Biophys. Acta 590, 212-222.
Boardman, N.K. (1970) Physical separation of the photosynthetic photochemical systems. Ann. Rev. Plant Physiol. 21, 115-14-0.
Bohme , H. (1977) On the role of ferredoxin and f erred ox in-NADP+reductase in cyclic electron transport of spinach chloroplasts.Eur. J. Biochem. 72, 283-289.
Bohme, H. and Cramer, W.A. (1972) The role of cytochrome b^ in cyclic electron transport: evidence for an energy coupling site in the pathway of cytochrome b, oxidation in spinach chlor oplasts.Biochim. Biophys. Acta2 83, 302-315.

21
Bouges-Bocquet, B. (1973) Electron transfer between the two photosystems in spinach chloroplasts. Biochim. Biophys. Acta 314, 250-256.
Bouges-Bocquet, B. (1977) Cytochrome f and plastocyanin kinetics in Chi ore 11a Pyrenoidosa. II Reduction kinetics and eLectric field increase in the 10msec range. Biochim. Biophys. Acta 4-62, 371-379.
Bouges-Bocquet, B. (1980a) Kinetic models for the electron doners of photosystem II of photosynthesis. Biochim. Biophys. Acta 594,85-103.
Bouges-Bocquet, B.(1980b) Detection of a new protein involved in the electrogenic loop of green algae. FEBS Lett. 117, 54-58.
Bouges-Bocquet, B. (1981a) Recovery of the reactants of the slow electrogenic phase in Chlorella cells and organisation of the plasto- quinone pool, in: Proc. 5th Inti. Photosynth. Congr. (. Akqyunoglou,G., ed.), Vol. 2, pp 19-27, Balaban Int. Sci. Serv., Philadelphia.
Bouges-Bocquet, B. (1981b) Factors regulating the slow electrogenic phase in green algae and higher plants. Biochim. Biophys. Acta 635, 327-340.
Bouges-Bocquet, B. and Delos me, R. (1978) Evidence for a new electron donor to P-700 in Chlorella pyrenoidosa. FEBS Lett. 94, 100-104.
Bowes, J.M. and Crofts, A.R. (1981) Effect of 2 ,5-dibromo-3- methyl- 6-isopropyl-p-benzoquinone on the secondary electron acceptor B of photosystem II. Arch. Biochem. Biophys. 209, 682-686.
Braumann, T., Weber, G. and Grimme, L.H. (1982) Carotenoid and chlorophyll composition of light-harvesting and reaction centre proteins of the thylakoid membrane. Photobiochem. Photobiophys. 4, 1-8.
Bulychev, A.A. and Vredenberg, W.J. (1976) The effect of cations and membrane permeability modifying agents on the dark kinetics of the photoelectric response in isolated chloroplasts. Biochim.Biophys. Acta 423, 548-556.
Butler, W.L. (1978) Energy distribution in the photochemical apparatus of photosynthesis. Ann. Rev. Plant Physiol. 29, 345-378.
Case, G.D. and Parson, W.W. (1973) Shifts in bacter iochlor ophyll and carotenoid absorption bands linked to cytochrome c_-555 photooxidation in Chromatium. Biochim. Biophys. Acta 325, 441-453.
Clark, W. M. (i960) "Oxidation-reduction potentials of organic systems". Waverly Press, Baltimore, Maryland.
Cogdell, R.J., Monger, T.G. and Parson,W.W. (1975) Carotenoid triplet states in reaction centres from Rh od opse udomonas sphaeroides and Rhodospirilium rubrum. Biochim. Biophys. Acta 408, 188-189.
Conjeaud, H. , Michel-Villaz, M., Vermeglio, A. and Mathis, P. (1976)Location of field-sensitive carotenoid molecules in the chloroplast membrane. Arguments from low-teraperature studies. FEBS Lett. 71, 138-141.

218
Coombs, J. and Greenwood, A.D. (1976) Compartmentation of the photosynthetic apparatus, in: Topics in Photosynthesis (Barber, J., ed.), Vol. 1, pp 1-51, Elsevier/North Holland, Amsterdam.
Cox, R.P.(l979) Chloroplast cytochrome b-563. Hydrophobic environment and lack of direct reaction with ferredoxin. Biochem. J.184. 39-44.
Cox, R.P. and Andersson, B. (1981) Lateral and transverse organization of cytochromes in the chloroplast thylakoid membrane. Biochem. Biophys. Res. Comm. 103, 1336-1342.
Cramer, W.A. and Butler, W.L. (1967) Light-induced absorbance changes of two cytochrome b components in the electron transport system of spinach chloroplasts. Biochim. Biophys. Acta 143, 332-339.
Crofts, A.R., Prince, R.C., Holmes, N.G. and Crowther, D. (1974) Electrogenic electron transport and the carotenoid change in photosynthetic bacteria, in: Proc. 3rd. Int. Congr. Photosynth., Rehovot, Israel (Avron, M., ed.), Vol. 2, pp 1131-1146, Elsevier/ North Holland, Amsterdam.
Crofts, A.R., Crowther, D., Celis, H., Celis, S.A. and Tierney, G. (1977) Proton pumps in bacterial photosynthesis. Biochem. Soc. Trans. 5, 491-495.
Crofts, A.R., Meinhardt, S.W., Jones, K.R. and Snozzi, M. (1983)The role of the quinone pool in the cyclic electron-transfer chain of Rhodopseudomonas Sphaeroides. A modified Q-cycle mechanism. Bicchim. Biophys. Acta 723, 202-218.
Crowther, D. and Hind, G. (1980) Partial characterization of cyclicelectron transport in intact chloroplasts. Arch. Biochem. Biophys. 204. 568-577.
Crowther, D. and Hind, G. (1982) Stoichiometry of proton release to electron flow during plastoquinol oxidation. ARC Report.
Crowther, D., Mills, J.D. and Hind, G. (1979) Protonmotive cyclicelectron flow around photosystem I in intact chloroplasts. FEBS Lett. 98, 386-390.
Deamer, D.W. and Packer, L. (1969) Light-dependent anion transport in isolated spinach chloroplasts. Bicchim. Biophys. Acta 172,539-545.
de Grooth, B.G. and Amesz, J. (1977a) Electrochromic absorbance changes of photosynthetic pigments in Rhodopseudomonas sphaeroides.I Stimulation by secondary electron transport at low temperature. Biochim. Biophys. Acta 462, 237-246.
de Grooth, B.G. and Amesz, J. (1977b) Electrochromic absorbance changes of photosynthetic pigments in Rhcdopseudomonas sphaeroides .II Analysis of the band shifts of carotenoid and bacteriochlorophyll. Bicchim. Biophys. Acta 462, 247-258.

de Grooth, B.G., van Gorkom, H.J. and Meiburg, R.F. (1980)Electrochromic absorbance changes in spinach chloroplasts induced by an external electrical field. Biochim. Biophys. Acta 589. 299-314-•
Delosme, R., Zickler, A. and Joliot, P. (1978) Turnover kinetics ofphotosystem I measured by the electrochromic effect in Chlore11a. Biochim. Biophys. Acta 504., 165-174-.
de Vries, S., Albracht, S.P.J. , Berden, J.A., Marres, C.A.M. and Slater, E.C. (1983) The effect of pH, ubiquinone depletion and myxcthiazol on the reduction kinetics of the prosthetic groups of ubiquinol: cytochrome c oxidoreductase. Biochim. Biophys. Acta 723, 91-103.
Diner, B.A. and Delosme, R. (1983) Oxidation-reduction properties of the electron acceptors of photosystem II. I. Redox titration of the flash-induced carotenoid bandshift, of C-550 and of the variable fluorescence yield in spinach chloroplasts. Bicchim. Biophys. Acta 722, U3-451.
Dolan, E. and Hind, G. (1974-) Kinetics of the reduction and oxidation of cytochromes b/ -and f in isolated chloroplasts. Biochim. Biophys. Acta 357-, 380- 385.
Dutton, P.L. (1978) Redox, potentiometry: Determination of midpointpotentials of oxidation-re duct ion components of biological electron-transfer systems. Methods in Enzymol. 54, 4-11-4-35.
Dutton, P.L. and Prince, R.C. (1978) Equilibrium and disequilibrium in the ubiquinone-cytochrome b-cu oxidoreductase of Rhodopseudo- monas sphaeroides. FEBS Lett.91, 15-20.
Dutton, P.L., Petty, K.M., Bonner, H.S. and Morse, S.D. (1975)Cytochrome c^ and reaction centre Rhodopseudomonas sphaeroides GA membranes. Extinction coefficients, content, half-reduction potentials, kinetics and electric field alterations. Biochim. Biophys. Acta 387, 536-556.
Ellenson, <T.L. and Sauer, K. (1976) The electrophotoluminescence of chloroplasts. Photochem. Photobiol. 23, 113-123.
Ernrich, H.M.,Junge, W. and Witt, H.T. (1969) Further evidence for an optical response of chloroplast bulk pigments to a light induced electrical field in photosynthesis. Z. Naturfcrsch. 24-B, 114-4--114-6.
Erecinska, M. , Chance, B. , Wilson, D.F. and Dutton, P.L. (1972)Aerobic reduction of cytochrome b-566 in pigeon-heart mitochondria. Proc. Natl. Acad. Sci. USA 69, 50-54.
Farineau, J., Garab, G., Horvath, G. and Fhludi-Daniel, A. (1980)Proton translocation in the slow rise of the flash-induced 515nm absorbance change of intact chloroplasts. FEBS Lett. 118, 119-122.
Ford, R.C. and Barber, J. (1983) Incorporation of sterol into chloroplast thylakoid membranes and its effect on fluidity and function.Planta 158, 35-4-1.

Forti, G., Bert ole , M.L. and Zanetti, G. (1965) Purification and properties of cytochrome f from parsley leaves. Biochim. Biophys. Acta 109, 33-4-0.
Fowler, C.F. and Kok, B. (1976) Determination of H+/e ratios in ch- loroplasts with flashing light. Biochim. Biophys. Acta 4-23, 510- 523.
Gabellini, N. and Hauska, G. (1983) Characterization of cytochrome b in the isolated ubiquinol-cytochrome c,_ oxidoreductase from Rhodopseudomonas sphaeroides GA. FEBS Lett. 153, 14-6-150.
Gabellini, N., Bowyer, J.R. , Hurt, E., Melandri, B.A. and Hauska, G. (1982) A cytochrome b/c^ complex with ubiquinol-cytochrome c^ cxidoreductase activity from Rhodopseudomonas sphaeroides GA.Eur. J. Biochem. 126, 105-111.
Girvin, M. and Cramer, W.A. (1983) Redox titrations of the slow elec- trochromic phase in chloroplasts. in: Proc. 6th Inti. Congr. Photosynth. (Sybesma, C., ed.).
Goldbeck, J.H. and Kok, B. (1979) Redox titrations of electron acceptor Q and the plastoquinone pool in photosystem II. Biochim. Biophy Acta 5£7, 347-360.
Graber, P. and Witt, H.T. (1974.) On the extent of the electrical potential across the thylakoid membrane induced by continuous light in Chlorella cells. Biochim. Biophys. Acta 333, 389-392.
Graber, P. and Witt, H.T. (1976) Relations between the electrical potential, pH gradient, proton flux and phosphorylation in the photosynthetic membrane. Biochim. Biophys. Acta 423, 141-163.
Guerrieri, F. and Nelson, B.D. (1975) Studies on the characteristics of a proton pump in phospholipid vesicles inlayed with purified complex III from beef heart mitochondria. FEBS Lett. 54, 339-342.
Haehnel, W. (1977) Electron transport between plastoquinone and chlorophyll A^ in chlor oplasts. II Reaction kinetics and the function of plastocyanin in situ. Biochim. Biophys. Acta 459. 418-441.
Haehnel, W. (1982) On the functional organization of electron transport from plastoquinone to photosystem I. Biochim. Biophys. Acta 682, 245-257.
Haehnel, W. , Berzborn, R.J. and Andersson, B. (1981) Localization of the reaction side of plastocyanin from immunological and kinetic studies with inside-out thylakoid vesicles. Biochim. Biophys.Acta 637, 389-399.
Hauska, G. , Reimer, S. and Trebst, A. (1974) Native and artificial energy-conserving site in cyclic photophosphorylation systems. Biochim. Biophys. Acta 357, 1-13.

Hauska, G., Hurt, E., Gabellini, N. and Lockau, W. (1983) Comparative aspects of quinol-cytochr ome c./plastocyanin oxidoreductases. Biochim. Biophys. Acta 726, 97-133.
Haworth, P., Kyle, D.J., Horton, P. and Arntzen, C.J. (1982)Chloroplast membrane protein phosphorylation. Photochem. Photobiol 36, 713-718.
Hill, R. and Bendall, F. (i960) Function of the two cytochrome components in chloroplasts: a working hypothesis. Nature 186, 136-137.
Hiyama, T. and Ke, B. (1972) Difference spectra and extinction coefficients of P700. Biochim. Biophys. Acta 267, 160-171.
Holmes, N.G. and Crofts, A.R. (1977) The carotenoid shift in Rhodop-seudomonas sphaeroides: the flash induced change. Biochim. Biophys Acta 159, 192-505.
Hong, Y.Q. and Junge, W. (1983) Localized or delocalized protons inphotophosphorylation? On the accessibility of the thylakoid lumen for ions and buffers. Biochim. Biophys. Acta 722, 197-208.
Horton, P. (1983) Control of chloroplast electron transport by phos- •phorylation of thylakoid proteins. FEBS Lett. 152, 17-52.
Horton, P. and Croze, E. (1979) Characterization of two quenchers of chlorophyll fluorescence with different midpoint oxidation-reduction potentials in chloroplasts. Biochim. Biophys. Acta 515» 188-201.
Horvath, G., Niemi, H.A., Droppa, M. and Thludi-Daniel,A. (1979) Characteristics of the flash-induced 515 nanometer absorbance change of intact isolated chloroplasts. Plant Physiol. 63, 778-782
Huber, S.C. and Edwards, G.E. (1977) The importance of reducing conditions for the inhibitory action of DBMIB+ ,antimycin A and EDAC+ on cyclic photophosphorylation. FEBS Lett. 79, 207-211.
Huber, H.-L., Rumber, B. and Siggel, U. (1980) Contribution of membrane potentials to energy conversion in photosynthetic membranes. Ber. Bunsenges. Phys. Chem. 81, 1050-1055.
Hurt, E. and Hauska.,. • C-. (1981) A cytochrome f/b^ complex of fivepolypeptides with plastoquihol-plastocyanin-oxidoreductase activity from spinach chloroplasts. Eur. J-. Bicchem. 117, 591-599.
Hurt, E. and Hauska, G. (1982) Oxidant-induced reduction of cytochrome br in the isolated cytochrome ^ /f complex from chloroplasts. Pnotobiochem. Photobicphys. 1, 9-15.
Hurt, E.C., Hauska, G. and Shahak, Y. (1982) Electrogenic proton translocation by the chloroplast cytochrome b,/f complex reconstituted into phospholipid vesicles. FEBS Lett. 119, 211-216.
Izawa, S. and Pan, R.L. (1978) Photosystem I electron transport and phosphorylation supported by electron donation to the plastcquinone region. Biochem. Biophys. Res. Comm. 83,1171-1177.
Jackson, J.B. and Crofts, A.R. (1969) The high energy state inchromatophores from Rhodopseudomcnas suhaeroides. FEBS Lett.4, 185-189.
Jackson, J.B. and Crofts, A.R. (1971) The kinetics of light-induced carotenoid changes in Rhodopseudomonas sphaeroides and their relation to electrical field generation across the chromato- phore membrane. Eur. J. Biochem. 18, 12 0-130.
Jackson, J.B. and Dutton,P.L. (1973) The kinetic and redox potentio- metric resolution of the carotenoid shifts in Rhodopseudomonas sphaer oides chr omatophores: their relationship to electric field alterations in electron transport and energy coupling. Biochim. Biophys. Acta 325, 102-113.
Joliot, P. and Delosme, R. (1974.) Flash-induced 519nm absorption change in green algae. Biochim. Biophys. Acta 357 , 2 67-284-.
Junge, W. (1974-) Structural features of the primary charge separation across the functional membrane of photosynthesis in green plants, in: Proc. 3rd. Inti. Congr. Photosynth., Rehovot, Israel (Avron, M., ed.), Vol. 1, pp 273-286, Elsevier/North Holland, Amsterdam.
Junge, W. (1977) Membrane potentials in photosynthesis. Ann. Rev.Plant Physiol. 28, 503-536.
Junge, W. and Aus lander, W. (1973) The electric generator in photosynthesis of green plants. I. Vectorial and protolytic properties of the electron transport chain. Biochim. Biophys. Acta 333, 59-70.
Junge, W. and Witt, H.T. (1968) On the ion transport system of photosynthesis. Investigations on a molecular level. Z . Naturfcrsch. 23B, 2U-254.
Junge, W. , Auslander, W., McGeer, A.J. and Runge, T. (1979) Thebuffering capacity of the internal phase of thylakoids and the magnitude of the pH changes inside under flashing light. Biochim. Biophys. Acta 54-6, 121-14-1.
Jurinsic, P., Govindjee and Wraight, C.A. (1978) Membrane potential and microsecond to millisecond delayed light emission after a single excitation flash in isolated chlor oplasts. Photochem. Photobiol. 27, 61-71.
Hatch, S. , Shiratori, I. and Taiamiya, A. (1962) Purification andsome properties of spinach plastocyanin. J. Biochem. 51, 32-4-0.

Kroger, A. and Klingenberg, M. (1973) Further evidence for the pool function of ubiquinone as derived from the inhibition of the electron transport by antimycin. Eur. J. Biochem, 39, 313-323.
Kuhn, H, (1979) Photoprocesses in monolayer assemblies, in: Light- induced charge separation in Biology and Chemistry (Gerischer, H. and Katz, J .J ., eds.), pp 151-169, Verlag Chemie, Weinheim.
Larkum, A.W.D. and Bonner, W.D. (1972) Light-induced absorbance change of P518 in intact chloroplasts. Biochim. Biophys. Acta 256, 396-4-08.
Leung, K.H. and Hinkle, P.C. (1975) Reconstitution of ion transport and respiratory control in vesicles formed from reduced coenzyme Q-cytochrome c reductase and phospholipids. J. Biol. Chem. 250, 84.67-8471.
Liptay, W. (19 6 9) Electrochromian and Solvatochromism. Angew. Chem.Int. Ed. Eng. 8, 177-188.
Malkin, R. (1978) Oxidation-reduction potential dependence of the flash-induced 518nm absorbance change in chlor oplasts. FEBS Lett. 87, 329-333.
• Malkin, R. and Aparicio, P.J. (1975) Identification of a g = 1.90 high-potent ial iron-sulphur protein in chloroplasts. Biochem. Biophys. Res. Comm. 63, 1157-1160.
Malkin, R. and Barber, J. (1979) On the function of the fluorescence quenchers in chloroplasts and their relation to the primary electron acceptor of photosystem II. Arch. Biochem. Biophys.193, 169-178.
Mangel, M., Berns, D.S. and Ilani, A. (1975) Dependence of photosensitivity of bileaflet lipid membranes upon the chlorophyll and carotenoid content. J. Membrane Biol. 20, 171-180.
Matsuura, K., Ishikawa, T. and Nishimura, M. (1980) Correlation ofmembrane-potential-sensing carotenoid to pigment-protein complex II in Rhodooseudomonas sohaeroides. Biochim. Biophys. Acta 590,339-34-4-.
McCarty, R.E. and Carmeli, C. (1982) Proton translocating ATPases of photosynthetic membranes. in: Photosynthesis (Govindjee, ed.), Vol. 1, pp 64-7-695, Academic Press.
Meinhardt, S.W. and Crofts, A.R. (1982) The site and mechanism of action of myxothiazol as an inhibitor of electron transfer in Rhcdopseudomonas sohaeroides. FEBS Lett. 14-9, 217-222.
Melis, A. and Harvey, G.W. (1981) Regulation of photosystem stoichiometry, chlorophyll a and chlorophyll b content and relation to chloroplast ultra structure . Biochim. Biophys. Acta 637, 138-14-5.

Michels, P. A.M. and Konings, W.N. (1978) The electrochemical proton gradient generated by light in membrane vesicles and chromato- phores from Rhodopseudomonas sphaeroides. Eur.J. Biochem. 85, 14-7-155.
Mills, J.D. , Crcwther, D. , Slovacek, R.E., Hind, G. and McCarty, R.E. (1979) Electron transport pathways in spinach chloroplasts. Reduction of the primary acceptor of photosystem II by reduced nicotinamide adenine dinucleotide phosphate in the dark. Biochim. Biophys. Acta 54-7, 127-137.
Mitchell, P. (1961) Coupling of phosphorylation to electron and hydrogen transfer by a chemi-osmotic type of mechanism. Nature 191,144- -14-8.
Mitchell, P. (1976) Possible molecular mechanisms of the protonmotive function of cytochrome systems. J. The or. Biol. 62, 327-367.
Mullet, J.E. and Arntzen, C.J. (1981) Identification of a 32-34- kilo- dalton polypeptide as a herbicide receptor protein in photosystem II. Biochim. Biophys. Acta 635, -236-24-8.
Mullet, J.E., Burke, J.J. and Arntzen, C.J. (1980) Chlorophyll proteins of photosystem I. Plant Physiol. 65, 814--822.
Nakatani, H.Y. and Barber, J. (1977) An improved method for isolating chloroplasts retaining their outer membranes. Biochim. Biophys. Acta £61, 510-512.
Oettmeier, W., Masson, K., Soil, H.J. and Johanningmeier (1982) Photoaffinity labelling of plastoquinone binding sites, in: 2nd Eur. Bioenerg. Conf., EBEC Reports, Vol. 2, pp 219-220, L.B.T.M.-C.N.R.S. Villeurbanne.
Ohnishi, T. and Trumpower, B.L. (1980) Differential effects of antimy- cin on ubisemiquinone bound in different environments in isolated succinate-cytochrome c reductase complex. J. Biol. Chem. 255, 3278-3284-.
O'Keefe, D.P. and Dutton, P.L. (1981) Cytochrome b oxidation and reduction reactions in the ubiquinone-cytochrome b/c^ oxidoreductase from Rhodopseudomonas sphaeroides. Biochim. Biophys. Acta 635, 14-9- 166.
O'Keefe, D.P., Prince, R.C. and Dutton, P.L. (1981) The interaction of the reaction centre secondary quin one with the ubiquinone-cytochrome c^ oxidoreductase in Rhodopseudomonas sphaeroides chroma- tophores. Biochim. Biophys. Acta 637, 512-522.
Olsen, L.F. and Barber, J. (1981) Origin of the slow component of the electrochromic shift: A charge delocalisation model. FEBS Lett.123, 90-94.

Olsen, L. F. and Cox, R.P. (1979) Light-induced proton transport by chloroplastssuspended in fluid media at sub-zero temperatures: kinetics and stoichiometry. Eur. J. Biochem. 95, 4-27-4-32.
Olsen, L.F., Telfer, A. and Barber, J. (1980) A flash spectroscopic study of the kinetics of the electrochromic shift, proton release and the redox behaviour of cytochromes f and b-563 during cyclic electron flow. FEBS Lett. 118, 11-17.
Packham, N.K. , Berriman, J.A. and Jackson, J.B. (1978) The charging capacitance of the chromatophore membrane. FEBS Lett. 89, 2 05- 210.
Packham, N.K., Packham, C., Mueller, P., Tiede, D. and Dutton, P.L.(1980) Reconstitution of photochemically active reaction centres in planar phospholipid membranes. Light-induced electrical currents under voltage-clamped conditions. FEBS Lett. 110, 101-106.
Papa, S. , Lorusso, M. and Guerrieri, F. (1975) Mechanism of respiration-driven proton translocation in the inner mitochondrial membrane. Analysis of proton translocation associated with oxidation of endogenous ubiquinol. Biochira. Biophys. Acta 387, 4-25-4-4-0.
Parson, W.W. and Ke, B. (1982) Primary photochemical reactions, in: Photosynthesis (Govindjee, ed.), Vol. 1, pp 331-385, Academic Press.
Petty, K.M. and Dutton, P.L. (1976a) Properties of the flash-induced proton binding encountered in membranes of Rhodopseudomonas sph- aeroides: a functional- pK on the ubisemiquinone? Arch. Biochem. Biophys. 172, 335-34-5.
Petty, K.M. and Dutton, P.L. (1976b) Ubiquinone-cytochrome b electron and proton transfer: A functional pK on cytochrome b^Q in Rhodopseudomonas sphaeroides membranes. Arch. Biochem. Biophys. 172, 34-6-353.
Petty, K.M., Jackson, J.B. and Dutton, P.L. (1977) Kinetics and stoichiometry of proton binding in Rhodopseudomonas sphaer oides chromatophore s. FEBS Lett. 84, 229-303.
Petty, K., Jackson, J.B. and Dutton, P.L. (1979) Factors controlling the binding of two protons per electron transferred through the ubiquinone and cytochrome h/c^ segment of Rhodopseudomonas sphaer- oides chromatophores. Biochim. Biophys. Acta 54-6, 17-4-2.
Prince, R.C. and Dutton, P.L. (1975) A kinetic completion of the cyclic photosynthetic electron pathway of Rhodopseudomonas sphaeroides: cytochrome b_-cytochr ome c oxidation-reduct ion. Biochim. Biophys. Acta 387, 609-613. d
Prince, R.C. and Dutton, P.L. (1977) Single and multiple turnover reactions in the ubiquinone-cytochrome b-c„ oxidoreductase of Rhodopseudomonas sphaer oides. The physical chemistry of the major electr donor to cytochrome c^ and its coupled reactions. Biochim. Biophys Acta 462, 731-74-7. *

Frince, R.C., Baccar ini-Melandri, A., Hauska, G.A., Melandri, B.A. and Crofts, A.R. (1975) Asymmetry of an energy transducing membrane. The location of cytochrome c^ in Rhodopseudomonas sphaeroides and Rh odopseud omonas capsulata. Biochim. Biophys.Acta 387, 212-227.
Prince, R.C., Linkletter, S.J.G. and Dutton, P.L. (1981) The thermodynamic properties of some commonly used oxidation-re duct ion mediators, inhibitors, and dyes, as determined by polarography. Biochim. Biophys. Acta 635, 132-148.
Radmer, R. and Cheniae, G. (1977) Mechanisms of oxygen evolution, in: Topics in Photosynthesis (Barber, J., ed.), Vol. 2, pp 303-34-8, Elsevier/North Holland, Amsterdam.
Reich, R. and Sewe, K.-U. (1977) The effect of molecular polarization on the electrochromism of carotenoids. I. The influence of a carboxylic group. Photochem. Fhotobiol. 26, 11-17.
Rich, P.R. (1981) A generalized model for the equilibration of quinone pools with their biological donors and acceptors in membrane -bound electron transfer chains. FEBS Lett. 130, 173-178.
Rich, P.R. and Bendall, D.S. (197 9) A mechanism for the reduction of cytochromes by quinols in solution and its relevance to biological electron transfer reactions. FEBS Lett. 105,189-194.
Rich, P.R. and Bendall, D.S. (1980a) The redox potentials of the b-type cytochromes of higher plant chloroplasts. Biochim. Biophys. Acta 591, 153-161.
Rich, P.R. and Bendall, D.S. (1980b) The kinetics and thermodynamics of the reduction of cytochrome c by substituted p-benzoquinols in solution. Biochim. Biophys. Acta 592, 506-518.
Roberts, H., Choo, W.M., Smith, S.C., Marzuki, S., Linnane, A.W., Porter, T.H. and Folkers, K. (1979) The site of inhibition of mitochondrial electron transfer by coenzyme Q analogues. Arch. Biochem. Biophys. 191, 306-315.
Robinson, H.H. and Yocum, G.F. (1980) Cyclic photophosphorylation reactions catalyzed by ferredaxin, methyl viologen and anthraquinone sulphonate. Biochim. Biophys. Acta 590, 97-106.
Rumberg, B. (1977) Field changes, in: Encyclopedia of Plant Physiology, New Series, Vol. 5, Photosynthesis I (Trebst, A. and Avron, M., eds.), pp 4-05-415, Springer-Verlag,Berlin.
Saphon, S. , Jackson, J.B. and Witt, H.T. (1975) Electrical potential changes,H+ translocation and phosphorylation induced by short flash excitation in Rhodopseudomonas sphaeroides chromatophores. Biochim. Biophys. Acta 408,67-82.

Satch, K. (1974.) Action of derivatives of 1,10-phenanthroline on electron transport in chloroplasts. Biochim. Biophys. Acta 333. 127-135.
Satoh, K. (1981) Further characterization of the photosystem II chlorophyll a-protein complex purified from digitonin extracts of spinach chloroplasts-polypeptide composition, in:Proc. 5th Int. Congr. Photosynth. (Akcyunoglou, G., ed.),Vol. 3, pp 55-66, Balaban Int. Sci. Serv., Philadelphia.
Schapendonk, A.H.C.M. and Vredenberg, W.J. (1977) Salt-induced absorbance changes of P515 in broken chloroplasts. Biochim. Biophys. Acta 4-62, 613-621.
Schapendonk, A.H.C.M. and Vredenberg, W.J. (1979) Activation of the reaction II component of P515 in chloroplasts by pigment system I. FEBS Lett. 106, 257-261.
Schapendonk, A.H.C.M., Vredenberg, W.J. and Tonk, W.J.M. (1979) Studies on the kinetics of the 515nm absorbance changes in chloroplasts. Evidence for the induction of a fast and a slow P515 response upon saturating light flashes. FEBS Lett. 100, 325-330.
Schliephake , W. , Junge , W. and Witt, H.T. (1968) Correlation between field formation, proton translocation and the light reactions in photosynthesis. Z. Naturforsch. 23B, 1571-1578.
Schlodder, E. and Witt, H.T. (1980) Electrochromic absorptionchanges of a chloroplast suspension induced by an external electric field. FEBS Lett. 112, 105-113.
Schmidt, S., Reich, R. and Witt, H.T. (1971a) Electrochromism ofchlorophylls and carotenoids in multilayers and 'in chlaroplasts. Naturwissen. f[8, 4-14--4-15.
Schmidt, S. , Reich, R. and Witt, H.T. (1971b) Electr ochromic measurements in vitro as a test for the interpretation of field indicating absorption changes in photosynthesis, in: Froc. 2nd. Int. Congr. Photosynth., Stresa, Italy (Forti, G., Avron, M. and Melandri, A., eds.), Vol. 2, pp 1087-1095, Junk, W. , The Hague.
Schroder, H. , Muhle , H. and Rumberg, B. (1971) Relationship between ion transport phenomena and phosphorylation in chloroplasts. in: Proc. 2nd. Int. Congr. Photosynth., Stresa, Italy (Forti, G., Avron, M. and Melandri, A., eds.), Vol. 2, pp 919-930, Junk.W., The Hague.
Seely, G.R. (1973) Energy transfer in a model of the photosynthetic unit of green plants. J. The or. Biol. 4^, 189-199.
Selak, M.A. and Whitmarsh, J. (1982) Kinetics of the electrogenic step and cytochrome ^ and f redox changes in chloroplasts. Evidence for a Q-cycle. FEBS Lett. 150, 286-292.
Sewe, K.-U. and Reich, R. (1977) The effect of molecular polarization on the electrochromism of carotenoids. II Lutein-chlorophyll complexes: the origin of the fie Id-indicating absorption change at 520nm in the membranes of photosynthesis. Z. Naturforsch. 32C, 161-171.

228Shahak, Y., Crowther, D. and Hind, G. (1980) Endogenous cyclic electron transport in broken chloroplasts. FEBS Lett. 114,73-78.
Shahak, Y., Crowther, D. and Hind, G. (1981) The involvement of ferre- doxin-NADP + reductase in cyclic electron transport in chloroplasts. Biochim. Biophys. Acta 636, 234-243.
Slater, E.C. (1983) The Q cycle, an ubiquitous mechanism of electron transfer. TIBS 8, 239-242.
Slovacek, R.E. and Hind, G. (1978) Hash spectroscopic studies of cyclic electron flow in intact chloroplasts. Biochem. Biophys.Res. Comm. 84, 901-906.
Slovacek, R.E., Crowther, D. and Hind, G. (1979) Cytochrome function in the cyclic electron transport pathway of chloroplasts. Biochim. Biophys. Acta 547, 138-14.8,
Stiehl, H.H. and Witt, H.T. (1969) Quantitative treatment of the function of plastoquinone in photosynthesis. Z. Naturforsch. 24B, 1588-1598.
Strichartz, G.R. and Chance, B. (1972) Absorbance changes at 520nm caused by salt addition to chloroplast suspensions in the dark. Biochim. Biophys. Acta 256, 71-84.
Stuart, A.L. and Wasserman, A.R. (1973) Purification of cytochrome b^. A tightly bound protein in chloroplast membranes. Biochim. Biophys. Acta 314» 284-297.
Surkov, S.A. and Konstantinov, A. (1980) Dibromothymoquinone interaction with the CoQ-cytochrome b locus of the mitochondrial respiratory chain. Further evidence for the Q-cycle . FEBS Lett. 109, 283-288.
Symons, M., Swysen, C. and Sybesma, C. (1977) The light-induced carotenoid absorbance changes in Rhodopse udomonas sphaeroides. An analysis and interpretation of the band shifts. Biochim. Biophys. Acta 462 , 706-717.
Takamiya, K. and Dutton, P.L. (1977) The influence of transmembrane potentials of the redox equilibrium between cytochrome c^ and the reaction centre in Rh od opse ud omonas sphaeroides chromato- phores. FEBS Lett. 80, 279-284.
Thornber, J. (1975) Chlorophyll-proteins: light-harvesting and reaction centre components of plants. Ann. Rev. Plant Physiol. 26, 127- 158.
Thornber, J.P. and Barber, J. (1979) Photosynthetic pigments and models for their organization in vivo, in: Topics in Photosynthesis (Barber, J., ed.), Vol.3, pp 27-70, Elsevier/North Holland, Amsterdam.
Thorne, S.W., Horvath, G., Kahn, A. and Boardman, N.K. (1975) Light- dependent absorption and selective scattering changes at 518nmin chloroplast thylakoid membranes. Proc. Natl. Acad. Sci. USA 72, 3858-3862.

Trebst, A. Earth, E. and Draber, W. (1970) On a new inhibitor of photosynthetic electron-transport in isolated chloroplasts.Z. Naturforsch.25B, 1157-1159.
Trebst, A., Wietoska, H., Draber, W. and Knops, H.J. (1978) The inhibition of photosynthetic electron flow in chloroplasts by the dinitrophenylether of bromo- or iodo-nitr othymol. Z. Natur- forsch. 330, 919-927.
Trebst, A., Reimer, S., Draber, W. and Knops, H.J, (1979) The effect of analogues of dibroraothymoquinone and of bromonitrothymol on photosynthetic electron flow. Z. Naturforsch. 340, 831-84-0.
Tributsch, H. (1972) Reaction of the excited chlorophyll molecules at electrodes and in photosynthesis. Fhotochem. Photobiol.16, 261-269.
Trumpower, B.L. (1981) Function of the iron-sulphur protein of thecytochrome b-c- segment in electron-transfer and energy-conser- ving reactions of the mitochondrial respiratory chain. Biochim. Biophys. Acta 639, 129-155.
van den Berg, W.H., Prince, R.C., Bashford, C.L. ,Takamiya, K., Bonner, W.D. and Dutton, P.L. (1979) Electron and proton transport in the ubiquinone cytochrome b-Cp oxidoreductase of Rhodopseu- domonas sphaeroides. Patterns or binding and inhibition by anti- mycin. J. Biol. Chem. 254-, 8594--8604-.
Velthuys, B.R. (1978) A third site of proton translocation in green plant photosynthetic electron transport. Proc. Natl. Acad.Sci. USA 75, 6031-6034-.
Velthuys, B.R. (1979) Electron flow through plastoquinone and cytochromes b, and f in chloroplasts. Proc. Natl. Acad. Sci. USA 76, 2765^2769.
Velthuys, B.R. (1980) Electron and proton transfer events in chloroplasts during a short series of flashes. FEES Lett.115, 167-170.
Velthuys, B.R. (1981) Electr on-dependent competition between plastoquinone and inhibitors for binding to photosystem II. FEBS Lett. 126, 277-281.
Velthuys, B.R. and Amesz, J. (1974-) Charge accumulation at the reducing side of system 2 of photosynthesis. Biochim. Biophys. Acta 333, 85-94.
von Jagcw, G. and Ehgel, W.D. (1980) A model for the cytochrome b dimer of the ubiquinoi : cytochrome c oxidoreductase as a proton trans- locator. FEBS Lett. Ill , 1-5.
von Jagow, G. and Engel, W.D. (1981) Complete inhibition of electron transfer from ubiquinoi to cytochrome b by the combined action of antinycin and myxothiazol. FEBS Lett. 136, 19-24.
Vredenberg, W.J. and Tonk, W.J.M. (1974.) On the coupling of electrical events at the membranes of energized chlaroplasts in intact plant leaf cells.FEBS Lett. 42 , 2 36-24-0.
Webster, G.D., Cogdell, R.J. and Lindsay, J.G. (1980) Identification of the carotenoid present in the B-800-850 antenna complex from Rhodopseudomonas cansulata as that which responds electrochro- mically to transmembrane electric fields. Biochim. Biophys. Acta 591, 321-330.
Wikstrom, M.K.F. and Berden, J.A. (1972) Oxidoreduction of cytochrome b in the presence of antimycin. Biochim. Biophys. Acta 283, 4.03-420.
Wikstrom, M. and Krab, K. (1980) Respiration-linked H+ translocationin mitochondria: stoichiometry and mechanism. Curr. Top. Bioenerg. 10, 51-101.
Wikstrom, M., Krab, K. and Saraste, M. (1981) Proton-translocating cytochrome complexes. Ann. Rev. Biochem. 50, 623-655.
Witt, H.T. (1971) Coupling of quanta*electrons, fields, ions and phosphorylation in the functional membrane of photosynthesis. Results by pulse spectroscopic methods. Q. Rev. Biophys. 4, 365-477.
Witt, H.T. (1975) Primary acts of energy conservation in the functional membrane of photosynthesis, in: Bioenergetics of Photosynthesis (Govindjee, ed.), pp 493-554, Academic Press.
Witt, H.T. (1979) Energy conversion in the functional membrane of photosynthesis. Analysis by light pulse and electric pulse methods. The central role of the electric field. Biochim. Biophys. Acta 505, 355-427.
Witt, H.T. and Zickler, A. (1974) Vectorial electron flow across thethylakoid membrane. Further evidence by kinetic measurements with an electrochromic and electrical method. FEBS Lett. 39, 205-208.
Witt, H.T., Schlodder, E. and Graber, P.(1976) Membrane-bound ATP synthesis generated by an external electric field. FEBS Lett.69, 272-276.
Wolff, C. and Witt, H.T. (1969) On metastable states of carotenoids in primary events of photosynthesis. Registration by repetitive ultra-short-flash photometry. Z. Naturforsch. 24B, 1031-1037.
Wolff, C., Buchwald, H.-E., Ruppel, H., Witt, K. and Witt, H.T.(1969) Rise time of the light induced electrical field across the functional membrane of oh otosyn the s is . Z. Naturforsch. 24B, 1038- 1041.
Wollman, F.-A. and Bennoun, P. (1982) A new chlorophy11-protein complex related to photosystem I in Chlamydomonas reinhardii. Biochim. Biophys. Acta 680, 352-360.

Yamazaki, I. and Ohnishi, T. (1966) One-electron-transfer reactions in biochemical systems. I. Kinetic analysis of the oxidation- reduction equilibrium between quinol-quinone and ferro-ferricy- tochrome c. Biochim. Biophys. Acta 112, 4-69-4-81.
Yu, C.-A. and Yu, L. (1981) Ubiquinone-binding proteins. Biochim. Biophys. Acta 639, 99-128.
Zannoni, D., Prince, R.C., Dutton, P.L. and Marrs, B.L. (1980)Isolation and characterization of a cytochrome c - deficient mutant of Rhodorseudomonas cansulata. FEBS Lett. 113, 289-293.
Zickler, A., Witt, H.T. and Bcheim, G. (1976) Estimation of the light- induced electrical potential at the functional membrane of photosynthesis using a voltage-dependent ionophare. FEBS Lett. 66, 112- 14.8.
Zimanyi, L. and Garab, G. (1982) Configuration of the light induced electric field in thylaieoids and its possible role in the kinetics of the 515nm absorbance change. J. Theor. Biol. 95, 811-821.