the 2015 app marketing guide by localytics
TRANSCRIPT

THE 2015 APP MARKETING GUIDE The Data Trends & Takeaways You Need to Consider in 2015
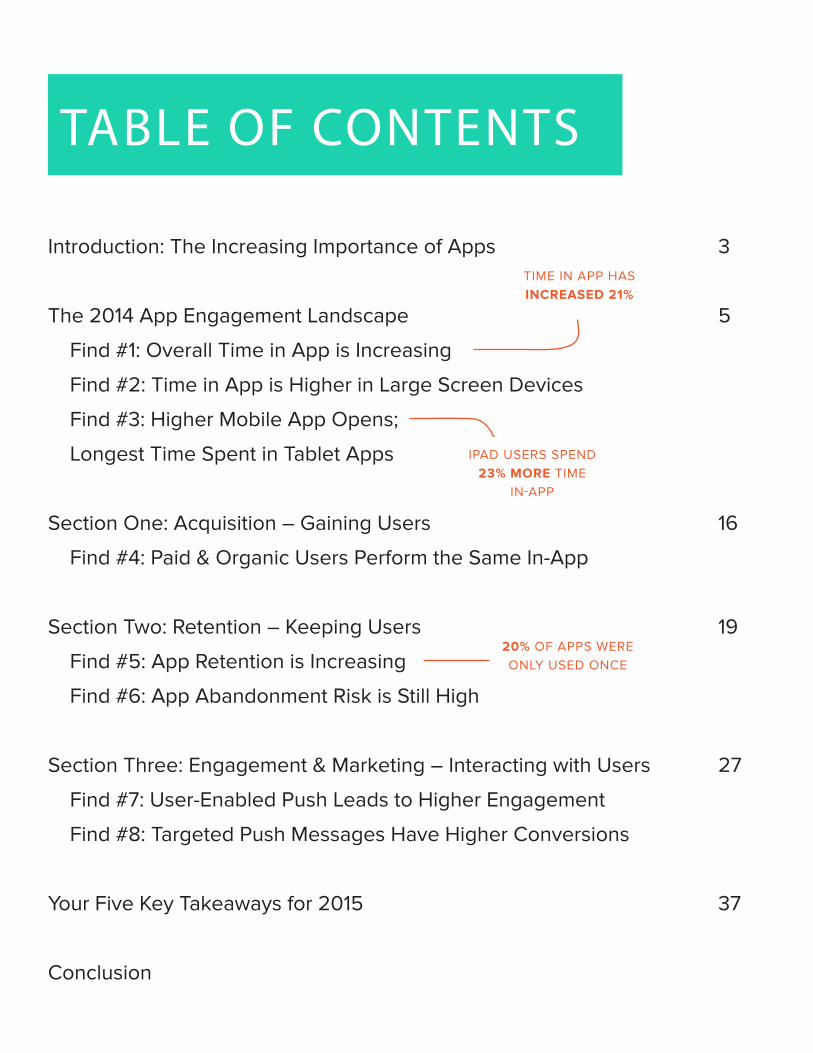
TABLE OF CONTENTS
Introduction: The Increasing Importance of Apps 3
The 2014 App Engagement Landscape 5
Find #1: Overall Time in App is Increasing
Find #2: Time in App is Higher in Large Screen Devices
Find #3: Higher Mobile App Opens;
Longest Time Spent in Tablet Apps
Section One: Acquisition – Gaining Users 16
Find #4: Paid & Organic Users Perform the Same In-App
Section Two: Retention – Keeping Users 19
Find #5: App Retention is Increasing
Find #6: App Abandonment Risk is Still High
Section Three: Engagement & Marketing – Interacting with Users 27
Find #7: User-Enabled Push Leads to Higher Engagement
Find #8: Targeted Push Messages Have Higher Conversions
Your Five Key Takeaways for 2015 37
Conclusion
TIME IN APP HAS INCREASED 21%
20% OF APPS WERE ONLY USED ONCE
IPAD USERS SPEND 23% MORE TIME
IN-APP
THE INCREASING IMPORTANCEOF APPS

There’s no denying it: mobile apps have become the primary way we consume information.
Time spent in mobile apps now far outweighs time spent on the mobile web, which means consumers have found a new way to interact with your business; while on the go, and even when they have access to other mediums like the web and television. It’s clear that if you want to engage users long-term, mobile has to be an leading part of your strategy.
Yet many mobile apps still falter, as competition grows (the number of apps in the Apple App Store passed 1.2 million this year) and app users’ attention span shrinks. Encouraging app engagement beyond the first few days can be difficult, and traditional web tactics don’t apply.
So what does the state of the mobile app industry show us? What does success look like, and how can brands win over mobile consumers? What do you need to do to prepare your app for an optimal and profitable 2015?
This report dives into 2014 mobile data in an effort to:
* Flesh out key themes and major changes in app usage and trends* Help frame your 2015 mobile strategy * Provide five actionable takeaways for planning a successful year

THE2014 APP ENGAGEMENT LANDSCAPE

Historically, the metric most marketers have used to judge the popularity of an app is the number of downloads from the App Store or Google Play Store.
We’re here to tell you: tracking downloads is an outdated and inaccurate way to measure success.
The real insight lies in user retention and interactions, and answering this question: does your app engage users on their terms after the download?
2014 was a banner year for app engagement. Time in app improved across the board, and we discovered that larger screen sizes offer additional opportunities for increased engagement. The data shows that app usage is growing and the potential for more greater interactions is there. 2014 has proven that the the defition of success for apps lies in their ability to create an engaging, dynamic experience that prioritizes ongoing value.
FIND #
1

FIND #
1
Overall Time in App is Increasing
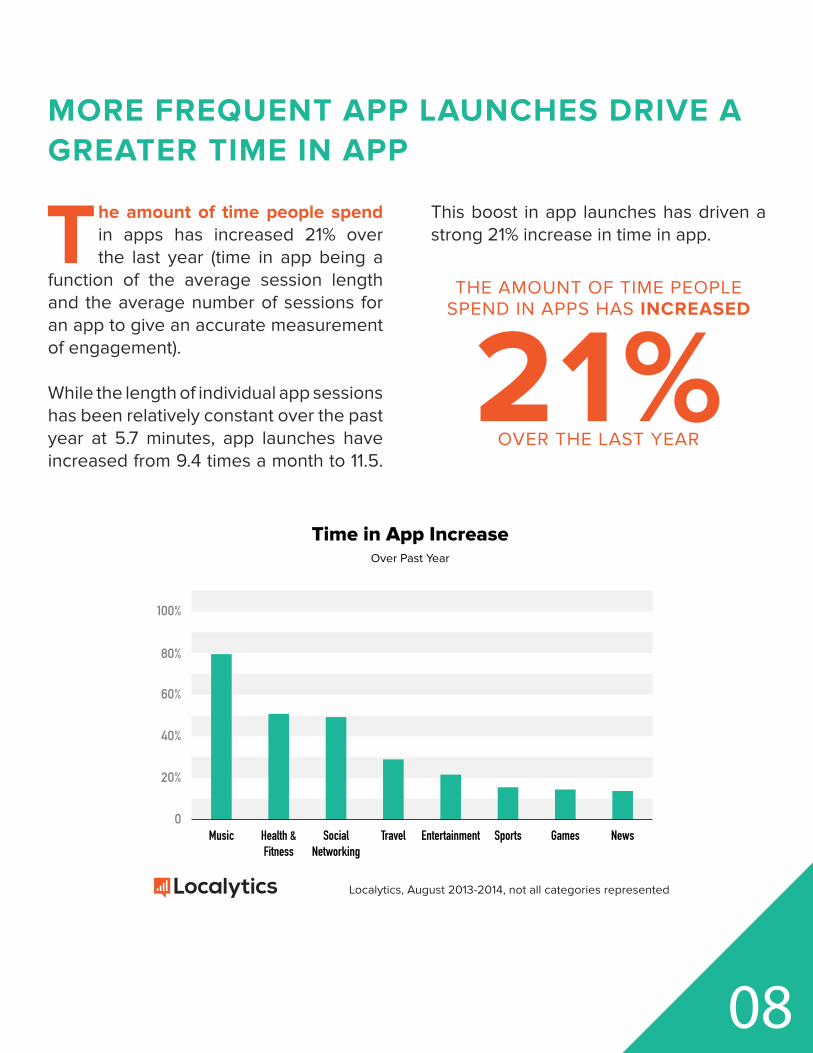
MORE FREQUENT APP LAUNCHES DRIVE A GREATER TIME IN APP
The amount of time people spend in apps has increased 21% over the last year (time in app being a
function of the average session length and the average number of sessions for an app to give an accurate measurement of engagement).
While the length of individual app sessions has been relatively constant over the past year at 5.7 minutes, app launches have increased from 9.4 times a month to 11.5.
This boost in app launches has driven a strong 21% increase in time in app.
08
THE AMOUNT OF TIME PEOPLE SPEND IN APPS HAS INCREASED
21%OVER THE LAST YEAR
Music Health &Fitness
TravelSocialNetworking
Entertainment Games NewsSports0
20%
40%
60%
80%
100%
Time in App IncreaseOver Past Year
Localytics, August 2013-2014, not all categories represented

People are spending more time than ever with their apps, but certain app categories show a
greater increase than others.
Music apps were the big winner with a 79% increase in time spent with these apps, resulting in an increase of 64 minutes per month compared to last year. As more people shift from iTunes to music apps such as SoundCloud and iHeartRadio, the time spent in music apps has drastically increased.
These apps offer greater flexibility around music genres, playlists, and radio features. Most Music apps also incorporate a social component, allowing people to share
their favorite playlists. These reasons could explain why Music has seen such a strong time in app increase over the past year.
Health and Fitness has shown the second highest increase in time in app at 51%, for an average 22 more minutes per month spent with these apps than last year.
As the hardware specs for smartphones increase, so too does their potential to act as a health device. The recently announced iPhone 6 and iPhone 6+ comes with a new Health app that continuously measures motion data (which Apple claims is especially useful for people who climb stairs).
Similar features came with the Samsung Galaxy S5 released in May, including an integrated heart rate monitor and a fitness tracker. Health features are now coming standard on many smartphones, as hardware becomes more advanced and consumers demonstrate an interest in fitness tracking.
MUSIC APPS SHOW GREATEST IMPROVEMENT
09
MUSIC APPS SAW A
79%INCREASE IN TIME IN APP
OVER THE LAST YEAR
Health &Fitness
Music EntertainmentTravelSocialNetworking
Sports NewsGames0
5
10
15
20
25
Localytics, August 2014, not all categories represented
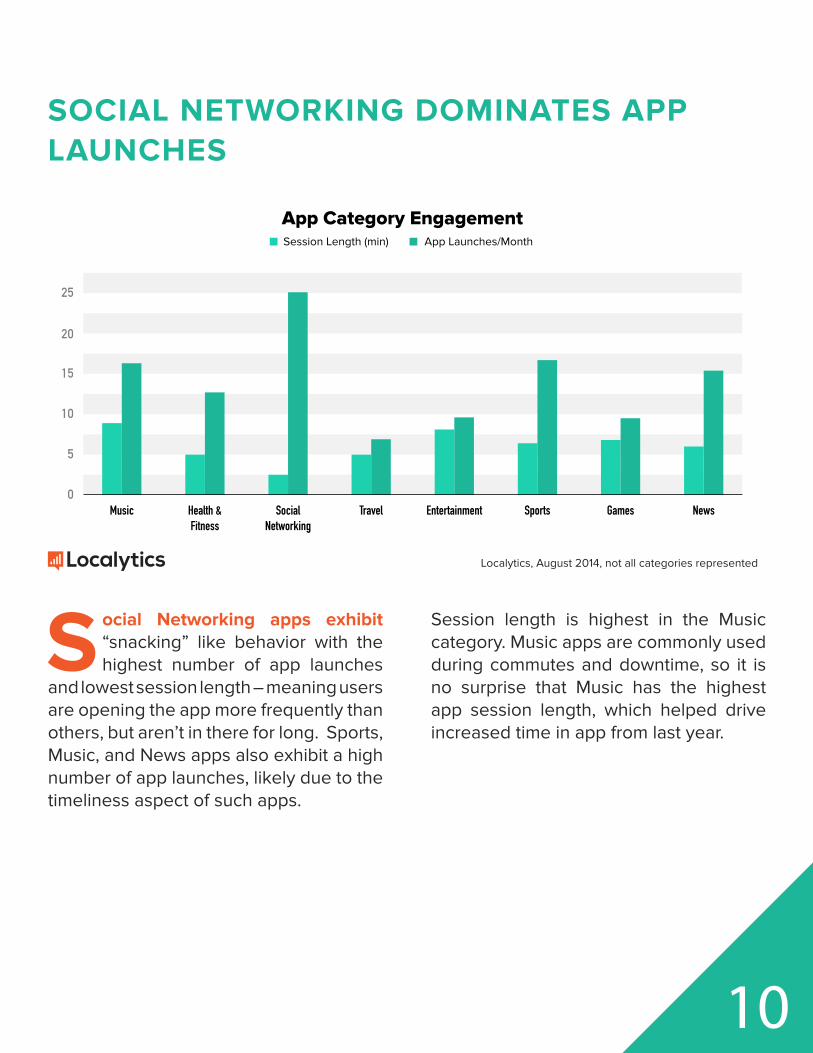
App Category EngagementSession Length (min) App Launches/Month
Social Networking apps exhibit “snacking” like behavior with the highest number of app launches
and lowest session length – meaning users are opening the app more frequently than others, but aren’t in there for long. Sports, Music, and News apps also exhibit a high number of app launches, likely due to the timeliness aspect of such apps.
Session length is highest in the Music category. Music apps are commonly used during commutes and downtime, so it is no surprise that Music has the highest app session length, which helped drive increased time in app from last year.
SOCIAL NETWORKING DOMINATES APP LAUNCHES
10
FIND #
2
Time in App is Higher in Large
Screen Devices
FIND #
2

Music NewsBooksPhotography EntertainmentGames Health &Fitness
Sports SocialNetworking
0
25%
50%
75%
100%
125%
Time in App IncreasePhones with at Least 5” Screen
Localytics, October 2014, not all categories represented
Of the verticals we examined, in 2014 there was an average 68% increase in time in app on phones
with at least a 5-inch screen. In some cases, the increase is as high as 142%.
Gaming apps demonstrate one of the largest increases in time in app based on device screen size. Most Gaming apps require quick finger movements, which are easier to do on a large screen.
For most of the other categories examined, such as Photography, Sports, News, and Books, an inclination towards large screen devices for video streaming or reading is understandable. Music however, is much more surprising. This
may be because more music apps are involving a social networking component for sharing playlists, commenting and liking.
12
IN 2014 THERE WAS AN AVERAGE
68%INCREASE IN TIME IN APP ON PHONES WITH AT LEAST A 5-INCH SCREEN. IN
SOME CASES, AS HIGH AS
142% FIND #
3

FIND #
3
Higher Mobile App Opens;
Longer Time Spent in Tablet Apps

iPad iPhone0
3
6
9
12
15
App EngagementSession Length (min) App Launches/Month
Localytics, October 2014
Mobile consumers use their tablets and smartphones in fundamentally different ways.
For most, their smartphone is always on them, whereas their tablet usually stays at home.
By having access to smartphones throughout the day, this naturally lends itself to more app launches. In 2014, iPhone apps were launched an average 36% more times than iPads.
However, iPhone sessions are typically shorter since people are generally on the go when using their smartphone or use mobile apps in small “bites.”
The average session length for an iPhone is 5.2 minutes, which is over a minute shorter than their iPad counterparts at 6.4
minutes (a difference of 23%).
While a smartphone may be used for quick news or sports updates, people typically use their iPads for longer activities, such as reading or watching content. Essentially, the larger the screen size, the more likely users are to spend more time in apps.
IPAD APPS HAVE A
23%HIGHER AVERAGE SESSION LENGTH
THAN IPHONE APPS
14
So, when we look back on 2014, this will ring true: app engagement is on the rise, and users are looking for more mobile interactions.
But how does that effect retention rates? And how do you acquire the users you know will be most engaged? Plus, just what kind of marketing should you run to improve engagement and keep users coming back again and again?
In the next few sections, we dig into the data details by examining 2014 trends in user acquisition, retention and marketing tactics, to determine exactly how you can prep for a phenomenal 2015.

SECTION ONE: ACQUISITION – GAINING USERS
FIND #
4

FIND #
4
Paid & Organic Users Perform the
Same Once In-App

11+1 3 4 62 5 7 98 100
20%
40%
60%
80%
100%
Localytics, 2014
Mobile App EngagementBy Acquisition Source for Total Number of Times an App Was Used the First 60 Days
*Users not attributed to any specfic acquisition source
Ad Acquired Organic*
Users will discover your app ina variety of different ways – the most well known being through
organic search in the App Store, a tactic that has been addressed with the advent of App Store Optimization.
But in 2014, savvy marketers turned to targeted ads to drum up awareness and drive new users to their apps.
And it worked: once in-app, ad acquired users equaled organic users in terms of engagement. Specifically, by returning to the app multiple times within the first 60 days of their first app open.
Users who discover an app via an ad network are more likely to come back for a 2nd, 3rd and 4th session than organic users.
This more frequent early life cycle usage is likely due to the quality of the ad – if the creative can convince the user of the benefit of the app, they are more likely to give it a couple chances.
It’s natural to assume that organic users are going to become your power users, but what this year has shown us is that paid-to-acquire users have just as much potential.
18
USERS WHO DISCOVER AN APP VIA AN AD NETWORK ARE MORE
LIKELY TO COME BACK FOR A
2ND, 3RD AND 4TH
SESSION THAN ORGANIC USERS

SECTION T WO: RETENTION – KEEPING USERS
FIND #
5
App Retention is Increasing
11+1 3 4 62 5 7 98 100
10%
20%
30%
40%
50%
Localytics, June 2014
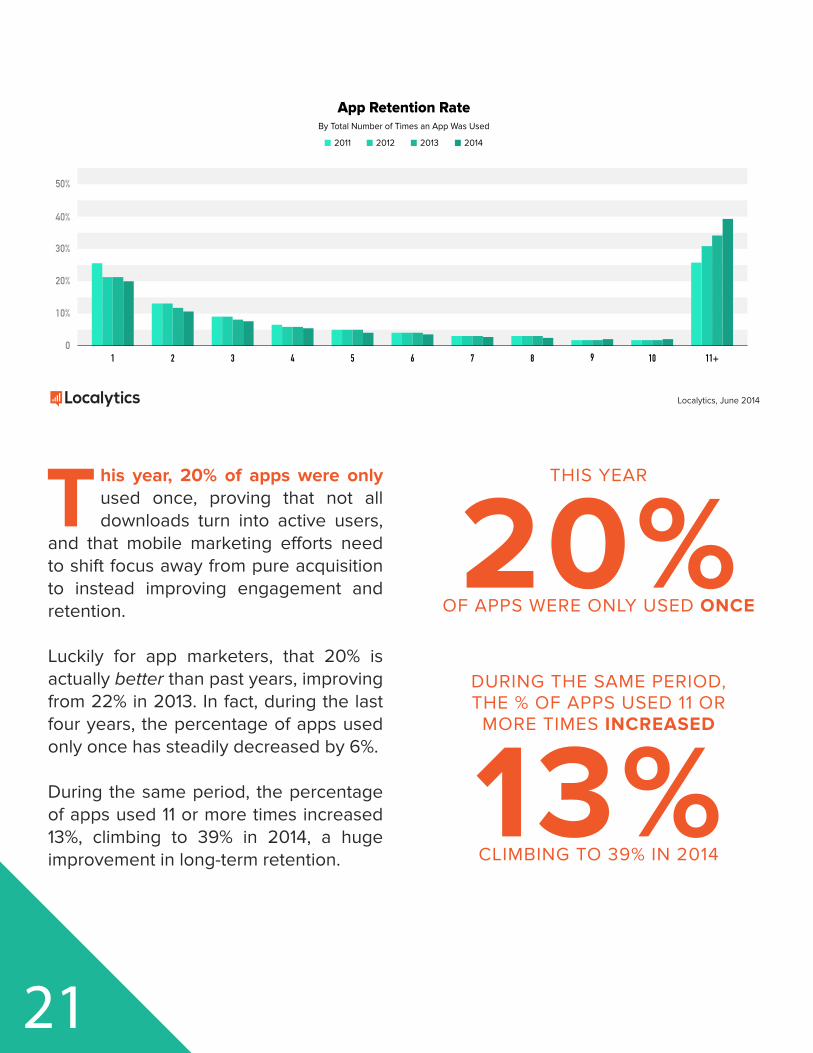
App Retention RateBy Total Number of Times an App Was Used
2011 2012 20142013
This year, 20% of apps were only used once, proving that not all downloads turn into active users,
and that mobile marketing efforts need to shift focus away from pure acquisition to instead improving engagement and retention.
Luckily for app marketers, that 20% is actually better than past years, improving from 22% in 2013. In fact, during the last four years, the percentage of apps used only once has steadily decreased by 6%.
During the same period, the percentage of apps used 11 or more times increased 13%, climbing to 39% in 2014, a huge improvement in long-term retention.
21
THIS YEAR
20%OF APPS WERE ONLY USED ONCE
DURING THE SAME PERIOD, THE % OF APPS USED 11 OR
MORE TIMES INCREASED
13%CLIMBING TO 39% IN 2014
FIND #
6
App Abandonment Risk is Still High
<1 min 1 min - 1 hr 12 hr - 1 day1 hour - 12 hr 1 - 2 days 2-7 days0
100
200
300
400
500
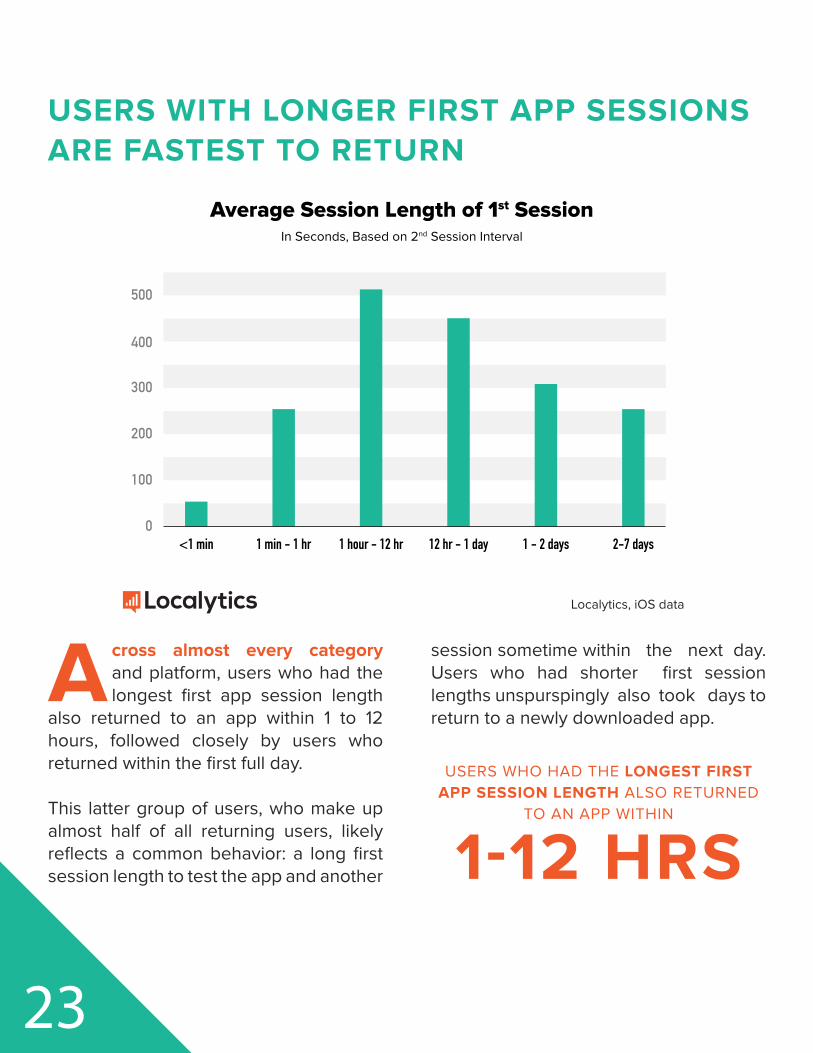
Average Session Length of 1st SessionIn Seconds, Based on 2nd Session Interval
Localytics, iOS data
USERS WITH LONGER FIRST APP SESSIONS ARE FASTEST TO RETURN
Across almost every category and platform, users who had the longest first app session length
also returned to an app within 1 to 12 hours, followed closely by users who returned within the first full day.
This latter group of users, who make up almost half of all returning users, likely reflects a common behavior: a long first session length to test the app and another
session sometime within the next day. Users who had shorter first session lengths unspurspingly also took days to return to a newly downloaded app.
23
USERS WHO HAD THE LONGEST FIRST APP SESSION LENGTH ALSO RETURNED
TO AN APP WITHIN
1-12 HRS

<1 min 1 min - 1 hr 12 hr - 1 day1 hour - 12 hr 1 - 2 days 2-7 days
iPad iPhone
100%
0
20%
40%
60%
80%
% Chance of Never Returning
Localytics, August 2014
MARKETERS FACE THE CHALLENGE OF THE “APP CHURN RISK WINDOW”
In 2014, there was a 60% chance users who didn’t come back to your app within seven days never returned.
In examining global iOS (iPad and iPhone) app usage, we found that the median user returns within just under 6 hours of his first app usage.
However, if a user doesn’t launch an app for a second time within one day from first use, there is a 40% chance that their first session will also be their last.
This “Churn Risk Window” increases over time – when the interval between the first
and second session approaches seven days, there is a 60% chance that a user will never return. Essentially, the longer a user waits to open an app a second time, the greater the chance they won’t return again.
24
IN 2014, THERE WAS A
60% CHANCE USERS WHO DIDN’T COME
BACK TO YOUR APP WITHIN SEVEN DAYS NEVER RETURNED
SOCIAL AND ENTERTAINMENT USERS ARE QUICKEST TO NEVER RETURN
For certain categories, marketers must react even more quickly to re-engage users before they’re lost. In Social and Entertainment apps, the data shows that if a user doesn’t try the app again within 12 hours of their first launch, there is greater than a
50% chance he will never open it again.
News apps, on the other hand, have some of the longest intervals between their first and second app launches: the median churn risk window for this category is almost 24 hours.
Even if a user doesn’t launch a News app again for up to seven days after his first use, there is still a 59% chance he will return later. This may reflect news cycles that are sometimes multiple days between big events.
25
IN SOCIAL & ENTERTAINMENT APPS, IF A USER DOESN’T RETURN TO THE APP WITHIN 12 HOURS THERE IS A
50%+CHANCE HE WILL NEVER RETURN
GamesSports NewsFood & DrinkPhotography Health &Fitness
Entertainment WeatherSocialNetworking
Music0
5%
10%
15%
20%
25%
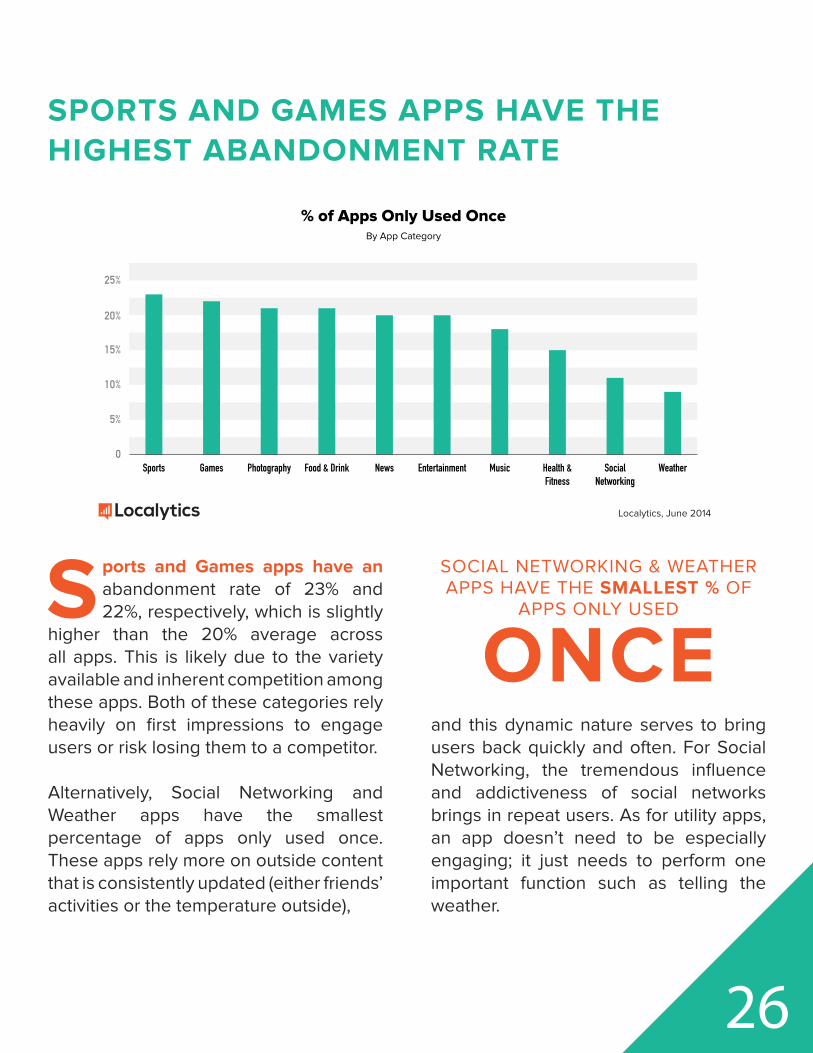
% of Apps Only Used OnceBy App Category
Localytics, June 2014
SPORTS AND GAMES APPS HAVE THE HIGHEST ABANDONMENT RATE
Sports and Games apps have an abandonment rate of 23% and 22%, respectively, which is slightly
higher than the 20% average across all apps. This is likely due to the variety available and inherent competition among these apps. Both of these categories rely heavily on first impressions to engage users or risk losing them to a competitor.
Alternatively, Social Networking and Weather apps have the smallest percentage of apps only used once. These apps rely more on outside content that is consistently updated (either friends’ activities or the temperature outside),
and this dynamic nature serves to bring users back quickly and often. For Social Networking, the tremendous influence and addictiveness of social networks brings in repeat users. As for utility apps, an app doesn’t need to be especially engaging; it just needs to perform one important function such as telling the weather.
26
SOCIAL NETWORKING & WEATHER APPS HAVE THE SMALLEST % OF
APPS ONLY USED
ONCE
SECTION THREE: ENGAGEMENT & MARKETING – INTERACTINGWITH USERS
FIND #
7
User-Enabled Push Leads to Higher
App Engagement

MusicEcommerce PhotographyFood & DrinkTravel EducationGames Health &Fitness
SportsSocialNetworking
0
50%
100%
150%
200%
250%
% Higher Engagement with Push EnabledAs Measured by App Launches
Localytics, August 2014
APP ENGAGEMENT IS HIGHER AMONGST PUSH ENABLED USERS
One of the biggest misconceptions about app marketing is that push notifications are intrusive
or annoying to users, and don’t actually improve retention or boost time in app. Data we analyzed this year proves that push messaging is actually a highly effective tool for app engagement.
We found that 52% of people enable push notifications on their mobile phones. Those 52% of people who enable push average 88% more app launches than those who disable push notifications. This number is slightly higher for Android, with the platform breakdown at 59% Android and 46% iOS.
This discrepancy is likely due to the fact that Android push notifications are on by default, whereas IOS asks the users
during their first session if they would like to enable push notifications.
Ecommerce sees an enormous 278% lift in engagement when comparing users who enable push, versus Health and Fitness apps, for example, which see only a 34% bump. This could be because the majority of eCommerce users are looking for mobile-specific offers and discounts, and are more likely see push messages as deal indicators.
29
PUSH ENABLED USERS AVERAGE
88% MORE APP LAUNCHES THAN THOSE
WHO DISABLE PUSH

100%
Month +1 Month +2 Month +3 Month +40
20%
40%
60%
80%
App User Retention% of Users Using the App in Subseqent Months
Localytics, August 2014
Push Enabled Push Disabled
USER RETENTION IS 2-3X HIGHER FOR PUSH ENABLED USERS
Minimizing churn is a major pain point for most app marketers. The power of push messaging is
evident here, too.
Retention for push-enabled users is significantly higher than for those who disable push notifications. Even just one month after first downloading the app, the difference in retention is staggering.On average, 62% of users will return to
the app the following month if they are being engaged with push messaging, whereas only 32% of users will return if not prompted with push.
This gap widens further down the road. Four months after their first session, over 1/3 of push enabled users are still engaging with the app, compared to only 14% of non-push users.
30

11+1 3 4 62 5 7 98 100
10%
20%
30%
40%
50%
Localytics, August 2014
App Retention RateBy Push Enablement for Total Number of Times an App Was Used
Push Enabled Push Disabled
PUSH ENABLED USERS HAVE A LOWER APP ABANDONMENT RATE
Remember, 20% of apps are used once and then never used again. When push messaging is enabled
in an app, this abandonment number actually decreases to almost 11%.
In other words, 11% of apps with push-enabled users are only used once, compared tothe 20% average. Users with push-enabled also spend more time in an app, with over 50% of users coming back to the app at least 11 times.
Even Apple has recognized the power of push and will be offering interactive
push in iOS 8 in the next month. These interactive notifications will enable users to continue to interact with apps – through push messages – even when not actually inside an app.
31
11% OF APPS WITH PUSH-ENABLED USERS
ARE ONLY USED ONCE, COMPARED TO
THE 20% AVERAGE

Travel/Lifestyle Games eCommerce/Retail TechnologyMedia/Entertainment0
2%
4%
6%
8%
10%
Push Messaging Click RateBy Vertical
Localytics, November 2014
PUSH MESSAGING POPULARITY VARIES BY INDUSTRY
Just as not all pushes are created equal, neither are all categories. Certain industries have higher click rates than others, depending on the content and timeliness of the message. Travel and Lifestyle
apps, which often offer quick information, are more likely to be interacted with than messages with a more complex call to action.
32
FIND #
8
FIND #
8
Targeted Push Messages Have
Higher Conversions

SEGMENTED PUSH MESSAGES ARE MORE SUCCESSFUL AT CONVERTING A CLICK
Marketers who segment their push messages, compared to those who blast them to
all users, see significant improvement in engagement. Our data shows that broadcast push messages are only opened by 3% of users.
However, this rate increases to 7% if the push message is segmented by user behavior and preferences. In other words, segmented push messages have over double the open rate as push messages blasted to everyone.
A push message – generic or targeted – can certainly bring a user back into the app, but it doesn’t guarantee that the user will actually complete the action you set out for them to do.
This year, research showed that of people who open a push notification, 54% of users convert from segmented push compared to only 15% for broadcast messages – that’s a 3x improvement in push messages that are informed by your app user analytics.
34
SEGMENTED PUSH MESSAGES HAVE OVER
2X THE OPEN RATE AS PUSH
MESSAGES BLASTED TO EVERYONE
54% OF USERS CONVERT FROM
SEGMENTED PUSH COMPAREDTO ONLY
15%FOR BROADCAST MESSAGES

MON TUE WED THUR FRI SAT SUN0
1%
2%
3%
4%
5%
6%
Push Messaging Click RateDay of Week
Localytics, November 2014
PUSH MESSAGES SENT DURING THE WEEK AND IN THE AFTERNOON PERFORM BEST
Push message click rates are fairly consistent throughout the week, but drop on the weekend. During
the week, the click rate average is 5.8%, but for the weekend the click rate drops
down to 3.5%. Fridays especially see the highest click rate of over 6%.
According to our data, most apps currently send their push messages in the evening, likely thinking that this is when people are home from work and willing to engage spend more time in-app.
This, however, is a misconception. Push messages actually have the greatest click rate at 6.7% in the afternoon (from 12PM- 5PM). In the morning, the click rate is only 5.3% and at night, shockingly, only 4.6%.
35
PUSH MESSAGES HAVE THE HIGHEST CLICK RATE AT
6.7%IN THE AFTEROON
10 or Fewer Words 11 – 20 Words 21 or Greater Words
8.8% 4.9% 3.2%
WordsWordsWordsWords
WordsWordsWords
Words WordsWords
WordsWords
WordsWords
WordsWordsWords
WordsWords
WordsWordsWordsWordsWordsWords
Words
WordsWords
Words
WordsWordsWordsWordsWords
Words Word
sWordsWords
WordsWords
Words
WordsWords
Words
Words
WordsWordsWords
WordsWords
Words
Words
Words
WordsWordsWords
WordsWords
Words
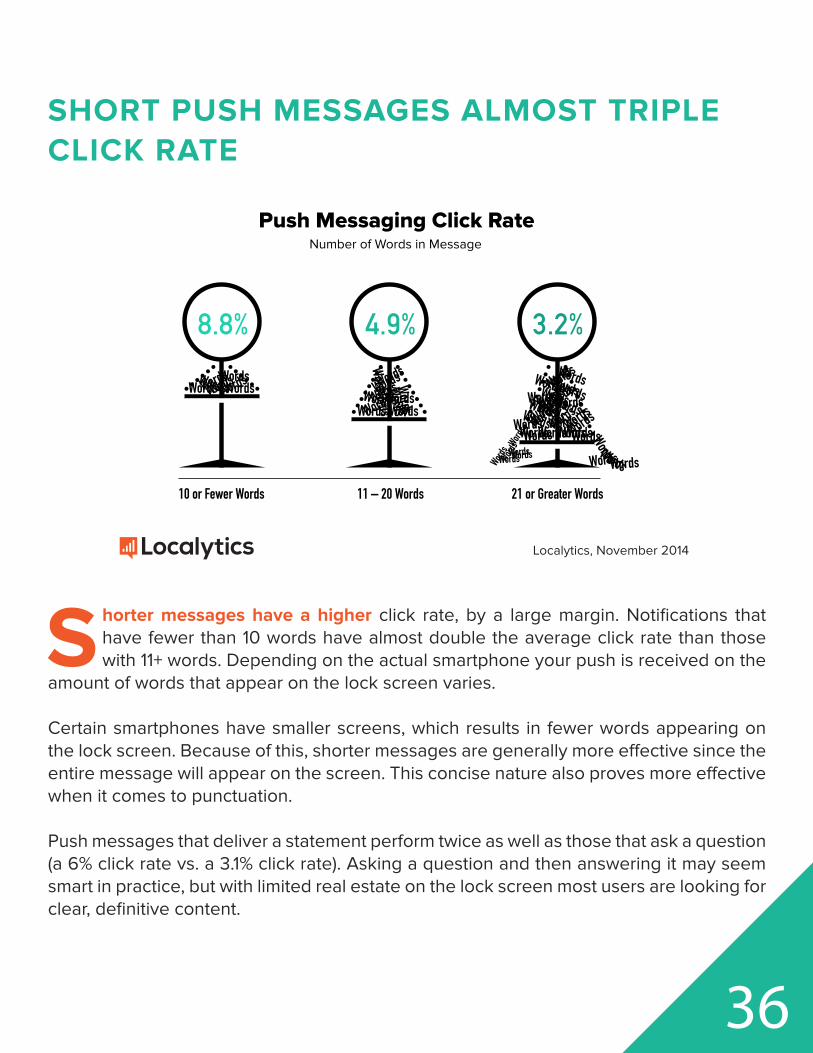
Push Messaging Click RateNumber of Words in Message
Localytics, November 2014
SHORT PUSH MESSAGES ALMOST TRIPLE CLICK RATE
Shorter messages have a higher click rate, by a large margin. Notifications that have fewer than 10 words have almost double the average click rate than those with 11+ words. Depending on the actual smartphone your push is received on the
amount of words that appear on the lock screen varies.
Certain smartphones have smaller screens, which results in fewer words appearing on the lock screen. Because of this, shorter messages are generally more effective since the entire message will appear on the screen. This concise nature also proves more effective when it comes to punctuation.
Push messages that deliver a statement perform twice as well as those that ask a question (a 6% click rate vs. a 3.1% click rate). Asking a question and then answering it may seem smart in practice, but with limited real estate on the lock screen most users are looking forclear, definitive content.
36
YOURFIVE KEY TAKEAWAYSFOR 2015

1. BUSINESSES NEED A PLAN TO ACQUIRE THE RIGHT USERS FROM MULTIPLE CHANNELS
Launching an app and hoping it goes viral isn’t a plan, and techniques like App Store Optimization only go so far in exposing your app to potential new users. There’s a common theory that organic users are a better investment: they cost nothing to acquire and are more likely to interact with your app regularly. This year, we found this isn’t true – and that in fact organic and paid users are equally valuable.
Paid-to-acquire users are typically just as engaged as organic users, which means your acquisition efforts need to include paid channels like Facebook or ad networks like MobFox and Millennial Media. Paid campaigns allow you to target an audience of highly qualified potential users, which is critical to boosting downloads and building your user base.
More importantly, finding and targeting these ideal users will improve retention and grow your app far more substantially than through just downloads. When you acquire users who are actually engaged with your app and use it on a regular basis, you have the foundation to build a real profitable channel (instead of simply concentrating on attracting more users and caring little about churn).
38

39
WHAT TO DO IN 2015
Create and optimize an acquisition strategy that includes organic promotion and paid channels to attract the right mix of users.
Take into account important user metrics, like retention and lifetime value, to determine which channels result in the most valuable users. What does this mean, exactly? Use app analytics to track users by campaign, and answer these questions:
* How frequently do these users return?* How much time do they spend in-app?* What is their combined lifetime value?* What is the ROI of this channel (when looking at ad spend and total user lifetime value)?
Your plans should also include promotion across the different channels and mediums you regularly use for brand marketing: social media, blogging, even the creation of a microsite providing detailed information about the app all contribute to organic acquisition. When it comes to ads, diversify your partnerships and experiment with different campaigns to discover what works (even if it’s not what you initially expected). Develop a plan in which the paid/organic split delivers the right results for you.

2. LARGER SCREEN SIZES OFFER MORE WAYS TO KEEP USERS IN-APP LONGER
Great apps don’t offer a one-size-fits-all experience.
In 2014, there were more mobile app launches than tablet or web apps because users are increasingly on the go and rely on their smartphones (and therefor apps) to access information, content and features quickly. This concept is even further demonstrated by the data showing social networking and music apps with a higher number of launches.
But we also saw that larger screen devices have higher engagement rates, primarily when it comes to time in app and session length. Enhanced screen size means enhanced capabilities, including important visuals and features that keep users engaged and in-app longer. It is, essentially, a bigger playing field.
Thus, users “snack” on mobile apps and, well, enjoy a long meal with tablet or phablet apps.
Don’t worry: this shouldn’t (and doesn’t) lead to a crossroads. Users are simply using apps differently, and not necessarily favoring one over the other.
40

WHAT TO DO IN 2015
Diversify and customize. Namely, play to the strengths found in the data.
When you launch a new version of your mobile app in 2015, design it to give users the fastest, easiest and most efficient path to completing an event or accessing a key feature:
* Track which screen flows are most popular and eliminate bottlenecks;* Use your analytics to create conversion funnels and see where users are dropping off; and* Consider ways to provide easier access or present users with a feature earlier in the experience
With your tablet app, expand: add new and innovative features that capitalize on the larger screen size and offer the user additional ways to continue interacting with the app. Think outside the box and test new app elements on a bigger screen. Take the opportunity to run NPS surveys and ask loyal users to rate your app (since they’re spending so much time in it, to begin with). Go big.
41

3. THE KEY TO RETENTION IS IN THE FIRST APP SESSION
As we discovered this year, across almost every category and platform, users who had the longest first session length also returned to the app the fastest, typically within 12 hours. These users see the value in your app right away, and are likely to turn into power users and have the greatest worth to your brand long-term.
The longer a user waits to return to the app for his second session, the more likely he is to never return.
When it comes to user retention, you need to win early to win often. The first app session sets the stage for any and all future interactions; so providing value at the onset is critical to keeping momentum. Focusing your efforts on creating the optimal first session is the crucial to creating an initial relationship and providing interest from the onset.
42

WHAT TO DO IN 2015
Bring ease and interest to the forefront.
Define the key value of your app and make it immediately known – don’t make app users go looking for it. The key is to create a “sticky” initial experience.
Upon first app open, make important features instantly visible and accessible. This could be in the form of a short series of intro screens that the user can navigate, or helpful call outs. Or, it could simply be making a home screen that highlights each feature.
Ask yourself:
* Are there any deterrents to immediate feature access?* Is the intro too short, too long, too spam-like, or too cluttered?* Does the home screen UI optimize for the right elements?* What about this experience would make me want to stay?
Also, create a plan to get the push opt-in at the get-go. 2014 proved that push messaging is clearly a highly successful tactic for increasing engagement. Make the user’s first app experience great and parlay that into getting push enabled. You can customize an in-app message outlining the benefits of enabling push, what kind of information the user will receive, and any and all pros.
43
4. APP USERS ARE ACTIVELY SEEKING OUT WAYS TO FURTHER INTERACT WITH GREAT APPS (BUT APPS TODAY AREN’T LIVING UP TO USER EXPECTATIONS)
There’s a clear gap between the increase we’ve seen in time in app and initial retention rates, and the App Churn Risk Window and abandonment rates.
Since 2011, app retention (in looking at the first 11 sessions) has improved substantially, and the number of apps only used once continues to decrease. Time in app alone has increased 21%. The clear conclusion is that app usage is growing, and users want to discover and interact with great apps.
Supply and demand in the app space is higher than ever before; but the actual quality delivered doesn’t yet meet expectations. While time in app is up, there’s still a 60% chance that users who don’t return after seven days never will, and in certain verticals the abandonment rate is higher (~23%) than the increase we’ve seen in time in app.
Many of the improvements in retention and usage can be attributed to an increased understanding of and focus on user engagement, which has enabled developers to create more useful apps. But there’s still much to do to shrink this gap that has little to do with the app UI. Increasing app engagement isn’t just a development initiative; it’s a marketing initiative.
Now, users are looking for a bidirectional experience when interacting with apps – quite simply, they want an app that listens to them and optimizes accordingly. This means running customized app marketing and innovating on brilliant new features.
44
WHAT TO DO IN 2015
Plan to retain and engage users by enabling app marketing campaigns that speak to their individual wants and needs. This means going beyond developing new app versions with a better UI, and trends into the territory of push and in-app messaging and A/B testing marketing.
Start by defining your app user personas and creating user segments to reflect those personas (including loyal users, purchasers, unengaged users, social sharers, etc.) With these evolving segments, you can run highly targeted app marketing campaigns to engage users via in-app and push messaging. You can answer critical questions, including:
* What kind of information, offers, and content do they enjoy?* What kind of messages can improve their app experience?* Do these messages help to re-engage them in-app?* Do these messages improve retention over time?* Are these user segments now more likely to engage with new or different app features?
When you can create marketing that’s targeted to your users based on real data, you create a relationship grounded in their needs and better understand the value in your app from their eyes.
Next step? Evolve.
Seeking out and creating new app features isn’t the onus of developers – app marketers are now in the trenches of analytics, campaigns and user behavior, which all work to drive app evolution. In order to create a great app (one that exceeds user expectations), you have to know what they want be the one to execute on it first. In some cases, you need to be the one to define what users are looking for before they even really understand. Using data to inform feature creation, and working in the mindset of your users, you can grow your app.
45
5. PERSONALIZED USER EXPERIENCES ARE THE NEXT BIG STEP
When it comes to app marketing, what we found in 2014 is that, typically, push message copy needs to be short, clear and enticing – but beyond that, the content or offer associated needs to speak to your users. This year, we discovered that segmented push messages have almost double the average click rate as broadcast notifications.
Given the popularity of push messages as a marketing tool, they’re a good indicator of what does and doesn’t work in app marketing. This year, push notifications are signaling that targeting and personalization are the clear winners in app marketing. In order to execute on this, you need to know app users in and out and what their expectations are to effectively personalize.
Your app users are people, and they consist of more than just their in-app behavior. Increasingly, your audience is interacting with your brand in a number of different ways – some of which aren’t even traceable. The most effective way to gain a complete view of your users is with cross-channel analytics.
46

WHAT TO DO IN 2015
Make your marketing relevant and make it valuable to the individual. Creating customized campaigns uses the best of your analytics and user data to discover (and provide) the best information, offers, and content possible.
Using in-app behavior to inform personalization is one way to ensure a great app user experience; but it’s only half of the equation. To enable truly personalized experiences, this data has to include channels outside of just your app.
Compile profile and behavioral information within your cross-channel analytics to truly understand how your audience operates. This includes:
* Attributes like gender, age, location, or favorites; and* Actions like last in-store purchase, emails opened, or events attended
By gathering customer information from all channels, you gain a complete view of users: who they are, what they want, what they need, and what they expect. Use this to inform your app roadmap, your marketing campaigns, and how you better their mobile experience. Maintain these elements when thinking of the user experience: dynamic and personalized.
47
48
CONCLUSION
When it comes to your app, you need to be constantly evolving.
We’ve seen the app industry rise and change rapidly, with user expectations leading the charge and their experience at the forefront of what consistutes success.
The next year in mobile is going to focus on improving user engagement and retention even further by creating dynamic, personalized experiences, and creating user profiles that represent a complete view of your customer across all channels. The clear conclusion: apps cannot be successful if they remain static.
In addition to cross-channel capabilties, app marketing is going to become about retargeting to re-engage users who have abandoned your app. Essentially, regardless of where your user is inside or outside of the app, you need a plan to engage them. Integrated analytics and marketing platforms allow you to track user behavior and automate smarketer campaigns to engage them. The right platform should also house behavioral and profile data about your users from their online and in-store interactions.
App usage is only going to continue growing; along with it, user expectations. Rising to meet these expectations, treating your users as people along a journey, and identifying the value in your app are all key to keeping your app useful and relevant. How are you going to accomplish this in 2015?
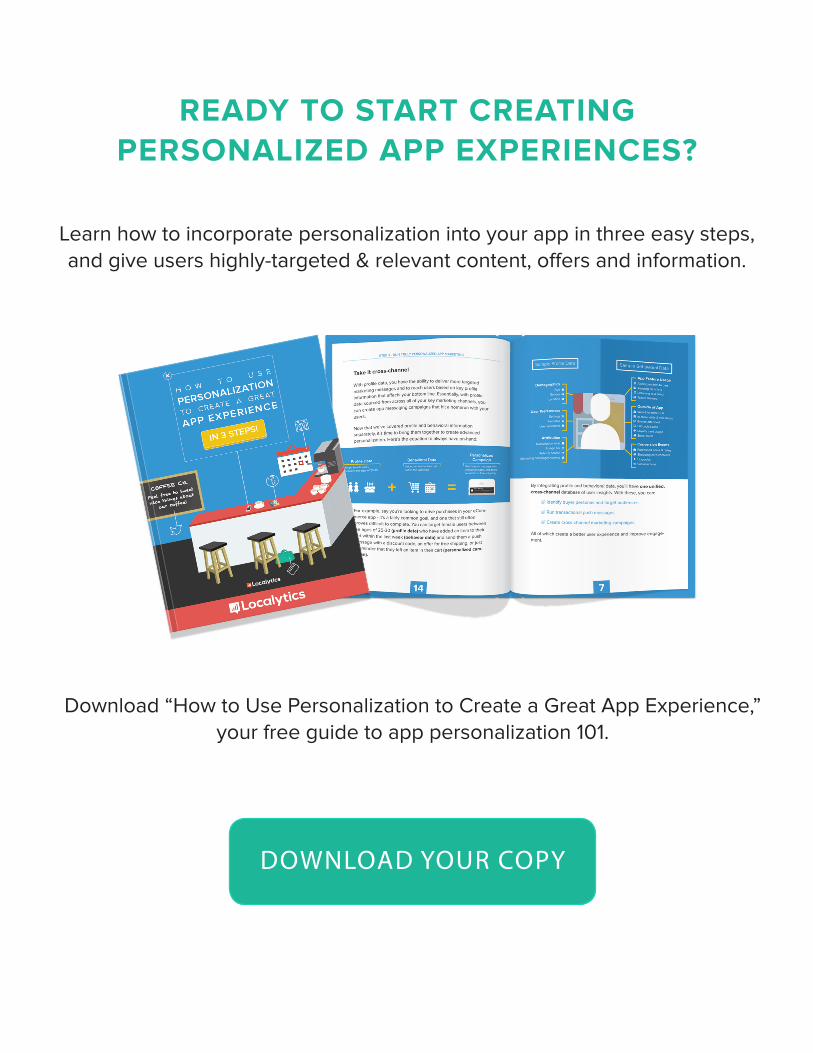
READY TO START CREATING PERSONALIZED APP EXPERIENCES?
Learn how to incorporate personalization into your app in three easy steps, and give users highly-targeted & relevant content, offers and information.
Download “How to Use Personalization to Create a Great App Experience,” your free guide to app personalization 101.
DOWNLOAD YOUR COPY