texas vegetable assn. mid-year meeting mcallen, texas june ... · texas vegetable assn. mid-year...
TRANSCRIPT
Texas Vegetable Assn. Mid-Year Meeting
McAllen, Texas
June 17, 2004
Central America Free Trade:
What’s at Stake For Texas Agriculture?
C NAS Parr Rosson, Professor & Director
Center for North American Studies
Department of Agricultural Economics
Texas A&M University
What’s At Stake?
Access to Dominican Republic &
Central American Markets
Sources of Raw Materials
Gains/Losses to Trade
Greater Efficiency & Economies of
Scale

Australia ‘04
Bahrain ‘04 DR-CAFTA
‘04
Chile ‘04 FTAA ‘06
Morocco ‘04
Southern African
Customs Union ‘05
Singapore ‘03
Jordan ‘03
U.S. Trade Agreements-3d Largest Market
NAFTA ‘94 Israel ‘85
CUSTA, ‘89
Andean FTA
05
Panama ‘05
Thailand ‘05
15 Trade Agreements Completed or Pending

World Average Agricultural Tariffs, 2000
115
85
55
40
30 25
12
0
20
40
60
80
100
120
140 Bound Average
World Average
62%
Percent

Bound Tariffs for Selected Products, 2000
40 39
52 52
86 86
10 12
Fruit Fresh Fruit Preparations 0
20
40
60
80
100
Percent South America
Central America
Caribbean Islands
North America
Source: ERS/USDA

Bound Tariffs for Selected Products, 2000
41 38
54 51
86 86
11 12
Vegetables Vegetable Preparations 0
20
40
60
80
100
Percent
South America
Central America
Caribbean Islands
North America
Source: ERS/USDA
DR-Central American
Free Trade Agreement

Dominican
Republic,
800 Miles
NE
North
Houston,
1,300 Miles
NW
Mexico
Separate
Agreement with
United States

CAFTA WHO?
– Costa Rica
– Dominican Republic
– El Salvador
– Guatemala
– Honduras
– Nicaragua
What? Free Trade Area Between Each Country & the United States
When? Early 2005, if Approved
How? Trade Promotion Authority

CAFTA (cont.)
About ½ of Markets Open to U.S. Agriculture When Implemented
Opportunities: HQ Beef, Cotton, Wheat, Soybeans
Rest of Market Access Over 15-20 Years: Pork, Beef, Poultry, Rice, Corn, Dairy

DR-CAFTA Demographics
Country Pop.
(mil)
GDP/
Person
Poverty
%
Lit.
%
Ag. Pop.
%
Costa Rica 3.9 $8,300 20.6 96 20
El Salvador 6.5 $4,600 48 80.2 30
Guatemala 13.9 $3,900 75 70.6 50
Honduras 6.7 $2,500 53 76.1 34
Nicaragua 5.1 $2,200 50 67.5 42
Dom. Rep. 8.7 $6,300 25 84.7 17
Total/Avg. 44.8 $4,633 45.3 79.2 32.2

U.S. Total Trade with CAFTA, 2003
Source: Foreign Trade Statistics, U.S. Census Bureu
$3.4
$1.8
$2.3
$2.8
$0.5
$4.2
$3.4
$2.0
$2.9 $3.3
$0.8
$4.5
$0.1
-$0.2
-$0.7 -$0.5
-$0.3 -$0.2 $0.0
$1.0
$2.0
$3.0
$4.0
$5.0
-$1.0
Billion Dollars
Exports Imports Balance

U.S.-Central American Agricultural Trade, 1990-2003
$1.3 $1.4
$1.5 $1.6 $1.6
$1.8 $2.0
$2.2 $2.1
$1.9 $2.1
$1.9 $2.0
$2.1
$0.5 $0.6 $0.6
$0.7 $0.8
$0.9 $1.0 $1.0
$1.3 $1.1 $1.1
$1.2 $1.3 $1.3
-$0.8 -$0.8 -$0.9 -$0.9
-$0.8 -$0.9
-$1.0 -$1.2
-$0.8 -$0.8 -$1.0
-$0.7 -$0.7
1990 1995 2000 2003
$0.0
$0.5
$1.0
$1.5
$2.0
$2.5
-$0.5
-$1.0
-$1.5
Billion Dollars
Imports Exports Balance
Source: Foreign Agricultural Trade of The United States , Calender Year, USDA/ERS

U.S. Ag Trade with CAFTA, 2003
Source : Fore ign Trade Statistics, U.S. Census Bureu
$242 $238$349
$200$95
$442
$865
$105
$763
$221$114
$280
-$623
$133
-$414
-$21 -$19
$162
Costa R
ica
El Salvador
Guatem
ala
Honduras
Nicaragua
Dom
inican Rep.
$0
$200
$400
$600
$800
$1000
-$200
-$400
-$600
-$800
Mill ion Dollars
Exports Imports Balance

U.S. Agricultural Exports to
Central America
Source: U.S. Trade Internet System, www.fas.usda.gov/ustrade
Grains & Feeds
$218
Oilseeds
$90 Animals
$47
Veg/Fruit
$44
Beverages
$37
Other
$47
Grains & Feeds
$582
Oilseeds
$260
Animals
$204 Veg/Fruit
$117
Cotton
$47
Other
$129
Total, 1990: $483 million Total, 2003: $1,339 million

U.S. Agricultural Imports from
Central America
Bananas
$453 Fruit/Veg.
$133
Fish
$211
Coffee
$372
Sugar
$133
Other
$264
Bananas
$674
Fruit/Veg
$527
Fish
$478
Coffee
$459
Sugar
$188
Other
$328
Total, 1990: $1,566 million Total, 2003: $2,654 million
Source: U.S. Trade Internet System, www.fas.usda.gov/ustrade

U.S. Onion and Melon Exports to
CAFTA
Source: U.S. Trade Internet System, www.fas.usda.gov/ustrade
$0.6
$2.0
$1.5 $1.3
$2.6
$3.9
$1.9
$1.0
$0.4 $0.6
$0.2 $0.0 $0.0
$0.1 $0.0 $0.0 $0.1 $0.0 $0.0 $0.1
1994 1995 1996 1997 1998 1999 2000 2001 2002 2003
$0.0
$1.0
$2.0
$3.0
$4.0
$5.0
Million Dollars
Onions Melons
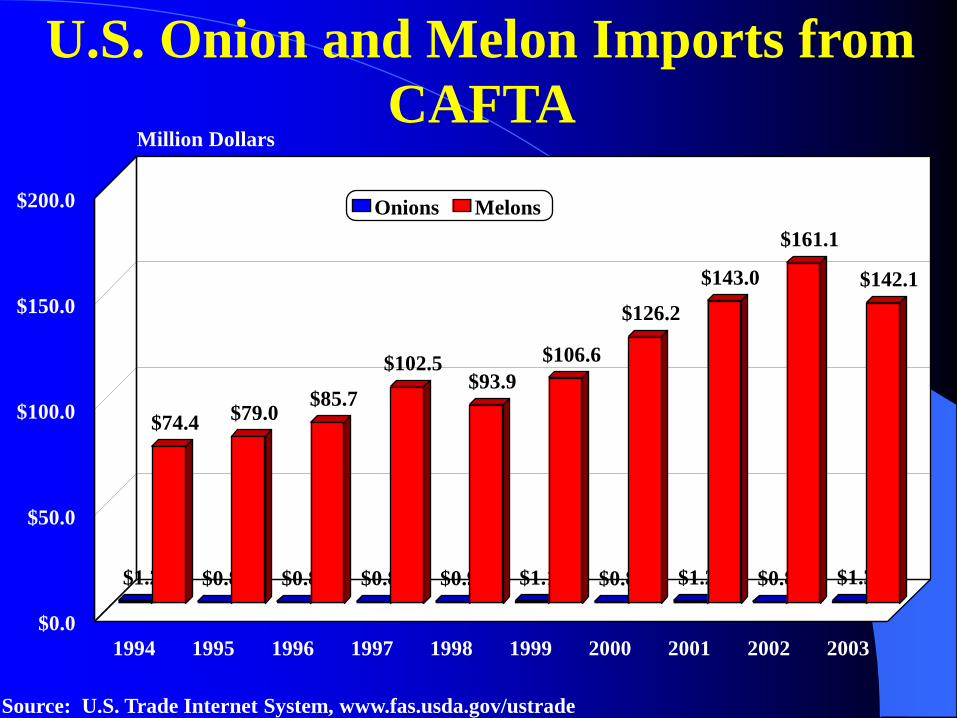
U.S. Onion and Melon Imports from
CAFTA
Source: U.S. Trade Internet System, www.fas.usda.gov/ustrade
$1.2 $0.8 $0.8 $0.8 $0.9 $1.1 $0.8 $1.2 $0.8 $1.3
$74.4 $79.0
$85.7
$102.5 $93.9
$106.6
$126.2
$143.0
$161.1
$142.1
1994 1995 1996 1997 1998 1999 2000 2001 2002 2003
$0.0
$50.0
$100.0
$150.0
$200.0
Million Dollars
Onions Melons

Melon Tariff Phase-Out
US Tariffs Eliminated Immediately
Most CA Tariffs Eliminated Immediately
Exception: Dominican Republic May Impose 20% Safeguard Duties
– 5 Years for Watermelon
– 10 Years for Other Melons

Onion Tariff Phase-Out
US Tariffs Eliminated Immediately
CA Tariffs Eliminated Over 10 to 15
Years
All But El Salvador Have Some Type
of Safeguard or Tariff-Rate Quota

CAFTA Base Tariffs
for Yellow & White Onions
47
15 15 15 15
97
Costa Rica* El Salvador Guatemala Honduras Nicaragua Dom. Rep.
0
20
40
60
80
100
120 Percent
* Denotes Tariff-Rate Quota

CAFTA Phase-Out Period
for Yellow & White Onions
15
12
10
15 15 15
Costa Rica El Salvador Guatemala Honduras Nicaragua Dom. Rep. 0
2
4
6
8
10
12
14
16
18 Years

Monthly U.S. Cantaloupe Shipments and Imports
Source: Agricultural Marketing Service, USDA
0
100
200
300
400 Million Pounds
0
5
10
15
20
25
30 $/CWT
Texas Other U.S. CAFTA Mexico Price

Monthly U.S. Honeydew Shipments and Imports
Source: Agricultural Marketing Service, USDA
Jan 01
May
Jan 02
May
May
Jan 04
0
20
40
60
80
100Million Pounds
0
5
10
15
20$ per 2/3 Carton of 6s
Texas Other US CAFTA Mexico Price

Monthly U.S. Watermelon Shipments and Imports
Source: Agricultural Marketing Service, USDA
Jan 01
May 01
Jan 02
May 02
Jan 03
May 03
Jan 04
0
200
400
600
800Million Pounds
0
0.1
0.2
0.3
0.4
0.5Cents/Pound, Various Red
Texas Other U.S. CAFTA Mexico Prices

Monthly U.S. Onion Shipments and Imports
Source: Agricultural Marketing Service, USDA
0
100
200
300
400
500 Million Pounds
0
10
20
30
40
50 $/CWT
Other U.S. Texas Mexico CAFTA Other Imports Price
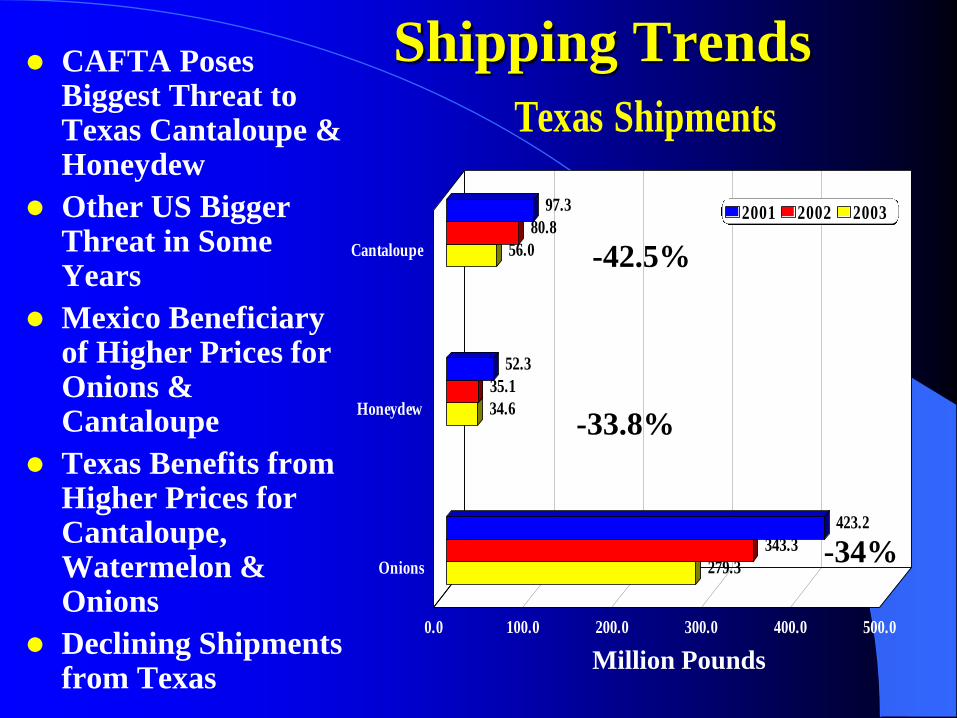
Shipping Trends CAFTA Poses
Biggest Threat to Texas Cantaloupe & Honeydew
Other US Bigger Threat in Some Years
Mexico Beneficiary of Higher Prices for Onions & Cantaloupe
Texas Benefits from Higher Prices for Cantaloupe, Watermelon & Onions
Declining Shipments from Texas
Texas Shipments
97.3
52.3
423.2
80.8
35.1
343.3
56.0
34.6
279.3
Cantaloupe
Honeydew
Onions
0.0 100.0 200.0 300.0 400.0 500.0
2001 2002 2003
-42.5%
-33.8%
-34%
Million Pounds
Summary
Negotiations Completed – DR-CAFTA May Go To Congress Soon
– Labor & Environmental Interests Important to the Debate
DR-CAFTA Tariff Reductions Will Open Markets, Over Time
Dr-CAFTA Major Supplier of Honeydew and Cantaloupe to U.S. Market
– Texas Season Overlaps with Rest of United States & DR-CAFTA
Mexico & Other US Major Competition in Watermelon & Onions

Issues for Texas
Are More Trade Agreements a Desirable Outcome?
Without DR-CAFTA, U.S. Market Access Limited
– Even with DR-CAFTA, No Guarantee of Market
Growth, Some Countries Need Economic
Development & Income Growth
Investment in CA May Spur Production &
Development of Infrastructure
SPS Problems May Arise, More Trade Disputes
Likely
Recent Declines in Shipments of Texas Cantaloupe,
Honeydew & Onions Troublesome

Center for North American Studies
Parr Rosson
Ph: 979-845-3070
E-mail: [email protected]
“Informed Decisions for Global
Change”
C NAS