texas public health journal...tpha journal volume 68, issue 1 3 commissioner’s comments dr....
TRANSCRIPT

In This Issue
Texas Public Health JournalA quarterly publication of the
Texas Public Health Association (TPHA)
Volume 68, Issue 1 Winter 2016
Please visit the Journal page of our website at http://www.texaspha.orgfor author information and instructions on submitting to our journal.
Texas Public Health AssociationPO Box 201540, Austin, Texas 78720-1540 phone (512) 336-2520 fax (512) 336-0533
Email: [email protected]“The articles published in the Texas Public Health Journal do not necessarily refl ect the offi cial policy or opinions of the Texas Public Health Asso-ciation. Publication of an advertisement is not to be considered an endorsement or approval by the Texas Public Health Association of the product or service involved.”
Subscriptions: Texas Public Health Journal, PO Box 201540, Austin, Texas 78720-1540. Rates are $75 per year. Subscriptions are included with memberships. Membership application and fees accessible at www.texaspha.org. Please visit the journal page for guidelines on submitting to the Texas Public Health Journal.
President’s Message 2
Commissioner’s Comments 3
Poison Control News: Explosions and Fires Reported with Electronic Cigarettes 3
NBOMe Designer Drugs Reported to Texas Forensic Laboratories 4
Original Public Health Research and Practice: Lessons Learned from the Field: Community Assessment for Public Health Emergency Response (CASPER) 6
The Effect of a Pilot Nutrition Education Intervention on Perceived Cancer Risk in a Rural Texas Community 14
Predictors of Perineal Laceration in Women Delivering on the Texas-Mexico Border 20
GIS Day, Texas Department of State Health Services, Austin, Texas, November 18, 2015 24
Call for Exhibitors! 92nd Annual TPHA Annual Education Conference 26
Call for Member Engagement and Fundraising 27

2 TPHA Journal Volume 68, Issue 12
EditorCatherine Cooksley, DrPH, ARGC
Managing EditorTerri S. Pali
Editorial BoardKaye Reynolds, MPH - Co-chairCarol Galeener, PhD - Co-chair
Jean Brender, RN, PhDAmol Karmarker, PhDKimberly Fulda, DrPH
Mathias B. Forrester, BSNatalie Archer, MPH, PhDKathryn Cardarelli, PhDTPHA Executive Board
Cindy Kilborn, MPH, M(ASCP), PresidentMelissa Oden, DHEd, LMSW-IPR, MPH,
CHES, President-ElectCarol M. Davis, MSPH, CPH, 1st Vice President
Rachel Wiseman, MPH, 2nd Vice PresidentJames Swan, PhD, Immediate Past President
Bobby Schmidt, MEd (2018)Kaye Reynolds, DrPH (2018)
Gloria McNeil, RN, BSN, MEd (2017)Sandra Strickland, DrPH, RN (2017)
Elizabeth Barney (2017)Rita Espinoza, MPH (2016)
Debbie Flaniken (2016)TPHA Governing Council
Cindy Kilborn, MPH, M(ASCP), PresidentMelissa Oden, DHEd, LMSW-IPR, MPH,
CHES, President-ElectCarol M. Davis, MSPH, CPH, 1st Vice President
Rachel Wiseman, MPH, 2nd Vice PresidentJames Swan, PhD, Immediate Past President
Bobby Schmidt, MEd (2018)Kaye Reynolds, DrPH (2018)
Gloria McNeil, RN, BSN, MEd (2017)Sandra Strickland, DrPH, RN (2017)
Elizabeth Barney (2017)Rita Espinoza, MPH (2016)
Debbie Flaniken (2016)Sheronika Denson, DrPH, MS (2018)
Stephen L. Williams, MEd, MPA (2018)Alexandra Garcia, PhD, RN, FAAN (2018)
Martha Culver, RN, MSPH (2017)Jennifer Smith, MSHP (2017)
Maram Museitif, MPH, CPH, CCRP (2017)Cathy Troisi, MS, PhD (2016)
Arianne Rhea (2016)Christine Arcari, PhD (2016)
Roger Barker, MBA (HCA), RS, Administration & Management Section (2016)
David Sanders, PhD Aging & Public Health Section (2016)
Anil Mangla, MS., PhD., MPH., FRIPH, Epidemiology Section (2016)
Lisette K. Osborne, RN-BC, MSN, CHEP, Public Health Nursing Section (2016)
Alisa Rich, PhD, Environmental and Consumer Health Section (2016)
Page Animadu, Student Section (2016)Bobby Jones, DVM, MPH, DACVPM,
ParliamentarianCatherine Cooksley, DrPH, ARGC
RepresentativeJohn R. Herbold, DVM, MPH, PhD
ARGC AlternateTerri S. Pali, Executive Director
Journal TypesettingCharissa Crump
* ( ) term expires
President’s MessageCindy Kilborn, MPH
Public Health: Ev-eryone – Every-where – Everyday. That has been the topic I have ad-dressed in this col-umn for the past year. Since I be-came the President of the Texas Public Health Association
(TPHA) in February of 2015, I have tried to focus on this theme. In fact, as I have men-tioned in past columns, it is the offi cial theme for the 92nd Annual Educational Conference (AEC) this April in Galveston.
This past November, as TPHA president, I had the opportunity to attend the annual meet-ing and exposition of the American Public Health Association (APHA) held in Chicago. Our TPHA has been an affi liate member for many years. The theme of the 143rd meet-ing of APHA was integrating “Health into All Policies”. In other words, the concepts of public health should be included in everything we, as a society, do. Attending the sessions of this conference reiterated the fact that fea-turing this concept of promoting health in all aspects of life and community is paramount for all members of society in order for us to thrive and prosper as a nation. In my opin-ion, it is the only way for the United States to move forward. Without addressing the soci-etal problems that health inequities impose on our population, we will not be able to ensure an acceptable standard of living for the com-ing generations.
That is one reason why APHA has intro-duced its new initiative of “Generation Public Health”. Incorporating “Health in All Poli-cies” cannot be achieved in a few years and it will not be achieved with only the partici-pation of our current public health workforce. Bringing health equity to all those living in this country will require the participation of every one of us. APHA has recognized the need for this seamless immersion of public health into policy development (“Health in All Policies”) and is committed to sustain-ing this necessary, long term concept through incorporating this philosophy into their of-fi cial conference theme for 2016: “Creating the Healthiest Nation: Ensuring the Right to Health”.
We at TPHA believe we can start right here in Texas to work toward this goal by incor-porating health into all policies here at home. Creating the healthiest nation is indeed an
ambitious goal, but it can be done with every citizen’s involvement starting here in our own state. Information, inspiration and equality are key to fulfi lling this ultimate public health mission. The public health workforce must become a workforce of advocates not only nationally, but statewide. As has been said before, one entity (public health) will not ac-complish this in isolation. Advocacy is bring-ing together partners from fi elds as diverse as transportation, housing, law enforcement, ed-ucation, climate science, technology develop-ment and national defense to address the many diverse aspects of public health. Aspects of health are intertwined with so many factors we hear about every day, but don’t necessarily relate those to better health. Some examples are these: minimum wage workers may not be able to purchase the healthiest of foods; transportation issues may hamper access to appropriate food/ recreation/ education/ employment; substandard housing may pro-mote exposures to lead/mold/ harmful pests/ violence/ stress; increasing temperatures may lead to heat-related illness/expand the distribu-tion of disease vectors, and effect the occur-rence of food and water borne illnesses. It is a given that the disenfranchised will always be disproportionately affected by the aforemen-tioned factors. It is also a given that this will over burden our ineffi cient health care system. America spends more on healthcare than any other nation; but that doesn’t translate into the US being the healthiest nation. The US ranks 34th in life expectancy.
The simplest solution is to avoid the need for the traditional use of our current healthcare system, which only addresses acute needs at a critical point. How? By creating a healthier nation through prevention! Making changes in traditional public health and healthcare prac-tices can feel uncomfortable at best but resist-ing change can no longer be an option. Public health advocacy can take us to “Generation Public Health”, and this rising tide will fl oat our societal boat. TPHA has fully embraced this new generation and encourages all Tex-ans to come aboard. The next cruise leaves Galveston April 11th. Back your bags, I hope to see you there. Public Health: Everyone – Everywhere – Everyday.Source: The Nation’s Health; APHA Jan 2016
Please see pages 26 and 27 and help us make this conference great! Contact Terri at [email protected] to fi nd out how.
ewTtduycoH

TPHA Journal Volume 68, Issue 1 3
Commissioner’s Comments
Dr. Hellerstedt Named New DSHS CommissionerTexas Department of State Health Services
Poison Control NewsExplosions and Fires Reported with Electronic CigarettesMathias B. ForresterTexas Department of State Health Services, Austin, [email protected]
Dr. John Hellerstedt joined DSHS as its new commissioner as of Jan. 1, 2016. His broad experience positions him well to lead the state’s public health department. He most recently was the chief medical offi cer for the Seton Family of Hospitals and re-
turns to the Health and Human Services system, having previously served as medical director for the Medicaid and Children’s Health Insurance Program Division. After leaving HHSC, Dr. Hellerstedt served as vice president of medical affairs for Dell Children’s Medi-cal Center of Central Texas. He has also been in private practice as a pediatrician at the Austin Regional Clinic.
“I am very excited about this next chapter in my life, and I’m eager to return to public service where I can help keep Texans healthy and safe,” Dr. Hellerstedt said.
Dr. Hellerstedt is a graduate of the University of Pittsburgh medical school. He completed his residency at the University of Texas-San Antonio Health Science Center.
As the next DSHS commissioner, Dr. Hellerstedt will take over for Kirk Cole, who served as interim commissioner since Dr. David Lakey left in January. Dr. Lakey served as agency commissioner for eight years.
Cole will return to his role as associate commissioner, working
closely with the new commissioner to ensure that the policy, pro-grams and operations of the agency continue to be strategic, respon-sive to the needs of the state and align with the goals and priorities of state leadership. Dr. Lisa Cornelius, who served as interim DSHS Chief Medical Executive and provided counsel on medical, public health and related issues, will continue her work as the agency’s In-fectious Diseases Medical Offi cer.
“Bringing Dr. Hellerstedt on board is great for the HHS system and for the health of Texans everywhere,” said Health and Human Ser-vices Executive Commissioner Chris Traylor. “John’s work in pri-vate practice, combined with his public service and his incredible work at Seton, gives him a unique depth of knowledge about Tex-ans’ health needs that will serve the state well. Dr. Hellerstedt’s life-long dedication to public health makes him a perfect fi t as the state’s health commissioner.”
The Department of State Health Services has 12,000 employees and an annual budget of $3.2 billion. The agency oversees disease prevention and public health preparedness, family and community health services, environmental and consumer safety, regulatory programs and mental health and substance abuse prevention and treatment programs. The agency’s Division for Regional and Local Health Services specifi cally serves the needs of local public health agencies, DSHS Health Service Regions and local communities to help build and maintain capacity to provide public health services needed at the local level.
Electronic cigarettes (also known as e-cigarettes, e-cigs, personal va-porizers, electronic nicotine delivery systems) are battery-powered devices that heat a solution containing nicotine, fl avorings, and other chemicals (e.g., propylene glycol, glycerol). The users then inhale the vapors that result.1-3 Electronic cigarettes fi rst became available in the United States in 2007.2 As of July 13, 2014, there were 2.5 million electronic cigarette smokers in the United States, and the number is growing.2
Concerns have been raised about explosions or fi res attributed to electronic cigarettes. For instance, in October 2015, a man was hos-pitalized and placed in a medically induced coma after an electronic cigarette exploded in his face.4 However, sources of data on such incidents are not readily available. The National Fire Incident Re-porting System (NFIRS) does not collect information in such a way that it allows for analysis of electronic cigarette fi res.2 The U.S. Fire Administration conducted an Internet search for media reports of electronic cigarette explosions or fi res during January 2009-August 2014.2 Twenty-fi ve separate instances of fi re or explosion involving electronic cigarettes were identifi ed. Eighty percent of the incidents occurred while the device was being charged and 8% while being used. Although no deaths were reported, ten persons were injured, two involving serious burns when the electronic cigarettes exploded
in the users’ mouths. One of these 25 incidents occurred in Texas.
Many electronic cigarettes have a USB port for connecting the de-vice to the manufacturer’s power adapter. However, the USB port may result in electronic cigarettes being connected to power adapters not provided by the manufacturer. The use of non-approved power adapters may be responsible for a number of the electronic cigarette fi res and explosions.2
Review of Texas Poison Center Network (TPCN) data identifi ed four explosions or fi res related to electronic cigarettes reported during 2009- 2015. One person was charging the battery not as recommend-ed and the electronic cigarette exploded in a table drawer. Another electronic cigarette exploded in a person’s hands, causing redness. In a third incident, an electronic cigarette exploded in the user’s pocket, causing 2nd-3rd degree burns to the leg and groin area. Details on the fourth incident were not readily available but did not appear to involve an injury. In comparison, during the same time period, 902 exposures to the liquid contents of electronic cigarettes had been re-ported to the TPCN.
In conclusion, considering the millions of electronic cigarettes in use in the United States, explosions or fi res involving electronic
C
DT
Dnbthmf
h H l h d H
b

4 TPHA Journal Volume 68, Issue 1
cigarettes appear to be rare.2 Electronic cigarette batteries should be charged according to the manufacturer’s instructions. Use of power sources other than those approved by the manufacturer may result in explosion and fi re.2
REFERENCES1. Chatham Stephens K, Law R, Taylor E, Melstrom P, Bunnell R, Wang B, Apelberg B, Schier JG. 2014. Notes from the fi eld: calls to poison centers for exposures to electronic cigarettes United States, September 2010 February 2014. MMWR Morb Mortal Wkly Rep 63:292 293.2. U.S Fire Administration. October 2014. Electronic cigarette fi res and ex-
NBOMe Designer Drugs Reported to Texas Forensic LaboratoriesMathias B. Forrester1, Jane Carlisle-Maxwell2
1Texas Department of State Health Services, Austin, [email protected] University of Texas, Austin, [email protected]
A number of synthetic or designer drugs of abuse have appeared in the US in recent years. One class of these designer drugs are variants of the 2C series of phenethylamines. A 2-methoxybenzyl is added onto the nitrogen (N) of the phenethylamine; as a result drugs in this class are given the designation ‘NBOMe.’ These include 2-(4-iodo-2,5-dimethoxyphenyl)-N-(2-methoxybenzyl)ethanamine (25I-NBOMe; 2CI-NBOMe; 25I; Cimbi-5), 2-(4-chloro-2,5-dimethoxyphenyl)-N-(2-methoxybenzyl)ethanamine (25C-NBOMe; 2C-C-NBOMe; 25C; Cimbi-82), and 2-(4-bromo-2,5-dimethoxyphenyl)-N-(2-methoxybenzyl)ethanamine (25B-NBOMe; 2C-B-NBOMe; 25B; Cimbi-36).1,2 The 2-methoxybenzyl increases the potency of the phenethylamine, causing NBOMe to be active at a very low sub-milligram dose.2
Considered to be synthetic LSD (lysergic acid diethylamine), people use NBOMe drugs because they are reported to produce euphoria, hallucinations, empathic feelings, changes in consciousness, and un-usual body sensations.3-5 NBOMe drugs are sold under street names such as N-bomb, Smiles, Solaris, and Cimbi and are often obtained through the Internet or from individual dealers.1,2,4,6,7 These drugs may be inhaled, ingested, or injected.1,2,6,8,9 NBOMe drugs may be sold as other hallucinogens such as LSD, resulting in users unknow-ingly taking NBOMe drugs by mistake.1,4
NBOMe drugs may have serotonergic and sympathomimetic ad-verse health effects: tachycardia, hypertension, agitation, aggression, hallucinations, seizures, nausea, insomnia, paranoia, hyperpyrexia, clonus, elevated white cell count, elevated creatine kinase, hyper-glycemia metabolic acidosis, rhabdomyolysis, and renal failure.1,3,6-13
Deaths implicating NBOMe drugs have been reported in various states, including Texas.1-3,7,8,14-16
The Drug Enforcement Administration (DEA) issued an order on November 15, 2013, to temporarily schedule 25I-NBOMe, 25C-NBOMe, and 25B-NBOMe in schedule 1 of the Controlled Sub-stances Act (CSA).1
Comparatively few NBOMe drug exposures are reported to Texas poison centers.8 Through 2015, only 52 exposures have been reported (63.5% 25I-NBOMe, 11.5% 25C-NBOMe, 25.0% unknown type).
Another potential source of information on NBOMe use is a Drug Enforcement Administration (DEA) program called the National Forensic Laboratory Information System (NFLIS). Details of the NFLIS are available at https://nfl is.deadiversion.usdoj.com. The pro-gram contains information on scientifi cally verifi ed drug chemistry
plosions. U.S Fire Administration, Federal Emergency Management Agency; Washington, DC. Available at https://www.usfa.fema.gov/downloads/pdf/publications/electronic_cigarettes.pdf. Accessed November 1, 2015.3. Etter JF, Bullen C, Flouris AD, Laugesen M, Eissenberg T. 2011. Electronic nicotine delivery systems: A research agenda. Tobacco Control 20:243-248.4. Bowerman M. October 29, 2015. Fla. Man hospitalized after e-cigarette explodes in face. 13WMAZ.com. Available at http://www.13wmaz.com/story/news/2015/10/29/fl a man hospitalized after e cigarette explodes in face/74826882/. Accessed November 1, 2015.
analysis results from federal, state, and local forensic laboratories. The laboratories analyze substances seized in law enforcement op-erations. (Thus, although the substances the laboratories analyze might not necessarily be from actual exposures, they indicate what substances are available.) Twenty-one forensic laboratories in Texas contribute to the NFLIS.
No Texas forensic laboratories reported NBOMe during 2010 or 2011. Table 1 shows the NBOMe reports from Texas forensic labora-tories during 2012-2014 by drug type. The total number of NBOMe reports increased over the three-year period, although much of the in-crease occurred between 2012 and 2013 when the number of reports more than tripled. All three types of NBOMe were reported in each year. However, while 25I-NBOMe accounted for the preponderance of reports in 2012, it had a smaller majority in 2013 and accounted for the smallest proportion of NBOMe reports in 2014. Meanwhile, the number and proportion of both 25C-NBOMe and 25B-NBOMe reports increased during the three years.
Texas is divided into eleven Public Health Regions (PHRs) or groups of adjacent counties (https://www.dshs.state.tx.us/chs/info/info_txco.shtm). Forensic laboratories that contribute to the NFLIS are found in all eleven PHRs, although the number of laboratories varies by PHR. When the distribution of NBOMe reports by PHR where the forensic laboratory is located is examined (Table 2), the majority of NBOMe reports in all three years were found to originate from PHR,6 the PHR in southeast Texas that contains Houston, although this proportion was highest in 2012. PHR 8, the PHR in south-central Texas that contains San Antonio, had no NBOMe reports in 2012 but the second most frequent proportion of reports in 2013 and 2014.
In conclusion, the number of NBOMe reports from Texas forensic laboratories has increased during 2012-2014. Moreover, the specifi c type of NBOMe found by the laboratories has changed during the three-year period. The preponderance of NBOMe reports come from southeast Texas (Houston area), although an increasing proportion of the reports have come from other regions of the state, particularly south-central Texas (San Antonio area).
REFERENCES1. Drug Enforcement Administration. Department of Justice. 2013. Schedules of controlled substances: temporary placement of three synthetic phenethyl-amines into Schedule I. Final order. Fed Regist 78(221):68716-68719.2. Harris County Institute of Forensic Sciences. September 12, 2012. De-signer psychedelics: New class of designer drugs in Harris County.3. Advisory Council on the Misuse of Drugs. May 29, 2013. ‘NBOMe’ com-pounds: A review of the evidence of use and harm. London, England; 10-16.

TPHA Journal Volume 68, Issue 1 5
Available at: https://www.gov.uk/government/uploads/system/uploads/at-tachment_data/fi le/204808/J_TCDO_report_on_5 6APB_and_NBOMe_compounds.pdf. Accessed December 18, 2013.4. Drug Enforcement Administration. November 2013. 25I NBOMe, 25C NBOMe, and 25B NBOMe (Street names: N bomb, Smiles, 25I, 25C, 25B). Drug Enforcement Administration.5. Ninnemann A, Stuart GL. 2013. The NBOMe series: a novel, dangerous group of hallucinogenic drugs. J Stud Alcohol Drugs 74:977 978.6. Kelly A, Eisenga B, Riley B, Judge B. 2012. Case series of 25I NBOMe exposures with laboratory confi rmation. Clin Toxicol (Phila) 50:702.7. Hassan A. September 23, 2012. Lethal designer drug taking lives in streets of Houston. Houston Chronicle 111(346):B1,B4.8. Forrester MB. 2014. NBOMe designer drug exposures reported to Texas poison centers. J Addict Dis 33:196 201.9. Rose RS, Cumpston KL, Stromberg PE, Wills BK. 2012. Severe poisoning following self reported use of 25 I, a novel substituted amphetamine. Clin Toxicol (Phila) 50:707 708.10. Hill SL, Doris T, Gurung S, Katebe S, Lomas A, Dunn M, Blain P, Thom-as SH. 2013. Severe clinical toxicity associated with analytically confi rmed recreational use of 25I-NBOMe: case series. Clin Toxicol (Phila) 51:487-492.11. Poklis JL, Nanco CR, Troendle MM, Wolf CE, Poklis A. 2014. Deter-
mination of 4-bromo-2,5-dimethoxy-N-[(2-methoxyphenyl)methyl]-benze-neethanamine (25B-NBOMe) in serum and urine by high performance liquid chromatography with tandem mass spectrometry in a case of severe intoxica-tion. Drug Test Anal 6:764-769.12. Rose RS, Poklis JL, Poklis A. 2013. A case of 25I-NBOMe (25-I) in-toxication: a new potent 5HT2a agonist designer drug. Clin Toxicol (Phila) 51:174-177.13. Stellpfl ug SJ, Kealey SE, Hegarty CB, Janis GC. 2014. 2-(4-Iodo-2,5-dimethoxyphenyl)-N-[(2-methoxyphenyl)methyl]ethanamine (25I-NBOMe): Clinical case with unique confi rmatory testing. J Med Toxicol 10:45-50.14. Horswell C. February 27, 2015. Family of teen who died after ingesting ‘N-Bomb’ raising awareness of risks. Houston Chronicle. Available at http://www.chron.com/neighborhood/woodlands/news/article/Family of teen who died after ingesting N Bomb 6106759.php. Accessed April 30, 2015.15. Caldicott DG, Bright SJ, Barratt MJ. 2013. NBOMe - a very different kettle of fi sh. Med J Aust 199:322.323.16. Poklis JL, Devers KG, Arbefeville EF, Pearson JM, Houston E, Poklis A. 2014. Postmortem detection of 25I-NBOMe [2-(4-iodo-2,5-dimethoxyphenyl)-N-[(2-methoxyphenyl)methyl]ethanamine] in fl uids and tissues determined by high performance liquid chromatography with tandem mass spectrometry from a traumatic death. Forensic Sci Int 234:e14-e20.
Table 1. NBOMe reports from Texas forensic laboratories by drug type Drug type 2012 2013 2014 No. % No. % No. % 25I-NBOMe 63 84.0 156 63.2 52 19.7
25C-NBOMe 11 14.7 48 19.4 122 46.2
25B-NBOMe 1 1.3 43 17.4 90 34.1
Total 75 247 264
Table 2. NBOMe reports from Texas forensic laboratories by Public Health Region Public Health Region (area: major cities) 2012 2013 2014 No. % No. % No. % 1 (Northeast: Amarillo, Lubbock) 0 0.0 1 0.4 1 0.4
2 (North-central: Abilene, Wichita Falls) 2 2.7 0 0.0 3 1.1
3 (North-central: Dallas, Fort Worth) 5 6.7 17 6.9 23 8.7
4 (Northeast) 4 5.3 4 1.6 7 2.7
5 (East) 0 0.0 13 5.3 5 1.9
6 (Southeast: Houston) 56 74.7 149 60.3 168 63.6
7 (Central: Austin) 6 8.0 26 10.5 16 6.1
8 (South-central: San Antonio) 0 0.0 32 13.0 34 12.9
9 (West-central) 0 0.0 0 0.0 1 0.4
10 (West: El Paso) 0 0.0 0 0.0 0 0.0
11 (South: Corpus Christi, Brownsville) 2 2.7 5 2.0 6 2.3
Total 75 247 264

6 TPHA Journal Volume 68, Issue 1
Original Public Health Research and Practice
Lessons Learned from the Field: Community Assessment for Public Health Emergency Response (CASPER) David F. Zane, MS1, Tracy Haywood, BS2, Barbara Adams, MPH1, Herminia Alva, MPH3, Vivienne Heines, MPH3, Bonnie Feldt, MPH4, Joseph (Greg) Rosen, BA5, Judy Henry, PhD6, Kaila Thompson, MPH7, Sharon Stonum, MPH8, Jennifer Kiger, MPH9, Kelly Johnson, MS9, Dana Wiltz-Beckham, DVM9, Monty Gomez, MPH10, Kirsten Short, MPH11, Kahler Stone, MPH12, Jennifer Horney, PhD13 1Health Emergency Preparedness and Response Section, Division for Regional Local and Health Services, Texas Department of State Health Services, Austin, Texas 2Division for Regional Local and Health Services, Texas Department of State Health Services, Austin, Texas 3Health Service Region 11, Division for Regional Local and Health Services, Texas Department of State Health Services, Harlingen, Texas 4Health Service Region 7, Division for Regional Local and Health Services, Texas Department of State Health Services, Temple, Texas 5Health Service Region 6/5, Division for Regional Local and Health Services, Texas Department of State Health Services, Houston, Texas 6Austin-Travis County Health and Human Services Department, Austin, Texas 7Fort Bend County Health and Human Services, Rosenberg, Texas 8Galveston County Health District, La Marque, Texas9Harris County Public Health and Environmental Services, Houston, Texas 10Hays County Health Department, San Marcos, Texas11Houston Health Department, Houston, Texas12Waco-McLennan County Public Health District, Waco, Texas 13Texas A & M University, School of Public Health, College Station, Texas
Correspondence: [email protected] Community Assessment for Public Health Emergency Response (CASPER) is a tool created for rapidly assessing public health threats and needs. CASPERs can be conducted in both disaster and non-disaster settings. It can provide situational awareness to public health and emergency management offi cials to strengthen disaster response and recovery, assist with public health preparedness planning ef-forts, and identify routine public health issues. Since 2001, Texas has ranked second in the nation in the number of CASPERs conducted. Multiple local health departments and the Texas Department of State Health Services have conducted CASPERs in their jurisdictions. We were interested in identifying and sharing lessons learned in conduct-ing CASPERs.
In spring 2015, we identifi ed key informants at agencies and orga-nizations in Texas that were believed to have conducted CASPERs from January 2008 through May 2015. Agencies and organizations included local health departments and DSHS Health Service Regions (HSRs) and Texas A&M University. Through facilitated telephone calls and email communications with key informants, we identi-fi ed and documented lessons learned. We identifi ed over 70 lessons learned in conducting CASPERs. These lessons were categorized according to the four general CASPER phases outlined in the Cen-ters for Disease Control and Prevention’s CASPER toolkit. As ju-risdictions across Texas and the nation become trained on CASPER methods, we anticipate that more CASPERs will be conducted. We hope that these health departments and other organizations will use this shared knowledge to accelerate their CASPER planning and in-crease the potential success of their assessment. It is our desire that the CASPER community-of-practice will grow.
Key Words – assessments, disasters, public health, preparedness
INTRODUCTIONCommunity Assessment for Public Health Emergency Response (CASPER) refers to a group of tools and methods designed by the Centers for Disease Control and Prevention (CDC) to provide rapid, reliable, and accurate population-based public health information.1
CASPER is an adaptation of a cluster sampling method developed by the World Health Organization in the 1960s to assess vaccination coverage rates.2 In the 1990s, this method was adapted by CDC for use in rapid, post-disaster assessments.3 Since that time, it has been most frequently used by public health and emergency management professionals to conduct post-disaster assessments.4 However, it has also been used to gather information on other topics, including rou-tine community health assessments, H1N1 vaccine uptake, commu-nity recovery, and other topics.5-8
CASPERs utilize a two-stage cluster sampling method population-based sampling weights from each census block, which allows for generalizability of collected data to the entire population of the study area. In the fi rst stage, clusters – typically 30 census block or block groups – are selected probability proportionate to population size. In the second stage, seven households are randomly selected to com-plete an interview. Unlike a simple random sample, households se-lected using the cluster sampling method have an unequal probability of selection; therefore, all analyses included a mathematical weight for probability of selection to reduce bias.
CASPER can be useful in both disaster and non-disaster settings.9
Between 2003 and 2012, at least 53 CASPERs were conducted in 13 states and one U.S. territory.8 Among the CASPERs, 37 (69.9%) were conducted in response to specifi c natural or human-induced disasters, including 14 (37.8%) for hurricanes. The remaining 16 (30.1%) CASPERs were conducted in non-disaster settings. In
TPHA Journal Volume 68, Issue 1 7
Texas, eight CASPERs were conducted during this time, including disaster-related CASPERs in response to Hurricanes Rita (2005) and Ike (2008) and the Bastrop County wildfi res (2011) and non-disaster CASPERs for public health assessment in San Saba County (2010) and in response to the H1N1 novel infl uenza A outbreak in Willacy County (2010 and 2011).10,11 After Hurricane Ike, CASPER results were utilized to better understand the immediate unmet needs of households after the storm, to arrange for referral services, to esti-mate demand for shelters, and to establish six comfort stations at sites across Houston.12 During the H1N1 novel infl uenza A outbreak, the Texas Department of State Health Services (DSHS) HSR 11 used CASPER to assess infl uenza knowledge and practices in Willacy County after low participation at an H1N1 vaccination event. Find-ings included a lower than expected percentage of the population had received the infl uenza vaccine, with many giving the reason that they were either unsure about the safety of the new H1N1 vaccine or that the locations where the vaccine was offered were not con-venient.13 In response, the DSHS HSR health department was able to increase advertising of the vaccine’s availability outside normal business hours and to develop educational materials on the vaccine’s safety.13 CASPERs in a non-disaster setting can also provide an op-portunity to exercise response capability and improve preparedness for future disaster events.
Since 2001, Texas has ranked second (behind North Carolina) in the nation in the number of CASPERs conducted.14 We were inter-ested in identifying lessons learned in conducting CASPERs and then sharing them with public health professionals at local, regional, and state health departments; preparedness and emergency response professionals; and academic and research professionals interested in community assessment. We hope sharing lessons learned will benefi t and grow the CASPER community-of-practice in Texas and beyond.
METHODSIn spring 2015, we identifi ed key informants at agencies in Texas that conducted CASPERs from January 2008 through May 2015. These agencies and key informants were identifi ed initially from historical record repositories maintained by the DSHS Health Emergency Pre-paredness and Response Section (Austin) that archived CASPERs conducted in both disaster and non-disaster settings throughout Texas. These agencies and organizations included local and DSHS HSRs and Texas A&M University. Following initial communications with these respondents, a modifi ed snowball sampling approach was used to identify additional individuals with CASPER experience. In total, we identifi ed 18 informants representing seven local health de-partments, a state university, and the state health department (three regional offi ces and the central offi ce) that collectively had over 20 CASPER experiences in Texas.
Key informant roles in CASPERs refl ected the diversity of activi-ties required to implement a community assessment to include plan-ning, epidemiology, sampling, mapping, logistics, and interviewing. Through facilitated focus group telephone calls, a semi-structured in-terview was administered to participating key informants. Questions solicited lessons learned on activities throughout the four CASPER phases and sought insights on such categories as determining ob-jectives, when to conduct the assessment, deciding on the sampling approach, organizing fi eld assessment teams, performing data analy-sis on completed fi eld interviews, and publishing a fi eld summary report – among others. Email communications with specifi c infor-mants supplemented these focus group interviews in order to gather additional insights.
After identifying and documenting lessons learned from these tele-phone calls and emails, we categorized these lessons according to the four general CASPER phases outlined in the CDC CASPER toolkit:
1) preparing for the CASPER, 2) conducting the CASPER, 3) ana-lyzing the data, and 4) writing the report and sharing the results. Data were additionally subcategorized within the CASPER phases based on general activities inherent in the CDC CASPER toolkit. Lessons learned gathered from the key informants were consolidated via an inductive process to remove duplicates and provide a more succinct and user-friendly matrix of lessons learned.
No Institutional Review Board approval was required for the collec-tion and distillation of these lessons learned.
RESULTSWe identifi ed over 70 lessons learned. They are categorized accord-ing to the four general CASPER phases outlined in CDC’s CASPER toolkit and are described in Table 1, but a selected summary is pro-vided below.
During the fi rst phase of CASPER, developing clear objectives that are focused on local needs is critical to ensuring a successful assess-ment. CASPER-related expenses can vary on many factors, includ-ing costs for supplies, food, lodging, and rental vehicles, but may (estimate) range between $3,000 and $7,500. In determining when to conduct the assessment, it is important to seek insights and knowl-edge from the community and key stakeholders. During sampling, being able to visit selected clusters prior to deploying fi eld teams is ideal to identify potential sampling issues/obstacles. When cluster maps are created, it is important to provide training to fi eld teams on how to read and use the maps. In regards to the survey tool and data-base, it is best to use previously created survey tools and adapt them instead of creating all new surveys. It also is recommended to set up the database with easy to use or common software to enhance data entering effi ciency. When assigning fi eld teams, pair experienced members with less-experienced members. Though more training the better, it is essential to provide at least three hours of Just-in-Time training prior to the assessment. The key informants also recom-mended utilizing the expertise and support of DSHS HSR and central offi ce staff during all of the CASPER phases.
In the second CASPER phase, it is optimal to have two to three days for data collection planned and to have an assigned logistics person who can solve fi eld problems and address team needs. It was also noted to encourage the use of social media before, during, and after CASPER to increase awareness and reduce suspicion from the com-munity.
During the third CASPER phase (data analysis), CDC’s Epi Info can be used to conduct weighted analysis to account for probability of selection.
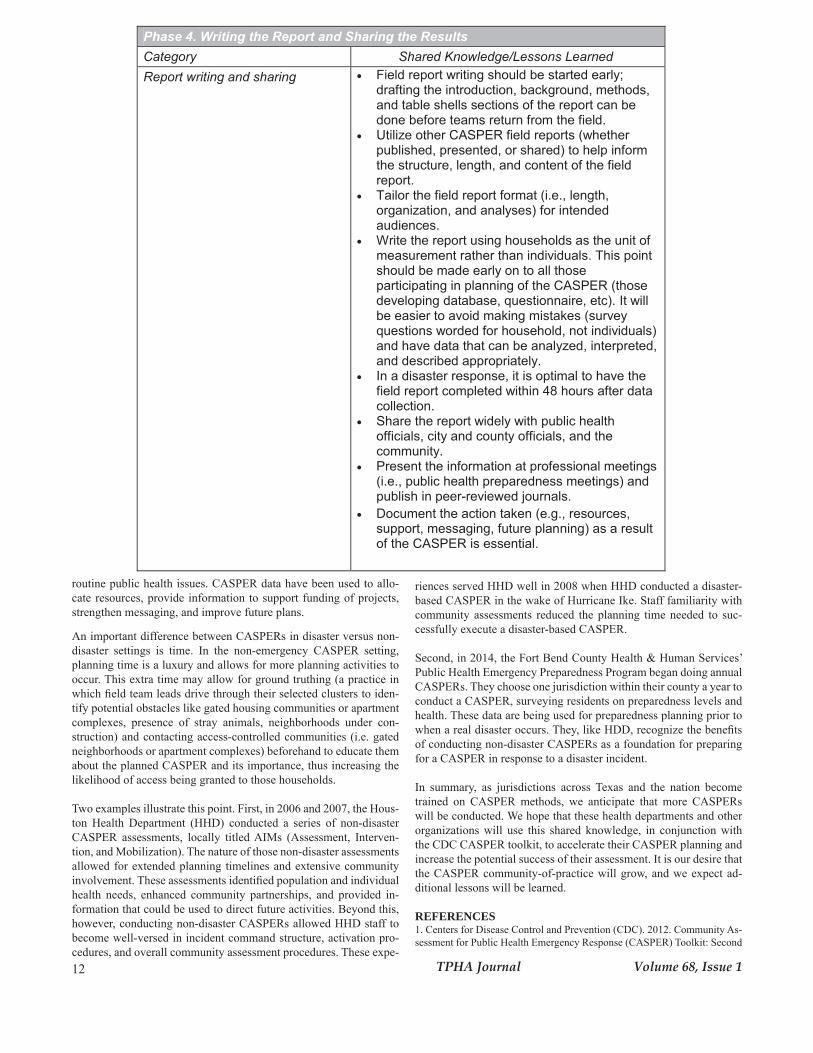
In the fourth and fi nal CASPER phase, it is optimal, during disaster response, to share the fi eld report within 48 hours of data collection completion. When writing the report, it is vital to report the unit of analysis as households and to include the feedback of all who are involved in the planning of the CASPER to avoid mistakes in the interpretation and analysis of the data.
DISCUSSION As part of this review, we identifi ed over 70 lessons learned in con-ducting CASPERs. These lessons were categorized according to the four general CASPER phases outlined in CDC’s CASPER toolkit. This shared knowledge can serve as an excellent complement to the step-by-step instructions outlined in CDC’s CASPER toolkit.
One of the overarching lessons learned is that CASPERs can be successfully conducted in both disaster and non-disaster settings. It can provide situational awareness to public health and emergency management offi cials to strengthen disaster response and recovery, assist with public health preparedness planning efforts, and identify

8 TPHA Journal Volume 68, Issue 1
Table 1. Community Assessment for Public Health Emergency Response (CASPER) Shared Knowledge/Lessons Learned by CASPER Phases and Category Phase 1. Preparing for a CASPER Category Shared Knowledge/Lessons Learned Objectives � Developing clear objectives, focused on local
needs, are critical to ensuring a successful assessment.
� Inform local officials (e.g., county judge, emergency management coordinator) and solicit input on objectives.
Costs
� CASPER methods and techniques are ideal for providing reliable health information more quickly and inexpensively than other epidemiologic methods (e.g., telephone surveys), and therefore are uniquely suited for disaster-related public health assessments.
� Costs for conducting a CASPER will vary based on many factors, such as the objectives and availability of local/in-house resources (e.g., staff time, vehicles). Ideally, in-house staff (local or state) are available to develop the objectives and the sampling approach, produce the maps, find the volunteers to be on the field teams, provide the training, enter the data, and write the report. Expenses vary on many factors including costs for supplies, food, lodging, and rental vehicles, and may (estimate) range between $3,000 and $7,500.
Timing the assessment � Knowing and engaging the community is crucial. In non-disaster CASPERs, conduct the assessment when you anticipate residents are going to be home and receptive to interviews (e.g., during weekdays, from 3–7pm; during weekends, start after 9:30 am).
� Avoid scheduling non-disaster CASPERs during potential competing community activities (e.g., festivals, school vacations) and during predicted adverse weather conditions (e.g., extreme heat, rain, and hurricane seasons).
� For disaster-related CASPERs, it is important to engage emergency management partners and to consider when it is safe to enter the affected disaster area(s). The assessment may be timed when residents have been allowed back into their homes after an evacuation order or after immediate threats have ended.
Sampling approach � The CASPER sampling method is flexible and is tailored to meet objectives of each incident.
� Sampling at the census block level is ideal. � For rural areas, with known low number of
housing units per cluster, it is appropriate to join adjacent census blocks to create larger clusters for the sampling frame.
� In selected clusters with large numbers of housing units, it is appropriate to identify smaller geographic areas for the systematic sampling to occur.
� Visiting selected clusters (“ground truthing”) prior to deploying field teams is ideal to identify potential sampling issues/obstacles (e.g., gated communities, apartment buildings, stray animals).
TPHA Journal Volume 68, Issue 1 9
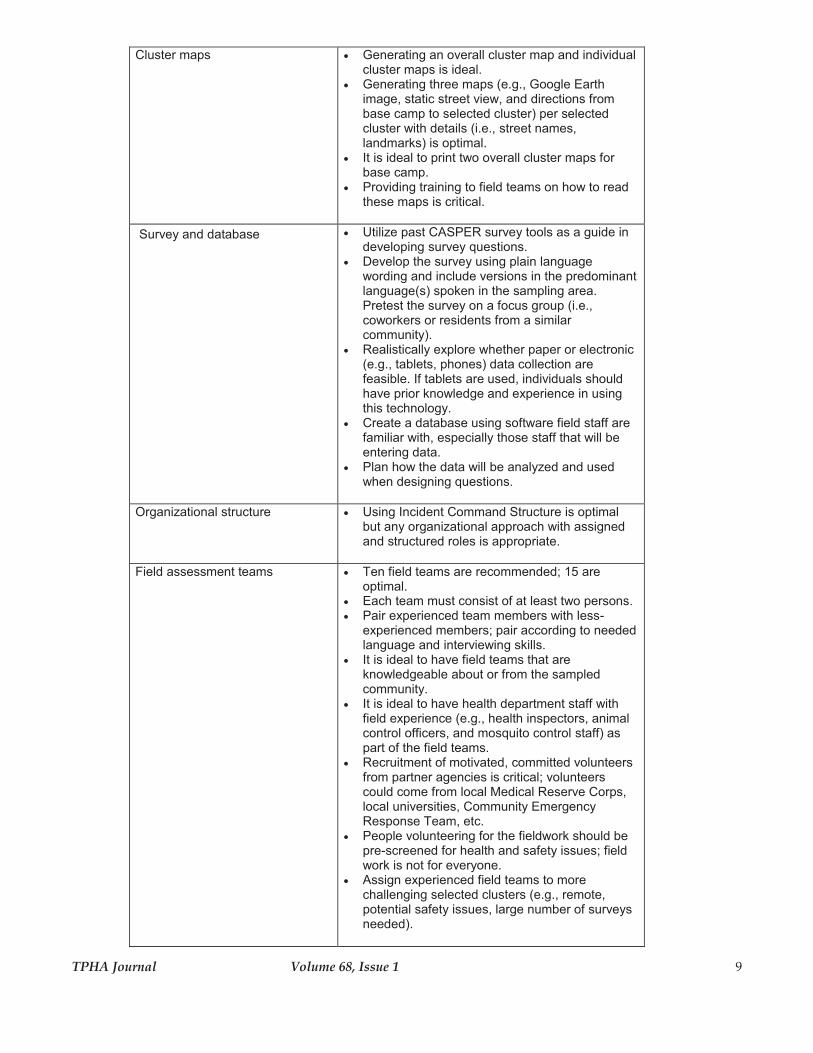
Cluster maps
� Generating an overall cluster map and individual cluster maps is ideal.
� Generating three maps (e.g., Google Earth image, static street view, and directions from base camp to selected cluster) per selected cluster with details (i.e., street names, landmarks) is optimal.
� It is ideal to print two overall cluster maps for base camp.
� Providing training to field teams on how to read these maps is critical.
Survey and database � Utilize past CASPER survey tools as a guide in developing survey questions.
� Develop the survey using plain language wording and include versions in the predominant language(s) spoken in the sampling area. Pretest the survey on a focus group (i.e., coworkers or residents from a similar community).
� Realistically explore whether paper or electronic (e.g., tablets, phones) data collection are feasible. If tablets are used, individuals should have prior knowledge and experience in using this technology.
� Create a database using software field staff are familiar with, especially those staff that will be entering data.
� Plan how the data will be analyzed and used when designing questions.
Organizational structure
� Using Incident Command Structure is optimal but any organizational approach with assigned and structured roles is appropriate.
Field assessment teams
� Ten field teams are recommended; 15 are optimal.
� Each team must consist of at least two persons. � Pair experienced team members with less-
experienced members; pair according to needed language and interviewing skills.
� It is ideal to have field teams that are knowledgeable about or from the sampled community.
� It is ideal to have health department staff with field experience (e.g., health inspectors, animal control officers, and mosquito control staff) as part of the field teams.
� Recruitment of motivated, committed volunteers from partner agencies is critical; volunteers could come from local Medical Reserve Corps, local universities, Community Emergency Response Team, etc.
� People volunteering for the fieldwork should be pre-screened for health and safety issues; field work is not for everyone.
� Assign experienced field teams to more challenging selected clusters (e.g., remote, potential safety issues, large number of surveys needed).

10 TPHA Journal Volume 68, Issue 1
Training � At least three hours of Just-in-Time training prior to the assessment is essential.
� Provide enough time to go over the sampling process (e.g., selecting households in the selected cluster), conducting the survey (e.g., questions, skip patterns), using the tracking form, logistics, and command structure.
� Solicit the participation of animal control and local law enforcement officers to identify potential safety concerns
� Train on safety plans, communication methods (e.g., cell, radio), and the importance of the check-in/check-out process.
Supplies
� Pre-identify the appropriate health education materials to distribute; reach out to local agencies for additional materials to distribute; ensure materials are in appropriate language.
� Prepared/standardized materials from outside organizations should be pre-screened to ensure consistent messaging.
� Allow enough time to copy/print at least 250 copies of educational materials for distribution.
� Equip field teams with plastic totes or other containers for supplies (i.e., survey forms, health education materials).
Local officials and media notification
� Notify law enforcement in advance of a CASPER being conducted so they can make security recommendations if necessary.
� Inform the media so that the community will be aware that public health teams may be in their neighborhood.
Communication methods � Develop a communications plan that includes, at a minimum, multiple communication methods (e.g., cell, radio) for field teams.
� Instruct teams to report to the command center at pre-determined times to ensure safety, report on progress, and address any potential issues.
� A mid-day in-person check-in can be helpful to monitor progress and team concerns.
Base camp, food and water � Plan early and confirm arrangements for the location of base camp.
� Ensure that wireless equipment is available at base camp.
� If possible, provide meals for the teams, using sack lunches or food coupons for local restaurants.
� Provide water and snacks to keep teams hydrated and nourished during the assessment, especially in disaster settings when food resources may be limited due to lack of electricity, road closures, etc.
Technical assistance � DSHS regional and central (Austin) offices offer exceptional remote or on-site technical assistance to local health departments in all CASPER phases and facets of their community assessment
� Local health departments are encouraged to use these DSHS resources to accelerate their CASPER planning and enhance the success of the assessment
� Requesting DSHS resources in a disaster setting should follow the normal emergency management resource request process.

TPHA Journal Volume 68, Issue 1 11
Phase 2. Conducting the CASPER Category Shared Knowledge/Lessons Learned Operations
� Set up base camp near survey area. � Two to three days of data collection is optimal. � Monitor teams’ progress; set up situation board
at the base camp to track number of interviews completed, number of houses approached, and identify safety issues.
� Deploy a logistics person to the field to address logistical issues (e.g., inoperable radio).
� Stress the need to review completed surveys and tracking sheets for accuracy while in the field.
� Conduct a general “hotwash” prior to demobilization; this “hotwash” will allow input from all participants. In addition, debriefing the interview teams when they return to the base camp will yield insights on field conditions, interviewer responses, and other issues.
� Send a web-based evaluation survey to all CASPER command and field staff a few days after the CASPER to obtain additional information on the assessment experience.
� Pre-identify at least two data entry staff. Data entry can begin as soon as field teams return from completion of clusters/interviews; this allows data entry personnel to obtain clarification and other information if needed.
Communications � Through the use of team captains and span of control, maintain communication (e.g., radio, cell, text messaging) with teams while in the field.
� Encourage the use of social media (e.g., Facebook, Instagram) before and during the CASPER on city/county webpages, and local news to increase awareness to the public, to reduce suspicion, and to keep field teams engaged.
Phase 3. Analyzing the Data Category Shared Knowledge/Lessons Learned Data analysis � Data analysis can be time-consuming, so having
a strong data analyst who understands the CASPER process and survey development is a definite advantage.
� Prior to analysis, data should be cleaned to identify outliers or extreme values.
� Epi Info can be used to conduct weighted analysis to account for the probability of selection; more information is available in the Centers for Disease Control and Prevention CASPER toolkit.
12 TPHA Journal Volume 68, Issue 1
Phase 4. Writing the Report and Sharing the Results Category Shared Knowledge/Lessons Learned Report writing and sharing � Field report writing should be started early;
drafting the introduction, background, methods, and table shells sections of the report can be done before teams return from the field.
� Utilize other CASPER field reports (whether published, presented, or shared) to help inform the structure, length, and content of the field report.
� Tailor the field report format (i.e., length, organization, and analyses) for intended audiences.
� Write the report using households as the unit of measurement rather than individuals. This point should be made early on to all those participating in planning of the CASPER (those developing database, questionnaire, etc). It will be easier to avoid making mistakes (survey questions worded for household, not individuals) and have data that can be analyzed, interpreted, and described appropriately.
� In a disaster response, it is optimal to have the field report completed within 48 hours after data collection.
� Share the report widely with public health officials, city and county officials, and the community.
� Present the information at professional meetings (i.e., public health preparedness meetings) and publish in peer-reviewed journals.
� Document the action taken (e.g., resources, support, messaging, future planning) as a result of the CASPER is essential.
routine public health issues. CASPER data have been used to allo-cate resources, provide information to support funding of projects, strengthen messaging, and improve future plans.
An important difference between CASPERs in disaster versus non-disaster settings is time. In the non-emergency CASPER setting, planning time is a luxury and allows for more planning activities to occur. This extra time may allow for ground truthing (a practice in which fi eld team leads drive through their selected clusters to iden-tify potential obstacles like gated housing communities or apartment complexes, presence of stray animals, neighborhoods under con-struction) and contacting access-controlled communities (i.e. gated neighborhoods or apartment complexes) beforehand to educate them about the planned CASPER and its importance, thus increasing the likelihood of access being granted to those households.
Two examples illustrate this point. First, in 2006 and 2007, the Hous-ton Health Department (HHD) conducted a series of non-disaster CASPER assessments, locally titled AIMs (Assessment, Interven-tion, and Mobilization). The nature of those non-disaster assessments allowed for extended planning timelines and extensive community involvement. These assessments identifi ed population and individual health needs, enhanced community partnerships, and provided in-formation that could be used to direct future activities. Beyond this, however, conducting non-disaster CASPERs allowed HHD staff to become well-versed in incident command structure, activation pro-cedures, and overall community assessment procedures. These expe-
riences served HHD well in 2008 when HHD conducted a disaster-based CASPER in the wake of Hurricane Ike. Staff familiarity with community assessments reduced the planning time needed to suc-cessfully execute a disaster-based CASPER.
Second, in 2014, the Fort Bend County Health & Human Services’ Public Health Emergency Preparedness Program began doing annual CASPERs. They choose one jurisdiction within their county a year to conduct a CASPER, surveying residents on preparedness levels and health. These data are being used for preparedness planning prior to when a real disaster occurs. They, like HDD, recognize the benefi ts of conducting non-disaster CASPERs as a foundation for preparing for a CASPER in response to a disaster incident.
In summary, as jurisdictions across Texas and the nation become trained on CASPER methods, we anticipate that more CASPERs will be conducted. We hope that these health departments and other organizations will use this shared knowledge, in conjunction with the CDC CASPER toolkit, to accelerate their CASPER planning and increase the potential success of their assessment. It is our desire that the CASPER community-of-practice will grow, and we expect ad-ditional lessons will be learned. REFERENCES1. Centers for Disease Control and Prevention (CDC). 2012. Community As-sessment for Public Health Emergency Response (CASPER) Toolkit: Second

TPHA Journal Volume 68, Issue 1 13
edition. Atlanta (GA): CDC. Available at: http://www.cdc.gov/nceh/hsb/di-saster/casper.htm. Accessed October 13, 2015. 2. Henderson RH, Sundaresan T. 1982. Cluster sampling to assess immuniza-tion coverage: a review of experience with a simplifi ed sampling method. Bulletin of the World Health Organization 60(2):253.3. Malilay J, Flanders WD, Brogan D. 1996. A modifi ed cluster-sampling method for post-disaster rapid assessment of needs. Bulletin of the World Health Organization 74(4):399.4. Horney J, Davis MK, Davis SE, Fleischauer A. 2013. An evaluation of community assessment for public health emergency response (CASPER) in North Carolina, 2003-2010. Prehospital and Disaster Medicine 28(02):94-98.5. Alfano-Sobsey E, Ledford SL, Decosimo K, Horney JA. 2014. Community health needs assessment in Wake County, North Carolina. North Carolina Medical Journal 75(6):376-383.6. Conley AM, Vagi S, Horney JA. 2014. Use of the community assessment for public health emergency response to conduct community health assess-ments for public health accreditation. Journal of Public Health Management and Practice 20(5):490-497.7. Horney JA, Moore Z, Davis M, MacDonald PD. 2010. Intent to receive pandemic infl uenza A (H1N1) vaccine, compliance with social distancing and sources of information in NC, 2009. PLoS One 5(6):e11226.8. Bayleyegn TM, Schnall AH, Ballou SG, Zane DF, Burrer SL, Noe RS, Wolkin AF. 2015. Use of community assessments for public health emergen-cy response (CASPERs) to rapidly assess public health issues - United States, 2003-2012. Prehospital and Disaster Medicine 30(04):374-381.
9. Malilay J, Heumann M, Perrotta D, Wolkin AF, Schnall AH, Podgornik MN, Simms EF. 2014. The role of applied epidemiology methods in the di-saster management cycle. American Journal of Public Health 104(11):2092-2102.10. Texas Department of State Health Services. 2011. Overview of CASPER activities 2009-2011. Available at: https://www.dshs.state.tx.us/commprep/disasterepi/casper/assessments.aspx. Accessed 13 November, 2015.11. Zane DF, Bayleyegn TM, Haywood TL, Wiltz-Beckham D, Guidry HM, Sanchez C, Wolkin AF. 2010. Community assessment for public health emer-gency response following Hurricane Ike - Texas, 25-30 September 2008. Pre-hospital Disaster Medicine 25(6):503-510.12. Perry M, Banerjee D, Slentz M, Sephen R, Liu L, Tran D, Mukkavilli S, Arafat RR. 2009. Hurricane Ike rapid needs assessment – Houston, Texas, September 2008. Morbidity and Mortality Weekly Report 58(38):1066-1071. Available at: http://www.cdc.gov/mmwr/preview/mmwrhtml/mm5838a3.htm. Accessed 13 November, 2015.13. Adams B. 2015. CASPER the friendly fl u assessment. 2015. Available at: http://www.azdhs.gov/documents/preparedness/epidemiology-disease-control/infectious-diseases-training/2015/wednesday-presentation-adams.pdf. Accessed 13 November 2015.14.Schnall A. September 30, 2015. Personal communication.

14 TPHA Journal Volume 68, Issue 1
The Effect of a Pilot Nutrition Education Intervention on Perceived Cancer Risk in a Rural Texas CommunityLiliana Correa, MS1, Debra B. Reed, PhD, RDN, LD2, Barent N. McCool, PhD3, Mary Murimi, PhD, RDN, LD2, Conrad Lyford, PhD4
1Former M.S. Nutritional Sciences Graduate Student, Texas Tech University, Lubbock, TX2Department of Nutritional Sciences, Texas Tech University, Lubbock, TX3Department of Hospitality and Retail Management, Texas Tech University, Lubbock, TX4Department of Agricultural & Applied Economics, Texas Tech University, Lubbock, TXCorrespondence to:Debra B. Reed, PhD, RDN, LD [email protected]
ABSTRACTBackground: A high consumption of fruits, vegetables, and whole grain foods and adequate levels of physical activity are associated with a lower risk of obesity and lower risk of lifestyle cancers. Re-search suggests that rural communities have a high risk of unhealthy behaviors that may contribute to excessive weight gain and risk of lifestyle related cancers. The purpose of this pilot study was to deter-mine the effect of an educational intervention in a rural Texas com-munity on the intermediate outcomes of eating behavior (increasing the intake of fruits, vegetables, and whole grain foods) and physical activity behavior, and the distal outcome of body mass index (BMI).Methods: The intervention, guided by the Social Cognitive Theory, was implemented over a 10-month period and included a variety of community-based education activities related to nutrition, physical activity, and cancer in a variety of settings. The effect of the inter-vention was assessed by analyzing pre- and post-data (N=67) using independent and paired samples t-tests and bivariate correlations. Results: Participants were mainly Hispanic (53.7%) and White (44.8%). At pre-intervention, 6% of participants reported consuming >5 servings of fruits and vegetables daily, 19.4% consumed >3 serv-ings of whole grain foods daily, and 85.1% were either overweight or obese. Only 31% of participants were aware that cancer risk was related to overweight at pre-intervention. At post-intervention, His-panics showed a signifi cant increase in the consumption of fruits and vegetables (p<0.05). Participation in sports or physical activity pro-grams showed a signifi cant increase (p<0.05). However, no signifi -cant decrease in BMI was shown. Conclusion: This intervention had a limited effect in increasing tar-geted behaviors and no effect on reducing BMI. More assessment is needed in this rural community to identify barriers to healthy behav-iors and to improve interventions to increase consumption of fruits, vegetables, and whole grain foods, levels of physical activity, and awareness of the cancer and obesity relationship. INTRODUCTIONDuring the last 20 years, there has been an increase in the rates of excessive weight in the U.S. population with more than 69% of the adult population classifi ed as overweight or obese.1 The increased rate of obesity and other chronic diseases, including cancer, is infl u-enced by behavioral changes in rural and urban populations.2-4 These changes include an increased intake of energy-dense foods that are high in saturated fat, trans fat, sugars, and salt, lower consumption of fruits, vegetables, and whole grain foods, and a lack of physical activity.2
Rural populations are at a higher risk of obesity and chronic diseases because they are more affected by unhealthy lifestyles and the lack of access to health care than urban populations.5 The prevalence of unhealthy lifestyles in rural populations is in part due to a lack of health-friendly environments. In health-friendly environments, per-sons have access to healthy, affordable food and nutrition informa-
tion, as well as to facilities, such as walking trails, which encourage participation in health activities.6,7 In addition, factors such as low educational and socioeconomic levels, low physical activity, high prevalence of obesity, and high smoking rates are associated with a negative health status among rural populations.8
Hispanics (42.5%) have the highest age-adjusted rates of obesity compared to non-Hispanic Whites (32.6%) and non-Hispanic Asians (10.8%) but are lower than Non-Hispanic Blacks (47.8%).1 Thus, except for non-Hispanic Blacks, Hispanics may be at greater risk for the development of obesity-related cancers of the colon, breast, kidneys, esophagus, pancreas, prostate, gallbladder, and liver.9 It has been estimated that up to one-third of the 589,430 cancer deaths ex-pected to occur in 2015 in the U.S. will be related to overweight or obesity, physical inactivity and poor nutrition.10 The cancer incidence rates for Hispanics in Texas during 2007-2011 were 412/100,000 for males and 325/100,000 for females; for Whites they were 532/100,000 males and 415/100,000 females; and for Blacks they were 583/100,000 males and 499/100.000 females.11 Although the cancer incidence rates for Hispanics are actually lower compared to other races, Hispanics are an important population to include in an educational intervention as they represent 38.6% of the total popula-tion and 31.8% of the rural population in Texas.12,13 In the 2010 U.S. Census, 19.3% of the total U.S. population was classifi ed as rural, and in Texas, 15.3% of the population was considered rural.14 Ap-proximately 18% of the rural U.S. population lives in poverty with Hispanic, Native American, and African-American populations hav-ing the highest percentage of poverty in both rural and urban com-munities.15
Approximately 40% of the Texas population reported consuming fruits less than one time daily, and 21.8% reported consuming vege-tables less than one time daily.16 Lutfi yya et al reported that rural pop-ulations were less likely than non-rural populations to consume fi ve or more daily servings of fruits and vegetables.6 Specifi cally, almost 79% of the U.S. rural population does not eat the recommended serv-ings of fruits and vegetables. Consumers are eating 6% more total grains than recommended but are eating only 34% of recommended amounts of whole grains.17 Fruits, vegetables, and whole grain foods are often not easily accessible and affordable by racial and ethnic minority groups in large urban centers or populations in rural areas.18 While research shows that increasing fruits, vegetables, and whole grains may help with weight management and cancer prevention,2 no rural intervention studies were found that addressed all of these targeted food groups in a single study. Further, while previous studies have used smaller rural food stores for the intervention setting,19,20 no studies were found that used a full-sized supermarket in combination with other settings for intervention within the rural community. Thus, a rural community in Texas was chosen for a multi-component pilot intervention that was delivered across several settings. It was hy-pothesized that participants in the intervention would increase their
TPHA Journal Volume 68, Issue 1 15
intake of fruits, vegetables, and whole grains and increase physical activity levels and that overweight/obesity levels (body mass index, BMI) would be reduced.
METHODSThis study was part of a Cancer Prevention Research Institute of Texas grant-funded project and was approved by the Texas Tech University Health Sciences Center’s Institutional Review Board for the Protection of Human Subjects. The pre-intervention data were collected during summer 2011, and post-intervention data were col-lected during spring 2012. The subjects were recruited from Mule-shoe, a rural community in West Texas. The population of Muleshoe is estimated to be 5,123 with more than 60% Hispanics.21
Study sampleParticipants were recruited using a variety of methods, including dis-tributing fl yers at the local supermarket, library, senior center, and churches. In addition, presentations about the study were made to the Chamber of Commerce, School Board, and Rotary and Lions service organizations. Outdoor electronic message boards at the schools dis-played information about the study. Any adult 18 years and older liv-ing in Muleshoe and willing to participate in this study was included, after they signed a consent form. Individuals who did not meet these requirements were excluded; no other screening criteria were used. Also, participants who did not participate in both data collections (pre- and post-intervention) were excluded from analyses in this study. Pre-intervention data were collected from 225 participants, with pre- and post-intervention data available for 67 participants. No data are available related to reasons for participant drop out.
InterventionParticipants received a 10-month intervention focused on encourag-ing participants to increase their consumption of fruits, vegetables, and whole grain foods and to increase their levels of physical ac-tivity. The 10-month intervention period was determined by the grant schedule and arrangements with the other community groups/settings. Table 1 shows the specifi c implementation settings and de-tails about the intervention’s content and timeline. This intervention differed from others in two aspects: 1) the focus was on a rural su-permarket as the primary site for the interventions; and 2) multiple “channels” throughout the community were used, with all interven-tions coordinated around the monthly themes refl ected on the posters placed in the supermarket.
The Social Cognitive Theory’s constructs of behavioral capability and self-effi cacy were used as the theoretical foundation for this in-tervention to change food and physical activity behaviors. Behav-ioral capability (knowledge and skill to perform a given behavior) was addressed by promoting fruit, vegetable, and whole grain intake in nutrition classes; handouts, fl yers, and videos; demonstration of new healthy recipes and traditional recipes that had been modifi ed with the targeted healthier ingredients; and food tastings.
Self-effi cacy (confi dence in one’s ability to take action and overcome barriers) was addressed in the classes and food preparation demon-strations and tastings by emphasizing that healthy, low-cost food can be easy to prepare, tasty, and cost less than fast food. Participants were presented with healthy options to be able to “make over” tra-ditional recipes and encouraged to discuss their ideas in class to ad-dress cultural barriers to change. To increase self-effi cacy in making healthier food choices at the supermarket, classes and store posters showed participants how to read food labels and how to use the su-permarket’s NuValTM system for evaluating the nutritional value of foods. As part of the broader weight management messaging, foods low in fat, sugar, and sodium were encouraged in addition to portion
control.
Class topics and educational materials related to physical activity included recommendations for amounts of daily physical activity to reduce weight (60 minutes) or maintain a healthy weight (30 min-utes). Low or moderate impact physical activities, such as walking, biking, gardening, and stretching were encouraged. The advantages to making the desired behavior changes (increase fruit, vegetable, and whole grain intake and increase physical activity) and the health effects of not making these changes were discussed in classes.
Most of the educational materials were obtained from the Ameri-can Institute for Cancer Research (AICR) and were available in both English and Spanish. Flyers and posters created specifi cally for this project were developed by the Registered Dietitians associated with this project and translated into Spanish by bilingual (English/Span-ish) graduate students who were familiar with the food and culture. However, as the intervention unfolded, less emphasis was placed on Spanish written materials as it was determined that while many of the Hispanic participants spoke Spanish and English, they were unable to read Spanish and relied on family members who were bilingual to interpret for them. The intervention activities were implemented by faculty and graduate students with a background in nutritional sciences. All classes were taught in English, with the exception of the classes conducted with Head Start parents, which were taught in Spanish.
MeasuresThis study was a pre-and post-intervention design with outcome measures of dietary intake, physical activity, and BMI. The Nutri-tion and Health Practices Survey included demographic questions from the Behavioral Risk Factor Surveillance System (BRFSS) 2010 Survey22 and questions on participants’ eating practices, attitudes re-garding cancer risk, and health practices. The survey was translated into Spanish by native Spanish speakers who were part of the project staff. It was pretested with 30 participants at a supermarket with a primarily Hispanic clientele in a suburban city about 70 miles from Muleshoe. In addition, the AIM-HI Fitness Inventory23 created by the American Academy of Family Physicians (AAFP) was used to collect data on participants’ dietary intake and physical activity. It was selected based on its use in various clinical settings and demo-graphic groups,23,24 ease of administration, face validity, and Spanish availability. Height and weight were measured by trained research staff and used to determine BMI. Participants received a $25 gift card from the local supermarket at both pre- and post- data collection.
Statistical Analysis Descriptive statistical analyses were performed to evaluate partici-pants’ demographic and physical characteristics at baseline. The de-pendent variables included were BMI, physical activity level, and intake of fruits, vegetables, and whole grain foods, while age, gender, race, language, marital status, income, education, and beliefs regard-ing cancer risk were independent variables. Independent and paired sample t-tests were used to compare the pre- and post-intervention change score of the variables tested. Bivariate analyses were used to determine the relationship between BMI, age, education, income, and physical activity with the participants’ reported consumption of fruits, vegetables, and whole grain foods. A p-value <0.05 was con-sidered statistically signifi cant. To perform the statistical analysis, IBM SPSS Statistics, version 21 was used.
RESULTSThe majority of the participants were older than 50 years (59.7%), fe-male (70.1%), married (59.7%), and spoke English as a fi rst language (85.1%) (demographic data not shown). Participants were predomi-

16 TPHA Journal Volume 68, Issue 1
nantly Hispanics (53.7%) and Whites (44.8%), had a high school education or less (71.6%) [elementary school 32.8% and high school 38.8%], and had an annual income of less than $20,000 (66.1%). After analyzing by race, it was found that 70.7% of the Hispanics had
Table 1. Implementation of intervention activities
Location Implementation Frequency
Supermarket Based
Food Product Tastings
Samples of a variety of foods (e.g. soups, salads, casseroles, desserts) prepared with healthy ingredients were offered to supermarket customers. Nutrition information and recipes were provided.
2 times per month for 10 months – products related to monthly themes
Posters Large posters reflecting healthy eating and healthy physical activity themes were placed strategically in the supermarket.
New posters placed each month for 10 months
NuValtm a and Healthy Food Markers
Healthy food markers were placed throughout the supermarket to supplement the supermarket’s NuValtm nutrition scoring system.
Markers moved monthly in support of poster themes
Community Based Classes
Community Center
Series of classes held in the evenings included food demonstrations and tastings and distribution of educational materials. Examples of class topics included weight management, recipe modification, portion distortion, reading food labels, and physical activity strategies.
Offered monthly for 10 months; 40 minutes long
Library Classes held as part of the library’s community education program – incorporated presentation and discussion; flyers and materials from American Institute for Cancer Research were placed in racks for patrons to take.
2 classes during the 10 month period
Head Start Center Classes presented to parents of children enrolled as part of their parent education program.
2 classes during the 10 month period
Health Fairs
High School Healthy eating and physical activity information provided at parents’ organization pre-football game dinner. Flyers promoting classes and events at the supermarket and community center were distributed.
1 time about mid-way through 10 month period
Senior Center Healthy eating and physical activity information provided; blood pressure, height, and weight measurements taken.
2 times during the 10 month period
Two Local Churches Healthy eating and physical activity information provided; blood pressure, height, and weight measurements taken.
1 time each during the 10 month period
Media
Television Interviews Project personnel interviewed about the project and the importance of healthy eating and physical activity by local TV station.
2 interviews during the 10 month period
Videos Videos of project activities prepared by local TV station. Videos were posted on TV station’s website, and videos could be viewed at any time during the project.
6 videos posted during the 10 month period
aNuValtm System summarizes comprehensive nutritional information in one number between 1 and 100 for each food in the supermarket (http://www.nuval.com/How ). The higher the NuValtm Score, the better the nutritional value. Approximately 30 supermarket chains nationwide use NuVal (http://www.nuval.com/location).
Table 2. Participants’ beliefs regarding cancer risk at pre- and post-intervention (N=67)
Pre Answered correctly
Post Answered correctly
Change Pre vs. Post p-valuea
% % % Drinking tap waterb 62.7 55.2 -7.5 0.058 Used of tanning beds 65.7 91.0 25.3 0.103 Getting sunburned 89.6 98.5 8.9 0.568 Being overweight 31.3 52.2 20.9 0.083 Drinking excessive quantities of alcohol 61.2 61.2 0.0 0.421
Chewing tobacco/using snuff 97.0 98.5 1.5 1.000
Smoking tobacco products 98.5 100.0 1.5 0.321 Drinking large quantities of caffeineb 28.4 32.8 4.4 0.083
a Paired samples t-test. b Not considered to cause cancer by the American Cancer Society and National Cancer Institut
an annual income of less than $20,000.
In Table 2, participants’ beliefs regarding cancer risk related to over-weight and selected behaviors are presented. At pre-intervention, there was much more awareness about the cancer risk related to the use of tobacco (97.0–98.5%) and getting sunburned (89.6%) when compared to the risk of being overweight (31.3%). While the aware-ness of cancer risk related to being overweight increased by 21% at post-intervention, this increase was not statistically signifi cant and was still well below the awareness levels of other risk factors.
At pre-intervention, participants had a mean BMI of 30.4±6.97, and 85.1% were either overweight or obese (37.3% overweight; 47.8% obese) (data not shown). Only 6% consumed fi ve or more servings of fruits and vegetables daily, and 19.4% consumed three or more servings of whole grain foods daily. There were no statistically sig-nifi cant differences found in fruit, vegetable, and whole grain food consumption from pre- to post-intervention. However, after ana-

TPHA Journal Volume 68, Issue 1 17
Table 3. Fruits and vegetables intake by race at pre- and post-intervention (N=66)
Race
White (n=30)
Change
White (W)
Pre vs. Post
p-valuea
Hispanic (n=36)
Change
Hispanic (H)
Pre vs. Post
p-valuea
W vs. H
Change p-
valueb
Pre Post Pre Post
mean ± standard deviation mean ± standard deviation Fruits and Vegetablesc
1.80±0.61 1.70±0.70 -0.10±0.84
0.522 1.33±0.53 1.63±0.68 0.30±0.67 0.010* 0.033*
n (%) 5 or more 3 (10.0) 4 (13.3) 1 (3.3) 1 (2.8) 4 (11.1) 3 (8.3) 3 to 4 18 (60.0) 13 (43.3) -5 (-16.7) 10 (27.8) 15 (41.7) 5 (13.9) 2 or less 9 (30.0) 13 (43.3) 4 (13.3) 25 (69.4) 17 (47.2) -8 (-22.2)
a White (pre vs. post) and Hispanic (pre vs. post) p values were calculated using paired samples t-test, *p <0.05. b White vs. Hispanic independent samples t-test. c Servings eaten a day; 1= 2 or less; 2= 3 to 4; 3= 5 or more
Table 4. Physical activity at pre- and post-intervention (N=67)
Characteristics
Times a week of physical activitya
Pre Post Change Pre vs. Post p-valueb
mean ± standard deviation Yard or housework 2.36±0.7
3 2.34±0.6
6 0.01±0.8
4 0.885
Walk ≥10 minutes 2.01±0.86
2.07±0.78
0.06±0.95
0.609
Sports or physical activity program
1.40±0.65
1.61±0.83
0.21±0.75 0.026*
a1= less than 1; 2= 1-3; 3= 4 or more. b Paired samples t-test. *p<0.05.
lyzing data by race, Hispanics showed a signifi cant increase in the consumption of fruits and vegetables at post-intervention (mean change 0.30+0.67; p<0.05) (Table 3). Participation in sports or phys-ical activity programs showed a signifi cant increase (mean change 0.21+0.75; p <0.05) from pre- to post-intervention (Table 4). No change was found in BMI from pre- to post-intervention.
Bivariate correlations between BMI and servings of fruits, veg-etables, and whole grain foods did not show signifi cant associa-tions (data not shown). However, signifi cant positive associations (p<0.05) were found among intake of fruits and vegetables and edu-cation level (r =0.26) and fruits and vegetables and income (r=0.31) at pre-intervention, but not post-intervention.
In our study, attendance was taken at the classes at the Community Center, but unfortunately only 10 of the 67 participants, for whom pre/post test data were available, attended these classes. The mean (standard deviation) number of classes attended by these 10 partici-pants was 5.10 (+1.97). Participants who attended the most classes did not have better outcomes than those who attended fewer classes (data not shown).
DISCUSSIONThis study examined the effect of a nutrition intervention on improv-ing eating behaviors, specifi cally those related to the intake of fruits, vegetables, and whole grains, and increasing physical activity in a ru-ral community of West Texas. These health behaviors are important in the prevention of obesity, cancer, and other chronic diseases.2, 25
The 2010 Census found that Hispanics (31.8%) and Whites (58.4%) were the most predominant races in rural Texas.13 In Muleshoe, per-centages were higher for Hispanics (53.7%) and lower for Whites (44.8%). Rural populations are more likely to live in poverty than urban populations, and Hispanics have the highest prevalence of poverty.14 Our fi ndings indicated that a majority of Muleshoe’s par-ticipants, especially Hispanic participants, were living below the poverty level. Limited income has been shown to affect a house-hold’s ability to purchase healthy foods.26
The prevalence of obesity is higher in rural populations who are more vulnerable to unhealthy lifestyles.27 Data from the 2005-2008 Na-tional Health and Nutrition Examination Survey (NHANES) showed that the prevalence of obesity was 39.6% among rural adults com-pared to 33.4% among urban adults.28 Rural populations’ increased likelihood to be obese was refl ected in this study as 47.8% of Mule-shoe participants were obese, compared to 34.9% in the total U.S. population.1 It was hypothesized that participants who received the
education intervention in our study would have lower BMI at post-intervention; however, this was not found. Similarly, Tussing-Hum-phreys et al conducted a multi-component, six-month church-based intervention (kickoff celebration followed by monthly, 60-minute educational sessions emphasizing increased intake of fruits, vege-tables, whole grains, and low fat dairy foods; a didactic physical ac-tivity session, and a self-directed physical activity component) with rural, lower Mississippi Delta African-American adults, and did not fi nd a signifi cant reduction in BMI.29 However, successful weight loss was reported for rural African-American women participating in a community-based intervention program conducted in churches in South Carolina.30 Since Muleshoe churches were receptive to one in-tervention session, they may be a good avenue for a continued higher dose of intervention.
From pre- to post-intervention, the percentage of participants who were aware that overweight is related to cancer risk increased from 31% to 52%; however, this increase was not statistically signifi cant and shows the need for additional education efforts related to over-weight as a factor that may increase cancer risk. A 2007 national cross-sectional study (n = 7452) found that 82-89% of respondents
across all races said they had never looked for information related to cancer prevention.31
In our study, it was hypothesized that participants who received the nutrition education intervention would have a signifi cantly higher mean intake of fruits, vegetables, and whole grains after the inter-vention. Most of the participants in Muleshoe reported a low con-sumption of fruits, vegetables, and whole grains at pre- and post-intervention. Although the consumption of fruits and vegetables was still low at post-intervention in the total sample, we found that Hispanics, not Whites, signifi cantly increased their consumption of fruits and vegetables. This racial difference was found also in a

18 TPHA Journal Volume 68, Issue 1
study that analyzed fruits and vegetables dietary behavior to assess the effects of a low-intensity, physician-endorsed intervention in a rural population, where the majority of participants were Whites or African-Americans. The authors found that for Whites there was not a signifi cant effect, but African-Americans increased their intentions compared to controls, at one and six months.32 In a systematic review of interventions designed to increase fruit and vegetable intake, the authors found that the largest effects of these interventions were ob-served among sub-groups of participants who were at a higher risk of disease, implying that these participants had increased motivation to improve their eating behaviors.33 In our study, Hispanics comprised 54% of the total participants, and 61% were considered obese at pre-intervention. Therefore, it is possible that participants perceived the need to lose weight, and thus they were motivated to increase their intake of fruits and vegetables. However, the motivation or strategies used by those who increased fruits and vegetables was not deter-mined.
In comparing our results related to changes in fruit, vegetable, and whole grain intake to other studies, similar fi ndings were reported for different intervention methods. A six-week community-based partic-ipatory research intervention to make the home environment more supportive of healthy eating and physical activity for rural adults of Southwest Georgia consisted of a tailored home environment pro-fi le, goal-setting, and behavioral contracting delivered through two home visits and two telephone calls.34 While intervention households reported signifi cant improvements in purchasing of fruit and vegeta-bles and family support for healthy eating and increased purchasing of exercise equipment and family support for physical activity rela-tive to comparison households, no signifi cant changes were observed for fruit and vegetable intake, physical activity, or weight between intervention and comparison households.
Tussing-Humphreys et al reported in their study with lower Missis-sippi Delta African-American adults that fruit, vegetable, and whole grain intake for both the intervention and control groups increased, but there were no signifi cant differences.29 However, they did fi nd that the high participation intervention group had signifi cant increas-es in these dietary outcome variables compared to the control group. They also found a positive effect of vehicle ownership on study com-pletion and attendance at intervention activities. Given the limited attendance at classes in our study, transportation and other barriers to classes should be explored in future work with the Muleshoe com-munity.
Additionally, it was hypothesized that the intervention would in-crease physical activity levels. A signifi cant increase in engagement in a sport or physical activity program on a regular basis was found and may indicate a socially acceptable way of increasing physical activity in this community. However, participants did not report signifi cant increases in yard or housework or walking from pre- to post-intervention. Previous research using a community-based ap-proach to promote walking in rural Missouri Caucasian and Black participants also did not fi nd a statistically signifi cant intervention ef-fect, although a positive net change in rates of seven-day total walk-ing in two subgroups (persons with a high school degree or less and persons living in households with annual incomes of <$20,000) was reported.35 Even so, walking has been determined as the most com-mon physical activity, especially in overweight, low income, and low education populations.36, 37 Thus, it would be helpful to determine barriers to walking in this rural community.
Study LimitationsOne limitation was the lack of a comparable control group, and therefore the positive changes seen may not be totally attributable
to the intervention. Also, while there were 225 participants at pre-intervention, only 67 provided survey data and anthropometrics at post-intervention, which limits the generalizability to all Muleshoe residents. Further, the small number of participants decreased the ability to detect changes in outcomes. Another limitation is that self-reported data were used to assess food intake and physical activity levels. In self-reported measures, participants have the tendency to under-report normal daily food intake and under- or over-estimate physical activity levels. This could be due to inaccurate memory, social desirability, or their inability to capture accurately their physi-cal activity and food intake.38, 39 Additionally, although the Aim-Hi Fitness Inventory has been used in a number of settings nationally, it was not validated or tested for reliability in this study population. Another limitation was that only individual factors were assessed and not environmental factors such as access to walking trails, qual-ity of food (food portions and nutritional value) sold in the com-munity venues other than the intervention supermarket, and food af-fordability, which could contribute to unhealthy behaviors. Although low-cost, healthy foods were promoted by the intervention, food insecurity was not assessed or addressed directly through activities or referrals.
Study StrengthsThis study has several strengths. First, limited data are available on rural interventions that include multiple components (diet and physi-cal activity) in a bi-racial rural population. Second, assessment tools and most educational materials were available both in English and Spanish, and recipes used in classes and materials refl ected the com-munity’s cultural groups. Third, height and weight were measured by trained staff, rather than using self-reported data, to increase validity. In addition, the data collected in this study helped to assess the BMI, eating habits, and physical activity status in this rural community that had not been studied before.
CONCLUSIONSIt is encouraging that Hispanics improved their intake of fruits and vegetables and that participation in physical activity programs in-creased in the total sample in this rural community. The interven-tion did not have a signifi cant effect in helping participants to reduce their BMI or increase intake of whole grain foods. The 21% increase in participants who were aware of the relationship between over-weight and cancer at post-intervention was a positive fi nding, but much improvement is still needed in knowledge and behavior. This study showed that the rural community of Muleshoe is at high risk of continued obesity and chronic diseases due to unhealthy behaviors and knowledge gaps. There is a need for additional assessment in this rural community to identify other possible barriers to healthy behaviors and to improve interventions to make them more success-ful. Focus group discussions or other forms of community partici-patory research could help further assess needs and promote more community ownership. Also, the sport and group activities results are promising and should be explored further.7
REFERENCES 1. Centers for Disease Control and Prevention. Overweight and Obesity 2015. Available at: http://www.cdc.gov/obesity/data/adult.html Accessed on Octo-ber 15, 2015.2. World Health Organization. Cancer. Fact sheet N° 297. Available at: http://www.who.int/mediacentre/factsheets/fs297/en/index.html Accessed on Octo-ber 15, 2015.3. Barnidge E, Radvanyi C, Duggan K, Motton F, Wiggs I, Baker E, Brown-son, R. Understanding and addressing barriers to implementation of envi-ronmental and policy interventions to support physical activity and healthy eating in rural communities. J Rural Health 2013;29(1):97-105. 4. Osuji T, Lovegreen S, Elliott M, Brownson R. Barriers to physical activity among women in the rural midwest. Women Health 2006;44(1):41-55.

TPHA Journal Volume 68, Issue 1 19
5. Jepson RG, Harris FM, Platt S, Tannahill C. The effectiveness of inter-ventions to change six health behaviours: a review of reviews. BMC Public Health 2010;10:538.6. Lutfi yya M, Chang L, Lipsky M. A cross-sectional study of US rural adults’ consumption of fruits and vegetables: do they consume at least fi ve servings daily? BMC Public Health 2012;12:280. 7. Whaley D, Haley P. Creating community, assessing need: preparing for a community physical activity intervention. Res Q Exerc Sport 2008;79(2):245-255.8. Jones C, Parker T, Ahearn M, Mishra A, Variyam J. Health Status and Health Care Access of Farm and Rural Population. U.S. Department of Agri-cultural Economics 2009;(EIB-57)72 pp.9. Anand P, Kunnumakkara A, Sundaram C, Harikumar B, Tharakan S, Lai O, Aggarwal B. Cancer is a preventable disease that requires major lifestyle changes. Pharm Res 2008;25(9):2097-2116.10. American Cancer Society. Cancer Facts & Figures 2015. Atlanta: Ameri-can Cancer Society. Available at: http://www.cancer.org/acs/groups/con-tent/@editorial/documents/document/acspc-044552.pdf Accessed on 10-28-2015.11. Texas Department of State Health Services. Texas Selected Can-cer Facts 2014. Available at: https://www.dshs.state.tx.us/tcr/statisticalData/2014FactSheets/Texas-Fact-Sheets-2014.aspx Accessed on October 15, 2015.12. U.S. Census Bureau. State and County Quick Facts 2014. Available at: http://quickfacts.census.gov/qfd/states/48000.html Accessed on October 15, 2015.13. Housing Assistance Council. Race and Ethnicity in Rural America 2012. Available at: http://www.ruralhome.org/storage/research_notes/rrn-race-and-ethnicity-web.pdf Accessed on October 15, 2015. 14. U.S. Census Bureau. 2010 Census Urban and Rural Classifi cation and Urban Area Criteria. Available at: http://www.census.gov/geo/reference/ua/urban-rural-2010.html Accessed on October 15, 2015.15. Housing Assistance Council. Rural poverty increases, while the U.S. poverty rate remains unchanged. Available at: http://www.ruralhome.org/storage/documents/rrbriefs/rrn_poverty_supplement_2013.pdf Accessed on October 15, 2015. 16. Centers for Disease Control and Prevention. 2013 State Indicator Re-port on Fruits and Vegetables. Available at: http://www.cdc.gov/nutrition/downloadsState-Indicator-Report-Fruits-Vegetables-2013.pdf Accessed on October 15, 2015. 17. U.S. Department of Agriculture. The U.S. Grain Consumption Landscape. Available at: http://www.ers.usda.gov/publications/err50/err50.pdf Accessed on October 15, 2015.18. Dunn RA, Sharkey JR, Lotade-Manje J, Bouhlal Y, Nayga RM. Socio-economic status, racial composition and the affordability of fresh fruits and vegetables in neighborhoods of a large rural region in Texas. Nutr J 2011;10:6.19. Bustillos B, Sharkey JR, Anding J, McIntosh A. Availability of more healthful food alternatives in traditional, convenience, and nontradi-tional types of food stores in two rural Texas counties. J Am Diet Assoc 2009;109(5):883-889.20. Gittelsohn J, Rowan M, Gadhoke P. Interventions in small food stores to change the food environment, improve diet, and reduce risk of chronic disease. Prev Chronic Dis 2012;9:110015. 21. Texas Tech University Health Science Center. Atlas of Rural and Com-munity Health. Demographic and Economics Maps 2010. Available at: http://www.gis.ttu.edu/center/Arch/Demography.html Accessed on October 15, 2015.22. Centers for Disease Control and Prevention. 2010 Behavioral Risk Fac-tor Surveillance System Survey Questionnaire. Available at: http://www.cdc.gov/brfss/questionnaires/index.htm Accessed on October 15, 2015.23. McAndrews J, McMullen S, Wilson S. Four strategies for promoting healthy lifestyles in your practice. Fam Pract Manag 2011;18(2):16-20.24. Pace DW, Lanigan MA, Staton WE, Graham GD, Manning KB, Dick-inson ML, Emsermann BC, Stewart EE. Effectiveness of 2 methods of promoting physical activity, healthy eating, and emotional well-being with the Americans in Motion - Healthy Interventions Approach. Ann Fam Med 2008;11(4):371-380.25. Wang X, Ouyang Y, Liu J, Zhu M, Zhao G, Bao W, Hu FB. Fruit and vegetable consumption and mortality from all causes, cardiovascular disease, and cancer: systematic review and dose-response meta-analysis of prospec-tive cohort studies. BMJ 2014;349:g4490. 26. Larson NI, Story MT, Nelson MC. Neighborhood environments: dispari-ties in access to healthy foods in the U.S. Am J Prev Med 2009;36(1):74-81.
27. Wilson S, Gallivan A, Kratzke C, Amatya A. Nutritional status and socio-ecological factors associated with overweight/obesity at a rural-serving US-Mexico border university. Rural Remote Health 2012;12(4):2228.28. Befort C, Nazir N, Perri M. Prevalence of obesity among adults from rural and urban areas of the United States: fi ndings from NHANES (2005-2008). J Rural Health 2012;28(4):392-397. 29. Tussing-Humphreys HL, Thomson JL, Mayo T, Edmond E. A church-based diet and physical activity intervention for rural, lower Mississippi Delta African American adults: Delta Body and Soul effectiveness study, 2010-2011. Prev Chronic Dis 2013;10:120286.30. Parker GV, Coles C, Logan NB, Davis L. A community-based weight loss intervention program for rural African American women. Fam Community Health 2010;33(2):133-143.31. Davis J, Buchanan K, Green B. Racial/ethnic differences in cancer pre-vention beliefs: applying the health belief model framework. Am J Health Promot 2013;27(6):384-389. 32. Carcaise-Edinboro P, McClish D, Kracen A, Bowen D, Fries E. Fruit and vegetable dietary behavior in response to a low-intensity dietary intervention: the rural physician cancer prevention project. J Rural Health 2008;24(3):299-305.33. Pomerlau J, Lock K, Knai C, McKee M. Interventions designed to in-crease adult fruit and vegetable intake can be effective: a systematic review of the literature. J Nutr 2005;135(10):2486-2495.34. Kegler CM, Alcantara I, Veluswamy JK, Haardorfer R, Hotz AJ, Glanz K. Results from an intervention to improve rural home food and physical activity environments. Prog Community Health Partnersh 2012;6(3):265-277.35. Brownson R, Baker E, Boyd R, Caito N, Duggan K, Housemann R, Wal-ton D. A community-based approach to promoting walking in rural areas. Am J Prev Med 2004;27(1):28-34.36. Brownson RC, Jones DA, Pratt M, Blanton C, Heath GW. Measuring physical activity with the behavioral risk factor surveillance system. Med Sci Sports Exerc 2000;32(11):1913-1918.37. Eyler AA, Brownson RC, Bacak SJ, Housemann RA. The epidemiology of walking for physical activity in the United States. Med Sci Sports Exerc 2003;35(9):1529-1536.38. Prince SA, Adamo KB, Hamel ME, Hardt J, Gorber SC, Tremblay M. A comparison of direct versus self-report measures for assessing physical activ-ity in adults: a systematic review. Int J Behav Nutr Phys Act 2008;5:56. 39. Seale JL. Predicting total energy expenditure from self-reported dietary records and physical characteristics in adult and elderly men and women. Am J Clin Nutr 2002;76(3):529-534.

20 TPHA Journal Volume 68, Issue 1
ABSTRACTObjective: To identify predictors of perineal laceration in women de-livering in a large county located on the Texas-Mexico border.Methods: A retrospective cohort study of women who delivered vag-inally in El Paso, Texas, between February 2007 and May 2010 was conducted. The majority of the women delivered at the University Medical Center of El Paso, a teaching hospital. Eighty-three deliver-ies to 78 women were included in the sample. Adjusted relative risks (RR) and p-values were calculated using log-binomial regression models. Generalized estimating equations were used to account for the fact that some patients contributed two deliveries to the sample.Results: Patients ranged in age from 15 to 29 years (median=18 years). The majority (75.9%) were primiparous. Approximately half the cohort (n=41, 49.4%) experienced a perineal laceration. Infant head circumference, birth weight, maternal age, and maternal body mass index (BMI) were not associated with the risk of a perineal laceration. Women who were delivered by a physician compared to those who were delivered by a certifi ed nurse midwife appeared to have a higher risk of perineal laceration (adjusted RR=1.58, p=0.07); however, further modeling revealed a higher p-value (0.09) for this variable. Primiparous women were twice as likely as multiparous women to have experienced a perineal laceration (adjusted RR=2.16, p=0.048).Conclusions: Nulliparity is an established risk factor for perineal laceration. Our study supports this observation. Keywords: Perineal laceration, parity, generalized estimating equa-tions
INTRODUCTIONPerineal lacerations are a recognized obstetrical complication. The portion of the perineum involved in perineal lacerations is the region between the vagina and anus. It is in this area that the levator ani, the superfi cial transverse perineal muscle, the bulbocavernosus muscle, and the external anal sphincter muscle all meet upon a central tendon, thus forming the perineal body.
Perineal tears of childbirth occur with varied severity, ranging from involvement of only the most superfi cial vaginal mucosa all the way to including injury to the anal sphincter. A degree system is used to classify the severity of a laceration. First-degree tears involve only the vaginal mucosa and/or perineal skin. Second-degree tears involve the underlying fascia and musculature. Third-degree lacera-tions involve disruption of the external anal sphincter. Lastly, fourth-degree tears entail laceration of both the external and internal anal sphincters, so that the anorectal passage is exposed.1 Third- and fourth-degree lacerations are known as higher-order lacerations.2
The frequency of higher-order lacerations ranges from 0.25 to 6%.2
Complications of perineal lacerations include a spectrum of disor-ders: stress incontinence, overactive bladder, pelvic organ prolapse, and anal incontinence.3
Predictors of Perineal Laceration in Women Delivering on the Texas-Mexico BorderJami Barnard, MD1, Elizabeth Portugal, MSN, CNM1, Loretta L. Hernandez, MPH1, Zuber D. Mulla, MSPH, PhD, CPH1,2
1Department of Obstetrics and Gynecology, Paul L. Foster School of Medicine, Texas Tech University Health Sciences Cen-ter at El Paso, El Paso, Texas2Department of Public Health, Graduate School of Biomedical Sciences, Texas Tech University Health Sciences Center, Lubbock, TexasCorrespondence to:Zuber D. Mulla, PhDPhone: [email protected]
Acknowledgments: This study was supported in part by the Department of Obstetrics and Gynecology, Texas Tech Univer-sity Health Sciences Center at El Paso, El Paso, Texas.
Nulliparity has been established as a risk factor for perineal lacera-tion.4-6 Other possible risk factors include infant birth weight, opera-tive delivery, maternal age, and a prolonged second stage of labor.4,5,7 Increased maternal body mass index (BMI) has been reported to be protective against third- and fourth-degree laceration.5
As clinicians can attest, a commonly voiced concern of expectant mothers surrounding childbirth is the fear of “tearing”. This was es-pecially the case when birth fears were discussed in CenteringPreg-nancy® childbirth preparation sessions for teenage mothers held at our institution which is located along the Texas, USA-Mexico border (unpublished data). CenteringPregnancy® is a group model of pre-natal care in which group members receive standard of care prenatal health care in a group setting that facilitates the delivery of health ed-ucation while fostering a support network.8 The fear of tearing is not unfounded as less than 50% percent of women giving birth maintain an intact perineum.3,9 Our goal was to examine the effect of infant head circumference, birth weight, maternal age, maternal BMI, ob-stetrical care provider [certifi ed nurse midwife (CNM) versus physi-cian], and parity on the risk of perineal laceration in a predominantly Hispanic county located on the Texas-Mexico border.
METHODSApproval to conduct this retrospective cohort study was granted by the Institutional Review Board for the Protection of Human Subjects at Texas Tech University Health Sciences Center (TTUHSC) in El Paso, Texas.
Source population and inclusion criteriaThe study sample was derived from a cohort of 87 patients who at-tended CenteringPregnancy® sessions at TTUHSC in El Paso and delivered vaginally. While our CenteringPregnancy® program en-rolled both low- and high-risk patients, the majority of the pregnan-cies were low risk and none of the subjects included in the current analysis were high risk. Participation in CenteringPregnancy® was voluntary. The majority of the women in our study delivered at TTUHSC El Paso’s primary teaching hospital, the University Medi-cal Center of El Paso. The cohort delivered between February 2007 and May 2010. Eighty of the 87 patients delivered once during the study period while seven patients delivered twice; hence, the source cohort contained 94 records.
Patients whose delivery was attended by both a CNM and a physi-cian were excluded from our analysis. A total of 83 patient records had complete information for the independent variables and the outcome of interest (perineal lacerations). Seventy-three of these patients had delivered once during the study period while fi ve had delivered twice. Our analyses were restricted to this sample of 83 records.

TPHA Journal Volume 68, Issue 1 21
Data analysisData were analyzed using SAS 9.3 software (SAS Institute, Inc., Cary, North Carolina). The dichotomous outcome of interest was a perineal laceration of any degree: occurrence of a laceration versus no laceration. Initially, frequency distributions of the risk factors of interest were examined along with 2 x 2 contingency tables. No zero cell values were observed.
Log-binomial regression was performed by specifying a binomial distribution and a log link within the GENMOD procedure.10 Two models were built. First, the following six dichotomous exposure variables were entered in the model: maternal BMI (≥25 vs. <25 kg/m2), parity (primiparous vs. multiparous), provider (delivered by a physician vs. CNM), birth weight (≥3000 vs. <3000 grams), mater-nal age (≥19 vs. <19 years), and infant head circumference (greater than the sex-specifi c 50th percentile found in the United States Cen-ters for Disease Control and Prevention growth charts vs. less than or equal to the 50th percentile). For male newborns the 50th percentile value for head circumference is 35.8 cm while for female newborns it is 34.7 cm.11 Given the low ratio of outcome events to the number of independent variables, a reduced model was also fi t.12 In the second model only the following key risk factor variables were entered: par-ity, provider, and infant head circumference.
It is possible that collinearity was present in one or both of our re-gression models. Collinearity is a harmful level of correlation be-tween the independent variables. Tolerances were calculated using logistic and linear regression models in an effort to diagnose multi-collinearity.13
Five patients delivered twice during the study period and hence con-tributed two records to the sample rather than one. These pairs of response (outcome) values are most likely negatively correlated; that is, a woman is typically more likely to experience a perineal lacera-tion delivering her fi rst child than her second child. To account for the correlated nature of the data, generalized estimating equations (GEE) were utilized.14,15 Initially an exchangeable working corre-lation matrix was specifi ed for both the full and the reduced GEE log-binomial regression models; however, due to warnings and er-rors issued by the SAS program, an independent working correlation matrix was subsequently used. Our choice of an independent rather than exchangeable working correlation structure was also motivated by the assumption that the binary responses within the fi ve pairs of women were most likely negatively rather than positively correlated, an hence an independent rather than exchangeable working correla-tion structure was appropriate given the study by Hanley et al.16 Ad-justed risk ratios (RR), 95% confi dence intervals (CI), and p values were calculated.
RESULTSA total of 83 vaginal deliveries to 78 women were included in the sample. The patients ranged in age from 15 to 29 years with 60.2% of the cohort being under 19 years of age (Table 1). Only two of the 83 infants weighed 4000 or more grams at birth (data not shown). Approximately 40% of the patients had been delivered by a CNM. The majority of the women were primiparous.
Adjusted RRs are shown in Table 2. Two log-binomial regression models were fi tted. Collinearity was not detected in either of the models (data not shown). The fi rst contained the six independent variables that were of clinical or epidemiological interest. The second model contained only three of these variables. In Model 1, women who were delivered by physicians appeared to be 58% more likely than those delivered by CNMs to experience a perineal lac-eration; however, the result was not statistically signifi cant (p=0.07). Parity was not a risk factor in Model 1 but was a signifi cant predictor of the outcome in Model 2: primiparous patients were twice as likely
as multiparous patients to have a perineal laceration (p=0.048).
DISCUSSIONAs women prepare for childbirth, concerns regarding perineal lac-eration abound. Obstetrical providers might be aided in antepartum discussions regarding apprehensions surrounding childbirth with in-formation on risk factors for perineal laceration. Additionally, seek-ing to lessen obstetrical complications, practitioners would be better able to serve their patients if perineal laceration risks were not only identifi able but also modifi able. In general there has not been much study in the United States on the risk factors for perineal laceration and most of the existing literature almost exclusively involves risks for third- and fourth-degree lacerations.
In congruence with the existing literature, this study found that nulliparity is a risk factor for perineal laceration, with primiparous women being twice as likely as multiparous women to have experi-enced a perineal laceration.4-6 Consistent with previous studies, ap-proximately half of all women in our sample experienced a perineal laceration during childbirth.3,9
Infant head circumference, birth weight, maternal age, and maternal BMI were not associated with the risk of a perineal laceration. A previous study proposed that the BMI-to-birth weight ratio may be a better predictor of severe perineal laceration risk than either birth weight or BMI alone. More research into the interaction between these variables is warranted.17
Obstetrical provider type (CNM compared with physician) was not found to be signifi cantly associated with an increased risk of perineal laceration. The involvement of a physician in the delivery might have indicated the need for urgent delivery, as in the situation of a wor-risome fetal monitoring strip, in which case allowing more time for the stretching of perineal tissues in hopes of avoiding laceration may not have been medically advisable for fetal well-being. Information regarding the use of operative delivery methods (vacuum and for-ceps) was not included in the study. Other studies which controlled for the use of operative delivery have found that patients delivered by CNMs were less likely to experience perineal laceration.18
Table 1. Selected Characteristics of 83 Vaginal Deliveries That Occurred in El Paso County, Texas, Between February 2007 and May 2010. Seventy-Three Patients Delivered Once while Five Patients Delivered Twice.
Characteristic
N=83
Number (%) Infant Birth weight ≥3000 g 62 (74.7) Head circumference greater than the sex- specific 50th percentile found in the CDC* growth charts† 13 (15.7) Maternal Age (y)‡ <19 50 (60.2) ≥19 33 (39.8) Body mass index ≥25 kg/m2 18 (21.7) Delivery provider Certified nurse midwife 33 (39.8) Physician (resident or attending) 50 (60.2) Parity Primiparous 63 (75.9) Multiparous 20 (24.1) Perineal laceration Yes 41 (49.4) No 42 (50.6)
* CDC: Centers for Disease Control and Prevention. † 50th percentiles for male and female newborns are 35.8 and 34.7 cm, respectively. ‡ Patients ranged in age from 15 to 29 years with a median of 18 years.

22 TPHA Journal Volume 68, Issue 1
Table 2. Adjusted Relative Risks (RR) for a Perineal Laceration in 83 Vaginal Deliveries (73 Patients Delivered Once while Five Patients Delivered Twice). RRs, 95% Confidence Intervals (CI), and p Values are from GEE* Log-Binomial Regression Models. Model 1 Model 2
Possible risk factor RR 95% CI p RR 95% CI p Infant Birth weight (grams) ≥3000 1.57 0.83-2.94 0.16 - - - <3000 1 (Referent) - - - - Infant head circumference > CDC† sex-specific 50th percentile 1.06 0.69-1.63 0.77 1.20 0.77-1.85 0.42 ≤ CDC† sex-specific 50th percentile 1 (Referent) - 1 (Referent) - Maternal Maternal age (years) ≥19 0.99 0.61-1.62 0.98 - - - <19 1 (Referent) - - - - Maternal body mass index (kg/m2) ≥25 1.11 0.73-1.68 0.62 - - - <25 1 (Referent) - - - - Delivery provider Physician 1.58 0.96-2.60 0.07 1.53 0.94-2.52 0.09 Certified nurse midwife 1 (Referent) - 1 (Referent) - Parity Primiparous 2.14 0.94-4.88 0.07 2.16 1.01-4.65 0.048 Multiparous 1 (Referent) - 1 (Referent) -
* Generalized estimating equations. † Centers for Disease Control and Prevention growth charts.
Approximately 80% of the population in El Paso, Texas, is of His-panic or Latino origin.19 Our investigation is, to our knowledge, the fi rst of its kind to have focused on young Latinas living on the border of Texas and Mexico. Furthermore, we used an appropriate tech-nique (GEE) to account for any correlation in the outcome given the fact that fi ve women each contributed two deliveries to the sample. Our investigation illustrates the point that the exchangeable working correlation matrix is not always the best choice when using GEE.16
Human error, a confounder that could not be accounted for, is another limitation of our study. Information regarding perineal laceration, tear classifi cation, and infant measurements all depend on human as-sessment and transcription accuracy. Our study did not collect in-formation on fetal head position at the time of delivery and several other factors that may infl uence the risk of perineal laceration such as operative vaginal delivery and a prolonged second stage of labor. A study of vacuum-assisted deliveries found that an occiput posterior position (versus an occiput anterior position) was associated with an increased risk of anal sphincter injury.20
Another possible limitation is the lack of information as to anesthe-sia involvement in delivery. Often patients are said to be unable to push effectively when epidurals are heavy. Might this effect also predispose to perineal lacerations if repeated pushing against tissues without progress allows time for infl ammation to become more severe? A study of risk factors for perineal laceration in un-medicated childbirth compared to women with medicated births to assess whether sensation of the birthing passages and processes has any effect on perineal laceration occurrence and/or severity may be warranted. Previous studies have suggested an increased risk of op-erative delivery with epidural versus non-epidural labor pain relief,21
and operative delivery has been associated with an increased risk of third-degree and fourth-degree laceration.5
Because our study only included patients who participated in the CenteringPregnancy® program, it has limited generalizability (ex-ternal validity). To clarify, this study is only representative of women who received regular group prenatal care. Additionally, our patients delivered at a teaching hospital which may further limit the general-izability of our results. Finally, our study was hampered by a small sample size. Several of our null fi ndings may be due to a lack of
power; however, if one applies the binary logistic regression sample size rule of ten outcome events per predictor variable,12 then our sec-ond regression analysis was adequately powered. Forty-one women experienced the outcome of interest. This fi gure divided by ten is 4.1. The number of predictor variables should be four or less. Our second model contained three predictor variables. The sample size directive cited above is a rule of thumb and may be too conserva-tive.22
As women in this prenatal care program are prescribed prenatal vi-tamins and nutrition is discussed as part of the learning sessions, it would be interesting to see if nutritional status plays a role in the risk for perineal laceration. A literature review did not reveal any studies that addressed the relationship between nutritional status and peri-neal tissue integrity in childbirth. It has been observed that people with higher intake of fats have increased skin elasticity.23 Previous studies have noted that women with increased striae gravidarum are at increased risk of perineal tear.24,25
In conclusion, nulliparity is an established risk factor for perineal laceration; however, further study is needed to identify maternal and provider-related risk factors that are readily modifi able. Advance-ments in not only risk prediction but also risk modifi cation and peri-neal support measures during labor will lessen the morbidity that results from perineal body disruption.
REFERENCES 1. Cunningham FG, Leveno KJ, Bloom SL, Hauth JC, Rouse DJ, Spong CY. Williams Obstetrics. 23rd ed. New York: McGraw-Hill; 2010.2. Cunningham F, Leveno KJ, Bloom SL, Spong CY, Dashe JS, Hoffman BL, Casey BM, Sheffi eld JS. Chapter 27 Vaginal Delivery. In: Cunningham F, Leveno KJ, Bloom SL, Spong CY, Dashe JS, Hoffman BL, Casey BM, Shef-fi eld JS. eds. Williams Obstetrics, Twenty-Fourth Edition. New York, NY: McGraw-Hill; 2013. http://accessmedicine.mhmedical.com/content.aspx?bookid=1057&Sectionid=59789168. Accessed November 02, 2015.3. Handa VL, Blomquist JL, McDermott KC, Friedman S, Munoz A. Pelvic fl oor disorders after vaginal birth: effect of episiotomy, perineal laceration, and operative birth. Obstet Gynecol. 2012;119:233-239.4. Groutz A, Cohen A, Gold R, et al. Risk factors for severe perineal injury during childbirth: a case–control study of 60 consecutive cases. Colorectal Dis. 2011; 13:e216–e219. 5. Landy HJ, Laughon SK, Bailit JL, et al. Characteristics associated with severe perineal and cervical lacerations during vaginal delivery. Obstet Gy-necol. 2011;117:627-635.6. Meyvis I, Van Rompaey B, Goormans K et al. Maternal position and other variables: effects on perineal outcomes in 557 births. Birth. 2012;39:115–120. 7. Rouse DJ, Weiner SJ, Bloom SL et al. Second-stage labor duration in nul-liparous women: relationship to maternal and perinatal outcomes. Am J Ob-stet Gynecol. 2009;201:357.e1–e7.8. Centering Pregnancy Overview. Centering Healthcare Institute Web Site. http://www.centeringhealthcare.org. Accessed April 10, 2013.9. da Silva FM, de Oliveira SM, Bick D, Osava RH, Tuesta EF, Riesco ML. Risk factors for birth-related perineal trauma: a cross-sectional study in a birth centre. J Clin Nurs. 2012;21:2209–18. 10. Robbins AS, Chao SY, Fonseca VP. What's the relative risk? A method to directly estimate risk ratios in cohort studies of common outcomes. Ann Epidemiol. 2002;12:452-454.11. Centers for Disease Control and Prevention. Data Table of Infant Head Circumference-for-age Charts. Available at http://www.cdc.gov/growth-charts/html_charts/hcageinf.htm. Accessed March 7, 2013.12. Peduzzi P, Concato J, Kemper E, Holford TR, Feinstein AR. A simulation study of the number of events per variable in logistic regression analysis. J Clin Epidemiol. 1996;49:1373-1379.13. Allison PD. Logistic Regression Using the SAS® System: Theory and Application. Cary, North Carolina: SAS Institute, Inc.; 1999.14. Hanley JA, Negassa A, Edwardes MD, Forrester JE. Statistical analysis of correlated data using generalized estimating equations: an orientation. Am J Epidemiol. 2003;157:364-375.15. Cole SR. Analysis of complex survey data using SAS. Comput Methods Programs Biomed. 2001;64:65-69.16. Hanley JA, Negassa A, Edwardes MD. GEE analysis of negatively cor-

TPHA Journal Volume 68, Issue 1 23
related binary responses: a caution. Stat Med. 2000;19:715-722.17. Schwartz N, Seubert DE, Mierlak J, Arslan AA. Predictors of severe peri-neal lacerations in Chinese women. J Perinat Med. 2009;37:109–113.18. Browne M, Jacobs M, Lahiff M, Miller S. Perineal injury in nulliparous women giving birth at a community hospital: reduced risk in births attended by certifi ed nurse-midwives. J Midwifery Womens Health. 2010;55:243-249.19. United States Department of Commerce. United States Census Bureau Web Site. www.quickfacts.census.gov. Accessed April 14, 2013.20. Wu JM, Williams KS, Hundley AF, Connolly A, Visco AG. Occiput pos-terior fetal head position increases the risk of anal sphincter injury in vacuum-assisted deliveries. Am J Obstet Gynecol. 2005;193:525-528.21. Anim-Somuah M, Smyth RM, Jones L. Epidural versus non-epidural or no analgesia in labour. Cochrane Database Syst Rev. 2011;12:CD000331.
22. Vittinghoff E, McCulloch CE. Relaxing the rule of ten events per variable in logistic and Cox regression. Am J Epidemiol. 2007;165:710-71823. Nagata C, Nakamura K, Wada K et al. Association of dietary fat, veg-etables and antioxidant micronutrients with skin ageing in Japanese women. Br J Nutr. 2010;103:1493-1498.24. Wahman AJ, Finan MA, Emerson SC. Striae gravidarum as a predictor of vaginal lacerations at delivery. South Med J. 2000;93:873-876.25. Halperin O, Raz I, Ben-Gal L, Or-Chen K, Granot M. Prediction of peri-neal trauma during childbirth by assessment of striae gravidarum score. J Obstet Gynecol Neonatal Nurs. 2010;39:292-297.

24 TPHA Journal Volume 68, Issue 1
On November 18, 2015, the Department of State Health Services (DSHS) in Austin, Texas, hosted GIS Day, where presentations were given and posters displayed that described the importance and utility of GIS (Geographic Information Systems) analyses in public health.
Following is a list of presentations from GIS Day. For more infor-mation on particular presentations, please contact Alassane Barro at [email protected].
1. ESRI Open HealthJoseph Bowles - ESRI
2. Planning Partnerships for Picturing Population HealthSusan Millea - Children's Optimal Health (COH)
3. Discovering and Understanding Disease Patterns at the In-tersection of GIS and Public HealthAlassane Barro - DSHS
4. Using MODIS Land Surface Temperature Data to Predict West Nile Virus OccurrenceLeon Kincy - DSHS
5. Geocaching
Following are abstracts of some of the presentations and posters from GIS Day. For more information on particular abstracts, please con-tact the corresponding author at the email provided.
1. Planning Partnerships for Picturing Population HealthSusan Millea, PhD, MSWChildren's Optimal [email protected]
The purpose of the presentation is to promote stronger development of data partnerships to improve population health. Brief reference to the research context will be provided, followed by a description of the processes used by Children's Optimal Health to partner with multiple organizations across sectors to acquire and use data pur-posefully. Several examples of maps will be used to demonstrate a variety of issues pertinent to the use of mapping to improve com-munity outcomes. The presenter will refl ect on concerns about 'new information/communication silos' and ways to address them.
2. Evaluation of the HTML5 Geolocation API Using Mobile DevicesBradley Hicks, BS1, Tim Algeo, PhD1, Justin Fischer, MS1
1USDA APHIS Wildlife [email protected]
The World Wide Web Consortium (W3C) published the Geoloca-tion Application Programming Interface (API) Specifi cation in July 2014 which allows developers to have confi gurable access to the geographical location of a device through HMTL scripting. Combin-ing the current version of HTML5 and scripting with the Geolocation API provides suffi cient opportunity for development of mobile data collection applications that utilize geographical information. The purpose of this evaluation was to determine if various network con-fi gurations (cellular, WiFi, and disconnected) on select iOS and An-droid mobile devices affect the accuracy, defi ned here as the shortest mean Euclidean distance to a fi xed location, reported by a HTML5 implementation of the Geolocation API.
3. Modifi ed Retail Food Environment Index Maps by Census Tract in Bexar and Smith Counties, Texas, 2015Haruna Miyakado, MS1, Erin Wu, MPH1, Nimisha Bhakta, MPH1
1Texas Department of State Health [email protected]
Food deserts have been defi ned as “areas that lack access to afford-able fruits, vegetables, whole grains, low-fat/non-fat milk or dairy alternatives, and other foods that make up the full range of a healthy diet.” Food swamps have been defi ned as “areas in which large rela-tive amounts of energy-dense snack foods, inundate healthy food options.” CDC created the modifi ed retail food environment index (mRFEI) that combines the concepts of “food desert” and “food swamp” into a single measure. The mRFEI measures the relative number of healthy and less healthy food retailers within census tracts. Food retail data source as of January 2015 was obtained from Environmental Systems Research Institute. National scheme, North American Industry Classifi cation Codes were referenced to identify specifi c types of food retailers. Healthy vendors were supermarkets with 50 or more employees or grocery stores with 10 to 49 employ-ees, fruit and vegetable markets, and warehouse clubs, and less healthy vendors were fast food restaurants, pizza restaurants, conve-nience stores, and small grocery stores with 1 to 3 employees within census tracts or a half mile from the tract boundary. 270 healthy food vendors and 4811 less healthy food vendors were included to calcu-late mREFI in Bexar County. 30 healthy food vendors and 379 less healthy food vendors were included to calculate mREFI in Smith County. mRFEI ranged from 0 to 50 for each census tract and from 0 to 40 for each census tract in Bexar and Smith County, respectively and all of them were successfully visualized.
4. Fleaborne Typhus in Texas (2003-2013)Nicole Evert, MS1; Bonny Mayes, MA1
1Texas Department of State Health [email protected]
Fleaborne (“Murine”) typhus is a rickettsiosis caused by Rickettsia typhi or R. felis, bacteria that can be transmitted by infected fl eas harbored by rats, opossums, cats, dogs and other small mammals. The disease is similar to louseborne typhus (R. prowazekii) but is generally milder. Disease onset is often sudden and symptoms may include fever, headache, chills, weakness, nausea, malaise, myalgias, and a macular rash. In the contiguous United States, this disease oc-curs primarily in California and Texas, where it is a notifi able condi-tion. From 2003 to 2013, there were 1,764 cases of fl eaborne typhus. The majority (>80%) of these cases occurred in South Texas but ap-pear to be expanding into the Gulf Coast counties. In this poster, we will summarize patient demographics, clinical disease presentation, morbidity and mortality, risk factors, seasonality, and diagnosis/case determination challenges.
5. Visualizing the HIV Care Continuum in Austin, TexasSonia Arbona, PhD1, Margaret Vaaler, PhD1, Dylan McAfee, MPH1
1Texas Department of State Health [email protected]
A Person Living with HIV (PLWH) may go through several stages of care and treatment. The goal in HIV treatment is to achieve a very low level of HIV viral load in the body. The HIV care continuum is a model that outlines these sequential stages. More than three-fourths
GIS Day, Texas Department of State Health Services, Austin, Texas, November 18, 2015Alassane Barro and Mathias B ForresterTexas Department of State Health Services, Austin, [email protected]
TPHA Journal Volume 68, Issue 1 25
of the PLWH in Texas reside in the fi ve largest cities in the state. We selected Austin as an example of those cities to illustrate the poten-tial use of maps as a tool in the public health response to the needs of individuals with HIV. Using HIV surveillance data collected by the Texas Department of State Health Services in 2014, we mapped the distribution of the proportion of PLWH in Austin at each of the stages of the model of HIV care continuum. The maps show distribu-tions of the proportion of PLWH in care measures by their ZIP code of residence. Although compared to statewide participation, people with HIV in Austin seem to go through the stages of care in larger proportions, the maps help visualize local areas within the city where engagement in care is poor. We do not show it here, but in addition to highlighting local gaps in the progression through stages in HIV care at the local level, mapping these stages of care can be used for com-parison with the geographical distributions of structural and social variables that infl uence participation in care services and adherence to treatment.
6. Geographic Differences in Antivenin Use in Copperhead (Ag-kisdtrodon contortrix) Bites Reported to Texas Poison CentersMathias B Forrester, BSTexas Department of State Health Servicesmathias.forrester@ dshs.state.tx.us
Background: Copperhead (Agkisdtrodon contortrix) is the most common snake involved in venomous snake bites reported to US poison centers. Since there are geographic differences in copperhead bites reported to Texas poison centers, there also might be expected to be geographic differences in antivenin administration. Methods: Cases were copperhead bites reported to Texas poison centers dur-ing 2000-2014. The cases were divided into those with and without antivenin. The copperhead bite rate (/100,000 population), serious outcome rate (%), and antivenin rate (%) were determined for the 6 Public Health Regions (PHRs) in Texas with the most reported bites and rural vs urban counties based on Offi ce of Management and Bud-get defi nitions. Results: The copperhead bite rate was PHR 3 (15.0), PHR 4 (41.5), PHR 5 (28.1), PHR 6 (25.4), PHR 7 (20.4), PHR 8 (13.0), rural (35.8), urban (13.8). The serious outcome rate was PHR 3 (13.1%), PHR 4 (15.0%), PHR 5 (15.4%), PHR 6 (14.5%), PHR 7 (12.5%), PHR 8 (20.4%), rural (15.0%), urban (14.5%). The an-tivenin rate was PHR 3 (55.8%), PHR 4 (43.2%), PHR 5 (28.4%),
PHR 6 (30.7%), PHR 7 (40.1%), PHR 8 (49.6%), rural (37.4%), ur-ban (42.6%). Discussion: The copperhead bite rate was highest in northeast Texas and declined moving west and south; the rate was over 2.6 times higher in rural than urban counties. Serious outcome rates were similar with respect to PHR and urbanization status. The antivenin rate was highest in PHR 3 (Dallas-Fort Worth area); the rate was 14% higher in urban counties.
7. Geographic Distribution of Hallucinogenic Tryptamines Re-ported by Texas Forensic LaboratoriesMathias B Forrester, BS,1 Jane C Maxwell, PhD2
1Texas Department of State Health Services2The University of Texasmathias.forrester@ dshs.state.tx.us
Background: Hallucinogenic tryptamines are among the designer drugs subject to abuse in the US. Use of hallucinogen tryptamines has been reported to be increasing. The Drug Enforcement Adminis-tration (DEA) maintains the National Forensic Laboratory Informa-tion System (NFLIS), which contains information on scientifi cally verifi ed drug chemistry analysis results from federal, state, and local forensic laboratories. Twenty-one forensic laboratories in Texas con-tribute to the NFLIS. Methods: Hallucinogenic tryptamine samples reported by Texas forensic laboratories during 2010-2014 were iden-tifi ed. The distribution of samples was determined for the 11 Pub-lic Health Regions (PHRs) in which the forensic laboratories were located for the 5-year period and for each individual year. Results: 682 samples were reported during 2010-2014 with the following dis-tribution by PHR: PHR 1 (2.8%), PHR 2 (1.3%), PHR 3 (19.5%), PHR 4 (5.1%), PHR 5 (10.3%), PHR 6 (22.9%), PHR 7 (27.7%), PHR 8 (2.9%), PHR 9 (0.3%), PHR 10 (0.7%), and PHR 11 (6.5%). The proportion of total samples from PHRs 3, 6, and 7 was 68.2% in 2010, 77.2% in 2011, 64.6% in 2012, 87.5% in 2013, and 42.1% in 2014; in 2014 over 30% of samples were from PHR 5. Discussion: During 2010-2014, 70% of hallucinogenic tryptamine samples were reported by Texas forensic laboratories in PHR 3 (Dallas-Fort Worth area), PHR 6 (Houston area), and PHR 7 (Austin area). The relative proportion varied from one year to the next. This information can be used to target further education, surveillance, and prevention activi-ties.
26 TPHA Journal Volume 68, Issue 1
The Texas Public Health Association invites you to the 92nd Annual Education Conference (TPHA AEC 2016).Hosted by the Galveston County Health District, this conference promises to be a large event, drawing as
many as 300 public health-care workers from across the state. We have exhibit space starting at $500 for Basic Level Exhibitor as well as Exhibitor packets at the Silver, Gold and Platinum Levels.Please join us today. Call TPHA at (512)336-2520 or go to: www.texaspha.org and click on events.
Silver Exhibitor$2,000 level
Dedicated Silver Exhibitorwill receive:
• A one-half page ad in the conference program
• Your logo on the TPHA website for one year
• Exhibit table with signage denoting you as a Silver Exhibitor
• Complimentary conference registration for up to two individuals
Platinum Exhibitor$5,000 level
Dedicated Platinum Exhibitorwill receive:
• A full page ad in the front of the conference program
• Your logo on the TPHA website for one year
• Exhibit table with signage denoting you as a Platinum Exhibitor
• Complimentary conference �������������� �������������� ���
• An award plaque recognizing your Platinum Exhibit
• A conference give-a-way with your company logo for each attendee
• Conference attendee list
Gold Exhibitor$3,000 level
Dedicated Gold Exhibitorwill receive:
• A full page ad in the conference program
• Your logo on the TPHA website for one year
• Exhibit table with signage denoting you as a Gold Exhibitor
• Complimentary conference registration for up to three individuals
• One (1) complimentary hotel sleeping room for two nights

TPHA Journal Volume 68, Issue 1 27
You are invited to participate in the TPHA
92nd Annual Education Conference (AEC)
April 11-13, 2016 The San Luis Resort Spa and Conference Center
Galveston, Texas
Public Health: Every Day, Every One, Every Where Since 1923, TPHA has been dedicated to promoting the safety, health and welfare of all Texans through leadership, education, training, collaboration, mentoring and advocacy. The TPHA workforce diligently undertakes the prevention of disease spread by food, water and air and the control of all threats to good health by inspection, surveillance, research and immunization. Opportunities include:
� Register to attend the conference (register at www.texaspha.org)
� Register to Exhibit Basic, Silver, Gold and Platinum levels to choose from (details on page 26)
� Donate to annual Silent Auction Consider making either a monetary contribution or donate an item to be auctioned. Examples of previous donations include gift cards, merchandise, artwork, vouchers for services, food, beverages or lodging, passes or tickets to performances. Please feel free to be as creative as you wish. Contact Terri Pali at (512) 336-2520 or [email protected] to make arrangements for item delivery.
TPHA is a 501(c)3 tax-exempt organization. Please support us in our mission.
Thank you for your support!

Texas Public Health AssociationPO Box 201540Austin, Texas 78720-1540
Non-Profi t Org.US Postage
PAIDPermit No.
1291Austin, TX
1948 V. M. Ehlers*1949 George W. Cox, MD*1951 S. W. Bohls, MD*1952 Hubert Shull, DVM*1953 J. W. Bass, MD*1954 Earle Sudderth*1956 Austin E. Hill, MD*1957 J. V. Irons, ScD*1958 Henry Drumwright1959 J. G. Daniels, MD*1960 B. M. Primer, MD*1961 C. A. Purcell*1962 Lewis Dodson*1963 L. P. Walter, MD*1964 Nell Faulkner*1965 James M. Pickard, MD*1966 Roy G. Reed, MD*1967 John T. Warren*1968 D. R. Reilly, MD*1969 James E. Peavy, MD*1970 W. Howard Bryant*1970 David F. Smallhorst*1971 Joseph N. Murphy, Jr.*1972 Lola Bell*1972 B. G. Loveless*1973 Barnie A. Young*1974 Ardis Gaither*1975 Herbert F. Hargis*
1975 Lou M. Hollar*1976 M. L. McDonald*1977 Ruth McDonald1978 Maggie Bell Davis*1978 Albert Randall, MD*1979 Maxine Geeslin, RN1979 William R. Ross, MD*1980 Ed L. Redford*1981 W. V. Bradshaw, MD*1981 Robert E. Monroe*1982 William T. Ballard*1983 Mike M. Kelly, RS1983 Hugh Wright*1984 Hal J. Dewlett, MD*1984 C. K. Foster1985 Edith Ehlers Mazurek1985 Rodger G. Smyth, MD*1986 Helen S. Hill*1986 Henry Williams, RS*1987 Frances (Jimmie) Scott*1987 Sue Barfoot, RN*1988 Jo Dimock, RN, BSN, ME*1988 Donald T. Hillman, RS*1989 Marietta Crowder, MD*1990 Robert Galvan, MS, RS1991 Wm. F. Jackson, REHS*1992 Charlie Norris*1993 T. L. Edmonson, Jr.*
1994 David M. Cochran, PE1995 JoAnn Brewer, MPH, RN*1996 Dan T. Dennison, RS, MT, MBA1997 Mary McSwain, RN, BSN1998 Robert L. Drummond1999 Nina M. Sisley, MD, MPH2000 Nancy Adair2001 Dale Dingley, MPH2002 Stella Flores2003 Tom Hatfi eld, MPA2004 Janet Greenwood, RS2005 Charla Edwards, MPH, RN2006 Janice Hartman, RS2007 Jennifer Smith, MSHP2008 Catherine D. Cooksley, DrPH2009 Hardy Loe, M.D.2010 John R. Herbold, DVM, PhD2012 Bobby D. Schmidt, M.Ed2013 Sandra H. Strickland, DrPH, RN2014 Jacquelyn Dingley, RN, BSN, MPH, MBA2015 Bobby Jones, DVM, MPH, DACVPM*deceased
TPHA LIFE MEMBERS
TPHA HONORARY LIFE MEMBERS
Minnie Bailey, PhDNed V. Brookes, PEOran S. Buckner, Jr., PE, RSBurl Cockrell, RSGordon Green, MD, MPH
Exa Fay HootenRobert MacLean, MDSam MarinoAnnie Lue MitchellLaurance N. Nickey, MD
Eduardo Sanchez, MD, MPH David R. Smith, MDKerfoot P. Walker, Jr., MDAlice V. White