testing for the impact resistance of ophthalmic lensesoraverylowlevelstress)was...
TRANSCRIPT

NBSIR 76-996
Testing for the ImpactResistance of OphthalmicLenses
Robert E. Berger
Center for Consumer Product Technology
Institute for Applied Technology
National Bureau of Standards
Washington, D. C. 20234
March 1976
Final
Prepared for
Optical Manufacturers Association
1730 N. Lynn Street
Arlington, Va. 22209


NBSIR 76-996
TESTING FOR THE IMPACTRESISTANCE OF OPHTHALMICLENSES
Robert E. Berger
Center for Consumer Product TechnologyInstitute for Applied Technology
National Bureau of Standards
Washington, D. C. 20234
March 1 976
Prepared for
Optical Manufacturers Association
1730 N. Lynn Street
Arlington, Va. 22209
U.S. DEPARTMENT OF COMMERCE, Elliot L. Richardson, S»ef0t»ry
James A. Baker, III, Undsr SecntaryDr. Betsy Ancker-Johnson. Assistant Secretary for Science and Technplogy
NATIONAL BUREAU OF STANDARDS. Ernest Ambler, Acting Director
Final

Introduction
The Optical Manufacturers Association's Research Associate Program
began at the National Bureau of Standards In February 1974. The object
of this program was to develop a mechanical testing procedure for
verifying the Impact resistance of ophthalmic lenses 1^1 . The research
effort was guided by the following specific objectives which were out-
lined at the onset of the program:
1. Collection and analysis of all available Information
regarding the FDA drop ball test Tj for eyeglass lenses.
2. Identification of the limitations of the present procedure
and the definition of the basic criteria for a proper test.
3. Experimental and analytical efforts to establish a procedure
for a new test.
Throughout the Investigation, a fundamental approach has been maintained
so that specific problems concerning Impact resistant lenses could be
viewed In terms of the broader perspectives of fracture mechanics and
statistics of fracture. Four research papers have been written.
The purpose of this report Is to review, for the sponsor, the
principal findings of the program, to discuss the possible alternatives
to the drop ball test, and to suggest a reasonable direction for con-
tinuing the effort. First, some preliminary remarks must be made
regarding impact, fracture, test methods, and damage to lenses.

- 2 -
Surfaces and edges of eyeglass lenses (as with all glass surfaces)
contain many small microcracks or, as they are commonly called, flaws.
The presence of such flaws is unavoidable and is a natural result of
the finishing and edging processes. The number, severity (for now,
severe flaws can be regarded as relatively deep cracks) , and location
of these flaws is random. For an individual lens , techniques do not
exist for describing this random distribution. However, for a group of
identical lenses, there are methods by which this flaw distribution can
be related to the amount of breakage when lenses are subjected to
increasing stress levels in a particular loading configuration.
The flaw distributions for surface flaws and edge flaws must be
described separately. This is because different procedures are used in
surfacing and edging and the nature of the resulting flaws reflects
these differences. An estimate of the depth of surface flaws is
about 1 micrometer. Edge flaws are at least an order of magnitude more
severe (the edge is ground but not polished)
.
When a lens is impacted, tensile stresses build up in regions of
both surfaces* and also on the edge. Fracture occurs when the stress
in the vicinity of a flaw is sufficiently large to cause that flaw to
grow catastrophically . As the number and severity of the flaws on a
lens increases, the likelihood for fracture also increases. The flaw
distributions on the surface and edge are then most important in
describing the impact resistance of a group of eyeglass lenses.
*In the drop ball test, the most likely surface for fracture initiation
is the concave surface where stresses arise from the flexure of the lens
during impact. Brandt _3/ discusses the relationship between the impact
parameters and the possible sites for fracture initiation.

- 3 -
The net flaw distribution on a group of finished lenses also depends
upon the type and quality of the strengthening technique (in the case
of glass lenses). The net effect of either heat treating or chemical
tempering is the existence of a surface compression region in which
both surface and edge flaws are embedded. For a given flaw, more
tensile stress is required to initiate fracture because the compres-
sion in the surface region must be overcome. Effectively, the severity
of the flaw has been reduced. For a group of lenses, the net flaw
distribution will depend upon the strengthening quality.
There are two general methods which can be used in testing for the
impact resistance of the finished product; the first is a proof test.
Each specimen is thoroughly inspected so that any lens containing flaws
in the worst end of the distribution are rejected. Traditionally,
proof tests are the safest and most expensive. A lens which passes
can be guaranteed to have no flaws more severe than some specified
level. Equivalently , it can be guaranteed to withstand a certain level
of impact.
The other alternative is to test for the overall quality of many
lenses. Essentially, one verifies that good machine shop practices are
in effect. No statement is made about an individual lens. Rather,
the percentage of lenses containing severe flaws is kept at some mini-
mum level. Often this is accomplished by statistical sampling procedures.
If either of these methods involves mechanical testing (especially
the proof test), the question of damage to lenses must be resolved.
Damage occurs when the severity of a flaw increases by the process of
slow crack growth (when the applied stress is not large enough to cause

- 4 -
catastrophic failure). The amount of growth depends upon the magnitude
of the applied stress, the length of time over which the stress Is
applied, and the original size of the flaw. In Appendix 1, some limited
experimental data are presented on the subject of crack growth In optical
glass. Also, an equation Is derived In order to compute an appropriate
estimate of damage.
The Drop Ball Test
The drop ball test Is purported to be a proof test; I.e., all lenses
which pass the test may be sold. However, It was found that, during
the drop ball test, both surfaces of the lens are subjected to extre-
mely localized tensile stresses kj ; I.e., the magnitude of the stress
drops off very sharply with distance from the Impact point. Therefore,
a lens which has potentially hazardous flaws will be Identified (by
fracturing In the drop ball test) only If one of these flaws happens
to be relatively near the Impact point. When Individual lenses are
repeatedly subjected to the drop ball test, they typically sustain
many impacts before fracturing _5/. This led to the formulation of the
"search theory" of Impact testing - the ball is searching for a weak
spot on the lens (where there exists a sufficiently severe surface flaw).
The same difficulty arises in the ability of the drop ball test to
detect potentially hazardous edge flaws. For round lenses subjected to
slightly off-center Impacts, the tensile stress at the edge differs,
from one point to another, by about thirty percent. This difference
is large enough to make the search theory applicable for the
failures as well 6^/. For lenses with asymmetrical shapes, differences
in the edge stress as large as 250% have been observed.

- 5 -
According to the FDA regulation 2^/, all lenses must be capable of
passing the drop ball test. However, it is now clear that impact resistance
cannot be verified on the basis of a single impact. Essentially, only a
small area of each lens is sampled in the drop ball test. The absence of
potentially hazardous flaws is verified for only this small area.
The implication that the drop ball test can be interpreted as a
sampling test that insures a minimum level of overall quality must be
resisted. This is because no limits are set for the tolerable amount
of breakage*. For example, a laboratory which breaks five percent of
its lenses (in the drop ball test) produces lenses with an overall
quality (in terms of the number of "bad" flaws) which is five times
worse than the laboratory which only breaks one percent. As any lens
which does not break can be sold, no minimum level of quality can be
attributed to it.
A further difficulty with the drop ball test is that the magnitude
of the peak surface stresses is very high. Often, relatively innocuous
flaws will initiate fracture Ij . Therefore, not all broken lenses were
necessarily bad.
The usefulness of the drop ball test is that a laboratory is likely
to take measures to minimize the amount of broken lenses. However, the
difficulty with enforcing the regulation has led to the suspicion that
laboratories with large amounts of breakage may often just suspend the
test.
*It has been shown that the percentage of broken lenses, for a group ofidentical lenses, is nearly proportional to the number of "bad" flawsper lens l_l , Therefore, the percent of broken lenses could be taken asa measure of the overall quality of the lenses in the group (see sectionon Sampling Tests in this report).

- 6 -
The possibility that the drop ball test causes damage to lenses
must also be investigated. A parameter which measures degradation in
drop ball testing is derived in Appendix 1. For surface flaws, the
strength degradation is on the order of 1% beneath the impact point.
Because the stress drops off so sharply with distance, the average
degradation over the entire lens' surface is several orders of magnitude
less. Further, it is unlikely that a second impact will coincide with
the first; therefore, in terms of a decreased ability to withstand a
second impact, degradation is negligible. For edge flaws, degradations
are on the order of 0.1% or less.
Often, when high power, thick lenses are drop ball tested, small
ring-type fractures can be observed on the impacting surface. As these
do not cause catastrophic failure of the lens, the lens has technically
passed the test, However, the lens is no longer suitable for sale.
Thus, many laboratories insert the lens in a plastic bag before admin-
istering the test. It has been suggested that this practice may
denigrate the intended purpose of the test 8^/. However, we have found
that there is a negligible decrease in the ability to detect lenses with
"bad" flaws when the plastic bag is used Ij \ i.e., the presence of the
plastic bag does not change the fact that very few of the bad lenses are
detected. On the other hand, the percentage of broken lenses does, of
course, decrease. If the drop ball test were to be used as a measure
of overall quality, the effect of the plastic bag would have to be taken
into account.

- 7 -
Alternative Proof Tests
One means of eliminating the deficiencies in the drop ball test is
to find a method by which any lens containing a potentially hazardous
flaw can be identified. This would involve inspecting the entire lens.
Early in the program, we investigated the feasibility of nondestructive
inspection techniques in which no stress (or a very low level stress) was
applied to the lens. None of the standard NDT procedures (e.g., acoustic
emission, dye penetrant, ultrasonics, x-ray diffraction) appeared to be
suitable for our purposes.
The remaining alternative is to develop a procedure in which nearly
uniform tensile stresses can be applied to large amounts of the surface
and edges. Two possibilities were investigated: (1) a static load test,
and (2) a thermal shock test. Both will be discussed in turn.
In a static load test, a loading configuration is designed for the
purpose of producing uniform stresses over a large surface area, and
the load is slowly applied to the lens. One restriction is that the
stress at the edge must also be relatively uniform and at a lower
level than the surface stress (because the edge flaws are so much more
severe). The ease with which the load can be applied must also be
considered. The resulting stresses from several types of loading
configurations were calculated with the aid of a finite element computer
analysis*. '
*This computer study, sponsored by the Optical Manufacturers' Association,was performed by R.A. Mitchell, R.M. Wooley and S. Baker of the EngineeringMechanics Section at NBS . The finished product of this investigation, a
computer code which evaluates the stress and displacement distribution atall points of a statically loaded lens, was presented to the sponsor.

- 8 -
Concentric ring loading, which had been used successfully for
circular disks 9/ , proved to be the most promising configuration*.
For a fixed support radius, an increase in the load radius (to increase
the stressed area) leads to a decrease in the uniformity of the stress
distribution and an increase in the edge- to-center stress ratio.. For
the load radius fixed, an increase in the support radius does not
seriously affect the uniformity, but does lead to some decrease in the
edge-to-center stress ratio. The values 7 mm and 13 mm, for the load
and support radii, respectively, proved to be a reasonable compromise
among the constraints. This configuration was tested in the laboratory,
with lenses which were instrumented with strain gages, and the agreement
with the analytical model was satisfactory.
There are several difficulties associated with the use of a
concentric ring apparatus as a proof test for ophthalmic lenses:
1. While the uniformly stressed area in this test is large
compared to the drop ball test, it is still small compared
to the total surface area of the lens.
*Other configurations were also investigated: a uniform pressure dropacross the lens did not produce as uniform a stress distribution; a
second loading ring improved the uniformity of the stress distribution,but the experimental duplication of this configuration was extremelydifficult; this was also the problem when the lens was ring loadedwhile resting on an elastic foundation.

- 9 -
2. The solutions are only valid for axisymmetric lens geometries.
Lenses having non-round shapes, or lenses with multifocal
segments or cylinders, would not exhibit the same uniformity
in the stress distribution.
3. The required load levels are very high (on the order of several
thousand newtons) and would vary significantly from one lens
power to another (even for symmetric shapes).
4. The high load levels and the necessity for accurate
positioning of the lens make this a very difficult test to
administer at the optical shop level.
Thermal shock tests have been in widespread use as a tool in crack
growth studies of glass specimens. In this procedure, a lens is first
heated and then rapidly immersed in a cold bath. Tensile stresses, which
are roughly proportional to the temperature difference, build up
quickly at all points on the surface and edge. To optimize heat trans-
fer rates, water has been used as the cold bath fluid 10/ . This
method has already been used successfully with ophthalmic lenses in a
study of edge quality; groups of lenses were ranked by comparing the
amounts of breakage as a function of the temperature drop 16/
.
However, in using the thermal shock method as a test for surface
quality, precautions must be taken to insulate the edge. Otherwise,
as the most severe flaws are at the edge, all fractures will initiate
there. We have built and tested such an apparatus (sketched in
figure 1), but its use as a proof test would introduce several difficulties:

-lo-
ci) it requires modification when the lens geometry is changed, (2) it
reduces the tested area, and (3) a separate thermal shock test would be
required for the edge.
Other difficulties with thermal shock testing are: (1) some
evidence of warping was noted in cases where no fracture was observed,
and (2) care must be exercised in maintaining oven and water bath
temperatures at the proper levels.
The most serious objection to both of the above proof tests is that
the amount of lens damage is significantly greater than in the drop ball
test. This is partly because the time duration for applying the load is
much longer. Concerning surface degradation, a case can be made for
testing at a lower stress level than the maximum in the drop ball test;
this can compensate for the increase in the time duration. However, the
edge stresses in the drop ball test are already so low that no further
decrease seems advisable. Even if the stresses could be applied in .02
seconds*, the strength degradation for edge flaws, in the concentric
ring proof test, would be nearly one hundred percent (see Appendix 1).
This amount of degradation cannot be tolerated.
*It is doubtful that the stresses could be applied so quickly in a staticload test without a significant increase in cost. Times of this durationmay not be inconceivable if thermal shock methods are used. However,because the stresses are applied in a water environment, crack propaga-tion velocities (and hence the degradation) are an order of magnitudehigher 11/.
- 11 -
Sampling Tests
As proof testing does not appear to be an entirely satisfactory
alternative to the drop ball test, we turn our attention to the remaining
alternative: a sampling test to insure that at least the overall quality
of lens production is above some minimum level.
The term "overall quality" must first be defined with respect to
impact resistance. A list of parameters that affect impact resistance
is presented in Table 1. The likelihood of fracture depends upon both
the flaw distribution and the applied stresses. An optical laboratory
has little or no control over the second set of parameters in Table 1
(lens geometry), which are usually determined by the customer. "Overall
quality" is thus determined by how well a particular laboratory can
control those parameters which affect the flaw distribution.
Consider a hypothetical case where a laboratory produces lenses of
only one geometry. That is, the variables affecting the stress distri-
bution are fixed. The amount of breakage (measured by the percent of
lenses broken) in the drop ball test (or any stress test) can be related
to the flaw distribution Jj > The flaw distribution can be identified by
the number of "bad" flaws per lens _7 / . The overall quality is then
maintained by keeping the number of bad flaws per lens to a minimum.
In terms of lens breakage, the percentage broken should not exceed some
fixed level.
However, each laboratory produces many different lens geometries,
and this introduces an entirely new set of variables. That is, there is
a distribution of lens geometries, and it is likely that this distribution

- 12 -
varies among laboratories. There exists the possibility that the
effect of this lens geometry distribution may conceal (or greatly dis-
tort) the relationship between the percentage broken and the flaw
distribution*. This Is the major difficulty with using the present
drop ball procedure as a test for overall quality (say, by merely
imposing a limit on the percentage broken)
.
To eliminate these deficiencies, we consider the possibility of
sampling with "coupon" lenses. Coupon lenses have fixed geometries of
some convenient configuration. As the geometries are fixed, the stress
distribution can be estimated and a relationship between the percentage
broken and the number of bad flaws per lens (for both edge and surface
flaws) can be established. The overall quality of lenses from different
laboratories can then be compared.
The obvious objection to such a procedure is that the lenses which
constitute the sample are different from those which are being produced
for sale. Typical sampling procedures 12/&13/ assume that the products
being inspected are nominally identical. The sample is then chosen
randomly from the finished products. This procedure is certainly not
applicable to the production of ophthalmic lenses, where each finished
product is different.|
Consider the case of a one-man laboratory with only one piece of i
equipment for each of the processes discussed in Table 1 (i.e., one grinder,
one polisher, one edger, one strengthening unit). As discussed earlier, the
Introduction of flaws into the surface or edge appears to be a random process
Because the equipment is fixed, we assume that the number of surface flaws
*For example, the amount of breakage for typical -2 diopter lenses is
over twice as great as for typical +2 diopter lenses when the flaw dis-tribution is assumed fixed. This is one of the results of the finite

- 13 -
introduced should depend only on the amount of surface area processed.
Similarly, the number of edge flaws introduced should depend only on
the amount of edge length processed. We assume that these flaw distribu-
tions can be satisfactorily described after some finite amounts of
surface area and edge length have been processed, regardless of what
lens geometries are being produced. Therefore, a batch should not be
defined in terms of a number of finished lenses but in terms of the
amounts of surface area and edge length processed.
For large laboratories, batches must be defined separately for
each combination of the parameters that affect the flaw distribution
(Table 1) . The coupon lenses are processed at predetermined intervals
during the production of each batch. Each coupon lens then comprises a
sample of surface area and edge length. Tests are conducted on them to
assess the overall quality of the entire batch.
The establishment of criteria for determining the amounts of
surface area and edge length which constitute a batch is outside the
scope of this report. However, a general guideline can be suggested:
the surface area and edge length of a batch should be large compared to
sizes required to describe the flaw distribution, but not so large
that significant changes in the equipment have taken place.
An Example
In this section, an example is presented on the use of coupon
lenses in a sampling test for the overall quality of a batch of ophthal-
mic lenses. In order to make the results quantitative, particular
safety criteria and coupon lens geometry are considered. It should be
understood that this example is for illustrative purposes and that
analogous procedures can be used Cor any safety criteria and coupoii
lens geometry.
\
- 14 -
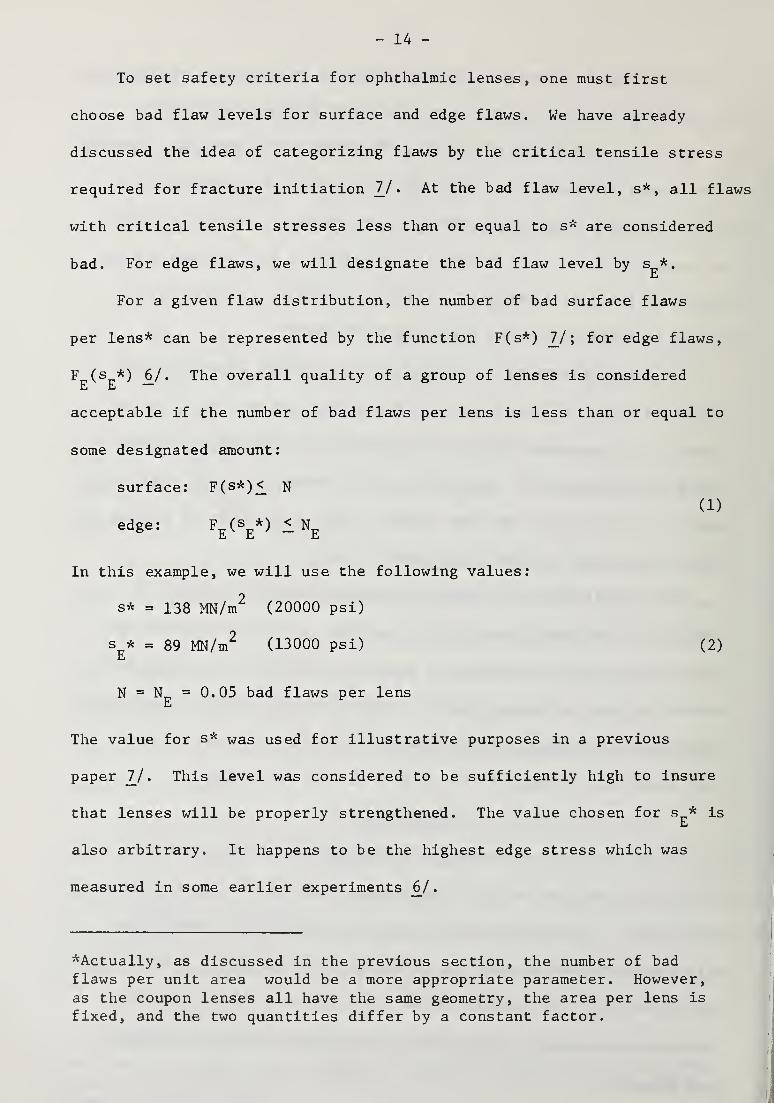
To set safety criteria for ophthalmic lenses, one must first
choose bad flaw levels for surface and edge flaws. We have already
discussed the idea of categorizing flaws by the critical tensile stress
required for fracture initiation _7 / . At the bad flaw level, s*, all fl
with critical tensile stresses less than or equal to s'"'^ are considered
bad. For edge flaws, we will designate the bad flaw level by s *.
For a given flaw distribution, the number of bad surface flaws
per lens* can be represented by the function F(s*) _7 / ; for edge flaws,
F (s *) 6^/. The overall quality of a group of lenses is considered
acceptable if the number of bad flaws per lens is less than or equal to
some designated amount:
surface: F(s*)<_ N
(1)
edge: ^^(V^ - ^E
In this example, we will use the following values:
s* = 138 MN/m^ (20000 psi)
s^* = 89 MN/m^ (13000 psi) (2)
N = = 0.05 bad flaws per lensE
The value for s* was used for illustrative purposes in a previous
paper ]_/ . This level was considered to be sufficiently high to insure
that lenses will be properly strengthened. The value chosen for s * ishi
also arbitrary. It happens to be the highest edge stress which was
measured in some earlier experiments 6^/.
'^Actually, as discussed in the previous section, the number of badflaws per unit area would be a more appropriate parameter. However,as the coupon lenses all have the same geometry, the area per lens is
fixed, and the two quantities differ by a constant factor.
- 15 -
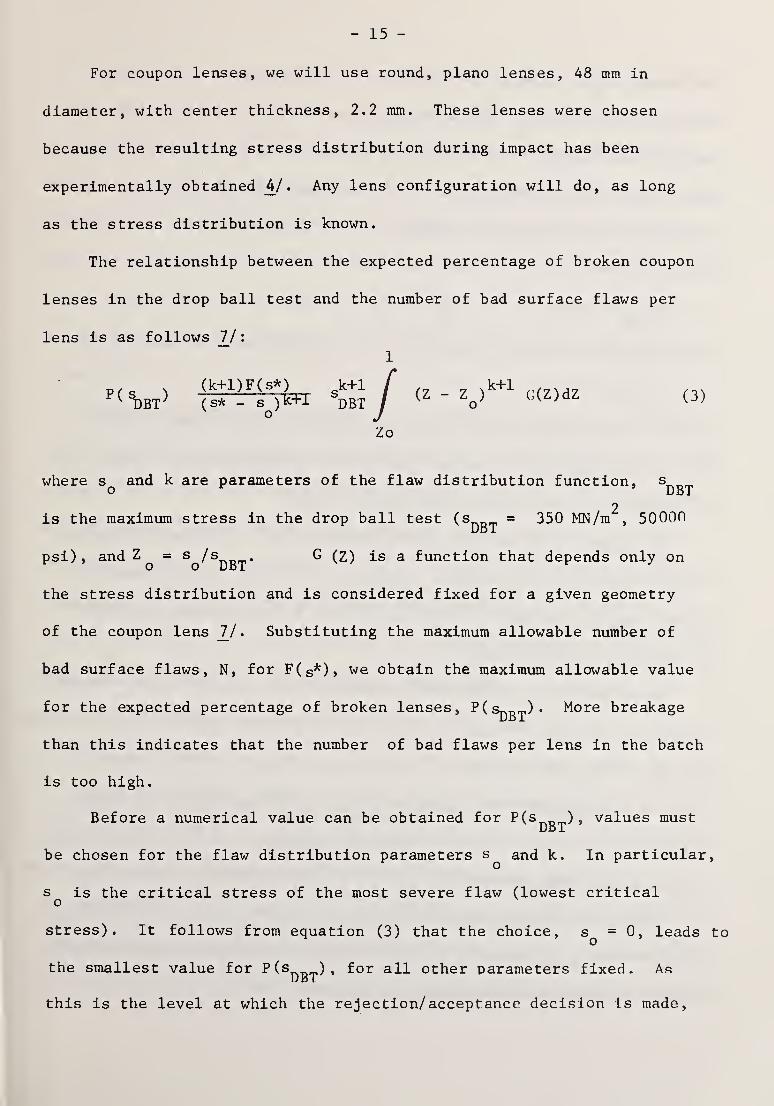
For coupon lenses, we will use round, piano lenses, 48 mm in
diameter, with center thickness, 2.2 mm. These lenses were chosen
because the resulting stress distribution during impact has been
experimentally obtained . Any lens configuration will do, as long
as the stress distribution is known.
The relationship between the expected percentage of broken coupon
lenses in the drop ball test and the number of bad surface flaws per
lens is as follows Ij
:
1
^(k+l)F(s*) k+1 f , k+1
P^W^ (s* - s^)k+l ^DBT /"
^o^^'^^^^^
Zo
where s and k are parameters of the flaw distribution function, s^„„o ' DBT
2is the maximum stress in the drop ball test (s = 350 MN/m , 50000
Ud 1
psi), and Z^ =
^o^^DBT*^ "'"^ ^ function that depends only on
the stress distribution and is considered fixed for a given geometry
of the coupon lens IJ . Substituting the maximum allowable number of
bad surface flaws, N, for F(s*)» we obtain the maximum allowable value
for the expected percentage of broken lenses, P(s|^g^). More breakage
than this indicates that the number of bad flaws per lens in the batch
is too high.
Before a numerical value can be obtained for P(s_,„^) , values must
be chosen for the flaw distribution parameters and k. In particular,
s is the critical stress of the most severe flaw (lowest criticalo
stress). It follows from equation (3) that the choice, s^ = 0, leads to
the smallest value for PCs^^^), for all other parameters fixed. As
this is the level at which the rejection/acceptance decision Is made,

- 16 -
the choice, = 0, is thus conservative. The value, k = 3.8, has
been used previously to represent some experimental data 7/. Also it
has been shown that the number of bad flaws per lens is not particularly
sensitive to this parameter _7 / . So, from equation (3), using the values
s =0 and k = 3.8, and the stress distribution G(Z) from a representativeo
lens, we obtain:
P(Spg^) = 1%
An analogous procedure can be repeated for edge flaws (Appendix 2.1):
P(s^g^) = 2%
For the safety criteria set in (1), a group of coupon lenses with less
than 1% breakage due to surface flaws and 2% breakage due to edge flaws
is considered to represent an acceptable batch.
In figure 2, an outline of the relationships, which are discussed
in this section, is presented. Equation (3) is thus the relationship
between box A (the safety criteria) and box B (the maximum allowable
percentage of broken lenses)
.
An essentially unmeasureable parameter, the number of bad flaws per
lens, has now been related to a readily measureable parameter, the percent-
age of broken coupon lenses. By testing a sample of coupon lenses, it is
desired to infer whether the percentage of broken lenses in a large
population of coupon lenses is less than P(s ). If this inference is
made, it can be stated that the number of bad flaws per lens is less than
N. Then, because the flaw distribution is assumed to be independent of
lens geometry, it can also be inferred that the number of bad flaws per
lens in the general population is also less than N.

- 17 -
For a given confidence limit, the number of coupon lenses required
for testing decreases sharply as P(s ) increases 14/. Without
changing the allowable number of bad flaws per lens, P(s ) can beDBl
increased by modifying the test method (say, by changing the stress
distribution, G(Z), in equation (3)). Thus, if an alternate test method
is used, in which the tensile stresses are more severe or are applied
over a larger part of the lens, the percentage of broken coupon lenses
will increase, and the number of coupon lenses required for testing will
be reduced.
For this example, we will consider a similar test to that presently
used: a drop ball test with a 7/8-inch (22 ram) diameter steel ball. One
advantage of such a test is that laboratories would not have to purchase
new equipment. The allowable percentage of broken lenses in this new
test, P(s ), can be related to P(s ). This relationship is derived' new DBT
in Appendix 2.2 and connects boxes B and C in figure 2. Again, if s^
is set equal to zero, this percentage will be a minimum and thus conserva-
tive. For our example, the calculated values are:
The number of coupon lenses required to verify these percentages of
broken lenses is correspondingly reduced.
One other relationship may be of interest (see boxes D and B of
figure 2). For a fixed flaw distribution, the percentage of broken
lenses in the drop ball test can be computed for other lens geometries.
Such calculations would follow straightforwardly from the finite element

- 18 -
computer program referred to earlier. An average percentage broken,
P(8j^g^), can then be formed and this average compared to ^^^Qg^)* If
the geometries are selected carefully, the average, P(s ), can beDBT
considered an estimate for the overall amount of breakage in a labora-
tory. Of course it may be necessary that the averaging process vary
among laboratories. This relationship also allows for a different, and
possibly more convenient, approach in determining the rejection limits
for the sampling test with coupon lenses. Referring to figure 2, the
path D-^B^C can be used instead of A^B-*C. That is, a limit is first
set on the overall percentage broken that is allowable. As records of
drop ball testing have been mandatory, there should be plenty of data
on which to base this limit. This limit is then a reflection of the
present state-of-the-art and can be modified if new technologies are
developed. The corresponding percentages of broken coupon lenses in the
drop ball test and the new sampling test then follow from the relations
D— B and B-»C (figure 2), respectively. Using the value s^ = 0, the
resulting limits are conservative. This approach is desirable because the
complicated (and somewhat arbitrary) decisions, regarding bad flaw levels
and the tolerable amount of bad flaws, are avoided.
Summary
The results of the research associate program indicate that it is
desirable to replace the drop ball test with a sampling procedure from
which meaningful information on lens quality can be obtained. We have
discussed some aspects of the design of a sampling plan in which the

- 19 -
overall quality of a laboratory's lenses is monitored by regularly
testing a set of coupon lenses. Several methods for determining accep-
tance/rejection criteria (e.g., based on the number of tolerable bad
flaws or on the present state-of-the-art) have been suggested. Details
for an actual sampling plan (which must also address the questions of
when to produce and test coupon lenses, what steps to take if rejection
is indicated, and how to enforce the plan) are deferred to such time
when a rigorous statistical evaluation can be performed.
The sampling procedure suggested in this report is intended as
a guide. Many modifications to this procedure can be imagined. For
example, it is possible that the manufacturer could verify the surface
quality of lens blanks (by testing coupon blanks, say). Then the
optical laboratory can be assured that the breakage it sustains is not
due to processes beyond its control.
Whatever direction the final sampling plan may take, some testing
may be necessary to verify certain assumptions. For example, in the
suggested approach of this report, a verification is required to confirm
that the flaw distribution is independent of lens geometry (if not,
difficulties can be circumvented by testing a worst case geometry).
The proof test methods discussed in this report (concentric ring
static load and thermal shock) are not suitable for verifying the impact
resistance of individual ophthalmic lenses. However, they may be of
use to the optical industry as a research tool; i.e. these tests would
allow for a more efficient determination of the effectiveness of new
materials or strengthening methods, if they are introduced.

- 20 -
It should be reemphasized , before closing, that the focus of this
report, and the entire program, has been on glass ophthalmic lenses.
Modifications would be required before the proposed sampling test could
be adopted for plastic lenses.
At this point, the NBS/OMA Research Associate Program terminates.
Until now, we have been concerned with the mechanical dynamics of
impact resistance and the drop ball test in order to understand the
limitations of the present test and to make recommendations for improving
it. The refinement of a new testing procedure, such as one suggested
in this report, lies in area of applied statistics.

References
1. OMA/NBS Contract CN-156
2. U.S. Food and Drug Administration, Use of Impact-Resistant Lensesin Eyeglasses and Sunglasses, Federal Register, Feb. 2, 1972
(37 F.R. 2503)
3. Brandt, N.M. , The Anatomy and Autopsy of an Impact Resistant Lens,Am. J. of Optom. and Physiol. Optics 51 (12): 982-986, 197A
4. Berger, R.E., Dynamic Strain Gage Measurements on Ophthalmic LensesImpacted by Low Energy Missiles, accepted for publication, Am. J.
of Optom. and Physiol. Optics.
5. Berger, R.E., Impact Testing of Ophthalmic Lenses: Stress Distributionand the Search Theory, Journal of the Am. Optom. Assoc., ^7(1):86-92, 1976
6. Berger, R.E., The Role of Edge Failures in Impact Testing of OphthalmicLenses, accepted for publication, Journal of the Am. Optom. Assoc.
7. Berger, R.E., Interpretation of the Drop Ball Test in Terms of a
Statistical Model for Fracture, accepted for publication. Am. J. of
Optom. and Physiol. Optics
8. Kors, K. and St. Helen, R. , The Use of Guide Tubes and Plastic Coversin Testing Ophthalmic Lenses for Impact Resistance, Am. J, of Optom.
and Physiol. Optics. 51(12): 969-977, 1974
9. Kao, R., Capps, W. and Perrone, N., A General Numerical LargeDeflection Solution of the Coaxial Ring Circular Glass Plate FlexureProblem, Catholic University of America, Washington, D.C., October1970
10. Badaliance, R. , Krohn, D.A. , and Hasselman, D.P.H., Effect of SlowCrack Growth on the Thermal-Stress Resistance of an Na„0-Ca-SiO_Glass, J. Am. Cer. Soc. 59(10): 432-436, Oct. 1974
11. Wiederhorn, S.M., Environmental Stress Corrosion Cracking of Glass,Corrosion Fatigue, Nace-2, pp. 731-742, NACE, Houston, Texas 1972
12. Muehlhause, CO., et . al. Consideration in the Use of Sampling Plansfor Effecting Compliance with Mandatory Safety Standards, NationalBureau of Standards Report NBSIR 75-697, June 1975

13. Duncan, A, J., Quality Control and Industrial Statistics, Richard D.
Irwin, Inc., Homewood, Illinois, 1965
1^. Mainland, D. ,Herrera, L. and Sutcliffe, M. I
. , Tables for Use withBinomial Samples, Department of Medical Statistics Report, New YorkUniversity College of Medicine, 1956
15. Evans, A.G. and Wiederhorn, S.M., Proof Testing of Ceramic Materials -
An Analytical Basis for Failure Prediction, U.S. National Bureau of
Standards Report, NBSIR 73-173, March 1973
16. Verbal communication relating to the Optical Wholesalers Association's,study of failure modes in ophthalmic lenses.
USCOMM-NBS-DC
Appendix 1
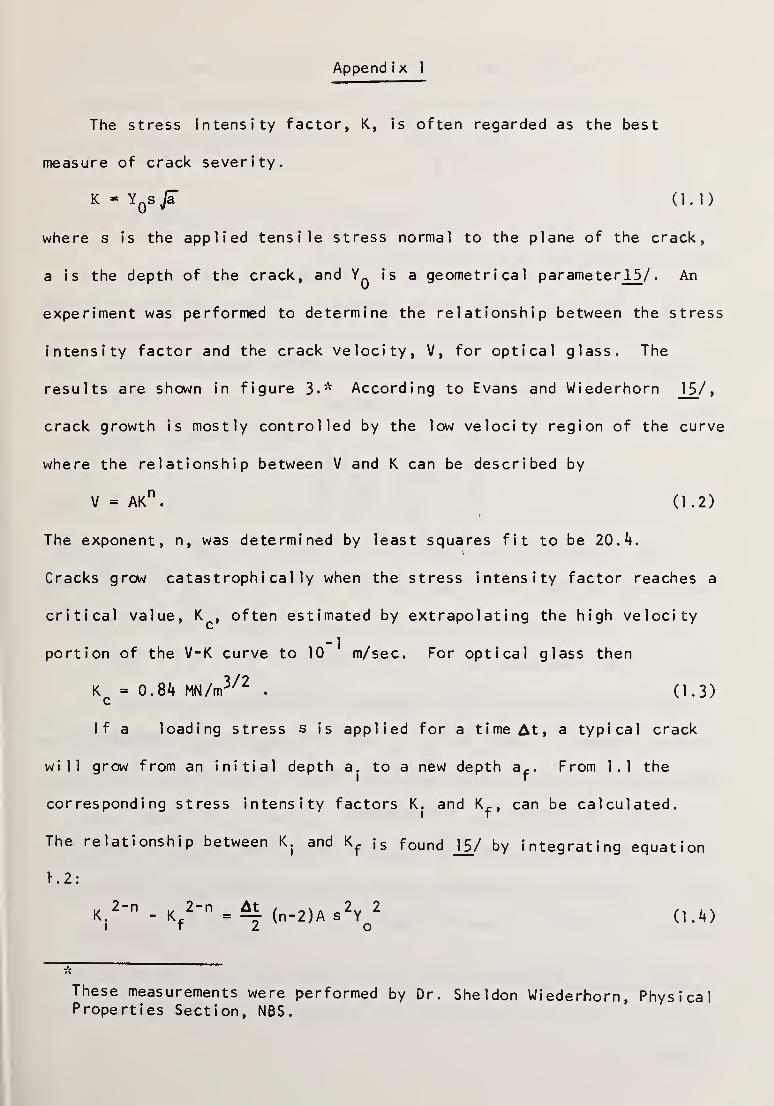
The stress intensity factor, K, is often regarded as the best
measure of crack severity.
K » YqS Ja (1.1)
where s is the applied tensile stress normal to the plane of the crack,
a is the depth of the crack, and Yq is a geometrical parameter 15/ . An
experiment was performed to determine the relationship between the stress
intensity factor and the crack velocity, V, for optical glass. The
results are shown in figure 3.'"' According to Evans and Wiederhorn 1 5/
,
crack growth is mostly controlled by the low velocity region of the curve
where the relationship between V and K can be described by
V = AK". (1.2)
The exponent, n, was determined by least squares fit to be 20.4.
Cracks grow catastrophi cal ly when the stress intensity factor reaches a
critical value, K^, often estimated by extrapolating the high velocity
portion of the V-K curve to 10 ' m/sec. For optical glass then
= 0.84 MN/m^^^ . (1.3)
If a loading stress s is applied for a time At, a typical crack
will grow from an initial depth a. to a new depth a^. From 1.1 the
corresponding stress intensity factors K. and , can be calculated.
The relationship between K. and is found jS./ by integrating equation
K2:
K2-n . , 2-n ^ At
(^.2)^ 32 2^^ ^^^
I t z o
These measurements were performed by Dr. Sheldon Wiederhorn, PhysicalProperties Section, NBS.

Then from 1.4, using 1.1 and 1.2;
K.
k71
n - 2
n - 2
0.5 )
If s. and are the stresses required for failure (i.e. for K
from 1.3), before and after crack growth, then
s. K.f _ _j_
s.
(1.6)
The percentage decrease in the stress required for fracture is an
appropriate measure of strength degradation:
D = ^ ""f = 1
-
n - 2
1-^ At
2 a.I
(1-7)
Order of magnitude estimates for the applied stresses on the surface
8 2and edge of the lens during the drop ball test are 3.5 X 10 N/m and
8 20.7 X 10 N/m
,respectively 4./. The depths of cracks causing failure are
then obtained from equation 1.1" with K = K^:
surface, a^ = 1.44 micron; edge, a^ = 36 microns
For the purpose of illustration we calculate the strength degradation
for cracks which are initially half as large as those causing failure:
a . = 0.72 micron; a,.. = 18 micronsSI El
From 1.1, the stress intensity factor for both these cracks is about 0.6
MN/m^'^^ for which the velocity (from figure 3) is about 10 ^ m/sec. The
duration of contact is about 0.2 msec V. Then from 1.7
= 10"^, = 5 X 10"^
"Using Yq = 2 for a crack which can idealized as a segment of an
ellipse 7/.

If the duration were increased by two orders of magnitude, to 20 msec,
the same edge flaw would grow to 36 microns and failure would be imminent-.
The corresponding degradation would be nearly 100%.
Append i x 2.1
For a round lens, a reasonable first approximation is to assume
that the applied stress ^^qj 'S uniform at the edge. Let f^^(^Qgj) denote
the fraction of edge flaws with critical stresses less than or equal to
s^g^. If the edge flaws can be represented by a Weibull type distribu-
tion 7/, then
^e(=e) =^ (=e- ^0 )
Therefore^DBTs* - st
.E 0
+ 1
(2.1.1)
(2.1.2)
The percent of lenses expected to break due to edge failures in the
drop bal 1 test is J/:
It remains to determine the parameter, k^ , for edge flaws. Consider
an experiment in which groups of lenses are subjected to thermal shock-all
lenses which break have failures originating at the edge. The percentage
of broken lenses is recorded as a function of the temperature difference,
AT. As AT increases the number of broken lenses increases. The applied
stress at the edge is proportional to the temperature difference
s £ =«<AT, Sq =<<ATq
is determined from the percent broken data by equation 2.1.2. Then
from 2.1.1 and 2.1.^:

In = b + (kg + )) In (AT - AT^)
(k + 1) C2. 1 .5 )
CWhere b = In
In figure ^4, is plotted as a function of AT - ATq on log-log paper-.
The slope is then + 1. From the figure k^ = 2.2. P( s^^^) then follows
from 2.1.1 and 2.1.2.
Append i x 2.2
For the drop ball test, the following relationship between the stress on
the lens and the input kinetic energy, K, was experimentally verified k/:
'NEW
'DBT
NEWKDBT
\_
2
Now K is proportional to the mass of the impacting steel ball, the mass is
proportional to the volume and the volume is proportional to the cube of
the diameter. Therefore,
12
'NEW
'dbt
DNEW
DBT
7/8 in.
5/8 in.
12
= 1.65
From equat ion (3)
' NEW
L" DBT J
k+ 1
= (1.65)^-^ = 10
P is )
For edge flaws ^ NEW^
P( E )
DBT
= (1.65)^'^ =5
"From OWA study 16/.

Table 1 . Parameters that Affect Impact Resistance
Parameters that Affect the Flaw Distribution
1. Quality of grinding and polishing (surface flaws)
2. Quality of edging (edge flaws)
3. Quality of strengthening (surface and edge flaws)
Also changes In the specific piece of equipmentand/or the operator are also likely to affect theflaw distribution
Parameters that Affect the Stress Distribution
1. Thickness
2. Power
3. Base curvature
4. Shape
These parameters determine the stress distributionfor a given impact or static loading condition.The presence of cylindrical power and/or multifocalsegments would also affect the stress distribution.

STAINLESS STEEL
F i gure 1
.
Schematic DrawingInsulate the LensTests
.
of Apparatus Used ToEdge in Thermal Shock

<11 ocn t—
\
/n T3 >IIII
'U O) 4->
G) C f—
\
t > I/)
erI/)
Li (/) ft)
V-/ >- cu 1 o —3
O o 1
A
4-1 1
A
<D <4-
0 i- oE 0 •
fO 4-< c(/) o a)
0) (U 4-1
O) 4-) 4-) «D
ro CO o Eo <u
(/) I. w> o 03
< 14- |C1- o
N1-
(UJ'
4-> (/)
oro Li_
i_
ro
j= oo
c (/)
o3
4-1
ro
J3 >1- E4-1
(/) E
-oro
5 2: UJro
>-Ll.
<
4-)
(A
C 0) c0 4-* 0a. Q. 53 3 (U
0 0 c0 ro
x> <u14- V4- .c
a. 0 4-)
0Q) t_ Q) c
-0ro LU ca ro UJ UJ
(U 0 T> c zro in ro (U 00) 4-) 0) 4-)
L. a. i_ (/) 4-1 Q-XI c J3 0) ro
4-» i_
4-1 4-1 3c (/) c 1/1 D)<u (U ca (U (U UJ0 (/) 0 0 «4- z1- c 1_ c C I/)
0) (U (U (U
Q- Q- Q.
0
01
D1ro
ro
<uuXI
c c(U 0
4-1
c 30) XI(U
\.
4-1 4-1
0) in
XI
</1
CL Sro
x:14-
c0 0)X4-1
ro
T3Cro
1-
3D1

10-2
I I I I I I L_
.50 .55 .60 .65 .70 .75 .80
STRESS INTENSITY FACTOR, K (MN/m3/2)
Figure 3- Crack Propagation in Optical Glass

2.0
1.0-
0.5
UJLl.
COzUJ
LJ 0.2Q-
<
Q 0.1<CD
0.05 -
O UNTREATED
# HEAT TREATED
I I I \ I
5 10 20 50 100
TEMPERATURE DIFFERENCE (AT -ATo)
Figure Results of Thermal Shock Tests 16/. Inferred
From Breakage Data (Equation 2.1.3).

lbS-1l4A (REV. 7-73)
U.S. DEPT. OF COMM.BIBLIOGRAPHIC DATA
SHEET
1. PUBLICATION OR REPORT NO.
NBSIR76-996
2. Gov't AccessionNo.
3. Recipient's Accession No.
I. TITLE AND SUBTITLli
TESTING FOR THE IMPACT RESISTANCE OF
OPHTHALMIC LENSES
5. Publication Date
January 1976
6. Performing Organization Code
213. O^f
'. AUTHOR(S)
Robert E. Berger8» Performing Organ. Report No.
K PERFORMING ORGANIZATION NAME AND ADDRESS
NATIONAL BUREAU OF STANDARDSDEPARTMENT OF COMMERCEWASHINGTON, D.C. 20234
10. Project/Task/Work Unit No.
2130570
11. Contract /Grant No.
2. Sponsoring Organization Name and Complete Address (Street, City, State, ZIP)
Optical Manufacturers Association
1730 N. Lynn StreetArlington, VA 22209
13. Type of Report &. PeriodCovered
Fi nal
14. Sponsoring Agency Code
15. SUPPLEMENTARY NOTES
16. ABSTRACT (A 200-word or less factual summary of most sigpificant information,
bibliography or literature survey, mention it here.)
If document includes a significant
The principal findings of the Optical Manufacturers Association's ResearchAssociate Program are summarized. The limitations of the present drop ball
test for impact resistance are discussed. Essentially, only a small part
of the lens surface and a small part of the edge are subjected to sufficientlyhigh stresses. It is therefore desirable to replace the drop ball test witha sampling procedure from which meaningful information on lens quality can
be obtained. Some aspects of the design of a sampling plan, in which the
overall quality of a laboratory's lenses is monitored by periodically testinga set of coupon lenses, are discussed.
I
17. KEY WORDS (six to twelve entries; alphabetical order; capitalize only the first letter of the first key word unless a proper
name; separated by semicolons
)
Drop ball test; impact resistance; ophthalmic lens; proof testing; researchassociate program; sampling test.
18. AVAILABILITY ;[X] Unlimited
1' For Official Distribution. Do Not Release to NTIS
1' Order From Sup. of Doc, U.S. Government Printing OfficeWashington, D.C. 20402. SD Cat. No. C13
Order From National Technical Information Service (NTIS)Springfield, Virginia 22151
19. SECURITY CLASS(THIS REPORT)
UNCL ASSIFIED
21. NO. OF PAGES
3320. SECURITY CLASS
(THIS PAGE)
UNCLASSIFIED
22. Price
$4.00USCOMM.DC 29042-P74