test-case: hpp bannwil, switzerland - fithydro.eu · outflow and hpp flumenthal about 12 km from...
TRANSCRIPT
TEST-CASE: HPP Bannwil, Switzerland
Prepared by Ismail Albayrak
1
1. Description of the Test-Case
1.1. Description of the water bodies related to the HPP
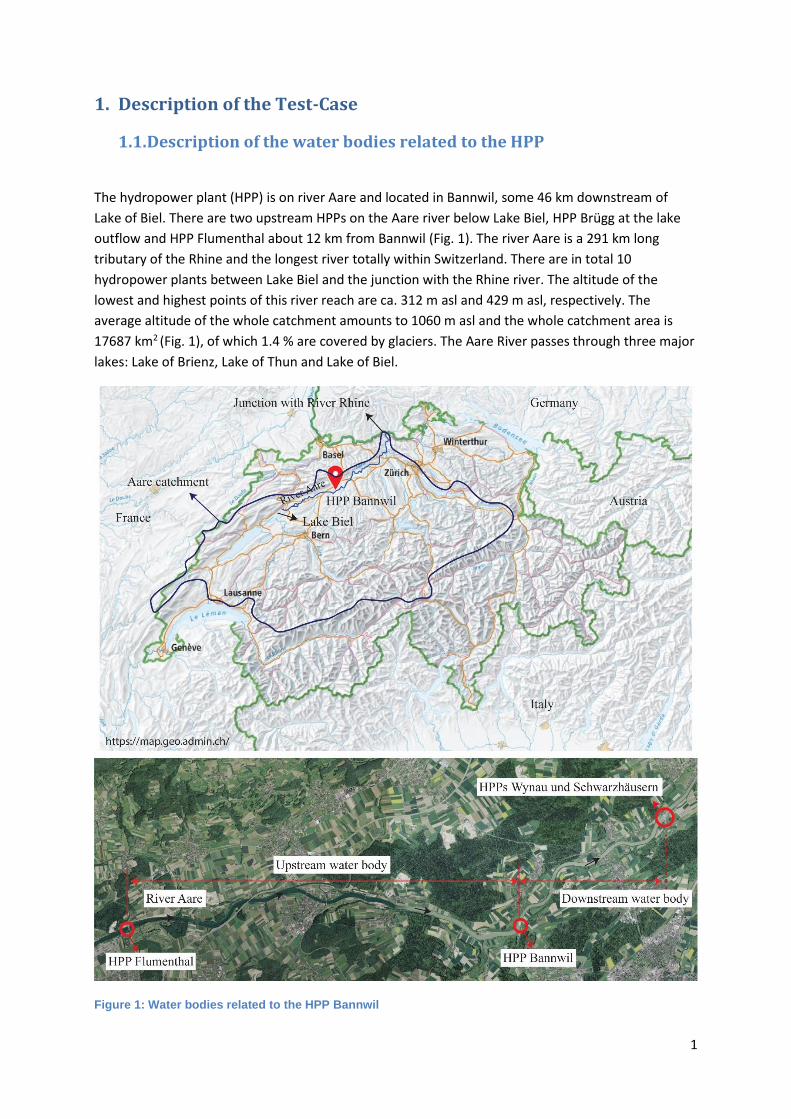
The hydropower plant (HPP) is on river Aare and located in Bannwil, some 46 km downstream of
Lake of Biel. There are two upstream HPPs on the Aare river below Lake Biel, HPP Brügg at the lake
outflow and HPP Flumenthal about 12 km from Bannwil (Fig. 1). The river Aare is a 291 km long
tributary of the Rhine and the longest river totally within Switzerland. There are in total 10
hydropower plants between Lake Biel and the junction with the Rhine river. The altitude of the
lowest and highest points of this river reach are ca. 312 m asl and 429 m asl, respectively. The
average altitude of the whole catchment amounts to 1060 m asl and the whole catchment area is
17687 km2 (Fig. 1), of which 1.4 % are covered by glaciers. The Aare River passes through three major
lakes: Lake of Brienz, Lake of Thun and Lake of Biel.
Figure 1: Water bodies related to the HPP Bannwil
2
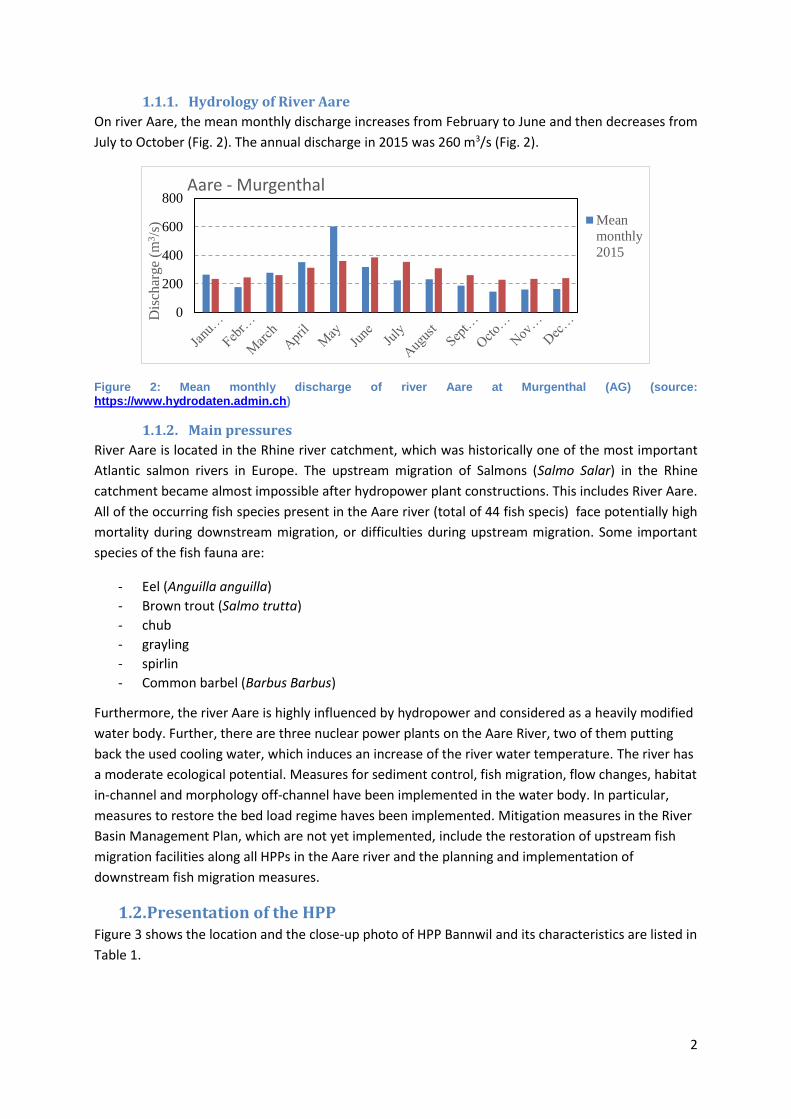
1.1.1. Hydrology of River Aare
On river Aare, the mean monthly discharge increases from February to June and then decreases from
July to October (Fig. 2). The annual discharge in 2015 was 260 m3/s (Fig. 2).
Figure 2: Mean monthly discharge of river Aare at Murgenthal (AG) (source:
https://www.hydrodaten.admin.ch)
1.1.2. Main pressures
River Aare is located in the Rhine river catchment, which was historically one of the most important
Atlantic salmon rivers in Europe. The upstream migration of Salmons (Salmo Salar) in the Rhine
catchment became almost impossible after hydropower plant constructions. This includes River Aare.
All of the occurring fish species present in the Aare river (total of 44 fish specis) face potentially high
mortality during downstream migration, or difficulties during upstream migration. Some important
species of the fish fauna are:
- Eel (Anguilla anguilla)
- Brown trout (Salmo trutta)
- chub
- grayling
- spirlin
- Common barbel (Barbus Barbus)
Furthermore, the river Aare is highly influenced by hydropower and considered as a heavily modified
water body. Further, there are three nuclear power plants on the Aare River, two of them putting
back the used cooling water, which induces an increase of the river water temperature. The river has
a moderate ecological potential. Measures for sediment control, fish migration, flow changes, habitat
in-channel and morphology off-channel have been implemented in the water body. In particular,
measures to restore the bed load regime haves been implemented. Mitigation measures in the River
Basin Management Plan, which are not yet implemented, include the restoration of upstream fish
migration facilities along all HPPs in the Aare river and the planning and implementation of
downstream fish migration measures.
1.2. Presentation of the HPP Figure 3 shows the location and the close-up photo of HPP Bannwil and its characteristics are listed in
Table 1.
0
200
400
600
800
Dis
char
ge
(m3/s
)
Aare - Murgenthal
Mean
monthly
2015

3
Figure 3: HPP Bannwil
The current fish pass is pool design with bottom and top openings. The entrance is located at the left
side of river shortly downstream of the powerhouse. The bottom slope of technical fish pass is on
average 6 %. Most of the head difference is accomplished in the first half of the fish way. It consists
of chamber with a spiral fish way. The upper part of the fish way consists of near horizontal canal
that lead to the exit roughly 100 m upstream of the HPP. The mean discharge in the fish way
amounts to 350 l/s.
The fish pass needs to be restructured to accommodate larger fish in the near future. Current plans
include replacing the lower part with a vertical fish pass design and the upper part with a nature like
open channel.
Table 1: Main characteristics of the HPP Bannwil
Watercourse Aare
Location : Bannwil
Mean annual discharge (2015) 260 m3/s
Design discharge 450 m3/s
Head 5.5 – 8.5 m
Power 28.5 MW, 150 GWh (3 bulb turbines)
Species concerned : 44 fish species known; target species: barbel, spirlin, eel, chub, trout, grayling, eel. Salmon expected in the next 10 - 20 years
1.2.1. E-flow
E-flow is not a concern at HPP Bannwil because it is a block-type HPP where
upcoming flow passes through the turbines and/or weir (during flood events) to the
downstream river reach1.2.2. Downstream migration devices
There is no specific measures implemented at HPP Bannwil. Fish can only pass through the turbines
and/or over the weirs when they are in operation.
4
2. Objectives on this Test Case What we are planning?
Downstream fish migration:
Downstream fish migration measures are investigated by means of field and numerical studies. The
current situation and the efficiency of spill flow or water release as an operational measure at the HPP
Bannwil will be investigated through field monitoring and 3-D numerical modelling in the area near the
powerhouse and weir. The monitoring will comprise:
characterization of the flow field using ADCP
3D numerical simulation
survey of the fish movements using ARIS Sonar and radio telemetry techniques
Preliminary 3-D numerical simulations will be considered in the planning of the monitoring. After the
monitoring campaign, the 3-D hydraulic model will be refined and validated using the ADCP data.
Applying this model to different structural and/or operational scenarios will allow to come up with
solutions to improve fish migration at reduced energy losses. For the former, the innovative fish
guidance structures (FGS) further developed in WP3, Task 3.5 (by etho-hydraulic modelling in the VAW
laboratory) will be a basis. The detailed hydraulic conditions at the FGS including bypass determined
in the lab will be implemented in the numerical model.
Turbine passage:
Dynamic pressure fluctuations experienced by fish during the turbine and spillway passages will be
studied at HPP Bannwil using a Barotrauma Detection System (BDS) developed at TUT. The data will
be analyzed and the results will be provided to Voith (WP2) for BioPA model by TUT. Voith will build a
CFD model of the turbine flows at HPP Bannwil, run the model and compare the model results with
BDS results. The results will be used for WP 3.3.X. Furthermore, Voith will use the same CFD-models
and focus on different operating modes to evaluate the possibility of adapting the operation for certain
time periods. Finally, the results from TUT and VOITH will be provided to TUM for fish turbine mortality
assessment. SJE might help TUT for the field measurements and analysis of BDS data.
3. Presentation and results of activities in FIThydro
3.1. Downstream fish migration measures (ETHZ, FCO, BKW) The current situation will be documented through field monitoring and 3d numerical modelling in the
area near the powerhouse and weir. The monitoring will comprise the characterization of the flow field
with acoustic velocity measurements and a survey of the fish movements. The latter will be made with
Aris Sonar and radio telemetry technique.
Spill flow or water release is the simplest means of transporting fish past HPP obstacles, which can be
also cost-effective when the downstream migration period of the target species is short or migration
occurs during high river flows. This option and the effect of the HPP operation on the flow field and
fish migration for different load cases, e.g. with and without spillway flow, will be investigated by
measuring flow velocities and turbulence characteristics, as well as monitoring fish movements. The
obtained hydraulic data will be used to calibrate and validate the numerical model.
5
Applying this model to different structural and/or operational scenarios will allow to come up with
solutions to improve fish migration at reduced energy losses. For the former, the innovative fish
guidance structures (FGS) further developed in WP3, Task 3.5 (by etho-hydraulic modelling in the VAW
laboratory) will be a basis. The detailed hydraulic conditions at the FGS including bypass determined
in the lab will be implemented in the numerical model.
3.1.1. Methodology
Velocity and bathymetry measurements around HPP using ADCP
Survey of the fish movements using ARIS Sonar and radio telemetry techniques
3D numerical modelling
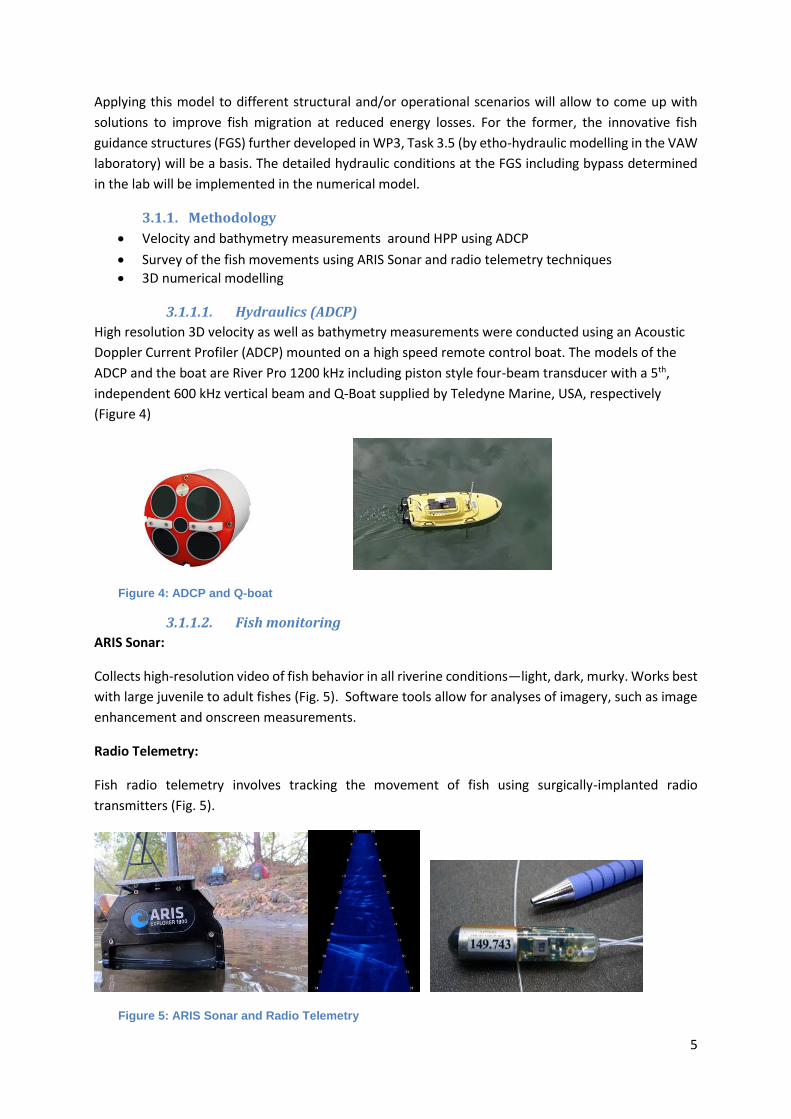
3.1.1.1. Hydraulics (ADCP)
High resolution 3D velocity as well as bathymetry measurements were conducted using an Acoustic
Doppler Current Profiler (ADCP) mounted on a high speed remote control boat. The models of the
ADCP and the boat are River Pro 1200 kHz including piston style four-beam transducer with a 5th,
independent 600 kHz vertical beam and Q-Boat supplied by Teledyne Marine, USA, respectively
(Figure 4)
Figure 4: ADCP and Q-boat
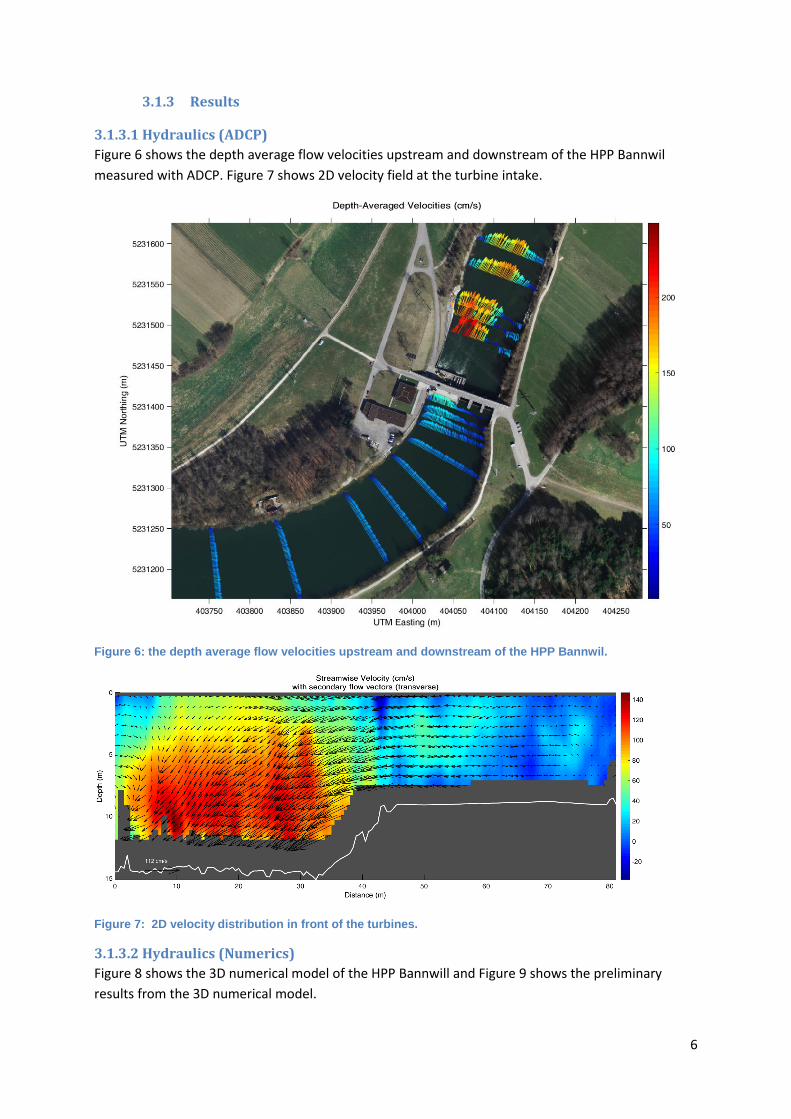
3.1.1.2. Fish monitoring
ARIS Sonar:
Collects high-resolution video of fish behavior in all riverine conditions—light, dark, murky. Works best
with large juvenile to adult fishes (Fig. 5). Software tools allow for analyses of imagery, such as image
enhancement and onscreen measurements.
Radio Telemetry:
Fish radio telemetry involves tracking the movement of fish using surgically-implanted radio
transmitters (Fig. 5).
Figure 5: ARIS Sonar and Radio Telemetry
6
3.1.3 Results
3.1.3.1 Hydraulics (ADCP)
Figure 6 shows the depth average flow velocities upstream and downstream of the HPP Bannwil
measured with ADCP. Figure 7 shows 2D velocity field at the turbine intake.
Figure 6: the depth average flow velocities upstream and downstream of the HPP Bannwil.
Figure 7: 2D velocity distribution in front of the turbines.
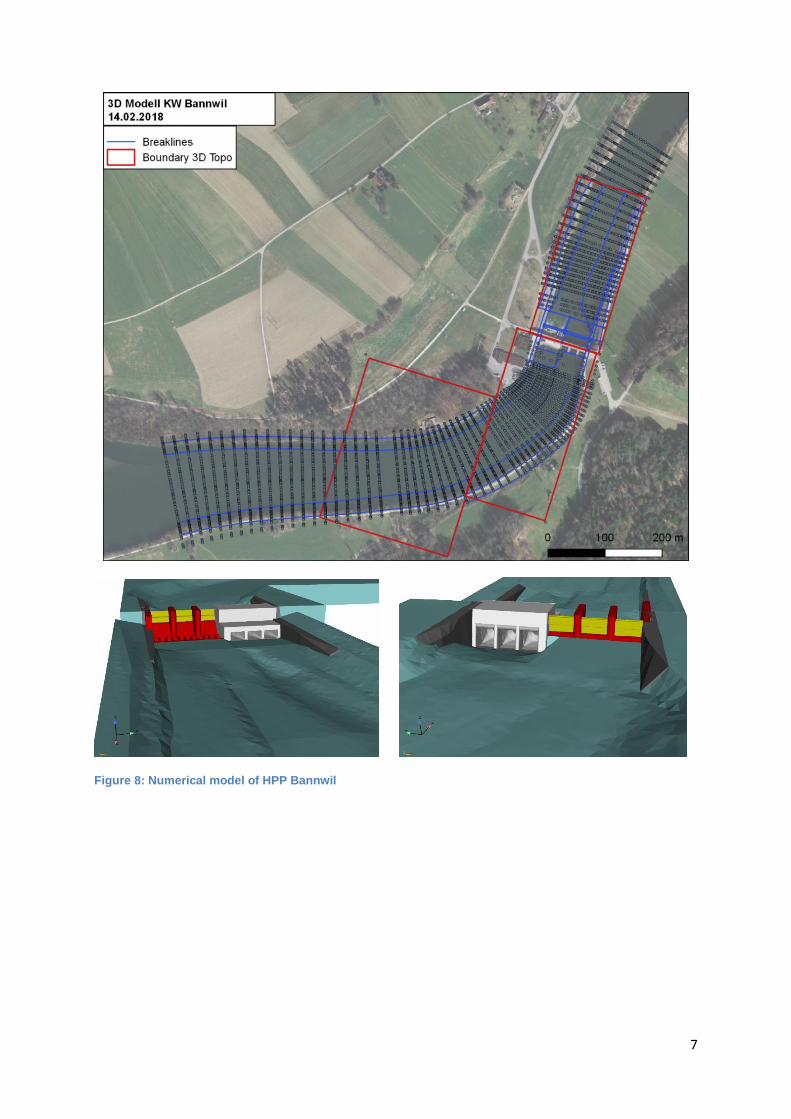
3.1.3.2 Hydraulics (Numerics)
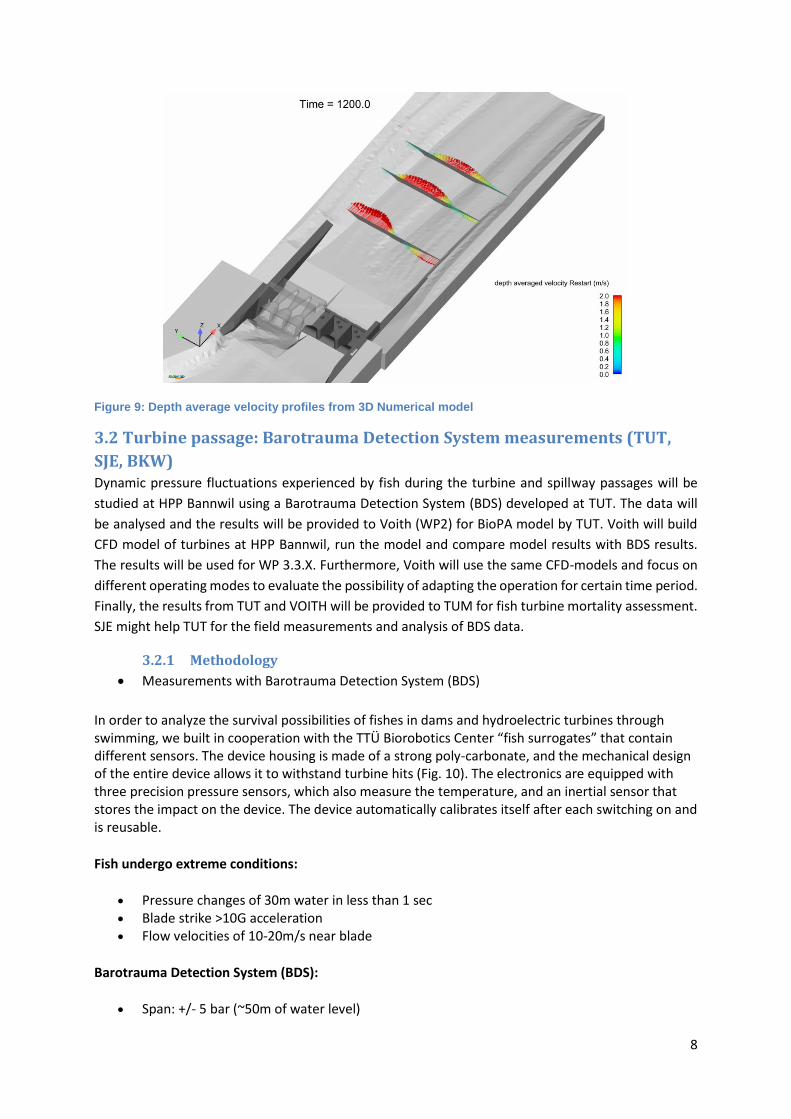
Figure 8 shows the 3D numerical model of the HPP Bannwill and Figure 9 shows the preliminary
results from the 3D numerical model.
7
Figure 8: Numerical model of HPP Bannwil
8
Figure 9: Depth average velocity profiles from 3D Numerical model
3.2 Turbine passage: Barotrauma Detection System measurements (TUT,
SJE, BKW) Dynamic pressure fluctuations experienced by fish during the turbine and spillway passages will be
studied at HPP Bannwil using a Barotrauma Detection System (BDS) developed at TUT. The data will
be analysed and the results will be provided to Voith (WP2) for BioPA model by TUT. Voith will build
CFD model of turbines at HPP Bannwil, run the model and compare model results with BDS results.
The results will be used for WP 3.3.X. Furthermore, Voith will use the same CFD-models and focus on
different operating modes to evaluate the possibility of adapting the operation for certain time period.
Finally, the results from TUT and VOITH will be provided to TUM for fish turbine mortality assessment.
SJE might help TUT for the field measurements and analysis of BDS data.
3.2.1 Methodology
Measurements with Barotrauma Detection System (BDS)
In order to analyze the survival possibilities of fishes in dams and hydroelectric turbines through swimming, we built in cooperation with the TTÜ Biorobotics Center “fish surrogates” that contain different sensors. The device housing is made of a strong poly-carbonate, and the mechanical design of the entire device allows it to withstand turbine hits (Fig. 10). The electronics are equipped with three precision pressure sensors, which also measure the temperature, and an inertial sensor that stores the impact on the device. The device automatically calibrates itself after each switching on and is reusable.
Fish undergo extreme conditions:
Pressure changes of 30m water in less than 1 sec Blade strike >10G acceleration Flow velocities of 10-20m/s near blade
Barotrauma Detection System (BDS):
Span: +/- 5 bar (~50m of water level)
9
Recording rate: configurable 100Hz/ 250Hz (4096/1024 samples/recorded value) Temperature compensated Triple modular redundance Auto-leveling to atmospheric pressure Length/diameter: 9.5cm/4cm Housing materials: Polycarbonate (tube) / Polyoxymethylen (end caps)
Figure 10: Barotrauma Detection System (BDS) and illustration of Barotrauma experienced by fish during turbine passage
3.3 Turbine passage: BioPA modelling (VOITH, BKW) Voith will build CFD model of turbines at HPP Bannwil, run the model and compare model results with
BDS results (Fig. 11). The results will be used for WP 3.3.X. Furthermore, Voith will use the same CFD-
models and focus on different operating modes to evaluate the possibility of adapting the operation
for certain time period. Finally, the results from TUT and VOITH will be provided to TUM for fish turbine
mortality assessment.
3.3.1 Methodology
CFD modeling of turbines (Fig. 11)
BioPA modelling
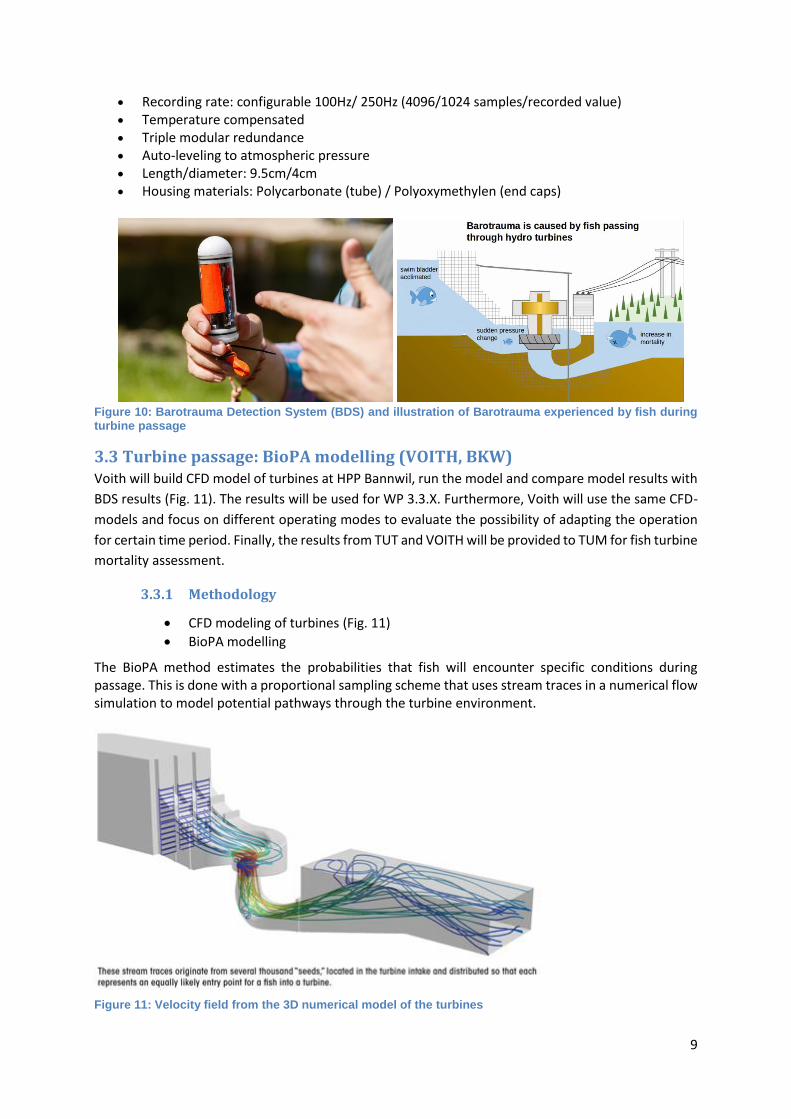
The BioPA method estimates the probabilities that fish will encounter specific conditions during passage. This is done with a proportional sampling scheme that uses stream traces in a numerical flow simulation to model potential pathways through the turbine environment.
Figure 11: Velocity field from the 3D numerical model of the turbines