tertiary recycling of waste plastics: an assessment of ... · pdf filetertiary recycling of...
TRANSCRIPT

1
Tertiary Recycling of Waste Plastics: An Assessment
of Pyrolysis by Microwave Radiation
Timothy T. Sharobem ([email protected])
Thesis Advisor: Professor Ah-Hyung Alissa Park
In partial fulfillment of requirements for Master of Science Degree
In Earth Resources Engineering
Department of Earth and Environmental Engineering
Fu Foundation of Engineering and Applied Science
Columbia University
May 2010
Work co-sponsored by the Earth Engineering Center, Columbia University

2
EXECUTIVE SUMMARY
In 2008, according to the United States Environmental Protection Agency (EPA),
Americans generated more than 254 million tons of municipal solid wastes (MSW) with plastics
comprising 12.1% of the total amount. Of this waste component, only 6.8% was recycled.
The traditional ways of handling non-recycled plastic wastes are landfilling and
incineration. It can be argued however that neither of those approaches are adequate solutions.
Landfills require large areas which may be challenged by increasing population. Furthermore,
there is no energetic incentive to sequester these polymers for decades. A better approach to land
filling is energy recovery via incineration, which uses the heat of combustion to generate
electricity. However, the necessity for considerable pollution control, the difficulty of burning
plastics, and their chemical composition suggest that some type of recycling is more valuable.
Tertiary recycling (also known as feedstock recycling) is the processing of waste into
fuels or basic chemicals. Several methods of plastic feedstock recycling have been investigated
in recent years (e.g. depolymerization, catalytic cracking/reforming) with the goal of either
recovering original monomers or, more commonly oils and waxes.
Also known as thermolysis, pyrolysis is a process of thermal and chemical
decomposition, generally leading to smaller molecules. As MSW plastics are predominately
thermoplastics, they serve as a good feedstock for this process. Pyrolysis is conducted in an
oxygen depleted environment. It can be operated at a wide range of temperatures in order to
target specific products (typically between 400-700 ° C for predominant liquid yield; > 700 ° C
for predominant C1- C3 light hydrocarbon). There is also considerable literature on different
reactor designs and the influence of catalysis.

3
Over the past ten years, more attention has been given to microwave powered pyrolysis.
The use of microwaves initiates localized, molecular heating and therefore under certain
conditions serves as more efficient reactor. However, since thermoplastics like polyethylene
(PE) and polyethylene terephthalate (PET) have poor dielectric properties they are not
particularly useful for microwave heating unless exposed with microwave absorbent materials.
When pulverized carbon is mixed with shredded or pelletized plastics, the added carbon
pyrolysis absorbs the electromagnetic radiation and transports the energy to the plastics via
conduction.
Although literature and process data from microwave pyrolysis applications report a high
oil/wax product yield, there are concerns that its energy requirement, and subsequent carbon
footprint, make this process inefficient and undesirable as an environmentally acceptable. A life
cycle assessment (LCA) was performed using pilot conditions from a commercial process of
microwave pyrolysis. By using the exit gas stream as a feed for an internal generator, Climax
Global Energy’s process significantly decreases its carbon footprint by not drawing electricity
from the grid. In a comparative analysis given a set of assumptions, this process was found to
have an auspicious carbon footprint versus another tertiary recycling process, gasification and F-
T synthesis, and versus the heat extracted from waste-to-energy.

4
TABLE OF CONTENTS
Acknowledgments..........................................................................................................................................6
Chapter 1: Introduction..................................................................................................................................7
1.1 Thesis Overview.........................................................................................................................7
1.2 MSW Background…..................................................................................................................7
1.2.1 Plastics………….....................................................................................................................9
1.3 Plastic Waste Management.......................................................................................................11
Chapter 2: Waste Management Methods.....................................................................................................12
2.1 Recycling .................................................................................................................................12
2.2 Land filling…............................................................................................................................14
2.3Waste to Energy.........................................................................................................................15
2.4 Tertiary Recycling....................................................................................................................16
Chapter 3: Pyrolysis of MSW Plastics........................................................................................................18
3.1 Introduction...............................................................................................................................18
3.2 Mechanisms or Modes of Decomposition……........................................................................18
3.3 Reactors……….........................................................................................................................21
Chapter 4: Microwave Pyrolysis .................................................................................................................23
4.1 Introduction to Microwaves......................................................................................................23
4.2 Microwave Systems…..............................................................................................................24
4.3 Microwave Heating…...............................................................................................................26
4.4 Microwave Pyrolysis Literature................................................................................................28
4.5 Possible “Microwave Effect.....................................................................................................32
Chapter 5: Life Cycle Assessment of MWP (Climax Global Energy)……..……….…………………….34
5.1 Introductions…………….........................................................................................................34
5.2 LCA Scope…............................................................................................................................35
5.3 Process and Calculations (MWP).............................................................................................37
5.4 Compared Processes.................................................................................................................40
5.5 LCA Discussion…………........................................................................................................41
Chapter 6: Conclusions and Future Work....................................................................................................44
References………………………………....................................................................................................46

5
LIST OF FIGURES
Figure 1.1 Total Annual MSW Generation for Select Years.........................................................................8
Figure 1.2 Per Capita Generation of MSW in the US ..................................................................................9
Figure 1.3 Examples of Thermoplastics and Thermosets …………….………………………………..…10
Figure 2.1 Typical Reclamation Process of Plastic Recycling....................................................................14
Figure 2.2 Hierarchy of Waste Management...............................................................................................15
Figure 2.3 Different Forms of Tertiary Recycling …………….……………...………………………..…16
Figure 3.1 General Polymer Decomposition Mechanism............................................................................20
Figure 4.1 Electromagnetic Spectrum..........................................................................................................23
Figure 4.2 Schematic of Magnetron Microwave Tube................................................................................25
Figure 4.3 Schematic of MWP Setup …………………………………………………………………..…29
Figure 4.3 Photo of the MWP Laboratory System ……………………………………………………..…30
Figure 4.4 Cumulative Yield of Products for MWP of 50 g HDPE v. Time (500 °C, 600 °C) ………..…31
Figure 5.1 Description of three waste management schemes .....................................................................36
Figure 5.2 Material and Energy Flows of the MWP-1 process………………………………...…………37
Figure 5.3 Material and Energy Flows of the MWP-2 process……….…………….……….....................39
Figure 5.4 Comparison of estimated GHG emissions (kg CO2-eq per million Btu product…………….42
Figure 5.5 Comparison of estimated GHG emissions (t- CO2-eq per day of operation, feed 20 MT of
waste plastics…………………………………………………………………………...……….……..….43
LIST OF TABLES
Table 2.1 Main Types of Plastics and Common Uses.................................................................................13
Table 4.1 Product Yield (wt%) from Polyethylene Pyrolysis for Various Reactors………………...……31
Table 5.1 Fuel Electricity Generation in NJ………………………………………………………...…….38

6
ACKNOWLEDGEMENTS
I would like to thank my advisor Professor Ah-Hyung (Alissa) Park for her invaluable
support and guidance during this research and throughout my involvement in the Earth and
Environmental Engineering Department at Columbia University. I would also like to thank
Professor Nickolas J. Themelis and the Earth Engineering Center at Columbia University for
funding this research during the summer of 2009.
Additionally, I would be remiss not to acknowledge John Griffith and Tom Pinto of
Climax Global Energy of Summit, New Jersey for their data and helpful input of their
microwave pyrolysis process. Additional thanks to Dr. Scott Kaufman, who provided valuable
input on the life cycle analysis in this report and Kyle Fricker, my colleague, for contributing to
the Climax LCA.
Finally, I must also acknowledge the advice and support I have been given from some of
my Columbia colleagues: Tom Ferguson; Jawad Bahatti; Andrew Lin; Xiaozhou Zhou; Tim
Rappold; and Xinxin Li. Thank you to all who have been a part of this undertaking.

7
1. INTRODUCTION
1.1 Thesis Overview
The following paper discusses the conversion of waste plastics into useful materials via
microwave radiation. More specifically, this report investigates microwave pyrolysis (MWP) as
an alternate tertiary recycling process for waste plastics.
The remainder of the initial section will provide the motivation for this project. The
second section introduces the current options of waste plastic management and the
advantages/disadvantages of each possibility. The third section discusses the pyrolysis of waste
plastics in general as a tertiary recycling process. This leads into a discussion about microwave
pyrolysis. Fundamentals of MWP are addressed as well as a discussion on the current status and
research. The fifth section is a life cycle analysis (LCA) of a commercialized microwave
pyrolysis process. Finally, there is a concluding section with comments about potential future
work.
1.2 MSW Background
Municipal Solid Waste (MSW) is comprised of items that are used in everyday life and
then thrown away. It includes paper, yard trimmings, and food scraps and many other durable
and non durable goods.
MSW is generated in staggering quantities in the United States, to the extent that the
magnitude of the tonnage is disputed. According to the United States Environmental Protection
Agency (US EPA), in their annual report on the generation and disposal of MSW, American
generated about 250 million tons of trash in the year 2008. Comparatively, according to a recent

8
survey of ‘The State of Garbage in America” conducted by BioCycle and the Earth Engineering
Center at Columbia University, Americans generated an estimated 413 million tons of MSW in
the same year. Despite this discrepancy, all analyses agree that the tonnage of MSW in America
is increasing. There is more MSW generated per year than ever previously recorded. Using the
conservative total MSW estimates from the US EPA, annual MSW generation has more than
doubled since the 1970s and increased by more than 21% in the last 20 years as shown in figure
1.1 below.
Figure 1.1. Total Annual MSW Generation for Select Years [Data: US EPA, 2009]
Furthermore, not only has the total mass of MSW increased throughout the years, but the
generation per capita has maintained a more or less constant level over the past 20 years as
shown in figure 1.2.

9
Figure 1.2. Per Capita Generation of MSW in the US [US EPA, 2009]
About 12% of all MSW consists of plastics. These are materials which cover a range of a
plastics, most notably polyethylene terephthalate (PET) and high density polyethylene (HDPE).
These plastics can be found in domestic products such as bottles for milk, soda, and detergent.
1.2.1 Plastics
Plastics are a generic group of materials composed of high molecular weight chains with
a carbon backbone. These materials are typically defined by its monomer, which is a smaller
compound that is linked together with its repeated units to form the material. Plastics have
different properties depending on the different polymers. They are common in everyday life as
most plastics have the same attributes. They are very resistant to chemicals, are thermal and
electric insulators, are light weight, and can be processed into varying thickness and shapes
(ACC 2009).

10
Plastics can be categorized by various criteria including chemical composition, chemical
structure, stiffness, the type of application, and processing method. Of these, the most common
categories are chemical composition and structure. Chemical composition classifies plastics by
the type of monomer and polymerization (e.g. polyolefins, polyesters, polycarbonates and
polyurethanes). Chemical structure meanwhile is associated with bonding linearity, branching,
and cross-linking. Another categorization-which is considered is discussed in recycling is
thermoplastics vs. thermosets, as shown in figure 1.3 below.
Figure 1.3. Examples of Thermoplastics and Thermosets
[Adapted from Feedstock Recycling of Plastic Wastes. J. Aguado]

11
Thermoplastics, which are most commodity plastics like HDPE or PET, soften when heated
since there is little bonding when the molecular chains. Thermosets meanwhile, which are
plastics found in circuit boards and epoxy resins, thermally decompose while heating (which has
implications later in this paper). In general however, according to the EPA, the vast majority
(99%) of MSW plastics are thermoplastics. A typical MSW plastic stream can be considered as
the following (% by tonnage/mass) 48% HDPE not from milk bottles, 26% PET from soda
bottles, 21% unpigmented HDPE from milk bottles, 2% PET not from soda bottles and, 2%
PVC.
1.3 Plastic Waste Management
Given the importance of plastics in everyday life and the large quantities with which it is
disposed, it is critical to evaluate how plastics are managed as they are accumulated in municipal
solid waste streams. Primary (mechanical) recycling, which reuses plastic in a similar application
as its initial use provides the highest value but is by and large uncommon, only 6.8% of all
plastics according to the US EPA. In fact, it has been estimated that only 15-20% of all MSW
plastics can be effectively recycled by conventional mechanical recycling technologies--i.e.
sorting/grinding/washing/and extrusion (Kaminsky 2006). Beyond this level, plastics are
mingled with and contained by extraneous materials such as soil, dirt, aluminum foils, papers
labels, and food remnants. A lot of plastic waste, for example medical waste, food packages,
personal hygiene products and many other packaging products that make a large part of waste
plastics and therefore cannot be recycled and reused (PACIA 2006).
In the following section, options of plastic waste management are discussed.

12
2. PLASTIC WASTE MANAGEMENT METHODS
2.1 Recycling
In general, materials recycling can be divided into three (or four) general levels: primary,
secondary, and tertiary. Primary recycling processes materials into a product with physical and
chemical characteristics similar to the original product. Secondary recycling turns waste into
products with characteristics that are less demanding than the original. Tertiary recycling (also
known as feedstock recycling) - the processing of waste into fuels or basic chemicals (Hind
1999). It should be noted that incineration is sometimes considered recycling where the heat
recovery is considered a product in the same way a monomer or oil would. In this context of this
report, incineration is considered different than recycling.
Primary recycling of post-consumer plastics packaging gained momentum in the United
States during the 1980s as a result of state level bottle deposit programs, which produced a
consistent supply of returned PET bottles. HDPE milk jugs were added to the deposit programs
later that decade. Since then, plastic recycling has grown steadily (Hind 1999).
It has been estimated that about 60 percent of the U.S. population (~148 million people)
have access to a plastics recycling program. The first step is collection of post-consumer use.
This commonly exists in two forms: (1) curbside collection - where consumers place designated
plastics in a special bin to be picked up by a public or private hauling company and (2) drop-off
centers - where consumers take their recyclables to a centrally located facility. Most curbside
programs collect both PET and HDPE (Aguado 1999).

13
To make sorting and thus recycling easier, the American Society of Plastics Industry
developed a standard marking code to help consumers identify and sort the main types of plastic.
These types and their most common uses are shown in table 2.1 below.
Table 2.1. Main Types of Plastics and Common Uses [Adapted: American Plastics Council]
After collection, the plastics are delivered to a material recovery/recycling facility (MRF)
for sorting into single resin streams to increase product value. The sorted plastics are then baled
to reduce shipping costs to reclaimers. During this, reclamation plastics are chopped into flakes,
washed to remove contaminants and sold to end users to manufacture new products (e.g. bottles,
containers, clothing, carpet, plastic lumber) (Aguado 1999).

14
Figure 2.1. Typical Reclamation Process of Plastic Recycling [Adapted from Aguado 1999]
2.2 Landfilling
If plastics are not recycled, by and large they will end up being transported to landfills for
long term storage. According to the EPA, the United States has more than 3,000 active landfills
and over 10,000 municipal landfills. In a typical landfill, based on average MSW streams it is
estimated that plastics will make up 7% of the landfill waste by weight, and 18% by volume
(Decker 1997). Unlike several waste components sent to landfills, MSW plastics will not release
any methane or light gases for energy recovery. Therefore, there is no immediate impact from
landfilling waste plastics; a longer term impact is assessed by comparing land use or the amount
of crude oil that is saved by recycling previous plastics as opposed to using crude oil as a
feedstock for the production of new polymers.

15
Figure 2.2 Hierarchy of Waste Management [Adapted from EnviroTech.com]
It is also worth noting the “waste management pyramids” as shown in figure 2.2 above.
According to US EPA, sustainability means meeting the needs of the present generation without
compromising the ability of future generations to meet their needs. The bottom line of
environmentally sustainable solid waste management is to reduce the amount of trash for final
disposal and then dispose of it in the environmentally safest manner. The most desirable and
sustainable way of managing materials to if possible avoid and minimize if possible, and if not
possible, then to recycle or reuse.
2.3 Waste-to-Energy
As of 2010, there are 87 waste-to-energy facilities in the United States, in which
incineration of waste is used to produce energy for power and heating (NYT). However, this
method of energy recovery has received much social resistance due to the atmospheric pollution
created by combustion process (Garcia et al. 2003). While MSW plastics have excellent fuel
value (on the order of 40-45 MJ/kg for HDPE and PET), in practice plastics are not used as WTE

16
feedstock, in part because of their recyclability, and since they are difficult to burn due at a
controllable rate without additional processing. The result of the uncontrolled combustion is
localized areas of oxygen deficiency-which in return affect the release products of incomplete
combustion (Kamisky 2006). Incineration of waste plastic of certain plastics has been linked in
the past to the formation of dioxins, nitrogen oxides and chlorinated compounds, especially in
the case of polyvinyl chloride (PVC) which is ~57 wt% chlorine. Additionally, the generation of
chlorine (as Cl2 or HCl) from combustion in waste-to-energy facilities presents a major operating
problem as it causes significant corrosion in the boiler system which increases operating costs
and decreases the electrical output (Krause 1987).
2.4 Feedstock/Tertiary Recycling
The concept of feedstock recycling is based on thermal and sometime thermal and
catalytic breakdown of polymer structure yielding monomers, oil fractions, aromatic fractions,
synthesis crude or synthesis gas (Buekens 2006). “Thermal cracking” is usually considered to be
pyrolysis-which will be discussed in further detail in the next section.
Feedstock recycling can be considered complementary to mechanical recycling since it is
has the sensitivity to handle plastic waste streams that are unsorted and contaminated. There are
several routes that can be considered which include, but are not exclusive to the chemical
depolymerization, thermal decomposition, gasification, catalytic cracking and reforming, and
hydrogenation, as shown in figure 2.3 below.

17
Figure 2.3. Different Forms of Tertiary Recycling
While chemical depolymerization (original monomer recovery) is the highest product
value, the feed for this process requires a pure plastic stream (e.g. styrene can be recovered from
polystyrene) and therefore presorting. Meanwhile, while pyrolysis (thermal decomposition) is
known for a “low quality” product (a mixture of various hydrocarbons), it is an advantage to
MSW plastics in that it can tolerate a mixed feed. Therefore, one can conclude that pyrolysis is
an ideal route (economically) for recovering some value for mixed, unwashed MSW plastics
which would not be candidates for primary recycling and otherwise reside in landfills.

18
3. PYROLYSIS OF MSW PLASTICS
3.1 Introduction
Simply defined, pyrolysis is the chemical and thermal decomposition of molecules in the
absence of oxygen. As most thermoplastics begin to degrade above ~300 °C, plastic pyrolysis
can be proceed at low (< 400°C), medium (400°C-600°), or at high temperatures (>600°C).
Process pressure is generally atmospheric (Buekens 2006).
There are several major factors which help to determine the product distribution from
plastic pyrolysis. Temperature is the most important operating variable, as it determines both the
rate of decomposition, and the stability of reaction products (lower temperatures favors
formation of larger molecules, whereas high temperature favors formation of smaller molecules).
Reaction time is also important as short residence times favor primary products like monomer
whereas longer times favor more thermodynamically stable products with longer times. Reactor
type is also important. This determines the quality of the heat transfer, as well as the gas and
liquid residence times (Kamisky 2006).
3.2 Mechanisms / Modes of Decomposition
In general, the pyrolysis of plastics follows complex routes that cannot be described by a
single or a set of chemical reactions. Nevertheless, pyrolysis is well understood regarding the
typical mechanisms by which these polymers degrade based on molecular composition and
structure.
The chemical reactions occurring during decomposition of polymers can be divided into
those involving atoms in main polymer chain and those involving side chains or side groups. The

19
two groups of chemical reactions are shown in figure 3.1, as main chain reactions and side chain
reactions. These two types of chemical reactions can again be divided into two groups. The
decomposition of some polymers can be explained by one of these general mechanisms (Beyler
and Hirschler 2001).
For simple thermoplastics such as polyethylene, the most common reaction mechanism is
the reaction involving the breaking of the bonds in the main polymer chain, termed chain
scission. The eight generic types of reactions shown in figure 3.1 are involved in this simple
decomposition process. These eight generic reactions are 1) random chain scission, 2) end chain
scission 3) intramolecular H* transfer, 4) intermolecular H* transfer, 5) unzipping, 6)
termination, 7) recombination and 8) disproportionation. Chain scission can occur in the chain
end (termed end chain scission, E) or at any random location in the chain (termed random chain
scission, R). Random chain scissions generally result in the generation of both monomers and
oligomers and a variety of other chemical species. Hence, the volatile products of decomposition
depend on the relative volatility of the resulting molecules (Beyler and Hirschler 2001).
The thermal stability of polyolefins, such as polyethylene is strongly affected by
branching. Linear polymers are most stable and polymers with branching less stable. Studies
show that the dominant decomposition mechanism for polyethylene is through random scission
(Aguado et al. 2002a).

20
Figure 3.1. General Polymer Decomposition Mechanism
[Adapted from Beyler and Hirschler (2001)]
As a result of the complex random chain rupture, the pyrolysis of polyethylene at low
temperature operations favors the production of waxes and paraffin oils and light oils and light
alkanes at high temperatures. Conversely, PET, which exhibits predominantly hydrogen transfer
and decarboxylation, branches off benzoic acid and vinyl terephthalate (Duncan 2000). PVC via
HCl elimination favors production of benzene at lower temperatures and HCl vapor and toluene
at higher temperatures.

21
3.3 Reactors
In regards to reactor design, compared with other methods of gas-solid contacting (e.g.
fixed beds, rotary cylinders), fluidized beds have several advantages over alternative reactor
designs. Fluidized beds have rapid and good mixing of solids—which leads to almost uniform
isothermal conditions throughout the fluidized bed. This allows for easy and reliable process
control. The range of operating temperatures is generally lower than that of other gas-solid
reactors. It also has a high process flexibility—making it possible to utilize different fluidizing
agents (in pyrolysis nitrogen could be used), operating temperatures and gas residence times and
the ability to operate with or without a catalyst (Arena 2006).
For polymer decomposition, fluidized beds are beneficial in that they have excellent heat
and mass transfer that can reduce the time necessary for a reaction. They have a low tendency for
clogging with molten polymer during the degradation process and have the ability to maintain a
constant temperature throughout (Hernandez 2007).
There a few aspects about fluidized beds that might be considered for further study.
Conesa et al 1994 reported that yields of products obtained by fluidized bed pyrolysis come via
two contributions. The first is primary degradation or cracking of the polymer which occurs in
the dense bed. The second contribution is the so called secondary and ternary reactions which
occur partially in the bed and partially in the freeboard. The influence of the secondary or ternary
reactions could be more important for applications that do not use catalysts and may have an
impact on the design of the column. For improvements in pyrolyzing plastics in fluidized beds, it
may be beneficial to consider this effect.

22
Unfortunately one downside of fluidized bed reactor is that scale-up is not always easy to
realize. As a result, even if laboratory scale tests are promising, a pilot scale is often necessary to
verify that such a process can be conducted.
Over the past ten years, more attention has been given to microwave pyrolysis.
Microwaves initiate localized, molecular heating and could therefore under certain conditions be
advantageous a faster as more efficient reactor. The following section investigates this specific
process to MSW plastics.

23
4. MICROWAVE PYROLYSIS OF WASTE PLASTICS
4.1 Introduction
‘Microwaves’ is the name given to electromagnetic radiation 1 m to 1 mm in wavelength
that corresponds to a frequency of about 1 to 300 GHz as shown in figure 4.1 below. This
frequency range falls between radio waves and visible light in the electromagnetic spectrum
(Katz 1992). Most of the microwave frequency band is used for communications and radar, and
consequently it is regulated by the Federal Communications Commission.
Figure 4.1. Electromagnetic Spectrum. [Adapted from EWI]
As a result, certain frequencies are allocated for exclusive industrial, scientific, and medical use,
specifically 915 MHz, and 2.45, 5.85, and 20.2-21.2 GHz. Because present industrial and
medical uses are based on heating water only 915 MHz and 2.45 GHz have significant
application. These are the frequencies at which commercial units are designed to operate.
The practical application of microwave radiation started during the Second World War,
in the course of intensive research on electromagnetic radiation in the frequency range from 500
MHz to 100 GHz in the development of high-definition radar (Meredith 1998). In reality,
microwave heating is one form of electrical volumetric heating (along with ohmic, radio

24
frequency (RF), and conduction/induction) which is defined by all the infinitesimal elements
constituting the volume of a workload being each heated individually, ideally at the same rate.
In conventional thermal processing, energy is transferred to the material through
convection, conduction, and radiation of heat from the surfaces of the material. In contrast,
microwave energy is delivered directly to materials through molecular interaction with the
electromagnetic field. In heat transfer, energy is transferred due to thermal gradients, but
microwave heating is the transfer of electromagnetic energy to thermal energy and is energy
conversion rather than heat transfer (Thostensin 1999).
4.2 Microwave Systems
Microwave furnaces consist of three major components: the sources, the transmission
lines, and the applicator. The microwave source generates the electromagnetic radiation via
acceleration of charge, and transmission lines deliver the energy from the source to the
applicator-where the microwaves are either absorbed or reflected.
The main part of the microwave is the source- typically a magentron- the most common
microwave source, which is a vacuum tube. In this tube an anode (an electrode on which high
density of electrical charge is present) is set at a high potential compared to the cathode (another
electrode). The potential difference produces a strong electric field, and the cathode is then
heated to remove loosely bound valence electrons. These removed electrons are the accelerated
towards the anode due to the presence of the electric field. In the magnetron, as depicted in
figure 4.2 below, an external magnet is used to create a magnetic field perpendicular to the

25
electric field and the applied magnetic field creates a circumferential force on the electron as it is
accelerated to the anode. The force causes the electron to travel in a spiral direction, and this
creates a swirling cloud of electrons. As electrons pass the resonant cavities, the cavities set up
oscillations in the electron cloud, and the frequency of the oscillations depends on the size of the
cavities. Electromagnetic energy is coupled from one of the resonant cavities to the transmission
lines through a coaxial line or waveguide launcher (Thostenson 1999).
Figure 4.2. Schematic of Magnetron Microwave Tube [Adapted from Thostenson et al 1999]
The magnetron is able to generate the electromagnetic radiation with high efficiency for
electrical energy, about 85% for 900 MHz and ~80% for 2.45 GHz (Meredith 1998).

26
4.3 Microwave Heating
When materials are exposed to a microwave field, there are essentially three different
ways by which the material will be heated. These mechanisms are based on how the molecules
of the material behave when subjected to the microwaves. The first mechanism is polarization-
having either the electrons of individual atoms (electronic polarization) or the nuclei of the atoms
themselves (atomic polarization) are displaced from their equilibrium position, which results to
induced dipoles which respond to an applied field. This effect is more pronounced in molecules
that have permanent dipoles from asymmetric charge distributions-like water. The second
mechanism is interfacial polarization—which arises from a buildup of charge in contact areas of
heterogeneous systems (heterogeneous being defined as multiple components that have different
conductivities or dielectric constants). The third mechanism is via ionic conduction where some
materials produce electric currents when subjected to EM fields. As the atoms of the molecules
of a given material undergo one of these phenomena, the movements aligned with the EM fields
cause a localized friction or heating.
The heating of materials can be further described by the following dielectric power
absorption equation:
P = Kf E2έ tan δ (Thostensin 1999)
where P is the power dissipation in W/cm3, K is a constant equal to 55.61 x 10
-14, f is the
applied frequency in Hz, E is the electric field strength in V/cm, έ is the dielectric constant, and
tan δ is the dielectric loss tangent. Both έ and tan δ have a dependence on operating frequency
and the sample temperature. In practice these values also vary with moisture content and

27
physical state (solid or liquid). The electromagnetic field energy dissipated as heat per unit
volume is proportional to the dielectric loss factor, the square of the field strength, and the
frequency of the applied field. This expression assumes that the influences upon heating rate due
to the heats of the reaction are negligible (Chen 1993).
Based on the above dissipation expression, the dielectric loss factor is largely important
as to whether a material can be heated and possibly pyrolyzed by microwave radiation. This
quantity is directly proportional to a more common material property, the dielectric constant.
Thermoplastics (with the exception of nylons) normally have very low dielectric
constants and low loss factors and are known as ‘transparent’ to microwaves. Therefore they
have not been thought of as candidates for microwave processing in the past. For example,
polyethylene, polystyrene, and polypropylene--three common polymers that belong in MSW
streams--have dielectric loss factors between 0.0007-0.0008 respectively at room temperature in
response to 2.45 GHz radiation—the most common microwave source—with little improvement
at lower frequencies or higher temperatures up to 100 °C, as obtained from the Engineer’s
Handbook of Industrial Microwave Heating. The magnitude of this transparency can be
understood by comparing those values to a dielectric loss factor of 13.0 for distilled water at
room temperature (25 °C). At 2.45 GHz, substances with dielectric loss factors on order of 10
require an electric field of 4.69 V/cm to increase 11°C/min, whereas substances with dielectric
loss factors of 0.01 require 148 V/cm for the same temperature rate-which are unsafe electric
fields to be generated by commercial devices.

28
The poor dielectric properties of plastics are aggravated by the fact that when plastics are
heated and have reached their melting point or gel transition, absorption of microwaves increases
substantially (Chen 1993). This can result in a poorly controlled pyrolytic reaction.
In order to take advantage of microwave heating with plastics, an additional material
must be intimately mixed with a microwave-absorbent material. By doing so, the plastics are not
directly heated via the mechanism previously discussed above, but rather by conduction from the
quickly heated-highly microwave absorbent material to the plastics. This is referred to often as
“microwave-induced” or “microwave-assisted” pyrolysis where the microwaves are considered
for the most part an indirect source of heat. The material that is most known for its use as
absorbent is graphitic carbon since it has dielectric properties of the same magnitude as water
(dielectric loss factor: ~12-15) and is cheap and highly abundant (Ludlow-Palafox 2006).
Microwave heating of carbon is used commonly in sintering in the ceramics industry. Carbon
accelerates the first stage of heating by applying thin coats of about millimeter depths to ceramic
surfaces (Katz 1992).
4.4 Microwave Pyrolysis Literature
While there has been some published literature on the microwave pyrolysis of waste tires
and biomass (e.g. corn stover), literature microwave induced pyrolysis of plastics is rare. In fact,
only one group from the University of Cambridge (UK) has been found to publish work on this
subject at the time of this paper.

29
Ludlow-Palafox et al (2001) implemented a lab scale, modified microwave furnace
system which is represented by the schematic in figure 4.3 below. Plastics, in shredded or
pelletized form, are fed by a hopper (3) to a quartz vessel (2) within the microwave cavity (1).
Pulverized carbon is also added as the material which is susceptible to microwave heating.
Nitrogen is fed into the reactor vessel to ensure the oxygen-depleted reaction environment (5).
Upon pyrolysis, the products volatilize and exit the microwave system. The vapors are
condensed (7) into the respective liquid (8, 9) and light gas fractions (10).
Figure 4.3. Schematic of MWP Setup
[Adapted from Ludlow-Palafox et al (2001)]
50 grams of HDPE (average density: 954 kg/m3 and diameter: 3 mm) was mixed with a kilogram
of particulate carbon. The microwave furnace (maximum operating power: 5 kW) operated at
1250 W (2.45 GHz, for 500 °C ) for 350 seconds upon addition of the plastic. The carbon was
heated additionally for a few minutes prior as well.
Slow agitation (6 rpm) maintained the intimate mixture between the carbon and the
HDPE pellets while nitrogen was continuously flowed (1.4 L/min) to remove oxygen from the
quartz chamber. After 350 seconds there was no plastic remnant within the reactor. The overall
recovery was a gaseous stream (19% by mass) and an oil/liquid fraction (81%). Thermocouples
measuring the temperature of the degrading plastics reported a system temperature of 500 °C.

30
Additional results were reported at 600 °C and 700 °C respectively. Temperature was reportedly
maintained by switching on and off various magnetrons. The product stream from the
condensing system was analyzed via gas chromatography-mass spectrometry (GC/MS).
Figure 4.4. Photo of the MWP Laboratory System [Univ. Cambridge]
Ludlow-Palafox et al (2001) had several key findings. The first was that reactor
temperature had the greatest effect on the rate if reaction/decomposition as shown in figure 4.5
below. This was quantified by the accumulation of volume in the main collection flask over
reaction time.

31
Figure 4.5. Cumulative Yield of Products for MWP of 50 grams of HDPE Over Time at 500 °C
and 600 °C. [Adapted from Ludlow-Palafox (2001)]
At 600°C, no additional oils or waxes accumulated in the collection vessel after 120 seconds,
suggesting that the entire 50 gram sample was pyrolyzed within that duration. It should be noted
that reactions reported at 700°C were extremely fast (flash pyrolysis) and were not able to report
accumulated volumes over a comparable time scale.
Table 4.1. Product Yield (wt%) from Polyethylene Pyrolysis for Various Reactors
500°C 600°C
Paper Reactor Gas Oil/Wax Solid Gas Oil/Wax Solid
Conesa et al 1997 Batch Fluidized ~7-16 NR NR ~18-60 NR NR
Cozzani et al 1997 Fixed Bed ~8-12 ~83-90 ~2-5 ~20-35 ~55-74 ~6-10
Williams et al 1999 Fluidized Bed 10.8 89.2 0 24.2 75.8 0
Ludlow-Palafox et al 2001 Microwave 19 81 0 20.9 79.1 0
Note: NR = not reported
In Table 4.1 above, some of the results from Ludlow-Palafox et al were compared versus
literature of polyethylene pyrolysis for alternate reactors. From this table two conclusions can be
made. First, an increase in temperature causes little difference in the liquid/gas yields of the

32
microwave reactor whereas it had quite an impact for the fluidized and fixed beds respectively.
Secondly, the magnitude (wt%) of the oil and wax seems to be largest for the microwave
pyrolysis reactor. This is a favorable result for the consideration of upgrading the pyrolysis
oil/wax into a crude liquid fuel.
4.5 Possible “Microwave Effect”
As previously discussed, microwave radiation interacts differently depending on the
given material and its dielectric properties. In microwave–induced pyrolysis, it is thought that the
pulverized carbon (a microwave absorbent material) absorbs the microwave energy and conducts
heat to the shredded plastics it is mixed with, thereby degrading the polymers. However, there
are some researchers who claim there may be more than conduction of heat from the carbon to
the plastic taking place. A second mechanism, a so called non-thermal effect, in which the
microwave radiation may be contributing to a lowering of the apparent activation energy of the
polymer molecular decomposition, manifested in a decrease of reaction rate.
In the past some organic reactions have suggested this particular phenomena. Gedye et al
initially claimed that significant rate enhancements in hydrolysis and esterification reactions in a
microwave reactor. The proposed lowering of the activation energy has been hypothesized to be
the storage of microwaves in the vibrational energy of a molecule--an enthalpic effect or by
alignment of molecules—an entropic effect (Marand 1992).
Arguments attempting to falsify the “microwave effect” suggest that experimental
mistakes have been made by extrapolating concepts of conventional heating into microwave

33
heating. The possibility of reduced temperature measurements is temperature reading due to heat
losses that occur because of conduction through thermocouple guards (Olmstead 1997). The
debate continues to the present day.
Regardless of whether the non-thermal effect exists, the fact remains that microwave
have been shown to successfully induce pyrolysis of waste plastics. In the following section, a
discussion of whether a large scale implementation of this technology is feasible is made via a
life cycle analysis of a patented MSW plastic microwave pyrolysis process.

34
5. A LIFE CYCLE ASSESSMENT OF MWP OF WASTE PLASTICS
5.1 Introduction
Although microwave pyrolysis has been shown to have similar product streams to
conventional pyrolysis technologies, there are concerns that its input energy requirement, and
subsequent carbon footprint, may make this process inefficient and undesirable as a large scale
waste plastic management scenario. Despite its high efficiency of converting electrical energy
into microwave radiation, microwaves still require electricity, which if produced via combustion
of primary energy sources (i.e. coal), is produced inefficiently (~30-40%) and therefore
decreases the overall process efficiency. This claim is investigated in the following chapter
using a case study of a patented microwave pyrolysis technology which has been proposed to
operate in Patterson, New Jersey, USA. In addition to determining the carbon footprint of the
process, its impact will be weighed against the footprint determined for a rival tertiary recycling
technology gasification and accompanied Fischer-Tropsch synthesis as well as incineration for
the given waste stream.
Climax Global Energy (Summit, New Jersey) has commercialized a microwave pyrolysis
technology that can convert landfill-bound plastics into beneficial materials, with particular
interests in upgrading to produce liquid fuels. Estimated pilot-scale microwave pyrolysis data
was provided for the conversion of waste plastics into Fischer-Tropsch (F-T) wax. The current
operating scale is 20 metric tons of MRF plastic feed per day. A product upgrading unit has not
been incorporated into their MWP systems yet, and thus, the data are only available for F-T wax
as the final product. However, considering that the required product upgrading process would be
35
very similar to that of the F-T process, the future addition of this unit should not pose any
technical difficulties for the commercialization of such technology.
Two MWP scenarios were considered the LCA study: one that exclusively employed
microwaves (MWP-1) and one that integrated microwave and a hybrid thermal microwave
system using the waste light off-gas (MWP-2).
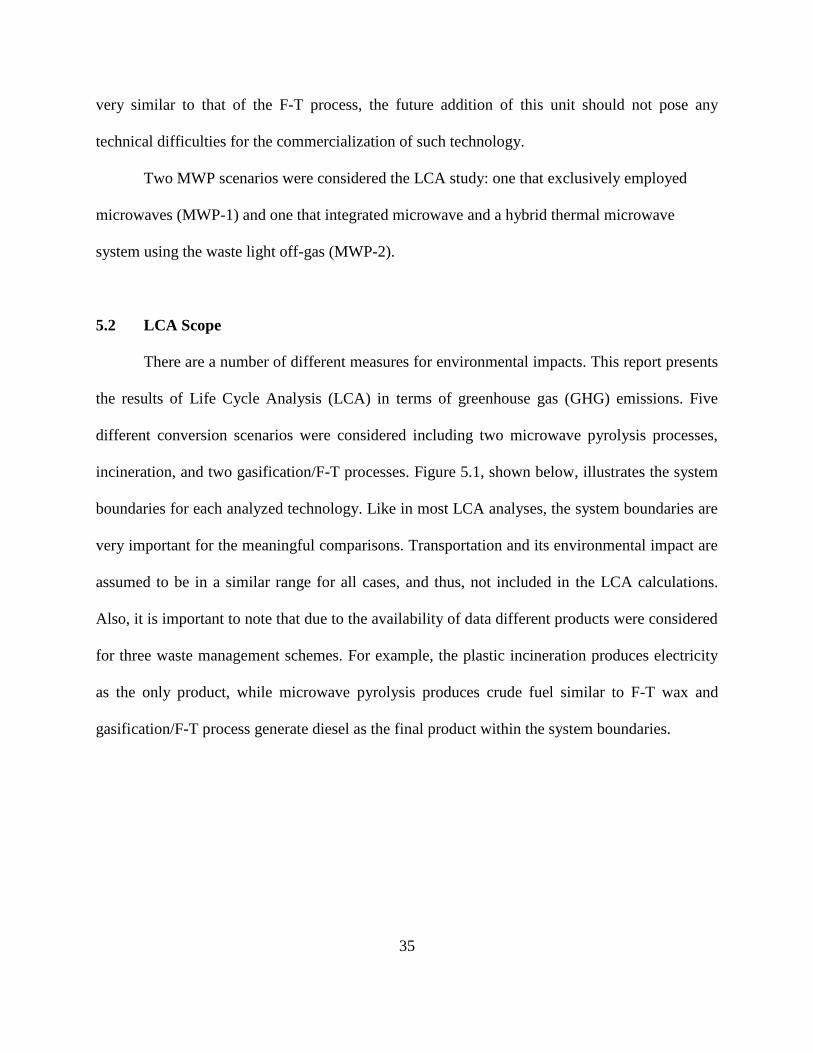
5.2 LCA Scope
There are a number of different measures for environmental impacts. This report presents
the results of Life Cycle Analysis (LCA) in terms of greenhouse gas (GHG) emissions. Five
different conversion scenarios were considered including two microwave pyrolysis processes,
incineration, and two gasification/F-T processes. Figure 5.1, shown below, illustrates the system
boundaries for each analyzed technology. Like in most LCA analyses, the system boundaries are
very important for the meaningful comparisons. Transportation and its environmental impact are
assumed to be in a similar range for all cases, and thus, not included in the LCA calculations.
Also, it is important to note that due to the availability of data different products were considered
for three waste management schemes. For example, the plastic incineration produces electricity
as the only product, while microwave pyrolysis produces crude fuel similar to F-T wax and
gasification/F-T process generate diesel as the final product within the system boundaries.

36
Figure 5.1. Description of Three Waste Management Schemes
It should also be noted that since this study is based on the GHG emission analysis of various
waste conversion technologies, a comparison cannot be directly made with landfilling. A
comparison to landfill would necessitate some considerations regarding the land use and GHG
emission due to landfill gas. However, generally there is no landfill GHG emission associated
with waste plastic’s degradation, it is difficult to discuss the land use for the proposed
technologies. Thus, only the technologies that convert non-recyclable plastics into products such
as fuels, chemical and electricity were assessed as a part of this study.
37
5.3 LCA Process Assumptions and Calculations
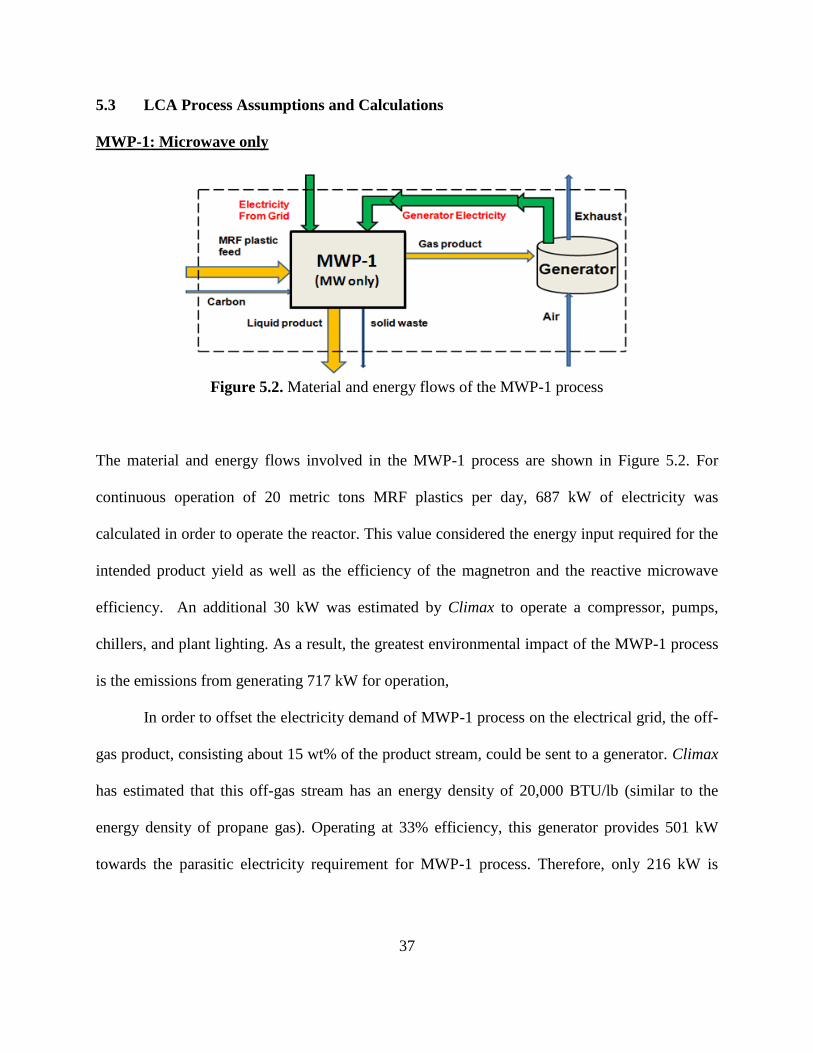
MWP-1: Microwave only
Figure 5.2. Material and energy flows of the MWP-1 process
The material and energy flows involved in the MWP-1 process are shown in Figure 5.2. For
continuous operation of 20 metric tons MRF plastics per day, 687 kW of electricity was
calculated in order to operate the reactor. This value considered the energy input required for the
intended product yield as well as the efficiency of the magnetron and the reactive microwave
efficiency. An additional 30 kW was estimated by Climax to operate a compressor, pumps,
chillers, and plant lighting. As a result, the greatest environmental impact of the MWP-1 process
is the emissions from generating 717 kW for operation,
In order to offset the electricity demand of MWP-1 process on the electrical grid, the off-
gas product, consisting about 15 wt% of the product stream, could be sent to a generator. Climax
has estimated that this off-gas stream has an energy density of 20,000 BTU/lb (similar to the
energy density of propane gas). Operating at 33% efficiency, this generator provides 501 kW
towards the parasitic electricity requirement for MWP-1 process. Therefore, only 216 kW is

38
needed from the grid. Furthermore, depending on the electricity mix of the grid, this byproduct
utilization may also reduces the overall carbon footprint of the MWP-1 process.
According to a July 2000 US Department of Energy Report, “Carbon Dioxide Emissions
from the Generation of Electrical Power in the United States,” electricity generated by coal (the
largest source for base load electricity in the US), emits 2.1 lb CO2 per kWh production. For gas
supplied electricity, the value of 1.3 lb CO2 per kWh was reported. Other pollutants were
considered to be minimal in comparison to magnitude of CO2 production. In order to calculate
the GHG emission associated with the electricity coming from the grid, a location specific
electricity mix is considered. Since Climax’s plant is located in New Jersey, the following
electricity mix listed in Table 1 was considered.
Table 5.1. Fuel Electricity Generation in NJ (EIA 2009 Data)
Electricity Generation
Method
Electricity Generation
(thousand MWh)
Total Net Electricity Generation 4769
Natural Gas-Fired 1646
Coal-Fired 284
Nuclear 2711
Other Renewables 76
This shows that 56.8% of electricity in NJ is provided by carbon free nuclear power, with the
majority of difference coming from natural gas fired facilities (34.5%) and only about 6% from
coal fired plants. The lower carbon emission associated with the electricity mix results in a lower
carbon footprint for the MWP products. For the analysis of the same MWP technologies in
another state, the impact could be significantly different, as about 50% of the United States
electricity today still comes from coal combustion.

39
MWP-2: Microwave & Thermal Treatment
Figure 5.3. Material and energy flows of the MWP-2 process
In the second scenario (MWP-2) shown in Figure 5.3, a hybrid reactor is used with 50%
of the pyrolysis energy provided by thermal heat and 50% by microwaves. The addition of
thermal heat is to overcome the low microwave susceptibility of plastics during the pyrolysis
process- as the permittivity of microwave radiation is increased at higher temperatures, and
reduces the requirement of microwaves in the pyrolysis reactor. The rejected heat from the
generated is used after start-up to liquefy the plastics and decrease the necessary microwave
radiation input. In doing so, following the other assumptions and values in the MWP-1 process,
373 kW of electricity (vs. 717 in MWP-1) is required for processing 20 metric tons of MRF
plastics per day. This allows for a surplus of 124 kW of electricity that is not used in the process
after utilizing the 15 wt% of gaseous products for electricity. Although this is promising benefit,
since this has not been currently integrated in their design, an output credit of providing
electricity to the grid was not considered within the scope of this LCA.

40
Assuming that the electricity produced in MWP-2 scenario with 20,000 BTU/lb gas
stream at 33% efficiency, the amount of heat rejected is more than four times the amount of
energy necessary to incorporate into the hybrid reactor. Further heat utilization is possible, such
as gasification of the solid residue stream. But given the quantity of the solid stream, conversion
to a new product would be impractical in application versus, recycling. Furthermore, there is no
infrastructure in place to utilize the waste heat to provide heat steam/hot water. Therefore it is
assumed that all heat unused by the plastic liquefaction process is rejected and wasted.
Given the same emission analysis as MWP-1 and the emissions analysis from operating
the generator, and a product energy density of F-T wax of 46.2 MJ/kg, the GHG emission for
MWP-2 process was determined to be 10.1 kg CO2 per million BTU of product.
5.4 Compared Processes
5.4.1 Gasification and Fischer-Tropsch Synthesis of MSW Plastics (GFT-1 and GFT-2)
Author’s note: This values obtained for the LCA for gasification and FT synthesis and
incineration were performed with and co-authored by Kyle Fricker ([email protected]),
junior research associate of the Earth and Engineering Center at Columbia University.
Gasification is a thermochemical process that converts the carbonaceous material to
synthesis gas (syngas) – an energetic gaseous fuel composed primarily of carbon monoxide,
hydrogen, carbon dioxide, and methane that can be used in power generation or chemical/liquid
fuel synthesis. By varying reaction parameters and further processing it is possible to fine tune
the syngas composition for certain applications (Tijmensen 2002). The syngas can be used to
generate electricity, yet, for this study, the syngas will be further processed into a liquid fuel

41
using Fischer-Tropsch technology (Huber 2006). Prior to alkane synthesis, several reforming and
conditioning steps are needed to purify the syngas. After the catalytic transformation of syngas to
Fischer-Tropsch crude oil/wax, the product is upgraded to produce primarily synthetic diesel fuel
and naphtha.
During gasification numerous chemical phenomena occur concurrently. Partial oxidation
is most important because it is responsible for producing the syngas, yet pyrolysis and
hydrogenation are also occurring. The process is very flexible in its feedstock – any carbon-
containing material can be gasified including materials in municipal solid waste. The products,
shown below in equation (1), will vary with different feedstocks, and the syngas can be further
adjusted through manipulation of operating conditions and downstream gas treatment (Higman
& van der Burgt 2008, Yung 2009).
Carbonaceous Material (thermoplastics) + Oxidant (O2, H2O) (1)
→ CO, H2, CO2, H2O, CH4, hydrocarbons
→ tar, char, ash
→ HCl, NH3, sulfur species
The overall Fischer-Tropsch (FT) reaction is represented by equation (2) below. The
appropriate H2/CO ratio is maintained through governing the kinetics of the reversible water gas
shift (WGS) reaction (3) below. The Anderson-Schulz-Flory (ASF) polymerization model
predicts the distribution of alkane chain products ranging from C1 to C50. The process was
developed early in the 20th century, yet catalysts are still being developed to select the desired
product range. The methane produced during F-T synthesis, usually larger quantities than

42
predicted by the ASF model, can be used to generate electricity or heat and improve the overall
process efficiency (Huber 2006).
CO + 2H2 → CnHn + H2O (2)
CO + H2O ↔ CO2 + H2 (3)
The products of FT synthesis are either olefin- or paraffin-rich depending on the
operating conditions and the catalyst choice. Long carbon chained paraffin products (C12-C19)
form at low reaction temperatures and produce FT waxes and synthetic diesel fuel. The shorter
carbon chain olefins (C5-C10) occur at high reaction temperatures and can be further processed
to make gasoline and other chemicals.
Since plastic gasification is an emerging research field, literature on gasification of pure
plastics is not readily available, emissions calculations are based on coal gasification data. This
is an acceptable assumption since the carbon content (wt%) in the plastic residue is similar to
that of coal (Oak Ridge National Laboratory Data: HDPE : ~85 wt% C, PET: 62 wt%, coal: ~75
wt%).
Assuming that GFT can achieve a similar product distribution from Climax’s pilot
design, F-T diesel (LHV: 123,600 Btu/gal, Norton et al. 1998), two GFT scenarios were
considered. GFT-1 is a base case, in which all CO2 is vented to the atmosphere and all off-gas
from the F-T reactor and the product upgrading unit is flared (similar to MWP-1). GFT-2 is
designed so that nearly all the process off-gas is used for the cogeneration of heat, steam, and/or
electricity (analogous to MWP-2). In doing so the impact was determined to be 107.3 kg CO2-eq

43
per million Btu of product (which is mostly diesel) for GFT-1, and 72.96 kg CO2-eq per million
Btu of product for GFT-2 respectively.
5.4.2 Incineration (PI)
The carbon footprint of incineration (LCA scenario-PI “plastic incineration’) was
determined using methodology and values presented by Johnke (2010) in section 2, which
provides an empirical relationship to calculate the emission from the incineration of municipal solid
waste streams.
5.5 LCA Discussion
For this study, the GHG emissions for five selected waste conversion processed based on
the system boundaries were estimated and illustrated in Figure 5.1. The LCA results are
summarized in Figure 5.4 (in terms of kg CO2-eq per million Btu of products) and Figure 5.5 (in
terms of ton of CO2-eq per day of operation).
Compared to the traditional waste-to-energy scheme of incineration, both MWP-1 and
MWP-2 resulted in less GHG emission per MBtu of products. The difference is not as significant
as between MWP and GFT processes but it is important to note that the microwave pyrolysis
technologies are capable of producing F-T wax which can be a feedstock for various fuels and
chemicals, whereas the incineration method only provides electricity. It should be also noted
that the further upgrading of F-T wax to liquid fuels such as gasoline and diesel has been omitted
in this study due to the lack of data availability. Further, the combustion (end use) of upgraded
liquid fuel has been left out of the GHG comparison since both MWP and GFT produce fuels

44
with similar combustion characteristics. However, overall the conversion of plastic wastes into
F-T wax via Climax’s microwave technology seems to be quite efficient.
When MWP-1 and MWP-2 were compared to two of the gasification/F-T schemes (GFT-
1 and GFT-2), their benefits seem to be more significant in terms of kg CO2-eq per million Btu of
products. However, this can be misleading since GFT-1 and GFT-2 are considered for the
production of diesel while MWP-1 and MWP-2 are designed to produce a mixture wax.
Therefore, without the incorporation of product upgrading process for the microwave-based
technologies, it is not fair to compare these technologies directly. While GHG emission data was
not available for such a product upgrade process, it is a well-known technology such that we do
not anticipate any technological difficulties with the development of efficient product upgrading
process for the MWP-1 and MWP-2 processes.
Figure 5.4. Comparison of Estimated Greenhouse Gas (GHG) emissions in terms of
kg CO2-eq per million Btu of products

45
The results shown in Figure 5.5 illustrate how much carbon in waste plastics is
transferred to the fuels during the process. As expected, most of carbon in waste plastics was
used to generate liquid fuels in MWP and GFT technologies, while a significant amount of
carbon was emitted as CO2 during the incineration of plastics.
Figure 5.5. Comparison of Estimated Greenhouse Gas (GHG) emissions in terms of ton of
CO2-eq per day of operation with the feed rate of 20 metric tons of waste plastics
Based on this evaluation, Climax’s microwave pyrolysis technologies seem to be
competitive with the gasification/F-T technologies for waste management. Among the five
selected process scenarios, the microwave pyrolysis with the utilization of thermal energy from

46
the off-gas seems to be the option with the most potential at this point in terms of GHG
emissions.
Overall, it appears that microwave pyrolysis may be a promising technology with a great
potential for environmental sustainability. However, further LCA is recommended once the
process is scaled up and more plant data is collected, since the GHG emission assessment is only
accurate as the input data.

47
6. CONCLUSIONS AND FUTURE WORK
Based on the life cycle analysis of Climax Global Energy’s process in Chapter 5,
microwave pyrolysis seems to have a promising future as a prospective tertiary recycling
method. Further inquiries are necessary however, before it has any real future in large scale
applications.
As is true in any life cycle analysis, the results are only as reliable as the quality of the
initial data and scope/boundary conditions. Climax’s estimation that its average oil/wax stream
can be approximated as a type of F-T wax (~C25) is a very loose assumption. In Ludlow-Palafox
et al 2001, the main components of the oil/wax fraction (from a 100% HDPE) yielded
compounds as small as C3 and as large C56. Furthermore, F-T wax itself does not have a market
of 16 metric tons a day, which by mass balance is about what would be expected based on the
MWP-1 and MWP-2 LCA conditions. Upgrading, however from controlled cracking of wax to
either diesel or to commodity oils may be an appealing alternative. However, those process
requirements, which were not determined and included in the LCA previously would certainly
increase the overall greenhouse emissions. That addition could change the comparison against
the other waste management processes.
While the available information released by Climax was enough to establish the power
requirements and the greenhouse gas emissions, one important variable which was excluded was
process temperature. While the measuring of temperature in a microwave system is somewhat
difficult-as exhibited by the conflicting studies of the non-thermal microwave effect, it is evident
in conventional pyrolysis studies that process temperature has a direct relationship to the type of
product. A higher process temperature, manifested by either an increase in heated carbon or in
magnetron power would raise the effective temperature to which the polymers are exposed and .

48
In terms of experimental work there a number of studies that can be done to further the
microwave pyrolysis of plastics experimental work initiated by Ludlow-Palafox et al (2001).
Since MSW plastics often include LDPE, PET, PVC, and sometimes PS along with high density
polyethylene, it would be worth investigating mixed stream pyrolysis. It should not be
anticipated that the results of these experiments coincide with results of mixed streams in other
pyrolysis reactors. As seen in Table 4.1, the influence of temperature, which compared MWP of
HDPE versus fixed bed and fluidized bed yielded an almost constant liquid/gas wt% despite
100° increase in process temperature.
Additional process conditions that may be worth investigating in a microwave reactor
include (1) vary the mass of pulverized carbon added per unit mass of plastic feed – find the
optimal ratio; (2) consider the change in quality of the product and the rate of reaction vs. the
diameter of the shredded/pelletized plastic; and (3) the change in quality of the product vs. the
particle diameter of the carbon. All of those studies can provide further hints at the mechanism
that is occurring which allows the plastics to thermally degrade despite their transparencies to
microwaves.
Lastly, another interesting application that may be of interest to explore further is the
removal of aluminum laminates which are attached to polypropylene wrappers, commonly found
in the food, beverage, and toiletry industry. One particular example is Tetrapack, a European
company whose drink cartons consist of a variety of types of laminates which contain ~6-30
micrometer width linings of aluminum (Ludlow-Palafox 2006). Microwave pyrolysis can be
able to simultaneously recover this metal sheet while generating olefins via low temperature
degradation of polypropylene.

49
7. REFERENCES
Aguado, J. and D. Serrano, Feedstock Recycling of Plastic Wastes, The Royal Society of
Chemistry, Cambridge, UK (1999).
Aguado, J. et al. 2002a, ‘Polyethylene Pyrolysis in a Conical Spouted Bed Reactor’, in AV
Bridgwater (ed), Pyrolysis and Gasification of Biomass and Waste, CPL Press, Strasbourg,
France.
APC, 2006, The History of plastic, American Plastics Council, Virginia, USA,
http://americanplasticscouncil.org (Accessed on April 26, 2010).
Arena, U. and M.L. Mastellone, “Fluidized-Bed Pyrolysis” Chapter 16 Feedstock Recycling and
Pyrolysis of Waste Plastics, Wiley, Hoboken, New Jersey, (2006).
Beyler, CL & Hirschler, MM 2001, ‘Thermal decomposition of polymers’, In PJ
Dinenno (ed), SFPE Hanbook of Fire Protection Engineering. 3rd ed., Quincy, Boston.
Buekens, A.G. “Introduction to Feedstock Recycling of Plastics” Feedstock Recycling and
Pyrolysis of Waste Plastics, Wiley, Hoboken, New Jersey, (2006).
Chen, M. et al., Basic Ideas of Microwave Processing of Polymers, Polymer Engineering and
Science, 33, 1092-1109 (1993).
Conesa, J.A. et al. Comparison Between the Pyrolysis of Two Types of Polyethylenes in a
Fluidized Bed Reactor, Journal of Analytical and Applied Pyrolysis, 30, 101-120 (1994).
Cozzani, V. et al., Influence of Gas Phase Reactions on the Product Yields Obtained in the
Pyrolysis of Polyethylene, Industrial and Engineering Chemistry Research, 36, 1955-1964
(1997).
Duncan, M.P. et al., Thermogravimetry of Polymers, in Encyclopedia of Analytical Chemistry,
R.A. Meyers (ed.) pp 8094-8105 Chichester: John Wiley & Sons, Ltd. 2000.
Gedye, R.N., W. Rank, and K.C. Westaway, Canadian Journal of Chemistry, 1991, 69
M. del Remedio Hernandez, A. Garcia, and A, Marcilla, Journal of Analytical and Applied
Pyrolysis 78 (2007) 272-281.
Hind, J. Recycling of Polymers, Plastics Consultancy Network, 1999
http://www.pcn.org/Technical%20Notes%20-%20Recycle1.htm (Accessed on May 1, 2010).
Huber, G.W., S. Iborra, A. Corma, ―Synthesis of Transportation Fuels from Biomass:
Chemistry, Catalysts, and Engineering, Chemical Reviews, 106, 4044-4098, (2006).

50
Johnke, B. “Emissions from Waste Incineration,” Good Practice Guidance and Uncertainty
Management in National Greenhouse Gas Inventories, Conference Paper 455, 455-468,
Research, http://www.ipcc-nggip.iges.or.jp/public/gp/bgp/5_3_Waste_Incineration.pdf
(Accessed on January 11, 2010).
Katz, J.D., Microwave Sintering of Ceramics, Annual Review of Materials Science, 22, 153-
170 (1992).
Kaminsky, W., Feedstock Recycling and Pyrolysis of Waste Plastics, Wiley, Hoboken, New
Jersey, (2006).
Krause, H.H. “Hot corrosion in boilers burning municipal solid waste.” Metal Handbook, Ninth
edition, Vol. 13: Corrosion, ASM International, 1987, p. 997-998.
Ludlow-Palafox, C. and H. Chase, Microwave-Induced Pyrolysis of Plastic Wastes, Industrial
and Engineering Chemistry Research. 40 (22) 4749-4756 (2001).
Marand, E. et al., Macromolecules, 25, 2243, (1992).
Marano, J.J. & J.P. Ciferno of Energy and Environmental Solutions, LLC, Life-Cycle
Greenhouse-Gas Emissions Inventory For Fischer-Tropsch Fuels, Prepared for U.S. Dept. of
Energy, (2001).
R. Meredith, Engineers Handbook of Industrial Microwave Heating, The Institution of Electrical
Engineers, London, UK, 1998.
Olmstead, W.E, and M.E. Brodwin, A Model for the Thermocouple Sensitivity During
Microwave Heating, International Journal of Heat and Mass Transfer, 40, 1559-1565 (1997).
PACIA 2006, Plastics and Chemicals Industries Association, Australia, www.pacia.org.au/
(Accessed on May 1, 2010).
Rosenthal, Elisabeth, “Europe Finds Clean Energy in Trash, But US Lags” NY Times April 12,
2010, Environment, http://www.nytimes.com/2010/04/13/science/earth/13trash.html (Accessed
May 1, 2010).
M.J.A. Tijmensen, A.P.C. Faaij, C.N. Hamelinck, M.R.M. van Hardeveld, ―Exploration of the
possibilities for production of Fischer Tropsch liquids and power via biomass gasification,
Biomass and Bioenergy, 23, 129-152, (2002).
Thostenson, E.T. and T.-W. Chou, Microwave Processing: Fundamentals and Applications,
Composites: Part A, 30 1055-1071 (1999).
U.S. Environmental Protection Agency (US EPA), “Municipal Solid Waste in the United States:
2007 Facts and Figures,” EPA530-R-08-010, (November 2008).

51