temporal variation of suspended sediment transport in … · temporal variation of suspended...
TRANSCRIPT

HYDROLOGICAL PROCESSESHydrol. Process. 28, 5972–5984 (2014)Published online 15 November 2013 in Wiley Online Library(wileyonlinelibrary.com) DOI: 10.1002/hyp.10090
Temporal variation of suspended sediment transport in theKoga catchment, North Western Ethiopia and environmental
implications
Eleni Yeshaneh,1* Alexander Eder1,2 and Günter Blöschl11 Vienna University of Technology, Centre for Water Resources Systems, Karlsplatz 13, 1040 Vienna, Austria
2 Institute for Land and Water Management Research, Pollnberstrasse 1, 3252 Petzenkirchen, Austria
* CCenE-m
Cop
Abstract:
Event sediment transport and yield were studied for 45 events in the upstream part of the 260 km2 agricultural Koga catchmentthat drains to an irrigation reservoir. Discharge and turbidity data were collected over a period of more than a year, accompaniedby grab sampling. Turbidity was very well correlated with the sediment concentrations from the samples (r = 0.99), whichallowed us to estimate the temporal patterns of sediment concentrations within events. The hysteresis patterns between dischargeand sediment concentrations were analysed to provide insight into the different sediment sources. Anticlockwise patterns are thedominant hysteresis patterns in the area, suggesting smaller contributions of suspended sediment from the river channels thanfrom the hillslopes and agricultural areas. Complicated types of hysteresis patterns were mostly observed for long events withmultiple peaks. For a given discharge, sediment yields in August and September, when the catchment was almost completelycovered with vegetation, were much smaller than during the rest of the rainy season. The hysteresis patterns and timing suggestthat the sediment availability from the agricultural areas and hillslopes affects sediment yields more strongly than does peakdischarge. Two distinct types of sediment rating curves were observed for the season when the agricultural land was covered withvegetation and when it was not, indicating the dominating contribution of land use/cover to sediment yields in the catchment. Therate of suspended sediment transport in the area was estimated as 25.6 t year�1 ha�1. Copyright © 2013 John Wiley & Sons, Ltd.
KEY WORDS event suspended sediment transport; sediment yield; hysteresis pattern
Received 6 June 2013; Accepted 9 October 2013
INTRODUCTION
Many countries suffer from land degradation and fromassociated processes such as gullying, flooding andsedimentation (Sadeghi et al., 2008). The economicimplication of this is more serious in developing countriesbecause of a lack of capacity to cope with it and also toreplace lost nutrients (Tamene and Vlek, 2008). Soilerosion in the Ethiopian highlands is a natural phenom-enon due to erosive rainfall and steep and undulatingtopography but is enhanced under agricultural systemsthat reduce protective soil cover (Guzman et al., 2013).The intensified use of the already stressed resources dueto high population growth in Ethiopia makes soil erosionthe most serious environmental problem affecting thequality of soil, land and water resources upon whichhumans depend for their subsistence (Shiferaw andHolden, 1999; Tamene and Vlek, 2008). The annual rate
orrespondence to: Eleni Yeshaneh, Vienna University of Technology,tre for Water Resources Systems, Karlsplatz 13, 1040 Vienna, Austria.ail: [email protected]
yright © 2013 John Wiley & Sons, Ltd.
of soil loss is significantly higher than the annual rate ofsoil formation rate in the country.Estimates of sediment yield and its temporal variation
are needed for various purposes including design oferosion control structures (Russel et al., 2001), rivermorphological computations and evaluation studies ofthe effects of various land use management practices(Gao and Pasternack, 2007; Sadeghi et al., 2008; Gaoand Puckett, 2011). Understanding and quantifyingerosion is important in highly erodible catchments thateventually contribute to siltation of downstreamreservoirs (Lopez-Tarazon et al., 2009; Gao and Puckett,2011; Guzman et al., 2013), especially with storms ofhigh rainfall intensity where run-off occurs over highlyunconsolidated sediments on agricultural areas (Nyssenet al., 2007). Once sediments reach the reservoirs, siltationbecomes a long-term socio-economical problem because itreduces water storage capacity (Lopez-Tarazon et al., 2009).Sediment supply in a catchment is heterogeneous in
time and space depending on climate, land use and anumber of landscape characteristics such as slope,topography, soil type, vegetation and drainage conditions

5973TEMPORAL VARIATION OF SUSPENDED SEDIMENT TRANSPORT
(Marttila and Klove, 2010). The investigation ofsuspended sediment concentration (SSC) dischargerelationships of individual events allows inference ofthe dominant origins and processes contributing tosuspended sediment (SS) dynamics of a basin (Lefrancoiset al., 2007; Sadeghi et al., 2008; Smith and Dragovich,2009; Gao and Puckett, 2011). The relationship betweendischarge and sediment concentration usually presents ahysteretic loop, which can be classified according to theirsymmetry, and their clockwise or anticlockwise hysteresis(Jansson, 2002; Lefrancois et al., 2007; Smith andDragovich, 2009; Gentile et al., 2010). Variability inthe SSC-discharge relationship has been studied toidentify sediment origins on catchments of varying sizes.The features of the hysteresis loops have been attributedto the location of the sediment source in the basin, theriver bed or the river banks (Jansson, 2002; Smith andDragovich, 2009; Gao and Puckett, 2011). Clockwiseloops have often been related to the depletion of availablesediments in the catchment or in the stream channel or thesuccessive reduction of the erosive effect of rainfall(Jansson, 2002; Gao and Josefson, 2012). An anticlock-wise hysteresis usually reflects sufficient hillslopesediment supply, delayed in-channel sedimentresuspension caused by the late break-up of biofilms,additional sediment sources from channel banks or tributariesor variable rainfall patterns (Gao and Josefson, 2012). Theclockwise hysteresis between SSC and discharge isregarded as a normal condition for most fluvial systemswhere SS transport is mainly caused by precipitation-induced flooding (Gao and Puckett, 2011).
Figure 1. Location map
Copyright © 2013 John Wiley & Sons, Ltd.
In the Ethiopian highlands, sediment delivery dependson discharge, the onset of rainfall, land use and landcover, which vary between rainfall seasons (Awulachewet al., 2010). Because of this, sediment rating curves arecomplex, and sediment budgets have rarely beenestablished (Nyssen et al., 2007). Although a number ofstudies have been performed in small catchments (Gaoand Pasternack, 2007; Lefrancois et al., 2007; Sadeghiet al., 2008; Smith and Dragovich, 2009; Eder et al.,2010; Marttila and Klove, 2010), much less is knownabout the sediment dynamics in medium scale catchment(Gao and Josefson, 2012). The aim of this paper is to quantifythe temporal variability of sediment yield from a medium-sized catchment in the Ethiopian highlands and identify thedominant (possible) sediment sources and generationmechanisms. This paper also assesses the future environ-mental implications of sediment delivery in the study area.
MATERIALS AND METHODS
The study area
Location, climate and topography. The consideredstudy area is 9838 ha in size and represents the upstreampart of the 260-km2 Koga catchment (Figure 1) innorthwestern Ethiopia. The Koga catchment is a typicalcatchment for the Ethiopian Highlands, 72% of which isused for subsistence agriculture. The Koga River is atributary of the Gilgel Abbay, which flows northwest intoLake Tana and lies in the upper part of the Blue Nile(Abbay) watershed.
of the Koga catchment
Hydrol. Process. 28, 5972–5984 (2014)

5974 E. YESHANEH, A. EDER AND G. BLÖSCHL
The climate of the Koga catchment falls within theWoina Dega [cool semi-humid, 1500 to 2400m above sealevel (a.s.l.)] and Dega zones (cool, above 2400m a.s.l.).The majority of the catchment area lies within the WoinaDega zone and is characterized by distinct dry and wetseasons. The dry seasons occur between November andApril and the wet season between May and October;small rains occur sporadically during April and May. Themean annual rainfall for the catchment is 1550mm(period 2006–2010). The mean daily temperature is18.25 °C. The monthly mean maximum temperaturevaries from 30.0 °C in March to 23.7 °C in August. Themonthly mean minimum temperature varies from 5.4 °Cin December to 13.1 °C in May and June.Although the land elevation of the Koga catchment
varies from 1875m a.s.l. at the mouth of the Koga Riverto 3215m a.s.l. at its highest point on the watersheddivide, the considered study area has its lowest elevationof 2015m a.s.l. at its mouth where it joins the Kogareservoir. The Koga reservoir (Figure 1) is used forirrigation of the downstream areas. The Koga River flowsat a distance of 26 km before it joins the Koga irrigationreservoir and a distance of 49 km before it joins the GilgelAbbay, which eventually flows into Lake Tana. The Kogacatchment is generally elongated with a pronouncednarrowing above the Village of Rim where the meanwidth of the catchment is only 3.8 km. The course of theKoga River is northerly up to the village of Rim and thenwesterly to Wetet Abbay.
Geology and soils. The regional geology of the Kogacatchment comprises extensive flow type, volcanic(extrusive) rocks mainly of the Ashangi Group; these weredeposited during the palaeocene-Oligocene-Miocene(teritiary) stages of geological time. The Ashangi groupcomprises the older volcanic rocks, which were formed bylava and debris, ejected from fissural volcanic eruptions.The choke shield volcanic group, deposited during theMiocene and Pliocene, has covered a small area of theupper Koga catchment in the eastern part. The shieldvolcanic group consists mainly of pyroclastic basalt and ispetrographically similar to the Ashangi group. The soiltypes within the upper part of the Koga catchment westudied are Luvic Phaeozems (Typic Argiustolls), ChromicCambisols (Fluventic and Typic Ustropepts), LithicLeptosols (Lithic Ustropepts), Haplic Alisols (TypicPaleustults), Eutric Vertisols (Ustic Tropaquepts) andEutric Gleysols (Typic Tropaquepts). These soils have clayto clay loam texture with the exception of Eutric Gleysols(Typic Tropaquepts) that has clay to sandy clay loam texture.
Population and tillage practices. The total populationof the Mecha woreda, within which the Koga catchmentis located, is 292 000, of which 269 404 live in the rural
Copyright © 2013 John Wiley & Sons, Ltd.
part, whereas 22 677 live in the urban part (CSA, 2007).Subsistence rain fed production of cereals comprisingteff, maize, barley and millet, as well as pulses, oilseedsand some legumes is dominant in the area, whereas irrigatedagriculture takes up a small percentage of the cultivated areaof the Koga catchment. Soil tillage is performed with oxen-drawn ploughs. There exist some attempts to prevent soilerosion through soil and water conservation structures suchas stone stacks along with tree planting (Figure 11e), stormwater diversion channels, soil bunds (Figure 11c), channeland orchard terraces and contour cultivation, though notbased on sufficient study as to which of these are mosteffective in controlling soil erosion in the catchment. Cropcultivation is the main source of income followed bylivestock for the poor farmers in the area.
Methods
Event data collection and developing a relationshipbetween turbidity measurements and SSC. A hydrologicalmonitoring station consisting of pressure transducer, DTS-turbidity sensor (Digital Turbidity Sensor), axiomdata loggerand staff gauge has been installed along a relatively stableand steep cross section in theKoga catchment (Figure 1). Thestation was installed just above the Koga reservoir along theriver that serves for irrigation of the downstream areas.The DTS-turbidity sensor was put around the middle of thehorizontal cross section and was moved up or down in thedifferent seasons depending on the flow conditions so that itremained, approximately, at the midpoint of the verticalsection of the flow. Although it is expected that there is adifference in SSCs both vertically and horizontally alongriver cross sections, some researchers have indicated that thedifference in SSC may be small at low flows (Gao andJosefson, 2012), with an average spatial variation of 9% ofthe mean of all samples collected along the vertical andhorizontal cross sections at a time (Lopez-Tarazon et al.,2009). Gao et al. (2007) indicated that grab samples at a pointof a cross section can be regarded as the averaged sampleover the cross section at any time. For high flow conditions,mixing increases, which will make the measurements fromthe turbidity sensors more representative of the whole crosssection, although entrainment from the river bed and riverbank may lead to layering of the sediment concentrations.Given that most of the sediment comes from the hillslopes(see later in the paper), the latter effect is probably small.Some biases due to the sensor position may still haveoccurred, which would be of interest to analyse in moredetail. The DTS-turbidity sensor was factory calibrated, andit was able to prevent biofilm growth on the sensor by awiperthat wipes the sensor system every 30 s. A rating curve wasdeveloped for the cross section using Manning’s equationaccompanied by several velocity measurements for variouswater levels (high and low flows) using current metre and
Hydrol. Process. 28, 5972–5984 (2014)

5975TEMPORAL VARIATION OF SUSPENDED SEDIMENT TRANSPORT
floating devices. We set up the monitoring station in arelatively stable and steep cross section tominimize sedimentdeposition along the cross section. Considering the possibil-ity of inundations at the monitoring station, the data loggerwas placed at considerable height. Although there wereseveral events that produced nearly bank full peak flows,none of the events exceeded the bank full discharge at themonitoring station in the study period. This was because ofupstream inundations resulting from small weirs across thestream that have been used for irrigation during the dryseason by individual upstream farmers. The shapes of thehydrographs suggest, however, that the upstream flows intotheflood plainswere relatively small. The bank full dischargeis 47.6m3 s�1 at the monitoring station.
Figure 2. Suspended sediment concentration (SSC) – discharge hysteresanticlockwise patterns o
Copyright © 2013 John Wiley & Sons, Ltd.
Using the Axiom data logger, we were able to have acontinuous record of water turbidity expressed in nephelo-metric turbidity units and water level data in metres for1 year starting from October 2011–2012. In addition, 257water grab samples were collected manually with 500mlplastic bottles from along the mid of the river for 25 events.Four to 12 samples per event were collected at 10- to 15-minintervals. Sample collection was based on convenience forcollection either for the rising limb, falling limb or bothwithout preference to any of the rainfall events. Thesampling process did not cover the whole duration of anevent andwas much less than the total duration of any of the45 events as also seen on Figures 2(a) and (c), 3(a) and 4.Samples were collected either for the rising limbs, peaks, for
(a)
(b)
(c)
is loops of (a) anticlockwise-clockwise-anticlockwise and (b) and (c)f some of the events
Hydrol. Process. 28, 5972–5984 (2014)

(a)
(b)
Figure 3. Suspended sediment concentration (SSC) – discharge hysteresis loops of (a) clockwise-anticlockwise-clockwise and (b) clockwise patterns
Figure 4. Suspended sediment concentration (SSC) – discharge hysteresis loop of a complicated pattern
5976 E. YESHANEH, A. EDER AND G. BLÖSCHL
the falling limbs or combinations of these three for thedifferent events that in turn makes the sampling processrepresentative of the 45 events for creating SSC-turbidityrelationship. From the 257 samples collected, 222 wereanalysed for SSC at the national and regional water bureaus.The remaining 35 samples were disregarded becauseleakage of part of the sample occurred before reaching thelabs due to a failure to close the bottles tightly.A relationship between turbidity measurements and SSC
was developed on the basis of the SSC values of thecollected samples. Out of the 222 samples analysed for
Copyright © 2013 John Wiley & Sons, Ltd.
SSC, 179 samples were used for establishing therelationship between turbidity and SSC. The remaining43 samples were excluded as they were either outliers orhad extremely low turbidity readings for events withextremely large SSC values (up to 22 000mg l�1). Usingthe 179 samples, we were able to get a very good (Figure 5)correlation coefficient (R2 = 0.987) between turbidityvalues and sample SSC values. Because of the excellentcorrelations, estimated sediment concentrations for eventswithout samples were also considered reliable. Althoughtexture analysis was not carried out on the SS from the
Hydrol. Process. 28, 5972–5984 (2014)

Figure 5. Suspended sediment concentration – turbidity relationship before (a) and after (b) removing outliers
5977TEMPORAL VARIATION OF SUSPENDED SEDIMENT TRANSPORT
water grab samples, previous soil studies in the catchmentsuggest that 85% of the upper catchment has a soil textureranging from clay to clay loam (Acers International Limited& Shawel Consult, 1995). Soil texture analysis made on 12soil samples we took from the different soil types in thecatchment indicated that the upper catchment does havesoil texture ranging from heavy clay to loam. Thisreduces the potential effect coarser SSs would have hadon the turbidity-SSC relationship especially during highflows. Turbidity values of some of the events in Juneexceeded the measurement range of the turbidity sensor,and in that case, the turbidity sensor recorded only itsmaximum limit (1797 nephelometric turbidity units).For those events, the suspended sediment yield (SSY) isa little underestimated.
SSC-discharge hysteresis analysis. Hysteresis patternsof SSC were generated and analysed for a link to thelikely sediment sources and transport processes. Hyster-esis analysis was performed by the classic visual analysisas it was found to give more reliable information thanother methods (Gao and Josefson, 2012).
Calculating SSY and examination of the relationshipbetween SSY and Qpeak. We summed up the SSYcalculated every 10min throughout the event to generatethe SSY of each event. To have a good estimate of totalsediment yield of each event, we examined whether or notthere is a trend in SSC beginning from an hour before thestart of the event until the start of the event. If there was adecreasing trend in sediment concentration before thestart of the event, the corresponding sediment yields werecalculated from the sediment concentrations, and the rateof decrease in the sediment yield was considered whensubtracting the amount of sediment before the start of theevent from the sediment yield of the event. If there was notrend in the sediment yield before the start of the event,
Copyright © 2013 John Wiley & Sons, Ltd.
the amount of sediment yield just before the start of theevent was subtracted from the event flow. This is believedto increase the accuracy of the estimated event sedimentyield. The relationship between SSY and Qpeak was thenanalysed for each event and for each month to identify theseasonal variation and sediment sources in the study area.In this study, we considered only SS load that makes themajor part of the total sediment load. However, it should benoted that transport of materials such as soil aggregates andsand and gravel sizematerials as a bed loadmay contribute tothe total sediment load.We calculated the SSY for each eventto determine the major sediment sources because sedimenttransport in the study area is mainly associated with a fewerosive events throughout the hydrological year. The yearlysediment yield was calculated on the basis of the continuousdischarge and turbidity values for one hydrological year usingthe established relationship with sample SSC. For the fewmissing SSC data for the June events when the turbiditysensor failed, we used the rating curve we developed on thebasis of Qpeak for calculating the sediment yield for thatparticular time. This might add some uncertainty to the SSYestimates for these points in time.The main rainy season in the catchment is June, July and
August. The rainfall starts to decrease in September andsignificantly decreases in October, with little or no rainfallin November. We started data collection in October 2011when the rainfall was decreasing. The major rainy seasonstarted in June 2012, which was a little later than usual.This was the time when the crop fields were ploughed inpreparation for cultivation in the major rainy season. Thecultivated land and most of the pasture was completelydevoid of vegetation in early June. Although the pastureland is green by mid-June, crops start to grow towards theend of June, and most of the cultivated crop fields are at anearly stage of crop growth and do not turn green until mid-July. From around mid-July, the cultivated land begins tobe covered with vegetation. Around mid-August until the
Hydrol. Process. 28, 5972–5984 (2014)

5978 E. YESHANEH, A. EDER AND G. BLÖSCHL
end of September, the catchment is almost completelygreen and covered with vegetation. Crop harvest of most ofthe crops begins in early October. Part of the cultivatedland that is close to the river became swampy from mid-July until the end of September and was ploughed andmade ready for sowing in early October. These vegetationdynamics were accounted for when interpreting SSY.
RESULTS AND DISCUSSIONS
SSC-discharge hysteresis analysis
We observed five types of hysteresis: anticlockwise (A),clockwise (C), two types of eight-shaped anticlockwise-clockwise-anticlockwise (ACA) and clockwise-anticlock-wise-clockwise (CAC) and complicated patterns. Whereasmost of the events with single peak discharge and short peakdischarge time showed any of the first four hysteresispatterns, events with multiple peak discharges or prolongedsingle discharge time showed complicated patterns.Although the September events showed all the above-
named five types of hysteresis (Table I and Figure 6(a)), theevents with clockwise hysteresis showed much largersediment yields than those with anticlockwise hysteresisand other types of hysteresis for similar peak discharges(Table I). Flow for the event 27–28/9/2012 with a peak flowof 16m3 s�1 and clockwise hysteresis had a sediment yieldof 89.8 t, whereas the event 10/9/2012 with the same peakflow and with anticlockwise hysteresis had a sediment yieldof only 17.6 t. The same is true of the event 4–5/9/2012 witha peak flow of 30.27m3 s�1 and a clockwise hysteresis(flow duration of 8:50 h) as compared with the event of 1/9/2012 that had the same peak flow but anticlockwisehysteresis (flow duration of 12:20 h). This suggests moresediment is generated from the river channels than fromother sources in September. This is because crop vegetationcover in September is higher than in the other months of theyear, and sediment contribution from the agricultural areasis less in this month than in the previous months.Sediment yields after mid-August are much smaller
than sediment yields before mid-August for similar peakflows (Table I). Nearly all the August events showedcomplicated hysteresis patterns except two of them in lateAugust that showed anticlockwise patterns (Figure 6(a)).Anticlockwise hysteresis patterns showed much lesssediment yield than those with complicated patterns.July events mainly showed anticlockwise and compli-
cated patterns but for events with similar peak flows, theones with complicated hysteresis types showed higheramounts of sediment yield, followed by events withanticlockwise hysteresis patterns. Events with clockwisehysteresis had the lowest amount of sediment yield,indicating channel sources are less important sources than
Copyright © 2013 John Wiley & Sons, Ltd.
other sources for this month, while at the same time itindicates that complicated environmental conditions areinvolved in sediment transport. All the four June eventsshowed three types of hysteresis patterns (anticlockwise,clockwise and complicated). A large event in June with acomplicated hysteresis pattern showed much greatersediment yield than an event with similar magnitude butan anticlockwise pattern. The clockwise hysteresispatterns of June and July events tend to be associatedwith sediment entrainment from deposition of antecedentrun-off events, especially when there is a relatively shorttime gap between successive events that reduces the timeof subsurface flows to transport the deposited sedimentsbefore the succeeding events. For example, the Qpeak timegap between the successive events 27/6/2012 to 27–28/6/2012 and the successive events 1–2/7/2012 to 2–3/7/2012is 23 and 21h, respectively, and they resulted in clockwisepatterns to follow anticlockwise patterns in the first events.However, this pattern does not seem to be consistent for theconsecutive events of 25–26/6/2012 to 27/6/2012 with aQpeak time gap of 30 h, which both showed anticlockwisehysteresis patterns. More work would be needed to shedlight on the effect of consecutive events on hysteresispatterns. Regardless of peak flow or duration of flows, allOctober events and the one November event showed ACAhysteresis pattern, except for the small mid-October eventthat showed an anticlockwise hysteresis.In general, anticlockwise hysteresis, including more of
anticlockwise type ACA patterns, dominates in the studyarea, implying channel sources are less important thanother sources. We also observe from Figure 6(b) that thepercentage of complicated hysteresis patterns is high forevents with relatively high peak flows indicatingcomplicated processes involved in sediment transportwith increased amount of peak flows.
SSY and relationship with Qpeak
The relationship between SS and discharge reflects theoverall pattern of erosion and SS delivery operating in thecatchment area, shedding light on basin SS response(Walling and Webb, 1982). In our study area, there was agood relationship between the peak flows and sedimentconcentration for the 15 events in September with acorrelation coefficient of 0.88. All the September events,whether high or low, were associated with lower sedimentyields than similar events in other months of the rainyseason. The hysteresis patterns suggest that the contributionof sediment yield from the river channel is more importantthan contributions from the agricultural areas and hillslopesfor this month. The dominance of channel erosion as asediment source may explain the good correlation betweensediment yield and peak flow in September.
Hydrol. Process. 28, 5972–5984 (2014)

Table I. Characteristics of discharge and sediment concentration and hysteresis patterns of the 45 events in the Koga catchment
DateQmean
(m3 s�1)Qpeak
(m3 s�1)
SSCmean
(mg l�1)SSY
(tonnes)Hysteresispattern
Duration(h)
8/10/2011 10.8 15.2 3987 3647 A-C-A 20:208–9/10/2011 10.0 16.1 1405 820 A 15:501/10/2012 16.23 46.8 322 446 A-C-A 20:402/10/2012 13.0 28.3 252 239 A-C-A 19:4015/10/2011 0.3 0.7 636 7 A 8:2030–31/10/2011 5.8 17.9 8175 1924 C 10:303/11/2011 1.4 3.7 4416 388 A-C-A 16:2025–26/6/2012 13.8 45.5 4228 1502 A 12:4027/6/2012 3.7 6.2 4602 468 A 9:1027–28/6/2012 5.1 13.0 3024 479 C 16:0030/6/2012 19.6 45.9 3866 3080 Complicated 15:501–2/7/2012 10.2 23.7 2785 831 A 8:502–3/7/2012 14.1 25.8 3581 1032 C 6:003/7/2012 22.0 32.6 7104 8778 C-A-C 15:304/7/2012 22.8 45.9 6814 3831 C 13:206/7/2012 12.2 22.5 8719 1445 A 9:306–7/7/2012 25.8 38.0 5918 9630 Complicated 28:008/7/2012 19.5 43.6 5635 5352 A 18:4014–15/7/2012 32.4 46.5 6420 12146 Complicated 20:3015–16/7/2012 30.49 45.6 3704 7675 Complicated 24:0022/7/2012 19.16 46.7 3437 3804 A 16:3025–26/7/2012 30.02 46.4 1930 6717 Complicated 30:006/8/2012 17.52 44.9 792 1231 Complicated 18:4017–18/8/2012 34.09 44.0 599 848 Complicated 12:4023–24/8/2012 22 46.7 330 1087 Complicated 30:2026/8/2012 21.2 46.6 469 511 A 12:4028/8/2012 22.9 46.0 479 675 Complicated 14:5031/8/2012 13.5 20.3 214 70 A 7:3031 / 8 / 2012–1 / 9 /2012
25.0 46.7 454 697 Complicated 17:40
1/9/2012 15.5 31.1 258 136 A 12:202–3/9/2012 27.4 47.0 452 536 A-C-A 12:003–4/9/2012 9.8 10.4 128 28 Complicated 11:404–5/9/2012 15.1 30.3 424 194 C 8:506/9/2012 22.0 46.3 313 387 A-C-A 11:406–7/9/2012 22.6 46.9 412 600 C-A-C 19:009–10/9/2012 9.1 21.5 195 98 A 7:5010/9/2012 11.9 16.3 110 18 A 7:0012–13/9/2012 7.9 12.4 102 33 Complicated 11:5016/9/2012 12.5 20.7 247 104 Complicated 10:2017–18/9/2012 14.8 34.3 178 179 C 13:2025/9/2012 5.1 8.9 177 29 A 13:1026/9/2012 14.8 46.7 529 405 Complicated 13:4026–27/9/2012 23.7 47.4 664 518 A 10:2027–28/9/2012 10.8 16.0 206 90 C 19:10
SSC, suspended sediment concentration; SSY, suspended sediment yield; A, anticlockwise; C, clockwise; ACA, anticlockwise-clockwise-anticlockwise;CAC, clockwise-anticlockwise-clockwise.
5979TEMPORAL VARIATION OF SUSPENDED SEDIMENT TRANSPORT
For the 23 events in the high rainfall months of June,July and August, the correlation coefficients are muchsmaller (Figure 8). The highest yields were not necessarilyrelated to high peak flows. Some of the small events hadthe highest yields. This is likely related to the dependenceof sediment yield on sediment availability from theagricultural areas and hillslopes during this time of
Copyright © 2013 John Wiley & Sons, Ltd.
the year. Although the number of October and Novemberevents is not representative enough to draw firmconclusions about the relationship between sediment yieldand peak flows, the few events do suggest that peak flowsare not directly correlated with sediment yield.study in the highlands of Ethiopia (Vanmaercke et al.,
2010) suggested that the variations in SSC are mainly due
Hydrol. Process. 28, 5972–5984 (2014)
(a)
(b)
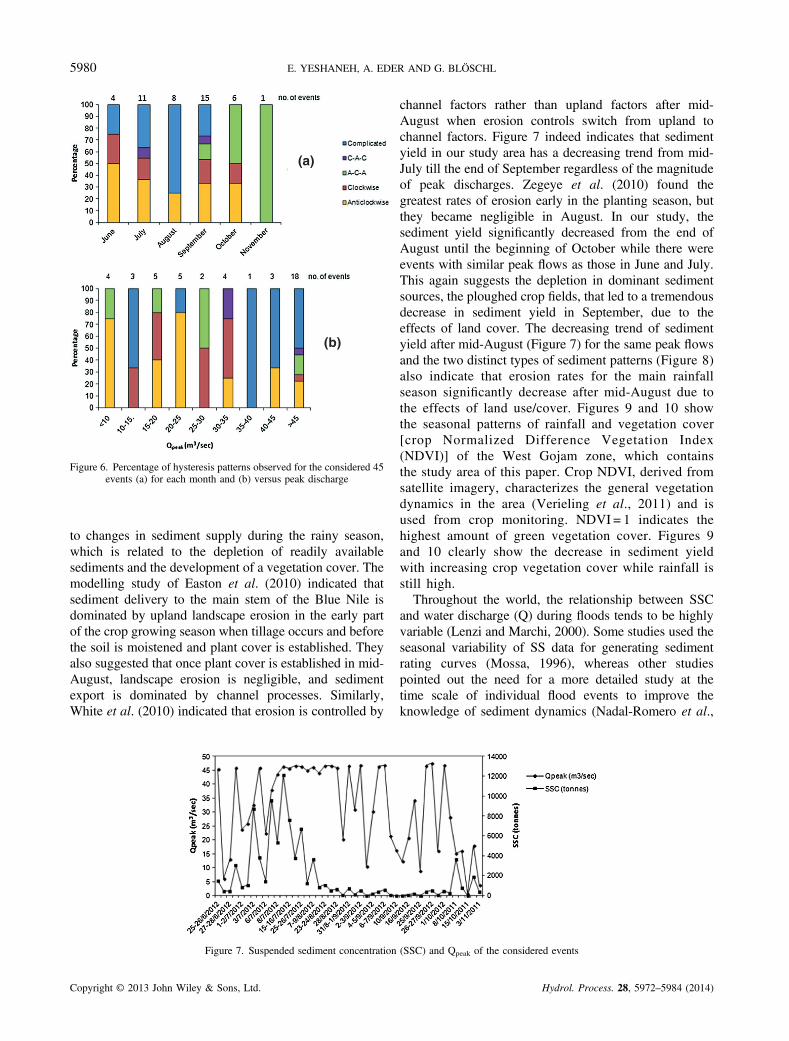
Figure 6. Percentage of hysteresis patterns observed for the considered 45events (a) for each month and (b) versus peak discharge
5980 E. YESHANEH, A. EDER AND G. BLÖSCHL
to changes in sediment supply during the rainy season,which is related to the depletion of readily availablesediments and the development of a vegetation cover. Themodelling study of Easton et al. (2010) indicated thatsediment delivery to the main stem of the Blue Nile isdominated by upland landscape erosion in the early partof the crop growing season when tillage occurs and beforethe soil is moistened and plant cover is established. Theyalso suggested that once plant cover is established in mid-August, landscape erosion is negligible, and sedimentexport is dominated by channel processes. Similarly,White et al. (2010) indicated that erosion is controlled by
Figure 7. Suspended sediment concentration
Copyright © 2013 John Wiley & Sons, Ltd.
channel factors rather than upland factors after mid-August when erosion controls switch from upland tochannel factors. Figure 7 indeed indicates that sedimentyield in our study area has a decreasing trend from mid-July till the end of September regardless of the magnitudeof peak discharges. Zegeye et al. (2010) found thegreatest rates of erosion early in the planting season, butthey became negligible in August. In our study, thesediment yield significantly decreased from the end ofAugust until the beginning of October while there wereevents with similar peak flows as those in June and July.This again suggests the depletion in dominant sedimentsources, the ploughed crop fields, that led to a tremendousdecrease in sediment yield in September, due to theeffects of land cover. The decreasing trend of sedimentyield after mid-August (Figure 7) for the same peak flowsand the two distinct types of sediment patterns (Figure 8)also indicate that erosion rates for the main rainfallseason significantly decrease after mid-August due tothe effects of land use/cover. Figures 9 and 10 showthe seasonal patterns of rainfall and vegetation cover[crop Normalized Difference Vegetation Index(NDVI)] of the West Gojam zone, which containsthe study area of this paper. Crop NDVI, derived fromsatellite imagery, characterizes the general vegetationdynamics in the area (Verieling et al., 2011) and isused from crop monitoring. NDVI = 1 indicates thehighest amount of green vegetation cover. Figures 9and 10 clearly show the decrease in sediment yieldwith increasing crop vegetation cover while rainfall isstill high.Throughout the world, the relationship between SSC
and water discharge (Q) during floods tends to be highlyvariable (Lenzi and Marchi, 2000). Some studies used theseasonal variability of SS data for generating sedimentrating curves (Mossa, 1996), whereas other studiespointed out the need for a more detailed study at thetime scale of individual flood events to improve theknowledge of sediment dynamics (Nadal-Romero et al.,
(SSC) and Qpeak of the considered events
Hydrol. Process. 28, 5972–5984 (2014)

Figure 9. Average rainfall and crop Normalized Difference VegetationIndex for 1999–2006 for West Gojam zone (Province) of the Amhara
region (EC-JRC, 2007)
Figure 10. Sediment yield calculated for the study area (October 2011–September 2012)
5981TEMPORAL VARIATION OF SUSPENDED SEDIMENT TRANSPORT
2008). Vanmaercke et al. (2010) found very lowcorrelations of the rating curves even after the data werestratified into three periods in a study conducted in amedium-sized catchment in the highlands of Ethiopia.Nadal-Romero et al. (2008) observed high sedimentconcentrations and a heterogeneous temporal distributionrelated to seasonal variations in surface run-off produc-tion for floods in a 0.45-km2 humid Mediterranean badland area in the Central Pyrenees. For our study area,based on the sediment yield of the 45 events and theircorresponding peak discharges, Figure 8 shows twodifferent sediment rating curves. The first relationshipapplies to events in August, September and the twoOctober events; the second relationship applies to June,July, October and November. The first relationship showsbetter correlation (R2 = 0.82) than the second one(R2 = 0.65). The lower correlation coefficient of thesecond sediment rating curve is due to the high sedimentyield associated with some of the low peak flows due tothe abundant availability of loose sediment from theploughed fields in this period of the year, as also observedfrom Figure 11 (a), (b) and (c). The rating curve forAugust, September and the first two October events isassociated with lower sediment yields than the othercurve for similar amounts of peak discharges, indicatingthere was a depletion of sediment from the sedimentsources in September and August. These findings suggestthat the agricultural fields (the pasture and crop fields) andhillslopes are more important sediment sources than thechannels for most of the yearly rainy season.Table II shows soil loss estimated by some studies
conducted in Ethiopia. Regardless of the different figures,all the studies indicated the severity of soil erosion in thehighlands of Ethiopia. On the basis of a 2010 land cover/use classification by Yeshaneh et al. (2013), the area
Figure 8. Sediment rating
Copyright © 2013 John Wiley & Sons, Ltd.
upstream of the monitoring station of our study area thatdrains to the monitoring station consists of 5248 ha ofcultivated land, 1848 ha of woody vegetation and 2742 ha
curves based on Qpeak
Hydrol. Process. 28, 5972–5984 (2014)

(a) (b)
(c) (d)
(e)
Figure 11. (a) June run-off from ploughed fields, (b) June flow at the monitoring station, (c) Land use/cover in June with soil conservation attempts (soilbunds), (d) Land use/cover in September and (e) soil and water conservation attempts (stone bunds with tree planting along with the stone bunds)
5982 E. YESHANEH, A. EDER AND G. BLÖSCHL
of other land use/cover types, that account for 53%, 19%and about 28% of the land use/cover of the area,respectively. Based on the fine temporal resolution(temporal resolution of 10min) continuous dischargeand sediment data we recorded at the monitoring station,we calculated a total sediment yield of 252 277 t year�1
from the 9838 ha, which is 25.6 t ha�1 year�1. This figureis somewhat smaller than the findings of most of thestudies conducted in the high lands of Ethiopia, althoughit is greater than sediment yields from catchments whereeffective soil and water conservation measures arepracticed. This estimate is extremely high from anenvironmental point of view. The relatively low amountof sediment yield we estimated compared with previousstudies could be attributed to various reasons. Onepossible reason could be our continuous measurementof discharge and sediment data with high temporal
Copyright © 2013 John Wiley & Sons, Ltd.
resolution, with better technology equipments thanprevious studies, which we believe has increased thereliability of sediment yield estimation, although there is apossibility of overestimation by previous studies with lessregular monitoring. No studies have been performed inthe catchment as to the extent the existing soil and waterconservation structures have changed the sediment yieldof the study area. Although there is a need for an in-depthstudy of the effect of the existing structures and otherfuture additional options on soil erosion in the catchment,the existing structures might have contributed to reducingthe sediment yield relative to estimates for the entirehighlands of Ethiopia. It has been noted by Yeshanehet al. (2013) that there is an increasing tendency toeucalyptus tree planting in the catchment in recent years;its impact on sediment yield should be studied along withthe conservation measures.
Hydrol. Process. 28, 5972–5984 (2014)

Table II. Soil loss estimates by different studies in Ethiopia
StudySoil loss int ha�1 year�1 Estimated for
S and Wconservationmeasures
1 Tadesse (2001) 31 Entire highlands2 Hurni (1993) 42 Plot based from cultivated fields
in the highlands3 Nyssen et al. (2007) 14.8 199-ha agriculture-dominated
catchment in the northern highlandsof Ethiopia
Yes
4 Ethiopian highlandsreclamation study(World Bank, 2007)
130 Plot based fromcultivated lands
5 Ethiopian highlandsreclamation study(World Bank, 2007)
35 Entire highlands
6 Vanmaercke et al. (2010) 4.97–65.43 513 300-ha (divided into subcatchments)agriculture-dominated catchment inNorthern highlands
Yes
7 Guzman et al. (2013) 5.2, 24.7 and 7.4 477, 113 and 112-ha agriculture-dominatedcatchments in the highlands
Yes
5983TEMPORAL VARIATION OF SUSPENDED SEDIMENT TRANSPORT
Increased SS load due to intensive land use has beenflagged out as a major concern by a number of studies incatchment and stream management (Restrepo et al., 2006;Marttila and Klove, 2010). Schiettecatte et al. (2008)identified the highest soil losses from crop fields in a151-km2 subwatershed in Cuba at times when the soil istilled and left bare for several weeks. They suggestedthat conservation measures would be most efficientduring those times. If, in our study area, the erosionprocess continued at the same rate (assuming soilformation is negligible), the top 10 cm of soil will havebeen eroded in the next 50 years, which will leave the landextremely degraded, making agriculture not practicable atthat time. Out of the total yearly sediment yield of252 277 t, 91% is transported from early June to mid-August, which suggests that soil and water conservationmeasures need to particularly target this time of the year.This finding is in line with those of McHugh (2006), whoindicated that severe erosion in a watershed in thehighlands of Ethiopia is associated with a few erraticstorms rather than steadily across all seasons. As stated byFood and Agriculture Organization, about 50% of thehighlands of Ethiopia were already ‘significantly eroded’in the mid-1980s, and erosion was causing a decline inland productivity at the rate of 2.2% per year (WorldBank, 2007). The total area that drains to the reservoir,including the area downstream from our monitoringstation, is 13 677 ha. With a sediment yield of 25.6 t year�1
ha�1, it is also worth noting that a total volume of269 000m3 of sediment reaches the Koga irrigationreservoir every year, which puts the sustainability of theirrigation dam in question.
Copyright © 2013 John Wiley & Sons, Ltd.
CONCLUSIONS
We found anticlockwise hysteresis patterns betweendischarge and SSC to be dominant in the Koga catchmentsuggesting that the main sediment sources are thehillslopes and agricultural areas with smaller contribu-tions from the river channels. However, there existcomplex hysteresis types where the conclusions are lessclear. During the period when the land is completelycovered by vegetation, sediment yield associated withclockwise patterns was found to be greater than thatassociated with anticlockwise and other patterns, suggestingriver channels contribute more to sediment yield in suchconditions than the other sources. Complicated and othertypes of hysteresis patterns mostly associated with longevents of multiple peaks suggest that a multitude of factorsof sediment delivery in the study occur, which cannot beinferred from the hysteresis patterns. Sediment availabilityfrom the agricultural areas and hillslopes that depends onland use/cover was found to more strongly control thevariations in event sedigraphs and rating loops than peakdischarge. SSY–peak discharge plots indicated much lowersediment yield for the time after mid of August when thecatchment was almost completely covered with vegetationas compared with similar events when the agricultural landwas devoid of vegetation. Two distinct types of sedimentrating curves based on peak discharges were observed forseasons with and without vegetation cover. SSY in the areais very high (25.6 t ha�1 year�1), and 91%of the yearly SSYis transported from early June to mid-August because of theavailability of loose sediment from the ploughed fields atthis time of the year. If the erosion process continued at the
Hydrol. Process. 28, 5972–5984 (2014)

5984 E. YESHANEH, A. EDER AND G. BLÖSCHL
same rate, the top 10 cm of soil will have been eroded in thenext 50 years. An amount of 269 000m3 of sedimentreaches the Koga irrigation reservoir every year. Thishighlights the urgent need for appropriate soil and waterconservation measures.
ACKNOWLEDGEMENTS
I would like to thank the Faculty for the Future Programme ofthe Schlumberger Foundation for granting me a scholarshipto domy studies at the Vienna University of Technology.Mythanks also extend to the Vienna Doctoral Programme onWater Resources Systems (DK-plus W1219-N22) for thetechnical and material support during my fieldwork inEthiopia through the Austrian Science Funds and for hostingme in the programme. I would also like to thank the KogaIrrigation Project team, especially Ato Zerihun Balcha, fortheir cooperation towards the success of this project.
REFERENCES
Acers International Limited, and Shawel Consult International. 1995.Feasibility study of the Birr and Koga irrigation project. KogaCatchment & Irrigation Studies, Annex J.
Awulachew SB, Ahmed AA, Haileselassie A, Yilma AD, Bashar KE,McCartney M, Steenhuis T. 2010. Improved water and landmanagement in the Ethiopian highlands and its impact on downstreamstakeholders dependent on the Blue Nile. CGIAR ChallengeProgramme on Water and FOOD, CPWF Project Report, PN19,http://cgspace.cgiar.org/handle/10568/3908
Central Statistical Agency (CSA). 2007. Population Census Data, DataProcessing Department Data Archive. Addis Ababa: Ethiopia.
Easton ZM, Fuka DR, White ED, Collick AS, Biruk Ashagre B,McCartney M, Awulachew SB, Ahmed AA, Steenhuis TS. 2010. Amulti basin SWAT model analysis of runoff and sedimentation in theBlue Nile, Ethiopia. Hydrology and Earth System Sciences 14:1827–1841. DOI: 10.5194/hess-14-1827-2010.
EC-JRC. 2007. Crop monitoring in Ethiopia. Mars-Food, 03. hftp://mars.jrc.ec.europa.eu/bulletin/Ethiopia/2007/Bulletin_ETH_Sept07.pdf
Eder A, Strauss P, Krueger T, Quinton JN. 2010. Comparative calculationof suspended sediment loads with respect of hysteresis effects(in Petzenkirchen catchment, Austria). Journal of Hydrology 389: 168–176.
Gao P, Josefson M. 2012. Event-based suspended sediment dynamics in acentral New York watershed. Geomorphology: 139-140: 425–437.
Gao P, Pasternack G, Bali K, Wallender W. 2007. Suspended-sedimenttransport in an intensively cultivated watershed in southeasternCalifornia, CATENA, 69: 239–252.
Gao P, PasternackG. 2007.Dynamics of suspended sediment transport atfield-scale drain channels of irrigation-dominated watersheds in the SonoranDesert, southeastern California.Hydrological Processes 21: 2081–2092.
Gao P, Puckett J. 2011. A new approach for linking event-based uplandsediment sources to downstream suspended sediment transport. EarthSurface Processes and Landforms 37(2): 169–179.
Gentile F, Bisantino T, Corbino R, Milillo F, Romano G, Trisorio LiuzziG. 2010. Monitoring and analysis of suspended sediment transportdynamics in the Carapelle torrent (Southern Italy). Catena 80: 1–8.
Guzman CD, Tilahun SA, Zegeye AD, Steenhuis TS. 2013. Suspendedsediment concentration-discharge relationships in the (sub-) humid Ethiopianhighlands. Hydrogy and Earth System Sciences 17: 1067–1077.
Hurni H. 1993. Land degradation, famine and resource scenarios inEthiopia. In World Soil Erosion and Conservation, Pimentel D (ed).Cambridge University Press: Cambridge.
Jansson M. 2002. Determining sediment source areas in a tropical riverbasin, Costa Rica. Catena 47: 63–84.
Copyright © 2013 John Wiley & Sons, Ltd.
Lefrancois J, Grimaldi C, Gascuel-Odoux C, Gilliet N. 2007. Suspendedsediment and discharge relationships to identify bank degradation as amain sediment source on small agricultural catchments. Hydrologicalprocesses 21: 2923–2933.
Lenzi M, Marchi L. 2000. Suspended sediment load during floods in asmall stream of Dolomites (northeastern Italy). Catena 39: 267–282.
Lopez-Tarazon JA, Batalla RJ, Vericat D, Francke T. 2009. Suspendedsediment transport in highly erodible catchment: the River Isabena(Southern Pyrenees). Geomorphology 109: 210–221.
Marttila H, Klove B. 2010. Dynamics of erosion and suspended sedimenttransport fromdrained peatland forestry. Journal ofHydrology388: 414–425.
McHugh OV. 2006. Integrated water resources assessment and manage-ment in a drought-prone watershed in the Ethiopian Highlands. PhDdissertation presented to the Faculty of Graduate School of CornellUniversity, http://ecommons.library.cornell.edu/handle/1813/3384
Mossa J. 1996. Sediment dynamics in the lowermost Mississippi River.Engineering Geology 45: 457–479.
Nadal-Romero E, Latron J, Marti-Bono C, Regües D. 2008. Temporaldistribution of suspended sediment transport in humidMediterranean badlandarea: the Araguas catchment, Central Pyrenees.Geomorphology 97: 601–616.
Nyssen J, Poesen J, Moeyersons J, Haile M, Deckers J. 2007. Dynamics ofsoil erosion rates and controlling factors in the Northern EthiopianHighlands – towards a sediment budget. Earth Surface Processes andLandforms. DOI:10.1002/esp.1569
Restrepo JD, Kjerfve B, Hermelin M, Restrepo JC. 2006. Factorscontrolling sediment yield in major South American drainage basin: theMagdalena River, Colombia. Journal of Hydrology 316: 213–232.
Russel MA, Walling DE, Hodgkinson RA. 2001. Suspended sedimentsources in two small lowland agricultural catchments in the UK.Journal of Hydrology 252: 1–24.
Sadeghi SHR, Mizuyama T, Miyata S, Gomi T, Kosugi K, Fukushima T,Mizugaki S, Onda Y. 2008. Determinant factors of sediment graphs andrating loops in a reforestedwatershed, Journal ofHydrology 356: 271–282.
Schiettecatte W, D’hondt L, Cornelis WM, Acosta ML, Leal Z, Lauwers N,AlmozaY,AlonsoGR,Diaz J,RuizM,GabrielsD. 2008. Influence of landuseon soil erosion risk in the Cuyaguateje watershed (Cuba). CATENA 74: 1–12.
Shiferaw B, Holden S. 1999. Soil erosion and smallholders’conservation decisions in the highlands of Ethiopia. WorldDevelopment 27(4): 739–752.
Smith H, Dragovich D. 2009. Interpreting sediment delivery processes usingsuspended sediment-discharge hysteresis patterns from nested uplandcatchments, south-easternAustralia.Hydrological processes 23: 2415–2426.
Tadesse G. 2001. Land Degradation: a challenge to Ethiopia. Environ-mental Management 27(6): 815–826.
Tamene L, Vlek P. 2008. Soil erosion studies in northern Ethiopia,Chapter 5. Land use and soil resources, 73–100.
Vanmaercke M, Zenebe A, Poesen J, Neyssen J, Verstraeten G, Deckers J.2010. Sediment dynamics and the role of flash floods in sediment exportfrom medium-sized catchments: a case study from the semi-arid tropicalhighlands in northernEthiopia. Journal of Soils and Sediments 10: 661–627.
Verieling A, Beurs KM, Brown ME. 2011. Variability of African farmingsystems from phonological analysis of NDVI time series. ClimateChange 109: 455–477.
Walling DE, Webb BW. 1982. Sediment availability and the prediction ofstorm period sediment yields. In Recent Developments in the Explanationand Prediction of Erosion and Sediment Yield, Walling DE (ed). IAHSPress: Wallingford; 327–337 (IAHS Publications No. 137).
White ED, Easton ZM, Fuka DR, Collick AS, Adgo E, McCartney M,Awulachew SB, Selassie Y, Steenhuis TS. 2010. Development andapplication of a physically based landscape water balance in the SWATmodel. Hydrological Processes 23: 3728–3737. DOI:10.1002/hyp.7876.
World Bank. 2007. The cost of land degradation in Ethiopia: a review ofpast studies. © Washington, DC. https://openknowledge.worldbank.org/handle/10986/7939
Yeshaneh E, Wagner W, Exner-Kittridge M, Legesse D, Blöschl G. 2013.Identifying land use/cover dynamics in the Koga catchment, Ethiopiafrom multi-scale data, and implications for enviromnental change.ISPRS International Journal of Geo-Information 2(2): 302–323.
Zegeye A, Steenhuis T, Blake R, Kidanu S, Collick A, Dadgari F. 2010.Assessment of soil erosion processes and farmer perception of landconservation in Debre Mewi watershed near Lake Tana, Ethiopia.Ecohydrology & Hydrobiology 10(2-4): 297–306.
Hydrol. Process. 28, 5972–5984 (2014)