template for technical support document - us epa · template for technical support document...
TRANSCRIPT
1
---------------------------------------------------------------------------------------------------------------------
---------------------------------------------------------------------------------------------------------------------
Template for Technical Support Document
Definition of important terms used in this document:
1) Designated “unclassifiable” – an area where EPA could not determine if there was a
violation of the 2008 Lead NAAQS or a contribution to a violation in a nearby area, because
there was insufficient air quality data for both 2006-2008 and 2007-2009 and where additional
monitoring data for 2010 could not result in a different designation.
2) Designated “attainment” – an area which EPA has determined, based on the most recent 3
years of certified air quality data from 2006-2008 or 2007-2009, has no violations of the 2008
Lead NAAQS during 36 consecutive valid 3-month site means; and which EPA has further
determined does not contribute to a violation of the 2008 Lead NAAQS in a nearby area and that
additional monitoring data from 2010 could not result in a different designation.
3) Designated nonattainment area – an area which EPA has determined, based on a State
recommendation and/or on the technical analysis included in this document, has a violation of
the 2008 Lead NAAQS during the most recent three consecutive years of quality-assured,
certified air quality data.
4) Prior nonattainment area – an area that is currently designated as nonattainment or
maintenance for the 1978 Lead Standard (including both current nonattainment areas and
maintenance areas).
5) Recommended nonattainment area – an area a State or Tribe has recommended to EPA be
designated as nonattainment.
6) Violating monitor – an ambient air monitor whose design value exceeds 0.15 micrograms per
cubic meter (μg/m³). As described in Appendix R of part 50, a violation can be based on either
Pb-TSP or Pb-PM10 data and only three months of data are necessary to produce a valid violating
design value.
7) 1978 Lead NAAQS – 1.5 µg/m3, National Ambient Air Quality Standard for lead
promulgated in 1978. Based on Pb-TSP indicator and averaged over a calendar quarter.
8) 2008 Lead NAAQS - 0.15 µg/m3, National Ambient Air Quality Standard for lead
promulgated in 2008. Based on Pb-TSP indicator and a three-month rolling average. Pb-PM10
data may be used in limited instances, including to show nonattainment.

2
ARIZONA
Area Designations For the
2008 Lead National Ambient Air Quality Standards
The Environmental Protection Agency (EPA) has revised the level of the primary (health-based)
National Ambient Air Quality Standard (NAAQS) for lead (Pb) from 1.5 micrograms per cubic
meter (μg/m³) to 0.15 μg/m³ measured as total suspended particles (TSP). EPA has revised the
secondary (welfare-based) standard to be identical in all respects to the primary standard.
Pursuant to section 107(d) of the Clean Air Act (CAA), EPA must designate as “nonattainment”
those areas that violate the NAAQS and those nearby areas that contribute to violations. The
table below identifies the portion of counties in Arizona (AZ) that EPA intends to designate
“nonattainment” for the 2008 lead national ambient air quality standard (2008 Lead NAAQS).
Table 1. Designation Recommendations
Area
AZ Recommended Nonattainment Counties
EPA’s Designated Nonattainment Counties
Nonattainment area for 1978 Lead NAAQS
Hayden None* Gila County (partial) Pinal County (partial)
na
*Governor of Arizona recommended delayed designations. EPA’s recommended boundary is identical to the
boundary described in ADEQ’s December 2009 Boundary Recommendation Technical Support Document.
Technical Analysis for Hayden, Arizona and Surrounding Areas
Introduction
This technical analysis for Hayden, Arizona identifies the monitor that violates the 2008 Lead
NAAQS and evaluates nearby areas for contributions to ambient lead concentrations in the area.
EPA has evaluated the surrounding area based on the weight of evidence of the following factors
recommended in previous EPA guidance:
Air quality in potentially included versus excluded areas;
Emissions and emissions-related data in areas potentially included versus excluded from
the nonattainment area, including population data, growth rates and patterns and
emissions controls;
Meteorology (weather/transport patterns);
Geography/topography (mountain ranges or other air basin boundaries);
Jurisdictional boundaries (e.g., counties, air districts, reservations, etc.); and
Any other relevant information submitted to or collected by EPA (e.g., modeling where
done appropriately).

3
Figure 1 is a map showing the state’s recommended nonattainment area and the surrounding
counties. Figure 2 shows the lead monitors in the area.
Figure 1. Violating Monitor and Surrounding Area
On December 15, 2009, the Governor of Arizona recommended that all portions of the State,
excluding Indian Country,1 be designated as unclassifiable/attainment for the Pb standard, with
the exception of the Hayden area of Gila and Pinal Counties, which is violating the standard.
Citing a commitment from the main source of Pb emissions in the area, ASARCO LLC, to
improve Pb controls on its facility, the Governor requested that EPA delay its designation of the
Hayden area. If exceedances are recorded between March 2010 – October 2010, or if ASARCO
fails to agree to enforceable controls, the letter recommends promulgating a nonattainment
boundary as shown in Figures 1 and 2.2 The basis for the boundary is discussed in Arizona
Department of Environmental Quality’s (ADEQ’s) boundary recommendation technical support
document.3
1 “Indian country” as defined at 18 U.S.C. 1151 refers to: “(a) all land within the limits of any Indian reservation
under the jurisdiction of the United States Government, notwithstanding the issuance of any patent, and, including
rights-of-way running through the reservation, (b) all dependent Indian communities within the borders of the
United States whether within the original or subsequently acquired territory thereof, and whether within or without
the limits of a state, and (c) all Indian allotments, the Indian titles to which have not been extinguished, including
rights-of-way running through the same.” 2 December 2009 Arizona Recommendation
3 ADEQ December 2009 Boundary Recommendation Technical Support Document
*Named sources emitted > 0.05 tpy of Pb according to 2005 NEIv2, 2008 TRI, and/or ADEQ emissions estimates. **Unnamed airports emitted < 0.05 tpy of Pb according to the draft 2008 NEI.
(draft 2008 NEI)**
Pb Point Source*
Freeport McMoRan
BHP Copper
ASARCO Copper Smelter & Concentrator
4
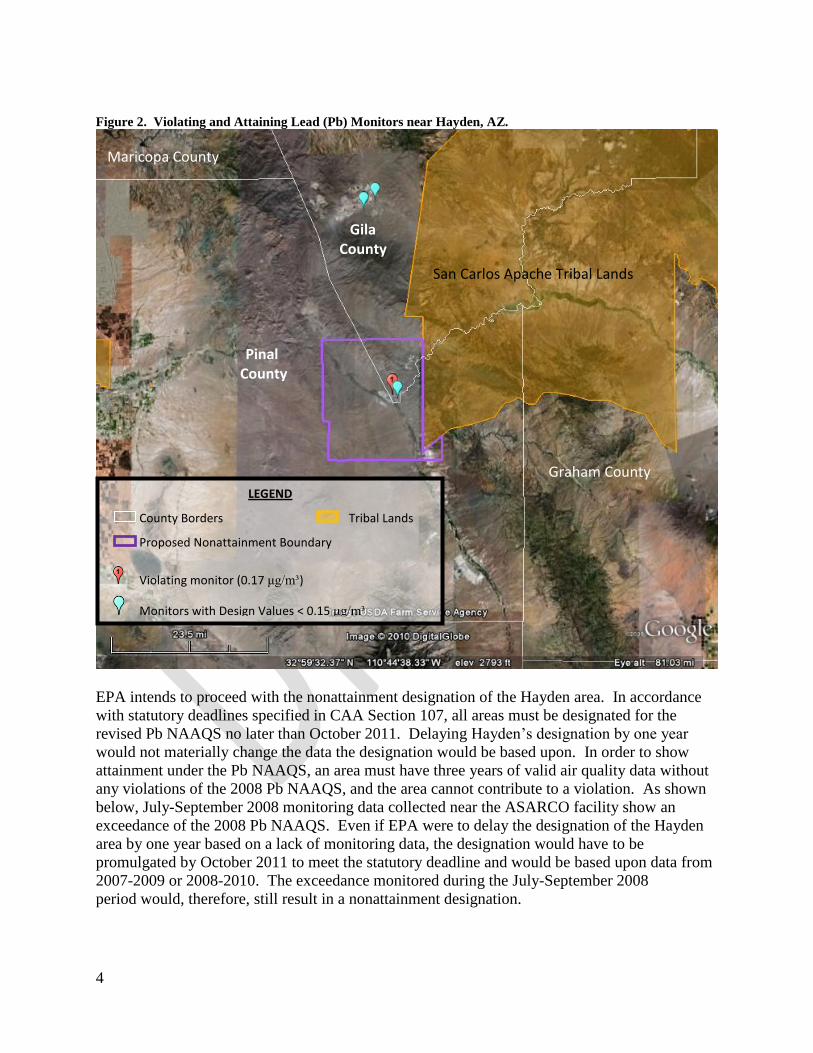
Figure 2. Violating and Attaining Lead (Pb) Monitors near Hayden, AZ.
EPA intends to proceed with the nonattainment designation of the Hayden area. In accordance
with statutory deadlines specified in CAA Section 107, all areas must be designated for the
revised Pb NAAQS no later than October 2011. Delaying Hayden’s designation by one year
would not materially change the data the designation would be based upon. In order to show
attainment under the Pb NAAQS, an area must have three years of valid air quality data without
any violations of the 2008 Pb NAAQS, and the area cannot contribute to a violation. As shown
below, July-September 2008 monitoring data collected near the ASARCO facility show an
exceedance of the 2008 Pb NAAQS. Even if EPA were to delay the designation of the Hayden
area by one year based on a lack of monitoring data, the designation would have to be
promulgated by October 2011 to meet the statutory deadline and would be based upon data from
2007-2009 or 2008-2010. The exceedance monitored during the July-September 2008
period would, therefore, still result in a nonattainment designation.
Gila County
Maricopa County
Graham County
Pinal County
LEGEND
County Borders Tribal Lands
Proposed Nonattainment Boundary
Violating monitor (0.17 μg/m³)
Monitors with Design Values < 0.15 μg/m³
San Carlos Apache Tribal Lands

5
EPA is not delaying designation of the Hayden area as sufficient data are available to make a
nonattainment determination at this time.
Based on EPA's technical analysis and currently available information, which is described
below, EPA intends to designate the Hayden area of Gila and Pinal Counties as nonattainment
for the 2008 Pb NAAQS.
Air Quality Data
This factor considers the Pb design values (in µg/m3) for air quality monitors in the Hayden, AZ
area and the surrounding area based on 2006-2008 data. A monitor’s design value indicates
whether that monitor attains a specified air quality standard. The 2008 Pb NAAQS are met at a
monitoring site when the identified design value is valid and less than or equal to 0.15 µg/m3. A
design value is only valid if minimum data completeness criteria are met. A Pb design value that
meets the NAAQS is generally considered valid if it encompasses 36 consecutive valid 3-month
site means (specifically for a 3-year calendar period and the two previous months). For this
purpose, a 3-month site mean is valid if valid data were obtained for at least 75 percent of the
scheduled monitoring days in the 3-month period. For purposes of assessing data capture, data
collected before January 1, 2009 will be treated with an assumed scheduled sampling frequency
of every sixth day, as specified by 40 CFR part 50 Appendix R, section 4(c)(i). A Pb design
value that does not meet the NAAQS is considered valid if at least one 3-month mean that meets
the same 75 percent requirement is above the NAAQS. That is, a site does not have to monitor
for three full calendar years in order to have a valid violating design value; a site could monitor
just three months and still produce a valid (violating) design value.
Pb monitors that collected data in Arizona for all or part of 2006 through 2008 are listed in Table
2.
As detailed in 40 CFR part 50 Appendix R, all FRM/FEM Pb-TSP and Pb-PM10 data collected in
accordance with the requirements of 40 CFR part 58, including Appendix A (quality assurance),
Appendix C (federal reference methods/federal equivalent methods (FRM/FEM)), and Appendix
E (siting criteria), are comparable against the Pb NAAQS. In addition, Pb-TSP and Pb-PM10
data representing sample collection periods prior to January 1, 2009 (i.e., "pre-rule" data) will be
considered valid for NAAQS comparisons and related attainment/nonattainment determinations
if the data were submitted to EPA’s Air Quality System (AQS) database prior to September 1,
2009, and the sampling and analysis methods used to collect the data were consistent with (1)
previous or newly designated FRMs or FEMs, and (2) the provisions of 40 CFR part 58 that were
in effect either at the time of original sampling or at the time of the attainment/nonattainment
determination. 40 CFR part 50, Appendix R contains the requirement for data used for
comparison with the Pb NAAQS.
In October 2006, EPA Region 9’s Superfund Division began collecting Pb-PM10 monitoring data
at the Hayden Maintenance Building monitor just west of the ASARCO copper concentrate and
smelting facility in Hayden, AZ. EPA’s Superfund Division also collected Pb-PM10 monitoring
data at the Winkelman site, located to the southeast of the ASARCO facility. (See Figure 3.)

6
Values from July, August, and September 2008 resulted in a 3-month average design value of
0.17 μg/m³ at the Hayden Maintenance Building monitor.
EPA has reviewed the quality assurance and quality control documents collected during this
sampling time. As required by 40 CFR part 58, Appendix A, a quality assurance project plan
was in place at the time of sampling, as was a field sampling and data management plan. The
information was entered into AQS in August 2009. Review of calibrations, flow checks, field
data sheets, chain of custody forms and laboratory reports show data collected at Hayden from
July through September 2008 to be valid.
Partisol-Plus Model 20205 Sequential Air Samplers were used at both Winkelman and the
Hayden Maintenance Building sites. At the time, these monitors were designated as EPA PM10
reference method monitors (RFPS-1298-127).4 On June 2, 2009, EPA published a Federal
Register notice designating these monitors as federal reference monitors for PM Coarse (PM10c).5
The monitors therefore meet the Federal Reference Method/Federal Equivalent Method
(FRM/FEM) requirements as specified in 40 CFR part 50, Appendix R. Filters were analyzed
using Energy Dispersive X-ray Fluorescence Spectroscopy (EDXRF) consistent with EPA
Compendium Method IO-3.3 and 40 CFR Part 50 Appendix R.6
The Hayden Maintenance Building monitoring site meets all siting and network design
requirements specified in 40 CFR 58 Appendices D and E. Located on the roof of a maintenance
building, the monitor complies with the requirement in 40 CFR 58 App. D 4.5 (i) which states
that "a monitor must be sited...where the Pb concentrations from all sources combined is
expected to be at its maximum". It is appropriate for the monitor to capture contributions from
ASARCO as well as any other Pb sources. This site is located in close proximity to a number of
public residences and is an appropriate location for monitoring ambient air and population
exposure.
EPA’s review shows the data collected at the Hayden Maintenance Building between July –
September 2008 to be valid for comparison against the Pb NAAQS.
Values from July, August, and September 2008 resulted in a 3-month average of 0.17 μg/m³ for
the Hayden Maintenance Building monitor. For 2006-2008, the Winkelman site’s design value
(highest 3 month average that meets data completeness requirements) is 0.04 μg/m³.
4 69624 Federal Register / Vol. 63, No. 242 / Thursday, December 17, 1998 / Notices
5 26395 Federal Register / Vol. 74, No. 104 / Tuesday, June 2, 2009 / Notices
6 66964 Federal Register / Vol. 73, No. 219 / Wednesday, November 12, 2008 / Rules and Regulations

7
Figure 3. Pb Monitors in Arizona and Associated Design Values
Pb data were also collected near the Freeport McMoRan (FMMI) copper mining and smelting
facility in Miami, AZ. Formerly owned by Phelps Dodge, the permitted facility has been
operating monitors near the facility. The information has not been entered into AQS but was
reviewed to inform these designations. The design value for the FMMI-Ridgeline monitor is
0.07 μg/m³. The design value for the FMMI-Golf Course monitor is 0.04 μg/m³.
Finally, the last Pb monitoring site in Arizona is the James L. Guyton (JLG) Supersite in
Phoenix. Run by ADEQ, it also collects Pb-PM10 and has a design value of 0.01 μg/m³.
LEGEND
County Borders Proposed Nonattainment Boundary
Monitors
Source Oriented Monitors
Icon Name Design Value
(μg/m³)
1 Hayden Maintenance Yard 0.17
2 Winkelman High School 0.04
3 FMMI Golf Course 0.04
4 FMMI Ridgeline 0.07
Population-Based Monitor
A JLG Supersite (Phoenix) .03

8
Table 2. Air Quality Data - Pb monitors in Arizona*
County State Recommended
Nonattainment?
Monitor Name Monitor Air Quality
System ID
Monitor Location Lead Design Value,
2006 - 2008 (µg/m
3)
Gila County
No** Hayden Maintenance Building
04-007-8020-01 2nd
Street and Garfield Ave, Hayden
0.17
Winkelman High School
04-007-8021-01 824 Thorne Ave., Winkelman
0.04
FMMI Ridgeline 04-007-0009-01 4030 Linden St, Miami
0.07
FMMI Golf Course
04-007-8000-01 SR 188 and US 60, Globe
0.04
Maricopa County
No JLG Supersite 04-013-9997-01
4530 N. 17th
Ave, Phoenix 0.01
*Monitors in Bold have the highest 2006-2008 design value in the respective county.
**Governor of Arizona recommended delayed designations. The Hayden and Winkelman monitors fall within the
boundary described in ADEQ’s December 2009 Boundary Recommendation Technical Support Document. The
remaining monitors are outside of the boundary.
All five sites in Arizona collected Pb-PM10 data from 2006-2008. The revised 2008 Pb NAAQS
is 0.15 μg/m³, collected as Pb-TSP. Total suspended particulate (TSP) monitors collect both
small-sized particles which may be inhaled, as well as larger-sized particles which are too large
to be inhaled but may affect human health through ingestion. Monitors that collect particulate
matter of 10 microns and smaller (PM10) capture inhalable-sized lead, but do not capture the
larger, ingestible lead particles. Ingestion can be a significant Pb exposure pathway, particularly
for young children, and larger particles may, through weathering or mechanical action, become
respirable at some point.7 Because what is captured by a PM10 monitor may not account for the
full Pb-TSP concentration, 40 CFR part 50 Appendix R, section 2(a)(i) specifies that Pb-PM10
data may be used to show nonattainment, but it cannot be used to show attainment. ADEQ is
also required to install a Pb-TSP monitor near the ASARCO, Hayden smelter.
As shown in Figure 2, the San Carlos Apache tribal lands lie to the east of the recommended
nonattainment area. There are no Pb ambient air monitors operating within the tribal lands, nor
do the tribal lands have any sources emitting 0.1 tons per year of Pb or more (see Emissions and
Emissions-Related Data section below). The Winkelman High School Pb-PM10 monitor is
located to the east of the sole Pb source located within the nonattainment area (the ASARCO
copper and smelting facility), and west of the tribal lands. Being a Pb-PM10 monitor, the
Winkelman monitor does not capture any Pb particles larger than 10 microns that may be present
in the ambient air. However, its design value of 0.04 μg/m³ is well below the standard. EPA
does not require Pb-PM10 monitors to be replaced by Pb-TSP monitors until a 3-month mean
exceeds 0.10 μg/m³.8 Available air data therefore indicate that areas to the east of the monitor,
including the San Carlos Apache tribal lands, are not causing the violation at the Hayden
Maintenance Building monitor.
7 66964 Federal Register / Vol. 73, No. 219 / Wednesday, November 12, 2008 / Rules and Regulations.
8 40 CFR Part 58 Appendix C, section 2.10.2.
9
The Hayden Maintenance Building monitor, sited in Gila County, close to the border of Pinal
County, is in violation of the 2008 Pb NAAQS. Therefore some portion of Gila County and
possibly additional areas in surrounding counties must be designated nonattainment. We
evaluate nearby counties because for each monitor or group of monitors that exceed a standard,
nonattainment boundaries must cover a large enough area to include not only the area judged to
be violating the standard but also the source areas that are determined to be contributing to the
violations. Each area has been evaluated based on the weight of evidence of eight factors and
other relevant information.
Emissions and Emissions-Related Data
Evidence of lead emissions sources surrounding a violating monitor are an important factor for
determining whether a nearby area is contributing to a monitored violation. For this factor, EPA
evaluated county level emissions data for lead, population data, and emissions controls.
Emissions
Emissions data were derived from the 2005 National Emissions Inventory, version 2 (NEIv2),
which is the most up-to-date version of the national inventory. See
http://www.epa.gov/ttnchie1/net/2005inventory.html. EPA recognizes that for certain counties,
emissions may have changed since 2005. For example, certain large sources of emissions in or
near this area may have installed emission controls or otherwise significantly reduced emissions
since 2005. EPA therefore also considered 2008 TRI information for Arizona.9 In addition,
Arizona provided updated emissions for the ASARCO Hayden smelter.10
Table 3 reflects data
from the state, the 2005 NEIv2, and the 2008 TRI.
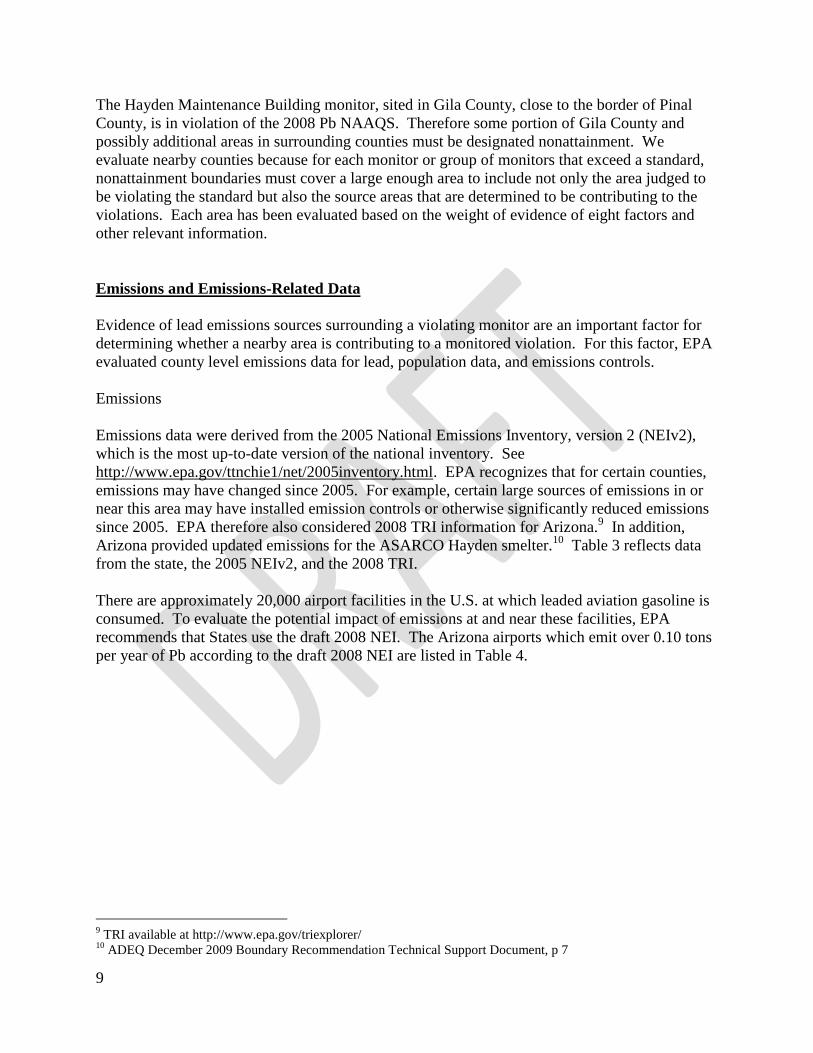
There are approximately 20,000 airport facilities in the U.S. at which leaded aviation gasoline is
consumed. To evaluate the potential impact of emissions at and near these facilities, EPA
recommends that States use the draft 2008 NEI. The Arizona airports which emit over 0.10 tons
per year of Pb according to the draft 2008 NEI are listed in Table 4.
9 TRI available at http://www.epa.gov/triexplorer/
10 ADEQ December 2009 Boundary Recommendation Technical Support Document, p 7

10
Table 3. Arizona Facilities with Pb Emissions > 0.10 tpy.*
County
Facility in State Recommended Nonattainment Area? Facility Address City
Facility Total Air Releases
(tpy)
Gila No Freeport-McMoRan Miami Inc Hwy 60 And New St. Claypool 4.90
Gila No** Asarco LLC Ray Complex/ Hayden Smelter & Concentrator 640 Asarco Ave Hayden 4.82
Gila No BHP Coppper Inc Pinto Valley Operation
Hwy 60 And Pinto Valley Rd Miami 0.13
Cochise No Aacco Cast Products Inc 401 N Aacco Trails Benson 0.23
Greenlee No Freeport-Mcmoran Morenci Inc 4521 Us Hwy 191 Morenci 0.44
Maricopa No Goodrich Corp Universal Propulsion Co 25401 N. Central Ave. Phoenix 0.13
Navajo No Cholla Power Plant 4801 Frontage Rd Joseph City 0.14
*Emissions reflect highest value from ADEQ, 2008 TRI, and 2005 NEI version 2.
**Governor of Arizona recommended delayed designations. Facility falls within the boundary described in ADEQ’s
December 2009 Boundary Recommendation Technical Support Document.
Table 4. Airports in Arizona Emitting > 0.10 tpy Pb according to the draft 2008 NEI.
County
Airport in State Recommended Nonattainment Area?* Facility Type City
Facility Total Air Releases (tpy)
Gila No Payson Airport Payson 0.12
Pinal No Casa Grande Muni Airport Casa Grande 0.27
Cochise No Cochise College Airport Douglas 0.13
Cochise No Sierra Vista Muni-Libby AAF Airport Fort Huachuca Sierra Vista 0.11
Coconino No Grand Canyon National Park Airport Grand Canyon 0.29
Coconino No Flagstaff Pulliam Airport Flagstaff 0.11
Maricopa No Phoenix Deer Valley Airport Phoenix 1.35 Maricopa No Falcon Fld Airport Mesa 1.23
Maricopa No Chandler Muni Airport Chandler 0.93
Maricopa No Phoenix-Mesa Gateway Airport Phoenix 0.67 Maricopa No Phoenix Goodyear Airport Goodyear 0.61
Maricopa No Scottsdale Airport Scottsdale 0.50
Maricopa No Glendale Muni Airport Glendale 0.39 Maricopa No Phoenix Sky Harbor Intl Airport Phoenix 0.32
Maricopa No Pleasant Valley Airport Peoria 0.21 Maricopa No Gila Compressor Station Airport Arlington 0.18
Maricopa No Lakeside Airpark Airport Buckeye 0.18
Maricopa No Goldfield Ranch Airport Fountain Hills 0.18 Maricopa No Gila Bend AF Aux Airport Gila Bend 0.18
Maricopa No Luke AFB Airport Glendale 0.18
Maricopa No Mobile Airport Mobile 0.18 Maricopa No Roesner Ranch Airport Morristown 0.18
Maricopa No Paloma Ranch Airport Paloma 0.18
Maricopa No Airscrew Performance Flightpark Ultralight Glendale 0.18
Maricopa No Wickenburg Muni Airport Wickenburg 0.13 Maricopa No Buckeye Muni Airport Buckeye 0.11

11
Maricopa No Stellar Airpark Airport Chandler 0.11
Maricopa No Eagle Roost Airpark Airport Aguila 0.11
Mohave No Grand Canyon West Airport Peach Springs 0.27
Mohave No Kingman Airport Kingman 0.16
Mohave No Lake Havasu City Airport Lake Havasu City 0.14
Pima No Ryan Field Airport Tucson 0.72
Pima No Tucson Intl Airport Tucson 0.44
Pima No Marana Rgnl Airport Tucson 0.25
Yavapai No Ernest A. Love Field Airport Prescott 0.92 Yavapai No Sedona Airport Sedona 0.13
Yuma No Yuma M. C. A. S. Airport Yuma M. C. A. S. 0.16
*Governor of Arizona recommended delayed designations. No airports in Table 4 fall within the boundary
described in ADEQ’s December 2009 Boundary Recommendation Technical Support Document.
Figure 4 shows airports and point sources in the area near the violating monitor. According to
the information sources listed above, other than the ASARCO copper smelter there are no
sources that emit over 0.10 tons of Pb per year within 25 miles of the violating monitor.
There are no known Pb sources emitting 0.1 tons per year of Pb or greater in the San Carlos
Apache tribal lands. Without any sources emitting over 0.1 tons per year of Pb, it is unlikely the
San Carlos Apache tribal lands are causing or contributing to the violation at the Hayden
Maintenance Building monitor. As discussed in the Air Quality Data section above, data from
the Winkelman High School monitor supports this conclusion. Air quality and emissions data
support excluding the San Carlos Apache tribal lands from the nonattainment area.

12
Figure 4. Lead (Pb) Sources near the Violating Monitor.
LEGEND
Violating Monitor (0.17 μg/m³) County Borders
Monitors with Design Values < 0.15 μg/m³ Proposed Nonattainment Boundary
Airports (according to the draft 2008 NEI) Other Point Sources (according to 2005
NEIv2, state emissions inventory, 2008 TRI)
0.1 – 0.3 tpy
0.1 – 0.3 tpy
0.3 – 0.5 tpy
0.3 – 0.5 tpy
0.5 – 1.0 tpy
0.5 – 1.0 tpy
> 1.0 tpy
> 1.0 tpy
13
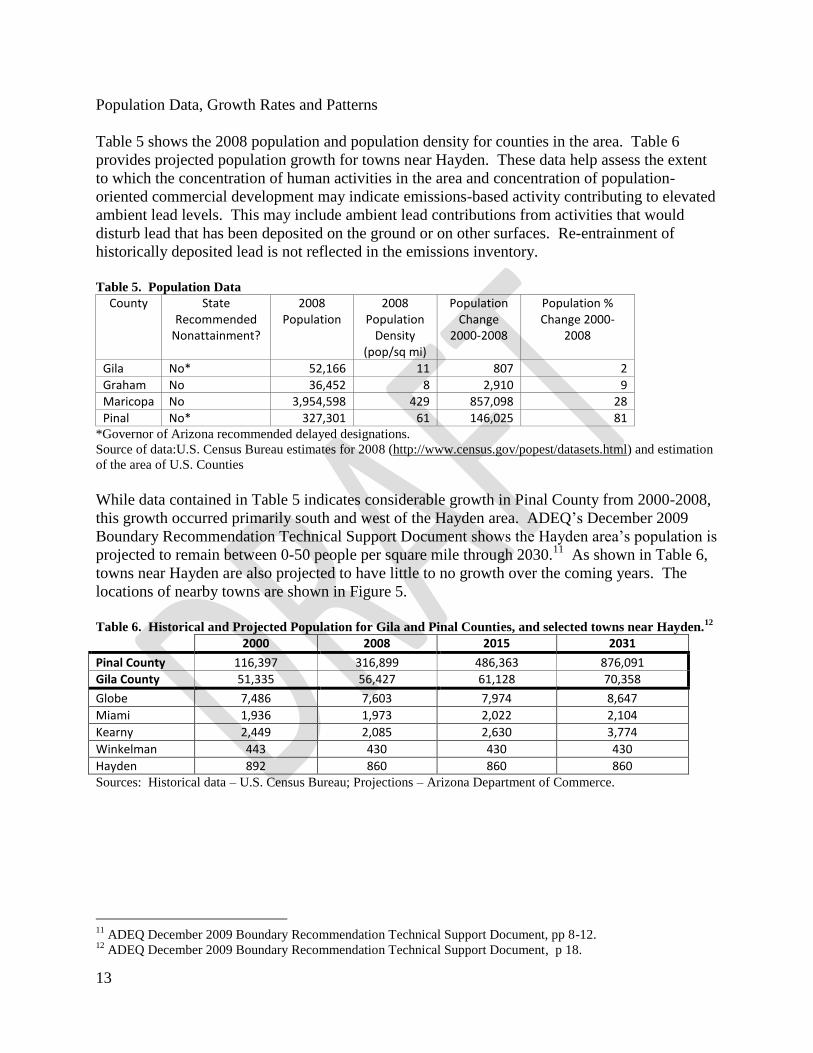
Population Data, Growth Rates and Patterns
Table 5 shows the 2008 population and population density for counties in the area. Table 6
provides projected population growth for towns near Hayden. These data help assess the extent
to which the concentration of human activities in the area and concentration of population-
oriented commercial development may indicate emissions-based activity contributing to elevated
ambient lead levels. This may include ambient lead contributions from activities that would
disturb lead that has been deposited on the ground or on other surfaces. Re-entrainment of
historically deposited lead is not reflected in the emissions inventory.
Table 5. Population Data
County State Recommended
Nonattainment?
2008 Population
2008 Population
Density (pop/sq mi)
Population Change
2000-2008
Population % Change 2000-
2008
Gila No* 52,166 11 807 2
Graham No 36,452 8 2,910 9 Maricopa No 3,954,598 429 857,098 28
Pinal No* 327,301 61 146,025 81 *Governor of Arizona recommended delayed designations.
Source of data:U.S. Census Bureau estimates for 2008 (http://www.census.gov/popest/datasets.html) and estimation
of the area of U.S. Counties
While data contained in Table 5 indicates considerable growth in Pinal County from 2000-2008,
this growth occurred primarily south and west of the Hayden area. ADEQ’s December 2009
Boundary Recommendation Technical Support Document shows the Hayden area’s population is
projected to remain between 0-50 people per square mile through 2030.11
As shown in Table 6,
towns near Hayden are also projected to have little to no growth over the coming years. The
locations of nearby towns are shown in Figure 5.
Table 6. Historical and Projected Population for Gila and Pinal Counties, and selected towns near Hayden.
12
2000 2008 2015 2031
Pinal County 116,397 316,899 486,363 876,091
Gila County 51,335 56,427 61,128 70,358
Globe 7,486 7,603 7,974 8,647
Miami 1,936 1,973 2,022 2,104
Kearny 2,449 2,085 2,630 3,774
Winkelman 443 430 430 430
Hayden 892 860 860 860 Sources: Historical data – U.S. Census Bureau; Projections – Arizona Department of Commerce.
11
ADEQ December 2009 Boundary Recommendation Technical Support Document, pp 8-12. 12
ADEQ December 2009 Boundary Recommendation Technical Support Document, p 18.

14
Figure 5. Counties and Cities near Hayden, Arizona.
EPA has considered the population growth rate for this area and does not believe that it affects
the boundary recommendation.
Emissions Controls
Under this factor, the existing level of control of emission sources is taken into consideration.
The emissions data used by EPA in this technical analysis and provided in Tables 3 and 4
represent emissions levels taking into account any control strategies implemented prior to the
relevant data collection.
Gila County
Pinal County
Maricopa County
Yavapai County
Graham County
Cochise County
Pima County
Navajo County
Apache County
LEGEND
County Borders Cities/Towns
Proposed Nonattainment Boundary
15
Specific to ASARCO, required control measures and technologies are listed in the operating
permit issued by ADEQ. See ADEQ’s December 2009 Boundary Recommendation Technical
Support Document for more details.
Meteorology (weather/transport patterns)
Due to the constraints imposed by the complex terrain in the Hayden area (see
Geography/Topography factor), the extent of the area exceeding the Pb standard is confined to a
relatively small area around the main source of lead emissions, the ASARCO Hayden smelter.
For the same reason, locations outside the particular valleys intersecting at Hayden do not
contribute to NAAQS exceedances there. Therefore, the meteorology factor did not play a
significant role in determining a boundary for the nonattainment area.
Meteorological data is available from the very nearby Winkelman 6 S station, part of the
National Weather Service Cooperative Observer Program. There is typically only 14 inches of
rain each year, with nearly half occurring July through September, coinciding with the Arizona
"monsoon" season. There is less than an inch of snow each year. Daily temperature highs range
from 64 to 91°F depending on season, and lows range from 31 to 69°F.
General wind information for Gila County is presented in Figure 6. Varied elevations in and
around Hayden cause complex local wind flow. Within and adjacent to the Gila River and San
Pedro River valleys, drainage winds tend to dominate at night under stable conditions, toward the
west on the south and west side of the smelter, and toward the south on the east side of the
facility. These conditions cause air pooling in low-lying areas at night, causing pollutants within
the air to settle in these areas. During the day under convective conditions, good vertical mixing
causes polluted air to reach the ground. The vertical mixing also causes the flow to be coupled
with winds aloft, which generally flow toward the east.
ADEQ's boundary recommendation technical support document further describes wintertime
conditions.
During the wintertime, relatively strong inversions (where cold air becomes trapped at
the surface by warmer air aloft) create extremely stable atmospheric conditions.
Depending on the strength of the inversion and amount of daytime surface heating, the
inversion may break by the early afternoon, permitting the air to mix vertically.
Sometimes, however, the inversion may not break at all. Under these conditions, vertical
and horizontal movement of the air is very limited, causing pollutants in the air to
accumulate up to several days with little dispersion.13
As described in the Geography and Topography factor below, Hayden's complex terrain limits
the extent of the area exceeding or contributing to the violation.
13
ADEQ December 2009 Boundary Recommendation Technical Support Document, p 21.

16
Figure 6. Average Wind Direction Frequencies in Gila County, AZ.
Source: A three-dimensional bar chart shows the wind frequencies in eight directions for the four seasons. This data
is taken from 1960-1992 Solar and Meteorological Surface Observation Network information issued jointly by the
U.S. Department of Commerce: National Climatic Data Center and the U.S. Department of Energy: National
Renewable Energy Laboratory. The chart frequencies reflect the directions from which the winds come.
Geography/topography (mountain ranges or other air basin boundaries)
The geography/topography analysis evaluates the physical features of the land that might have an
effect on the air shed and, therefore, on the distribution of lead over Hayden, Arizona. As shown
in Figure 7, the ASARCO Hayden smelter is located in very complex terrain, with the Gila River
making a winding semi-circle south of the facility, and intersected by the San Pedro River valley
from the south. The facility itself is elevated relative to the valleys; there is a 200 foot hill just
south of the facility, and mountains rising toward the north/northeast. ADEQ's boundary
recommendation technical support document contains the following terrain description.
Hayden lies in the Gila River Valley, approximately 2,044 feet above sea level. The town sits
at the base of the Dripping Springs Mountains which rise to a height of approximately 5,096
feet. The Mescal and Pinal Mountain ranges rise to the east beyond the Dripping Springs
range to approximately 7,848 feet in elevation at the highest point. To the west of Hayden,
the Tortilla Mountains rise to a height of 4,273 feet. The complex terrain forms natural
boundaries that isolate the Hayden area from most of Gila and Pinal Counties.14
In all directions there is a mountain side, limiting the extent of the area exceeding the Pb
standard to a relatively small area around the smelter, the main source of Pb emissions. For the
same reason, locations outside the particular valleys intersecting at Hayden do not contribute to
NAAQS exceedances there. This supports a relatively small nonattainment area, comprising the
nearby valleys and mountains, and including a buffer zone.
14
ADEQ December 2009 Boundary Recommendation Technical Support Document, p 21.

17
Figure 7. Terrain Near Hayden, AZ.
Jurisdictional boundaries
Existing jurisdictional boundaries may be helpful in articulating a boundary for purposes of
nonattainment designations, and for purposes of carrying out the governmental responsibilities of
planning for attainment of the lead NAAQS and implementing control measures. These existing
boundaries may include an existing nonattainment or maintenance area boundary, a county or
township boundary, a metropolitan area boundary, an air management district, or an urban
planning boundary established for coordinating business development or transportation activities.
In evaluating the jurisdictional factor, EPA considered the planning and organizational structure
of Pinal County, Gila County and the State of Arizona, as well as existing nonattainment
boundaries, to ensure that the implementation of controls within the prospective nonattainment
area can be carried out in a cohesive manner. See Figure 5 for county boundaries.
LEGEND
County Borders
Proposed Nonattainment Boundary
Design Value monitor (0.17 μg/m³)
Monitor with Design Value < 0.15 μg/m³

18
ADEQ has overall jurisdiction over environmental programs in the state of Arizona, as well as
jurisdiction over certain source types, including smelters, refineries, and coal-fired power plants,
and retains authority for regulating emissions from agricultural operations. Three Arizona
counties, Maricopa, Pima, and Pinal, have their own air pollution control programs and operate
pursuant to agreements with ADEQ. The lead air quality planning agencies responsible for state
implementation plans (SIPs) for Maricopa County and Pima County are the metropolitan
planning organizations (MPO), the Maricopa Association of Governments (MAG) and the Pima
Association of Governments (PAG), respectively. There is no MPO and thus no air quality
planning agency for SIP purposes in Pinal County or Gila County. Therefore, ADEQ is
responsible for developing SIPs for these counties.
As shown in Figure 8, the San Carlos Apache tribal lands lie to the east of the recommended
nonattainment area in both Pinal County and Gila County. Neither ADEQ nor the counties have
jurisdiction over tribal lands.
With the exception of the eastern boundary, the intended Pb nonattainment area boundary
coincides with that of the existing Hayden SO2 nonattainment area15
. Arizona recommended
excluding Indian Country from the nonattainment area, as the state has no jurisdiction over
Indian lands.16
As discussed in previous sections of this document, the Winkleman monitor,
located just east of Hayden and west of the San Carlos Apache tribal lands, has a design value of
0.04 µg/m3, well below the standard. There are no known Pb sources emitting 0.1 tons per year
of Pb or greater in the San Carlos Apache tribal lands. Given the air quality data, lack of
sources, the low monitored concentrations, and the state's lack of jurisdiction, EPA supports
excluding the San Carlos Apache tribal lands from the recommended Hayden Pb nonattainment
area.
15
44 FR 21261, April 10, 1979 16
ADEQ December 2009 Boundary Recommendation Technical Support Document, p 2

19
Figure 8. Tribal Lands and SO2 Nonattainment Boundary.
LEGEND
Violating Monitor (0.17 μg/m³) SO2 Nonattainment Boundary
Monitor with Design Value < 0.15 μg/m³ Proposed Pb Nonattainment Boundary
County Borders Tribal Lands
Airports (according to the draft 2008 NEI) Other Point Sources (according to 2005 NEIv2,
state emissions inventory, 2008 TRI)
0.1 – 0.3 tpy
0.1 – 0.3 tpy
0.3 – 0.5 tpy
0.3 – 0.5 tpy
0.5 – 1.0 tpy
0.5 – 1.0 tpy
> 1.0 tpy
> 1.0 tpy
San Carlos Apache Tribal Lands

20
Other Relevant Information
See ADEQ’s submittal documents for further details.
Conclusion
After considering the factors described above, EPA believes it is appropriate to include the
Hayden portions of Gila and Pinal Counties in the Hayden 2008 Pb NAAQS nonattainment area.
The Hayden Maintenance Building air quality monitor near the ASARCO copper smelting and
concentrate facility in Gila County shows a violation of the 2008 Pb NAAQS, based on 2006-
2008 air quality data. All other Pb monitors in Arizona currently attain the standard, including
those north and east of the violating monitor. Given the heavy weight of Pb, emissions are not
expected to transport long distances. Instead, Pb emissions fall out of the atmosphere relatively
close to their emission point. The topography and geography of the Hayden area further support
the boundaries identified by the state. Based on its consideration of all the relevant, available
information, as described above, EPA believe that the boundaries described herein encompass
the entire area that does not meet (or that contributes to ambient air quality in a nearby area that
does not meet) the 2008 Pb NAAQS.

21
Citations
December 2009 Arizona Recommendation Letter from Janice K. Brewer, Governor, to Laura Yoshii, U.S. Environmental Protection
Agency Region 9, December 15, 2009 transmitting recommendations for the 2008 Pb NAAQS,
with enclosures.
ADEQ December 2009 Boundary Recommendation Technical Support Document “Arizona Air Quality Designations Technical Support Document: Boundary Recommendation
for the 2008 Revision to the National Ambient Air Quality Standard for Lead,” Air Quality
Division, Arizona Department of Environmental Quality, December 9, 2009.
References
BGI Incorporated. June 17, 2008. Certificate of Calibration, tetraCal, serial number 000176.
CH2M Hill. November 2005. Final Field Sampling Plan, ASARCO LLC Hayden Plant Site,
Remedial Investigation. Prepared by CH2M Hill for U.S. EPA Region 9.
Chester LabNet. August 20, 2008. Lab Analysis Report #08-266 for Client #C033. Prepared
for CH2M Hill.
Chester LabNet. August 22, 2008. Lab Analysis Report #08-284 for Client #C033. Prepared
for CH2M Hill.
Chester LabNet. September 8, 2008. Lab Analysis Report #08-302 for Client #C033. Prepared
for CH2M Hill.
Chester LabNet. June 1, 2010. Lab Analysis Report #10-134 for Client #I012. Prepared for
Innovative Technical Solutions, Inc.
Chester LabNet. March 2010. Certifications and Calibrations.
Chinook Engineering. February 7, 2006. Certificate of Calibration, Streamline Pro MultiCal
System, serial number M060102.
Lee, Josephine. June 24, 2008. Meteorological and PM10 Monitoring Performance Audits at
Winkelman, AZ and Hayden, AZ Air Quality Monitoring Stations (ASARCO LLC Hayden Plant
Site), June 24, 2008. Prepared for John Hillenbrand/U.S. EPA by CH2M Hill.
Lindelof, Doug. December 29, 2008. Memorandum: Tier 1 Data Evaluation Memo for the
Asarco Hayden project, SDGs: 08-059, 08-169, 08-182, 08-206, 080-266, 08-284, 08-302, 08-
361, 08-373, 08-394, and 08-408. Prepared by Region 9 Environmental Services Assistance
Team (ESAT) for John Hillenbrand, U.S. EPA Region 9.

22
Monthly Quality Control Maintenance Check Sheets, Hayden, AZ monitor. November 2006 –
December 2008.
Wardwell, Sandra. November 13, 2009. Freeport McMoRan (FMMI) Golf Course Monitor
data.
Wardwell, Sandra. November 13, 2009. Freeport McMoRan (FMMI) Ridgeline Monitor data.
Wardwell, Sandra. December 1, 2009. Memorandum: Evaluation of QA/QC Information for Pb
Samples Collected by EPA in Hayden and Winkelman. Prepared by Sandra Wardwell, Unit
Manager, Arizona Department of Environmental Quality’s (ADEQ’s) Data Management & QA
Unit, to Ira Domsky, Deputy Director, ADEQ’s Air Quality Division.
Yoshimura, Gwen. November 30, 2009. Completeness Calculation, Hayden Maintenance
Building Monitor, July – September 2008.