telenor group · 2019-10-23 · challenging situation in pakistan 7 q3 2019 challenging macro...
TRANSCRIPT

Sigve Brekke, CEO
TELENOR GROUP Third quarter 2019
1

Disclaimer
The following presentation is being made only to, and is only
directed at, persons to whom such presentation may lawfully be
communicated (’relevant persons’). Any person who is not a relevant
person should not act or rely on this presentation or any of its
contents. Information in the following presentation relating to the
price at which relevant investments have been bought or sold in the
past or the yield on such investments cannot be relied upon as a
guide to the future performance of such investments.
This presentation does not constitute an offering of securities or
otherwise constitute an invitation or inducement to any person to
underwrite, subscribe for or otherwise acquire securities in any
company within the Telenor Group. The release, publication or
distribution of this presentation in certain jurisdictions may be
restricted by law, and therefore persons in such jurisdictions into
which this presentation is released, published or distributed should
inform themselves about, and observe, such restrictions.
This presentation contains statements regarding the future in
connection with the Telenor Group’s growth initiatives, profit
figures, outlook, strategies and objectives. In particular, the slide
“Outlook for 2019” contains forward-looking statements regarding
the Telenor Group’s expectations. All statements regarding the
future are subject to inherent risks and uncertainties, and many
factors can lead to actual profits and developments deviating
substantially from what has been expressed or implied in such
statements.
The comments in the presentation are related to Telenor’s
development in 2019 compared to the same quarter of 2018 and
accounting standards as of 31 December 2018, unless otherwise
stated. Outlook for 2019 is given on the IAS17/IFRS 15 accounting
standard.
2

3 Q3 2019
DNA acquisition completed Merging satellite entertainment
business with NENT
Subscription and traffic revenue growth in Myanmar and Thailand
Modernisation continues in Norway 5% mobile ARPU growth
Challenging situation in Pakistan
Highlights – Third quarter 2019

Modernisation yielding results in Norway
Q3 2019 4
ARPU growth across mobile and fixed Subscription and traffic revenue growth 5% opex reduction
329 344
Q3 18 Q3 19
+5%
373 399
Q3 18 Q3 19
+7% Mobile
Fixed broadband
Monetising on customer demands and world’s fastest mobile network
83 66
110 127
Fixed future Mobile Fixed
legacy
S&T growth
25% fibre revenue growth more than offset by decrease in copper related products
Opex reductions primarily driven by improvements in sales & marketing
Year on year change NOK m
104 2,046
Q3 19 Q3 18
2,150
-5%
NOK m NOK
1.4%
Organic growth

Thailand returning to growth, backed by network performance
Q3 2019 5
Improved customer satisfaction Steady subs. and traffic revenue improvement
Network NPS on level with pre transition period Improved survival rate and higher gross adds
Month on month improvement continues 4% ARPU growth in Q3
Growth in %
Jun 19 Apr 19 Jul 19 May 19 Aug 19 Sep 19

Strong customer intake in Myanmar continues
Q3 2019 6
2% subscription and traffic revenue growth
Q3 18 Q3 19
207
210
2%
Performance driven by subscriber growth, partly offset by ARPU pressure on voice services Annualisation of price floor regulation (Sep-18)
Solid subscriber trends continue
MMK billion
18.0
Q2 18 Q3 18 Q4 18
19.1
Q1 19 Q2 19 Q3 19
17.2 18.4
19.8 21.6
3.6 million new subscribers in one year
Million

Challenging situation in Pakistan
Q3 2019 7
Challenging macro environment… impacts performance
Devaluations of more than 30% in 2 years Consumer wallets negatively impacted
Unable to counteract effect of tax re-introduction Positive underlying growth, but ARPU increasingly under pressure Focus on cluster based performance improvements
PKR/USD development
-15
4
Q3 19
14
Tax re-
introduction
Q3 19
Underlying
5
Reversal
Q3 18
Subscription and traffic revenue growth (%) Percentage points contribution to growth
0.6
0.7
0.8
0.9
1
and tougher priorities for consumers…
Electricity prices
Fuel prices
23%
25%
Telenor stronghold in rural areas with more price sensitive customers
Development from Aug 2018 to Aug 2019
0.010
0.009
0.008
0.007
0.006

Major steps taken to simplify and de-risk asset portfolio
8
India exit announced (Feb 17)
VEON sell-down (April -17)
Disposal of Online Classifieds in Lat-Am (May -17)
VEON sell-down (Sep -17)
Financial services Partnering with ANT Financial in Pakistan (March -18)
Disposal of Central & Eastern European assets (March -18)
DNA Finland (April -19)
VEON sell-down (Mar -19)
Merging DTH business with Nordic Entertainment Group (Oct -19)

Jørgen C. Arentz Rostrup, CFO
TELENOR GROUP Third quarter 2019
9

Executing on our simplification agenda
Q3 2019 10
97.96% ownership after MTO Expected delisting in Q1 2020
Merging Canal Digital and Viasat Consumer assets in a non cash deal 50/50 ownership Peak run-rate of synergies expected to be NOK 600m Closing expected in first half 2020
DNA acquisition completed Merging Nordic satellite entertainment assets

Legacy and Pakistan putting pressure on subs. & traffic revenue growth
Q3 2019 11
Organic growth rate. Subscription & traffic revenues defined as revenues from mobile subscription & traffic, fixed internet & TV, retail telephony, data services and DTH
Total revenues (NOK bn)
Growth in Bangladesh and Norwegian fibre and mobile Pressure from fixed legacy and tax related effects in Pakistan
Reported revenues increased by 7% from inclusion of DNA (Finland) and FX Organic revenues remained stable
1.0
-0.6
0.6
0.4 1.1
Bangladesh Pakistan Denmark
0.3
Fixed fibre Fixed legacy
0.2
Sweden
0.0
Remaining
subs & traffic
Q3 19 Norway
mobile
1.0
27.6 28.1 27.7 28.0 29.5
Q3 18 Q4 18 Q1 19 Q2 19 Q3 19
Organic subscription & traffic revenue growth (%)
Percentage points contribution to growth

Stable opex development excluding M&A and DNA
Q3 2019 12
Opex by category (NOK m)* Opex by country (NOK m)*
* FX adjusted
104
67
2
142
169
63
Digi TP GP DNA dtac Q3 19
ex. DNA
Q3 19 Denmark Sweden Myanmar
14
Q3 18
46
Other/
Elim.
441 9,478
50
9,340
9,919
BC
45
Norway
2
-119
105
108
-248
-52
138
441
203 110 Other opex
Site rental
Operation and
Maintenance
Salaries and
Personnel
29
Sales, Marketing,
Commissions
Regulatory
Energy
Group
ex. DNA
342
DNA
CAT lease M&A
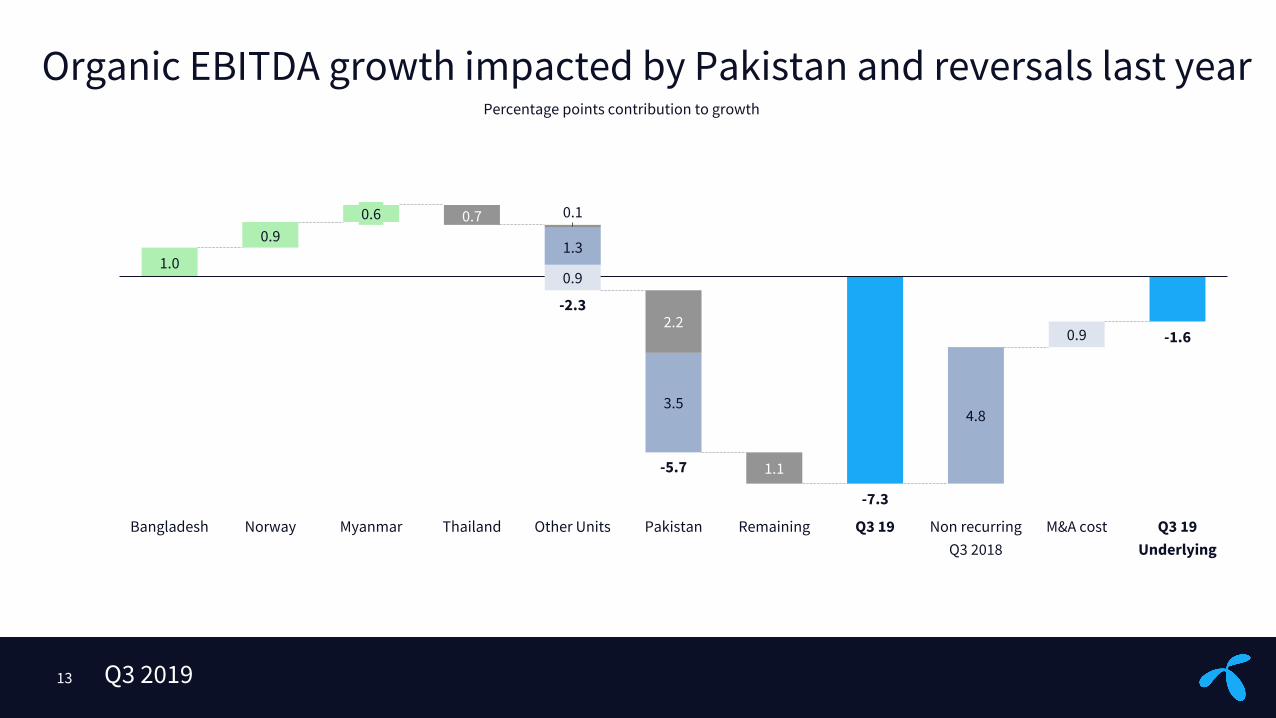
Organic EBITDA growth impacted by Pakistan and reversals last year
Q3 2019 13
1.0
-7.3
-1.6
0.9 0.7
1.3
0.1
Pakistan
0.9
1.1
Bangladesh
3.5
Norway Q3 19 Non recurring
Q3 2018
M&A cost
0.6
4.8
0.9
Q3 19
Underlying
Myanmar Thailand Other Units
-2.3
-5.7
2.2
Remaining
Percentage points contribution to growth

Net income of NOK -0.4 billion to equity holders of Telenor
Q3 2019 14
5.9
-0.4
1.9
2.1
0.3
Q3 2018 Depreciation
and
amortisation
Taxes EBITDA before
other items
0.1
Net profit from
discontinued
operations
Other items
0.4
Net financials
2.3
0.1
Remaining Q3 2019
4.01
-0.30
Earnings per share
NOK billion

Acquisition of DNA increasing leverage to 1.8x
Q3 2019 15
Free cash flow to equity holders of Telenor ASA
4.7
0.6 1.5 -0.8
2.8
Q3 18 Q4 18 Q1 19 Q2 19 Q3 19
M&A and disposals FCF excl M&A and disposals 26.5
-0.9
-11.6
Free cash flow (NOK bn)
2.5
Leverage and distribution to shareholders
1.0
Q2 19 Q3 19
1.8* DNA acquisition increased leverage by 0.65x (100%)
Share buyback >75% completed
Within targeted range of 1.5-2.0x
Net debt / EBITDA
-0.1
*Including 12 months rolling EBITDA for DNA (pro forma)

Q3 2019 16
Organic growth in subscription & traffic revenues
Organic EBITDA growth
Capex excl. licences (NOK bn)
*The outlook for 2019 is based on Group structure as of 30 September 2019 and excluding M&A costs related to the acquisition of DNA and the planned merger with Axiata in Asia. Subscription & traffic revenues from mobile, fixed and TV services, incl. Canal Digital DTH. Org. revenue growth in fixed currency, adj. for acquisitions and disposals. EBITDA before other items. Current Group structure and accounting standards as of 31 December 2018. **Excluding DNA
Low single digit decline*
Maintaining outlook for 2019
16-17 bn
Around 2018 level
-4.4%*
11.9 bn
-0.4%
YTD Excluding DNA

17
CAPITAL MARKETS DAY
29 JANUARY 2020 TELENOR HQ – FORNEBU NORWAY
SAVE THE DATE

Appendix
TELENOR GROUP Third quarter 2019
18

Geographic split of key financials first 9M 2019
Q3 2019 19
EBITDA before other items. Capex excl. licences.
38%
23%
31%
7%
ScandinaviaEmerging AsiaDeveloped AsiaOther
36%
30%
29% 4%
ScandinaviaEmerging AsiaDeveloped AsiaOther
33%
34%
28%
5%
ScandinaviaEmerging AsiaDeveloped AsiaOther
Revenues EBITDA EBITDA - CAPEX

Norway
Q3 2019 20
2 965 2 952 2 924 2 904 2 897
Q3 18 Q4 18 Q1 19 Q2 19 Q3 19
4 715 4 638 4 636 4 647 4 781
43% 40% 44% 43% 46%
Q3 18 Q4 18 Q1 19 Q2 19 Q3 19
1%
Organic growth Organic growth assuming fixed currency, adjusted for acquisitions and disposals. EBITDA before other items. Capex excl. licence fees
329 322 322 330 344
Q3 18 Q4 18 Q1 19 Q2 19 Q3 19
5% 2 826 2 647 2 749 2 717
2 938
1 001
1 754
979 1 378 1 407
Q3 18 Q4 18 Q1 19 Q2 19 Q3 19
EBITDA
CAPEX
4%
-2%
Mobile subscribers (‘000) Subs and traffic revenues (NOK m) and EBITDA margin
Mobile ARPU (NOK/month) EBITDA and capex (NOK m)

Sweden
Q3 2019 21
2 703 2 729 2 728 2 741 2 760
Q3 18 Q4 18 Q1 19 Q2 19 Q3 19
2 188 2 206 2 198 2 128 2 144
36% 32% 33% 33% 34%
Q3 18 Q4 18 Q1 19 Q2 19 Q3 19
-2%
Organic growth Organic growth assuming fixed currency, adjusted for acquisitions and disposals. EBITDA before other items. Capex excl. licence fees
213 211 208 204 203
Q3 18 Q4 18 Q1 19 Q2 19 Q3 19
-5% 1 068 1 020 995 971 1 029
251 436
310 330 324
Q3 18 Q4 18 Q1 19 Q2 19 Q3 19
EBITDA
CAPEX
-4%
2%
Mobile subscribers (‘000) Subs. and traffic revenues (NOK m) and EBITDA margin
Mobile ARPU (SEK/month) EBITDA and capex (NOK m)

Additional information – Norway and Sweden
Q3 2019 22
601 609 614 620 628
Q3 18 Q4 18 Q1 19 Q2 19 Q3 19
High-speed Low-speed
186 183 180 179 177
Q3 18 Q4 18 Q1 19 Q2 19 Q3 19
Roaming Interconnect
208 213 203 204 211
691 681 684 683 685
Mobile Norway – mobile ARPU (NOK)(‘000) Sweden – mobile ARPU (SEK)
Sweden – fixed broadband subscribers (‘000) Norway – fixed broadband subscribers (‘000)
300 295 297 304 318
14 12 12 12 12
Q3 18 Q4 18 Q1 19 Q2 19 Q3 19
Domestic Roaming Interconnect
330 344
329 322 322
643 650 655 656 662
Q3 18 Q4 18 Q1 19 Q2 19 Q3 19
High-speed Low-speed
834 850 844 841 826

Denmark
Q3 2019 23
1 737 1 699 1 671 1 659 1 652
Q3 18 Q4 18 Q1 19 Q2 19 Q3 19
874 851 837 813 827
24% 19%
22% 22% 24%
Q3 18 Q4 18 Q1 19 Q2 19 Q3 19
-8%
Organic growth Organic growth assuming fixed currency, adjusted for acquisitions and disposals. EBITDA before other items. Capex excl. licence fees
120 118 116 115 117
Q3 18 Q4 18 Q1 19 Q2 19 Q3 19
-3% 301
248 261 265 294
91
171
70 120 118
Q3 18 Q4 18 Q1 19 Q2 19 Q3 19
EBITDA
CAPEX
-5%
-5%
Mobile subscribers (‘000) Subs and traffic revenues (NOK m) and EBITDA margin
Mobile ARPU (DKK/month) EBITDA and capex (NOK m)
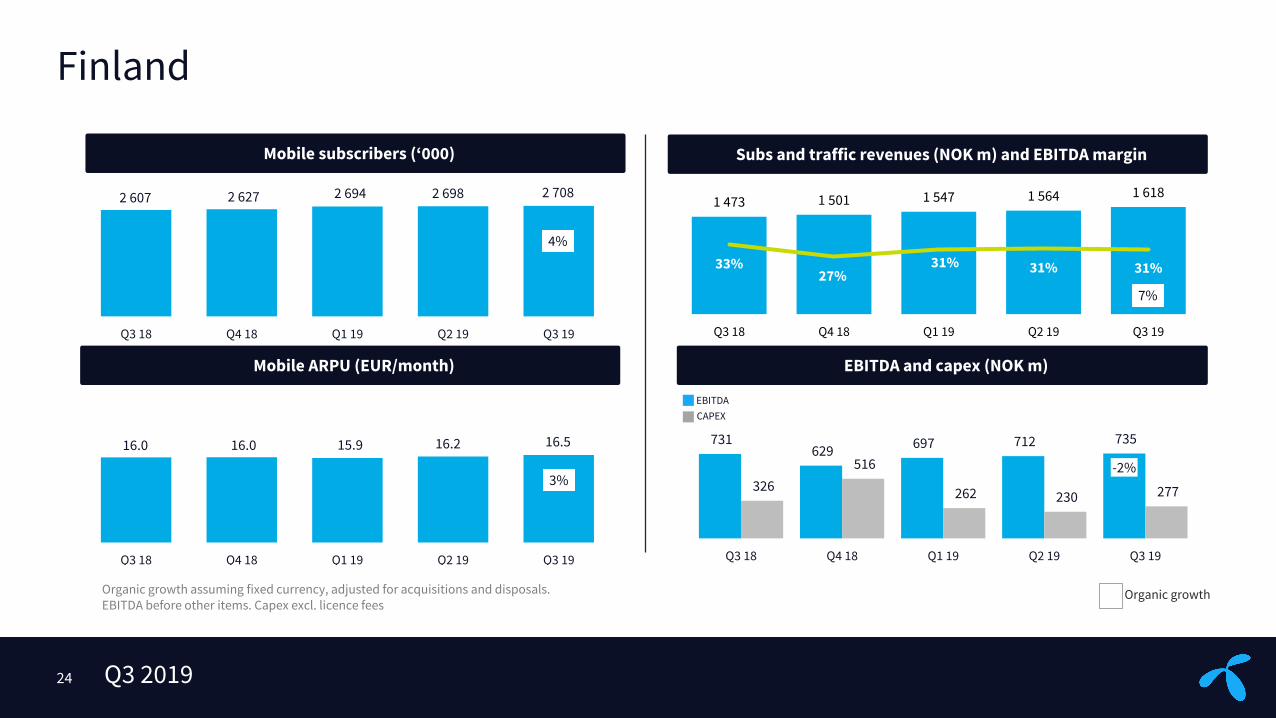
Finland
Q3 2019 24
2 607 2 627 2 694 2 698 2 708
Q3 18 Q4 18 Q1 19 Q2 19 Q3 19
1 473 1 501 1 547 1 564 1 618
33% 27%
31% 31% 31%
Q3 18 Q4 18 Q1 19 Q2 19 Q3 19
7%
Organic growth Organic growth assuming fixed currency, adjusted for acquisitions and disposals. EBITDA before other items. Capex excl. licence fees
16.0 16.0 15.9 16.2 16.5
Q3 18 Q4 18 Q1 19 Q2 19 Q3 19
3%
731 629
697 712 735
326
516
262 230 277
Q3 18 Q4 18 Q1 19 Q2 19 Q3 19
EBITDA
CAPEX
-2%
4%
Mobile subscribers (‘000) Subs and traffic revenues (NOK m) and EBITDA margin
Mobile ARPU (EUR/month) EBITDA and capex (NOK m)

Thailand (dtac)
Q3 2019 25
21 299 21 202 20 726 20 633 20 416
Q3 18 Q4 18 Q1 19 Q2 19 Q3 19
3 858 3 879 4 011 4 137 4 467
40% 27%
31% 32% 33%
Q3 18 Q4 18 Q1 19 Q2 19 Q3 19
0%
Organic growth assuming fixed currency, adjusted for acquisitions and disposals. EBITDA before other items. Capex excl. licence fees
250 247 243 252 261
Q3 18 Q4 18 Q1 19 Q2 19 Q3 19
4%
1 775
1 307 1 677 1 797 1 954
1 541
2 001
1 183
637 717
Q3 18 Q4 18 Q1 19 Q2 19 Q3 19
EBITDA
CAPEX
-5%
-4%
Mobile subscribers (‘000) Subs and traffic revenues (NOK m) and EBITDA margin
Mobile ARPU (THB/month) EBITDA and capex (NOK m)
Organic growth

Malaysia (Digi)
Q3 2019 26
11 803 11 660 11 251 11 364 11 330
Q3 18 Q4 18 Q1 19 Q2 19 Q3 19
2 723 2 731 2 769 2 743 2 850
47% 44% 48%
49% 47%
Q3 18 Q4 18 Q1 19 Q2 19 Q3 19
-1%
Organic growth Organic growth assuming fixed currency, adjusted for acquisitions and disposals. EBITDA before other items. Capex excl. licence fees
40.8 40.8 40.2 39.6 40.0
Q3 18 Q4 18 Q1 19 Q2 19 Q3 19
-2%
1 502 1 501 1 506 1 574 1 552
256 459 356
538
255
Q3 18 Q4 18 Q1 19 Q2 19 Q3 19
EBITDA CAPEX
-2%
-4%
Mobile subscribers (‘000) Subs and traffic revenues (NOK m) and EBITDA margin
Mobile ARPU (MYR/month) EBITDA and capex (NOK m)

Bangladesh (Grameenphone)
Q3 2019 27
71 413 72 732 74 053 75 330 75 717
Q3 18 Q4 18 Q1 19 Q2 19 Q3 19
3 135 3 250 3 348 3 466 3 584
62% 62% 61% 61%
Q3 18 Q4 18 Q1 19 Q2 19 Q3 19
7%
Organic growth assuming fixed currency, adjusted for acquisitions and disposals. EBITDA before other items. Capex excl. licence fees
161 157 156 159 156
Q3 18 Q4 18 Q1 19 Q2 19 Q3 19
-3%
2 078 2 163 2 162 1 992
2 347
454 395 425 384 221
Q3 18 Q4 18 Q1 19 Q2 19 Q3 19
EBITDA CAPEX
5%
6%
Mobile subscribers (‘000) Subs and traffic revenues (NOK m) and EBITDA margin
Mobile ARPU (BDT/month) EBITDA and capex (NOK m)
Organic growth *62% EBITDA margin excluding provisions
54%*

Pakistan
Q3 2019 28
42 940 43 530 44 258 43 851 44 391
Q3 18 Q4 18 Q1 19 Q2 19 Q3 19
1 637 1 474 1 476
1 317 1 158
78%
51% 49% 44% 43%
Q3 18 Q4 18 Q1 19 Q2 19 Q3 19
-15%
Organic growth assuming fixed currency, adjusted for acquisitions and disposals. EBITDA before other items. Capex excl. licence fees
217 209 206 195 184
Q3 18 Q4 18 Q1 19 Q2 19 Q3 19
-15%
1 566
900 860 695 606
267 391 386 395
221
Q3 18 Q4 18 Q1 19 Q2 19 Q3 19
EBITDA CAPEX
-53%
3%
Mobile subscribers (‘000) Subs and traffic revenues (NOK m) and EBITDA margin
Mobile ARPU (PKR/month) EBITDA and capex (NOK m)
Organic growth *Reversal of accrual in Q3 2018 impacting EBITDA by NOK 507m
*

Myanmar
Q3 2019 29
18 036 17 232 18 395 19 806 21 571
Q3 18 Q4 18 Q1 19 Q2 19 Q3 19
1 135 1 049 1 127 1 244 1 211
34% 26%
33% 40% 40%
Q3 18 Q4 18 Q1 19 Q2 19 Q3 19
2%
Organic growth Organic growth assuming fixed currency, adjusted for acquisitions and disposals. EBITDA before other items. Capex excl. licence fees
4,307 4,452 4,422 4,379 3,839
Q3 18 Q4 18 Q1 19 Q2 19 Q3 19
-11%
455 330
437
582 560
200 204 204 120 117
Q3 18 Q4 18 Q1 19 Q2 19 Q3 19
EBITDA CAPEX
16%
20%
Mobile subscribers (‘000) Subs and traffic revenues (NOK m) and EBITDA margin
Mobile ARPU (MMK/month) EBITDA and capex (NOK m)

Broadcast
Q2 2019 30
806 793 777 766 737
Q3 18 Q4 18 Q1 19 Q2 19 Q3 19
1 131 1 082 1 066 1 057 1 049
37% 28%
32% 34% 38%
Q3 18 Q4 18 Q1 19 Q2 19 Q3 19
-7%
Growth Organic growth assuming fixed currency, adjusted for acquisitions and disposals. EBITDA before other items. Capex excl. licence fees
409 401 403 401 407
Q3 18 Q4 18 Q1 19 Q2 19 Q3 19
-1% 563
406 467 486 539
97 139 81 96 73
Q3 18 Q4 18 Q1 19 Q2 19 Q3 19
EBITDA CAPEX
-4%
-9%
DTH subscribers (‘000) Subs and traffic revenues (NOK m) and EBITDA margin
DTH ARPU (NOK/month) EBITDA and capex (NOK m)
Adjusted for reversals in Q3 2018

Organic EBITDA growth
Q3 2019 31
4%
-4% -5% -5% -2%
5%
-53%
16%
-4%
Organic EBITDA growth (Q3 19 vs Q3 18) EBITDA margin (Q3 19)
46%
34% 24%
33%
47%
61%
43% 40% 38%
Norway Sweden Denmark Thailand Malaysia Bangladesh Pakistan Myanmar Broadcast
Scandinavia Developed Asia Emerging Asia Broadcast

Q3 growth in subscription and traffic revenues and EBITDA
Q3 2019 32
Subscription & traffic revenues EBITDA
Reported Organic Reported Organic
Norway 1.4 % 1.4 % 3.9 % 3.9 %
Sweden -2.0 % -2.5 % -3.6 % -3.9 %
Denmark -5.4 % -7.9 % -2.3 % -4.8 %
Thailand 15.8 % 0.2 % 10.1 % -4.6 %
Malaysia 4.7 % -1.0 % 3.3 % -2.3 %
Bangladesh 14.3 % 6.7 % 12.9 % 5.5 %
Pakistan -29.3 % -15.0 % -61.3 % -52.9 %
Myanmar 6.7 % 1.8 % 23.0 % 16.0 %
Broadcast* -7.3 % -7.9 % -4.2 % -4.4 %
Telenor Group 6.6 % -0.6 % -2.6 % -7.3 %
*Revenues from Canal Digital DTH

Net income of NOK -0.4 billion for Q3 2019, EPS of NOK -0.30
Q3 2019 33
NOK m 2018 Q3 2018 Q3 2019 Q3 2019
(Post IFRS16)
Revenues 110,362 27,566 29,530 29,462
EBITDA before other items 45,451 12,410 12,092 13,448
Other items (3,204) (261) (185) (172)
EBITDA 42,247 12,149 11,907 13,276
Depreciation & amortization (20,160) (5,429) (5,049) (6,271)
Operating profit 22,088 6,720 6,858 7,005
Associated companies (82) 8 (105) (105)
Net financials (3,158) (359) (2,293) (2,692)
Taxes (6,179) (2,011) (4,108) (4,027)
Profit (loss) from discontinued operations
4,773 2.262 9 9
Minorities 2,711 739 797 851
Net income - Telenor equity holders 14,731 5,881 (436) (661)
Earnings per share (NOK) 10.00 4.01 (0.30) (0.46)
Impact of IFRS 16
All figures according to accounting standard as of 31 Dec 2018 unless otherwise stated
-68
+1,356
+147
+81
+54
-225
-0.16
+1,369
-1,222
-399
+13

Debt maturity profile (NOK bn)
Q3 2019 34
7.4 2.5 4.9
10.1 6.4
2.7
4.5
0.7 1.5
3.4
1.2
1.8
5.7 4.9
34.5
2019 2020 2021 2022 2023 2024 2025 2026->
New debt Telenor ASA Subsidiaries Telenor ASA
NOK bn Q3 2019 Q3 2018
Digi 5.2 4.3
dtac 13.6 5.4
Grameenphone 0.2 1.9
Net debt in partly-owned subsidiaries:
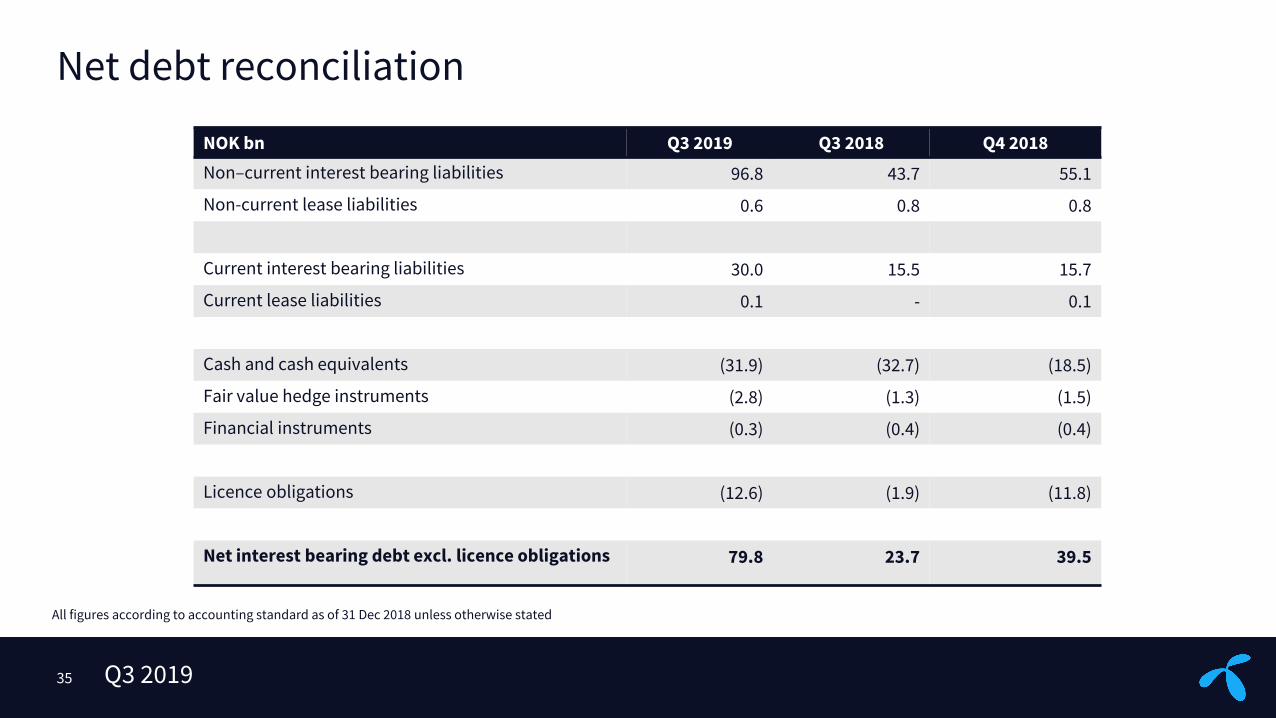
Net debt reconciliation
Q3 2019 35
NOK bn Q3 2019 Q3 2018 Q4 2018
Non–current interest bearing liabilities 96.8 43.7 55.1
Non-current lease liabilities 0.6 0.8 0.8
Current interest bearing liabilities 30.0 15.5 15.7
Current lease liabilities 0.1 - 0.1
Cash and cash equivalents (31.9) (32.7) (18.5)
Fair value hedge instruments (2.8) (1.3) (1.5)
Financial instruments (0.3) (0.4) (0.4)
Licence obligations (12.6) (1.9) (11.8)
Net interest bearing debt excl. licence obligations 79.8 23.7 39.5
All figures according to accounting standard as of 31 Dec 2018 unless otherwise stated

Balance sheet and key ratios
Q3 2019 36
30 Sep 2019 30 Sep 2018
Total assets 268.6 186.6
Equity attributable to Telenor ASA shareholders
36.6 48.5
Gross debt* 114.1 59.2
Net debt 79.8 23.7
Net debt/EBITDA** 1.8 0.5
Return on capital employed*** 16% 19%
*) Gross debt = current interest bearing liabilities + non-current interest bearing liabilities **) 12 months rolling EBITDA for the third quarter of 2019 includes proforma figures for DNA ***) Calculated based on an after tax basis of the last twelve months return on average capital employed

Return on capital employed
Q3 2019 37
10%
12% 12%
8% 8%
13%
16% 16%
2012 2013 2014 2015 2016 2017 2018 Q3 18 - Q3 19
Return on capital employed (Pre IFRS 16)*
*) ROCE is calculated excluding DNA