telecom italia group · telecom italia ngn network roll-out tim lte coverage telecom italia...
TRANSCRIPT
MARCO PATUANO
TELECOM ITALIA GROUP
1H 2013 ResultsMilan, August 2nd, 2013
Telecom Italia Group 1H 2013 Results
1MARCO PATUANO
TELECOM ITALIA GROUP1H 2013 Results
Safe HarbourThese presentations contain statements that constitute forward-looking statements within the meaning of the Private Securities Litigation Reform Act of 1995. These statements appear in a number of places in this presentation and include statements regarding the intent, belief or current expectations of the customer base, estimates regarding future growth in the differentbusiness lines and the global business, market share, financial results and other aspects of the activities and situation relating to the Company and the Group. Such forward looking statements are not guarantees of future performance and involve risks and uncertainties, and actual resultsmay differ materially from those projected or implied in the forward looking statements as a result of various factors. Consequently, Telecom Italia S.p.A. makes no representation, whether expressed or implied, as to the conformity of the actual results with those projected in the forward looking statements.Forward-looking information is based on certain key assumptions which we believe to be reasonable as of the date hereof, but forward looking information by its nature involves risks and uncertainties, which are outside our control, and could significantly affect expected results.Analysts are cautioned not to place undue reliance on those forward looking statements, which speak only as of the date of this presentation. Telecom Italia S.p.A. undertakes no obligation to release publicly the results of any revisions to these forward looking statements which may be made to reflect events and circumstances after the date of this presentation, including, without limitation, changes in Telecom Italia S.p.A. business or acquisition strategy or planned capital expenditures or to reflect the occurrence of unanticipated events. Analysts and investors are encouraged to consult the Company's Annual Report on Form 20-F as well as periodic filings made on Form 6-K, which are on file with the United States Securities and Exchange Commission.The accounting policies and consolidation principles adopted in the preparation of the Half-year Condensed Consolidated Financial Statement at 30 June 2013 have been applied on a basis consistent with those adopted in the Annual Consolidated Financial Statements at 31 December 2012, to which reference can be made, except for the new standards and interpretations adopted by the Group, which, other than for the prospective adoption of IFRS 13 ( Fair Value measurement), didn’t impact on the Half-year Condensed Consolidated Financial Statements at 30 June 2013.Some data for the first quarter 2012, used in comparisons, included into this presentation have been restated as a result of theearly adoption, starting from the first half 2012, of the revised version of IAS 19 (Employee Benefits) and the reclassification of Matrix (company that was disposed of on October 31, 2012) from the Business Unit Domestic–Core Domestic to the Business Unit Other Activities.
2MARCO PATUANO
TELECOM ITALIA GROUP1H 2013 Results
Agenda
Domestic 2Q13 Progress Report
Mobile Fixed
Appendix
3MARCO PATUANO
TELECOM ITALIA GROUP1H 2013 Results
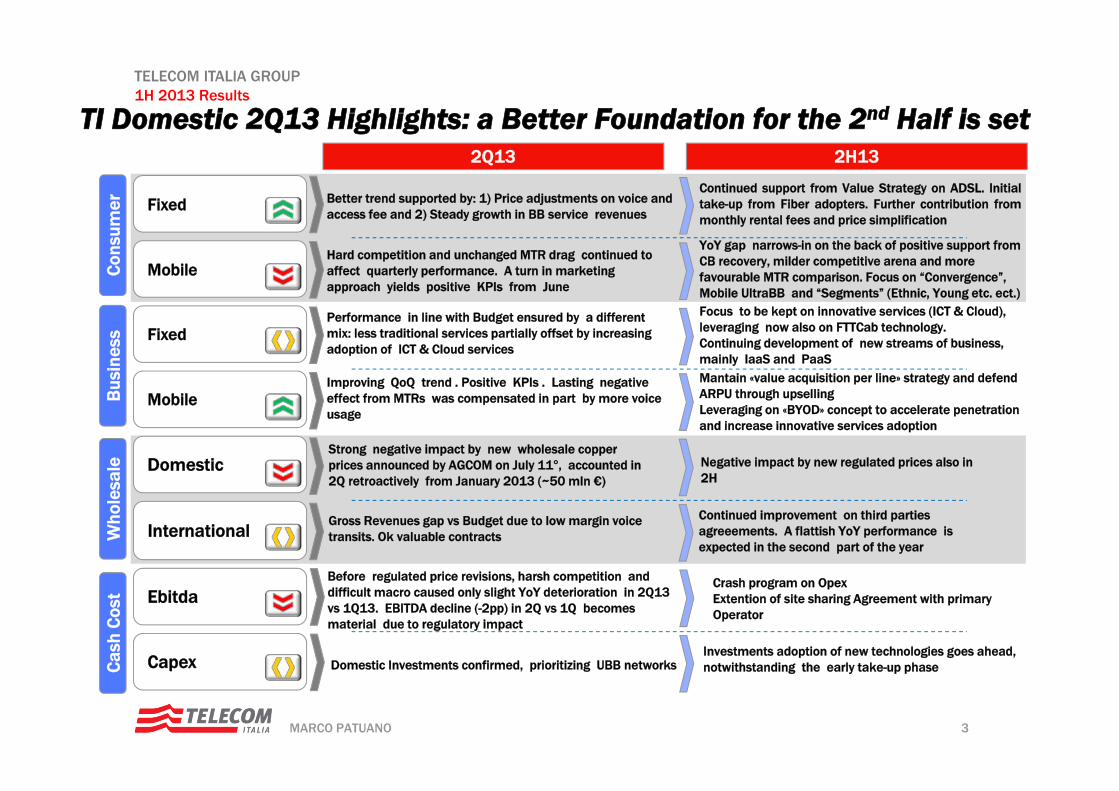
TI Domestic 2Q13 Highlights: a Better Foundation for the 2nd Half is set
Fixed
MobileCon
sum
erB
usin
ess
Who
lesa
leC
ash
Cos
t
Fixed
Mobile
Domestic
International
Better trend supported by: 1) Price adjustments on voice and access fee and 2) Steady growth in BB service revenues
Hard competition and unchanged MTR drag continued to affect quarterly performance. A turn in marketing approach yields positive KPIs from June
Performance in line with Budget ensured by a different mix: less traditional services partially offset by increasing adoption of ICT & Cloud services
Improving QoQ trend . Positive KPIs . Lasting negative effect from MTRs was compensated in part by more voice usage
Strong negative impact by new wholesale copperprices announced by AGCOM on July 11°, accounted in 2Q retroactively from January 2013 (~50 mln €)
Capex
Ebitda
2Q13 2H13
Continued support from Value Strategy on ADSL. Initialtake-up from Fiber adopters. Further contribution frommonthly rental fees and price simplification
YoY gap narrows-in on the back of positive support from CB recovery, milder competitive arena and more favourable MTR comparison. Focus on “Convergence”, Mobile UltraBB and “Segments” (Ethnic, Young etc. ect.)Focus to be kept on innovative services (ICT & Cloud), leveraging now also on FTTCab technology.Continuing development of new streams of business, mainly IaaS and PaaS
Negative impact by new regulated prices also in 2H
Before regulated price revisions, harsh competition and difficult macro caused only slight YoY deterioration in 2Q13 vs 1Q13. EBITDA decline (-2pp) in 2Q vs 1Q becomes material due to regulatory impact
Domestic Investments confirmed, prioritizing UBB networks
Crash program on OpexExtention of site sharing Agreement with primaryOperator
Gross Revenues gap vs Budget due to low margin voice transits. Ok valuable contracts
Continued improvement on third parties agreeements. A flattish YoY performance isexpected in the second part of the year
Mantain «value acquisition per line» strategy and defendARPU through upsellingLeveraging on «BYOD» concept to accelerate penetrationand increase innovative services adoption
Investments adoption of new technologies goes ahead, notwithstanding the early take-up phase
4MARCO PATUANO
TELECOM ITALIA GROUP1H 2013 Results
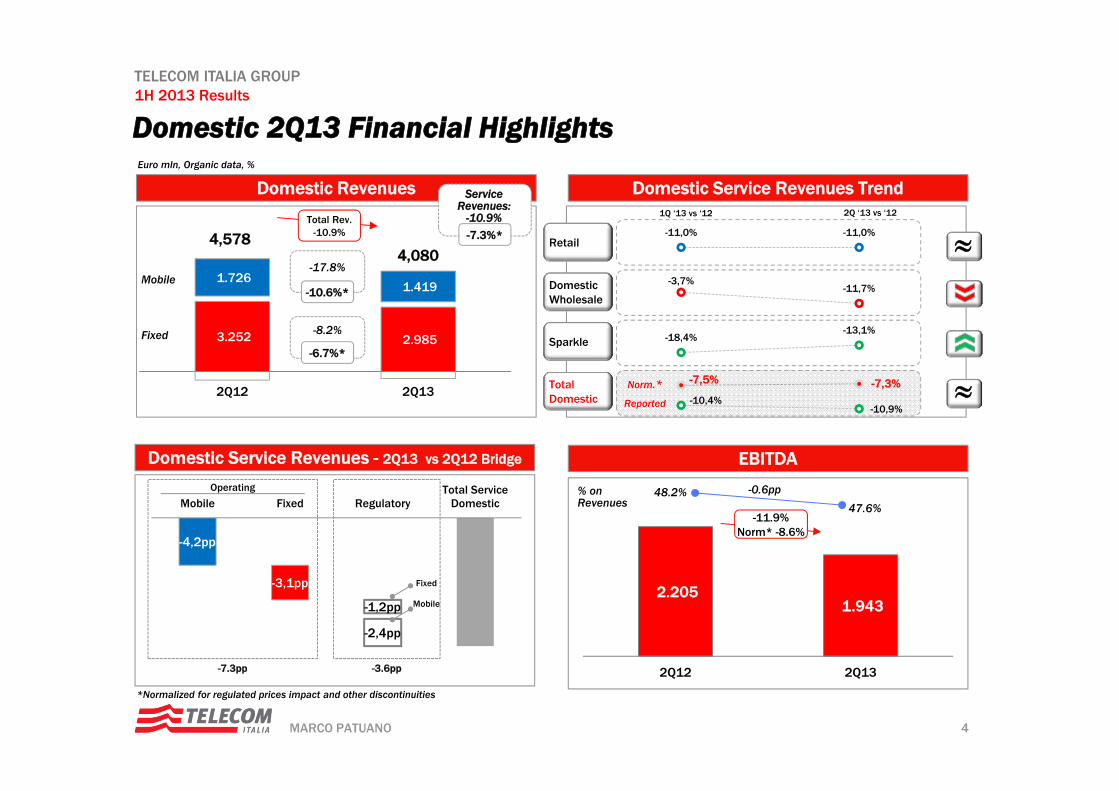
Domestic Revenues
3.252 2.985
1.726 1.419
2Q12 2Q13
-4,2pp
-3,1pp
-1,2pp
-2,4pp
Mobile Fixed RegulatoryTotal Service
Domestic
Domestic 2Q13 Financial HighlightsEuro mln, Organic data, %
Domestic Service Revenues - 2Q13 vs 2Q12 Bridge EBITDA
Domestic Service Revenues Trend
Total Rev.-10.9%
Fixed
4,578
Mobile
4,080
Domestic Wholesale
Retail
Sparkle
Total Domestic
1Q ‘13 vs ‘12 2Q ‘13 vs ‘12
2.205 1.943
2Q12 2Q13
-11.9%Norm* -8.6%
% on Revenues
48.2%47.6%
-0.6pp
*Normalized for regulated prices impact and other discontinuities
-8.2%
-17.8%
-11,0% -11,0%
-3,7%-11,7%
-18,4%-13,1%
-10,4%-10,9%
-7,5% -7,3%Norm.*
Reported
Operating
-7.3pp -3.6pp
Mobile
Fixed
Service Revenues:
-10.9%-7.3%*
-10.6%*
-6.7%*
5MARCO PATUANO
TELECOM ITALIA GROUP1H 2013 Results
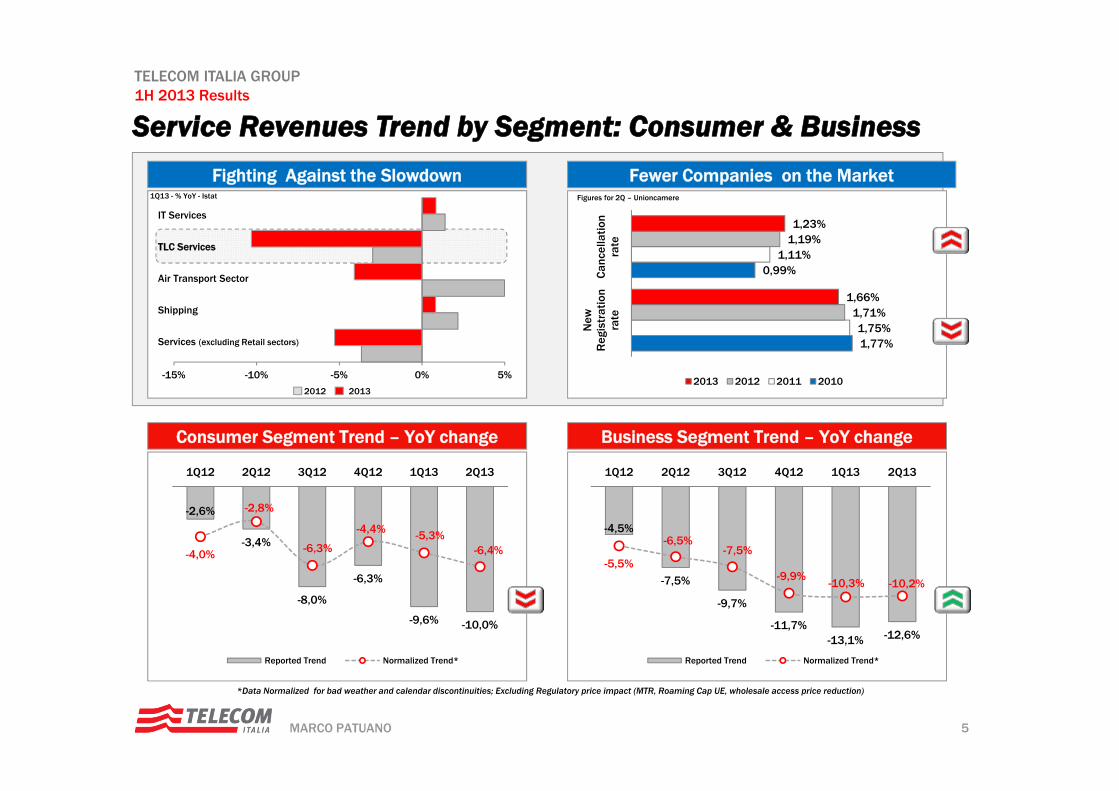
-15% -10% -5% 0% 5%
-4,5%
-7,5%
-9,7%
-11,7%-13,1% -12,6%
-5,5%
-6,5%-7,5%
-9,9%-10,3% -10,2%
1Q12 2Q12 3Q12 4Q12 1Q13 2Q13
Reported Trend Normalized Trend*
Service Revenues Trend by Segment: Consumer & Business
*Data Normalized for bad weather and calendar discontinuities; Excluding Regulatory price impact (MTR, Roaming Cap UE, wholesale access price reduction)
Consumer Segment Trend – YoY change Business Segment Trend – YoY change
-2,6%
-3,4%
-8,0%
-6,3%
-9,6% -10,0%
-4,0%
-2,8%
-6,3%
-4,4% -5,3%-6,4%
1Q12 2Q12 3Q12 4Q12 1Q13 2Q13
Reported Trend Normalized Trend*
Fighting Against the Slowdown
Services (excluding Retail sectors)
IT Services
TLC Services
Air Transport Sector
Shipping
1Q13 - % YoY - Istat
Fewer Companies on the Market
2012 2013
Figures for 2Q – Unioncamere
1,77%
0,99%
1,75%
1,11%
1,71%
1,19%
1,66%
1,23%
New
Reg
istr
atio
nra
teC
ance
llatio
nra
te
2013 2012 2011 2010
6MARCO PATUANO
TELECOM ITALIA GROUP1H 2013 Results
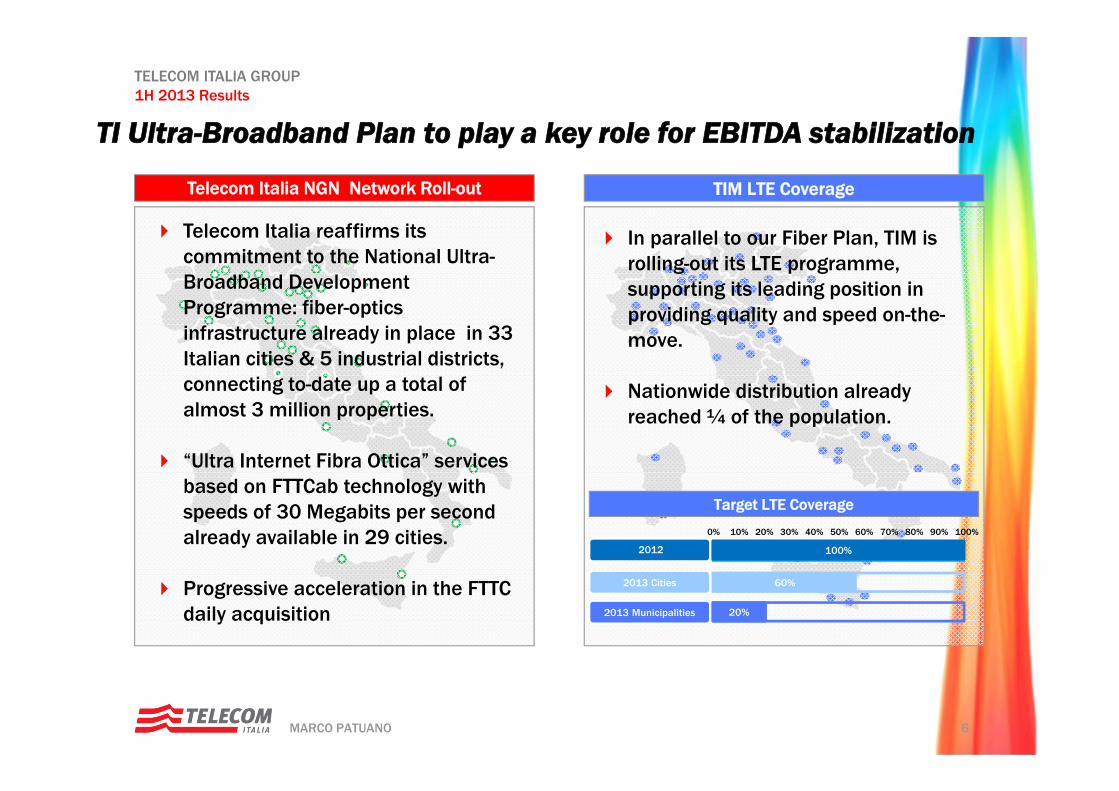
Telecom Italia NGN Network Roll-out TIM LTE Coverage
Telecom Italia reaffirms its commitment to the National Ultra-Broadband Development Programme: fiber-optics infrastructure already in place in 33 Italian cities & 5 industrial districts, connecting to-date up a total of almost 3 million properties.
“Ultra Internet Fibra Ottica” services based on FTTCab technology with speeds of 30 Megabits per second already available in 29 cities.
Progressive acceleration in the FTTC daily acquisition
6
In parallel to our Fiber Plan, TIM is rolling-out its LTE programme, supporting its leading position in providing quality and speed on-the-move.
Nationwide distribution already reached ¼ of the population.
2013 Cities
2013 Municipalities
2012
10% 20% 50% 100%30% 60% 70% 80% 90%40%0%
60%
20%
100%
Target LTE Coverage
TI Ultra-Broadband Plan to play a key role for EBITDA stabilization
7MARCO PATUANO
TELECOM ITALIA GROUP1H 2013 Results
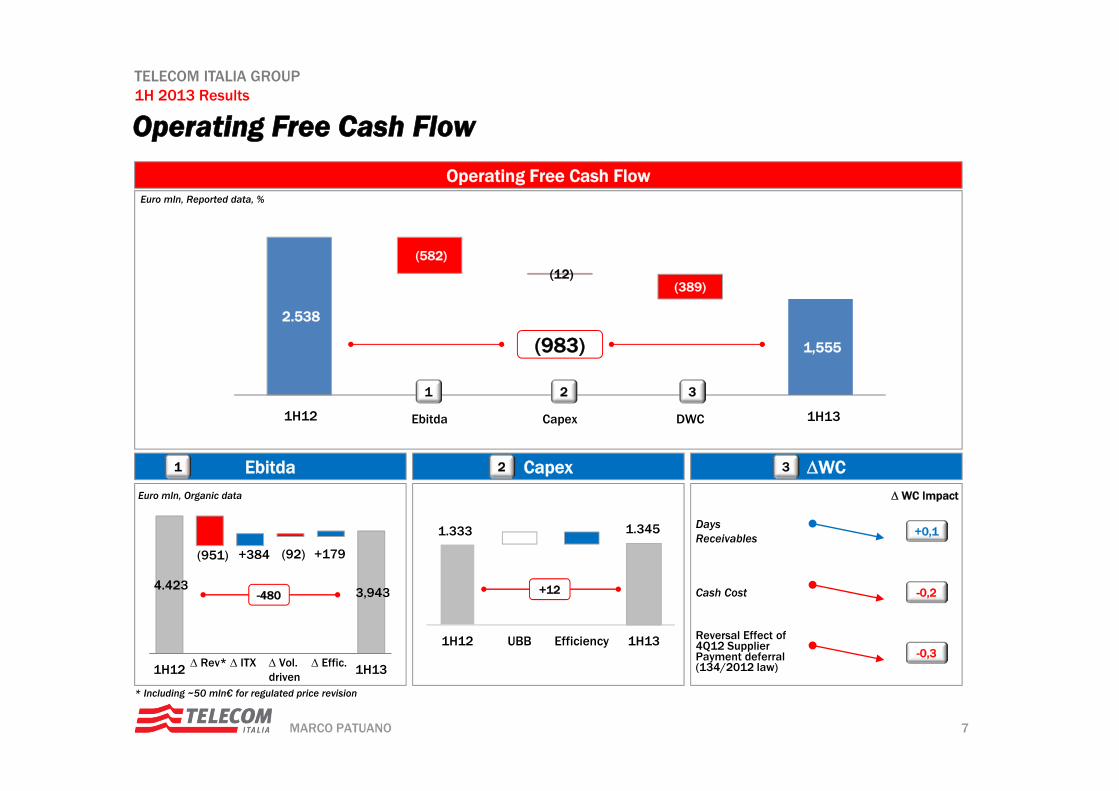
Operating Free Cash FlowOperating Free Cash Flow
Euro mln, Reported data, %
Ebitda Capex WC31 2
2.538
1.544 1,555
(582) (12)
(389)
1H11 Ebitda Capex DWC 1H12
1 32
(983)
1H12 1H13
+0,1DaysReceivables
Cash Cost
WC Impact
-0,2
-0,3
Reversal Effect of 4Q12 Supplier Payment deferral(134/2012 law)
1.333 1.345
1H12 UBB Efficiency 1H13
+124.423 3,943
(951) +384 (92) +179
1H12 1H13 Rev* ITX Vol. driven
Effic.
-480
Euro mln, Organic data
* Including ~50 mln€ for regulated price revision
8MARCO PATUANO
TELECOM ITALIA GROUP1H 2013 Results
Agenda
Domestic 2Q13 Progress Report
Mobile Fixed
Appendix
9MARCO PATUANO
TELECOM ITALIA GROUP1H 2013 Results
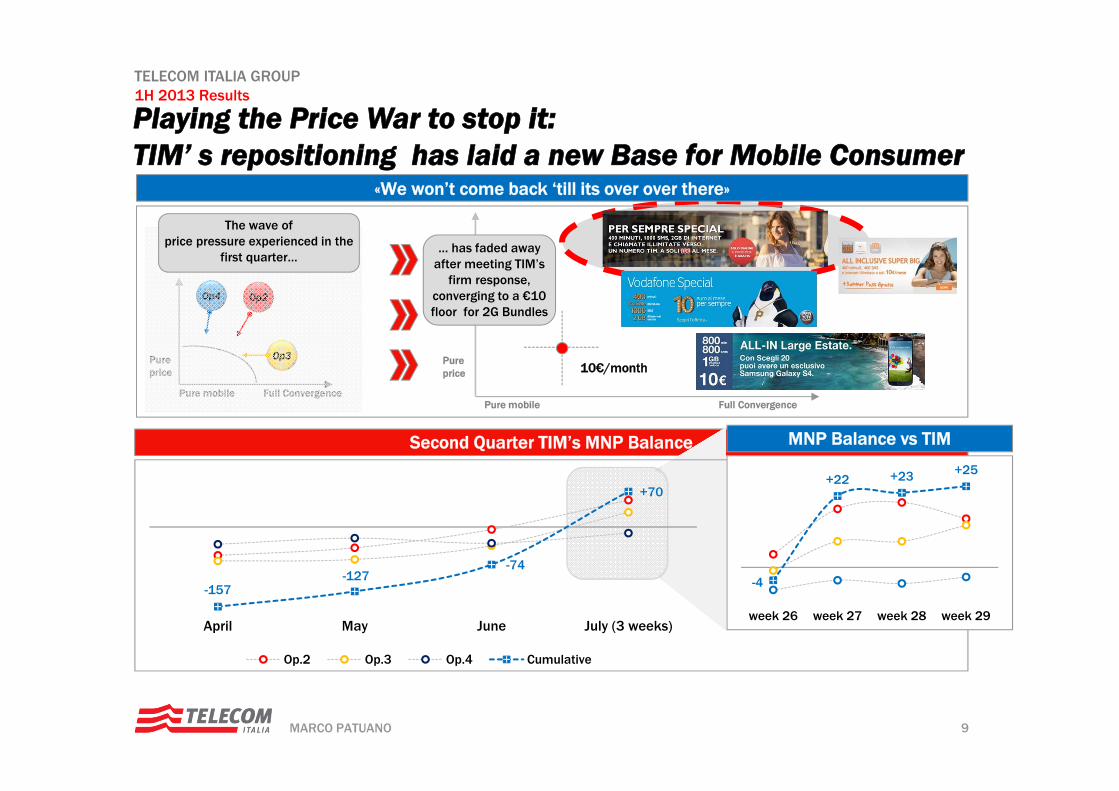
Playing the Price War to stop it: TIM’ s repositioning has laid a new Base for Mobile Consumer
«We won’t come back ‘till its over over there»
Pureprice
Pure mobile Full Convergence
Op4 Op2
Op3 Pureprice
Pure mobile
… has faded away after meeting TIM’s
firm response, converging to a €10 floor for 2G Bundles
10€/month
Full Convergence
The wave ofprice pressure experienced in the
first quarter…
Second Quarter TIM’s MNP Balance
-157-127
-74
+70
April May June July (3 weeks)
Op.2 Op.3 Op.4 Cumulative
MNP Balance vs TIM
-4
+22 +23 +25
week 26 week 27 week 28 week 29
10MARCO PATUANO
TELECOM ITALIA GROUP1H 2013 Results
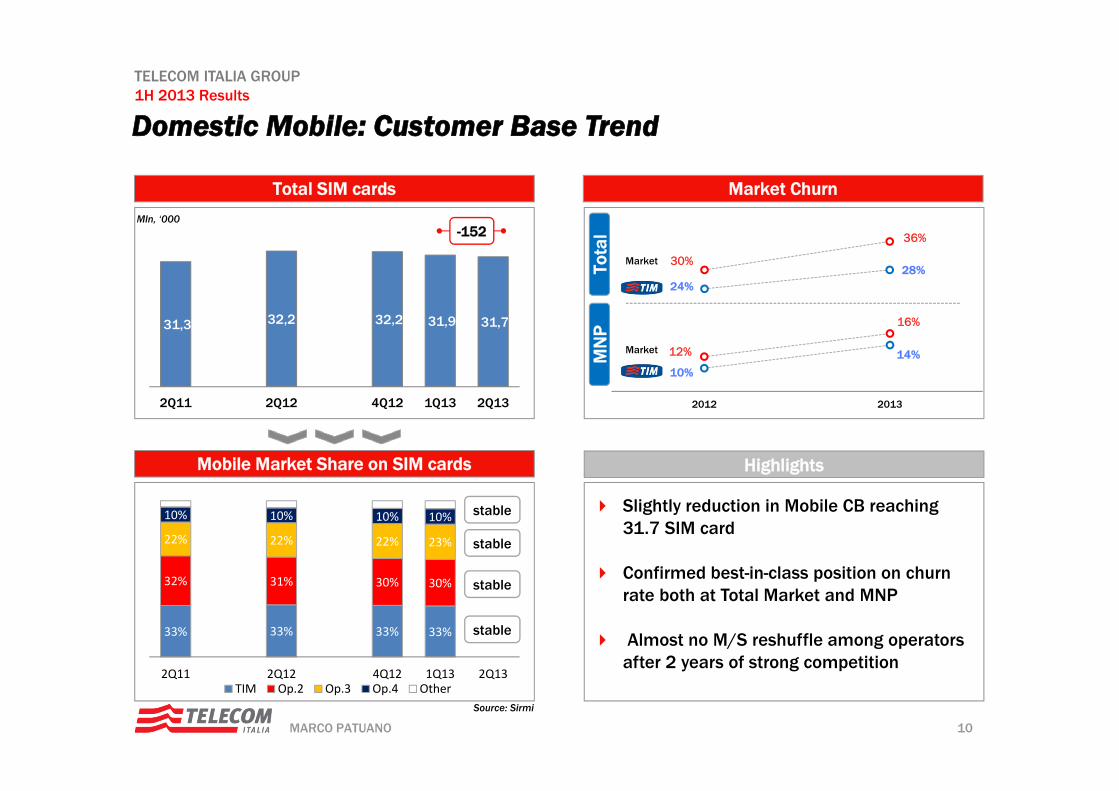
Mln, ‘000
Total SIM cards Market Churn
Domestic Mobile: Customer Base Trend
-152
24%28%
30%
36%
10%
14%12%
16%
2012 2013
MN
PTo
tal
Market
Market
Mobile Market Share on SIM cards Highlights
33% 33% 33% 33%
32% 31% 30% 30%
22% 22% 22% 23%
10% 10% 10% 10%
2Q11 2Q12 4Q12 1Q13 2Q13TIM Op.2 Op.3 Op.4 Other
31,3 32,2 32,2 31,9 31,7
2Q11 2Q12 4Q12 1Q13 2Q13
Source: Sirmi
stable
stable
stable
stable Slightly reduction in Mobile CB reaching31.7 SIM card
Confirmed best-in-class position on churnrate both at Total Market and MNP
Almost no M/S reshuffle among operatorsafter 2 years of strong competition
11MARCO PATUANO
TELECOM ITALIA GROUP1H 2013 Results
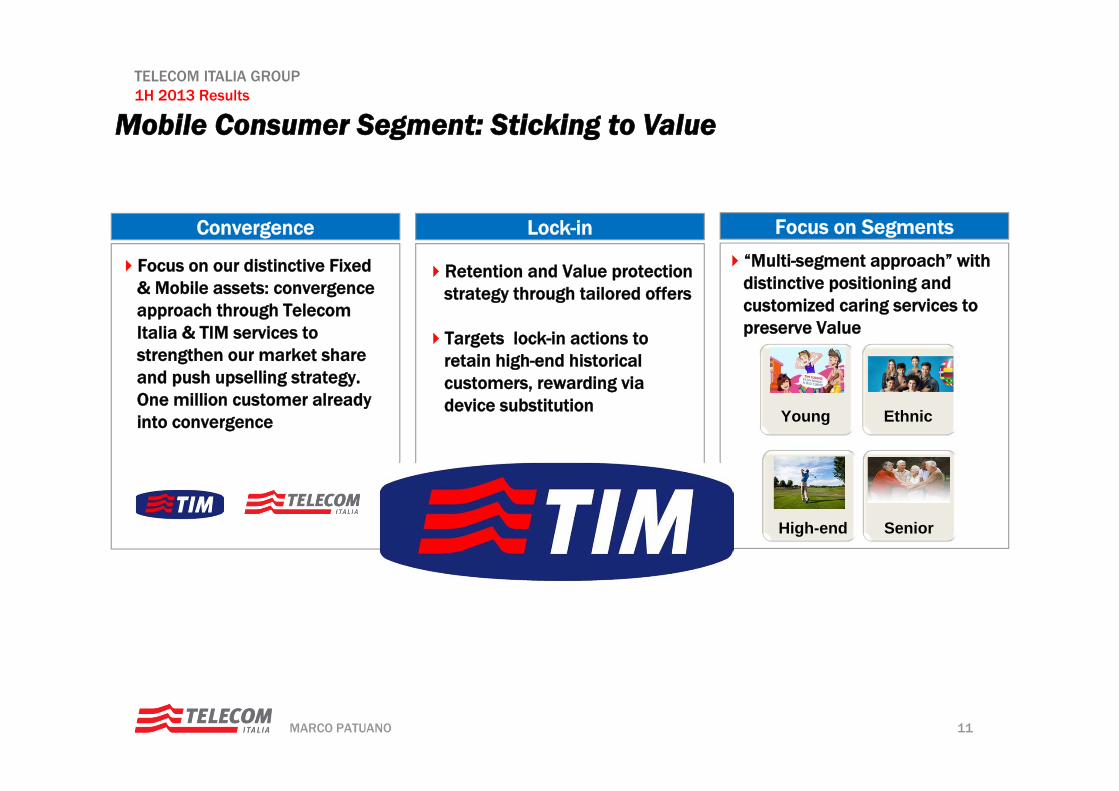
Focus on our distinctive Fixed & Mobile assets: convergence approach through Telecom Italia & TIM services to strengthen our market share and push upselling strategy. One million customer already into convergence
Convergence Lock-in Focus on Segments
Retention and Value protection strategy through tailored offers
Targets lock-in actions to retain high-end historical customers, rewarding via device substitution
“Multi-segment approach” with distinctive positioning and customized caring services to preserve Value
EthnicYoung
SeniorHigh-end
Mobile Consumer Segment: Sticking to Value
12MARCO PATUANO
TELECOM ITALIA GROUP1H 2013 Results
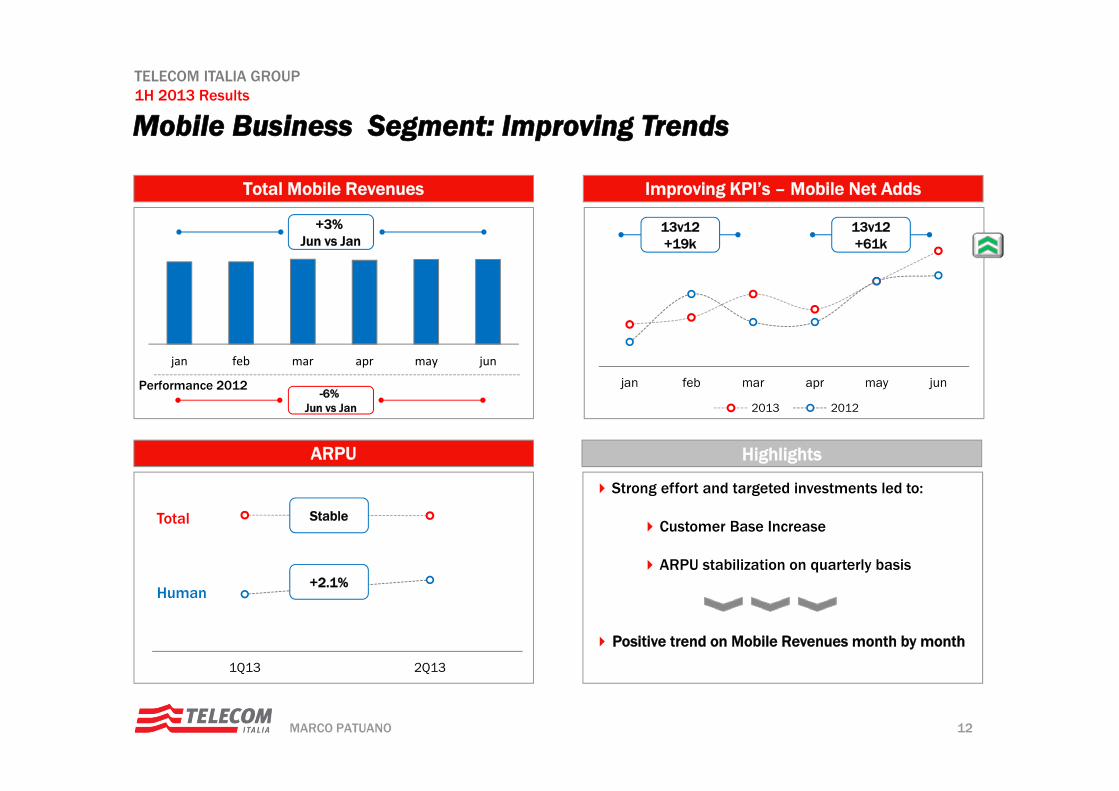
Mobile Business Segment: Improving Trends
jan feb mar apr may jun
+3% Jun vs Jan
Total Mobile Revenues Improving KPI’s – Mobile Net Adds
ARPU Highlights
jan feb mar apr may jun
2013 2012
13v12+19k
13v12+61k
1Q13 2Q13
Stable
+2.1%
Total
Human
Strong effort and targeted investments led to:
Customer Base Increase
ARPU stabilization on quarterly basis
Positive trend on Mobile Revenues month by month
-6% Jun vs Jan
Performance 2012
13MARCO PATUANO
TELECOM ITALIA GROUP1H 2013 Results
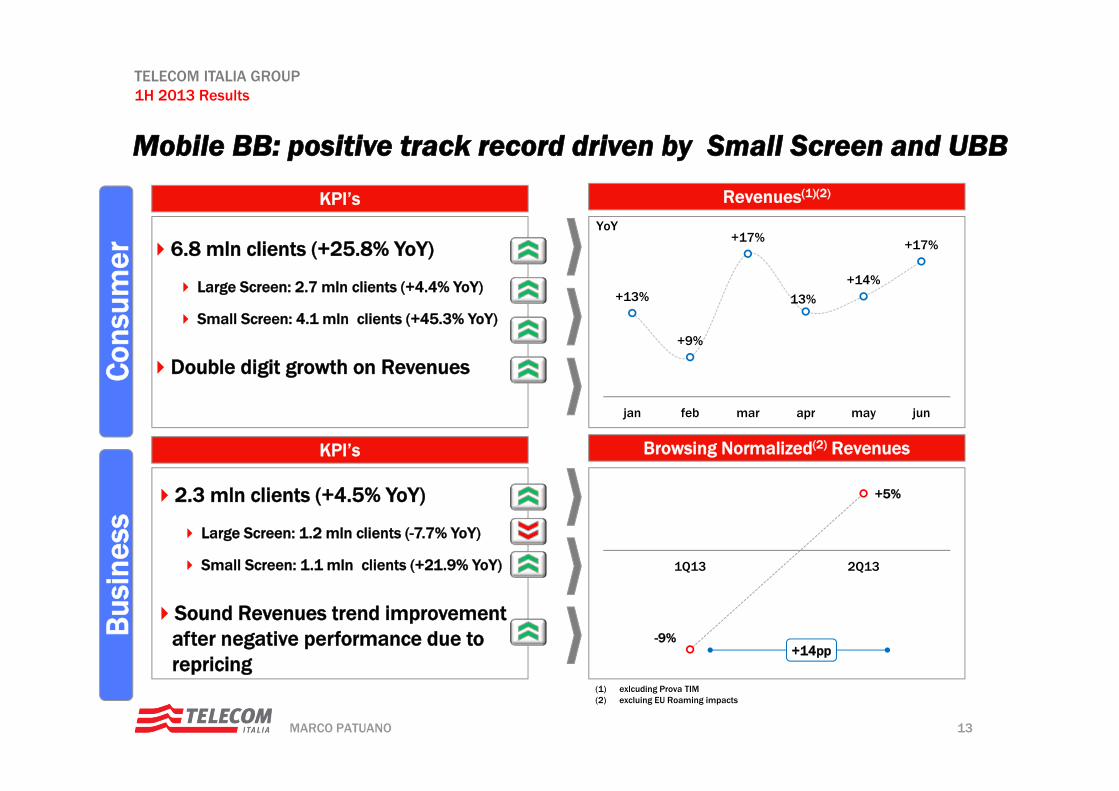
Mobile BB: positive track record driven by Small Screen and UBBC
onsu
mer
Bus
ines
s
KPI’s
KPI’s
Revenues(1)(2)
Browsing Normalized(2) Revenues
6.8 mln clients (+25.8% YoY)
Large Screen: 2.7 mln clients (+4.4% YoY)
Small Screen: 4.1 mln clients (+45.3% YoY)
Double digit growth on Revenues
2.3 mln clients (+4.5% YoY)
Large Screen: 1.2 mln clients (-7.7% YoY)
Small Screen: 1.1 mln clients (+21.9% YoY)
Sound Revenues trend improvement after negative performance due to repricing
+13%
+9%
+17%
13%
+14%
+17%
jan feb mar apr may jun
(1) exlcuding Prova TIM(2) excluing EU Roaming impacts
YoY
+14pp-9%
+5%
1Q13 2Q13
14MARCO PATUANO
TELECOM ITALIA GROUP1H 2013 Results
Euro mln, Organic Data
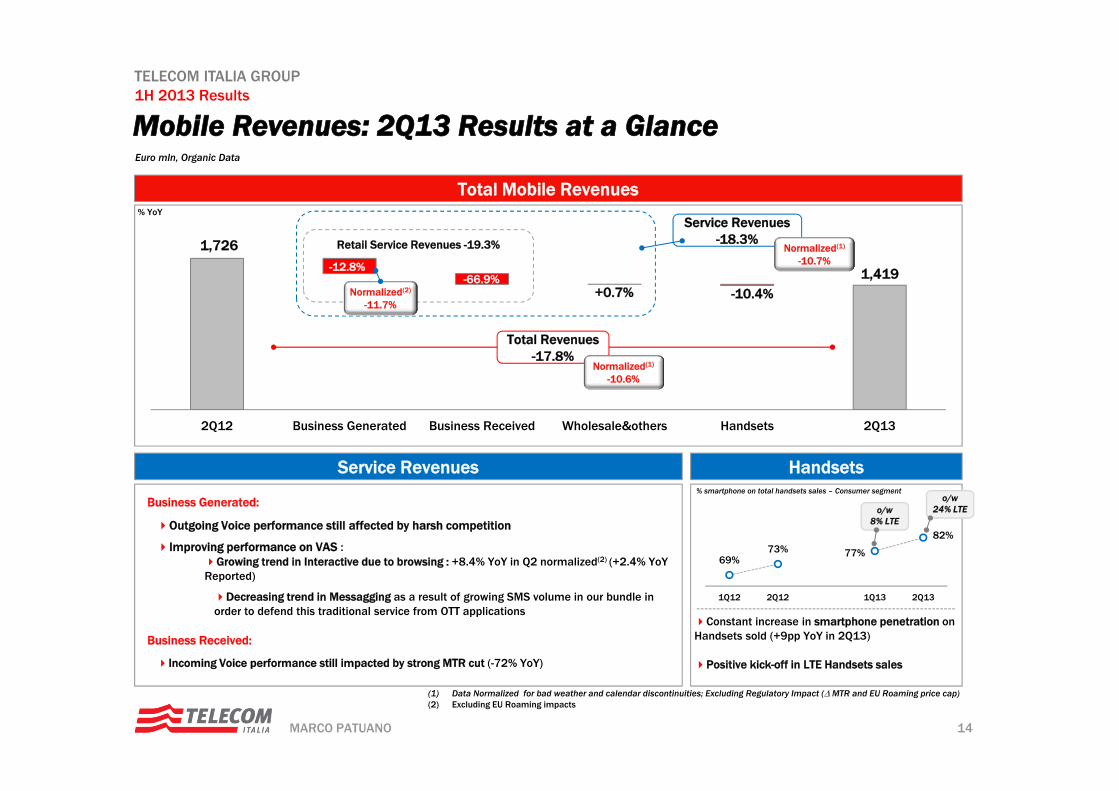
Mobile Revenues: 2Q13 Results at a Glance
Total Mobile Revenues% YoY
(1) Data Normalized for bad weather and calendar discontinuities; Excluding Regulatory Impact ( MTR and EU Roaming price cap)(2) Excluding EU Roaming impacts
2Q12 Business Generated Business Received Wholesale&others Handsets 2Q13
-12.8%-66.9%
+0.7% -10.4%
1,726
1,419
Retail Service Revenues -19.3%
Total Revenues-17.8%
Service Revenues-18.3%
Service Revenues Handsets
Normalized(1)
-10.7%
Normalized(1)
-10.6%
Normalized(2)
-11.7%
Business Generated:
Outgoing Voice performance still affected by harsh competition
Improving performance on VAS :Growing trend in Interactive due to browsing : +8.4% YoY in Q2 normalized(2) (+2.4% YoYReported)
Decreasing trend in Messagging as a result of growing SMS volume in our bundle in order to defend this traditional service from OTT applications
Business Received:
Incoming Voice performance still impacted by strong MTR cut (-72% YoY)
69%73% 77%
82%
1Q12 2Q12 1Q13 2Q13
% smartphone on total handsets sales – Consumer segmento/w
24% LTEo/w 8% LTE
Constant increase in smartphone penetration on Handsets sold (+9pp YoY in 2Q13)
Positive kick-off in LTE Handsets sales
15MARCO PATUANO
TELECOM ITALIA GROUP1H 2013 Results
Agenda
Domestic 2Q13 Progress Report
MobileFixed
Appendix
16MARCO PATUANO
TELECOM ITALIA GROUP1H 2013 Results
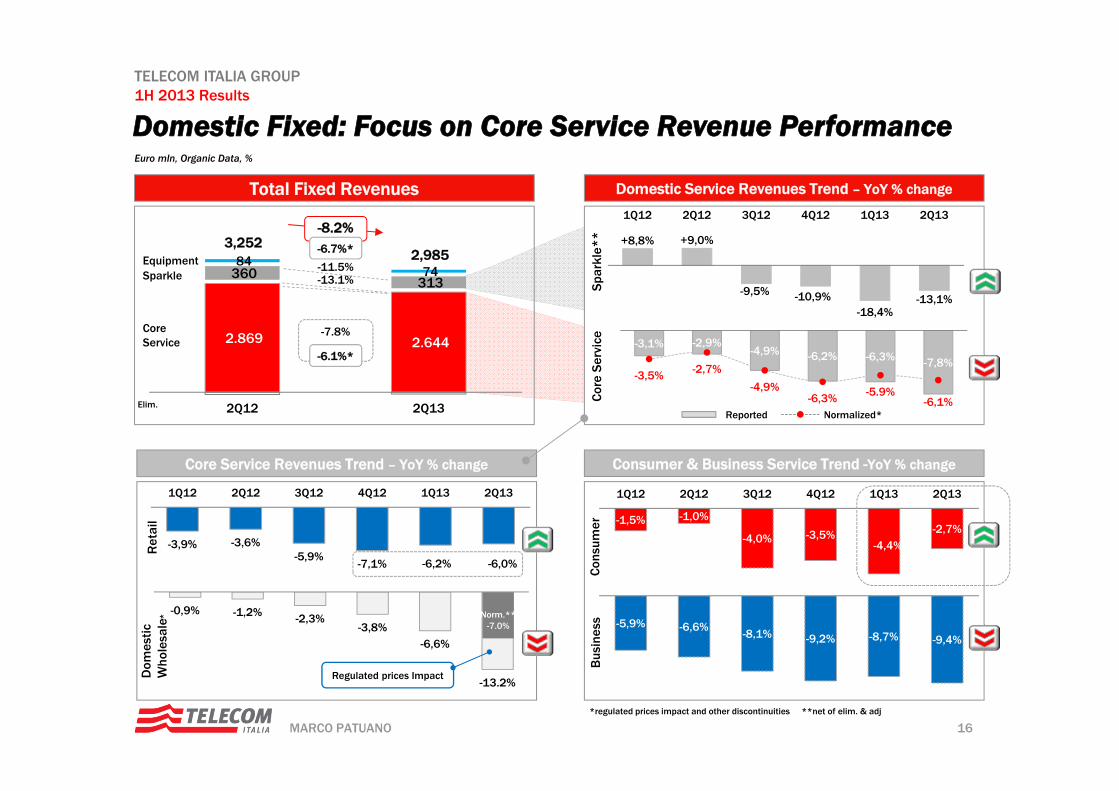
2.869 2.644
360 313
84 74
2Q12 2Q13
Euro mln, Organic Data, %
Domestic Fixed: Focus on Core Service Revenue Performance
Total Fixed Revenues Domestic Service Revenues Trend – YoY % change
Spa
rkle
**
Cor
e Se
rvic
e
**net of elim. & adj
Consumer & Business Service Trend -YoY % change
Elim.
Core Service Revenues Trend – YoY % change
Ret
ail
Dom
estic
W
hole
sale
Con
sum
erB
usin
ess
3,2522,985
Core Service
-7.8%
-8.2%
Sparkle -13.1%
Equipment -11.5%
-3,9% -3,6%-5,9%
-7,1% -6,2% -6,0%
1Q12 2Q12 3Q12 4Q12 1Q13 2Q13
+8,8% +9,0%
-9,5% -10,9%-18,4%
-13,1%
1Q12 2Q12 3Q12 4Q12 1Q13 2Q13
-3,1% -2,9%-4,9% -6,2% -6,3% -7,8%
-3,5% -2,7%
-4,9%-6,3% -5.9%
-6,1%
-1,5% -1,0%
-4,0% -3,5%-4,4%
-2,7%
1Q12 2Q12 3Q12 4Q12 1Q13 2Q13
-5,9% -6,6%-8,1% -9,2% -8,7% -9,4%
-0,9% -1,2% -2,3%-3,8%
-6,6%
-13.2%Regulated prices Impact
Reported Normalized*
*regulated prices impact and other discontinuities
* Norm.**-7.0%
-6.7%*
-6.1%*
17MARCO PATUANO
TELECOM ITALIA GROUP1H 2013 Results
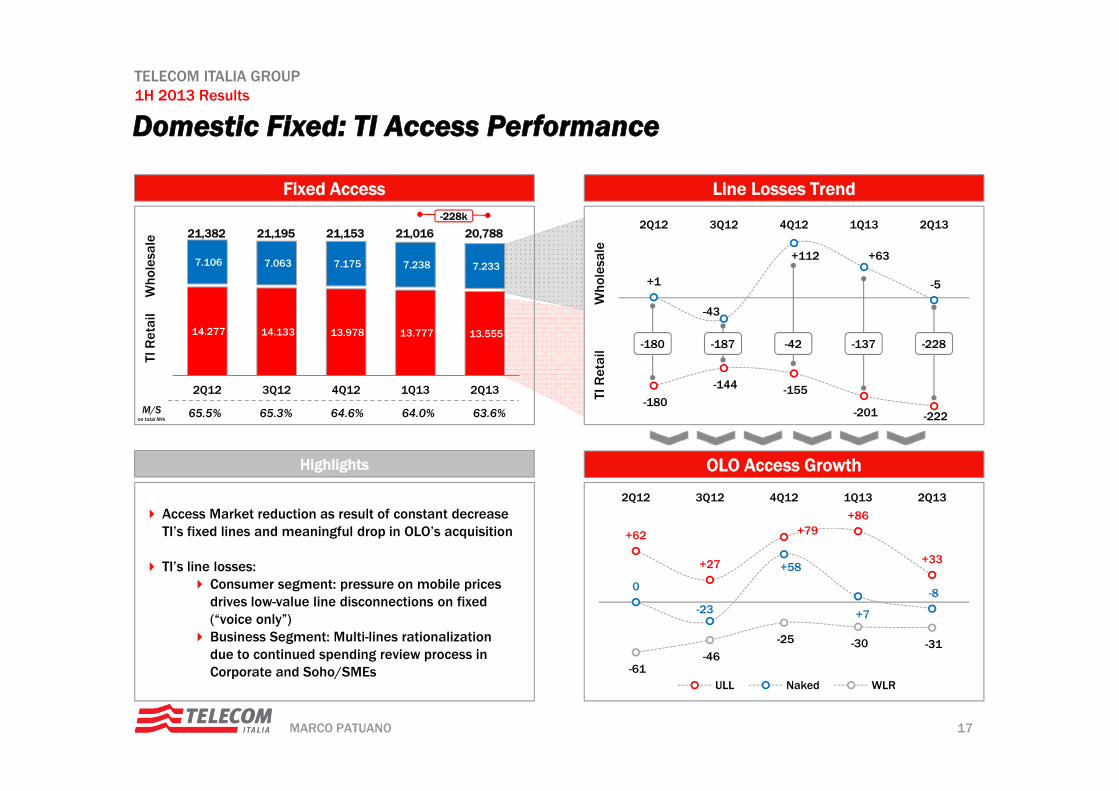
14.277 14.133 13.978 13.777 13.555
7.106 7.063 7.175 7.238 7.233
2Q12 3Q12 4Q12 1Q13 2Q13
Domestic Fixed: TI Access Performance
Highlights OLO Access Growth
Fixed Access Line Losses Trend
TI R
etai
lW
hole
sale
TI R
etai
lW
hole
sale
64.0%65.3%M/Son total Mrk
64.6%65.5% 63.6%
-228k
21,382 21,15321,195 21,016 20,788
-180
-144 -155
-201 -222
+1
-43
+112 +63
-5
2Q12 3Q12 4Q12 1Q13 2Q13
+62
+27
+79+86
+33
0
-23
+58
+7
-8
-61-46
-25 -30 -31
2Q12 3Q12 4Q12 1Q13 2Q13
ULL Naked WLR
-180 -187 -42 -137 -228
Access Market reduction as result of constant decrease TI’s fixed lines and meaningful drop in OLO’s acquisition
TI’s line losses: Consumer segment: pressure on mobile prices
drives low-value line disconnections on fixed (“voice only”)
Business Segment: Multi-lines rationalization due to continued spending review process in Corporate and Soho/SMEs
18MARCO PATUANO
TELECOM ITALIA GROUP1H 2013 Results
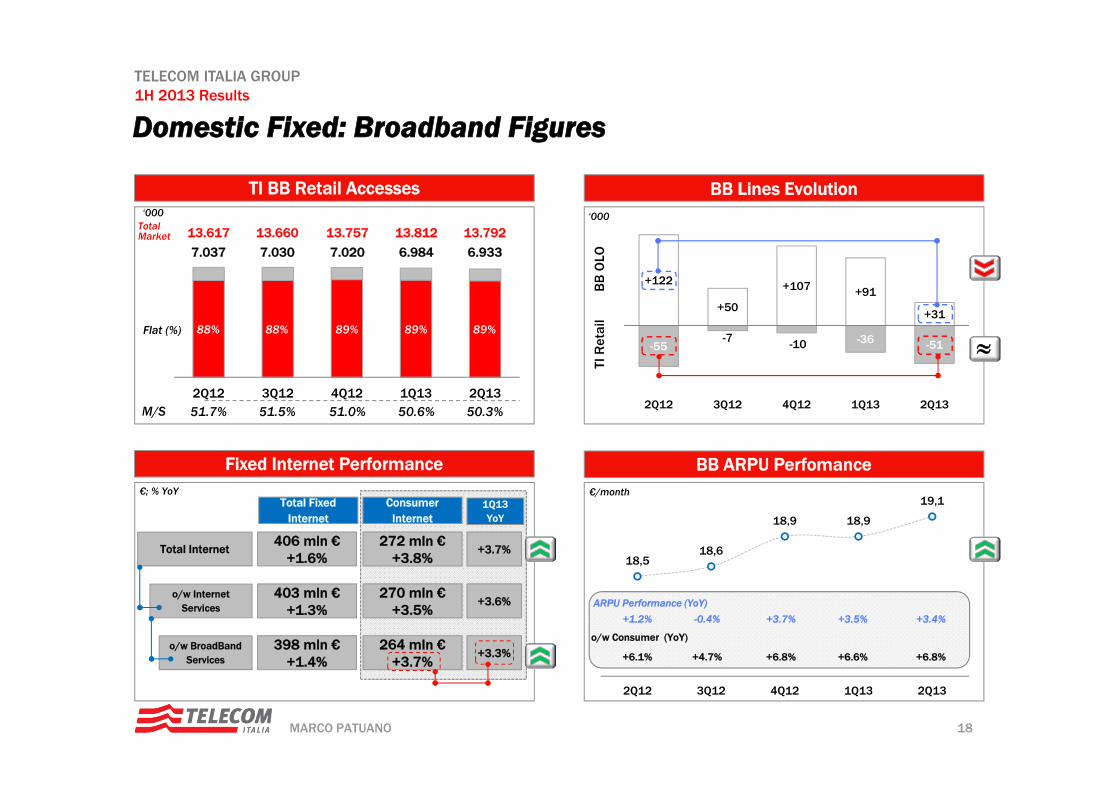
18,518,6
18,9 18,9
19,1
2Q12 3Q12 4Q12 1Q13 2Q13
2Q12 3Q12 4Q12 1Q13 2Q13
‘000
Flat (%)
M/S 51.7% 51.0% 50.3%
TI BB Retail Accesses BB Lines Evolution
Domestic Fixed: Broadband Figures
Fixed Internet Performance BB ARPU Perfomance
TotalMarket 13.617 13.812 13.79213.660
51.5%
TI R
etai
lB
B O
LO
‘000
13.757
50.6%
o/w Internet Services
o/w BroadBandServices
Total Internet
Total FixedInternet
Consumer Internet
406 mln €+1.6%
403 mln €+1.3%
398 mln €+1.4%
272 mln €+3.8%
270 mln €+3.5%
264 mln €+3.7%
+3.3%
+3.6%
+3.7%
1Q13 YoY
7.037 6.984 6.9337.030 7.020
88% 89% 89%88% 89%-55
-7 -10 -36 -51
+122
+50
+107 +91
+31
2Q12 3Q12 4Q12 1Q13 2Q13
+6.1% +6.8% +6.8%+4.7% +6.6%
o/w Consumer (YoY)
+1.2% +3.7% +3.4%-0.4% +3.5%ARPU Performance (YoY)
€/month €; % YoY
19MARCO PATUANO
TELECOM ITALIA GROUP1H 2013 Results
Agenda
Domestic 2Q13 Progress Report
MobileFixed
Appendix
20MARCO PATUANO
TELECOM ITALIA GROUP1H 2013 Results
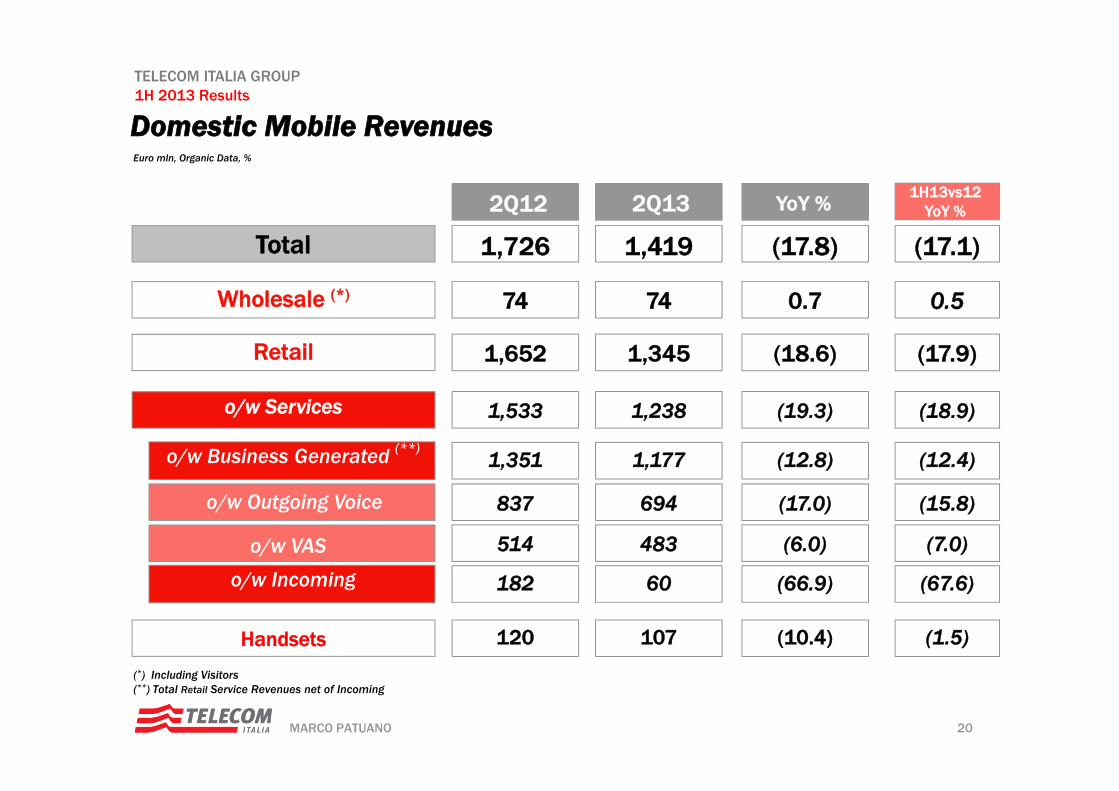
Domestic Mobile RevenuesEuro mln, Organic Data, %
(*) Including Visitors(**) Total Retail Service Revenues net of Incoming
Total
o/w Services
Wholesale (*)
Retail
o/w VAS
o/w Incoming
o/w Business Generated (**)
o/w Outgoing Voice
1,726
1,533
74
1,652
514
182
120
1,351
837
1,419
1,238
74
1,345
483
60
107
1,177
694
(17.8)
(19.3)
0.7
(18.6)
(6.0)
(66.9)
(10.4)
(12.8)
(17.0)
Handsets
(17.1)
(18.9)
0.5
(17.9)
(7.0)
(67.6)
(1.5)
(12.4)
(15.8)
2Q12 2Q13 YoY %1H13vs12
YoY %
21MARCO PATUANO
TELECOM ITALIA GROUP1H 2013 Results
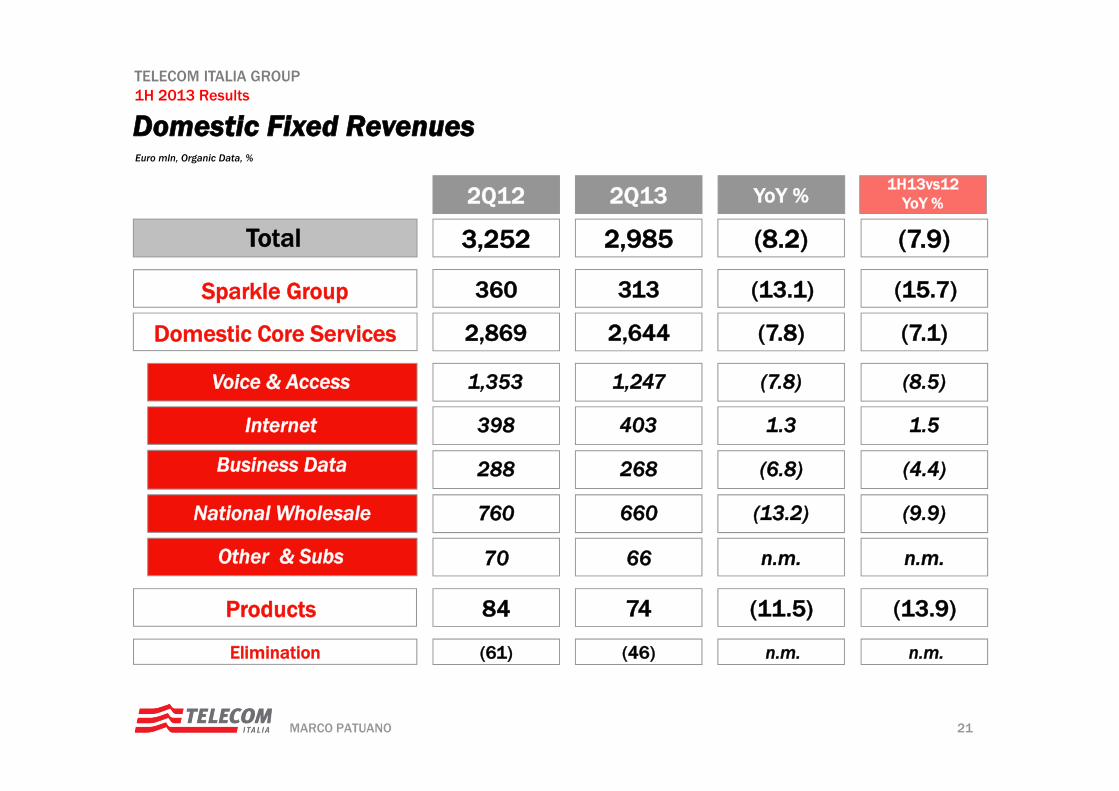
Domestic Fixed RevenuesEuro mln, Organic Data, %
84
2,869
1,353
398
288
760
70
2Q12
3,252
360
(61)
Products
Domestic Core Services
Voice & Access
Internet
Business Data
National Wholesale
Other & Subs
Total
Sparkle Group
Elimination
74
2,644
1,247
403
268
660
66
2Q13
2,985
313
(46)
YoY %
(11.5)
(7.8)
(7.8)
1.3
(6.8)
(13.2)
n.m.
(8.2)
(13.1)
n.m.
1H13vs12YoY %
(13.9)
(7.1)
(8.5)
1.5
(4.4)
(9.9)
n.m.
(7.9)
(15.7)
n.m.
22MARCO PATUANO
TELECOM ITALIA GROUP1H 2013 Results
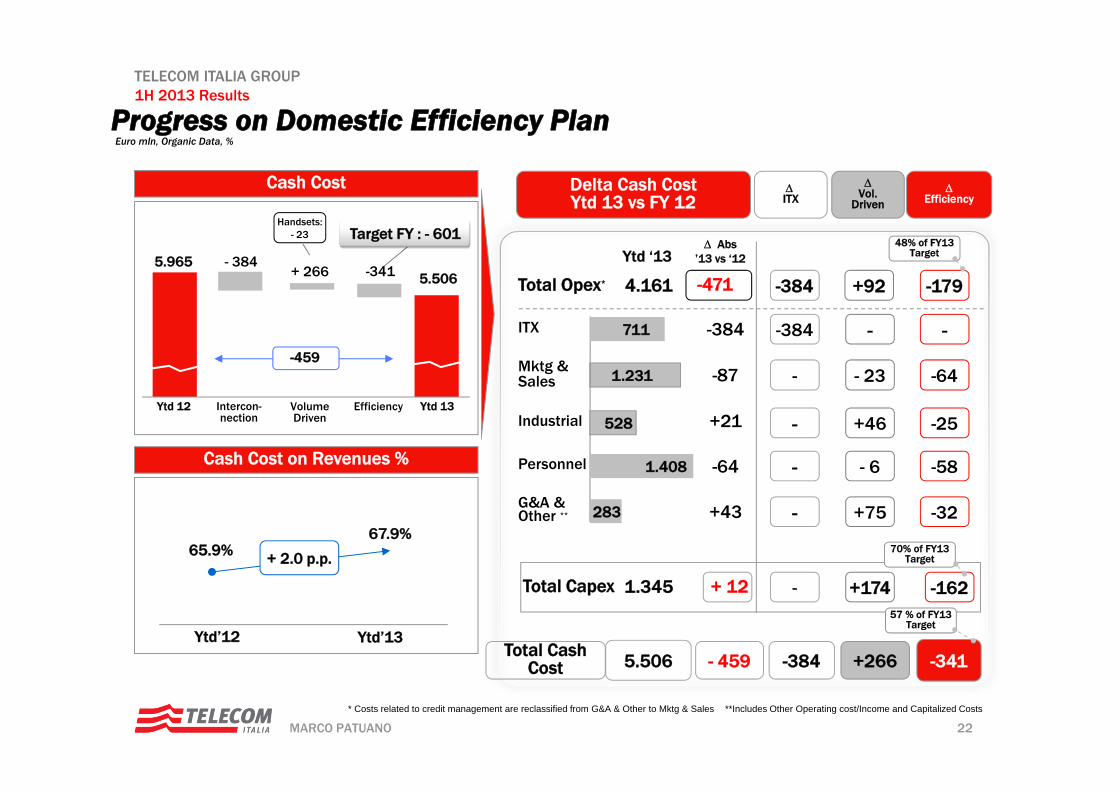
Progress on Domestic Efficiency PlanEuro mln, Organic Data, %
-341
-162
-
-64
-25
-58
-32
-179
Efficiency
Abs’13 vs ‘12
Total Cash Cost
Ytd ‘13
-384
1.345Total Capex + 12
1.231
528
-87
1.408
+21
-64
+43
4.161Total Opex* -471
711
-384
-
-384
-
-
-
-
-384
ITX
+266
+174
-
- 23
+46
- 6
+75
+92
Vol.
Driven
Delta Cash CostYtd 13 vs FY 12
Industrial
Personnel
Mktg &Sales
ITX
G&A &Other **
- 459
283
Cash Cost
EfficiencyVolume Driven
- 3845.965
-459
-341
Intercon-nection
Target FY : - 601
Ytd 12 Ytd 13
5.506
Handsets:- 23
+ 266
Cash Cost on Revenues %
Ytd’12 Ytd’13
5.506
48% of FY13 Target
70% of FY13 Target
57 % of FY13 Target
65.9%67.9%
+ 2.0 p.p.
**Includes Other Operating cost/Income and Capitalized Costs* Costs related to credit management are reclassified from G&A & Other to Mktg & Sales
23MARCO PATUANO
TELECOM ITALIA GROUP1H 2013 Results
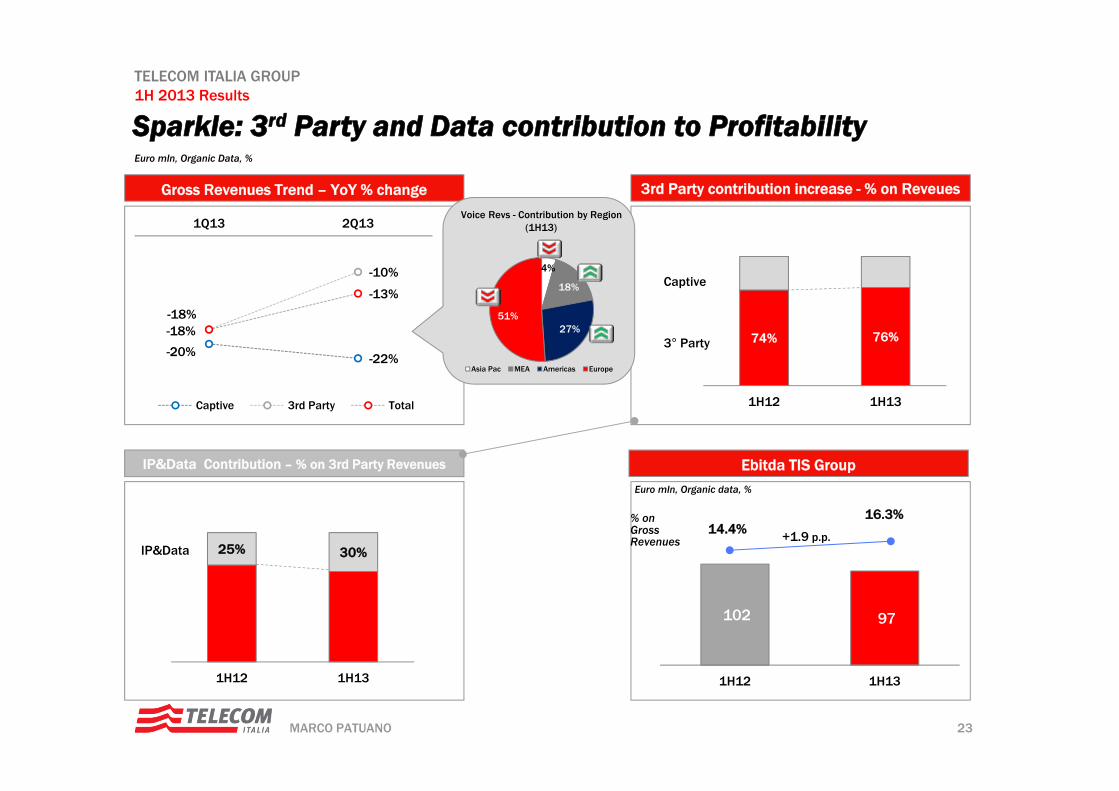
102 97
1H12 1H13
-20% -22%
-18%
-10%
-18%
-13%
1Q13 2Q13
Captive 3rd Party Total
Euro mln, Organic Data, %
Sparkle: 3rd Party and Data contribution to Profitability
Gross Revenues Trend – YoY % change 3rd Party contribution increase - % on Reveues
IP&Data Contribution – % on 3rd Party Revenues Ebitda TIS Group
3° Party
Captive
74% 76%
1H12 1H13
25% 30%
1H12 1H13
IP&Data
% on GrossRevenues
14.4%16.3%
+1.9 p.p.
Euro mln, Organic data, %
4%
18%
27%51%
Asia Pac MEA Americas Europe
Voice Revs - Contribution by Region(1H13)
24MARCO PATUANO
TELECOM ITALIA GROUP1H 2013 Results
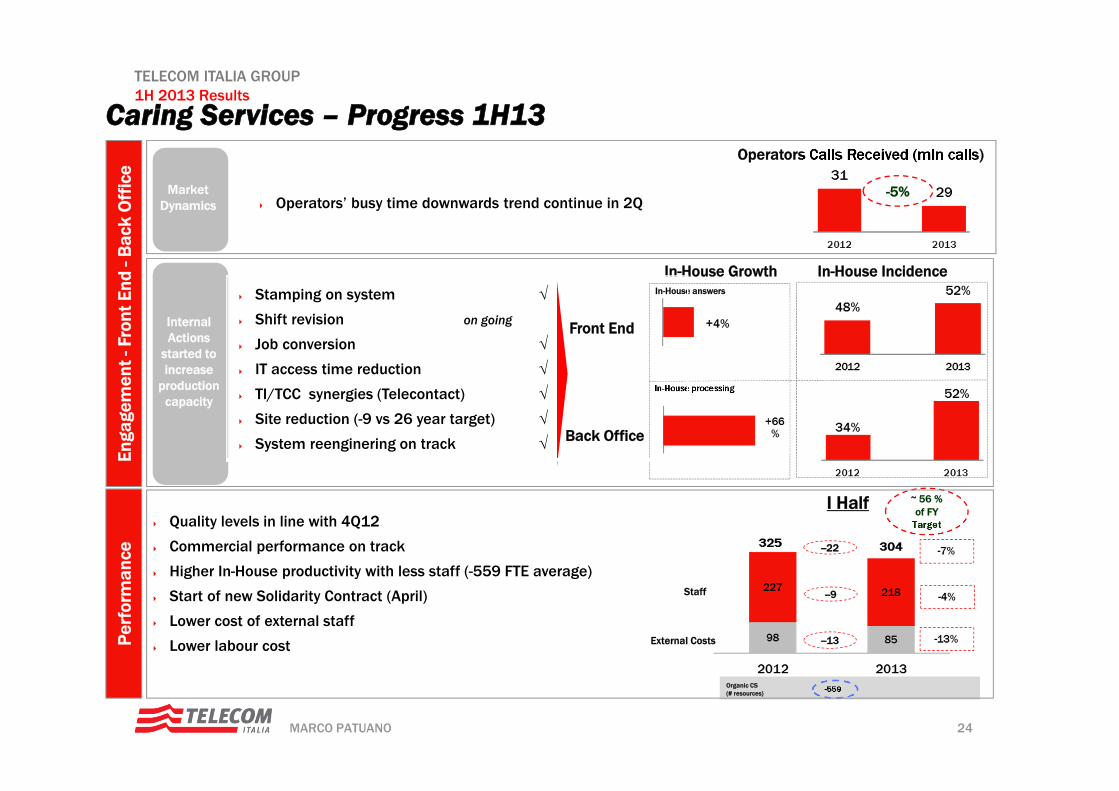
Caring Services – Progress 1H13
Front End
Back Office
Operators Calls Received (mln calls)
-5%Market Dynamics
Internal Actions
started to increase
production capacity
~ 56 % of FY
Target
-559
I Half
--13
--9
--22
Enga
gem
ent -
Fron
t End
-B
ack
Off
ice
Per
form
ance
In-House IncidenceIn-House Growth
Operators’ busy time downwards trend continue in 2Q
In-House answers
In-House processing
Quality levels in line with 4Q12
Commercial performance on track
Higher In-House productivity with less staff (-559 FTE average)
Start of new Solidarity Contract (April)
Lower cost of external staff
Lower labour cost
Staff
External Costs
Organic CS (# resources)
Stamping on system
Shift revision on going
Job conversion
IT access time reduction
TI/TCC synergies (Telecontact)
Site reduction (-9 vs 26 year target)
System reenginering on track
25MARCO PATUANO
TELECOM ITALIA GROUP1H 2013 Results
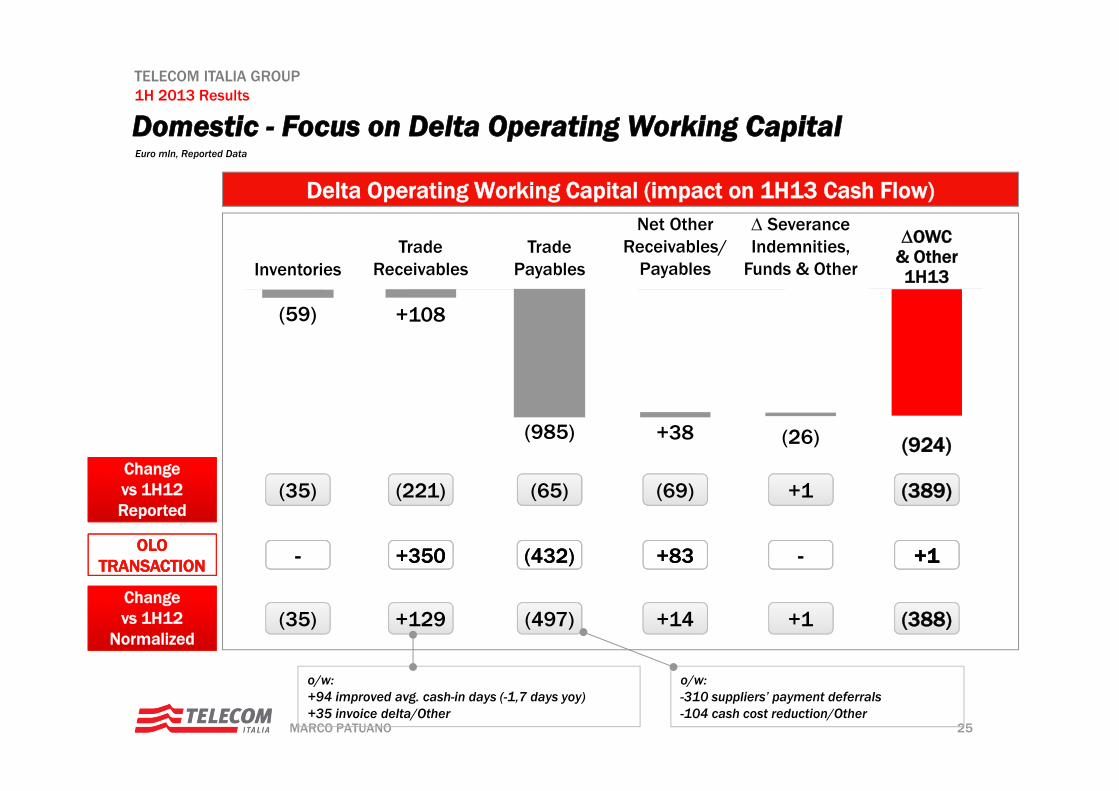
Domestic - Focus on Delta Operating Working CapitalEuro mln, Reported Data
Severance Indemnities,
Funds & Other
Net OtherReceivables/
PayablesTrade
ReceivablesInventories
OWC & Other1H13
(388)(35) +129 (497) +14 +1
Delta Operating Working Capital (impact on 1H13 Cash Flow)
TradePayables
(924)
(59) +108
(985) +38 (26)
o/w:-310 suppliers’ payment deferrals-104 cash cost reduction/Other
(389)(35) (221) (65) (69) +1Changevs 1H12Reported
Changevs 1H12
Normalized
+1+1-- +350+350 (432)(432) +83+83 --OLO TRANSACTION
OLO TRANSACTION
o/w:+94 improved avg. cash-in days (-1,7 days yoy)+35 invoice delta/Other