telecom italia · telecom italia morgan stanley 11th annual technology media & telecoms...
TRANSCRIPT
Telecom Italia
Morgan Stanley 11th Annual Technology Media & Telecoms Conference
Barcelona, November 17, 2011
TELECOM ITALIA GROUP
MARCO PATUANO – Chief Operating Officer
1 MARCO PATUANO
Morgan Stanley 11th Annual Technology Media & Telecoms Conference Barcelona, November 17, 2011
Safe Harbour
These presentations contain statements that constitute forward-looking statements within the meaning of the
Private Securities Litigation Reform Act of 1995. These statements appear in a number of places in this
presentation and include statements regarding the intent, belief or current expectations of the customer base,
estimates regarding future growth in the different business lines and the global business, market share, financial
results and other aspects of the activities and situation relating to the Company and the Group.
Such forward looking statements are not guarantees of future performance and involve risks and uncertainties, and
actual results may differ materially from those projected or implied in the forward looking statements as a result of
various factors.
Forward-looking information is based on certain key assumptions which we believe to be reasonable as of the date
hereof, but forward looking information by its nature involves risks and uncertainties, which are outside our control,
and could significantly affect expected results.
Analysts are cautioned not to place undue reliance on those forward looking statements, which speak only as of the
date of this presentation. Telecom Italia S.p.A. undertakes no obligation to release publicly the results of any
revisions to these forward looking statements which may be made to reflect events and circumstances after the
date of this presentation, including, without limitation, changes in Telecom Italia S.p.A. business or acquisition
strategy or planned capital expenditures or to reflect the occurrence of unanticipated events. Analysts and investors
are encouraged to consult the Company's Annual Report on Form 20-F as well as periodic filings made on Form 6-K,
which are on file with the United States Securities and Exchange Commission.

2 MARCO PATUANO
Morgan Stanley 11th Annual Technology Media & Telecoms Conference Barcelona, November 17, 2011
Agenda
► TI Group 3Q11 Progress Report
► Focus on Domestic Mobile Market
► Focus on Domestic Fixed Market
► Conclusions
3 MARCO PATUANO
Morgan Stanley 11th Annual Technology Media & Telecoms Conference Barcelona, November 17, 2011
7.088 7.073
7.318 7.470
7.246 7.516
9M10 9M11
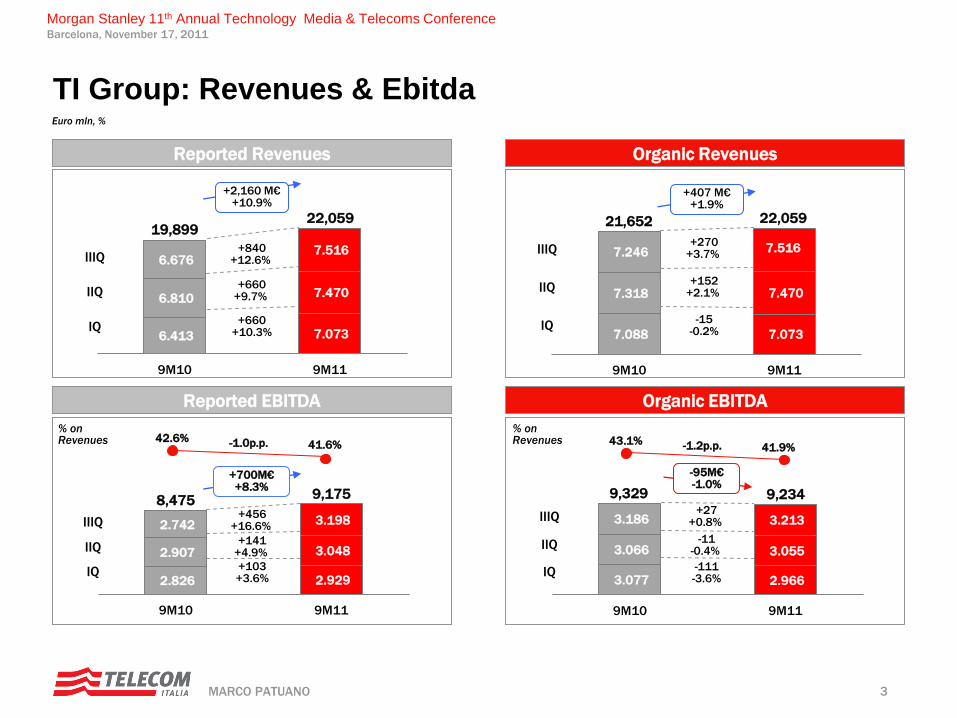
Euro mln, %
Reported EBITDA
Reported Revenues Organic Revenues
Organic EBITDA
42.6% 41.6%
+2,160 M€ +10.9%
% on Revenues
% on Revenues -1.0p.p.
+660 +9.7%
+660 +10.3%
19,899 22,059
IIQ
IQ
TI Group: Revenues & Ebitda
IIIQ +840
+12.6%
+407 M€ +1.9%
+152 +2.1%
-15 -0.2%
21,652 22,059
IIQ
IQ
IIIQ +270
+3.7%
IIQ
IQ
IIIQ
8,475 9,175
+141 +4.9%
+103 +3.6%
+456 +16.6%
43.1% 41.9% -1.2p.p.
9,329 9,234
-95M€ -1.0%
-11 -0.4%
-111 -3.6%
+27 +0.8%
IIQ
IQ
IIIQ
6.413 7.073
6.810 7.470
6.676 7.516
9M10 9M11
+700M€ +8.3%
3.077 2.966
3.066 3.055
3.186 3.213
9M10 9M11
2.826 2.929
2.907 3.048
2.742 3.198
9M10 9M11
4 MARCO PATUANO
Morgan Stanley 11th Annual Technology Media & Telecoms Conference Barcelona, November 17, 2011
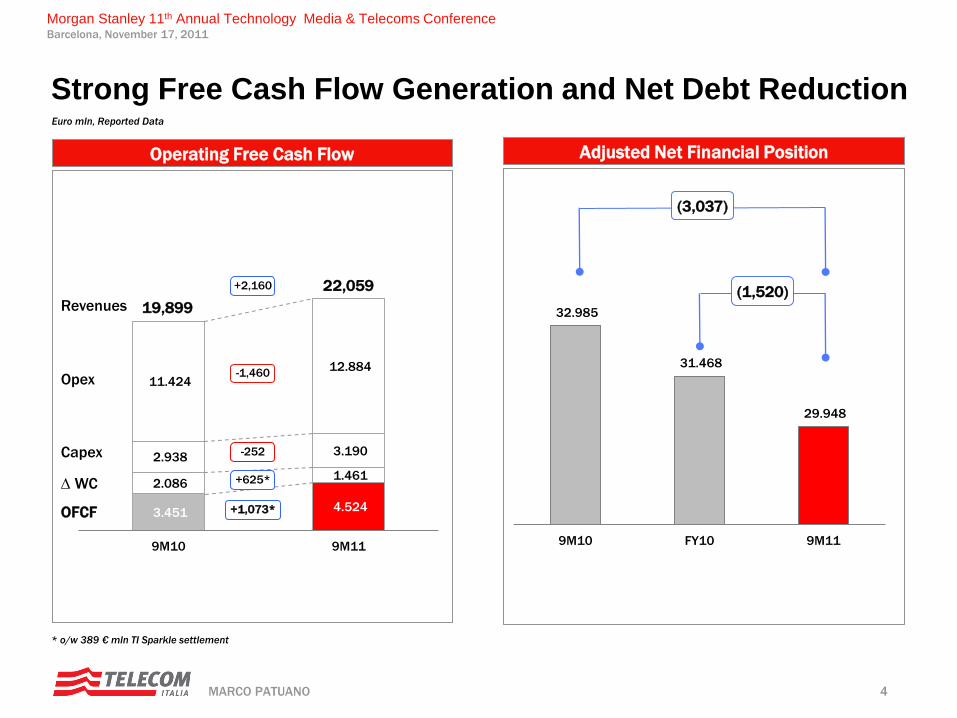
3.451 4.524
2.086 1.461
2.938 3.190
11.424
12.884
9M10 9M11
Euro mln, Reported Data
Operating Free Cash Flow
Revenues
Opex
Capex
D WC
OFCF
19,899
22,059 +2,160
-252
+625*
+1,073*
-1,460
* o/w 389 € mln TI Sparkle settlement
Strong Free Cash Flow Generation and Net Debt Reduction
32.985
31.468
29.948
9M10 FY10 9M11
Adjusted Net Financial Position
(3,037)
(1,520)
5 MARCO PATUANO
Morgan Stanley 11th Annual Technology Media & Telecoms Conference Barcelona, November 17, 2011
3.444 3.349
1.914 1.790
3Q10 3Q11
2.542 2.478
3Q10 3Q11
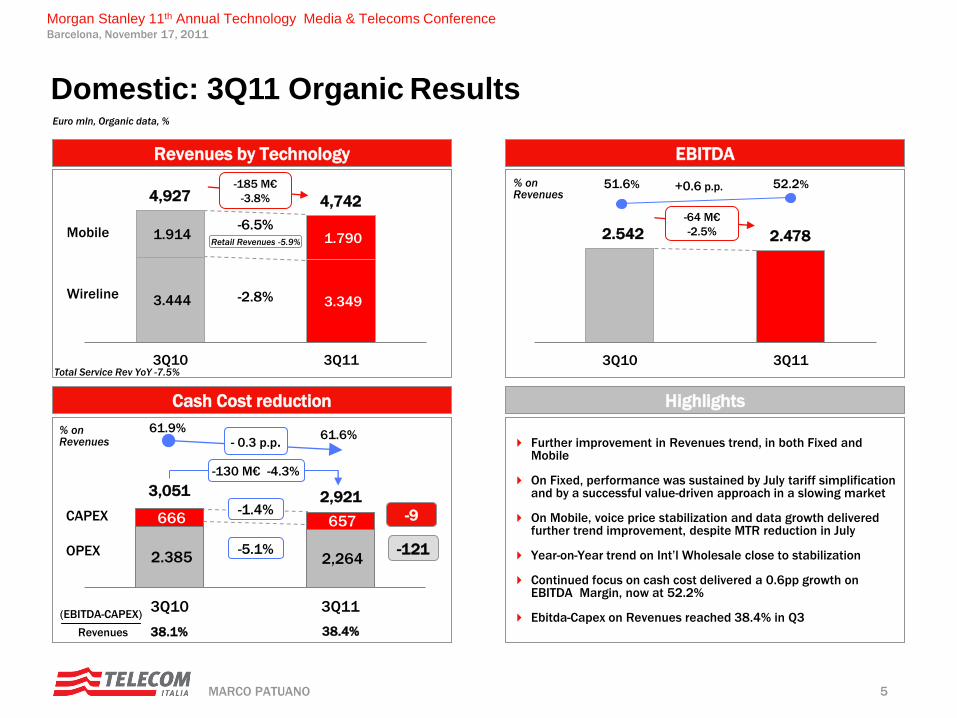
Domestic: 3Q11 Organic Results Euro mln, Organic data, %
Further improvement in Revenues trend, in both Fixed and Mobile
On Fixed, performance was sustained by July tariff simplification and by a successful value-driven approach in a slowing market
On Mobile, voice price stabilization and data growth delivered further trend improvement, despite MTR reduction in July
Year-on-Year trend on Int’l Wholesale close to stabilization
Continued focus on cash cost delivered a 0.6pp growth on EBITDA Margin, now at 52.2%
Ebitda-Capex on Revenues reached 38.4% in Q3
% on Revenues
-185 M€
-3.8%
-2.8% Wireline
4,927 4,742 -64 M€
-2.5%
51.6% 52.2% +0.6 p.p.
-6.5% Mobile
2.385 2,264
666 657
3Q10 3Q11
-9
-121
61.9% 61.6%
- 0.3 p.p.
CAPEX
-5.1% OPEX
-1.4%
-130 M€ -4.3%
3,051 2,921
% on Revenues
(EBITDA-CAPEX)
Revenues 38.1% 38.4%
Retail Revenues -5.9%
Total Service Rev YoY -7.5%
Cash Cost reduction
Revenues by Technology EBITDA
Highlights
6 MARCO PATUANO
Morgan Stanley 11th Annual Technology Media & Telecoms Conference Barcelona, November 17, 2011
Agenda
► TI Group 3Q11 Progress Report
► Focus on Domestic Mobile Market
► Focus on Domestic Market Fixed
► Conclusions
7 MARCO PATUANO
Morgan Stanley 11th Annual Technology Media & Telecoms Conference Barcelona, November 17, 2011
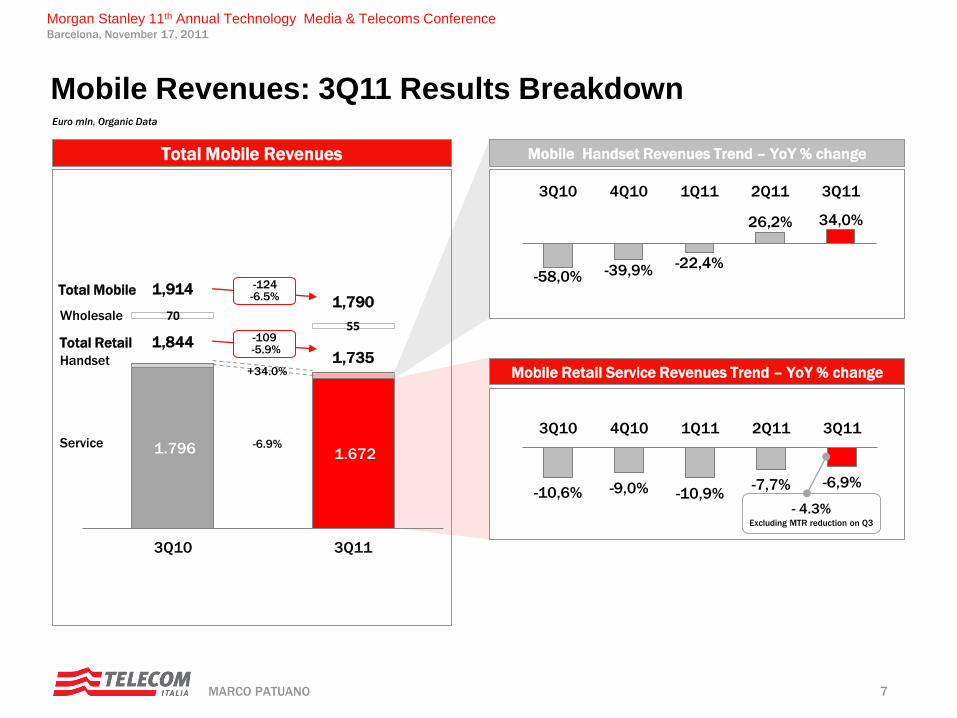
-10,6% -9,0% -10,9% -7,7% -6,9%
3Q10 4Q10 1Q11 2Q11 3Q11
1.796 1.672
70 55
3Q10 3Q11
+34.0%
Euro mln, Organic Data
Mobile Revenues: 3Q11 Results Breakdown
-58,0% -39,9% -22,4%
26,2% 34,0%
3Q10 4Q10 1Q11 2Q11 3Q11
- 4.3% Excluding MTR reduction on Q3
Total Mobile Revenues Mobile Handset Revenues Trend – YoY % change
Mobile Retail Service Revenues Trend – YoY % change
-124 -6.5%
1,914 Total Mobile 1,790
Total Retail 1,735
1,844
Wholesale
-109 -5.9%
Service -6.9%
Handset
8 MARCO PATUANO
Morgan Stanley 11th Annual Technology Media & Telecoms Conference Barcelona, November 17, 2011
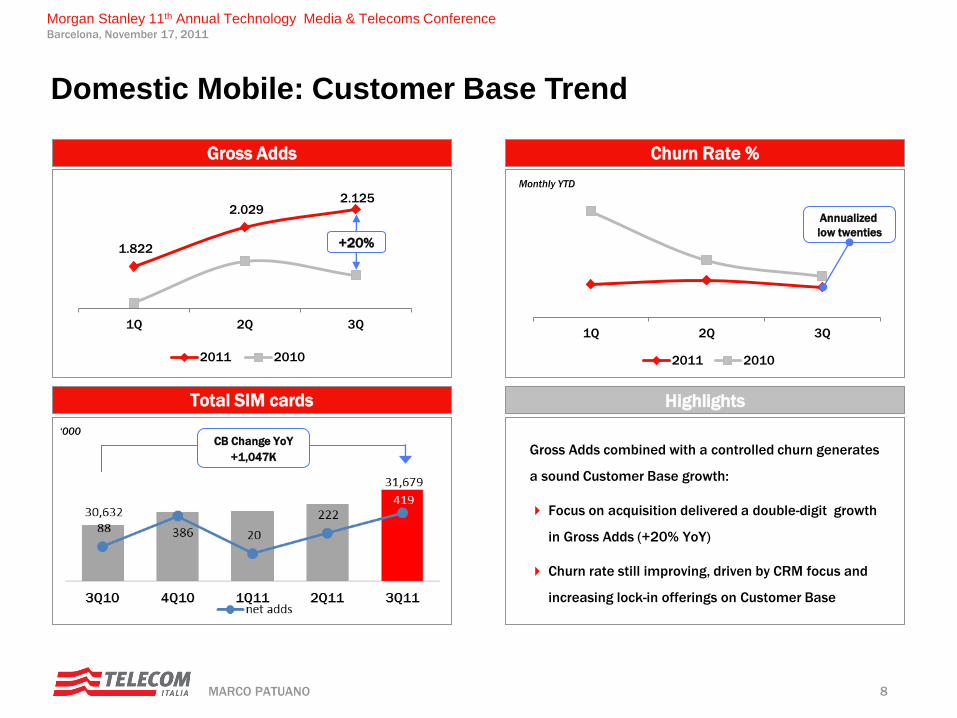
‘000
Gross Adds combined with a controlled churn generates
a sound Customer Base growth:
Focus on acquisition delivered a double-digit growth
in Gross Adds (+20% YoY)
Churn rate still improving, driven by CRM focus and
increasing lock-in offerings on Customer Base
Monthly YTD
1Q 2Q 3Q
2011 2010
1.822
2.029 2.125
1Q 2Q 3Q
2011 2010
+20%
Annualized
low twenties
Total SIM cards
Gross Adds Churn Rate %
Highlights
CB Change YoY
+1,047K
Domestic Mobile: Customer Base Trend
9 MARCO PATUANO
Morgan Stanley 11th Annual Technology Media & Telecoms Conference Barcelona, November 17, 2011
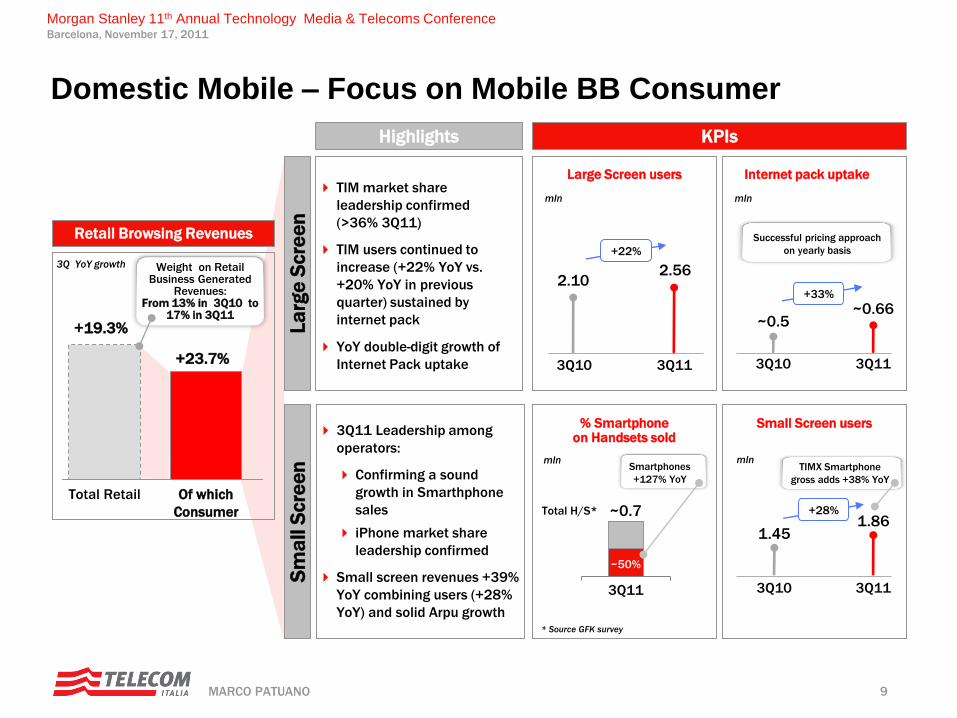
3Q11 Leadership among
operators:
Confirming a sound
growth in Smarthphone
sales
iPhone market share
leadership confirmed
Small screen revenues +39%
YoY combining users (+28%
YoY) and solid Arpu growth
TIM market share
leadership confirmed
(>36% 3Q11)
TIM users continued to
increase (+22% YoY vs.
+20% YoY in previous
quarter) sustained by
internet pack
YoY double-digit growth of
Internet Pack uptake 3Q10
+22%
3Q11
2.10 2.56
Large Screen users
mln
3Q10 3Q11
~0.5 ~0.66
Successful pricing approach
on yearly basis
Internet pack uptake
mln
% Smartphone on Handsets sold
mln
~50%
~0.7 Total H/S*
Smartphones
+127% YoY
3Q11
+33%
Small Screen users
mln
3Q10 3Q11
1.45 1.86
TIMX Smartphone
gross adds +38% YoY
+28%
* Source GFK survey
+19.3%
+23.7%
Total Retail Of which
Consumer
KPIs Highlights
Retail Browsing Revenues
3Q YoY growth Weight on Retail Business Generated
Revenues: From 13% in 3Q10 to
17% in 3Q11
Sm
all S
cre
en
L
arg
e S
cre
en
Domestic Mobile – Focus on Mobile BB Consumer
10 MARCO PATUANO
Morgan Stanley 11th Annual Technology Media & Telecoms Conference Barcelona, November 17, 2011
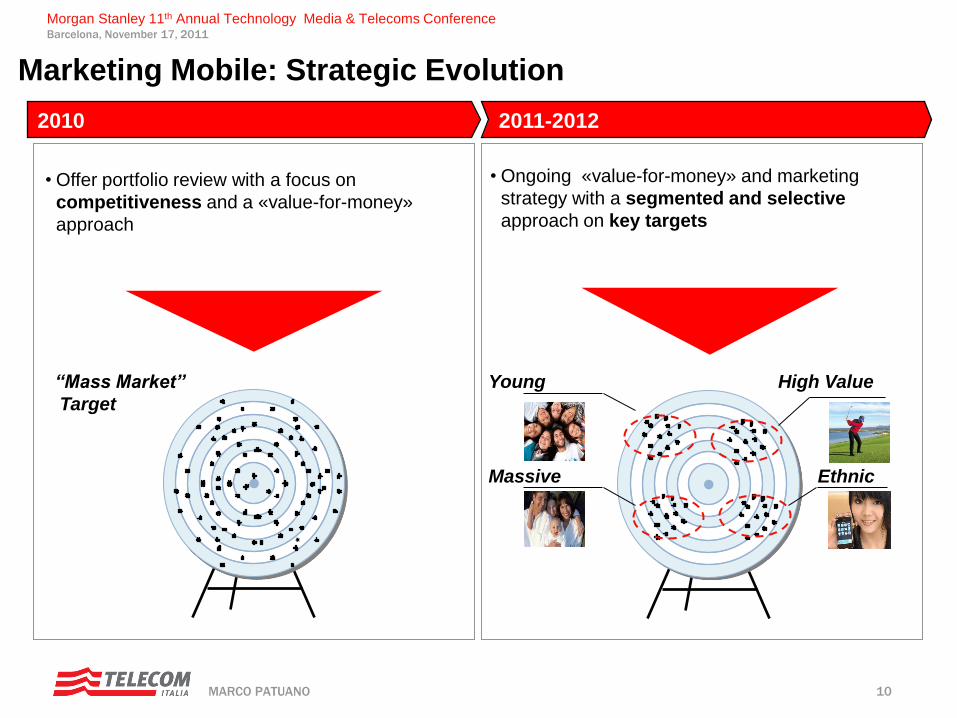
Marketing Mobile: Strategic Evolution
2010 2011-2012
• Offer portfolio review with a focus on
competitiveness and a «value-for-money»
approach
• Ongoing «value-for-money» and marketing
strategy with a segmented and selective
approach on key targets
“Mass Market”
Target
Young High Value
Ethnic Massive
11 MARCO PATUANO
Morgan Stanley 11th Annual Technology Media & Telecoms Conference Barcelona, November 17, 2011
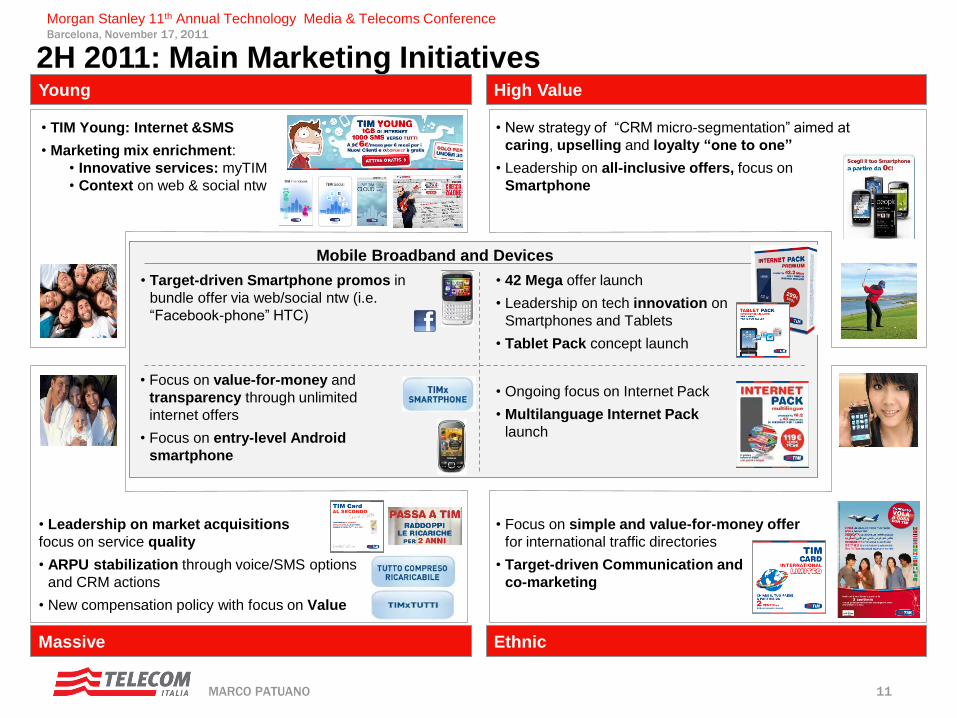
2H 2011: Main Marketing Initiatives Young High Value
Massive Ethnic
• TIM Young: Internet &SMS
• Marketing mix enrichment:
• Innovative services: myTIM
• Context on web & social ntw
• New strategy of “CRM micro-segmentation” aimed at
caring, upselling and loyalty “one to one”
• Leadership on all-inclusive offers, focus on
Smartphone
• Leadership on market acquisitions
focus on service quality
• ARPU stabilization through voice/SMS options
and CRM actions
• New compensation policy with focus on Value
• Focus on simple and value-for-money offer
for international traffic directories
• Target-driven Communication and
co-marketing
• Target-driven Smartphone promos in
bundle offer via web/social ntw (i.e.
“Facebook-phone” HTC)
• Focus on value-for-money and
transparency through unlimited
internet offers
• Focus on entry-level Android
smartphone
• 42 Mega offer launch
• Leadership on tech innovation on
Smartphones and Tablets
• Tablet Pack concept launch
• Ongoing focus on Internet Pack
• Multilanguage Internet Pack
launch
Mobile Broadband and Devices
12 MARCO PATUANO
Morgan Stanley 11th Annual Technology Media & Telecoms Conference Barcelona, November 17, 2011
Agenda
► TI Group 3Q11 Progress Report
► Focus on Domestic Mobile Market
► Focus on Domestic Fixed Market
► Conclusions
13 MARCO PATUANO
Morgan Stanley 11th Annual Technology Media & Telecoms Conference Barcelona, November 17, 2011
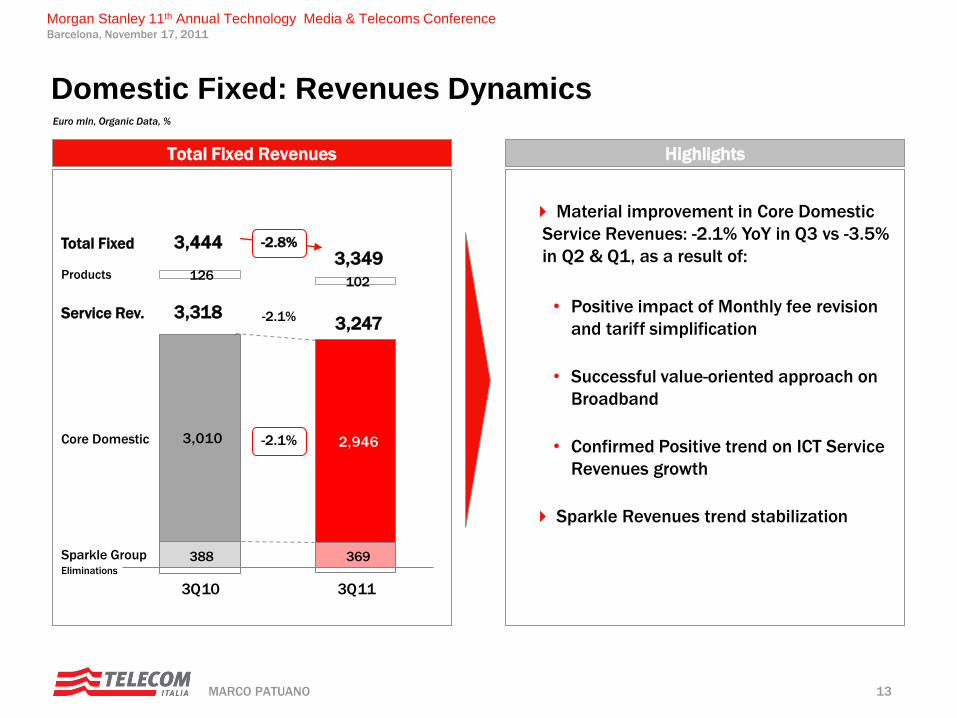
388
3,010 2,946
126 102
3Q10 3Q11
369
Euro mln, Organic Data, %
Domestic Fixed: Revenues Dynamics
Core Domestic
Products
Sparkle Group
Service Rev.
-2.8% Total Fixed 3,444 3,349
3,318 3,247
-2.1%
Eliminations
-2.1%
Material improvement in Core Domestic
Service Revenues: -2.1% YoY in Q3 vs -3.5%
in Q2 & Q1, as a result of:
• Positive impact of Monthly fee revision
and tariff simplification
• Successful value-oriented approach on
Broadband
• Confirmed Positive trend on ICT Service
Revenues growth
Sparkle Revenues trend stabilization
Total Fixed Revenues Highlights
14 MARCO PATUANO
Morgan Stanley 11th Annual Technology Media & Telecoms Conference Barcelona, November 17, 2011
TI Access
Line losses
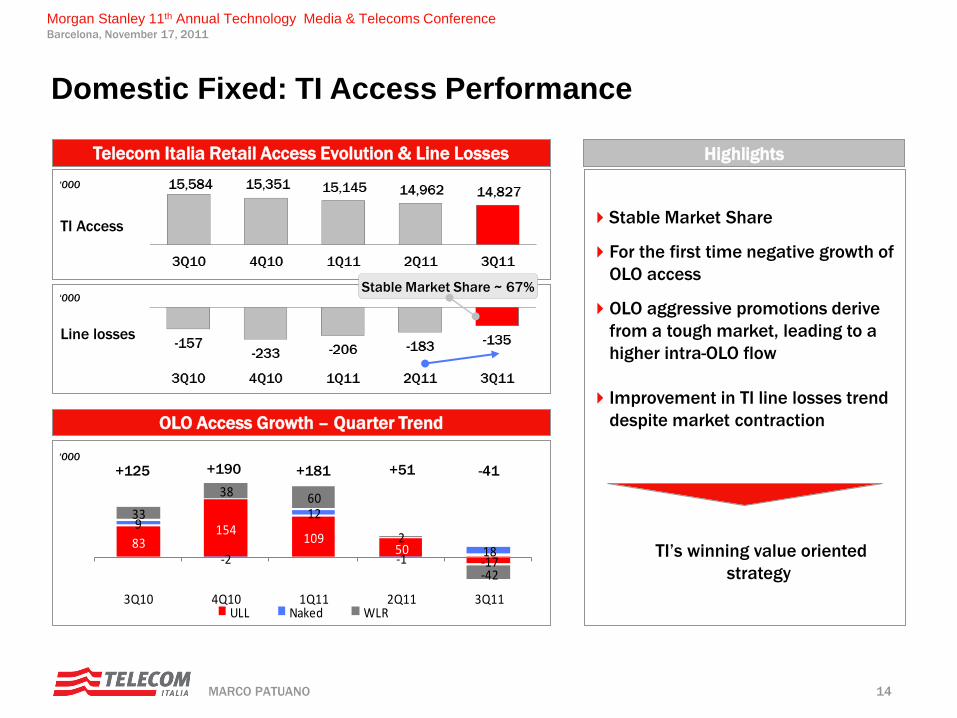
Stable Market Share
For the first time negative growth of
OLO access
OLO aggressive promotions derive
from a tough market, leading to a
higher intra-OLO flow
Improvement in TI line losses trend
despite market contraction
‘000
‘000
‘000
Stable Market Share ~ 67%
83154
10950
-17
9
-2
12
-118
33
38 60
2
-42
3Q10 4Q10 1Q11 2Q11 3Q11ULL Naked WLR
-41 +51 +181 +190 +125
Domestic Fixed: TI Access Performance
OLO Access Growth – Quarter Trend
Telecom Italia Retail Access Evolution & Line Losses Highlights
TI’s winning value oriented
strategy
15 MARCO PATUANO
Morgan Stanley 11th Annual Technology Media & Telecoms Conference Barcelona, November 17, 2011
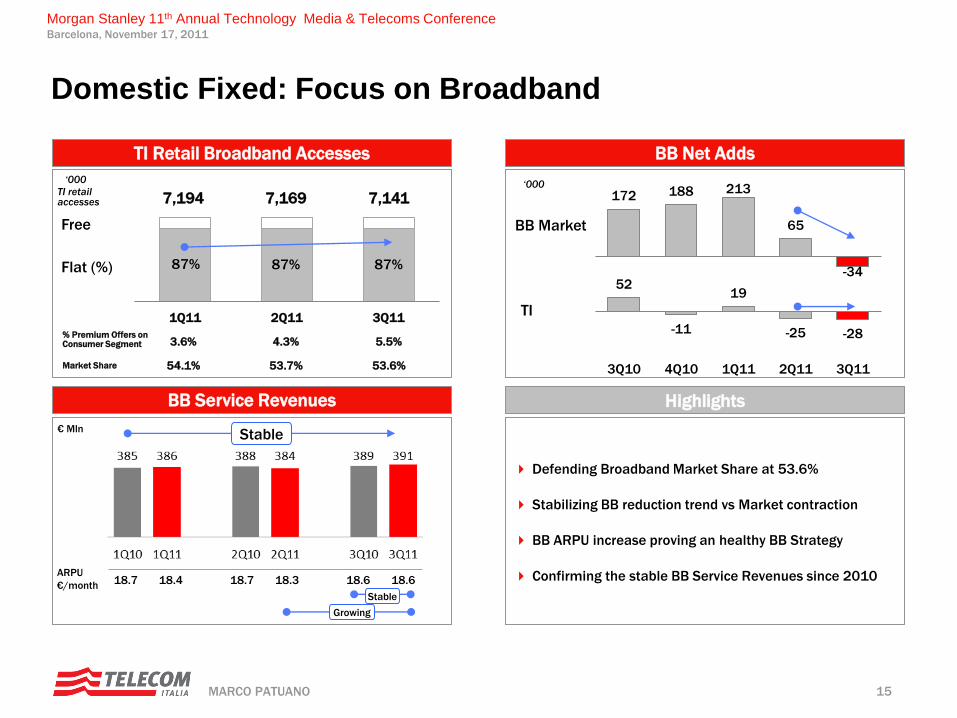
172 188 213
65
-34 52
-11
19
-25 -28
3Q10 4Q10 1Q11 2Q11 3Q11
‘000
Free
TI retail accesses
Defending Broadband Market Share at 53.6%
Stabilizing BB reduction trend vs Market contraction
BB ARPU increase proving an healthy BB Strategy
Confirming the stable BB Service Revenues since 2010
BB Market
TI
Flat (%)
€ Mln
‘000
% Premium Offers on Consumer Segment
Market Share
1Q11 2Q11 3Q11
87%
7,194
3.6%
54.1%
87%
7,169
4.3%
53.7%
87%
7,141
5.5%
53.6%
Stable
18.7 18.4 18.7 18.3 18.6 18.6 ARPU
€/month Stable
Growing
BB Service Revenues
TI Retail Broadband Accesses BB Net Adds
Highlights
Domestic Fixed: Focus on Broadband
16 MARCO PATUANO
Morgan Stanley 11th Annual Technology Media & Telecoms Conference Barcelona, November 17, 2011
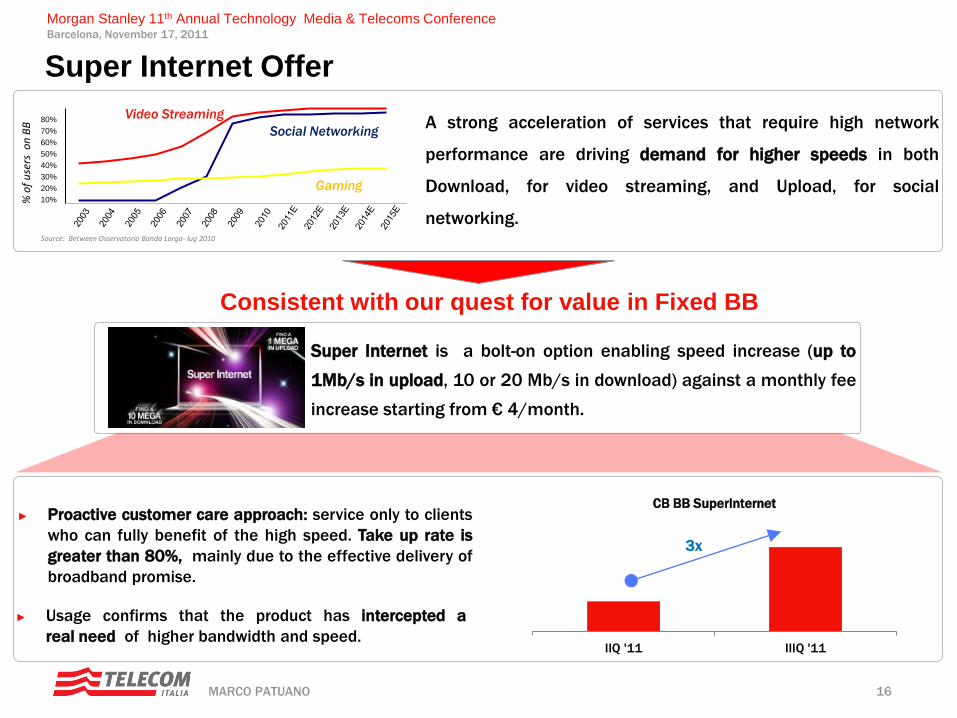
Super Internet Offer
Source: Between Osservatorio Banda Larga- lug 2010
% o
f u
sers
on
BB
10%
20%
30%
40%
50%
60%
80%
70% Social Networking
Video Streaming
Gaming
A strong acceleration of services that require high network
performance are driving demand for higher speeds in both
Download, for video streaming, and Upload, for social
networking.
► Proactive customer care approach: service only to clients
who can fully benefit of the high speed. Take up rate is
greater than 80%, mainly due to the effective delivery of
broadband promise.
Consistent with our quest for value in Fixed BB
► Super Internet is a bolt-on option enabling speed increase (up to
1Mb/s in upload, 10 or 20 Mb/s in download) against a monthly fee
increase starting from € 4/month.
► Usage confirms that the product has intercepted a
real need of higher bandwidth and speed. IIQ '11 IIIQ '11
CB BB SuperInternet
3x
17 MARCO PATUANO
Morgan Stanley 11th Annual Technology Media & Telecoms Conference Barcelona, November 17, 2011
Agenda
► TI Group 3Q11 Progress Report
► Focus on Domestic Mobile Market
► Focus on Domestic Fixed Market
► Conclusions
18 MARCO PATUANO
Morgan Stanley 11th Annual Technology Media & Telecoms Conference Barcelona, November 17, 2011
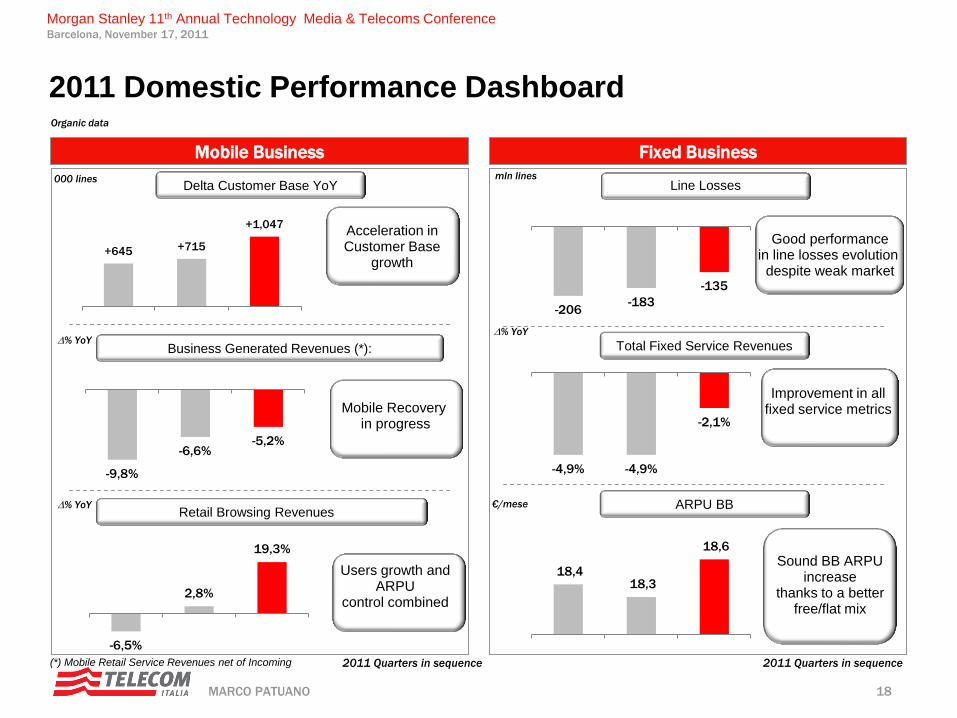
2011 Domestic Performance Dashboard Organic data
Mobile Business Fixed Business
Business Generated Revenues (*):
Delta Customer Base YoY
Retail Browsing Revenues
Total Fixed Service Revenues
Line Losses
Mobile Recovery in progress
Acceleration in Customer Base
growth
Users growth and ARPU
control combined
D% YoY
D% YoY
D% YoY
mln lines
ARPU BB
Sound BB ARPU increase
thanks to a better free/flat mix
2011 Quarters in sequence 2011 Quarters in sequence
Good performance in line losses evolution
despite weak market
Improvement in all fixed service metrics
-206 -183
-135
-4,9% -4,9%
-2,1%
18,4 18,3
18,6
+645 +715
+1,047
000 lines
(*) Mobile Retail Service Revenues net of Incoming
€/mese
-9,8%
-6,6% -5,2%
-6,5%
2,8%
19,3%
19 MARCO PATUANO
Morgan Stanley 11th Annual Technology Media & Telecoms Conference Barcelona, November 17, 2011
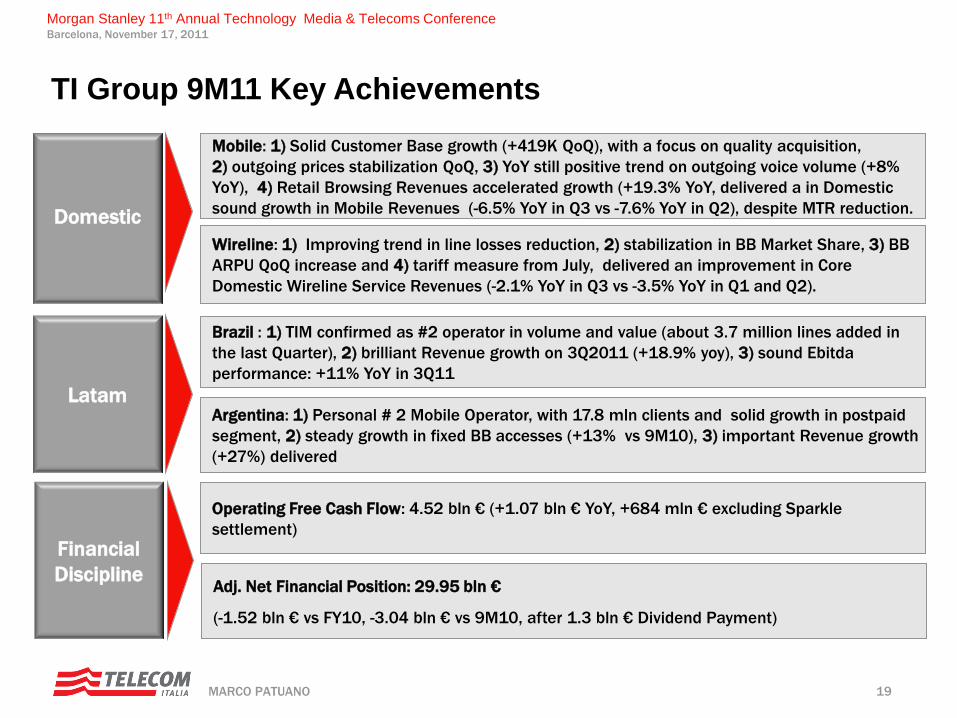
TI Group 9M11 Key Achievements
Financial
Discipline
Operating Free Cash Flow: 4.52 bln € (+1.07 bln € YoY, +684 mln € excluding Sparkle
settlement)
Adj. Net Financial Position: 29.95 bln €
(-1.52 bln € vs FY10, -3.04 bln € vs 9M10, after 1.3 bln € Dividend Payment)
Latam
Brazil : 1) TIM confirmed as #2 operator in volume and value (about 3.7 million lines added in
the last Quarter), 2) brilliant Revenue growth on 3Q2011 (+18.9% yoy), 3) sound Ebitda
performance: +11% YoY in 3Q11
Argentina: 1) Personal # 2 Mobile Operator, with 17.8 mln clients and solid growth in postpaid
segment, 2) steady growth in fixed BB accesses (+13% vs 9M10), 3) important Revenue growth
(+27%) delivered
Domestic
Mobile: 1) Solid Customer Base growth (+419K QoQ), with a focus on quality acquisition,
2) outgoing prices stabilization QoQ, 3) YoY still positive trend on outgoing voice volume (+8%
YoY), 4) Retail Browsing Revenues accelerated growth (+19.3% YoY, delivered a in Domestic
sound growth in Mobile Revenues (-6.5% YoY in Q3 vs -7.6% YoY in Q2), despite MTR reduction.
Wireline: 1) Improving trend in line losses reduction, 2) stabilization in BB Market Share, 3) BB
ARPU QoQ increase and 4) tariff measure from July, delivered an improvement in Core
Domestic Wireline Service Revenues (-2.1% YoY in Q3 vs -3.5% YoY in Q1 and Q2).
20 MARCO PATUANO
Morgan Stanley 11th Annual Technology Media & Telecoms Conference Barcelona, November 17, 2011
Back-up
21 MARCO PATUANO
Morgan Stanley 11th Annual Technology Media & Telecoms Conference Barcelona, November 17, 2011
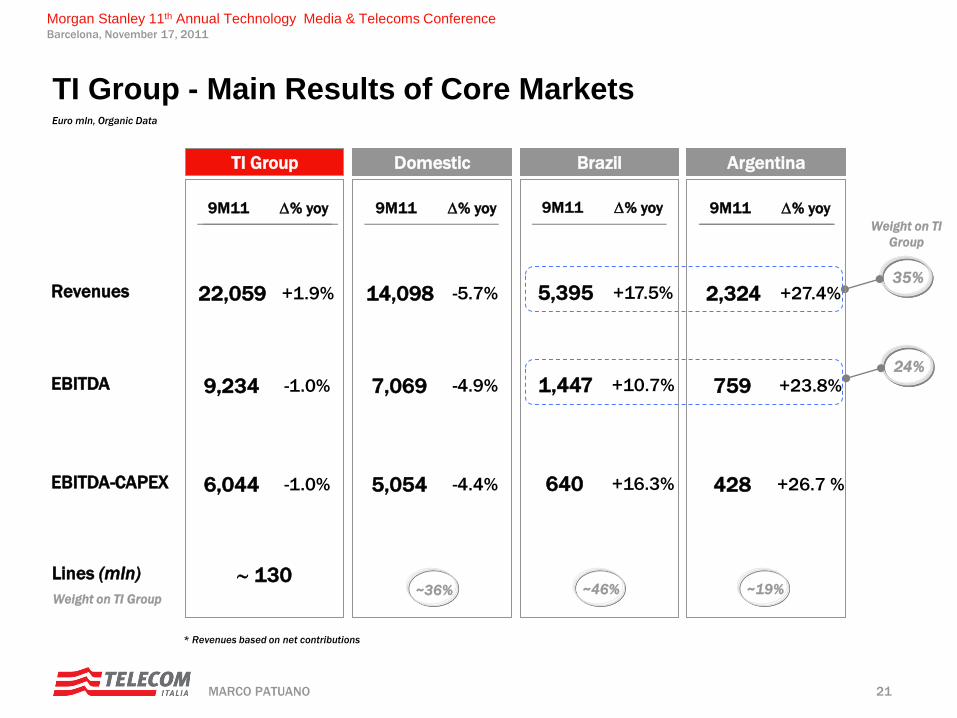
Revenues
EBITDA
EBITDA-CAPEX
* Revenues based on net contributions
35%
TI Group - Main Results of Core Markets Euro mln, Organic Data
Lines (mln)
Weight on TI Group
TI Group
9M11
22,059
9,234
6,044
D % yoy
+1.9%
-1.0%
-1.0%
130
9M11
5,395
1,447
640
D % yoy
+17.5%
+10.7%
+16.3%
Brazil
~46%
9M11
2,324
759
428
D % yoy
+27.4%
+23.8%
+26.7 %
Argentina
~19%
9M11
14,098
7,069
5,054
D % yoy
-5.7%
-4.9%
-4.4%
Domestic
~36%
Weight on TI
Group
24%
22 MARCO PATUANO
Morgan Stanley 11th Annual Technology Media & Telecoms Conference Barcelona, November 17, 2011
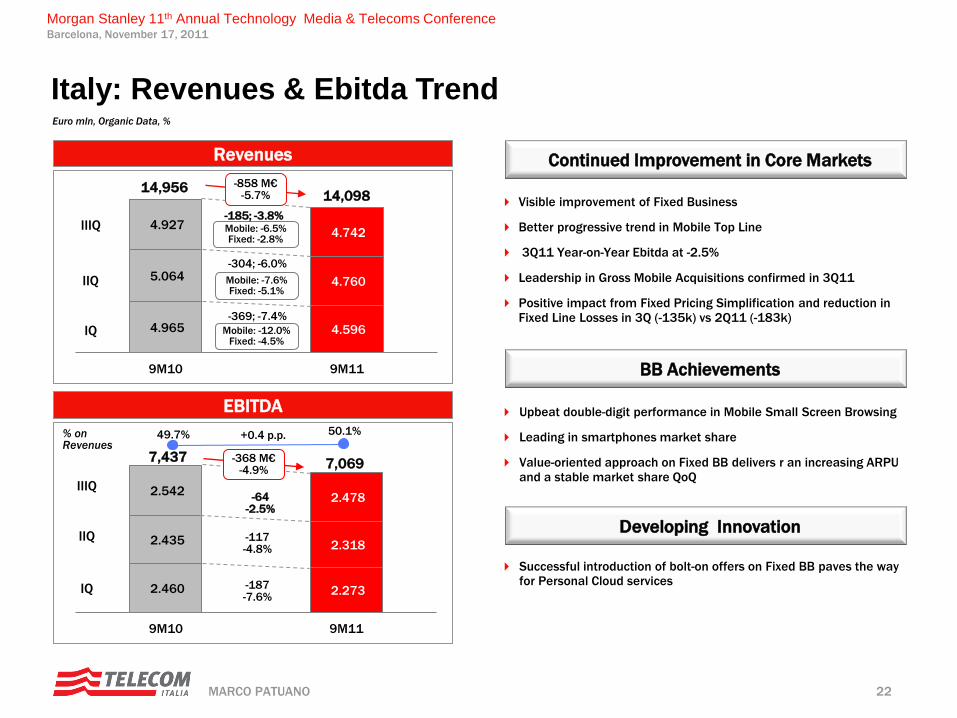
4.965 4.596
5.064 4.760
4.927 4.742
9M10 9M11
Mobile: -6.5% Fixed: -2.8%
-185; -3.8%
2.460 2.273
2.435 2.318
2.542 2.478
9M10 9M11
-64 -2.5%
7,437
Euro mln, Organic Data, %
-368 M€ -4.9%
-369; -7.4%
-304; -6.0%
49.7% 50.1% +0.4 p.p.
7,069
Upbeat double-digit performance in Mobile Small Screen Browsing
Leading in smartphones market share
Value-oriented approach on Fixed BB delivers r an increasing ARPU and a stable market share QoQ
Visible improvement of Fixed Business
Better progressive trend in Mobile Top Line
3Q11 Year-on-Year Ebitda at -2.5%
Leadership in Gross Mobile Acquisitions confirmed in 3Q11
Positive impact from Fixed Pricing Simplification and reduction in Fixed Line Losses in 3Q (-135k) vs 2Q11 (-183k)
-117 -4.8%
-187 -7.6%
Mobile: -7.6% Fixed: -5.1%
Mobile: -12.0% Fixed: -4.5%
Revenues
EBITDA
Developing Innovation
BB Achievements
Continued Improvement in Core Markets
Successful introduction of bolt-on offers on Fixed BB paves the way for Personal Cloud services
Italy: Revenues & Ebitda Trend
% on Revenues
IIQ
IQ
IIIQ
-858 M€ -5.7%
14,956 14,098
IIQ
IQ
IIIQ
23 MARCO PATUANO
Morgan Stanley 11th Annual Technology Media & Telecoms Conference Barcelona, November 17, 2011
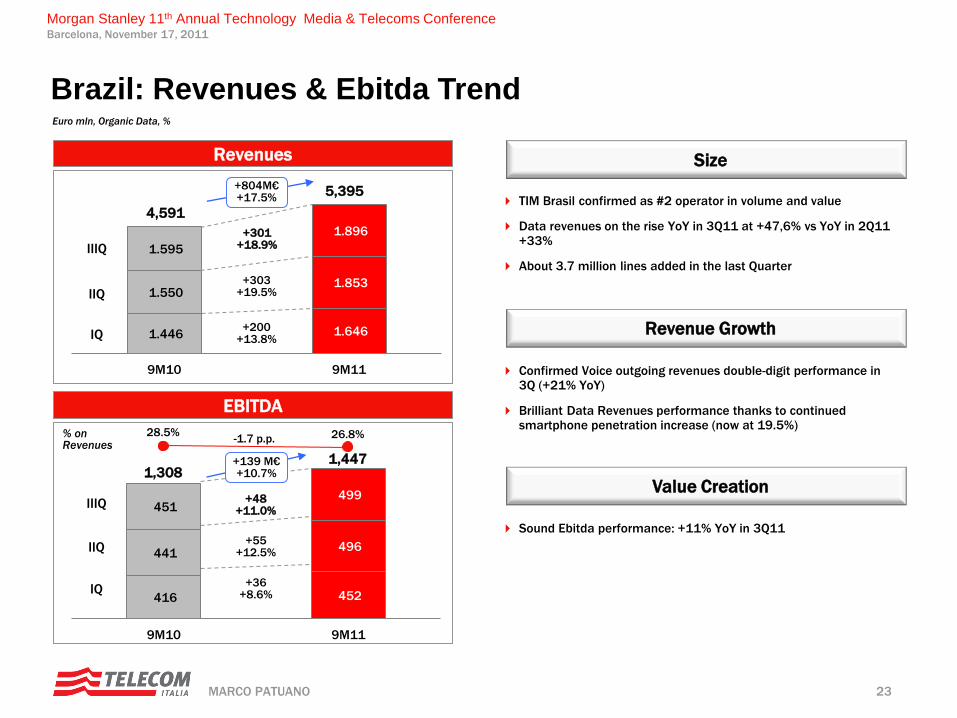
416 452
441 496
451 499
9M10 9M11
1.446 1.646
1.550 1.853
1.595
1.896
9M10 9M11
+301 +18.9%
Euro mln, Organic Data, %
Revenues
EBITDA
Brazil: Revenues & Ebitda Trend
+804M€ +17.5%
+303 +19.5%
+200 +13.8%
4,591
5,395
IIQ
IQ
IIIQ
+55 +12.5%
+36 +8.6%
1,308 1,447
-1.7 p.p. 26.8%
+48 +11.0%
+139 M€ +10.7%
28.5%
IIQ
IQ
IIIQ
% on Revenues
Value Creation
Revenue Growth
Size
TIM Brasil confirmed as #2 operator in volume and value
Data revenues on the rise YoY in 3Q11 at +47,6% vs YoY in 2Q11 +33%
About 3.7 million lines added in the last Quarter
Sound Ebitda performance: +11% YoY in 3Q11
Confirmed Voice outgoing revenues double-digit performance in 3Q (+21% YoY)
Brilliant Data Revenues performance thanks to continued smartphone penetration increase (now at 19.5%)
24 MARCO PATUANO
Morgan Stanley 11th Annual Technology Media & Telecoms Conference Barcelona, November 17, 2011
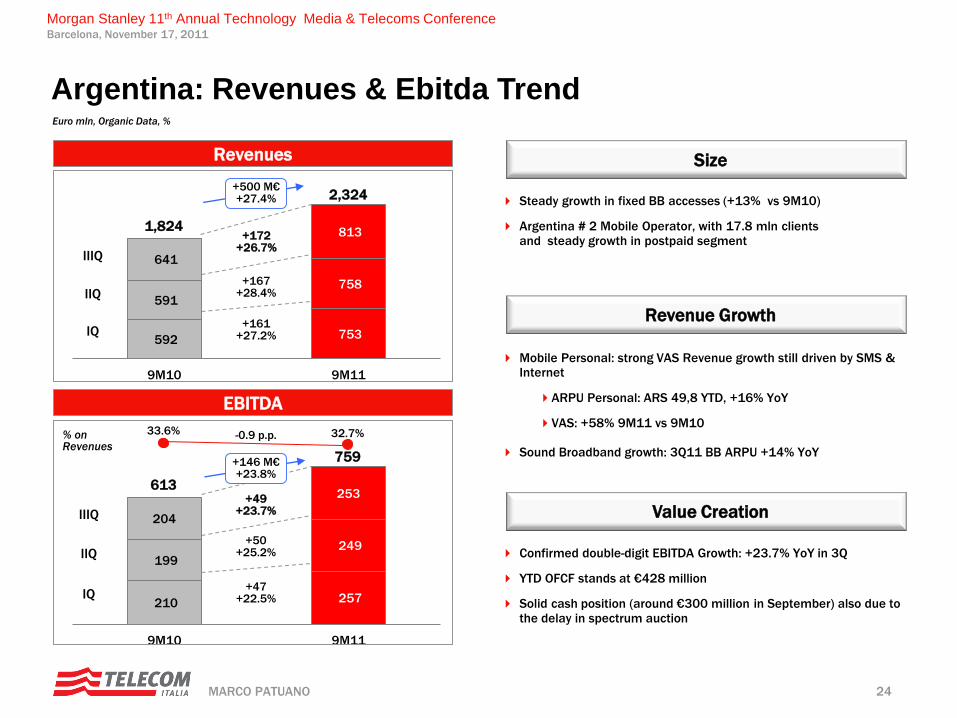
210 257
199
249
204
253
9M10 9M11
+49 +23.7%
592 753
591
758
641
813
9M10 9M11
+172 +26.7%
Euro mln, Organic Data, %
Revenues
EBITDA
Argentina: Revenues & Ebitda Trend
% on Revenues
Value Creation
Revenue Growth
Size
Mobile Personal: strong VAS Revenue growth still driven by SMS & Internet
ARPU Personal: ARS 49,8 YTD, +16% YoY
VAS: +58% 9M11 vs 9M10
Sound Broadband growth: 3Q11 BB ARPU +14% YoY
Confirmed double-digit EBITDA Growth: +23.7% YoY in 3Q
YTD OFCF stands at €428 million
Solid cash position (around €300 million in September) also due to the delay in spectrum auction
Steady growth in fixed BB accesses (+13% vs 9M10)
Argentina # 2 Mobile Operator, with 17.8 mln clients and steady growth in postpaid segment
+500 M€ +27.4%
+146 M€ +23.8%
+50 +25.2%
+47 +22.5%
613
759
33.6% -0.9 p.p. 32.7%
+167 +28.4%
+161 +27.2%
1,824
2,324
IIQ
IQ
IIIQ
IIQ
IQ
IIIQ
25 MARCO PATUANO
Morgan Stanley 11th Annual Technology Media & Telecoms Conference Barcelona, November 17, 2011
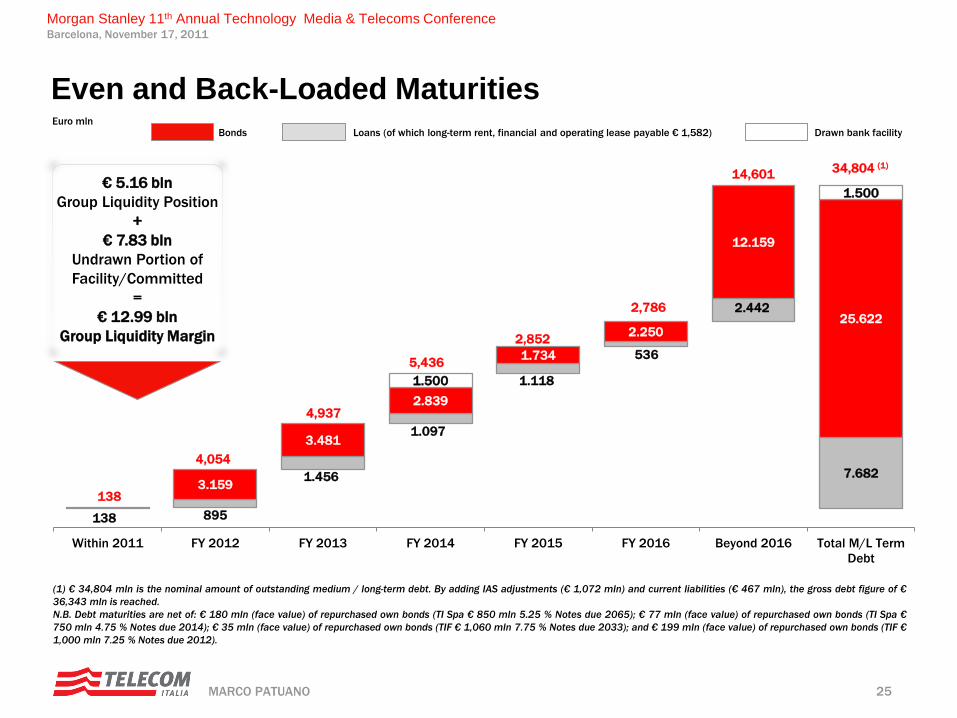
138 895
1.456
1.097
1.118
536
2.442
7.682 3.159
3.481
2.839
1.734
2.250
12.159
25.622
1.500
1.500
Within 2011 FY 2012 FY 2013 FY 2014 FY 2015 FY 2016 Beyond 2016 Total M/L Term
Debt
4,054
4,937
5,436
2,852
2,786
14,601 34,804 (1)
Bonds Loans (of which long-term rent, financial and operating lease payable € 1,582) Drawn bank facility
Even and Back-Loaded Maturities Euro mln
€ 5.16 bln
Group Liquidity Position
+
€ 7.83 bln
Undrawn Portion of
Facility/Committed
=
€ 12.99 bln
Group Liquidity Margin
138
(1) € 34,804 mln is the nominal amount of outstanding medium / long-term debt. By adding IAS adjustments (€ 1,072 mln) and current liabilities (€ 467 mln), the gross debt figure of €
36,343 mln is reached.
N.B. Debt maturities are net of: € 180 mln (face value) of repurchased own bonds (TI Spa € 850 mln 5.25 % Notes due 2065); € 77 mln (face value) of repurchased own bonds (TI Spa €
750 mln 4.75 % Notes due 2014); € 35 mln (face value) of repurchased own bonds (TIF € 1,060 mln 7.75 % Notes due 2033); and € 199 mln (face value) of repurchased own bonds (TIF €
1,000 mln 7.25 % Notes due 2012).
26 MARCO PATUANO
Morgan Stanley 11th Annual Technology Media & Telecoms Conference Barcelona, November 17, 2011
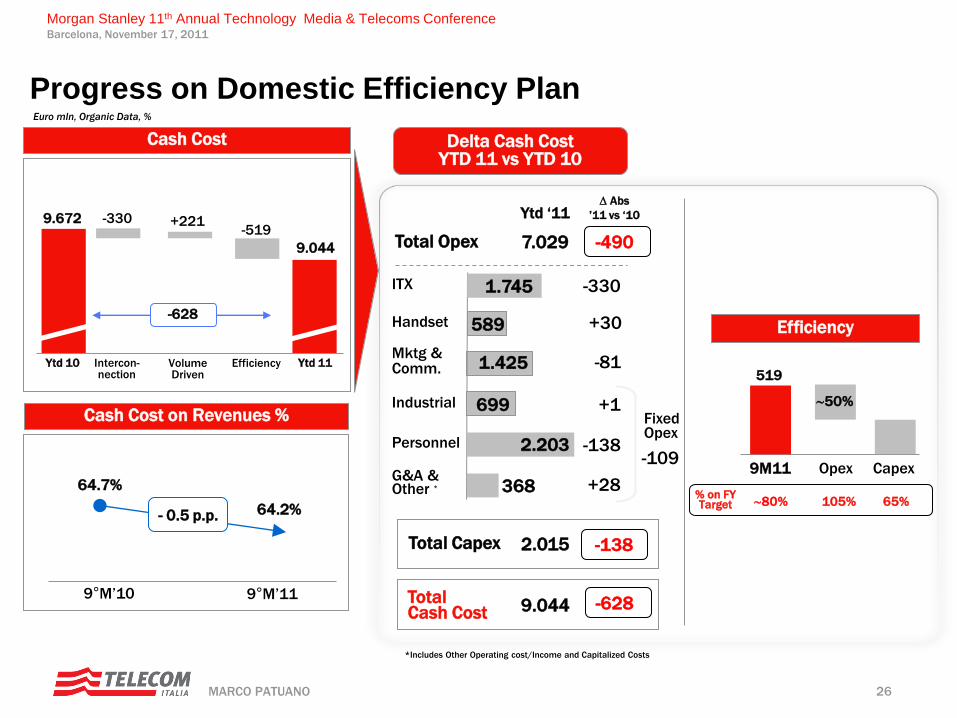
Progress on Domestic Efficiency Plan Euro mln, Organic Data, %
D Abs
’11 vs ‘10 Ytd ‘11
-330
2.015 Total Capex
1.425
699
-81
2.203
+1
-138
+28
7.029 Total Opex -490
1.745
Delta Cash Cost YTD 11 vs YTD 10
Industrial
Personnel
Mktg & Comm.
ITX
G&A & Other * 368
Cash Cost
Efficiency Volume Driven
-330 9.672
-628
-519
Intercon- nection
Ytd 10 Ytd 11
9.044
+221
Cash Cost on Revenues %
9°M’10 9°M’11 9.044
64.7%
64.2% - 0.5 p.p.
*Includes Other Operating cost/Income and Capitalized Costs
-628 Total Cash Cost
589 +30 Handset Efficiency
Fixed Opex
-109 9M11
519
Opex
50%
Capex
% on FY Target 80% 105% 65%
-138
27 MARCO PATUANO
Morgan Stanley 11th Annual Technology Media & Telecoms Conference Barcelona, November 17, 2011
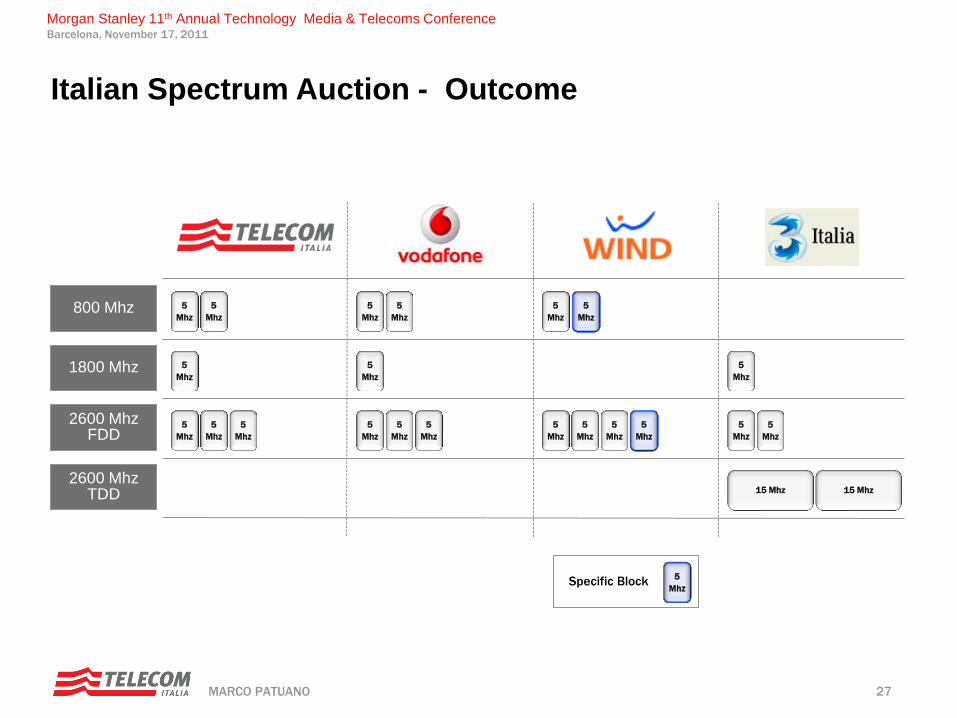
5
Mhz
Italian Spectrum Auction - Outcome
800 Mhz 5
Mhz
5
Mhz
5
Mhz
5
Mhz
5
Mhz
5
Mhz
1800 Mhz 5
Mhz
5
Mhz
5
Mhz
2600 Mhz FDD
5
Mhz
5
Mhz
5
Mhz
5
Mhz
5
Mhz
5
Mhz
5
Mhz
5
Mhz
5
Mhz
5
Mhz
5
Mhz
2600 Mhz TDD 15 Mhz 15 Mhz
Specific Block 5
Mhz
28 MARCO PATUANO
Morgan Stanley 11th Annual Technology Media & Telecoms Conference Barcelona, November 17, 2011
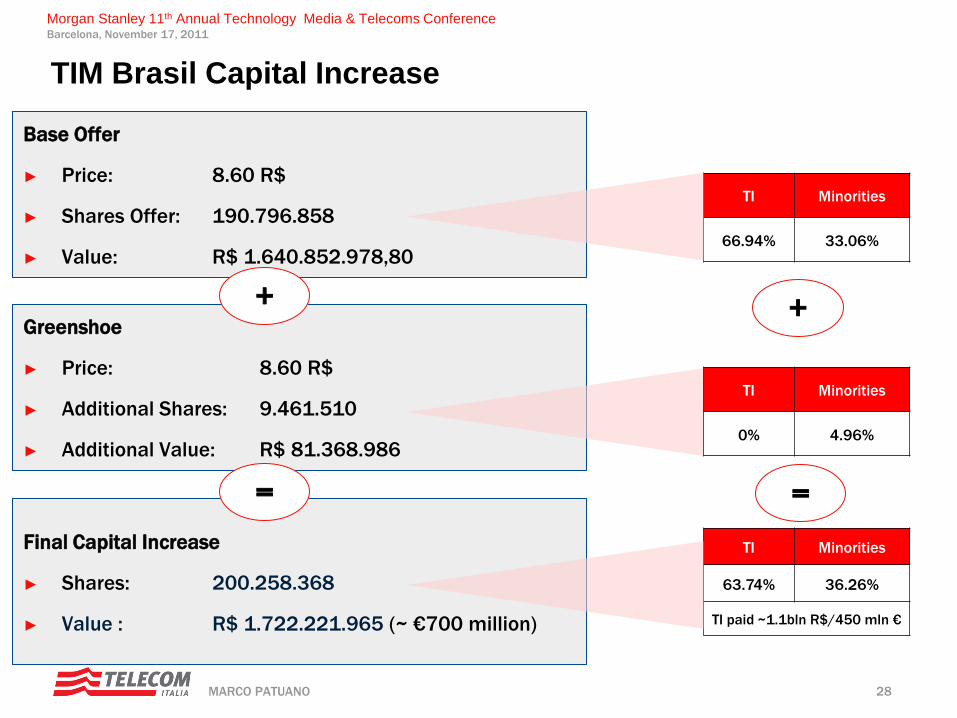
TIM Brasil Capital Increase
Base Offer
► Price: 8.60 R$
► Shares Offer: 190.796.858
► Value: R$ 1.640.852.978,80
Greenshoe
► Price: 8.60 R$
► Additional Shares: 9.461.510
► Additional Value: R$ 81.368.986
Final Capital Increase
► Shares: 200.258.368
► Value : R$ 1.722.221.965 (~ €700 million)
+
=
TI Minorities
66.94% 33.06%
+
=
TI Minorities
63.74% 36.26%
TI paid ~1.1bln R$/450 mln €
TI Minorities
0% 4.96%
29 MARCO PATUANO
Morgan Stanley 11th Annual Technology Media & Telecoms Conference Barcelona, November 17, 2011
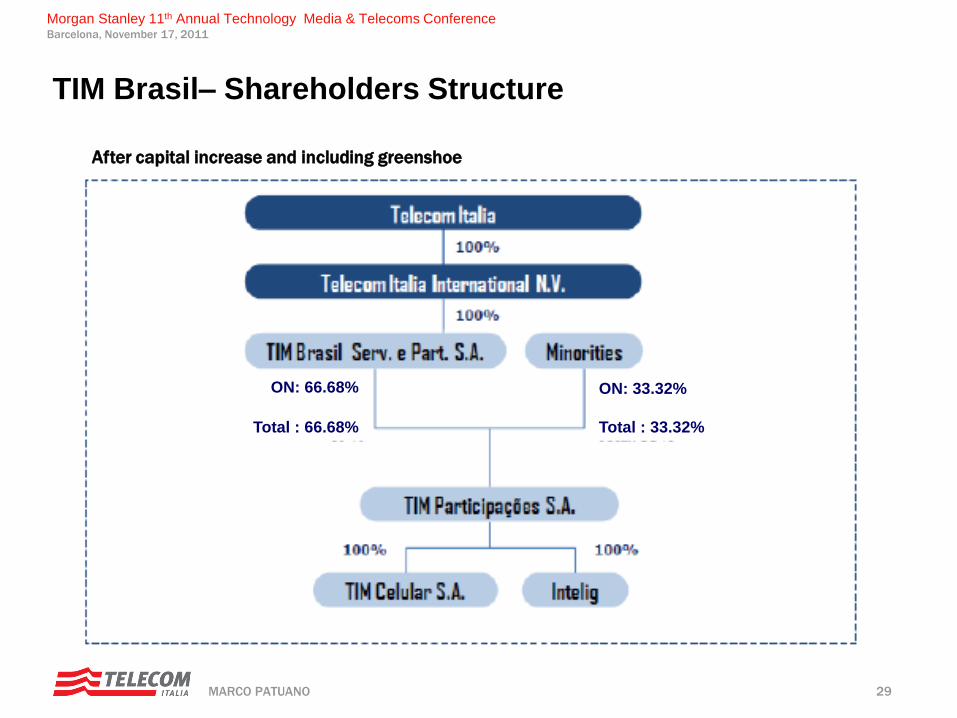
TIM Brasil– Shareholders Structure
After capital increase and including greenshoe
ON: 66.68%
Total : 66.68%
ON: 33.32%
Total : 33.32%
30 MARCO PATUANO
Morgan Stanley 11th Annual Technology Media & Telecoms Conference Barcelona, November 17, 2011
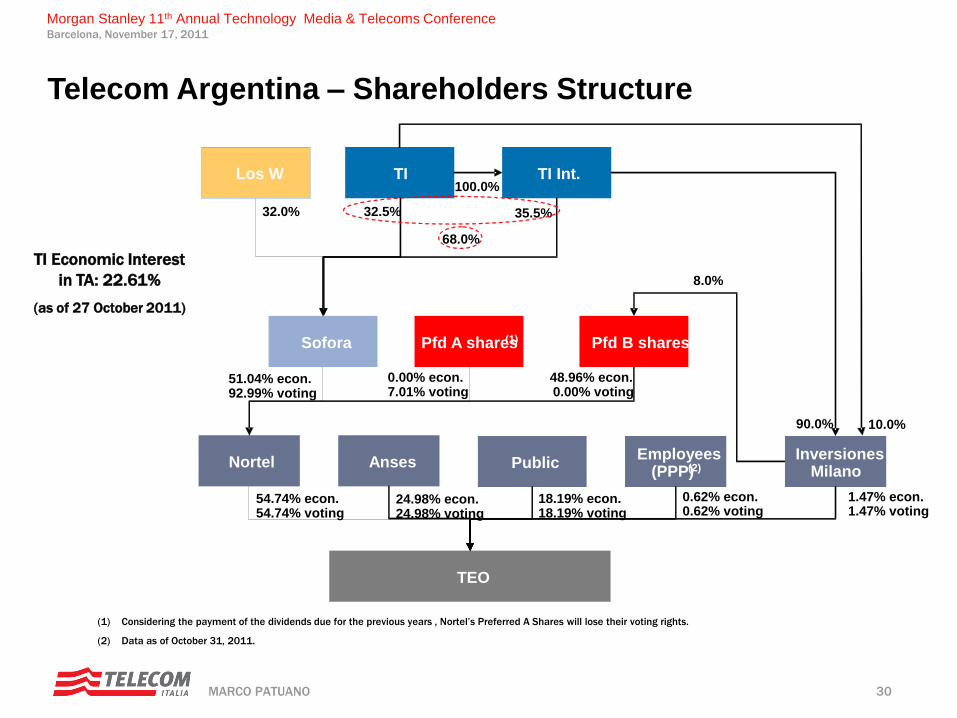
(1) Considering the payment of the dividends due for the previous years , Nortel’s Preferred A Shares will lose their voting rights.
(2) Data as of October 31, 2011.
54.74% econ. 54.74% voting
Los W
Nortel
Sofora
TI
Pfd A shares (1) Pfd B shares
Public
32.0% 32.5%
51.04% econ. 92.99% voting
0.00% econ. 7.01% voting
48.96% econ. 0.00% voting
TEO
Employees (PPP) (2)
18.19% econ. 18.19% voting
0.62% econ. 0.62% voting
8.0%
TI Int. 100.0%
35.5%
68.0%
Anses
24.98% econ. 24.98% voting
Inversiones Milano
1.47% econ. 1.47% voting
90.0% 10.0%
TI Economic Interest
in TA: 22.61%
(as of 27 October 2011)
Telecom Argentina – Shareholders Structure