telecom insider report - ap1inc.com - sp.pdf · ftth/b, lte, and other broadband technologies and...
TRANSCRIPT
© 2014 Pyramid Research | FTTH/B Deployments in APAC
November 2014
Report price: $3,495.00
SAMPLE PAGES: FTTH/B Deployments in Asia Pacific: Keys to Enhancing Service Availability, Proposition and Uptake
Malcolm Rogers | Analyst
Ozgur Aytar | Research Director
© 2014 Pyramid Research | FTTH/B Deployments in APAC 2
‘FTTH/B Deployments in Asia Pacific: Keys to Enhancing Service Availability, Proposition and Uptake,’ a Research Report by Pyramid Research, analyzes last-mile technology adoption trends and network deployment strategies, investments, stakeholders and best practices in the Asia Pacific region. The report also explores FTTH/B service positioning and pricing strategies as well as adoption and revenue trends across the region’s diverse market environment, taking into consideration the impact of LTE availability on FTTH/B network investments. The report includes case studies of Australia’s NBN and its wholesale partners, China Telecom, Korean incumbent KT and Telekom Malaysia.
Summary
© 2014 Pyramid Research | FTTH/B Deployments in APAC 3
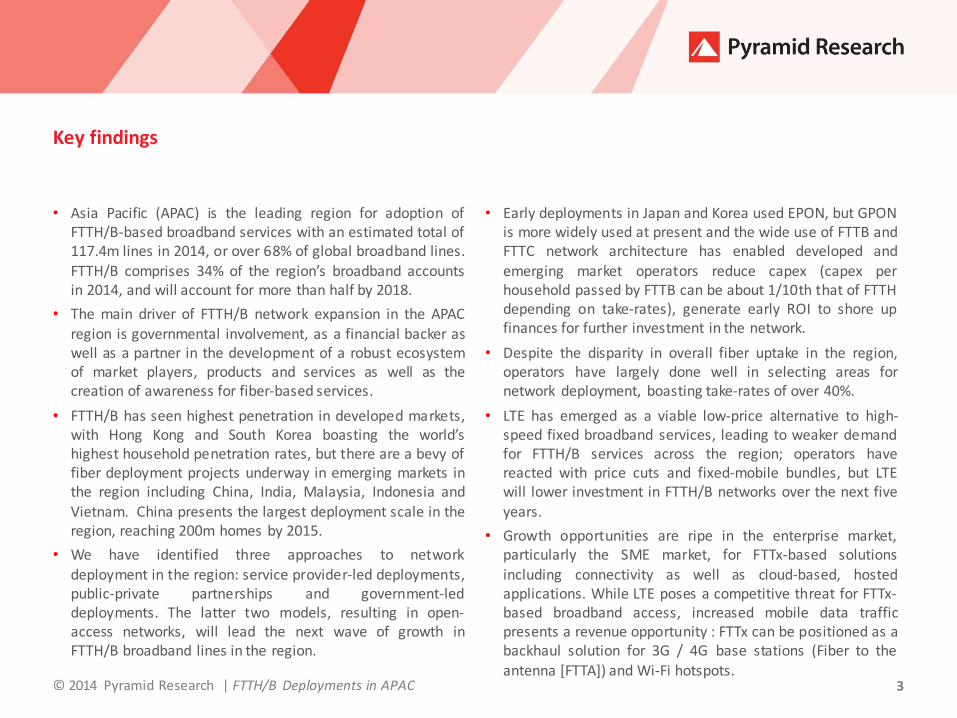
• Asia Pacific (APAC) is the leading region for adoption of FTTH/B-based broadband services with an estimated total of 117.4m lines in 2014, or over 68% of global broadband lines. FTTH/B comprises 34% of the region’s broadband accounts in 2014, and will account for more than half by 2018.
• The main driver of FTTH/B network expansion in the APAC region is governmental involvement, as a financial backer as well as a partner in the development of a robust ecosystem of market players, products and services as well as the creation of awareness for fiber-based services.
• FTTH/B has seen highest penetration in developed markets, with Hong Kong and South Korea boasting the world’s highest household penetration rates, but there are a bevy of fiber deployment projects underway in emerging markets in the region including China, India, Malaysia, Indonesia and Vietnam. China presents the largest deployment scale in the region, reaching 200m homes by 2015.
• We have identified three approaches to network deployment in the region: service provider-led deployments, public-private partnerships and government-led deployments. The latter two models, resulting in open-access networks, will lead the next wave of growth in FTTH/B broadband lines in the region.
• Early deployments in Japan and Korea used EPON, but GPON is more widely used at present and the wide use of FTTB and FTTC network architecture has enabled developed and emerging market operators reduce capex (capex per household passed by FTTB can be about 1/10th that of FTTH depending on take-rates), generate early ROI to shore up finances for further investment in the network.
• Despite the disparity in overall fiber uptake in the region, operators have largely done well in selecting areas for network deployment, boasting take-rates of over 40%.
• LTE has emerged as a viable low-price alternative to high-speed fixed broadband services, leading to weaker demand for FTTH/B services across the region; operators have reacted with price cuts and fixed-mobile bundles, but LTE will lower investment in FTTH/B networks over the next five years.
• Growth opportunities are ripe in the enterprise market, particularly the SME market, for FTTx-based solutions including connectivity as well as cloud-based, hosted applications. While LTE poses a competitive threat for FTTx-based broadband access, increased mobile data traffic presents a revenue opportunity : FTTx can be positioned as a backhaul solution for 3G / 4G base stations (Fiber to the antenna [FTTA]) and Wi-Fi hotspots.
Key findings

© 2014 Pyramid Research | FTTH/B Deployments in APAC 4
The ‘FTTH/B Deployments in Asia Pacific: Keys to Enhancing Service Availability, Proposition and Uptake’ report comprises network deployment model analysis, market sizing and demand analysis and trend analysis for networks based on the FTTx technologies in the Asia Pacific region as well as detailed case studies. Insights and data are derived through a mix of desk-based secondary research, primary research as well as quantitative modeling for sizing market opportunity.
The market sizing and demand analysis was derived from Pyramid Research’s Fixed Communications Forecast product. These forecasts are developed using a bottom-up methodology, building up from operator level to country-, regional- and global-level demand for fixed services, including fiber broadband, VoIP and IPTV. Pyramid’s forecasting methodology combines secondary and primary research, with international benchmarking and quantitative modeling in order to present a complete picture of the socio-demographic, competitive and demand trends affecting the adoption of fixed communications services. Primary research involves in-depth interviews with market players, and the secondary research effort includes obtaining relevant data and intelligence through publicly available sources, regulatory authority publications, trade associations, specialist databases and company financial reports, presentations and press releases.
Report methodology
© 2014 Pyramid Research | FTTH/B Deployments in APAC 5
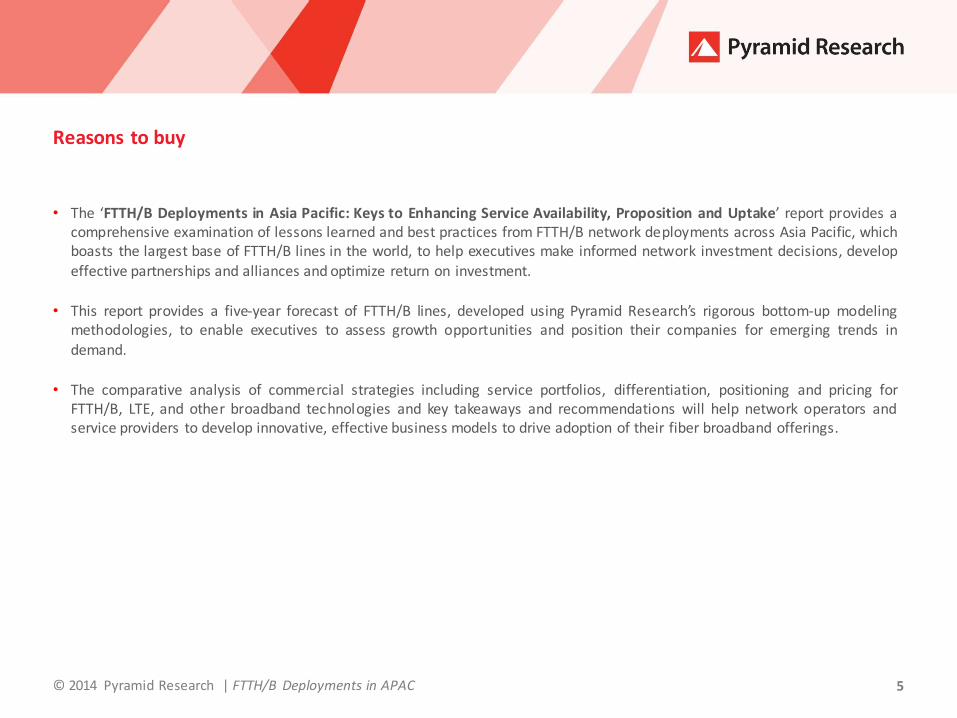
• The ‘FTTH/B Deployments in Asia Pacific: Keys to Enhancing Service Availability, Proposition and Uptake’ report provides a comprehensive examination of lessons learned and best practices from FTTH/B network deployments across Asia Pacific, which boasts the largest base of FTTH/B lines in the world, to help executives make informed network investment decisions, develop effective partnerships and alliances and optimize return on investment.
• This report provides a five-year forecast of FTTH/B lines, developed using Pyramid Research’s rigorous bottom-up modeling methodologies, to enable executives to assess growth opportunities and position their companies for emerging trends in
demand.
• The comparative analysis of commercial strategies including service portfolios, differentiation, positioning and pricing for FTTH/B, LTE, and other broadband technologies and key takeaways and recommendations will help network operators and service providers to develop innovative, effective business models to drive adoption of their fiber broadband offerings.
Reasons to buy
© 2014 Pyramid Research | FTTH/B Deployments in APAC 6
Table of contents 2 Table of exhibits 3 Executive summary 5 Introduction: Global and regional fiber market context FTTH/B market size worldwide 9 FTTH/B in the APAC region 10 Report scope and overview 12 Section 1: Network deployment and investment trends Network deployments across the region 14 Last-mile technology trends 16 Network investment levels 17 Network deployment models and best practices 21 Network deployment timing, location and scale 23 Section 2: Services, pricing and performance Service differentiation strategies 25 Broadband access services and bandwidth trends 26 Fiber-based services and applications beyond broadband access 27 Fiber broadband prices and operator strategies 31 Comparative analysis of fiber broadband ARPL 33 Service adoption trends and growth drivers 34 LTE impact on FTTH/B adoption rates 36 Section 3: Network operator and service provider case studies Australia: NBN Co 41 China: China Telecom 46 Malaysia: Telekom Malaysia 50 South Korea: KT Corp 54
Section 4: Key findings and recommendations 59 Appendices Companies mentioned 65 Sources and related research 66 About Pyramid Research 67
SECTION PAGE
Table of contents
SECTION PAGE
© 2014 Pyramid Research | FTTH/B Deployments in APAC 7
Exhibit 1: Fiber accounts and 2014 growth by region 9 Exhibit 2: Breakdown of global broadband lines, 2014 9 Exhibit 3: Broadband lines and FTTH/B share, Asia Pacific 10 Exhibit 4: FTTH/B lines household penetration 10 Exhibit 5: Drivers for FTTx deployments 11 Exhibit 6: A selection of FTTx network deployment projects across the Asia Pacific region 14 Exhibit 7: FTTH network operators in emerging Asia 15 Exhibit 8: FTTH/B/P/C network architecture 16 Exhibit 9: Government investments in FTTx projects 17 Exhibit 10: Targeted urban centers in Phase 1 18 Exhibit 11: Malaysian govt. Phase 2 capex by location and technology 19 Exhibit 12: NBN Australia capex, 2011-2014 20 Exhibit 13: Capex per FTTH/B household, NTT, HKBN, and TM 20 Exhibit 14: Fiber network business models matrix 21 Exhibit 15: Data traffic, 2013-2018 23 Exhibit 16: Emerging services ̶ from triple-play to multi-play 25 Exhibit 17: Maximum bandwidth offerings on FTTH/B networks, September 2014 26 Exhibit 18: Services delivered over FTTH/B by category 27 Exhibit 19: FTTH/B residential applications by bandwidth requirements 28 Exhibit 20: FTTH/B business applications by bandwidth requirement 29 Exhibit 21: Public services delivered over FTTx 30 Exhibit 22: PCCW’s broadband pricing by speed and technology 31 Exhibit 23: Iinet’s pricing per mbps 31 Exhibit 24: Average cost per megabyte per month fiber broadband by operator 32 Exhibit 25: Monthly ARPL, by service and country 33
Exhibit 26: Average LTE network speed by operator 33 Exhibit 27: FTTH/B share of total broadband accounts by country 34 Exhibit 28: % of FTTH/B homes passed that have signed up for service (take-rate) 35 Exhibit 29: LTE impact on fixed broadband 36 Exhibit 30: Net FTTH additions of NTT, 2011-2013 37 Exhibit 31: Fixed broadband net additions in South Korea, 2010-13 38 Exhibit 32: LGU+ fixed broadband subscriptions, 100mbps vs total, 2011–2013 38 Exhibit 33: CT mobile plans available for FTTH bundling 39 Exhibit 34: CT FTTH average monthly price, stand-alone vs. mobile bundle by speed band 39 Exhibit 35: Share of FTTH/B in total broadband lines in Australia, 2012-2019 41 Exhibit 36: NBN Co corporate capex plan 42 Exhibit 37: NBN Co wholesale pricing schedule 43 Exhibit 38: Telstra’s fiber service pricing schemes 44 Exhibit 39: Iinet’s fiber service pricing schemes 44 Exhibit40: Iinet and Telstra FTTH/B subscriptions, 2011-2014 45 Exhibit 41: Share of FTTH/B in total broadband lines in China, 2012-2019 46 Exhibit 42: China Telecom’s capex breakdown by category, 2013 47 Exhibit 43: China Telecom’s capex breakdown by category, 2014 47 Exhibit 44: China Telecom’s FTTH/B access pricing schedule 48 Exhibit 45: China Telecom’s FTTH/B subscriber l ines and market share, 2010-2014 49 Exhibit 46: Share of FTTH/B in total broadband lines in Malaysia, 2012-2019 50
EXHIBIT PAGE
Table of exhibits
EXHIBIT PAGE

© 2014 Pyramid Research | FTTH/B Deployments in APAC 8
Exhibit 47: TM’s total capex and share of capex toward high speed broadband, 2009-2013 51 Exhibit 48: TM’s fiber triple play pricing schedule 52 Exhibit 49: TM’s FTTH/B subscriber l ines and revenue, 2010-2014 53 Exhibit 50: Share of FTTH/B in total broadband lines in South Korea, 2012-2019 54 Exhibit 51: KT’s FTTx network rollout plan 55 Exhibit 52: KT’s fixed network capex 55 Exhibit 53: KT’s broadband access pricing schemes 56 Exhibit 54: KT broadband accounts by connection speed & % of total accounts, 2011-2014 57
EXHIBIT PAGE
Table of exhibits
© 2014 Pyramid Research | FTTH/B Deployments in APAC 9
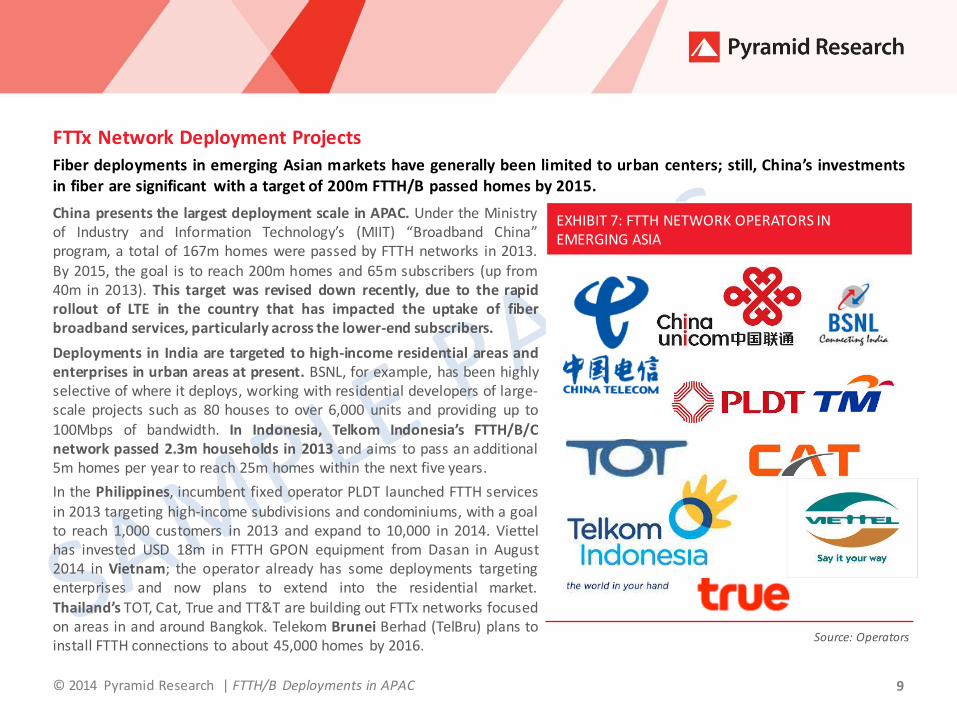
EXHIBIT 7: FTTH NETWORK OPERATORS IN EMERGING ASIA
China presents the largest deployment scale in APAC. Under the Ministry of Industry and Information Technology’s (MIIT) “Broadband China” program, a total of 167m homes were passed by FTTH networks in 2013. By 2015, the goal is to reach 200m homes and 65m subscribers (up from 40m in 2013). This target was revised down recently, due to the rapid rollout of LTE in the country that has impacted the uptake of fiber broadband services, particularly across the lower-end subscribers.
Deployments in India are targeted to high-income residential areas and enterprises in urban areas at present. BSNL, for example, has been highly selective of where it deploys, working with residential developers of large-scale projects such as 80 houses to over 6,000 units and providing up to 100Mbps of bandwidth. In Indonesia, Telkom Indonesia’s FTTH/B/C network passed 2.3m households in 2013 and aims to pass an additional 5m homes per year to reach 25m homes within the next five years.
In the Philippines, incumbent fixed operator PLDT launched FTTH services in 2013 targeting high-income subdivisions and condominiums, with a goal to reach 1,000 customers in 2013 and expand to 10,000 in 2014. Viettel has invested USD 18m in FTTH GPON equipment from Dasan in August 2014 in Vietnam; the operator already has some deployments targeting enterprises and now plans to extend into the residential market. Thailand’s TOT, Cat, True and TT&T are building out FTTx networks focused on areas in and around Bangkok. Telekom Brunei Berhad (TelBru) plans to install FTTH connections to about 45,000 homes by 2016.
FTTx Network Deployment Projects
Fiber deployments in emerging Asian markets have generally been limited to urban centers; still, China’s investments in fiber are significant with a target of 200m FTTH/B passed homes by 2015.
Source: Operators
© 2014 Pyramid Research | FTTH/B Deployments in APAC 10
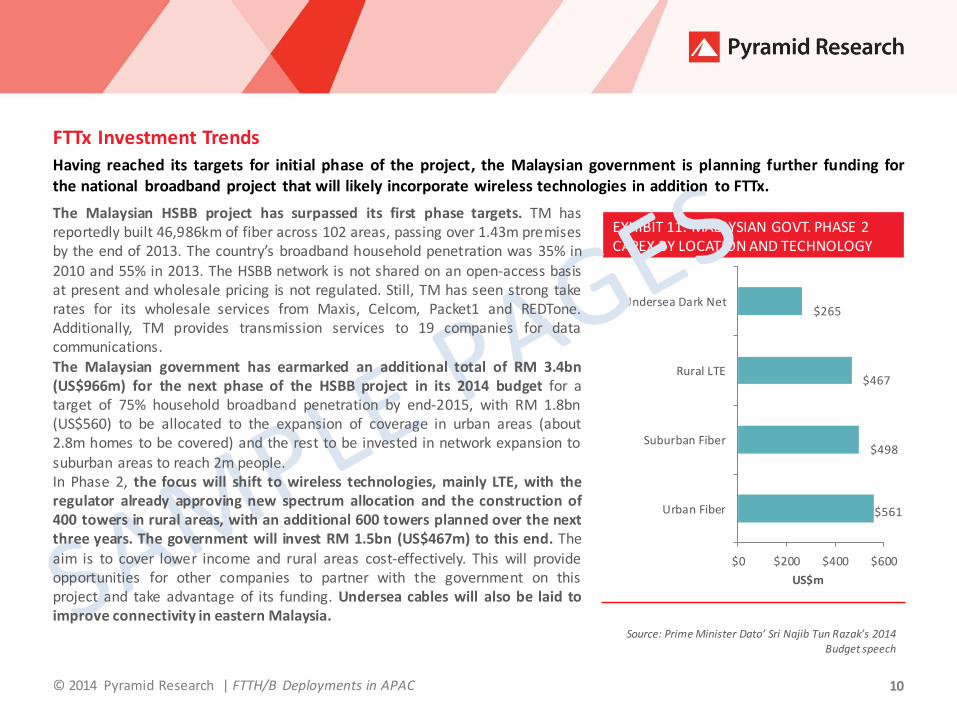
EXHIBIT 11: MALAYSIAN GOVT. PHASE 2 CAPEX BY LOCATION AND TECHNOLOGY
$561
$498
$467
$265
$0 $200 $400 $600
Urban Fiber
Suburban Fiber
Rural LTE
Undersea Dark Net
US$m
The Malaysian HSBB project has surpassed its first phase targets. TM has reportedly built 46,986km of fiber across 102 areas, passing over 1.43m premises by the end of 2013. The country’s broadband household penetration was 35% in 2010 and 55% in 2013. The HSBB network is not shared on an open-access basis at present and wholesale pricing is not regulated. Still, TM has seen strong take rates for its wholesale services from Maxis, Celcom, Packet1 and REDTone. Additionally, TM provides transmission services to 19 companies for data communications. The Malaysian government has earmarked an additional total of RM 3.4bn (US$966m) for the next phase of the HSBB project in its 2014 budget for a target of 75% household broadband penetration by end-2015, with RM 1.8bn (US$560) to be allocated to the expansion of coverage in urban areas (about 2.8m homes to be covered) and the rest to be invested in network expansion to suburban areas to reach 2m people. In Phase 2, the focus will shift to wireless technologies, mainly LTE, with the regulator already approving new spectrum allocation and the construction of 400 towers in rural areas, with an additional 600 towers planned over the next three years. The government will invest RM 1.5bn (US$467m) to this end. The aim is to cover lower income and rural areas cost-effectively. This will provide opportunities for other companies to partner with the government on this project and take advantage of its funding. Undersea cables will also be laid to improve connectivity in eastern Malaysia.
FTTx Investment Trends
Having reached its targets for initial phase of the project, the Malaysian government is planning further funding for the national broadband project that will likely incorporate wireless technologies in addition to FTTx.
Source: Prime Minister Dato’ Sri Najib Tun Razak’s 2014 Budget speech

© 2014 Pyramid Research | FTTH/B Deployments in APAC 11
EXHIBIT 28: % of FTTH/B HOMES PASSED THAT HAVE SIGNED UP FOR SERVICE (TAKE-RATE)
Across APAC, a mix of high deployment costs, resulting in higher service pricing, along with regulatory issues and geographical limitations are key inhibitors of network availability and adoption. Take, for example, the difference in the pace of deployment in Malaysia and Australia: While rollouts began in 2008 in both countries, NBN passed under 5% of Australian homes in the first five years as compared to Malaysia’s TM that passed 13% of the country’s households within 24 months, partly due to the significant difference in the geographical size of the countries. As for regulatory issues, Hong Kong’s HKBN, like many of its peers, identify right of way (RoW) as a significant issue for network deployment. The operator claims that the building management offices (BMOs) in Hong Kong are not always aligned with customer demand for more bandwidth and the approval process for laying fiber in buildings can be very long, entailing the education of BMOs on the promise of fiber. Many in the industry believe that governments should legislate building codes to accelerate the deployment of fiber in multi-tenant buildings as well as new developments.
Another important limitation impacting service pricing and adoption, particularly in emerging markets, is the ecosystem and the pool of skilled workforce. In Indonesia, for example, Telkom stated that a
Service Adoption Trends and Growth Drivers Targeted deployments, the development of a robust ecosystem and timely resolution of regulatory issues are key to driving strong uptake and improving return on invested capital.
Source: Pyramid Research, Operators
44%
42%
44% 43%
40%41%42%43%44%45%
Sin
gap
ore
Nex
tGe
n
NB
N
Ch
ina
Tel
eco
m
Au
stra
lia
NB
N
Tel
eko
mM
ala
ysia
% T
ake
-ra
te
lack of a robust ecosystem of suppliers and partners has made the FTTH deployment project more challenging, impacting the level of return on invested capital (ROIC).
Despite the disparity in overall fiber uptake, operators have done well in cherry-picking areas for network deployment. In Australia, where fiber subscriptions only make up 4% of total broadband accounts, about 44% of homes passed by FTTH/B have signed up for the service. TM has an impressive 47% take-rate. CT at 42% take-rate plans to slow its network expansion to focus on driving demand.
© 2014 Pyramid Research | FTTH/B Deployments in APAC 12
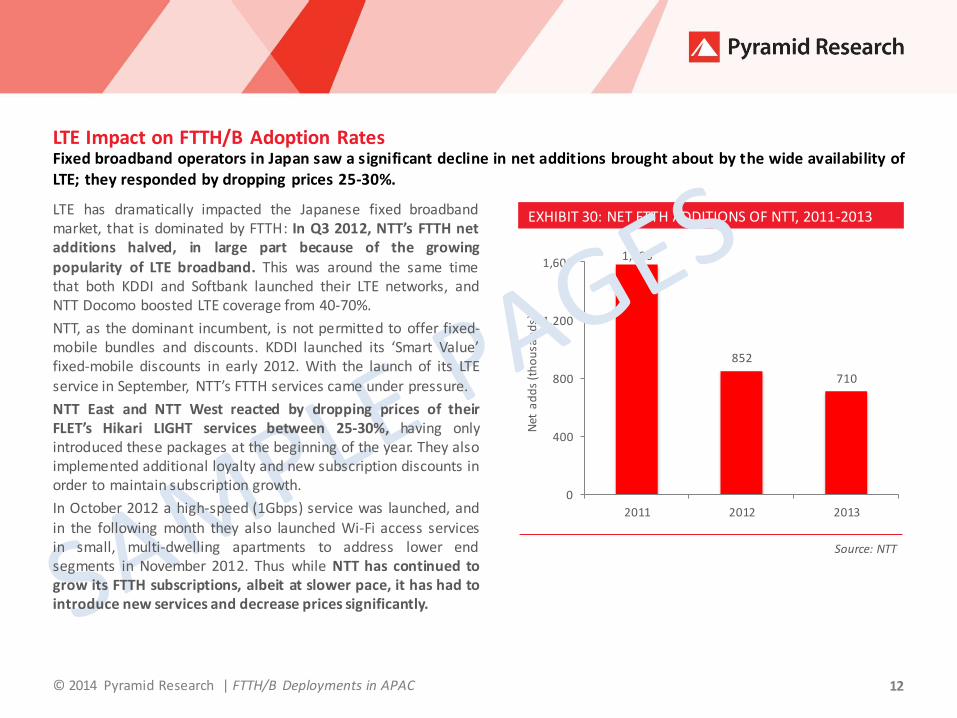
EXHIBIT 30: NET FTTH ADDITIONS OF NTT, 2011-2013
1,586
852
710
0
400
800
1,200
1,600
2011 2012 2013
Net
ad
ds
(th
ou
san
ds)
LTE has dramatically impacted the Japanese fixed broadband market, that is dominated by FTTH: In Q3 2012, NTT’s FTTH net additions halved, in large part because of the growing popularity of LTE broadband. This was around the same time that both KDDI and Softbank launched their LTE networks, and NTT Docomo boosted LTE coverage from 40-70%.
NTT, as the dominant incumbent, is not permitted to offer fixed-mobile bundles and discounts. KDDI launched its ‘Smart Value’ fixed-mobile discounts in early 2012. With the launch of its LTE service in September, NTT’s FTTH services came under pressure.
NTT East and NTT West reacted by dropping prices of their FLET’s Hikari LIGHT services between 25-30%, having only introduced these packages at the beginning of the year. They also implemented additional loyalty and new subscription discounts in order to maintain subscription growth.
In October 2012 a high-speed (1Gbps) service was launched, and
in the following month they also launched Wi-Fi access services in small, multi-dwelling apartments to address lower end segments in November 2012. Thus while NTT has continued to grow its FTTH subscriptions, albeit at slower pace, it has had to introduce new services and decrease prices significantly.
LTE Impact on FTTH/B Adoption Rates Fixed broadband operators in Japan saw a significant decline in net additions brought about by the wide availability of LTE; they responded by dropping prices 25-30%.
Source: NTT
© 2014 Pyramid Research | FTTH/B Deployments in APAC 13
3 BSNL CAT Celcom China Telecom China Unicom Chorus Chunghwa Telecom Dasan Google HKBN IBM i iNet KDDI Korea Telecom LG U+ M1 Maxis NBN Co. NTT OpenNet
Packet 1 PCCW PLDT RedTone Singtel SK Telecom Softbank Starhub Taiwan Mobile Telekom Brunei Telekom Indonesia Telekom Malaysia Telstra ToT TRUE TT&T Viettel
Companies mentioned

© 2014 Pyramid Research | FTTH/B Deployments in APAC 14
Sources and related research
Fixed Communications Forecast
Forecasts updated quarterly The Fixed Communications Forecast quantifies fixed voice, broadband by technology and IPTV adoption and service revenue trends, at the residential, corporate and total market levels. It tracks demand and projects future growth for 101 countries worldwide and is available at the country, regional and global levels.
LTE Business Models: Best Practices in Network Deployment, Positioning and Service Pricing Built around five detailed country case studies of markets where LTE networks have been launched, this Research Report examines LTE spectrum allocation and availability, network deployment considerations, product and pricing strategies and LTE adoption trends as well as drivers for market growth. Highlighting what works and what doesn't - based on the experience of commercial operators - this report uncovers the pain points and the keys to success for LTE service providers worldwide.
Capex Optimization Strategies: Operator Best Practices for LTE and FTTH Deployments
Capex optimization has become crucial to business survival for telecom operators, especially in saturated, highly competitive markets. This Insider presents a selection of 16 techniques for deploying LTE and FTTH in a capex-efficient way. They result from the application of the MASI framework, a methodology developed by Pyramid Research for generating ways of reducing capex, illustrated with examples of fiber and mobile broadband implementations from the Middle East and Africa as well as some developed-market players. Operators can use these best practices for controlled 4G and FTTH deployments.
FTTx in Latin America: Competition and Regulation Boost Growth
FTTx accounts are expected to grow at a 40% CAGR between 2013 and 2018 in Latin America. In this report, we examine the status and growth opportunity of fiber-based broadband in the region, highlighting key supply-push factors — regulation, competition and innovation — and demand-pull factors — consumer, enterprise demand and urbanization — driving the development of FTTx . The report is built around operator case studies including Iusacell in Mexico, TIM in Brazil and the fiber network-sharing initiative undertaken by Orange and Vodafone in Spain.
CLIENT CONFIDENTIAL
© 2014 Pyramid Research. All rights reserved. No material contained in this report may be reproduced in whole or in part without the prior written permission of the publisher. Neither the information nor the opinions expressed in the report should be construed as a recommendation for the purchase or sale of any security. The information contained in this report has been obtained from sources we believe to be reliable, but neither its completeness nor accuracy can be guaranteed. Opinions expressed are based on our interpretation of the available information and are subject to change.

© 2014 Pyramid Research | FTTH/B Deployments in APAC 15
About Pyramid Research
ADVISING LEADERS IN THE GLOBAL COMMUNICATIONS INDUSTRIES ON EMERGING MARKETS AND SERVICES OPPORTUNITIES
Pyramid Research (www.pyramidresearch.com) offers practical solutions to the complex demands our clients face in the global communications industry. Its analysis is uniquely positioned at the intersection of emerging markets, emerging technologies and emerging business models, powered by the bottom-up methodology of our market Forecasts for more than 100 countries — a distinction that has remained unmatched for more than 25 years.
HOW WE COVER COMMUNICATIONS MARKETS
Our highly structured analysis closely examines the performance,
technology trends, macroeconomic and regulatory environment, of service providers and equipment vendors in each of the more than 100 countries we cover. Using a bottom-up approach, we size market demand across services and countries, and conduct end-user surveys to validate adoption trends and anticipate shifts in demand. Our
commitment to intensive, direct interviewing of regulatory authorities, service providers and manufacturers — complemented with end-user data — ensures the most reliable portrait of every market we examine.
© 2014 Pyramid Research | FTTH/B Deployments in APAC
Meet us in person
PLEASE CONTACT PYRAMID RESEARCH AT:
Email: [email protected]
Email: [email protected]
Telephone: +44 (0) 20 7406 6608
PLEASE ENGAGE WITH US VIA:
@pyramidresearch OFFICE LOCATIONS:
EMEA, APAC John Carpenter House 7 Carmelite Street London, EC4Y 0BS United Kingdom Tel: +44 (0)20 7936 6530
16
To learn more about Pyramid Research’s product offerings and how they can be of service to your company, please contact [email protected] or visit us on the Web at www.pyramidresearch.com.
Latin America, North America 179 South St., Suite 200 Boston, MA 02111
USA Tel: +1 617 747 4100 Fax: +1 617 747 4133