sample pages - ap1inc.com - sp.pdf · global clothing & footwear retailing, 2014-2019 . market...
TRANSCRIPT
www.conlumino.com 1 www.conlumino.com 1
SAMPLE PAGES Global Clothing & Footwear Retailing, 2014-2019
Market Dynamics, Retail Trends and Competitive Landscape
Report Code: RT0345SR
Published: June 2015
Report Price: US$4,950 (Single Copy) for full report and US$1,950 for individual regions and global summary
no.com 2 2
The “Global Clothing & Footwear Retailing, 2014–2019” report, published by Conlumino, provides an analysis of current and forecast market data
of retail sales in the clothing and footwear categories across different channels globally. It also offers, clothing and footwear data by sub-categories
men, women and children. In addition, it highlights the largest and fastest growing markets for the category, identifying key trends influencing the
markets, with an emphasis on innovative retailers across different channels.
Summary
June 2015 RT0345SR
• Global clothing & footwear retail sales are forecast to surpass US$2.2
trillion by 2019, with major impetus from developing economies
• China is set to surpass the US as the world’s largest and Indonesia will
make an entrance into the Top 10 markets in 2019
• Specialist stores are set to remain the largest channel for clothing and
footwear sales, however online and discount stores are growing at a
faster pace
• Clothing & footwear is one of the largest sales categories over the
online channel and, the channel is forecast to continue its high growth
over the next five years
• Changing technology and faster communications will speed up and
globalize fashion trends
Some key findings Reasons to buy
• The report provides an essential overview of the global clothing & footwear
retail market, highlighting the largest and fastest-growing markets across the
globe
• Provides analysis of the latest trends, and market dynamics (covering nine
channels) in the retail space in major countries across the four regions: the
Americas, Europe, Asia-Pacific, and the Middle East and Africa
• Offers sub-category level sales, largest and fastest-growing channels for the
category, in major countries across the four regions
• Benefit from a detailed analysis of key trends influencing the Clothing and
footwear retail market
• Monitor the competitive landscape, with analysis of key international players
across the four regions and retail innovations to develop future strategies
154 SLIDES, 235 DATA CHARTS & GRAPHS + INFOGRAPHICS & TABLES
3
Asia-Pacific This section highlights the clothing &
footwear retail market size in 2014
and its forecast until 2019. There are
sub-category breaks for clothing,
including menswear, womenswear,
and children's wear, and in footwear
there are sub-categories for men’s
footwear, women’s footwear, and
children’s footwear.
It shows the biggest and fastest-
growing clothing & footwear retail
markets and the current and future
clothing & footwear retail trends.
There is also a break down of the
major clothing & footwear retailers in
the region, as well as examples of
innovative clothing & footwear
retailers which operate in this region.
Americas
This section highlights the clothing &
footwear retail market size in 2014
and its forecast until 2019. There are
sub-category breaks for clothing,
including menswear, womenswear,
and children's wear, and in footwear
there are sub-categories for men’s
footwear, women’s footwear, and
children’s footwear.
It shows the biggest and fastest-
growing clothing & footwear retail
markets and the current and future
clothing & footwear retail trends.
There is also a break down of the
major clothing & footwear retailers in
the region, as well as examples of
innovative clothing & footwear
retailers which operate in this region.
Europe
This section highlights the clothing &
footwear retail market size in 2014
and its forecast until 2019. There are
sub-category breaks for clothing,
including menswear, womenswear,
and children's wear, and in footwear
there are sub-categories for men’s
footwear, women’s footwear, and
children’s footwear.
It shows the biggest and fastest-
growing clothing & footwear retail
markets and the current and future
clothing & footwear retail trends.
There is also a break down of the
major clothing & footwear retailers in
the region, as well as examples of
innovative clothing & footwear
retailers which operate in this region.
Middle East and
Africa This section highlights the clothing &
footwear retail market size in 2014
and its forecast until 2019. There are
sub-category breaks for clothing,
including menswear, womenswear,
and children's wear, and in footwear
there are sub-categories for men’s
footwear, women’s footwear, and
children’s footwear.
It shows the biggest and fastest-
growing clothing & footwear retail
markets and the current and future
clothing & footwear retail trends.
There is also a break down of the
major clothing & footwear retailers in
the region, as well as examples of
innovative clothing & footwear
retailers which operate in this region.
June 2015 RT0345SR
CONTENTS
Global analysis of Clothing
& Footwear Retail market
Introduces global clothing & footwear retail landscape, includes current
market size and forecast, highlights world’s fastest growing markets and
channels. Also provides key trends, and sales developments in growth of Clothing & footwear sales.
Conlumino
4
Conlumino Global clothing & footwear retailing
July 2015 RT0345SR
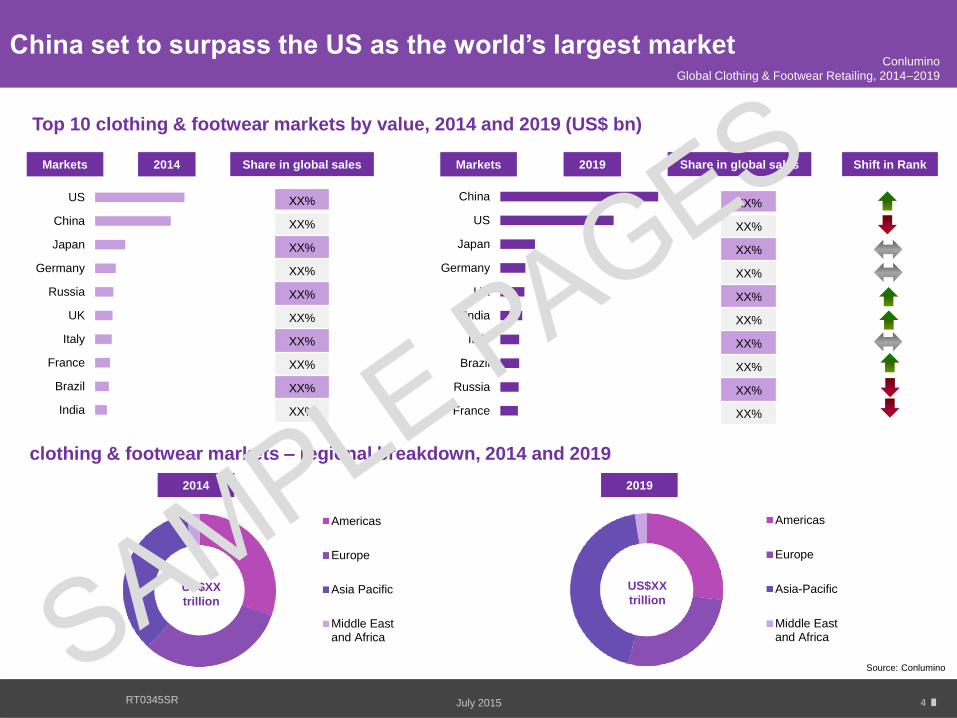
China set to surpass the US as the world’s largest market
Source: Conlumino
Top 10 clothing & footwear markets by value, 2014 and 2019 (US$ bn)
clothing & footwear markets – regional breakdown, 2014 and 2019
Americas
Europe
Asia Pacific
Middle Eastand Africa
Americas
Europe
Asia-Pacific
Middle Eastand Africa
Conlumino
Global Clothing & Footwear Retailing, 2014–2019
US$XX
trillion
2019 Share in global sales
India
Brazil
France
Italy
UK
Russia
Germany
Japan
China
US
France
Russia
Brazil
Italy
India
UK
Germany
Japan
US
ChinaXX%
XX%
XX%
XX%
XX%
XX%
XX%
XX%
XX%
XX%
XX%
XX%
XX%
XX%
XX%
XX%
XX%
XX%
XX%
XX%
Markets Share in global sales 2014 Markets Shift in Rank
2014 2019
US$XX
trillion

5
Conlumino
Global clothing & footwear retailing
June 2015 RT0345SR
Clothing total retail sales breakdown 2009, 2014 & 2019 (%)
Women's clothing & footwear continues to be the largest
category
Footwear total retail sales breakdown 2009, 2014 & 2019 (%)
2009
2009 2014 2019
Menswear
Womenswear
Childrenswear
2014 2019
Men's Footwear
Women's Footwear
Childrens' Footwear
Source: Conlumino
Conlumino
Global Clothing & Footwear Retailing, 2014–2019
6
Conlumino
Global clothing & footwear retailing
June 2015 RT0345SR
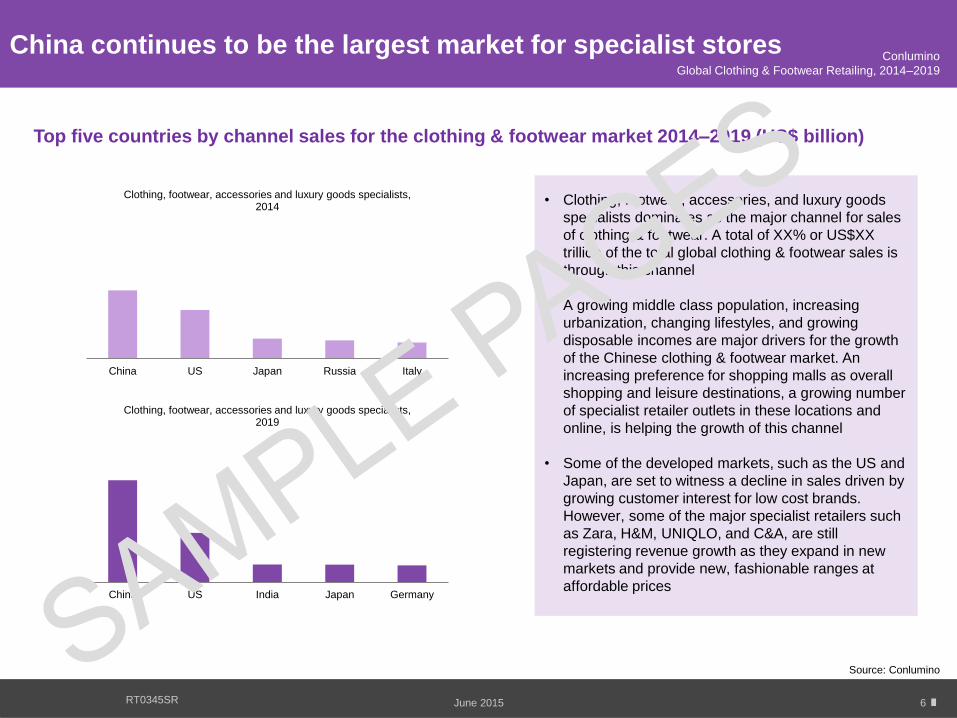
Top five countries by channel sales for the clothing & footwear market 2014–2019 (US$ billion)
China US Japan Russia Italy
Clothing, footwear, accessories and luxury goods specialists, 2014
China continues to be the largest market for specialist stores
Source: Conlumino
• Clothing, footwear, accessories, and luxury goods
specialists dominates as the major channel for sales
of clothing & footwear. A total of XX% or US$XX
trillion of the total global clothing & footwear sales is
through this channel
• A growing middle class population, increasing
urbanization, changing lifestyles, and growing
disposable incomes are major drivers for the growth
of the Chinese clothing & footwear market. An
increasing preference for shopping malls as overall
shopping and leisure destinations, a growing number
of specialist retailer outlets in these locations and
online, is helping the growth of this channel
• Some of the developed markets, such as the US and
Japan, are set to witness a decline in sales driven by
growing customer interest for low cost brands.
However, some of the major specialist retailers such
as Zara, H&M, UNIQLO, and C&A, are still
registering revenue growth as they expand in new
markets and provide new, fashionable ranges at
affordable prices
China US India Japan Germany
Clothing, footwear, accessories and luxury goods specialists, 2019
Conlumino
Global Clothing & Footwear Retailing, 2014–2019
7
Conlumino Global clothing & footwear retailing
Clothing, footwear, accessoriesand luxury goods specialists
Department stores Online Hypermarkets, supermarkets andhard-discounters
Value, variety stores and generalmerchandise retailers
XX%
June 2015 RT0345SR
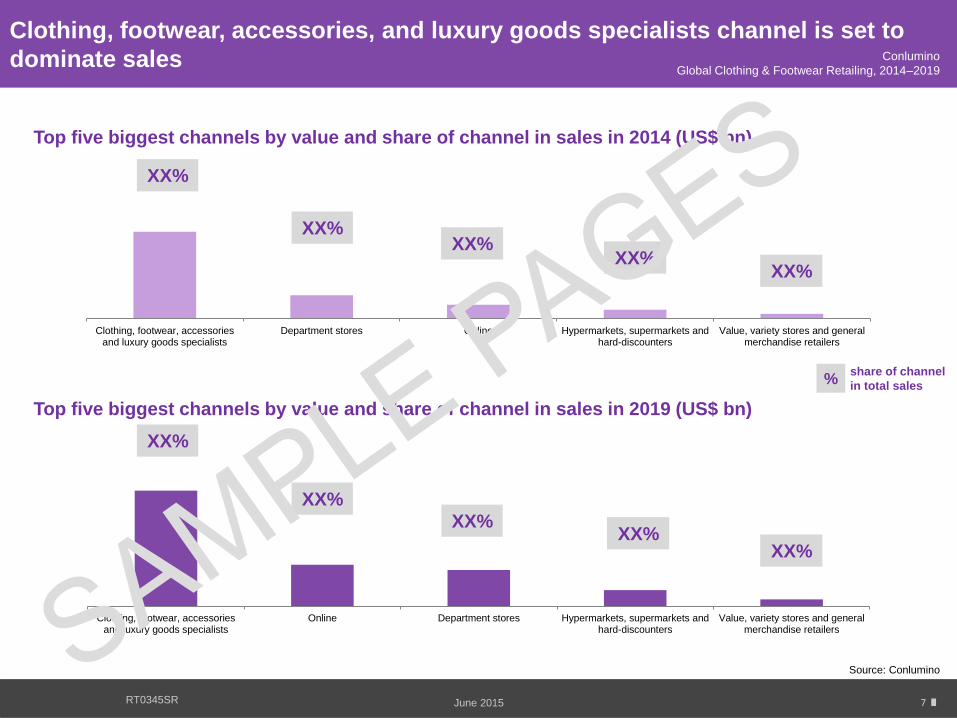
Top five biggest channels by value and share of channel in sales in 2014 (US$ bn)
Clothing, footwear, accessories, and luxury goods specialists channel is set to
dominate sales
Top five biggest channels by value and share of channel in sales in 2019 (US$ bn)
Clothing, footwear, accessoriesand luxury goods specialists
Online Department stores Hypermarkets, supermarkets andhard-discounters
Value, variety stores and generalmerchandise retailers
Source: Conlumino
XX% XX%
XX% XX%
XX%
XX%
XX% XX%
XX%
share of channel
in total sales %
Conlumino
Global Clothing & Footwear Retailing, 2014–2019
8
Conlumino
Global clothing & footwear retailing
June 2015 RT0345SR
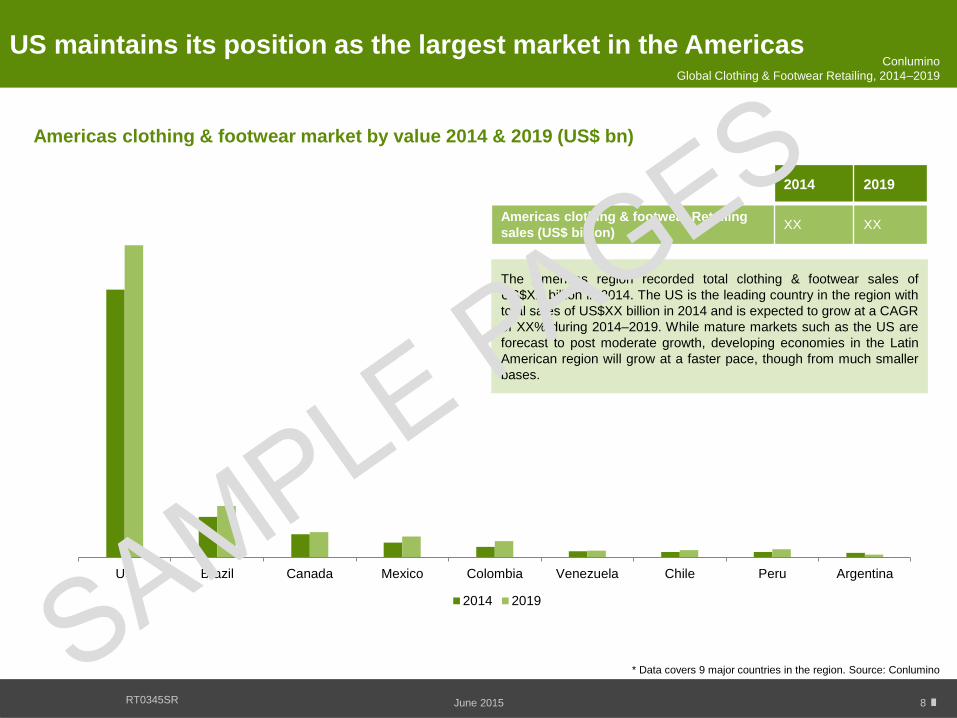
Americas clothing & footwear market by value 2014 & 2019 (US$ bn)
US maintains its position as the largest market in the Americas
US Brazil Canada Mexico Colombia Venezuela Chile Peru Argentina
2014 2019
* Data covers 9 major countries in the region. Source: Conlumino
The Americas region recorded total clothing & footwear sales of
US$XX billion in 2014. The US is the leading country in the region with
total sales of US$XX billion in 2014 and is expected to grow at a CAGR
of XX% during 2014–2019. While mature markets such as the US are
forecast to post moderate growth, developing economies in the Latin
American region will grow at a faster pace, though from much smaller
bases.
Conlumino
Global Clothing & Footwear Retailing, 2014–2019
2014 2019
Americas clothing & footwear Retailing
sales (US$ billion) XX XX
9
Conlumino
Global clothing & footwear retailing
June 2015 RT0345SR
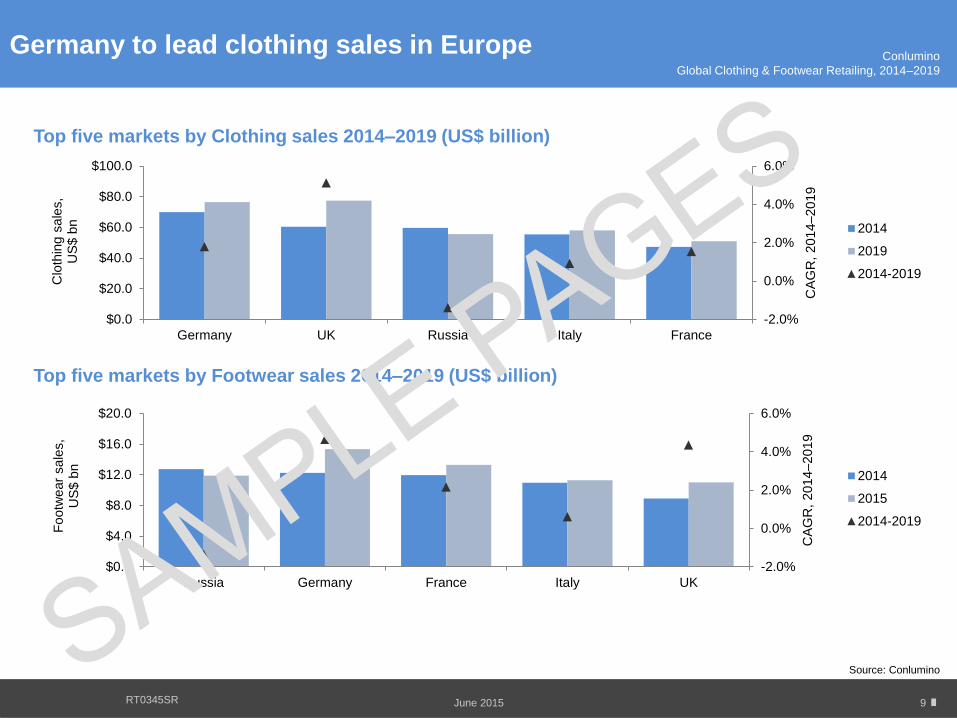
Top five markets by Clothing sales 2014–2019 (US$ billion)
Germany to lead clothing sales in Europe
Top five markets by Footwear sales 2014–2019 (US$ billion)
Source: Conlumino
-2.0%
0.0%
2.0%
4.0%
6.0%
$0.0
$20.0
$40.0
$60.0
$80.0
$100.0
Germany UK Russia Italy France
CA
GR
, 2014–
2019
Clo
thin
g s
ale
s,
U
S$ b
n
2014
2019
2014-2019
-2.0%
0.0%
2.0%
4.0%
6.0%
$0.0
$4.0
$8.0
$12.0
$16.0
$20.0
Russia Germany France Italy UK
CA
GR
, 2014
–2019
Footw
ear
sale
s,
U
S$ b
n
2014
2015
2014-2019
Conlumino
Global Clothing & Footwear Retailing, 2014–2019
10
Conlumino
Global clothing & footwear retailing
June 2015 RT0345SR
Country
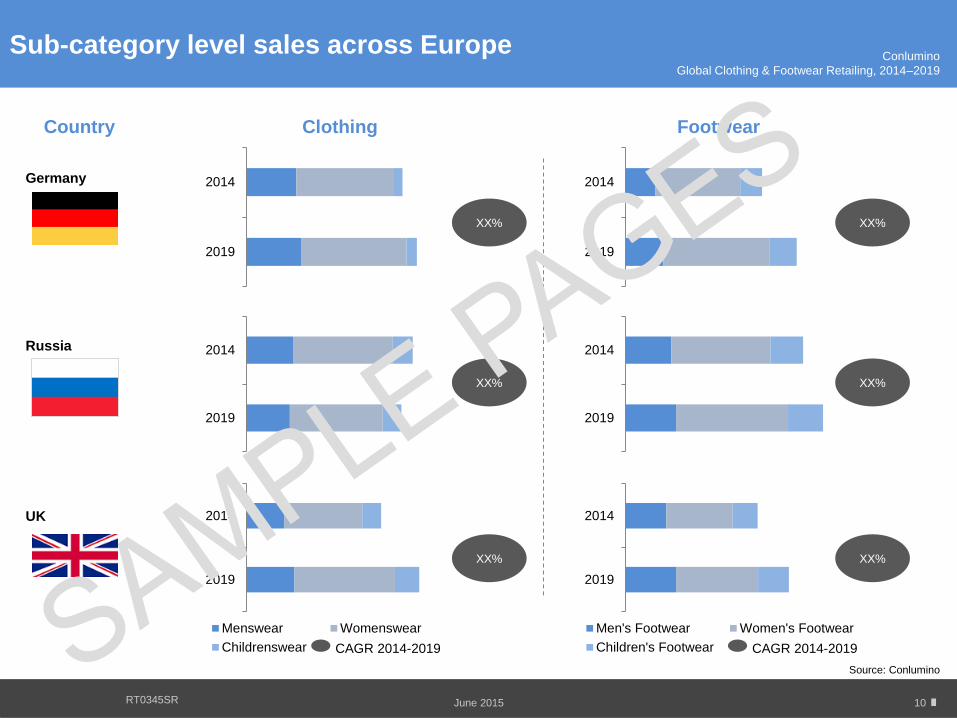
Sub-category level sales across Europe
Source: Conlumino
Conlumino
Global Clothing & Footwear Retailing, 2014–2019
Clothing Footwear
2019
2014
2019
2014
2019
2014
Menswear Womenswear
Childrenswear
2019
2014
2019
2014
XX%
XX%
XX%
XX%
XX%
XX%
Germany
Russia
UK
2019
2014
Men's Footwear Women's Footwear
Children's FootwearCAGR 2014-2019 CAGR 2014-2019
11
Conlumino
Global clothing & footwear retailing
June 2015 RT0345SR
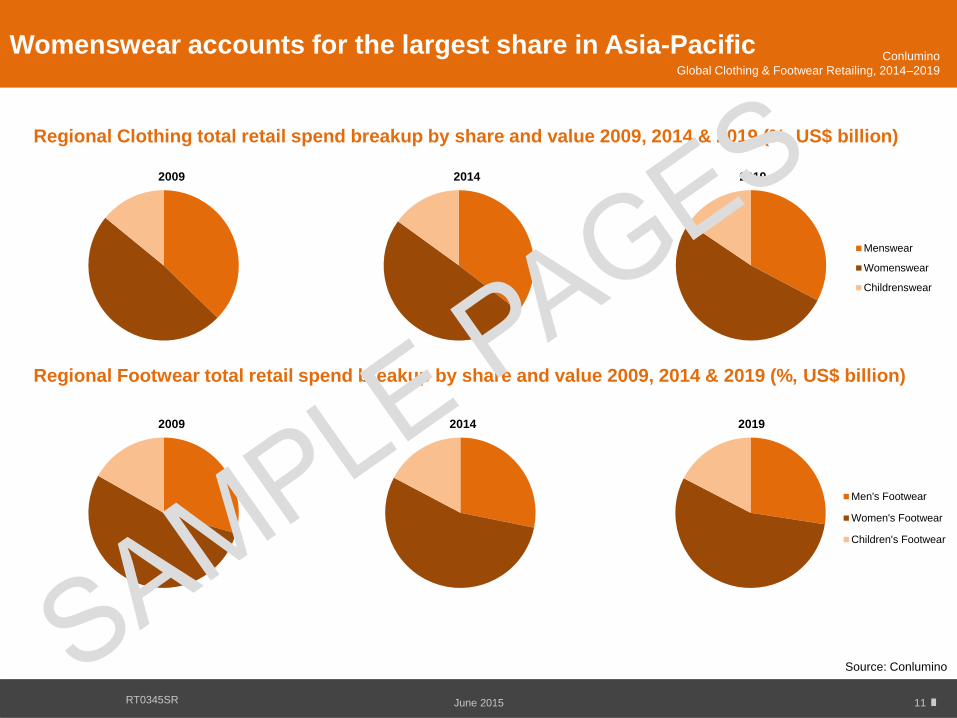
Regional Clothing total retail spend breakup by share and value 2009, 2014 & 2019 (%, US$ billion)
Womenswear accounts for the largest share in Asia-Pacific
Regional Footwear total retail spend breakup by share and value 2009, 2014 & 2019 (%, US$ billion)
Source: Conlumino
2014 2009 2019
Menswear
Womenswear
Childrenswear
2009 2014 2019
Men's Footwear
Women's Footwear
Children's Footwear
Conlumino
Global Clothing & Footwear Retailing, 2014–2019
12
Conlumino
Global clothing & footwear retailing
June 2015 RT0345SR
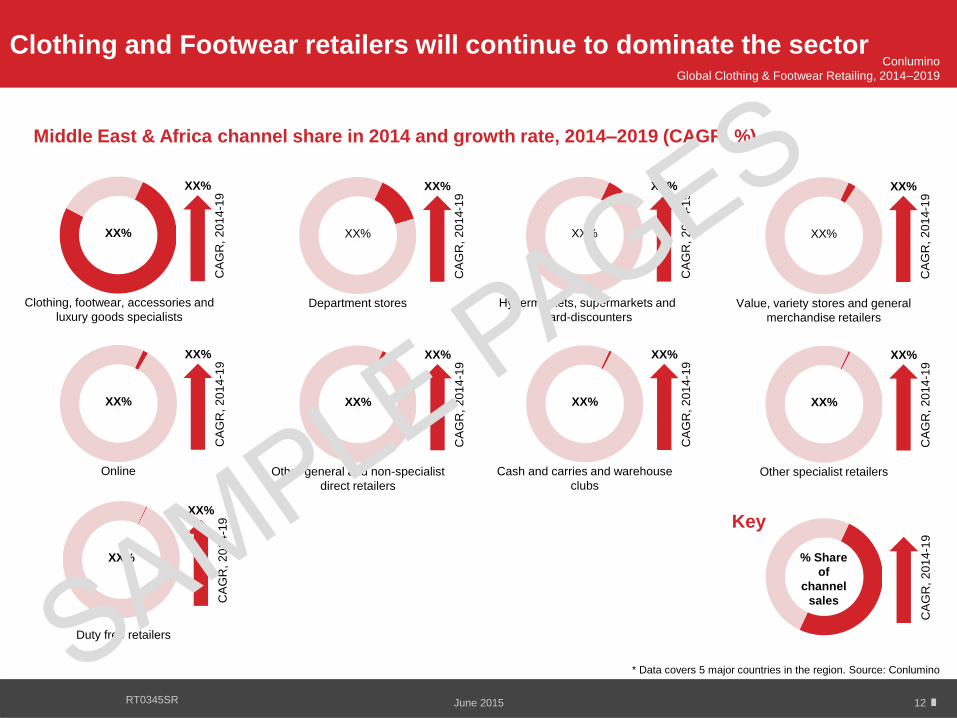
Clothing and Footwear retailers will continue to dominate the sector
* Data covers 5 major countries in the region. Source: Conlumino
XX%
Value, variety stores and general
merchandise retailers
XX%
CA
GR
, 2
01
4-1
9
Conlumino
Global Clothing & Footwear Retailing, 2014–2019
Key
XX%
Hypermarkets, supermarkets and
hard-discounters
XX%
CA
GR
, 2
01
4-1
9
XX%
Department stores
XX%
CA
GR
, 2
01
4-1
9
XX%
Clothing, footwear, accessories and
luxury goods specialists
XX%
CA
GR
, 2
01
4-1
9
XX%
Other specialist retailers
XX%
CA
GR
, 2
01
4-1
9
XX%
Cash and carries and warehouse
clubs
XX%
CA
GR
, 2
01
4-1
9
XX%
Other general and non-specialist
direct retailers
XX%
CA
GR
, 2
01
4-1
9
XX%
Online
XX%
CA
GR
, 2
01
4-1
9
CA
GR
, 2
01
4-1
9
% Share
of
channel
sales
Middle East & Africa channel share in 2014 and growth rate, 2014–2019 (CAGR, %)
XX%
XX%
CA
GR
, 2
01
4-1
9
Duty free retailers
.com 13 13 June 2015 RT0345SR
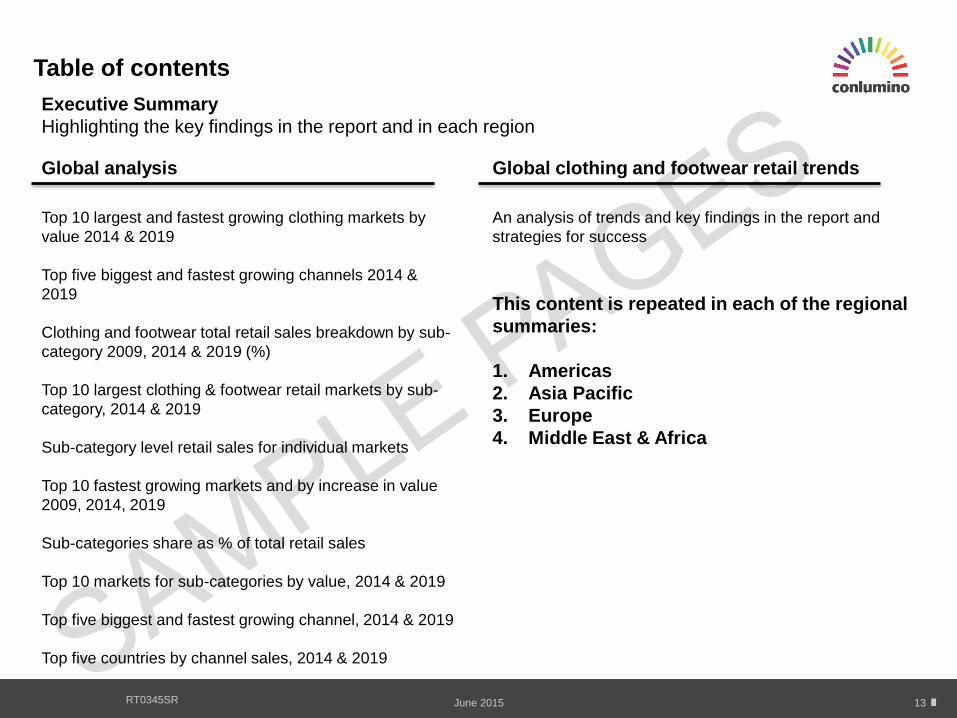
Global analysis
Top 10 largest and fastest growing clothing markets by
value 2014 & 2019
Top five biggest and fastest growing channels 2014 &
2019
Clothing and footwear total retail sales breakdown by sub-
category 2009, 2014 & 2019 (%)
Top 10 largest clothing & footwear retail markets by sub-
category, 2014 & 2019
Sub-category level retail sales for individual markets
Top 10 fastest growing markets and by increase in value
2009, 2014, 2019
Sub-categories share as % of total retail sales
Top 10 markets for sub-categories by value, 2014 & 2019
Top five biggest and fastest growing channel, 2014 & 2019
Top five countries by channel sales, 2014 & 2019
Global clothing and footwear retail trends
An analysis of trends and key findings in the report and
strategies for success
This content is repeated in each of the regional
summaries:
1. Americas
2. Asia Pacific
3. Europe
4. Middle East & Africa
Table of contents
Executive Summary
Highlighting the key findings in the report and in each region
conlumino.com 14 14 June 2015 RT0345SR
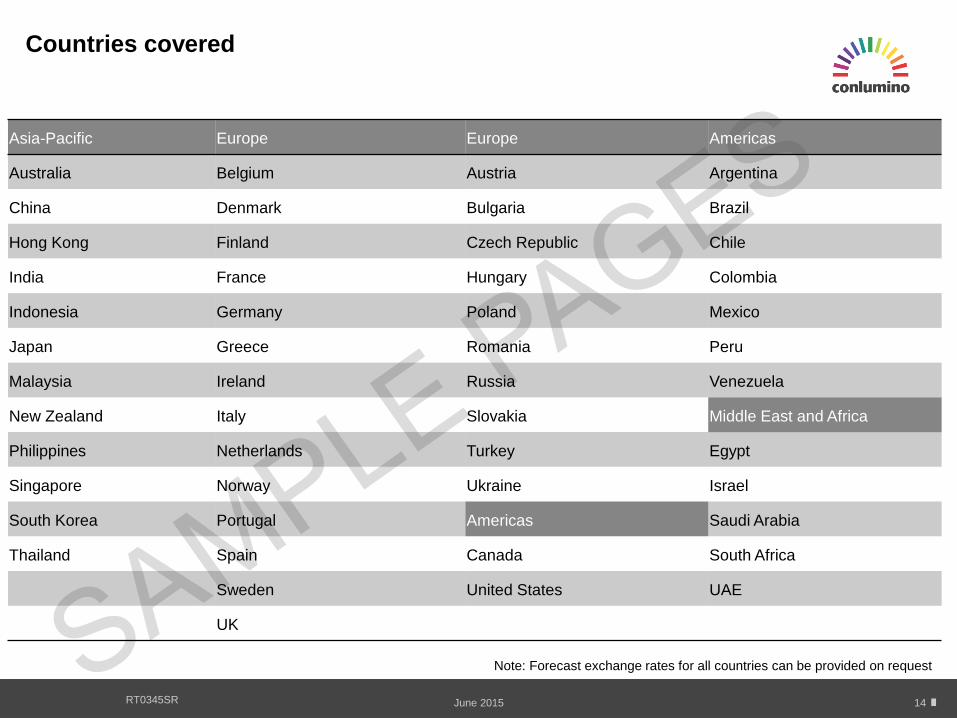
Asia-Pacific Europe Europe Americas
Australia Belgium Austria Argentina
China Denmark Bulgaria Brazil
Hong Kong Finland Czech Republic Chile
India France Hungary Colombia
Indonesia Germany Poland Mexico
Japan Greece Romania Peru
Malaysia Ireland Russia Venezuela
New Zealand Italy Slovakia Middle East and Africa
Philippines Netherlands Turkey Egypt
Singapore Norway Ukraine Israel
South Korea Portugal Americas Saudi Arabia
Thailand Spain Canada South Africa
Sweden United States UAE
UK
Countries covered
Note: Forecast exchange rates for all countries can be provided on request
.conlumino.com 15 15 March 2015 RT0345SR
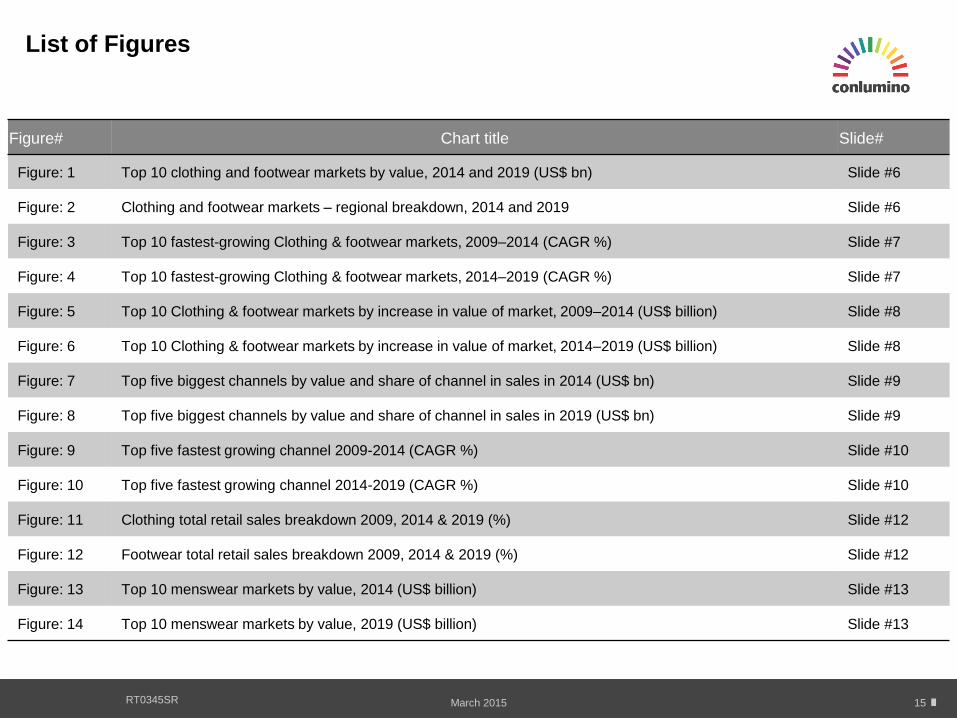
Figure# Chart title Slide#
Figure: 1 Top 10 clothing and footwear markets by value, 2014 and 2019 (US$ bn) Slide #6
Figure: 2 Clothing and footwear markets – regional breakdown, 2014 and 2019 Slide #6
Figure: 3 Top 10 fastest-growing Clothing & footwear markets, 2009–2014 (CAGR %) Slide #7
Figure: 4 Top 10 fastest-growing Clothing & footwear markets, 2014–2019 (CAGR %) Slide #7
Figure: 5 Top 10 Clothing & footwear markets by increase in value of market, 2009–2014 (US$ billion) Slide #8
Figure: 6 Top 10 Clothing & footwear markets by increase in value of market, 2014–2019 (US$ billion) Slide #8
Figure: 7 Top five biggest channels by value and share of channel in sales in 2014 (US$ bn) Slide #9
Figure: 8 Top five biggest channels by value and share of channel in sales in 2019 (US$ bn) Slide #9
Figure: 9 Top five fastest growing channel 2009-2014 (CAGR %) Slide #10
Figure: 10 Top five fastest growing channel 2014-2019 (CAGR %) Slide #10
Figure: 11 Clothing total retail sales breakdown 2009, 2014 & 2019 (%) Slide #12
Figure: 12 Footwear total retail sales breakdown 2009, 2014 & 2019 (%) Slide #12
Figure: 13 Top 10 menswear markets by value, 2014 (US$ billion) Slide #13
Figure: 14 Top 10 menswear markets by value, 2019 (US$ billion) Slide #13
List of Figures
ino.com 16 16 March 2015 RT0345SR
List of Figures
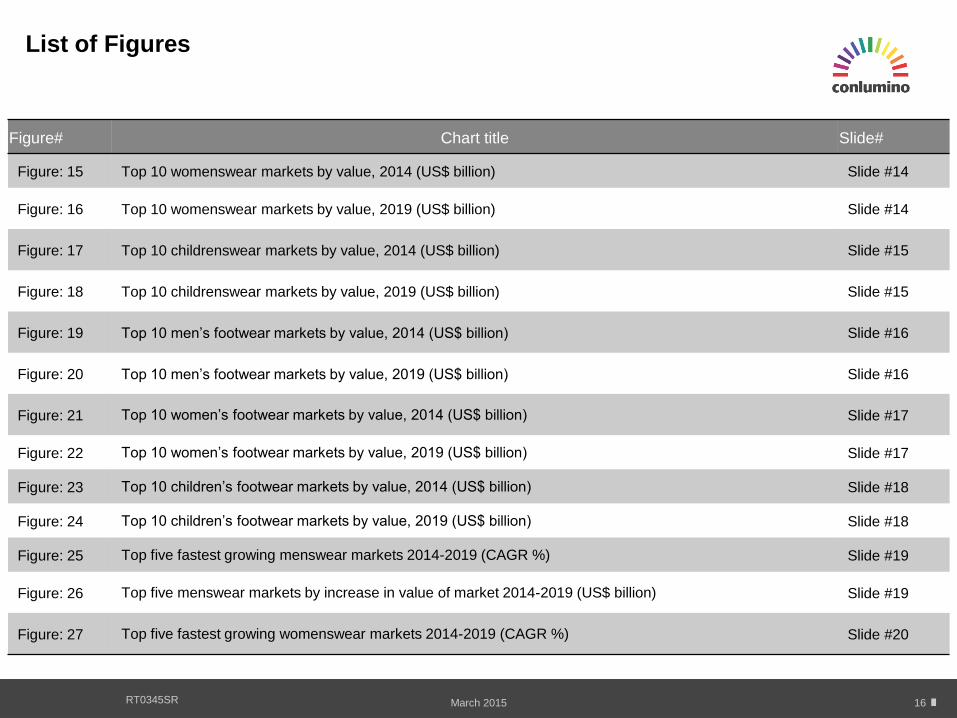
Figure# Chart title Slide#
Figure: 15 Top 10 womenswear markets by value, 2014 (US$ billion) Slide #14
Figure: 16 Top 10 womenswear markets by value, 2019 (US$ billion) Slide #14
Figure: 17 Top 10 childrenswear markets by value, 2014 (US$ billion) Slide #15
Figure: 18 Top 10 childrenswear markets by value, 2019 (US$ billion) Slide #15
Figure: 19 Top 10 men’s footwear markets by value, 2014 (US$ billion) Slide #16
Figure: 20 Top 10 men’s footwear markets by value, 2019 (US$ billion) Slide #16
Figure: 21 Top 10 women’s footwear markets by value, 2014 (US$ billion) Slide #17
Figure: 22 Top 10 women’s footwear markets by value, 2019 (US$ billion) Slide #17
Figure: 23 Top 10 children’s footwear markets by value, 2014 (US$ billion) Slide #18
Figure: 24 Top 10 children’s footwear markets by value, 2019 (US$ billion) Slide #18
Figure: 25 Top five fastest growing menswear markets 2014-2019 (CAGR %) Slide #19
Figure: 26 Top five menswear markets by increase in value of market 2014-2019 (US$ billion) Slide #19
Figure: 27 Top five fastest growing womenswear markets 2014-2019 (CAGR %) Slide #20
ww.conlumino.com 17 17 March 2015 RT0345SR
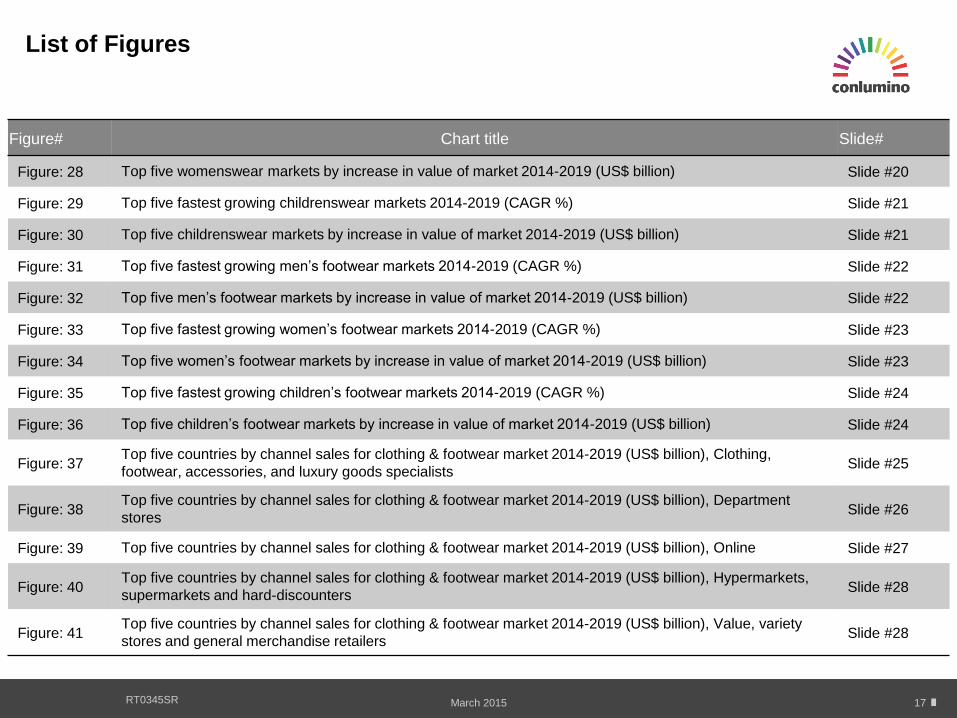
Figure# Chart title Slide#
Figure: 28 Top five womenswear markets by increase in value of market 2014-2019 (US$ billion) Slide #20
Figure: 29 Top five fastest growing childrenswear markets 2014-2019 (CAGR %) Slide #21
Figure: 30 Top five childrenswear markets by increase in value of market 2014-2019 (US$ billion) Slide #21
Figure: 31 Top five fastest growing men’s footwear markets 2014-2019 (CAGR %) Slide #22
Figure: 32 Top five men’s footwear markets by increase in value of market 2014-2019 (US$ billion) Slide #22
Figure: 33 Top five fastest growing women’s footwear markets 2014-2019 (CAGR %) Slide #23
Figure: 34 Top five women’s footwear markets by increase in value of market 2014-2019 (US$ billion) Slide #23
Figure: 35 Top five fastest growing children’s footwear markets 2014-2019 (CAGR %) Slide #24
Figure: 36 Top five children’s footwear markets by increase in value of market 2014-2019 (US$ billion) Slide #24
Figure: 37 Top five countries by channel sales for clothing & footwear market 2014-2019 (US$ billion), Clothing,
footwear, accessories, and luxury goods specialists Slide #25
Figure: 38 Top five countries by channel sales for clothing & footwear market 2014-2019 (US$ billion), Department
stores Slide #26
Figure: 39 Top five countries by channel sales for clothing & footwear market 2014-2019 (US$ billion), Online Slide #27
Figure: 40 Top five countries by channel sales for clothing & footwear market 2014-2019 (US$ billion), Hypermarkets,
supermarkets and hard-discounters Slide #28
Figure: 41 Top five countries by channel sales for clothing & footwear market 2014-2019 (US$ billion), Value, variety
stores and general merchandise retailers Slide #28
List of Figures
.conlumino.com 18 18 March 2015 RT0345SR
List of Figures
Figure# Chart title Slide#
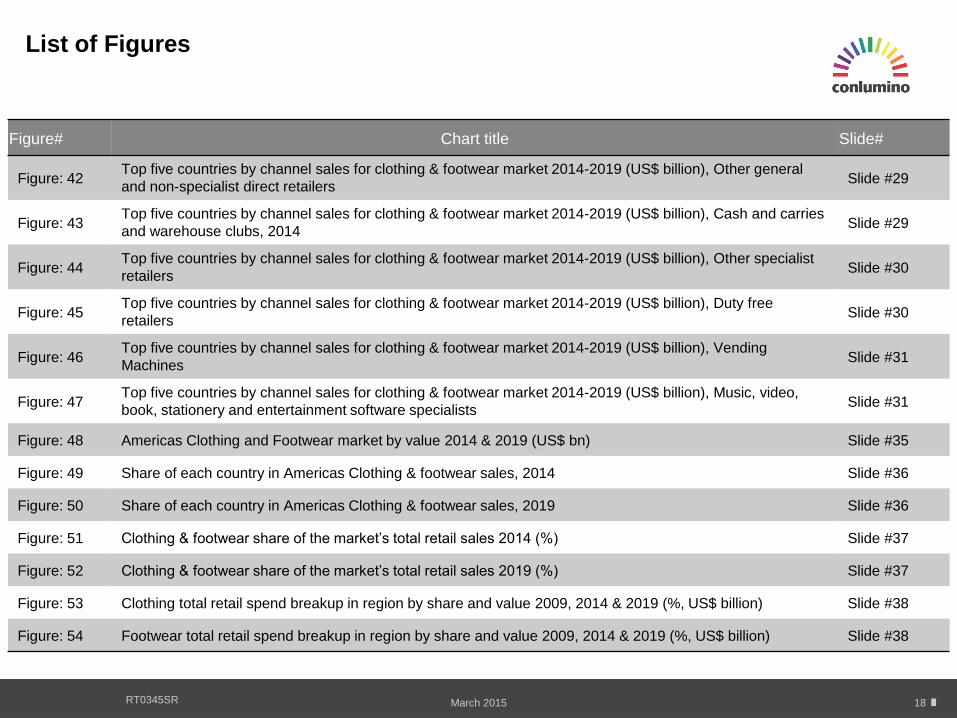
Figure: 42 Top five countries by channel sales for clothing & footwear market 2014-2019 (US$ billion), Other general
and non-specialist direct retailers Slide #29
Figure: 43 Top five countries by channel sales for clothing & footwear market 2014-2019 (US$ billion), Cash and carries
and warehouse clubs, 2014 Slide #29
Figure: 44 Top five countries by channel sales for clothing & footwear market 2014-2019 (US$ billion), Other specialist
retailers Slide #30
Figure: 45 Top five countries by channel sales for clothing & footwear market 2014-2019 (US$ billion), Duty free
retailers Slide #30
Figure: 46 Top five countries by channel sales for clothing & footwear market 2014-2019 (US$ billion), Vending
Machines Slide #31
Figure: 47 Top five countries by channel sales for clothing & footwear market 2014-2019 (US$ billion), Music, video,
book, stationery and entertainment software specialists Slide #31
Figure: 48 Americas Clothing and Footwear market by value 2014 & 2019 (US$ bn) Slide #35
Figure: 49 Share of each country in Americas Clothing & footwear sales, 2014 Slide #36
Figure: 50 Share of each country in Americas Clothing & footwear sales, 2019 Slide #36
Figure: 51 Clothing & footwear share of the market’s total retail sales 2014 (%) Slide #37
Figure: 52 Clothing & footwear share of the market’s total retail sales 2019 (%) Slide #37
Figure: 53 Clothing total retail spend breakup in region by share and value 2009, 2014 & 2019 (%, US$ billion) Slide #38
Figure: 54 Footwear total retail spend breakup in region by share and value 2009, 2014 & 2019 (%, US$ billion) Slide #38
ww.conlumino.com 19 19 March 2015 RT0345SR
Figure# Chart title Slide#
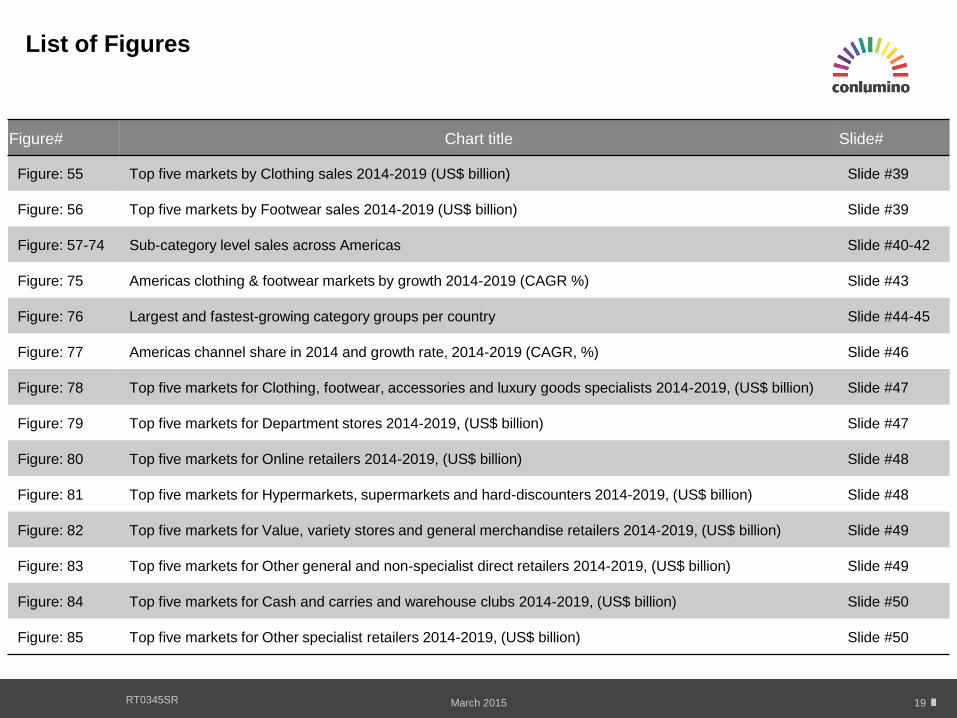
Figure: 55 Top five markets by Clothing sales 2014-2019 (US$ billion) Slide #39
Figure: 56 Top five markets by Footwear sales 2014-2019 (US$ billion) Slide #39
Figure: 57-74 Sub-category level sales across Americas Slide #40-42
Figure: 75 Americas clothing & footwear markets by growth 2014-2019 (CAGR %) Slide #43
Figure: 76 Largest and fastest-growing category groups per country Slide #44-45
Figure: 77 Americas channel share in 2014 and growth rate, 2014-2019 (CAGR, %) Slide #46
Figure: 78 Top five markets for Clothing, footwear, accessories and luxury goods specialists 2014-2019, (US$ billion) Slide #47
Figure: 79 Top five markets for Department stores 2014-2019, (US$ billion) Slide #47
Figure: 80 Top five markets for Online retailers 2014-2019, (US$ billion) Slide #48
Figure: 81 Top five markets for Hypermarkets, supermarkets and hard-discounters 2014-2019, (US$ billion) Slide #48
Figure: 82 Top five markets for Value, variety stores and general merchandise retailers 2014-2019, (US$ billion) Slide #49
Figure: 83 Top five markets for Other general and non-specialist direct retailers 2014-2019, (US$ billion) Slide #49
Figure: 84 Top five markets for Cash and carries and warehouse clubs 2014-2019, (US$ billion) Slide #50
Figure: 85 Top five markets for Other specialist retailers 2014-2019, (US$ billion) Slide #50
List of Figures
w.conlumino.com 20 20 March 2015 RT0345SR
Figure# Chart title Slide#
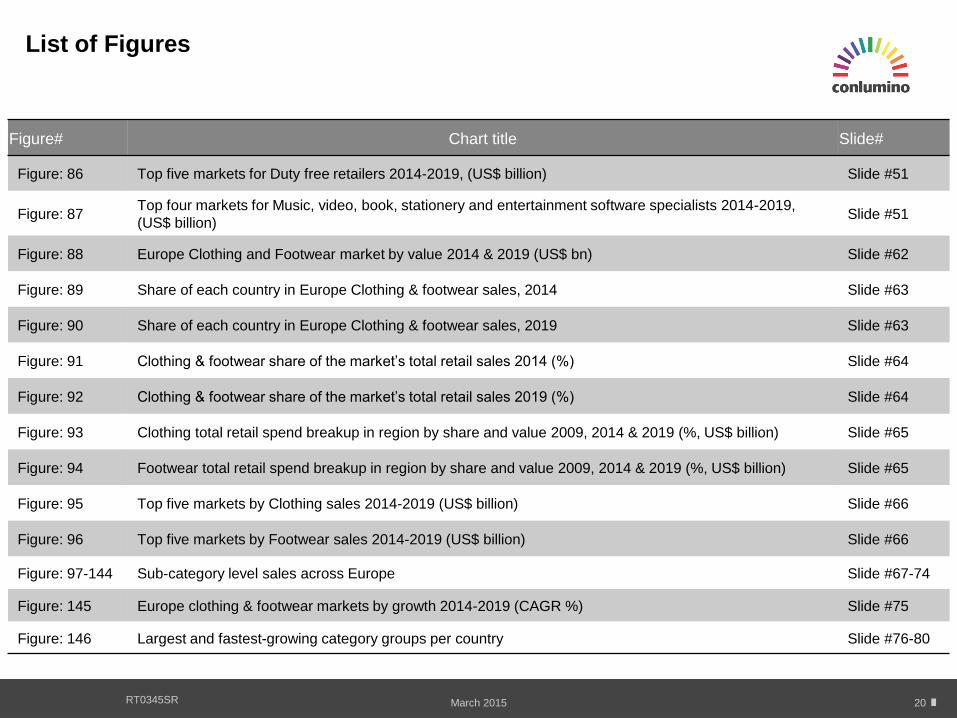
Figure: 86 Top five markets for Duty free retailers 2014-2019, (US$ billion) Slide #51
Figure: 87 Top four markets for Music, video, book, stationery and entertainment software specialists 2014-2019,
(US$ billion) Slide #51
Figure: 88 Europe Clothing and Footwear market by value 2014 & 2019 (US$ bn) Slide #62
Figure: 89 Share of each country in Europe Clothing & footwear sales, 2014 Slide #63
Figure: 90 Share of each country in Europe Clothing & footwear sales, 2019 Slide #63
Figure: 91 Clothing & footwear share of the market’s total retail sales 2014 (%) Slide #64
Figure: 92 Clothing & footwear share of the market’s total retail sales 2019 (%) Slide #64
Figure: 93 Clothing total retail spend breakup in region by share and value 2009, 2014 & 2019 (%, US$ billion) Slide #65
Figure: 94 Footwear total retail spend breakup in region by share and value 2009, 2014 & 2019 (%, US$ billion) Slide #65
Figure: 95 Top five markets by Clothing sales 2014-2019 (US$ billion) Slide #66
Figure: 96 Top five markets by Footwear sales 2014-2019 (US$ billion) Slide #66
Figure: 97-144 Sub-category level sales across Europe Slide #67-74
Figure: 145 Europe clothing & footwear markets by growth 2014-2019 (CAGR %) Slide #75
Figure: 146 Largest and fastest-growing category groups per country Slide #76-80
List of Figures
ww.conlumino.com 21 21 March 2015 RT0345SR
Figure# Chart title Slide#
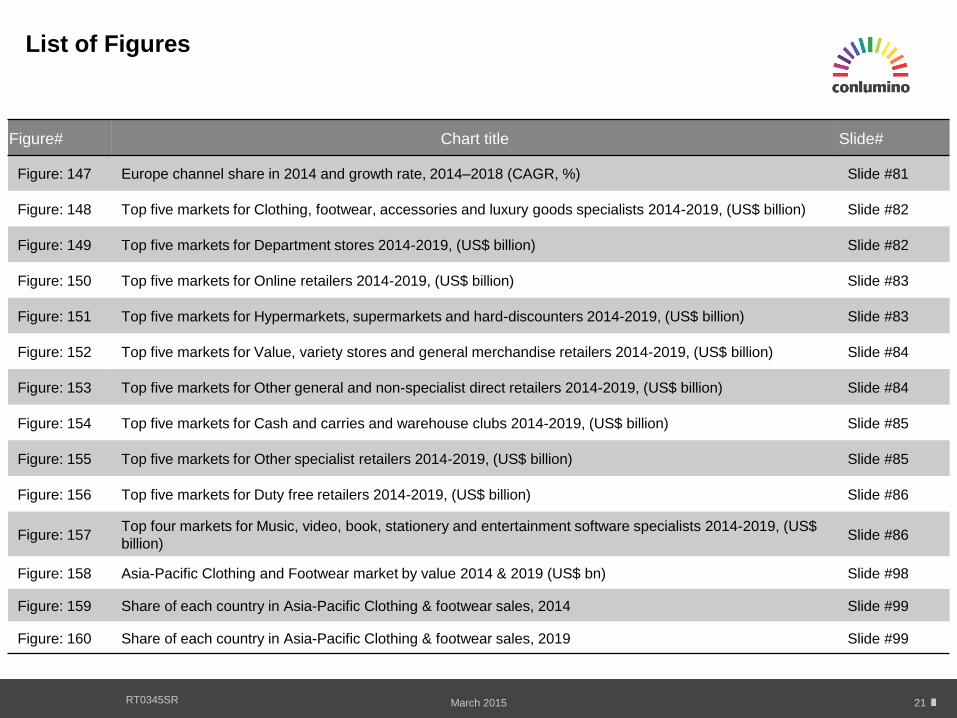
Figure: 147 Europe channel share in 2014 and growth rate, 2014–2018 (CAGR, %) Slide #81
Figure: 148 Top five markets for Clothing, footwear, accessories and luxury goods specialists 2014-2019, (US$ billion) Slide #82
Figure: 149 Top five markets for Department stores 2014-2019, (US$ billion) Slide #82
Figure: 150 Top five markets for Online retailers 2014-2019, (US$ billion) Slide #83
Figure: 151 Top five markets for Hypermarkets, supermarkets and hard-discounters 2014-2019, (US$ billion) Slide #83
Figure: 152 Top five markets for Value, variety stores and general merchandise retailers 2014-2019, (US$ billion) Slide #84
Figure: 153 Top five markets for Other general and non-specialist direct retailers 2014-2019, (US$ billion) Slide #84
Figure: 154 Top five markets for Cash and carries and warehouse clubs 2014-2019, (US$ billion) Slide #85
Figure: 155 Top five markets for Other specialist retailers 2014-2019, (US$ billion) Slide #85
Figure: 156 Top five markets for Duty free retailers 2014-2019, (US$ billion) Slide #86
Figure: 157 Top four markets for Music, video, book, stationery and entertainment software specialists 2014-2019, (US$
billion) Slide #86
Figure: 158 Asia-Pacific Clothing and Footwear market by value 2014 & 2019 (US$ bn) Slide #98
Figure: 159 Share of each country in Asia-Pacific Clothing & footwear sales, 2014 Slide #99
Figure: 160 Share of each country in Asia-Pacific Clothing & footwear sales, 2019 Slide #99
List of Figures
wconlumino.com 22 22 March 2015 RT0345SR
Figure# Chart title Slide#
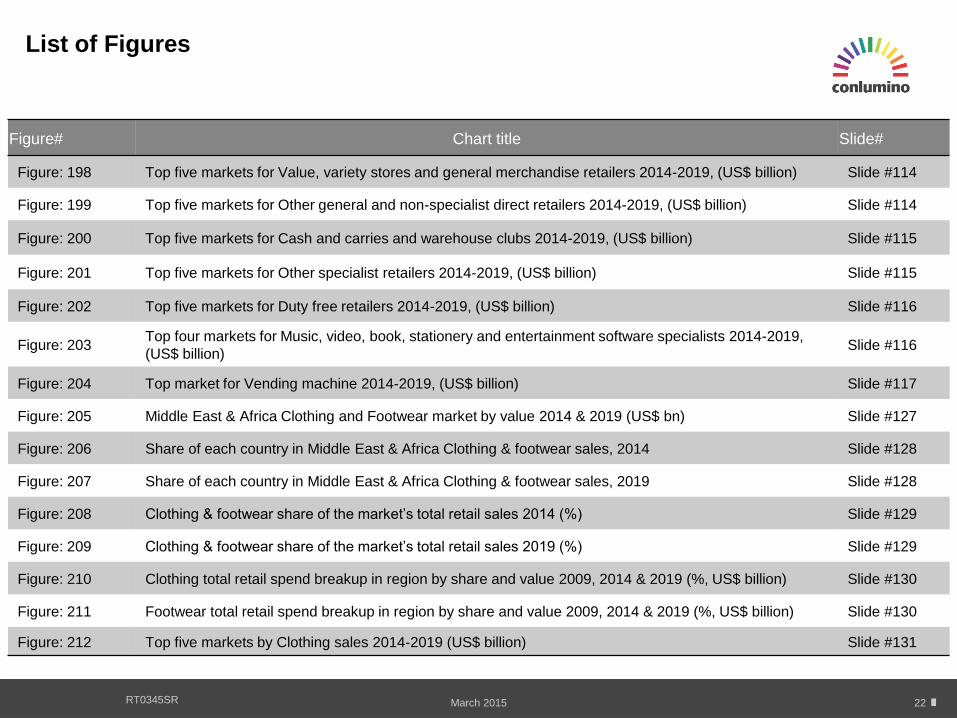
Figure: 198 Top five markets for Value, variety stores and general merchandise retailers 2014-2019, (US$ billion) Slide #114
Figure: 199 Top five markets for Other general and non-specialist direct retailers 2014-2019, (US$ billion) Slide #114
Figure: 200 Top five markets for Cash and carries and warehouse clubs 2014-2019, (US$ billion) Slide #115
Figure: 201 Top five markets for Other specialist retailers 2014-2019, (US$ billion) Slide #115
Figure: 202 Top five markets for Duty free retailers 2014-2019, (US$ billion) Slide #116
Figure: 203 Top four markets for Music, video, book, stationery and entertainment software specialists 2014-2019,
(US$ billion) Slide #116
Figure: 204 Top market for Vending machine 2014-2019, (US$ billion) Slide #117
Figure: 205 Middle East & Africa Clothing and Footwear market by value 2014 & 2019 (US$ bn) Slide #127
Figure: 206 Share of each country in Middle East & Africa Clothing & footwear sales, 2014 Slide #128
Figure: 207 Share of each country in Middle East & Africa Clothing & footwear sales, 2019 Slide #128
Figure: 208 Clothing & footwear share of the market’s total retail sales 2014 (%) Slide #129
Figure: 209 Clothing & footwear share of the market’s total retail sales 2019 (%) Slide #129
Figure: 210 Clothing total retail spend breakup in region by share and value 2009, 2014 & 2019 (%, US$ billion) Slide #130
Figure: 211 Footwear total retail spend breakup in region by share and value 2009, 2014 & 2019 (%, US$ billion) Slide #130
Figure: 212 Top five markets by Clothing sales 2014-2019 (US$ billion) Slide #131
List of Figures
nlumino.com 23 23 March 2015 RT0345SR
Figure# Chart title Slide#
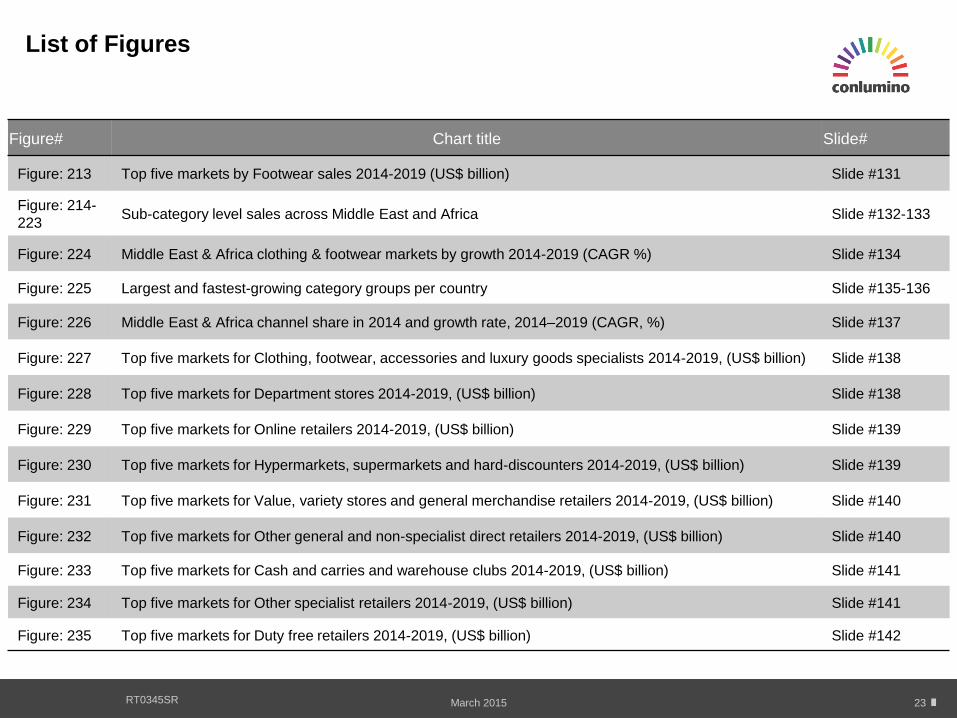
Figure: 213 Top five markets by Footwear sales 2014-2019 (US$ billion) Slide #131
Figure: 214-
223 Sub-category level sales across Middle East and Africa Slide #132-133
Figure: 224 Middle East & Africa clothing & footwear markets by growth 2014-2019 (CAGR %) Slide #134
Figure: 225 Largest and fastest-growing category groups per country Slide #135-136
Figure: 226 Middle East & Africa channel share in 2014 and growth rate, 2014–2019 (CAGR, %) Slide #137
Figure: 227 Top five markets for Clothing, footwear, accessories and luxury goods specialists 2014-2019, (US$ billion) Slide #138
Figure: 228 Top five markets for Department stores 2014-2019, (US$ billion) Slide #138
Figure: 229 Top five markets for Online retailers 2014-2019, (US$ billion) Slide #139
Figure: 230 Top five markets for Hypermarkets, supermarkets and hard-discounters 2014-2019, (US$ billion) Slide #139
Figure: 231 Top five markets for Value, variety stores and general merchandise retailers 2014-2019, (US$ billion) Slide #140
Figure: 232 Top five markets for Other general and non-specialist direct retailers 2014-2019, (US$ billion) Slide #140
Figure: 233 Top five markets for Cash and carries and warehouse clubs 2014-2019, (US$ billion) Slide #141
Figure: 234 Top five markets for Other specialist retailers 2014-2019, (US$ billion) Slide #141
Figure: 235 Top five markets for Duty free retailers 2014-2019, (US$ billion) Slide #142
List of Figures
wwwconlumino.com 24 24 March 2015 RT0345SR
Figure# Chart title Slide#
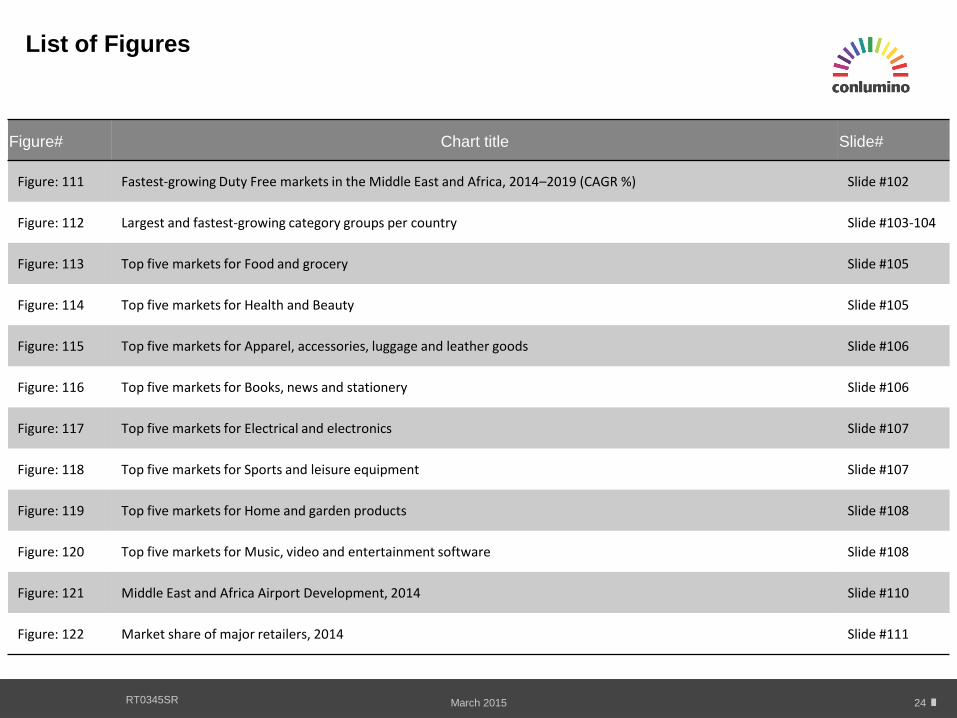
Figure: 111 Fastest-growing Duty Free markets in the Middle East and Africa, 2014–2019 (CAGR %) Slide #102
Figure: 112 Largest and fastest-growing category groups per country Slide #103-104
Figure: 113 Top five markets for Food and grocery Slide #105
Figure: 114 Top five markets for Health and Beauty Slide #105
Figure: 115 Top five markets for Apparel, accessories, luggage and leather goods Slide #106
Figure: 116 Top five markets for Books, news and stationery Slide #106
Figure: 117 Top five markets for Electrical and electronics Slide #107
Figure: 118 Top five markets for Sports and leisure equipment Slide #107
Figure: 119 Top five markets for Home and garden products Slide #108
Figure: 120 Top five markets for Music, video and entertainment software Slide #108
Figure: 121 Middle East and Africa Airport Development, 2014 Slide #110
Figure: 122 Market share of major retailers, 2014 Slide #111
List of Figures
ww.conlumino.com 25 25 March 2015 RT0345SR
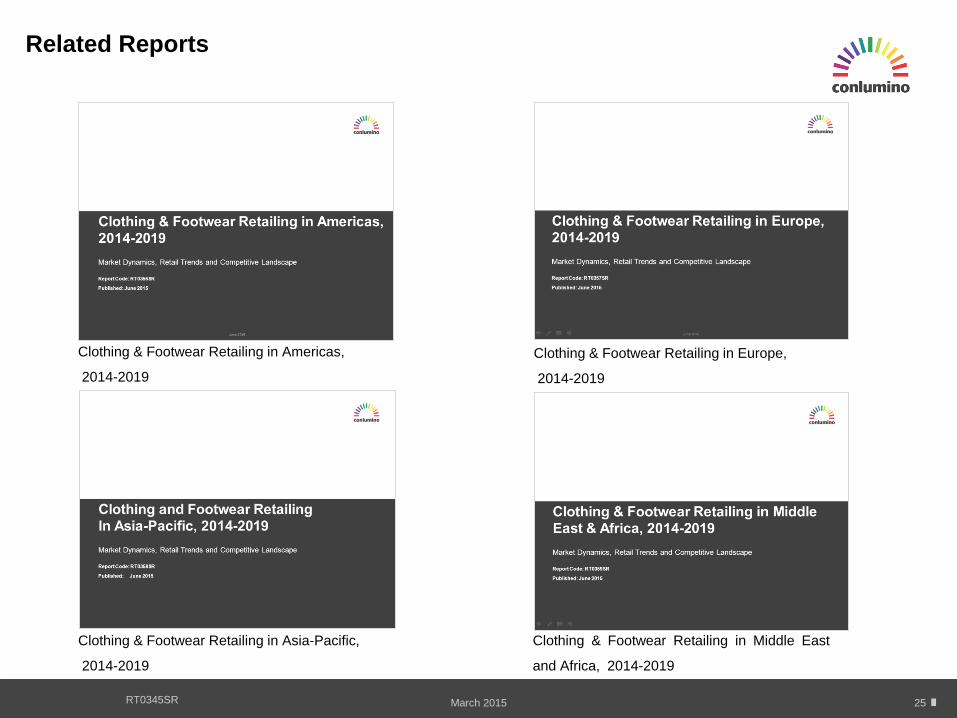
Related Reports
Clothing & Footwear Retailing in Americas,
2014-2019
Clothing & Footwear Retailing in Europe,
2014-2019
Clothing & Footwear Retailing in Asia-Pacific,
2014-2019
Clothing & Footwear Retailing in Middle East
and Africa, 2014-2019
ww.conlumino.com 26 26
About Conlumino
June 2015 RT0345SR
Conlumino Global Retail offers a comprehensive 360
view of the retail landscape. A team of analysts, with more than 200 years of combined
experience, help you identify and understand the most current retail trends.
Hundreds of retail businesses across the globe used our research to make critical business decisions.
All Rights Reserved.
No part of this publication may be reproduced, stored in a retrieval system or transmitted in any form by any means, electronic, mechanical,
photocopying, recording or otherwise, without the prior permission of the publisher, Conlumino.
The facts of this report are believed to be correct at the time of publication but cannot be guaranteed. Please note that the findings, conclusions and
recommendations that Conlumino delivers will be based on information gathered in good faith from both primary and secondary sources, whose
accuracy we are not always in a position to guarantee. As such, Conlumino can accept no liability whatsoever for actions taken based on any
information that may subsequently prove to be incorrect.
Disclaimer
Head Office