teekay shipping shipping jefferies tanker ... crude oil tankers product carriers specialized ice...
TRANSCRIPT

www.teekay.com
T E E K A Y – T H E M A R I N E M I D S T R E A M C O M P A N Y ®
SM
Jefferies Tanker Conference
Teekay Shipping
Jefferies Tanker Conference
September 15, 2005
Teekay Shipping Teekay Shipping
Jefferies Tanker Jefferies Tanker ConferenceConference
September 15, 2005September 15, 2005
TEEKAY SHIPPING
2 T E E K A Y – T H E M A R I N E M I D S T R E A M C O M P A N Y ® www.teekay.com
Forward Looking StatementsForward Looking StatementsThis presentation contains forward-looking statements (as defined in Section 21E of the Securities Exchange Act of 1934, as amended) which reflect management’s current views with respect to certain future events and performance, including statements regarding the Company’s future growth prospects; tanker market fundamentals, including the balance of supply and demand in the tanker market and sources of incremental oil production, and spot tanker charter rates; LNG shipping demand fundamentals; and the valuation of the Company. The following factors are among those that could cause actual results to differ materially from the forward-looking statements, which involve risks and uncertainties, and that should be considered in evaluating any such statement: changes in production of or demand for oil, petroleum products and LNG, either generally or in particular regions; greater or less than anticipated levels of tanker newbuilding orders or greater or less than anticipated rates of tanker scrapping; changes in trading patterns significantly affecting overall tanker tonnage requirements; changes in applicable industry laws and regulations and the timing of implementation of new laws and regulations; changes in the typical seasonal variations in tanker charter rates; changes in the offshore production of oil; the potential for early termination of long-term contracts and inability of the Company to renew or replace long-term contracts; shipyard production delays; and other factors discussed in Teekay’s filings from time to time with the SEC, including its Report on Form 20-F for the fiscal year ended December 31, 2004. The Company expressly disclaims any obligation or undertaking to release publicly any updates or revisions to any forward-looking statements contained herein to reflect any change in theCompany’s expectations with respect thereto or any change in events, conditions or circumstances on which any such statement is based.

TEEKAY SHIPPING
3 T E E K A Y – T H E M A R I N E M I D S T R E A M C O M P A N Y ® www.teekay.com
Investment HighlightsInvestment Highlights
Conventional crude oil tankersLiquefied natural gas carriersRefined product tankersShuttle TankersFloating Storage Units
Teekay is the only publicly traded shipping company with the following complement of assets:
Diverse Portfolio of Assets
Large spot in-chartered fleet provides additional operating leverage while minimizing capital employed
Large owned spot tanker fleet provides significant operating leverage
Unique Business MixFixed-rate contract portfolio provides for positive earnings in nearly any tanker
cycle
Teekay’s Business Model Appeals to CustomersTeekay is the only publicly traded shipping company that moves the three most
important commodities:Liquefied Natural Gas Crude Oil Refined Products
TEEKAY SHIPPING
4 T E E K A Y – T H E M A R I N E M I D S T R E A M C O M P A N Y ® www.teekay.com
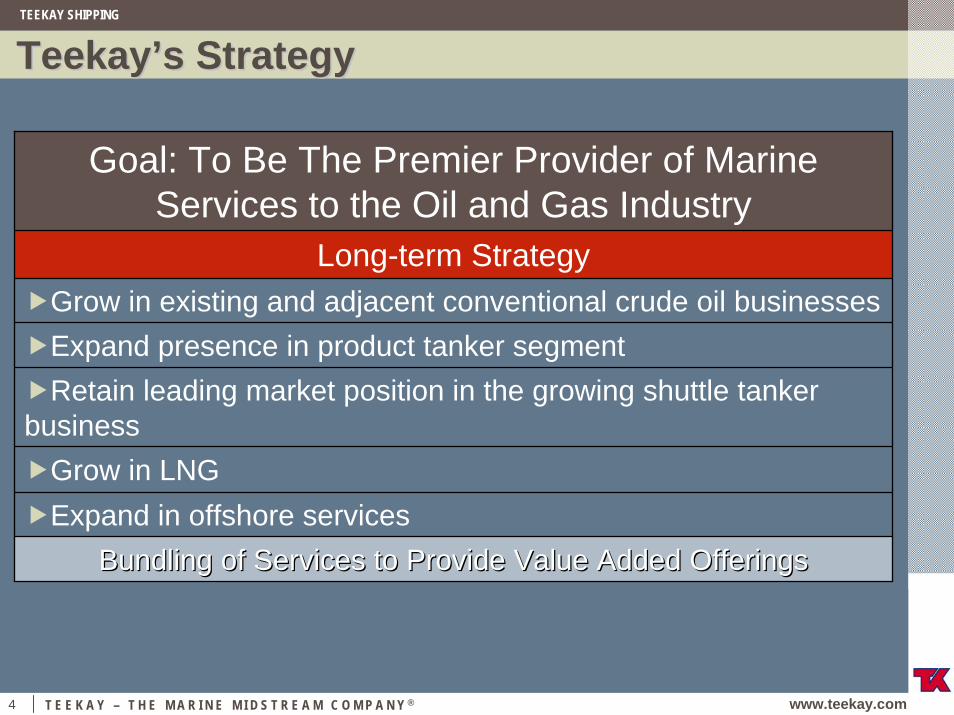
TeekayTeekay’’s Strategys Strategy
Goal: To Be The Premier Provider of Marine Services to the Oil and Gas Industry
Long-term StrategyGrow in existing and adjacent conventional crude oil businessesExpand presence in product tanker segmentRetain leading market position in the growing shuttle tanker
businessGrow in LNGExpand in offshore services
Bundling of Services to Provide Value Added OfferingsBundling of Services to Provide Value Added Offerings
TEEKAY SHIPPING
5 T E E K A Y – T H E M A R I N E M I D S T R E A M C O M P A N Y ® www.teekay.com
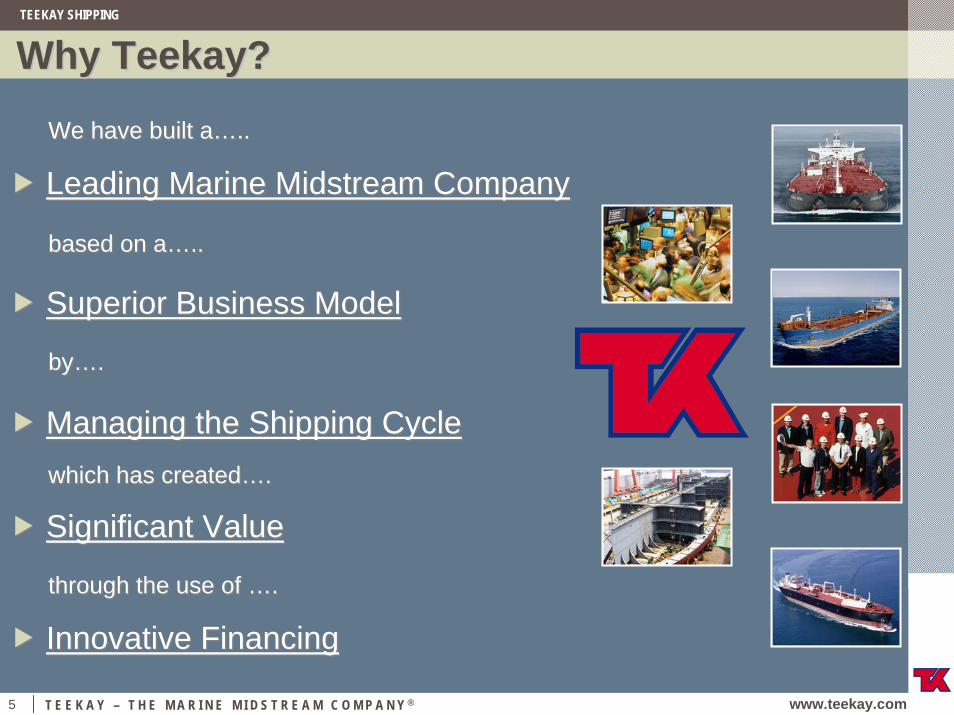
Why Teekay?Why Teekay?
We have built a…..We have built a…..
Leading Marine Midstream CompanyLeading Marine Midstream Company
based on a…..based on a…..
Superior Business ModelSuperior Business Model
by….by….
Managing the Shipping CycleManaging the Shipping Cyclewhich has created….which has created….
Significant ValueSignificant Value
through the use of ….through the use of ….
Innovative FinancingInnovative Financing
TEEKAY SHIPPING
6 T E E K A Y – T H E M A R I N E M I D S T R E A M C O M P A N Y ® www.teekay.com
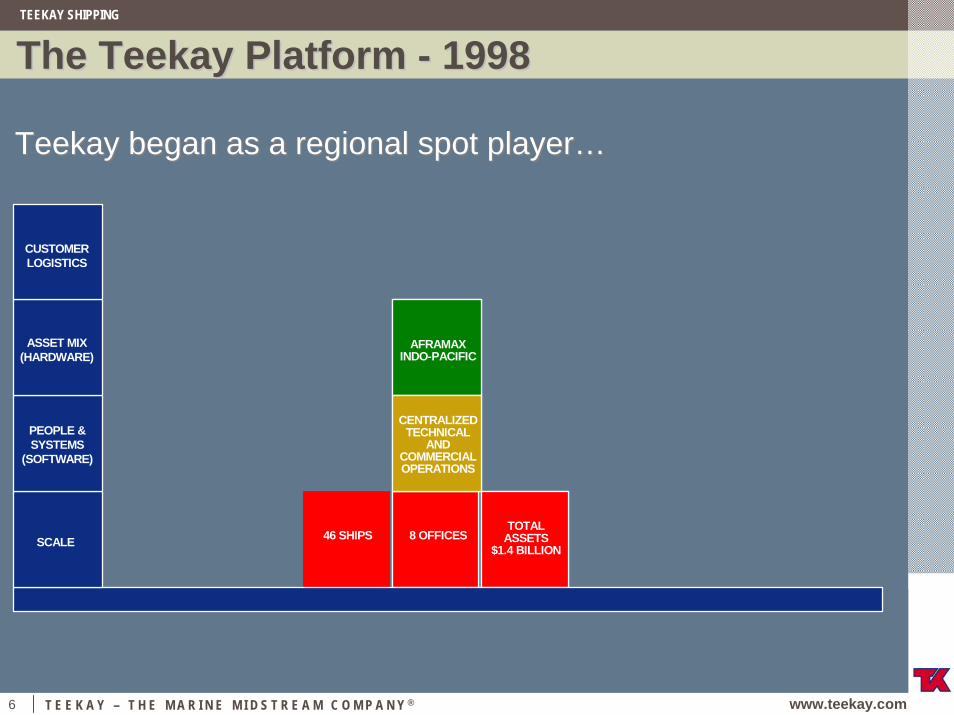
The Teekay Platform The Teekay Platform -- 19981998
Teekay began as a regional spot player…Teekay began as a regional spot player…
TOTAL ASSETS
$1.4 BILLION46 SHIPS 8 OFFICES
TOTAL ASSETS
$1.4 BILLION46 SHIPS 8 OFFICESSCALE
PEOPLE & SYSTEMS
(SOFTWARE)
ASSET MIX (HARDWARE)
CUSTOMER LOGISTICS
AFRAMAX INDO-PACIFIC
AFRAMAX INDO-PACIFIC
CENTRALIZED TECHNICAL
AND COMMERCIAL OPERATIONS
CENTRALIZED TECHNICAL
AND COMMERCIAL OPERATIONS
TEEKAY SHIPPING
7 T E E K A Y – T H E M A R I N E M I D S T R E A M C O M P A N Y ® www.teekay.com
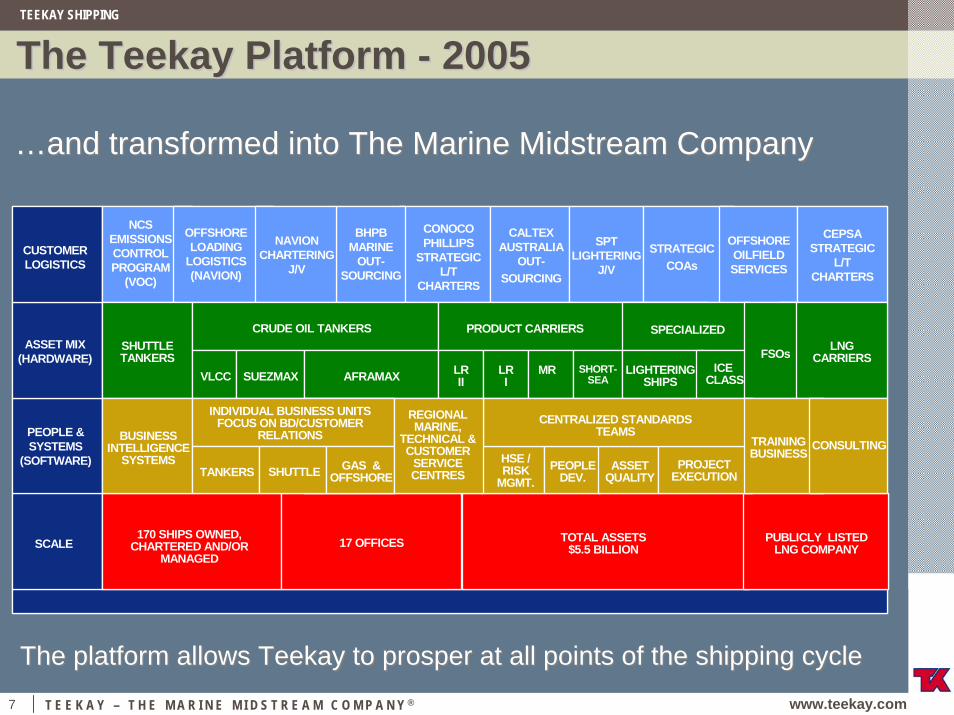
The Teekay Platform The Teekay Platform -- 20052005
…and transformed into The Marine Midstream Company…and transformed into The Marine Midstream Company
SCALE
PEOPLE & SYSTEMS
(SOFTWARE)
ASSET MIX (HARDWARE)
CUSTOMER LOGISTICS
SCALE
PEOPLE & SYSTEMS
(SOFTWARE)
ASSET MIX (HARDWARE)
CUSTOMER LOGISTICS
17 OFFICES170 SHIPS OWNED,
CHARTERED AND/ORMANAGED
PUBLICLY LISTED LNG COMPANY
TOTAL ASSETS$5.5 BILLION17 OFFICES
170 SHIPS OWNED, CHARTERED AND/OR
MANAGED
PUBLICLY LISTED LNG COMPANY
TOTAL ASSETS$5.5 BILLION
NCSEMISSIONS CONTROL PROGRAM
(VOC)
OFFSHORE LOADING
LOGISTICS (NAVION)
NAVION CHARTERING
J/V
BHPB MARINE
OUT-SOURCING
CONOCO PHILLIPS
STRATEGIC L/T
CHARTERS
CALTEX AUSTRALIA
OUT-SOURCING
SPT LIGHTERING
J/V
OFFSHORE OILFIELD SERVICES
CEPSA STRATEGIC
L/T CHARTERS
STRATEGICCOAs
NCSEMISSIONS CONTROL PROGRAM
(VOC)
OFFSHORE LOADING
LOGISTICS (NAVION)
NAVION CHARTERING
J/V
BHPB MARINE
OUT-SOURCING
CONOCO PHILLIPS
STRATEGIC L/T
CHARTERS
CALTEX AUSTRALIA
OUT-SOURCING
SPT LIGHTERING
J/V
OFFSHORE OILFIELD SERVICES
CEPSA STRATEGIC
L/T CHARTERS
STRATEGICCOAs
VLCC SUEZMAX
FSOsSHUTTLETANKERS
AFRAMAX
CRUDE OIL TANKERS PRODUCT CARRIERS SPECIALIZED
ICECLASS
LNG CARRIERS
LRII
LRI
MR SHORT-SEA
LIGHTERING SHIPSVLCC SUEZMAX
FSOsSHUTTLETANKERS
AFRAMAX
CRUDE OIL TANKERS PRODUCT CARRIERS SPECIALIZED
ICECLASS
LNG CARRIERS
LRII
LRI
MR SHORT-SEA
LIGHTERING SHIPS
BUSINESSINTELLIGENCE
SYSTEMS
INDIVIDUAL BUSINESS UNITS FOCUS ON BD/CUSTOMER
RELATIONS
TANKERS SHUTTLE GAS & OFFSHORE
REGIONAL MARINE,
TECHNICAL & CUSTOMER
SERVICE CENTRES
CENTRALIZED STANDARDS TEAMS
HSE /RISK
MGMT.PEOPLE
DEV.ASSET
QUALITYPROJECT
EXECUTION
TRAINING BUSINESS
CONSULTINGBUSINESS
INTELLIGENCESYSTEMS
INDIVIDUAL BUSINESS UNITS FOCUS ON BD/CUSTOMER
RELATIONS
TANKERS SHUTTLE GAS & OFFSHORE
REGIONAL MARINE,
TECHNICAL & CUSTOMER
SERVICE CENTRES
CENTRALIZED STANDARDS TEAMS
HSE /RISK
MGMT.PEOPLE
DEV.ASSET
QUALITYPROJECT
EXECUTION
TRAINING BUSINESS
CONSULTING
The platform allows Teekay to prosper at all points of the shipping cycleThe platform allows Teekay to prosper at all points of the shipping cycle
TEEKAY SHIPPING
8 T E E K A Y – T H E M A R I N E M I D S T R E A M C O M P A N Y ® www.teekay.com
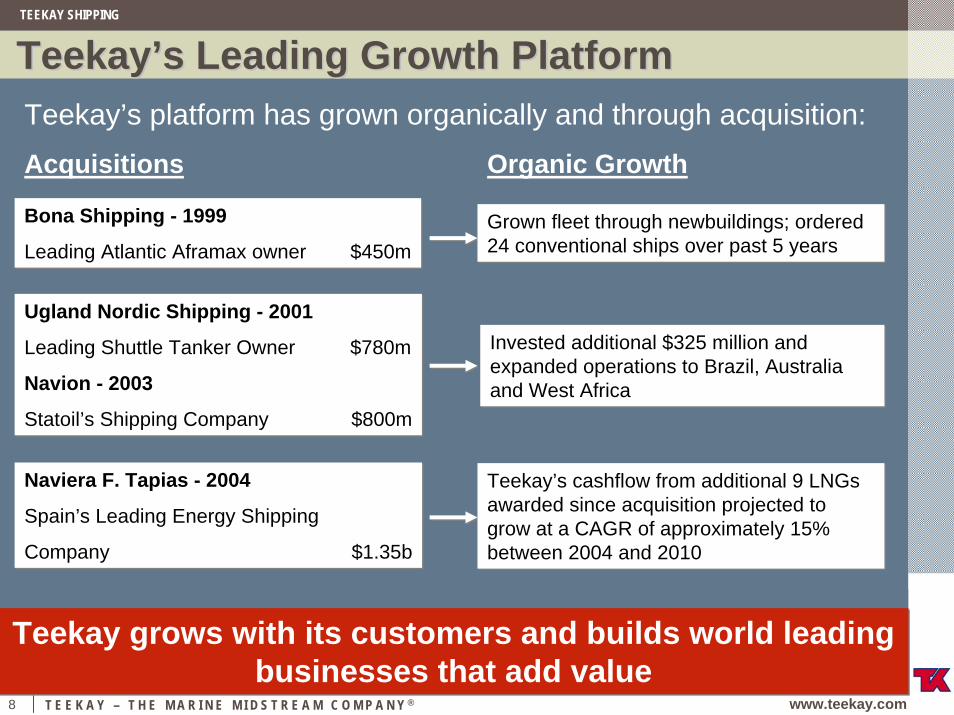
TeekayTeekay’’s Leading Growth Platforms Leading Growth PlatformTeekay’s platform has grown organically and through acquisition:Acquisitions Organic Growth
Bona Shipping - 1999
Leading Atlantic Aframax owner $450m
Bona Shipping - 1999
Leading Atlantic Aframax owner $450m
Ugland Nordic Shipping - 2001
Leading Shuttle Tanker Owner $780m
Navion - 2003
Statoil’s Shipping Company $800m
Ugland Nordic Shipping - 2001
Leading Shuttle Tanker Owner $780m
Navion - 2003
Statoil’s Shipping Company $800m
Grown fleet through newbuildings; ordered 24 conventional ships over past 5 yearsGrown fleet through newbuildings; ordered 24 conventional ships over past 5 years
Invested additional $325 million and expanded operations to Brazil, Australia and West Africa
Invested additional $325 million and expanded operations to Brazil, Australia and West Africa
Naviera F. Tapias - 2004
Spain’s Leading Energy Shipping
Company $1.35b
Naviera F. Tapias - 2004
Spain’s Leading Energy Shipping
Company $1.35b
Teekay’s cashflow from additional 9 LNGsawarded since acquisition projected to grow at a CAGR of approximately 15% between 2004 and 2010
Teekay’s cashflow from additional 9 LNGsawarded since acquisition projected to grow at a CAGR of approximately 15% between 2004 and 2010
Teekay grows with its customers and builds world leading businesses that add value
Teekay grows with its customers and builds world leading businesses that add value
TEEKAY SHIPPING
9 T E E K A Y – T H E M A R I N E M I D S T R E A M C O M P A N Y ® www.teekay.com
SHUTTLE TANKER
OFFSHORE DRILLINGFSO
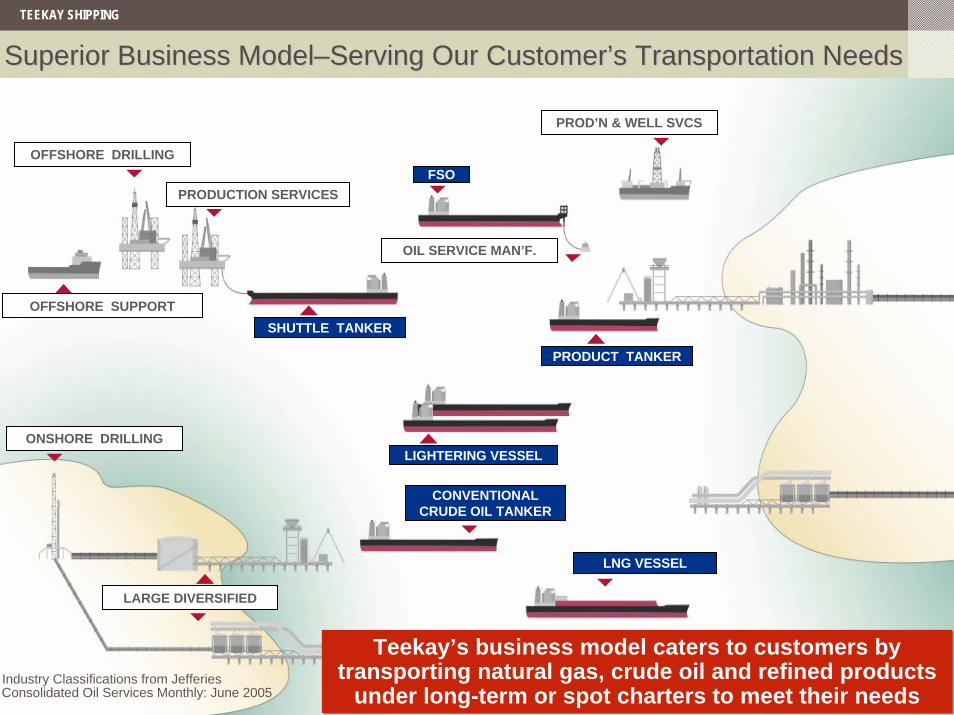
Superior Business ModelSuperior Business Model––Serving Our CustomerServing Our Customer’’s Transportation Needss Transportation Needs
OFFSHORE SUPPORT
PRODUCTION SERVICES
ONSHORE DRILLING
LARGE DIVERSIFIED
PROD’N & WELL SVCS
OIL SERVICE MAN’F.
LIGHTERING VESSEL
PRODUCT TANKER
CONVENTIONAL CRUDE OIL TANKER
LNG VESSEL
Industry Classifications from Jefferies Consolidated Oil Services Monthly: June 2005
Teekay’s business model caters to customers by transporting natural gas, crude oil and refined products
under long-term or spot charters to meet their needs
Teekay’s business model caters to customers by transporting natural gas, crude oil and refined products
under long-term or spot charters to meet their needs
TEEKAY SHIPPING
10 T E E K A Y – T H E M A R I N E M I D S T R E A M C O M P A N Y ® www.teekay.com
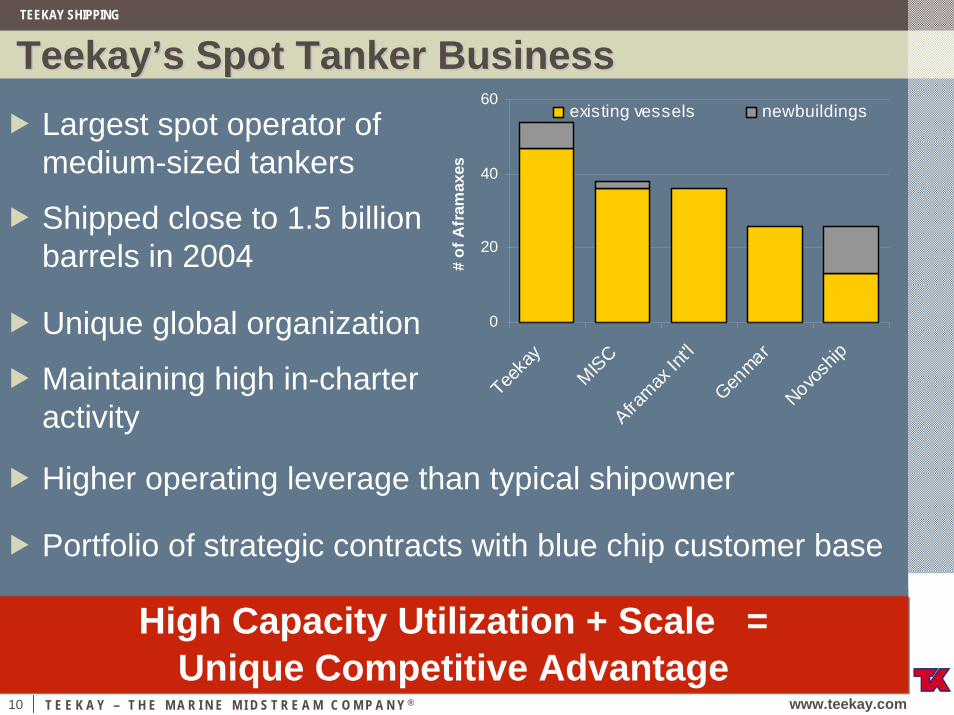
TeekayTeekay’’ss Spot Tanker BusinessSpot Tanker BusinessLargest spot operator of medium-sized tankers
Shipped close to 1.5 billion barrels in 2004
Unique global organization
Maintaining high in-charter activity
0
20
40
60
Teeka
y
MISCAfra
max In
t'lGen
marNovo
ship
# of
Afr
amax
es
existing vessels newbuildings
Higher operating leverage than typical shipowner
Portfolio of strategic contracts with blue chip customer base
High Capacity Utilization + Scale = Unique Competitive Advantage
High Capacity Utilization + Scale = Unique Competitive Advantage
TEEKAY SHIPPING
11 T E E K A Y – T H E M A R I N E M I D S T R E A M C O M P A N Y ® www.teekay.com
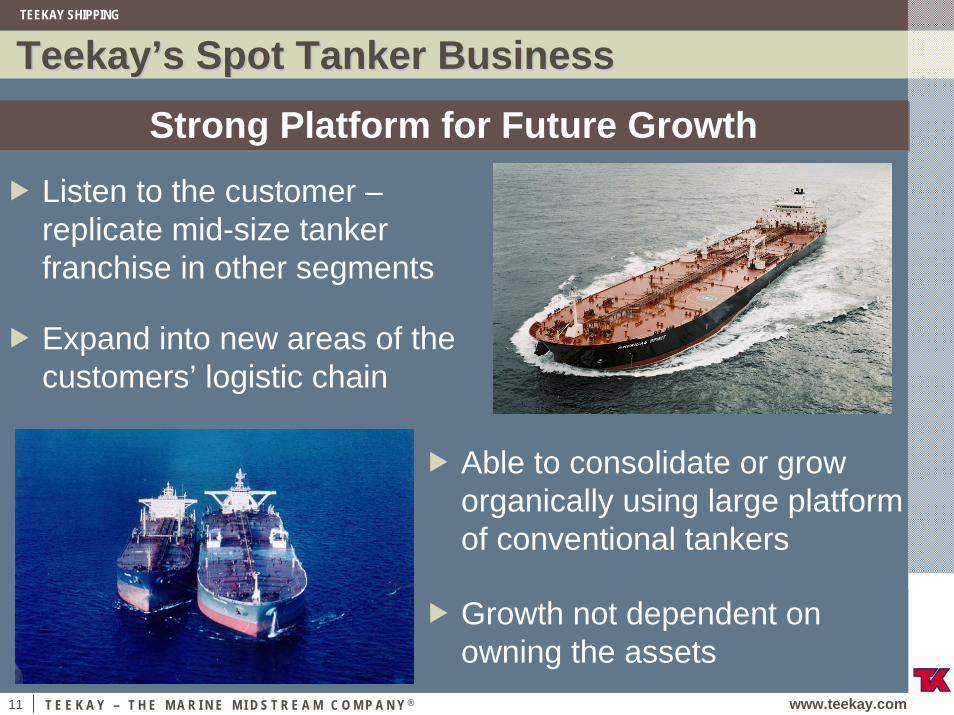
TeekayTeekay’’ss Spot Tanker BusinessSpot Tanker Business
Strong Platform for Future GrowthStrong Platform for Future GrowthListen to the customer –replicate mid-size tanker franchise in other segments
Expand into new areas of the customers’ logistic chain
Able to consolidate or grow organically using large platform of conventional tankers
Growth not dependent on owning the assets
TEEKAY SHIPPING
12 T E E K A Y – T H E M A R I N E M I D S T R E A M C O M P A N Y ® www.teekay.com
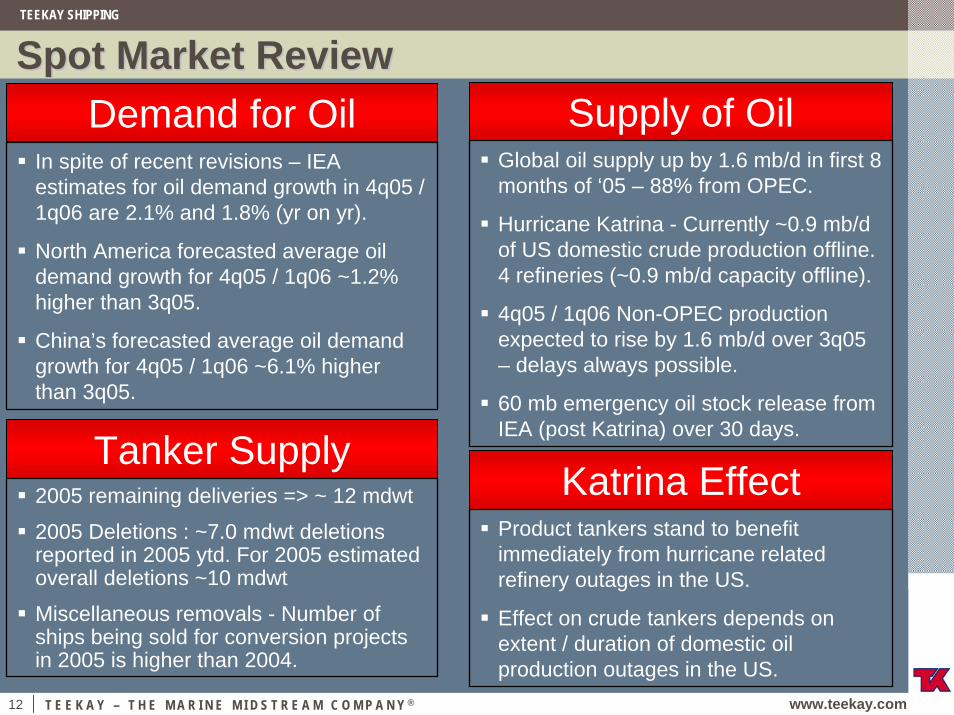
Spot Market ReviewSpot Market ReviewDemand for Oil Supply of Oil
Tanker SupplyKatrina Effect
In spite of recent revisions – IEA estimates for oil demand growth in 4q05 / 1q06 are 2.1% and 1.8% (yr on yr).
North America forecasted average oil demand growth for 4q05 / 1q06 ~1.2% higher than 3q05.
China’s forecasted average oil demand growth for 4q05 / 1q06 ~6.1% higher than 3q05.
Global oil supply up by 1.6 mb/d in first 8 months of ‘05 – 88% from OPEC.
Hurricane Katrina - Currently ~0.9 mb/d of US domestic crude production offline. 4 refineries (~0.9 mb/d capacity offline).
4q05 / 1q06 Non-OPEC production expected to rise by 1.6 mb/d over 3q05 – delays always possible.
60 mb emergency oil stock release from IEA (post Katrina) over 30 days.
Product tankers stand to benefit immediately from hurricane related refinery outages in the US.
Effect on crude tankers depends on extent / duration of domestic oil production outages in the US.
2005 remaining deliveries => ~ 12 mdwt
2005 Deletions : ~7.0 mdwt deletions reported in 2005 ytd. For 2005 estimated overall deletions ~10 mdwt
Miscellaneous removals - Number of ships being sold for conversion projects in 2005 is higher than 2004.
TEEKAY SHIPPING
13 T E E K A Y – T H E M A R I N E M I D S T R E A M C O M P A N Y ® www.teekay.com
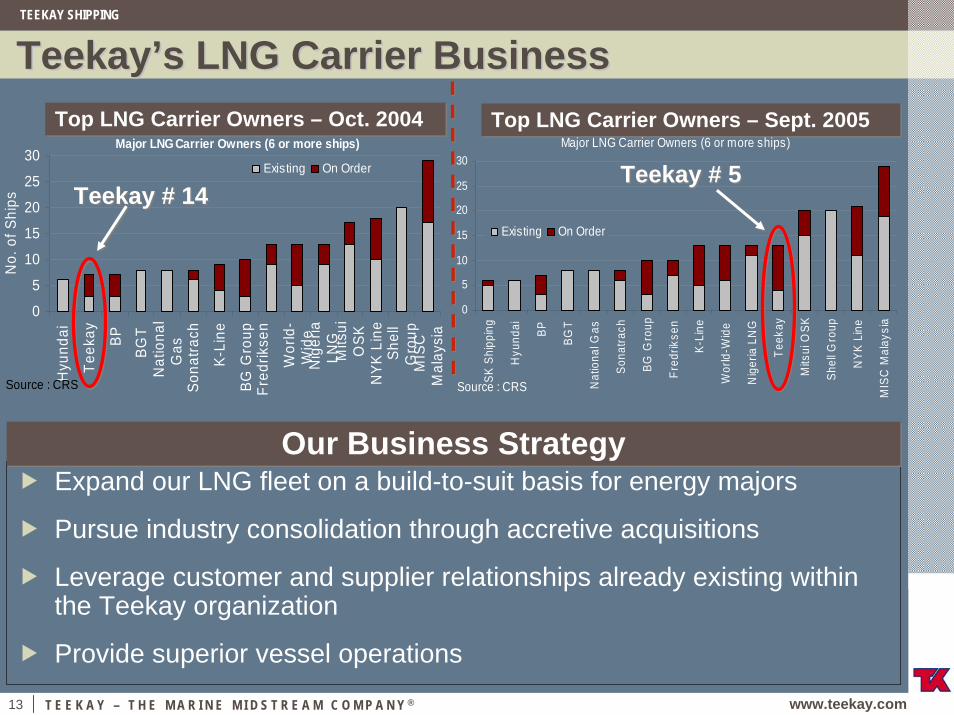
TeekayTeekay’’ss LNG Carrier BusinessLNG Carrier Business
Major LNG Carrier Owners (6 or more ships)
0
5
10
15
20
25
30
Hyu
ndai
Teek
ay BP
BGT
Nat
iona
lG
as
Sona
trach
K-Li
ne
BG G
roup
Fred
rikse
n
Wor
ld-
Wid
e N
iger
iaLN
G
Mits
uiO
SKN
YK L
ine
Shel
lG
roup
MIS
CM
alay
sia
Source : CRS
No.
of S
hips
Existing On Order
Top LNG Carrier Owners – Oct. 2004Top LNG Carrier Owners – Oct. 2004 Top LNG Carrier Owners – Sept. 2005Top LNG Carrier Owners – Sept. 2005
Teekay # 14Teekay # 14
Major LNG Carrier Owners (6 or more ships)
0
5
10
15
20
25
30
SK S
hipp
ing
Hyu
ndai
BP
BGT
Nat
iona
l Gas
Sona
trach
BG G
roup
Fred
rikse
n
K-Li
ne
Wor
ld-W
ide
Nig
eria
LN
G
Teek
ay
Mits
ui O
SK
Shel
l Gro
up
NYK
Lin
e
MIS
C M
alay
sia
Source : CRS
Existing On Order
Teekay # 5Teekay # 5
Expand our LNG fleet on a build-to-suit basis for energy majors
Pursue industry consolidation through accretive acquisitions
Leverage customer and supplier relationships already existing within the Teekay organization
Provide superior vessel operations
Our Business StrategyOur Business Strategy

TEEKAY SHIPPING
14 T E E K A Y – T H E M A R I N E M I D S T R E A M C O M P A N Y ® www.teekay.com
Delivery Schedule of Delivery Schedule of NewbuildingNewbuilding LNG CarriersLNG Carriers
RASGAS HULL #2238
RASGAS HULL #1643
RASGAS HULL #1644
RASGAS HULL #1645
RASGAS HULL #1646
Tangguh HULL #1780
Tangguh HULL #S298
RASGAS HULL #2239
RASGAS HULL #2240
2006 2007 2008LNG CARRIER FLEETSept.2005 2009
Ship DeliveryShip Delivery
Teekay’s share of the LNG orderbook ~$930 million Teekay’s share of the LNG orderbook ~$930 million

TEEKAY SHIPPING
15 T E E K A Y – T H E M A R I N E M I D S T R E A M C O M P A N Y ® www.teekay.com
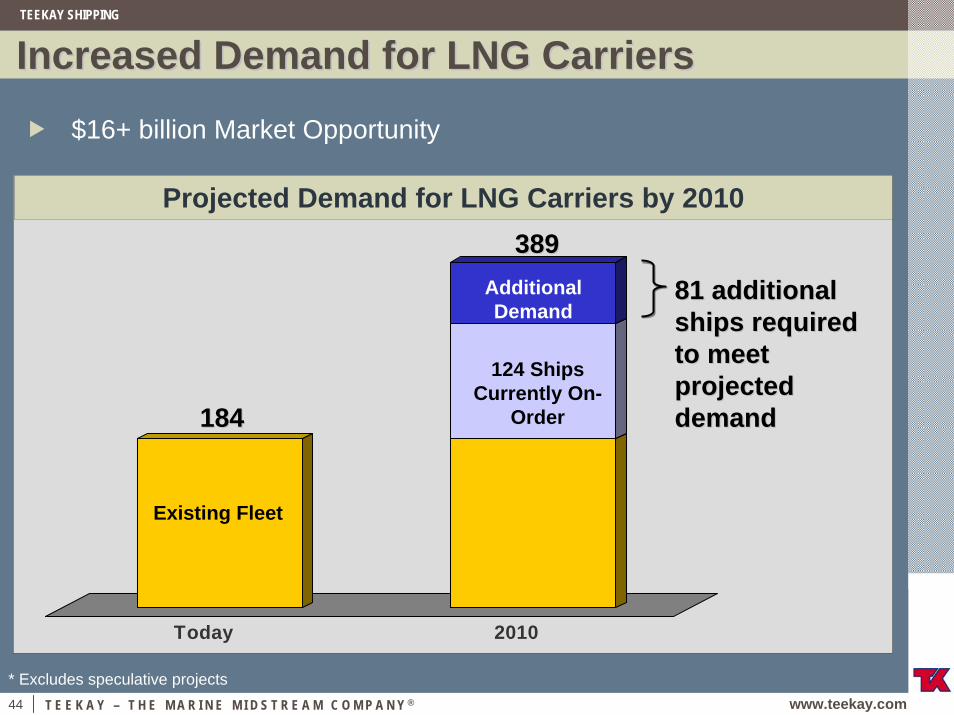
Increased Demand for LNG CarriersIncreased Demand for LNG Carriers
Today 2010
$16+ billion Market Opportunity
Projected Demand for LNG Carriers by 2010
Existing Fleet
124 Ships Currently On-
Order
81* additional 81* additional ships required ships required to meet to meet projected projected demanddemand
Additional Demand
389 389
184184
* Excludes speculative projects, Company Estimates
TEEKAY SHIPPING
16 T E E K A Y – T H E M A R I N E M I D S T R E A M C O M P A N Y ® www.teekay.com
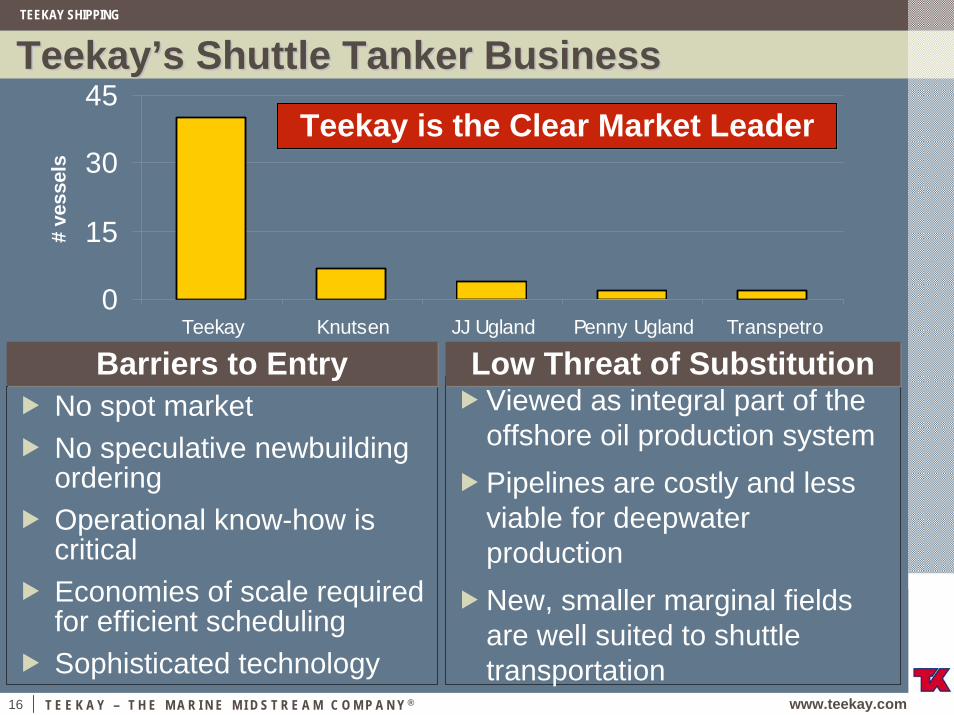
TeekayTeekay’’ss Shuttle Tanker BusinessShuttle Tanker Business
No spot market No speculative newbuildingorderingOperational know-how is criticalEconomies of scale required for efficient schedulingSophisticated technology
Barriers to EntryBarriers to EntryViewed as integral part of the offshore oil production systemPipelines are costly and less viable for deepwater production New, smaller marginal fields are well suited to shuttle transportation
Low Threat of SubstitutionLow Threat of Substitution
0
15
30
45
Teekay Knutsen JJ Ugland Penny Ugland Transpetro
# ve
ssel
s
Teekay is the Clear Market LeaderTeekay is the Clear Market Leader
TEEKAY SHIPPING
17 T E E K A Y – T H E M A R I N E M I D S T R E A M C O M P A N Y ® www.teekay.com
TeekayTeekay’’ss Shuttle Tanker BusinessShuttle Tanker Business
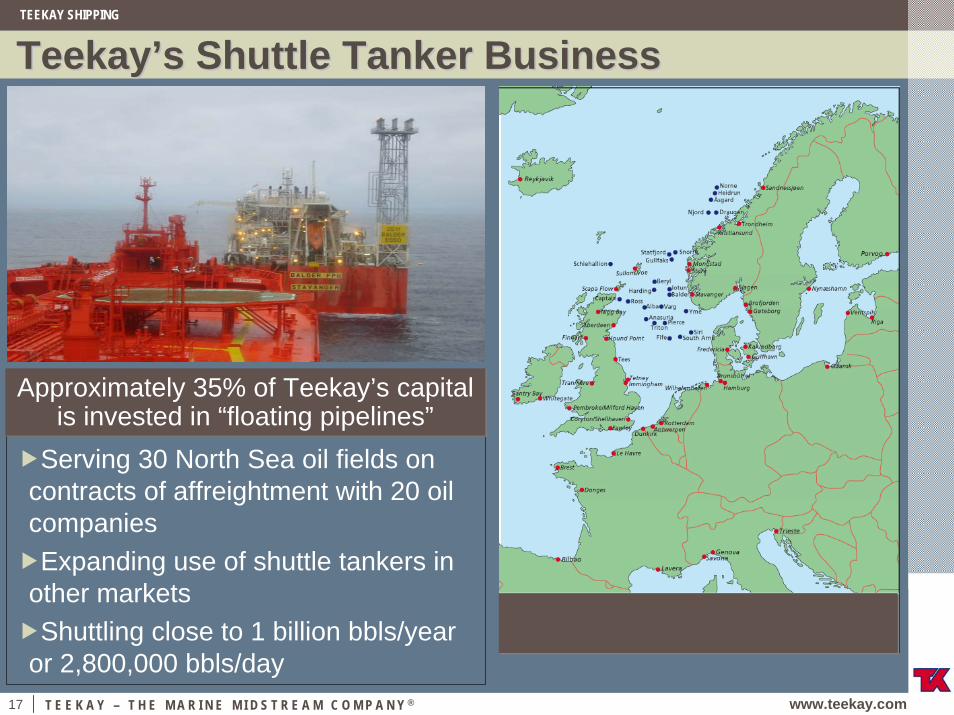
Serving 30 North Sea oil fields on contracts of affreightment with 20 oil companiesExpanding use of shuttle tankers in
other marketsShuttling close to 1 billion bbls/year
or 2,800,000 bbls/day
Approximately 35% of Teekay’s capital is invested in “floating pipelines”
Approximately 35% of Teekay’s capital is invested in “floating pipelines”
TEEKAY SHIPPING
18 T E E K A Y – T H E M A R I N E M I D S T R E A M C O M P A N Y ® www.teekay.com
TeekayTeekay’’ss Shuttle Tanker SegmentShuttle Tanker Segment
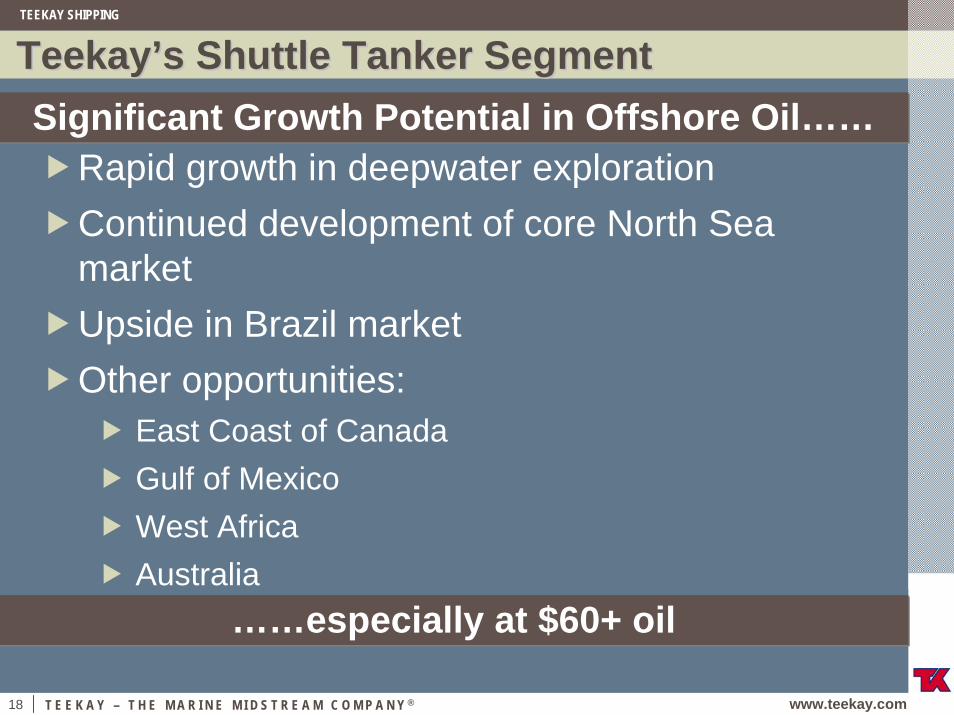
Rapid growth in deepwater explorationContinued development of core North Sea marketUpside in Brazil marketOther opportunities:
East Coast of CanadaGulf of MexicoWest AfricaAustralia
Significant Growth Potential in Offshore Oil……Significant Growth Potential in Offshore Oil……
……especially at $60+ oil……especially at $60+ oil
19 T E E K A Y – T H E M A R I N E M I D S T R E A M C O M P A N Y ® www.teekay.com
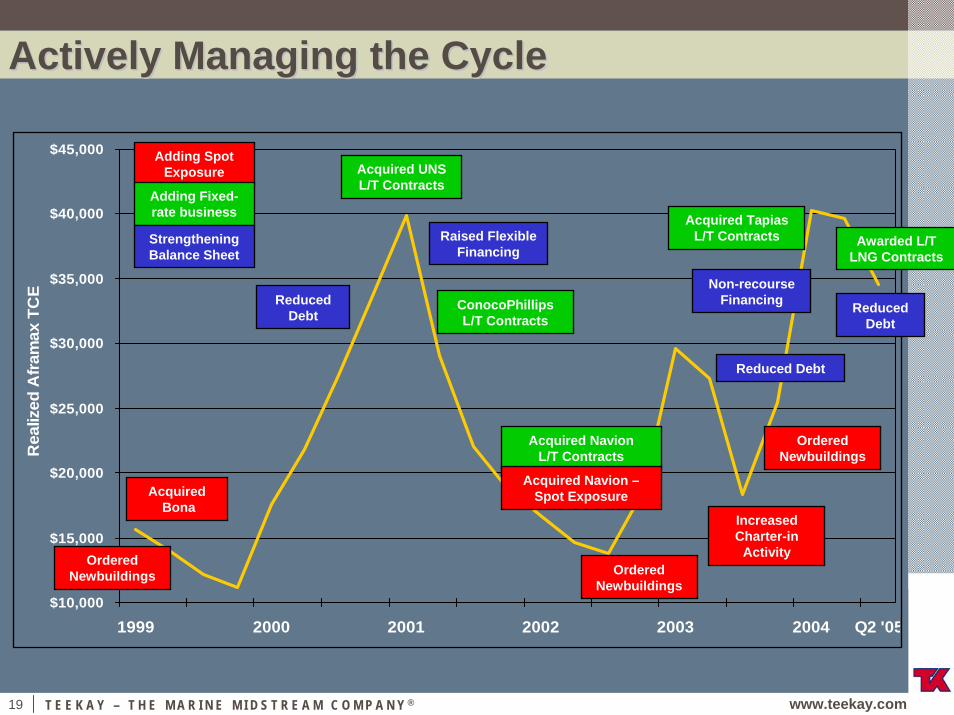
Actively Managing the CycleActively Managing the Cycle
$10,000
$15,000
$20,000
$25,000
$30,000
$35,000
$40,000
$45,000
1999 2000 2001 2002 2003 2004 Q2 '05
Rea
lized
Afra
max
TC
E
Acquired Navion L/T Contracts
Acquired UNS L/T Contracts
Raised Flexible Financing
Reduced Debt
Ordered Newbuildings
AcquiredBona
Ordered Newbuildings
Acquired Navion –Spot Exposure
ConocoPhillips L/T Contracts
Reduced Debt
Ordered Newbuildings
Acquired Tapias L/T Contracts
Adding Spot Exposure
Adding Fixed-rate business
Strengthening Balance Sheet
Non-recourse Financing
Increased Charter-in
Activity
Awarded L/T LNG Contracts
Reduced Debt
TEEKAY SHIPPING
20 T E E K A Y – T H E M A R I N E M I D S T R E A M C O M P A N Y ® www.teekay.com
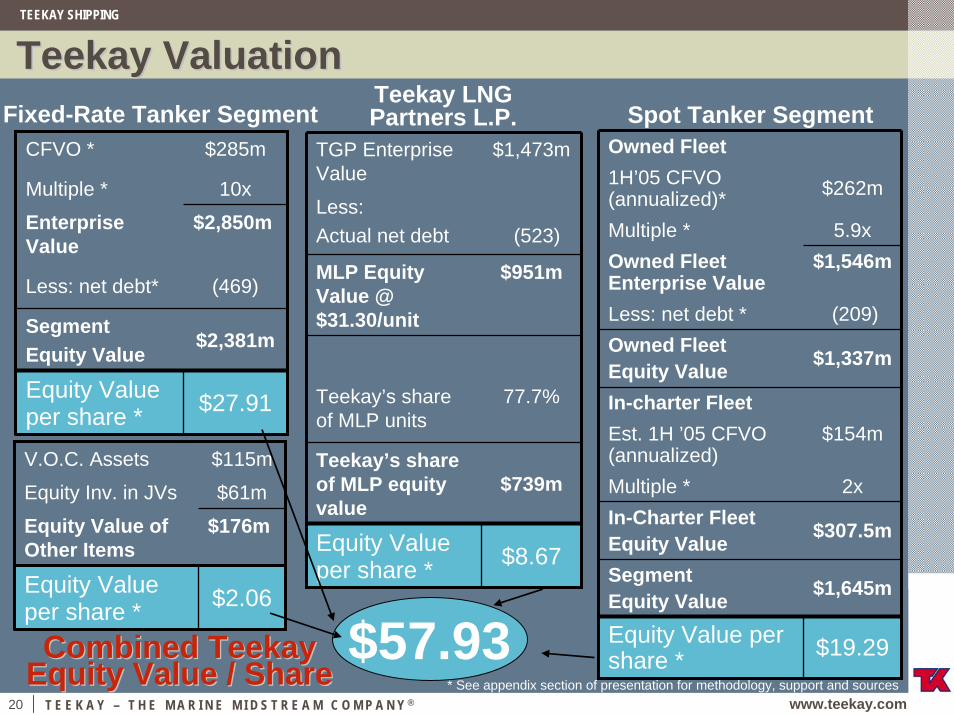
Teekay ValuationTeekay Valuation
CFVO * $285m
Multiple * 10x
Enterprise Value
$2,850m
Less: net debt* (469)
Segment Equity Value
$2,381m
Equity Value per share * $27.91
TGP Enterprise Value
$1,473m
Less: Actual net debt (523)
MLP Equity Value @ $31.30/unit
$951m
Teekay’s share of MLP units
77.7%
Teekay’s share of MLP equity value
$739m
Equity Value per share * $8.67
Teekay LNG Partners L.P.Fixed-Rate Tanker Segment
Owned Fleet1H’05 CFVO (annualized)* $262m
Multiple * 5.9xOwned Fleet Enterprise Value
$1,546m
Less: net debt * (209)Owned Fleet Equity Value $1,337m
In-charter FleetEst. 1H ’05 CFVO (annualized)
$154m
Multiple * 2xIn-Charter FleetEquity Value $307.5m
Segment Equity Value $1,645m
Equity Value per share * $19.29
Spot Tanker Segment
$57.93Combined Teekay Combined Teekay Equity Value / ShareEquity Value / Share * See appendix section of presentation for methodology, support and sources
V.O.C. Assets $115m
Equity Inv. in JVs $61m
Equity Value of Other Items
$176m
Equity Value per share * $2.06

TEEKAY SHIPPING
21 T E E K A Y – T H E M A R I N E M I D S T R E A M C O M P A N Y ® www.teekay.com
Financial HighlightsFinancial HighlightsNet income of $383m or $4.42 per share in 1H 2005
Reduced leverage from 42% to 34% in last 6 months
~ $300m or 6.9 million shares repurchased since Nov. ’04 => present authorization for additional $305m or 6.8 million shares
Dividend increased three times in past three years
When completed, over 16% of o/s
shares repurchased since Nov. ‘04
When completed, over 16% of o/s
shares repurchased since Nov. ‘04
Increased 93% in three years
Increased 93% in three years
ROE of ~20%ROE of ~20%
Near low end of target range
Near low end of target range
TEEKAY SHIPPING
22 T E E K A Y – T H E M A R I N E M I D S T R E A M C O M P A N Y ® www.teekay.com
$-
$0.50
$1.00
$1.50
$2.00
$2.50
$3.00
$10,0
00
$15,0
00
$20,0
00
$25,0
00
$30,0
00
$35,0
00
$40,0
00
$45,0
00
$50,0
00
$55,0
00
$60,0
00
Aframax Rates ($ per day)
Qua
rter
ly E
arni
ngs
Per S
hare
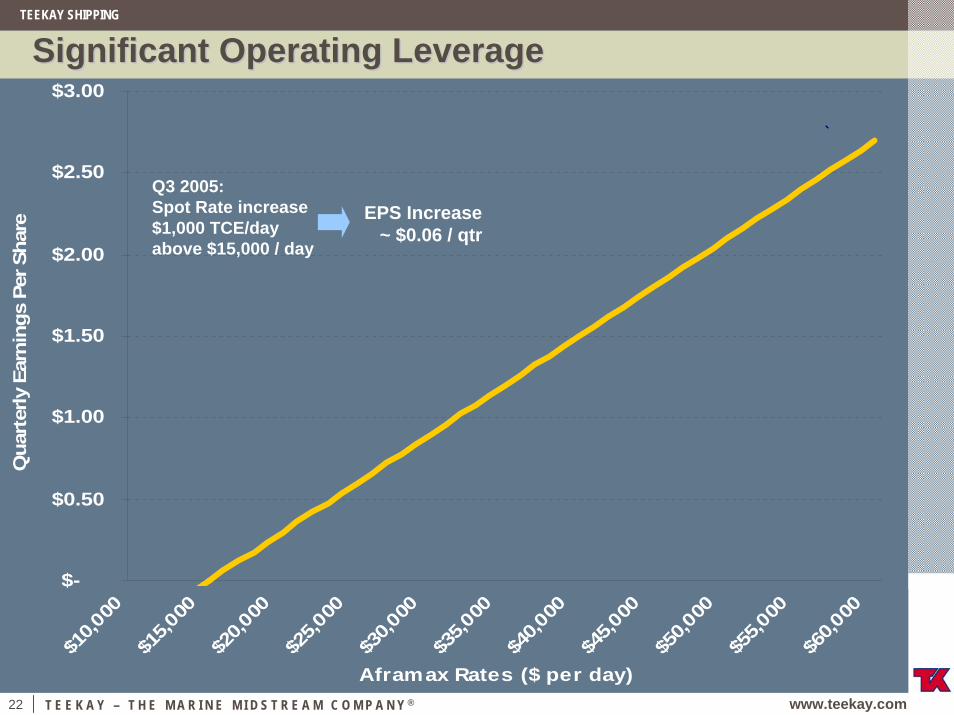
Significant Operating LeverageSignificant Operating Leverage
Q3 2005:Spot Rate increase $1,000 TCE/day above $15,000 / day
EPS Increase~ $0.06 / qtr
TEEKAY SHIPPING
23 T E E K A Y – T H E M A R I N E M I D S T R E A M C O M P A N Y ® www.teekay.com
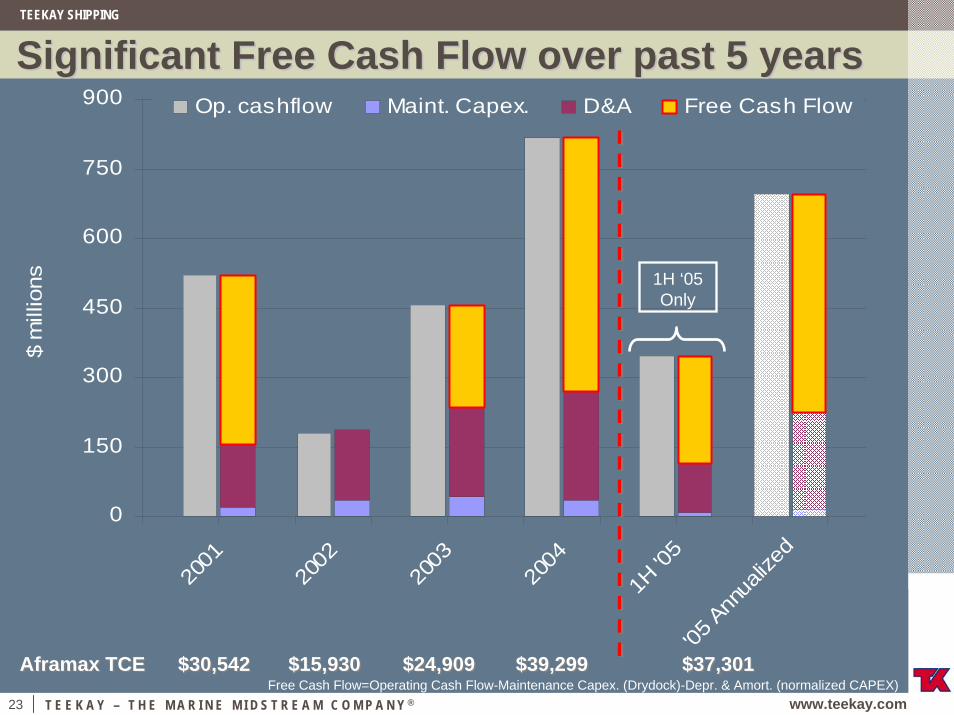
Significant Free Cash Flow over past 5 yearsSignificant Free Cash Flow over past 5 years
0
150
300
450
600
750
900
2001
2002
2003
2004
1H '0
5'05
Ann
ualiz
ed
$ m
illio
ns
Op. cashflow Maint. Capex. D&A Free Cash Flow
1H ‘05 Only
Aframax TCEAframax TCE $30,542$30,542 $15,930$15,930 $24,909$24,909 $39,299$39,299 $37,301$37,301Free Cash Flow=Operating Cash Flow-Maintenance Capex. (Drydock)-Depr. & Amort. (normalized CAPEX)
TEEKAY SHIPPING
24 T E E K A Y – T H E M A R I N E M I D S T R E A M C O M P A N Y ® www.teekay.com
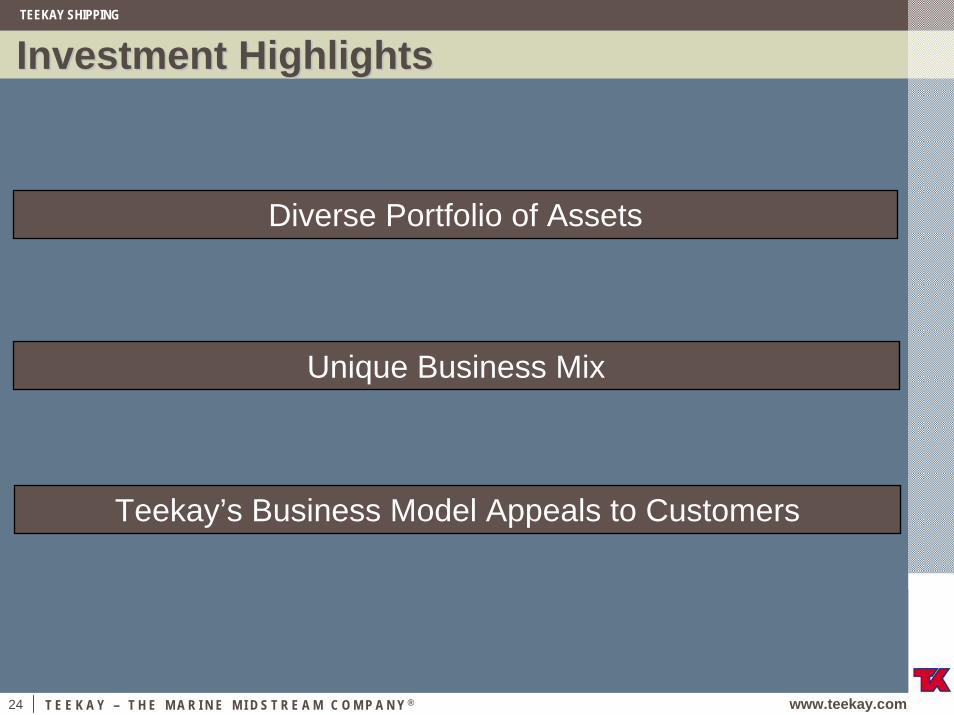
Investment HighlightsInvestment Highlights
Teekay’s Business Model Appeals to Customers
Diverse Portfolio of Assets
Unique Business Mix
www.teekay.com
T E E K A Y – T H E M A R I N E M I D S T R E A M C O M P A N Y ®
SM
AppendixAppendixTanker Market Slides
Teekay LNG Partners L.P.
Sum-of-parts Valuation Support
Fleet Breakdown
Non-GAAP Reconciliation

TEEKAY SHIPPING
26 T E E K A Y – T H E M A R I N E M I D S T R E A M C O M P A N Y ® www.teekay.com
Crude Tanker Spot MarketCrude Tanker Spot Market
0
25,000
50,000
75,000
100,000
125,000
150,000
175,0001q
99
3q99
1q00
3q00
1q01
3q01
1q02
3q02
1q03
3q03
1q04
3q04
1q05
3q05
ytd
Source: CRS
US$
per
Day
Aframax Suezmax VLCC

TEEKAY SHIPPING
27 T E E K A Y – T H E M A R I N E M I D S T R E A M C O M P A N Y ® www.teekay.com
Product Tanker Spot MarketProduct Tanker Spot Market
0
10,000
20,000
30,000
40,000
50,000
60,000
70,000
80,0001q
99
3q99
1q00
3q00
1q01
3q01
1q02
3q02
1q03
3q03
1q04
3q04
1q05
3q05
ytd
Source: CRS
US
$ pe
r Day
LR2 LR1 MR
TEEKAY SHIPPING
28 T E E K A Y – T H E M A R I N E M I D S T R E A M C O M P A N Y ® www.teekay.com
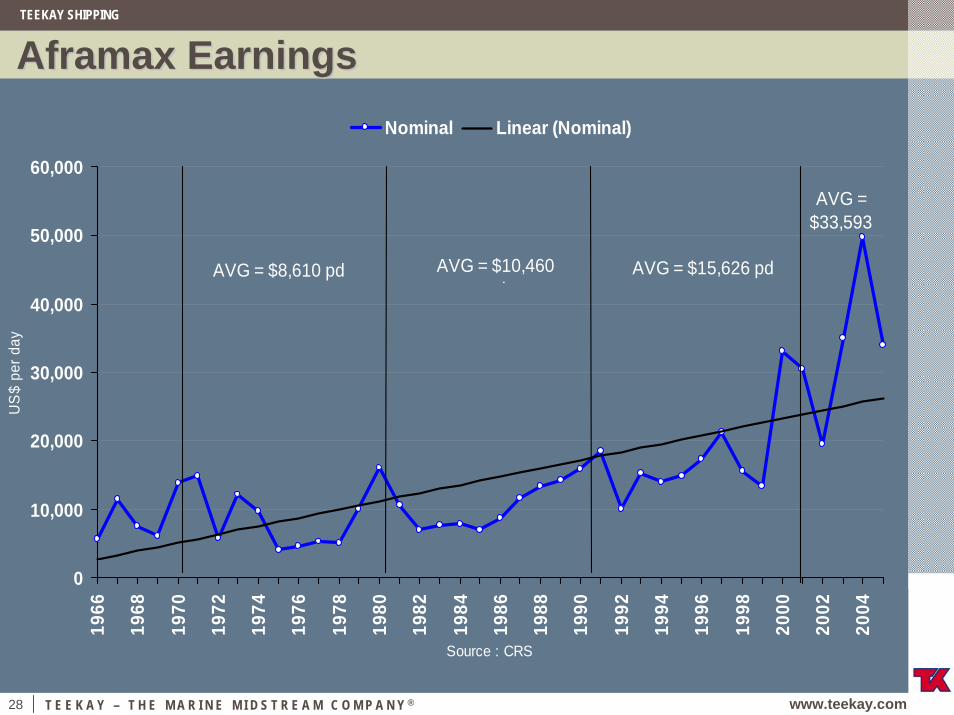
Aframax EarningsAframax Earnings
0
10,000
20,000
30,000
40,000
50,000
60,000
1966
1968
1970
1972
1974
1976
1978
1980
1982
1984
1986
1988
1990
1992
1994
1996
1998
2000
2002
2004
Source : CRS
US
$ pe
r day
Nominal Linear (Nominal)
AVG = $8,610 pd AVG = $10,460 d
AVG = $15,626 pd
AVG = $33,593
TEEKAY SHIPPING
29 T E E K A Y – T H E M A R I N E M I D S T R E A M C O M P A N Y ® www.teekay.com
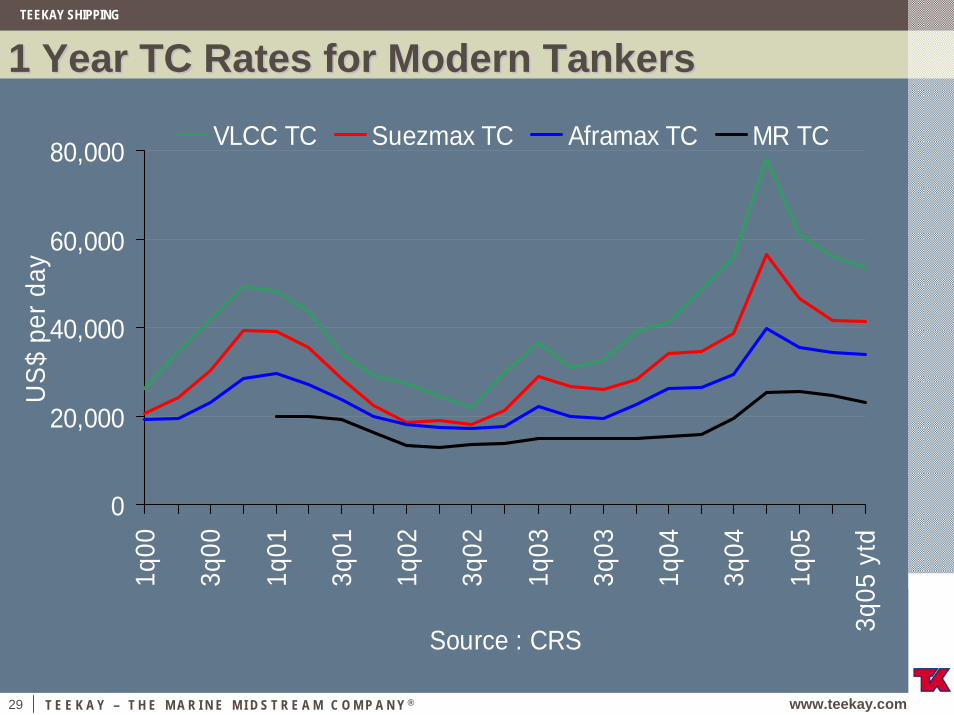
1 Year TC Rates for Modern Tankers1 Year TC Rates for Modern Tankers
0
20,000
40,000
60,000
80,0001q
00
3q00
1q01
3q01
1q02
3q02
1q03
3q03
1q04
3q04
1q05
3q05
ytd
Source : CRS
US
$ pe
r day
VLCC TC Suezmax TC Aframax TC MR TC

TEEKAY SHIPPING
30 T E E K A Y – T H E M A R I N E M I D S T R E A M C O M P A N Y ® www.teekay.com
Oil Demand Growth Estimate Oil Demand Growth Estimate
64
70
76
82
88
94
1q02
3q02
1q03
3q03
1q04
3q04
1q05
3q05
E
1q06
E
3q06
E
Source : IEA
Oil
Dem
and
/ Sup
ply-
MB
/D
500
800
1,100
1,400
1,700
2,000
OEC
D In
dust
ry S
tock
s - M
ill. B
bl.
World oil demand OECD Industry Stocks World oil supply
Estimated winter oil demand is 3.0 mb/d higher
than 3q05 demandInventory growth forms part of OPEC strategy to
meet 4q05 peak oil demand
2006 Forecast: 2.1% oil demand growth
TEEKAY SHIPPING
31 T E E K A Y – T H E M A R I N E M I D S T R E A M C O M P A N Y ® www.teekay.com
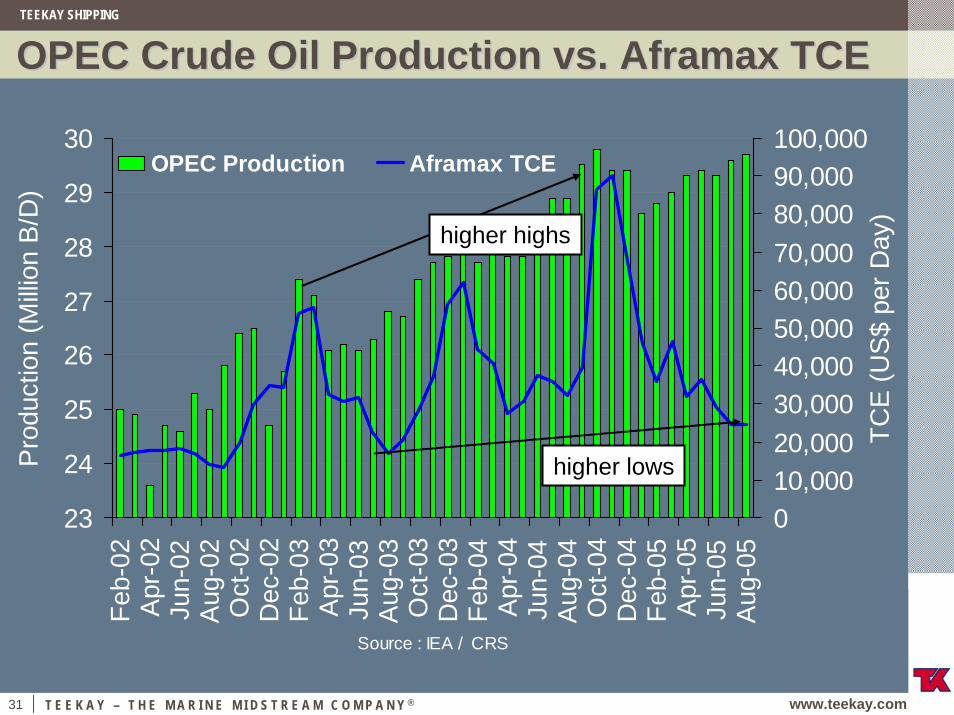
OPEC Crude Oil Production vs. Aframax TCEOPEC Crude Oil Production vs. Aframax TCE
23
24
25
26
27
28
29
30Fe
b-02
Apr
-02
Jun-
02Au
g-02
Oct
-02
Dec
-02
Feb-
03A
pr-0
3Ju
n-03
Aug-
03O
ct-0
3D
ec-0
3Fe
b-04
Apr
-04
Jun-
04Au
g-04
Oct
-04
Dec
-04
Feb-
05A
pr-0
5Ju
n-05
Aug-
05
Source : IEA / CRS
Pro
duct
ion
(Milli
on B
/D)
010,00020,00030,00040,00050,00060,00070,00080,00090,000100,000
TCE
(US$
per
Day
)
OPEC Production Aframax TCE
higher highs
higher lows

TEEKAY SHIPPING
32 T E E K A Y – T H E M A R I N E M I D S T R E A M C O M P A N Y ® www.teekay.com
OPEC Crude Output vs. Aframax TCEOPEC Crude Output vs. Aframax TCE’’ss
23
24
25
26
27
28
29
30
1q99
3q99
1q00
3q00
1q01
3q01
1q02
3q02
1q03
3q03
1q04
3q04
1q05
3q05
ytd
Source : IEA/CRS
Mill
ion
Bbl
s/D
ay
0
10,000
20,000
30,000
40,000
50,000
60,000
70,000
80,000
90,000
US
$/D
ay
OPEC crude prod. Aframax Average
TEEKAY SHIPPING
33 T E E K A Y – T H E M A R I N E M I D S T R E A M C O M P A N Y ® www.teekay.com
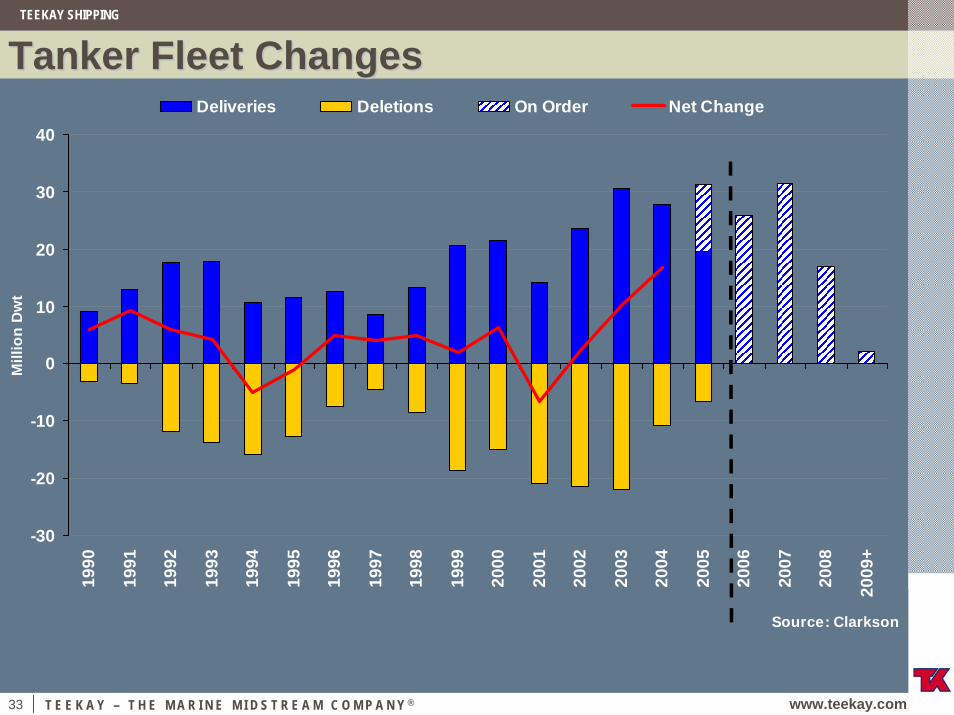
Tanker Fleet ChangesTanker Fleet Changes
-30
-20
-10
0
10
20
30
40
1990
1991
1992
1993
1994
1995
1996
1997
1998
1999
2000
2001
2002
2003
2004
2005
2006
2007
2008
2009
+
Source: Clarkson
Mill
ion
Dw
t
Deliveries Deletions On Order Net Change
TEEKAY SHIPPING
34 T E E K A Y – T H E M A R I N E M I D S T R E A M C O M P A N Y ® www.teekay.com
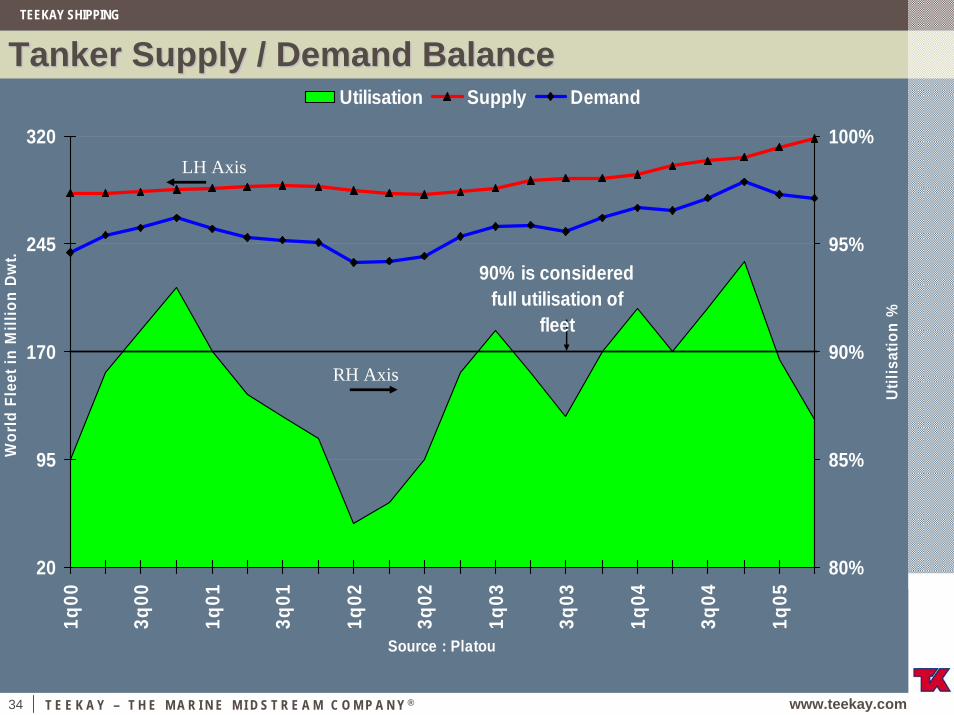
Tanker Supply / Demand BalanceTanker Supply / Demand Balance
20
95
170
245
320
1q00
3q00
1q01
3q01
1q02
3q02
1q03
3q03
1q04
3q04
1q05
Source : Platou
Wor
ld F
leet
in M
illio
n D
wt.
80%
85%
90%
95%
100%
Util
isat
ion
%
Utilisation Supply Demand
90% is considered full utilisation of
fleet
LH Axis
RH Axis
TEEKAY SHIPPING
35 T E E K A Y – T H E M A R I N E M I D S T R E A M C O M P A N Y ® www.teekay.com
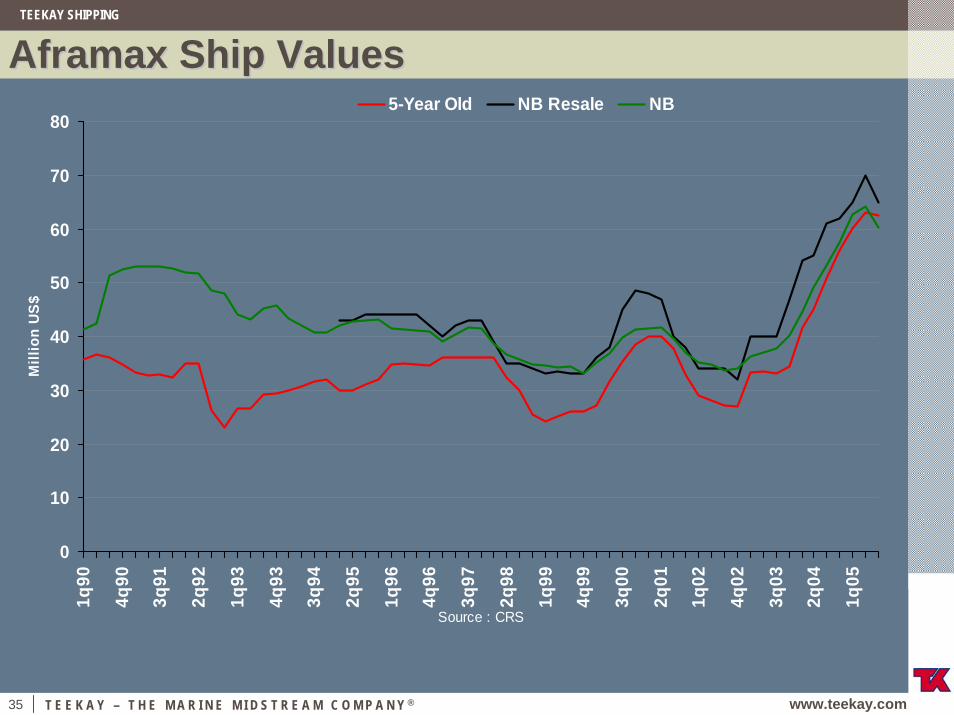
Aframax Ship ValuesAframax Ship Values
0
10
20
30
40
50
60
70
80
1q90
4q90
3q91
2q92
1q93
4q93
3q94
2q95
1q96
4q96
3q97
2q98
1q99
4q99
3q00
2q01
1q02
4q02
3q03
2q04
1q05
Source : CRS
Mill
ion
US$
5-Year Old NB Resale NB

www.teekay.com
T E E K A Y – T H E M A R I N E M I D S T R E A M C O M P A N Y ®
SM
TEEKAY LNG PARTNERS L.P.TEEKAY LNG TEEKAY LNG PARTNERS L.P.PARTNERS L.P.

TEEKAY SHIPPING
37 T E E K A Y – T H E M A R I N E M I D S T R E A M C O M P A N Y ® www.teekay.com
TeekayTeekay’’ss LNG Carrier OverviewLNG Carrier Overview
Teekay Shipping CorporationEnterprise Value = $5.0 billion
Teekay Shipping CorporationEnterprise Value = $5.0 billion
Teekay GP L.L.C.(General Partner)
Teekay GP L.L.C.(General Partner)
Public Unitholders
Public Unitholders75.7%75.7%
22.3%22.3%
100%100%
2.0%2.0% Teekay LNG Partners L.P.
9 Vessels
Current LNG Fleet
Current Oil Tanker Fleet
LNG Carriers On-Order
5 Vessels4 Vessels
TEEKAY SHIPPING
38 T E E K A Y – T H E M A R I N E M I D S T R E A M C O M P A N Y ® www.teekay.com
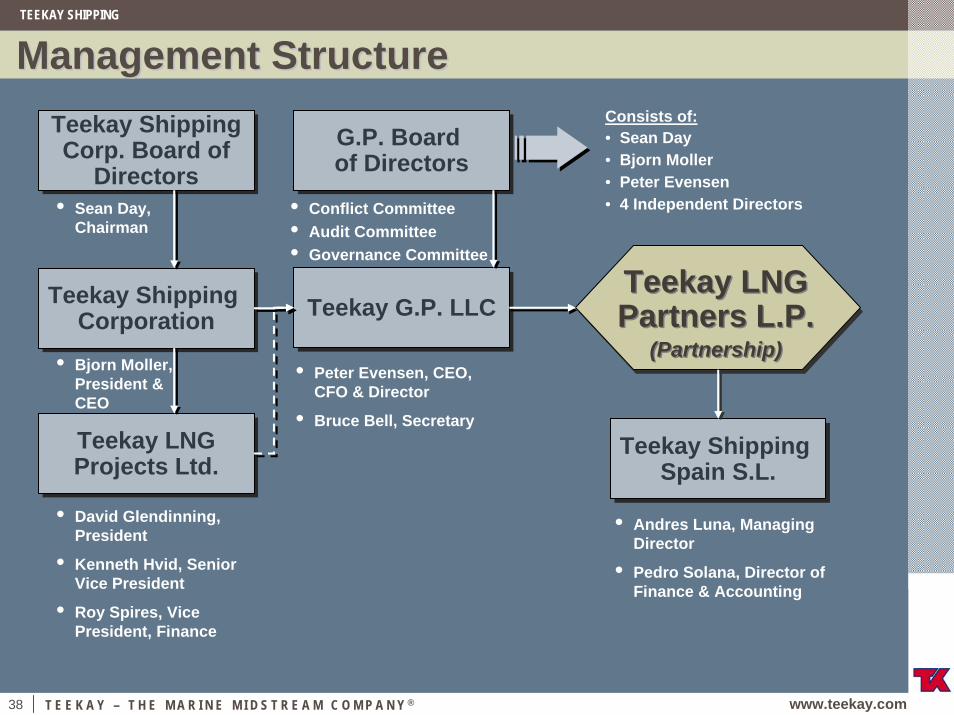
Management StructureManagement StructureConsists of:• Sean Day• Bjorn Moller• Peter Evensen• 4 Independent Directors
Teekay Shipping Corp. Board of
Directors
Teekay Shipping Corp. Board of
Directors
Teekay LNG Partners L.P.
(Partnership)
Teekay LNG Partners L.P.
(Partnership)
G.P. Board of DirectorsG.P. Board of Directors
Teekay Shipping Corporation
Teekay Shipping Corporation Teekay G.P. LLCTeekay G.P. LLC
Teekay LNGProjects Ltd.Teekay LNGProjects Ltd.
Teekay Shipping Spain S.L.
Teekay Shipping Spain S.L.
• Peter Evensen, CEO, CFO & Director
• Bruce Bell, Secretary
• Conflict Committee• Audit Committee• Governance Committee
• Bjorn Moller, President & CEO
• Sean Day, Chairman
• David Glendinning, President
• Kenneth Hvid, Senior Vice President
• Roy Spires, Vice President, Finance
• Andres Luna, Managing Director
• Pedro Solana, Director of Finance & Accounting
TEEKAY SHIPPING
39 T E E K A Y – T H E M A R I N E M I D S T R E A M C O M P A N Y ® www.teekay.com
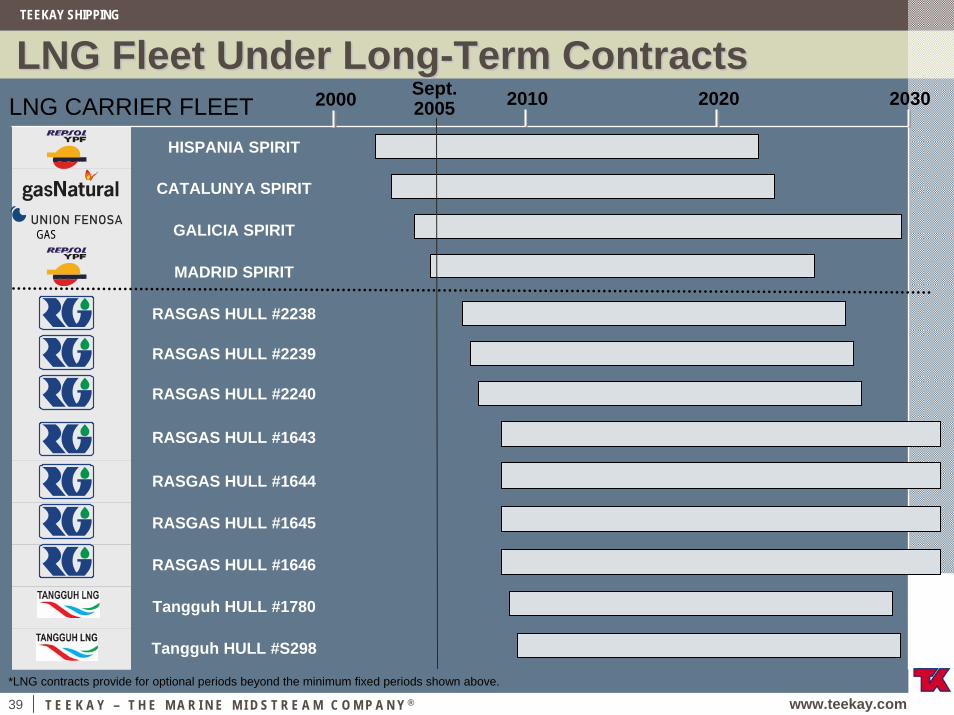
LNG Fleet Under LongLNG Fleet Under Long--Term ContractsTerm Contracts
HISPANIA SPIRIT
RASGAS HULL #1643
RASGAS HULL #1644
RASGAS HULL #1645
RASGAS HULL #1646
Tangguh HULL #1780
Tangguh HULL #S298
CATALUNYA SPIRIT
GALICIA SPIRIT
MADRID SPIRIT
RASGAS HULL #2238
RASGAS HULL #2239
RASGAS HULL #2240
2010 2020 2030
GAS
2000 Sept.2005LNG CARRIER FLEET
*LNG contracts provide for optional periods beyond the minimum fixed periods shown above.
TEEKAY SHIPPING
40 T E E K A Y – T H E M A R I N E M I D S T R E A M C O M P A N Y ® www.teekay.com
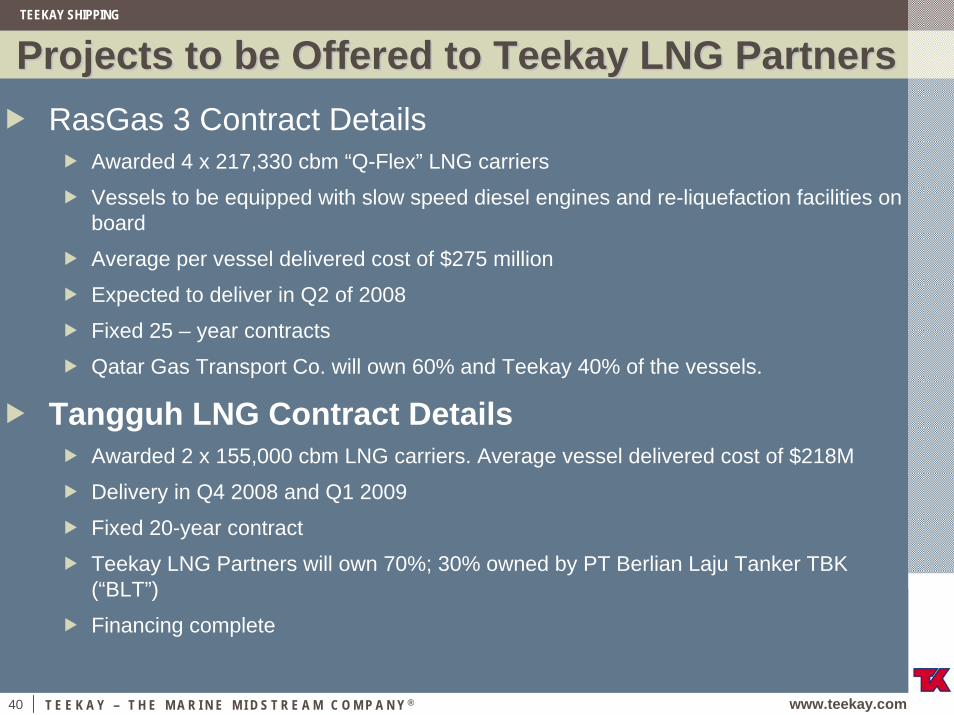
Projects to be Offered to Teekay LNG PartnersProjects to be Offered to Teekay LNG PartnersRasGas 3 Contract Details
Awarded 4 x 217,330 cbm “Q-Flex” LNG carriers
Vessels to be equipped with slow speed diesel engines and re-liquefaction facilities on board
Average per vessel delivered cost of $275 million
Expected to deliver in Q2 of 2008
Fixed 25 – year contracts
Qatar Gas Transport Co. will own 60% and Teekay 40% of the vessels.
Tangguh LNG Contract DetailsAwarded 2 x 155,000 cbm LNG carriers. Average vessel delivered cost of $218M
Delivery in Q4 2008 and Q1 2009
Fixed 20-year contract
Teekay LNG Partners will own 70%; 30% owned by PT Berlian Laju Tanker TBK (“BLT”)
Financing complete
TEEKAY SHIPPING
41 T E E K A Y – T H E M A R I N E M I D S T R E A M C O M P A N Y ® www.teekay.com
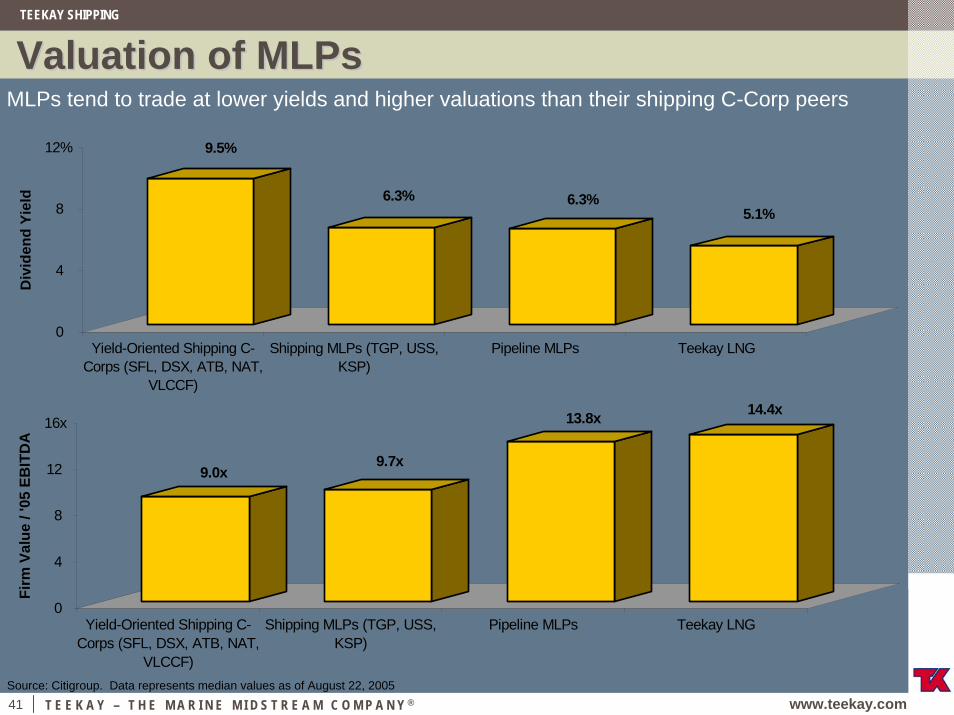
Valuation of Valuation of MLPsMLPsMLPs tend to trade at lower yields and higher valuations than their shipping C-Corp peers
9.5%
6.3% 6.3%5.1%
0
4
8
12%
Div
iden
d Yi
eld
Yield-Oriented Shipping C-Corps (SFL, DSX, ATB, NAT,
VLCCF)
Shipping MLPs (TGP, USS,KSP)
Pipeline MLPs Teekay LNG
9.0x9.7x
13.8x 14.4x
0
4
8
12
16x
Firm
Val
ue /
'05
EBIT
DA
Yield-Oriented Shipping C-Corps (SFL, DSX, ATB, NAT,
VLCCF)
Shipping MLPs (TGP, USS,KSP)
Pipeline MLPs Teekay LNG
Source: Citigroup. Data represents median values as of August 22, 2005
www.teekay.com
T E E K A Y – T H E M A R I N E M I D S T R E A M C O M P A N Y ®
SM
NEW LNG PROJECTSNEW LNG NEW LNG PROJECTSPROJECTS
TEEKAY SHIPPING
43 T E E K A Y – T H E M A R I N E M I D S T R E A M C O M P A N Y ® www.teekay.com
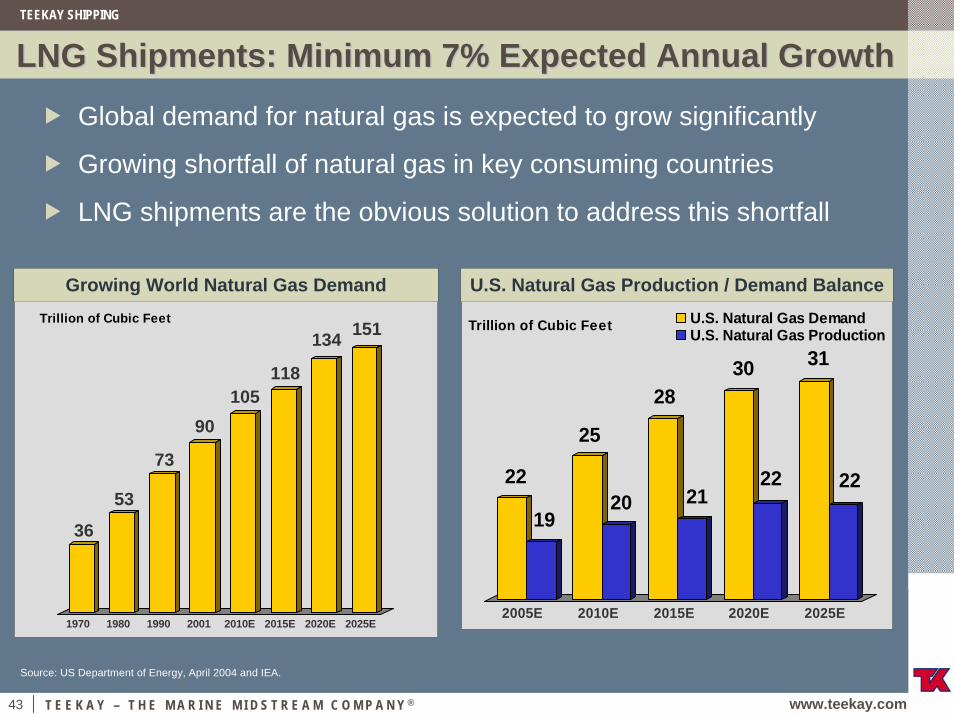
LNG Shipments: Minimum 7% Expected Annual GrowthLNG Shipments: Minimum 7% Expected Annual Growth
Global demand for natural gas is expected to grow significantly
Growing shortfall of natural gas in key consuming countries
LNG shipments are the obvious solution to address this shortfall
36
53
73
90105
118
134 151
1970 1980 1990 2001 2010E 2015E 2020E 2025E
Trillion of Cubic Feet
Growing World Natural Gas Demand U.S. Natural Gas Production / Demand Balance
22
19
25
20
28
21
30
22
31
22
2005E 2010E 2015E 2020E 2025E
Trillion of Cubic Feet U.S. Natural Gas DemandU.S. Natural Gas Production
Source: US Department of Energy, April 2004 and IEA.
TEEKAY SHIPPING
44 T E E K A Y – T H E M A R I N E M I D S T R E A M C O M P A N Y ® www.teekay.com
Increased Demand for LNG CarriersIncreased Demand for LNG Carriers
Today 2010
$16+ billion Market Opportunity
Projected Demand for LNG Carriers by 2010
Existing Fleet
124 Ships Currently On-
Order
81 additional 81 additional ships required ships required to meet to meet projected projected demanddemand
Additional Demand
389 389
184184
* Excludes speculative projects

TEEKAY SHIPPING
45 T E E K A Y – T H E M A R I N E M I D S T R E A M C O M P A N Y ® www.teekay.com
Securing Our Share of the Market OpportunitySecuring Our Share of the Market Opportunity
$16+ billion LNG Market
OpportunityCost of CapitalCost of Capital
Ship Yard Relationships
Ship Yard Relationships
Customer Relationships
Customer Relationships
Operational Excellence
Operational Excellence
Industry ReputationIndustry
Reputation
Technical Expertise
Technical Expertise
Project Management
Project Management
Operating Cost Competitiveness
Teekay LNG has a winning formulaTeekay LNG has a winning formula
TEEKAY SHIPPING
46 T E E K A Y – T H E M A R I N E M I D S T R E A M C O M P A N Y ® www.teekay.com
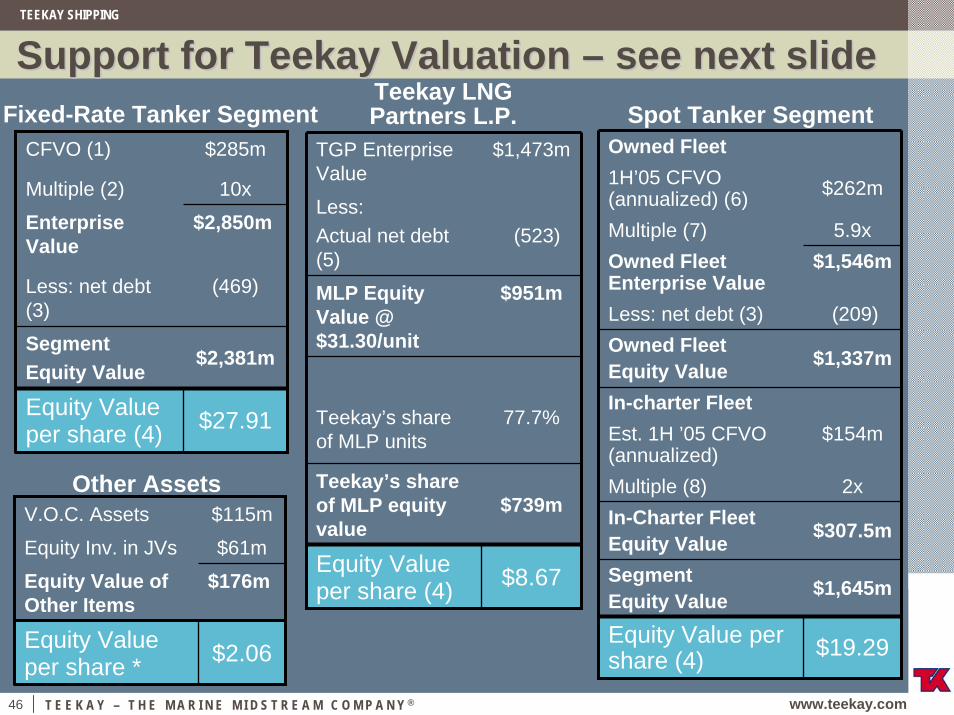
Support for Teekay Valuation Support for Teekay Valuation –– see next slidesee next slideTeekay LNG Partners L.P.Fixed-Rate Tanker Segment Spot Tanker Segment
CFVO (1) $285m
Multiple (2) 10x
Enterprise Value
$2,850m
Less: net debt (3)
(469)
Segment Equity Value
$2,381m
Equity Value per share (4) $27.91
TGP Enterprise Value
$1,473m
Less: Actual net debt (5)
(523)
MLP Equity Value @ $31.30/unit
$951m
Teekay’s share of MLP units
77.7%
Teekay’s share of MLP equity value
$739m
Equity Value per share (4) $8.67
Owned Fleet1H’05 CFVO (annualized) (6) $262m
Multiple (7) 5.9xOwned Fleet Enterprise Value
$1,546m
Less: net debt (3) (209)Owned Fleet Equity Value $1,337m
In-charter FleetEst. 1H ’05 CFVO (annualized)
$154m
Multiple (8) 2xIn-Charter FleetEquity Value $307.5m
Segment Equity Value $1,645m
Equity Value per share (4) $19.29
V.O.C. Assets $115m
Equity Inv. in JVs $61m
Equity Value of Other Items
$176m
Equity Value per share * $2.06
Other Assets
TEEKAY SHIPPING
47 T E E K A Y – T H E M A R I N E M I D S T R E A M C O M P A N Y ® www.teekay.com
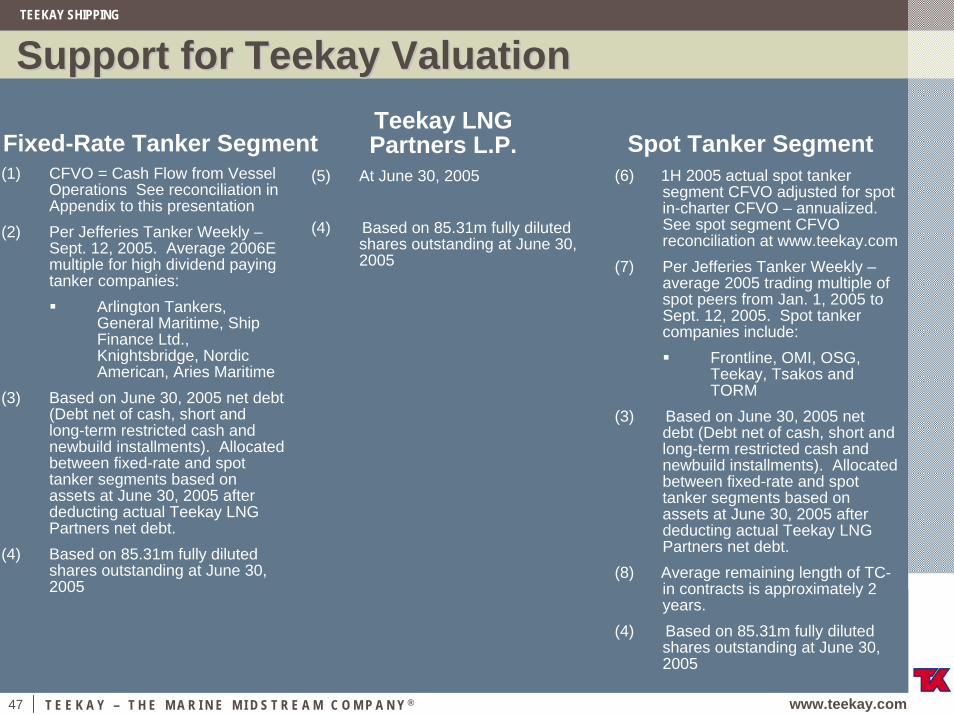
Support for Teekay ValuationSupport for Teekay Valuation
Fixed-Rate Tanker SegmentTeekay LNG Partners L.P. Spot Tanker Segment
(1) CFVO = Cash Flow from Vessel Operations See reconciliation in Appendix to this presentation
(2) Per Jefferies Tanker Weekly –Sept. 12, 2005. Average 2006E multiple for high dividend paying tanker companies:
Arlington Tankers, General Maritime, Ship Finance Ltd., Knightsbridge, Nordic American, Aries Maritime
(3) Based on June 30, 2005 net debt (Debt net of cash, short and long-term restricted cash and newbuild installments). Allocated between fixed-rate and spot tanker segments based on assets at June 30, 2005 after deducting actual Teekay LNG Partners net debt.
(4) Based on 85.31m fully diluted shares outstanding at June 30, 2005
(5) At June 30, 2005
(4) Based on 85.31m fully diluted shares outstanding at June 30, 2005
(6) 1H 2005 actual spot tanker segment CFVO adjusted for spot in-charter CFVO – annualized. See spot segment CFVO reconciliation at www.teekay.com
(7) Per Jefferies Tanker Weekly –average 2005 trading multiple of spot peers from Jan. 1, 2005 to Sept. 12, 2005. Spot tanker companies include:
Frontline, OMI, OSG, Teekay, Tsakos and TORM
(3) Based on June 30, 2005 net debt (Debt net of cash, short and long-term restricted cash and newbuild installments). Allocated between fixed-rate and spot tanker segments based on assets at June 30, 2005 after deducting actual Teekay LNG Partners net debt.
(8) Average remaining length of TC-in contracts is approximately 2 years.
(4) Based on 85.31m fully diluted shares outstanding at June 30, 2005
TEEKAY SHIPPING
48 T E E K A Y – T H E M A R I N E M I D S T R E A M C O M P A N Y ® www.teekay.com
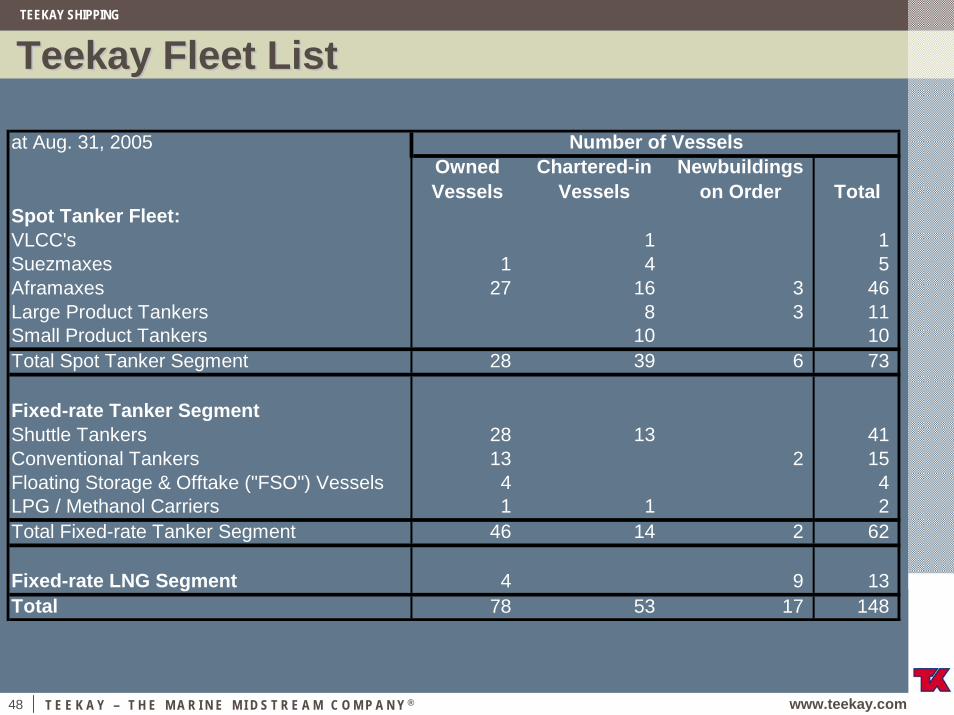
Teekay Fleet ListTeekay Fleet List
at Aug. 31, 2005Owned Vessels
Chartered-in Vessels
Newbuildings on Order Total
Spot Tanker Fleet:VLCC's 1 1 Suezmaxes 1 4 5 Aframaxes 27 16 3 46 Large Product Tankers 8 3 11 Small Product Tankers 10 10 Total Spot Tanker Segment 28 39 6 73
Fixed-rate Tanker SegmentShuttle Tankers 28 13 41 Conventional Tankers 13 2 15 Floating Storage & Offtake ("FSO") Vessels 4 4 LPG / Methanol Carriers 1 1 2 Total Fixed-rate Tanker Segment 46 14 2 62
Fixed-rate LNG Segment 4 9 13 Total 78 53 17 148
Number of Vessels

TEEKAY SHIPPING
49 T E E K A Y – T H E M A R I N E M I D S T R E A M C O M P A N Y ® www.teekay.com
NonNon--GAAP ReconciliationGAAP ReconciliationCash flow from vessel operations represents income from vessel operations before depreciation and amortization expense and vessel write-downs/(gain) loss on sale of vessels. Cash flow from vessel operations is a non-GAAP financial measure used by certain investors to measure the financial performance of shipping companies. Cash flow from operations is not required by accounting principles generally accepted in the United States and should not be considered as an alternative to net income or any other indicator of the Company's performance required by accounting principles generally accepted in the United States. The following table reconciles this non-GAAP measure as used in this presentation to the most directly comparable GAAP financial measure for the periods presented.
Year Ended
Dec. 31, 2005
Projection for Fixed-rate Tanker Segment
Income From Vessel Operations 160,000
Depreciation and Amortization 125,000
Cash flow from vessel operations 285,000