technology flows and foreign investment in the australian manufacturing sector*
TRANSCRIPT

TECHNOLOGY FLOWS AND FOREIGN INVESTMENT
IN THE AUSTRALIAN MANUFACTURING SECTOR*
THOMAS G. PARRY* and J. F. WATSON
University of New South Wales
Among the various issues of concern to countries which are host to foreign direct investment, usually via the multinational enterprise (MNE),' the nature of technology flows associated with MNE operations is of considerable importance. For Australia, with a significant proportion of the manufacturing sector foreign owned and controlled, the overseas sector has long been recognized as the major source of new technology.2 The apparent technological dependence of the manufacturing sector, coupled with the degree of foreign ownership in manufacturing, raises a number of important issues with policy significance (see [ 101 ).
First, given the reliance on overseas technology, both via direct foreign investment as well as through independent licensing arrangements with non-affiliated firms abroad, what is the extent of actual research and development (R&D) work undertaken within Australia by foreign subsidiaries? One of the concerns over foreign ownership is that it tends to decrease the extent of local R&D and reinforces reliance on imported tech- nology (see [ 151 ). Implicit in this concern is the belief that dependence on foreign tech- nology is not altogether desirable.
Apart from the desirability or otherwise of reliance on overseas technology, an im- portant question concerns the actual channels of access to foreign technology available to and used by the foreign subsidiary. In part, interest in the channels of access to overseas technology reflects an interest in the broader question of the nature of technology trans- fer mechanisms. In addition, identifying the channels of access to overseas technology which are actually used by established subsidiaries may give an indication of the feasibility of by-passing foreign direct investment while still securing access to overseas technology. Thus, for example, if independent technology licensing appears more important than intra-MNE technology transfer, there may be a case, ceteris paribus, for by-passing foreign direct investment if technology is the major element sought in a particular industry or process.
Whatever the actual sources of access to overseas technology, including both affiliated and non-affiliated firms abroad, the freedom of access and the terms of access raise a
*The assistance of an A.R.G.C. award is gratefully acknowledged. A referee has provided especially valuable comments and suggestions. See, for example, [ 11 1 for a survey of these general issues. The technological dependence of the Australian manufacturing sector has been established in a number of studies, including [3, 7 , 1 3 , s J .
103

104 AUSTRALIAN ECONOMIC PAPERS JUNE
number of important issues. On the one hand, there is concern over whether the overseas affiliate provides access to all of its latest technology; the costs of obtaining that tech- nology from the overseas affiliate compared with independent licensing, if this is at all possible; and, the nature of restrictions imposed on the subsidiary in the use of that te~hnology.~ On the other hand, the nature of non-affiliate technology obtained by the subsidiary, particularly in comparison with technology obtained from the overseas affi- liate, is of considerable interest. Again, the freedom of access to new technology on the “open market”, licensing from non-affiliated firms abroad, the costs of such licensing and the nature of restrictions imposed on the use of the technology, all determine the terms of access to overseas technology from independent overseas firms compared with tied arrangements with the overseas affiliate.
Closely related to the terms of access to overseas technology from both affiliated and non-affiliated foreign firms is the nature of modification of overseas technology for the host market. For the smaller, developed host market such as Australia, there are potential problems involved in the transfer of “inappropriate” and often large-scale technology from the larger overseas markets to the smaller host market (see [ 121 ). The suitability of overseas technology extends to both the product and process technology which is em- ployed within the subsidiary’s market. An important issue, then, is the extent to which the subsidiary does undertake modification of overseas technology for the host-country market, and the differences, if any, in modification of imported technology from the overseas affiliate and imported technology from non-affiliated firms overseas. It is possible that technology imported independently from non-affiliated firms abroad will require less modification than comparable technology obtained via the overseas affiliate because the subsidiary will be likely to purchase the least-cost technology when it is buying on the open market, rather than when it is utilizing existing technology developed by the affiliate. An important consideration is that MNE technology which is expensive to develop initially is relatively costless to transfer and use within the various subsidiaries of the MNE, and that major adaptation is unlikely unless there are strong pressures on the firm to do so (see [2] ).
Finally, technology dependence, or conversely technological independence, is partly reflected in the creation of new technology by the subsidiary and the outflow of that technology abroad to both affiliated and non-affiiated firms. Technology outflows may generate royalty payments for the domestic subsidiary which partly offset the payment of royalties and fees abroad. In addition, technology developed by the subsidiary may be swapped for technology developed by overseas firms, with no payments taking place. In either case, technology outflows represent a measure of technological independence and have implications for the balance of payments in royalties and fees tied to technology flows.
This paper reports the results of a study, based on a questionnaire survey,“ designed to provide information about these issues associated with the technology dimension of foreign direct investment in the Australian manufacturing sector. The questionnaire was designed to provide data on a number of aspects of actual technology characteristics of
31ncluding the restrictive export franchise which has been alleged to limit the freedom to export of the subsidiary. See, for example, [ 1,3,6] .
4Which is available from the author on request.

1979 TECHNOLOGY FLOWS AND FOREIGN INVESTMENT 105
foreign-direct-investment subsidiaries in Australian manufacturing, as well as form the basis for some limited statistical tests of various hypotheses associated with the tech- nology dimension of foreign direct investment. In particular, information was collected on the following :
(a) The extent of R&D undertaken by subsidiaries in Australia and the influence of several characteristics of foreign subsidiaries on the level of R&D and the type of R&D undertaken.
(b) The source of funds for R&D undertaken by subsidiaries, and the role of the Commonwealth Government’s Industrial Research and Development (I.R.&D.) grant scheme in fostering domestic R&D by foreign subsidiaries. The extent to which I.R.&D funds have been directed to modifying overseas technology.
(c) The channels of access to new overseas technology used by subsidiaries and the terms of access to affiliate and non-affiliate technology. One major issue is the differences, if any, in the restrictions imposed by affiliates, on the one hand, and nonaffiliated firms on the other hand, on the use of imported technology. The extent of outward techno- logy flows to both affiliated and non-affiliated firms overseas, and the importance of technology-swap arrangements.
(d) The extent of export activity by foreign subsidiaries, including the role of restric- tions on exporting attached to technology agreements encompassed by the general restrictions in (c), above. In particular, an important issue is whether export restrictions are more prevalent with affiliate or with non-affiliate technology agreements.
METHODOLOGY
The questionnaire was sent to 765 foreign-owned enterprises’ operating in the Aust- ralian manufacturing sector and listed in the Department of Industry and Commerce “Directory of Overseas Investment in Australian Manufacturing Industry, 1976”. The final sample consisted of 196 firms which had returned questionnaires with sufficient information.6 An additional 30 firms indicated that the questionnaire was not applicable and 37 firms declined to provide information. In all, there were 236 replies from the 765 companies approached.
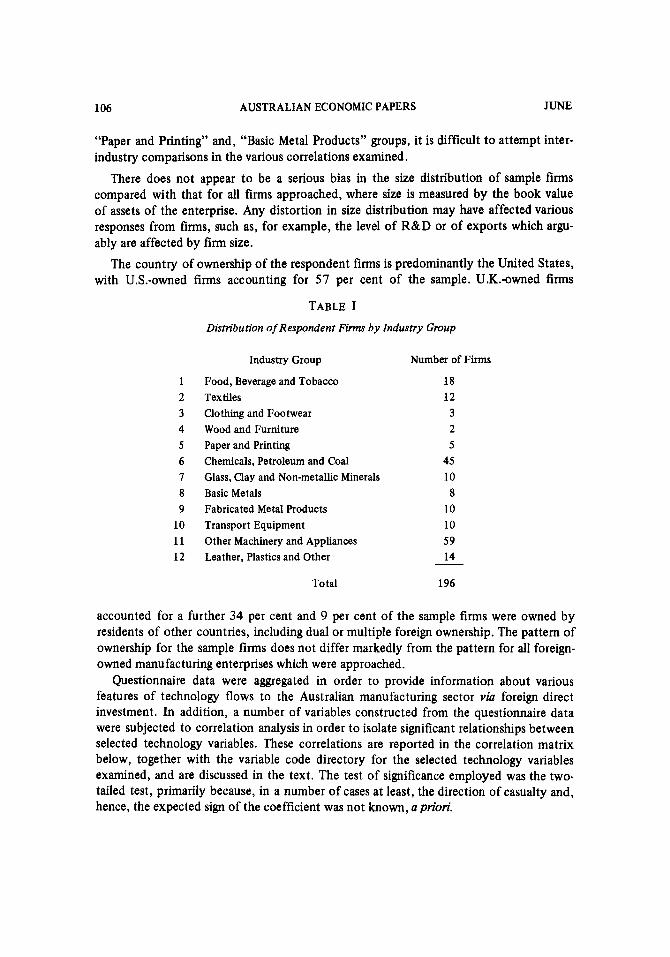
Table I shows the distribution of the respondent firms among 12 manufacturing industry groups. As can be seen, firms in the “Chemicals, Petroleum and Coal” group and “Other Machinery and Appliances” dominate the sample.’ Because of the relatively small size of the sub-samples in “Clothing and Footware”; “Wood and Furniture”;
’Foreign ownership is classified in terms of beneficial equity interest through ownership links of all identified foreign residents (individuals and companies) in enterprises which operate manufacturing establishments.
61t should be noted that not all respondent firms provided full information on all questions asked. This means that not all of the frequencies for various data sum to a total of 196.
‘It should be noted that the distribution of the 196 sample fums is not significantly different from the distribution amongst industry groups for all fums in the Department of Industry and Commerce listing of firms. The industries where there is a difference between the distribution of sample fums compared with all firms in the listing are: Paper and Printing (2.5 per cent sample, 5 per cent over- all); Glass, Clay and Non-Metallic Minerals (5.1 per cent sample, 3.5 per cent overall); and, Fabri- cated Metal Products (5.1 per cent sample, 3.5 per cent overall). The other industry groups, includ- ing the two main groups, Chemicals, Petroleum and Coal and Other Machinery and Appliances, have a sample distribution which lies very close to the distribution for all f m s in the Industry and Com- merce Directory.
106 AUSTRALIAN ECONOMIC PAPERS JUNE
“Paper and Printing” and, “Basic Metal Products” groups, it is difficult to attempt inter- industry comparisons in the various correlations examined.
There does not appear to be a serious bias in the size distribution of sample firms compared with that for all firms approached, where size is measured by the book value of assets of the enterprise. Any distortion in size distribution may have affected various responses from firms, such as, for example, the level of R&D or of exports which argu- ably are affected by firm size.
The country of ownership of the respondent firms is predominantly the United States, with U.S.-owned firms accounting for 57 per cent of the sample. U.K.-owned firms
TABLE I Distribution of Respondent Firms by Industry Group
Industry Group Number of Firms
1 2 3 4 5 6 I 8 9 10 11 12
Food, Beverage and Tobacco Textiles Clothing and Footwear Wood and Furniture Paper and Printing Chemicals, Petroleum and Coal Glass, Clay and Non-metallic Minerals Basic Metals Fabricated Metal Products Transport Equipment Other Machinery and Appliances Leather, Plastics and Other
18 12 3 2 5 45 10 8 10 10 59 14
Total 196
accounted for a further 34 per cent and 9 per cent of the sample firms were owned by residents of other countries, including dual or multiple foreign ownership. The pattern of ownership for the sample firms does not differ markedly from the pattern for all foreign- owned manufacturing enterprises which were approached.
Questionnaire data were aggregated in order to provide information about various features of technology flows to the Australian manufacturing sector via foreign direct investment. In addition, a number of variables constructed from the questionnaire data were subjected to correlation analysis in order to isolate significant relationships between selected technology variables. These correlations are reported in the correlation matrix below, together with the variable code directory for the selected technology variables examined, and are discussed in the text. The test of significance employed was the two- tailed test, primarily because, in a number of cases at least, the direction of casualty and, hence, the expected sign of the coefficient was not known, a priori.
1979 TECHNOLOGY FLOWS AND FOREIGN INVESTMENT 107
THE FINDINGS
Research and Development in Manufacturing Of the 196 firms in the sample, 144 undertook some research and development work
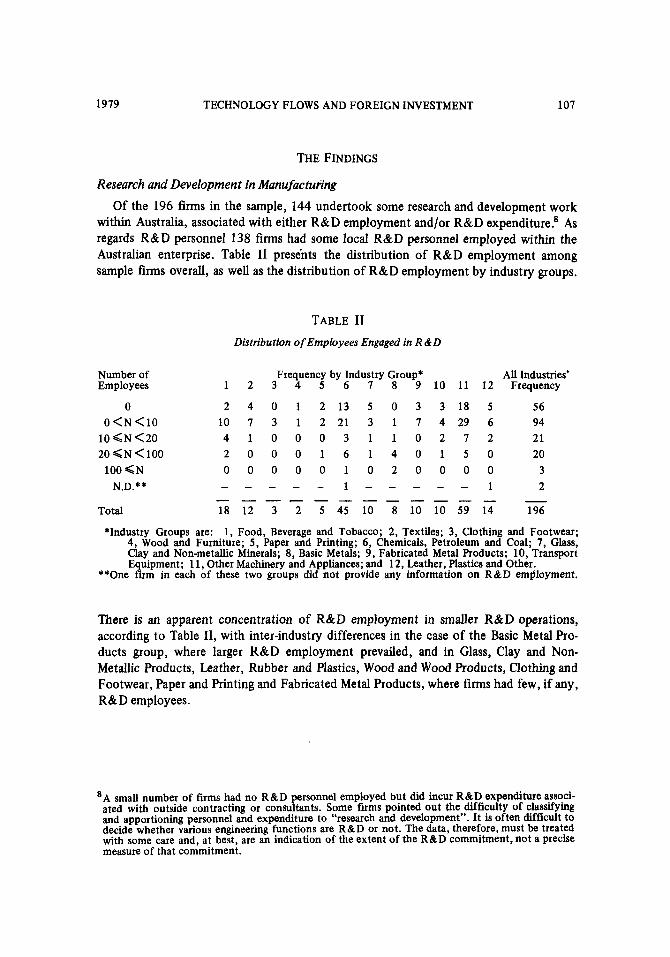
within Australia, associated with either R&D employment and/or R&D expenditure? As regards R&D personnel 138 firms had some local R&D personnel employed within the Australian enterprise. Table I1 presents the distribution of R&D employment among sample firms overall, as well as the distribution of R&D employment by industry groups.
TABLE I1 Distribution of Employees Engaged in R&D
Number of Frequency by Industry Group* All Industries’ Employees 1 2 3 4 5 6 7 8 9 10 11 12 Frequency
0 2 4 0 1 2 1 3 5 0 3 3 1 8 5 56 O<N<10 10 7 3 1 2 2 1 3 1 7 4 2 9 6 94
10 < N <20 4 1 0 0 0 3 1 1 0 2 7 2 21 20 < N < 100 2 0 0 0 1 6 1 4 0 1 5 0 20
100 <N 0 0 0 0 0 1 0 2 0 0 0 0 3 1 2
Total 18 12 3 2 5 45 10 8 10 10 59 14 196
_ - - _ - 1 _ - _ _ _ N.D.** - - - - - - - _ - - - _ -
*Industry Groups are: 1, Food, Beverage and Tobacco; 2, Textiles; 3, Clothing and Footwear; 4, Wood and Furniture; 5, Paper and Printing; 6, Chemicals, Petroleum and Coal; 7, Glass, Clay and Non-metallic Minerals; 8, Basic Metals; 9, Fabricated Metal Products; 10, Transport Equipment; 11, Other Machinery and Appliances; and 12, Leather, Plastics and Other.
**One fcm in each of these two groups did not provide any information on R&D employment.
There is an apparent concentration of R&D employment in smaller R&D operations, according to Table 11, with inter-industry differences in the case of the Basic Metal Pro- ducts group, where larger R&D empioyment prevailed, and in Glass, Clay and Non- Metallic Products, Leather, Rubber and Plastics, Wood and Wood Products, Clothing and Footwear, Paper and Printing and Fabricated Metal Products, where firms had few, if any, R&D employees.
*A small number of firms had no R&D personnel employed but did incur R&D expenditure associ- ated with outside contracting or consultants. Some f m s pointed out the difficulty of classifying and apportioning personnel and expenditure to “research and development”. It is often difficult to decide whether various engineering functions are R&D or not. The data, therefore, must be treated with some care and, at best, are an indication of the extent of the R&D commitment, not a precise measure of that commitment.

108 AUSTRALIAN ECONOMIC PAPERS JUNE
TABLE 111 Distribution of R & D Expenditure
R&D Budget
$0 0 <R&D < $50,000 $5 0,000 <R & D < $200,000
$1,00,000 < R&D N.D.*
$200,000 <R&D< $i,ooo,ooo
Total
Frequency
45 43 52 33 8
15
196
-
*N.D. -no data provided
Table I11 presents data on the distribution of R&D expenditure among sample firms, including the 45 firms with zero R&D budgets. The median R&D budget for firms with some R&D expenditure is $100,000, with an average expenditure per R&D worker in these firms of $18,202.’
Firms were asked what proportion of total world-wide R&D expenditure by the group was accounted for by the Australian operations’ R&D budget. Only five firms gave a figure of more than ten per cent, with a majority of respondents indicating that Australian R&D constituted a small part of total group expenditure.” Looking at the correlation between R&D activity by the local Australian firms and several characteristics of the firms,” there is a significant correlation between the proportion of group R&D expen- diture accounted for by the Australian operation (V9)” and the size of the Australian enterprise, measured by sales (V60). There is no apparent correlation, however, between the proportion of foreign ownership (V67) or the country of ownership (V68) and the proportion of group R&D performed by the Australian enterprise (V9).
In view of the interest in the question of the “suitability” of imported technology, particularly associated with foreign direct investment, firms were asked to indicate what proportion of their R&D budget was allocated to modifying overseas technology for domestic use. Despite some difficulties in precisely classifying “modification or adapta- tion” of foreign technology, 115 firms spent some proportion of their total R&D budget on modification of overseas technology. The mean proportion of the R&D budget de- voted to modification was 42 per cent. The distribution of firms according to the propor- tion of R&D spent on modification, by industry groups as well as overall, is shown in
’The average expenditure per R&D worker was calculated for firms with non-zero values for both their R&D budget and R&D employment.
“The few notable exceptions to this occurred where the Australian market was important in the overall R&D effort of the global firm, such as with, for example, marine biology research and
11 certain agricultural and veterinary products. lzAll correlation results are reported in the Appendix.
The symbol refers to the variable code used in the correlation matrix.

1979 TECHNOLOGY FLOWS AND FOREIGN INVESTMENT 109
Per Cent Spent
TABLE IV Proportion of R &D Budget Spent on “Modification”
Frequency by Industry Group* All Industries’ 1 2 3 4 5 6 7 8 9 10 11 12 Frequency
0 <% t 2 5 6 1 1 1 0 3 2 1 1 1 1 0 2 31 25 <%<SO 3 6 1 0 2 2 0 0 0 2 3 2 38 50 <%<75 3 0 0 0 0 7 1 1 2 3 1 0 2 15 75<%<100 3 0 0 0 0 1 7 2 2 2 0 1 0 0 31
Total 15 7 2 1 2 2 9 5 4 5 6 3 3 6 115**
**In addition to the 115 f m s which undertook some modification or adaptation of foreign tech- nology, 26 claimed that they did not undertake any modification or adaptation. Fifty-five firms did not provide any data on modification. In order to avoid confusing totals for “no modification” and “no data”, these figures have been omitted from the table: it is not altogether clear that all f m s which responded with a zero “modification/adaptation” figure discriminated between an actual zero value and unwillingness (or inability) to provide that information.
*The industry groups correspond with those of Table 111.
Table IV.13 Firms in the chemical, petroleum and coal group are apparently most heavily involved in modification of overseas technology, relative to the total number of res- pondent firms in that industry group. Firms in the textiles, clothing and footwear, wood and furniture, and paper and paper products appear to have a significantly lesser commit- ment to modification or adaptation of overseas technology. The apparent relative com- mitment of the chemical, petroleum and coal group to modification is interesting in view of the earlier difficulties attributed to “inappropriate” technology associated with foreign direct investment in the Australian chemical industry [12]. It may be that there are more instances of technological adaptation than were evident in that earlier study of the chemical industry.
TheSourceofR&D FundsandI.R.&D. Grants Firms were asked to provide information on continuing parent company levies for
financing R&D, and the role of the Commonwealth Government’s Industrial Research and Development Grant (I.R.&D) scheme. Only 10 firms in the sample had R&D budget financing via continuing contributions from the parent company to Australian-subsidiary R&D. In marked contrast, 72 firms with an R&D budget currently received I.R.&D. payments, with an additional 13 firms indicating that they had received such payments in the recent past. Forty-three per cent of sample firms either receive or have recently been receiving Commonwealth I.R.&D. payments.
Most of the firms receiving I.R.&D. funds provided information on the allocation of those funds as between pure research on the one hand and modification of overseas products and processes on the other. Of the 76 firms which provided information, 17 firms used none of their I.R.&D.funds on pure research, while 14 firms spent 50 per cent and 17 firms spent 100 per cent of I.R.&D.funds on pure research. Of these same
13Modification of overseas technology applies to both technology obtained from the parent or other overseas affiliate as well as technology from nonaffiliated firms overseas.

110 AUSTRALIAN ECONOMIC PAPERS JUNE
76 firms, 25 had no allocation of I.R.&D. funds for modification of overseas products and processes, which, of course, includes the 17 firms devoting 100 per cent of these funds to pure research, and 15 firms allocated 50 per cent and eight firms allocated 100 per cent of I.R.&D. funds to “modif i~at ion”.~~ The mean response shows that 47 per cent of I.R.&D. funds are allocated to modifying overseas technology, a similar propor- tion to sample firms’ use of all R&D money for modification of overseas technology.
A number of interesting results from the correlation matrix emerge with respect to research and development. First, the commitment to R&D, both R&D expenditure (V8) and personnel W7), is correlated with company size (V60), measured by sales. Both expenditure and personnel are positively correlated at the one per cent significance level with company size.15 Secondly, the absolute size of the R&D budget as well as the number of R&D employees are both positively and significantly correlated with the licensing of technology from overseas non-affiliate firms 0143) but not with licensing from overseas affiliates 0133). However, when R&D expenditure is weighted by sales to take account of firm size (V69), the relationship between weighted R&D expenditure and licensing from both affiliated and non-affiliated firms is inverse, though not signi- ficant. There is no clear substitution of licensing from both affiliated and nonaffiliated overseas firms for domestic R&D revealed in these correlations.’6 There may be a direct link between the need for R&D personnel associated with licensing in terms of the capacity to utilize such licenses which is reflected in the correlation results.
A number of other interesting points emerge in the correlation results. First, there is no apparently significant correlation between country of ownership (V68) and the extent of R&D activity in the Australian enterpri~e.’~ The proportion of foreign ownership (V67), however, does appear inversely related with the number of R&D personnel as well as the absolute value of the R&D budget, though the correlation is only significant in the case of R&D personnel. This may reflect the fact that a greater domestic R&D commitment comes with a greater proportion of domestic ownership of the Australian firm, whatever the actual merits of undertaking domestic R&D. Secondly, the proportion of foreign ownership (V67) also emerges as apparently significant in relation to the use of I.R.&D. funds in the financing of domestic research (V12). It seems that the greater the proportion of foreign ownership, the less likely will a firm have I.R.&D. support of Australian R&D. Finally, the commitment to domestic R&D expenditure appears sig- nificantly and positively correlated d t h both the licensing of domestic technology to overseas firm (V52) and the exchange of domestic technology with overseas affiliates under non-pecuniary swap arrangements 0 1 5 5 ) . Absolute R&D expenditure shows up in
14There is some doublecounting in the totals for the latter two categories which corresponds to the 15totals for expenditure on pure research.
It should be noted that with a number of the correlations the absolute value of the coefficients is usually quite low, even where highly significant. In part this is a result of the relatively large num- ber of observations, though, of course, the main reason is simply that a number of other factors will have an influence on the variables examined, not just the variables included in the correlation
It would be interesting to compare these and subsequent correlations with correlations for smaller sub-samples, such as industry groups. Unfortunately the number of sub-samples with sufficient observations is too small for meaningful comparisons because of the problems of missing observa-
It may be argued, for example, that US.-based firms tend to centralize R&D out of the host country to a greater extent than other nationalities.
16matrix.
17tions with matched pairs of variables.

1979 TECHNOLOGY FLOWS AND FOREIGN INVESTMENT 111
the generation of domestic technology which results in licensing abroad by the domestic enterprise and/or technology-swap agreements with foreign affiliates. The significance of outward technology flows is considered in more detail in the following section.
Access to Technology and Technology Outflows Firms were asked to rank in importance various potential sources of access to new
technology on an ordinal scale from zero (unimportant) to five (very important). The various sources of access included technical and trade journals, overseas travel by senior personnel of the Australian enterprise, visits to the Australian enterprise by personnel from the overseas affiliate, technical agreements with the overseas affiliate, technical agreements with overseas non-affiliates, technical agreements with nonaffiliated Aust- ralian enterprises, the C.S.I.R.O., Australian tertiary and research institutions and other Australian research bodies.
Only two channels of access were ranked by the majority of the respondent firms as “very important”: “overseas visits by senior personnel of the Australian enterprise” and “technical agreements with the overseas affiliate”. The apparent importance of overseas visits by Australian personnel undoubtedly reflects the benefits of first-hand observation of the operations of overseas facilities by Australian managerial and technical executives. Other sources of access to overseas technology which were ranked as significant were “technical and trade journals” and “visits to the Australian firm by personnel of the overseas affiliate”. It appears from the sample firms’ responses that foreign-owned firms in Australian manufacturing tend to place emphasis on obtaining new technology from overseas [8, 131, particularly from the overseas affiliate,” rather than from domestic research sources.
Firms were asked for information on licensing agreements with both affiliated and non-affiliated overseas enterprises. Of 192 respondent firms providing information, 12 1 (63 per cent) did license some technology from their overseas affiliate, while 71 firms (37 per cent) had no licensing arrangements with the overseas affiliate.lg There is a greater tendency not to have licensing agreements with the overseas affiliate in the Food, Beverage and Tobacco, Fabricated Metal Products, and Textiles groups.
For those firms which did license technology from foreign affiliates, a variety of forms of payment for technical know-how were used;20 62 firms paid fees or royalties based on production, 25 firms paid fees or royalties based on sales, and 22 firms paid a fured fee independent of sales or production levels. A variety of other forms of payment were reported by 16 firms, including guaranteed minimum payments, once-only initial pay- ments, payments based on raw materials purchased from the affiliate, payment of ex- penses for overseas technical consultants, and payments of a proportion of profits. Royalty payments ranged from zero to ten per cent of sales and zero to five per cent of production. The average royalty on sales was 3 per cent and 2.4 per cent on production.
::C& the evidence in the Department of Science SCORE survey.
2oing, for example, informal swap arrangements. Firms could obtain technology from the affiliate without a formal licensing arrangement, includ-
Some firms used more than one method of payment for royalties, thus the following totals in- clude some doublecounting of firms. This makes it difficult to use this data for any further analysis of inter-relationships with other technology variables.

112 AUSTRALIAN ECONOMIC PAPERS JUNE
Firms were also questioned about restrictions attached to licensing agreements with foreign affiliates, including the restrictive export franchise which has been traditionally associated with direct foreign investment in Australia (see [ 1, 3, 6 ,4]) . Of considerable significance, of the 121 firms which did license technology from overseas affiliates, 44 (37 per cent) did have some restriction imposed on exporting attached to the licensing agreement. It appears then, that the restrictive export franchise is still potentially rele- vant with respect to licensing from the overseas affiliate.” Much less important, at least in terms of the number of firms involved, were licensing agreements which entailed some control over the purchase of inputs by the Australian enterprise, where only eight firms of the 121 with affiliate licensing arrangements had such restrictions [cf: [3]). Other restrictions attached to licensing agreements with foreign affiliates, reported by ten firms, included “confidentiality requirements”, “quality controls” and “requirements over the use of trade marks”.
There are a number of differences between licensing from foreign affiliates and non- affiliates which emerged from the questionnaire study. Only 67 of the sample firms had licensing agreements with non-affiliated foreign firms, a significantly smaller proportion than with licenses from foreign affiliates. Of these 67 firms, only 25 had licensing agree- ments from overseas non-affiliated firms and not from overseas affiliates. The remaining 42 firms were licensed from both overseas affiliated and non-affiliated firms.
Respondent firms reported a number of arrangements in force for payment of royalties and fees for non-affiliate licenses. Fees or royalties based on sales or production, and fees which were futed independent of production were the two most prevalent forms of pay- ment.
Licensing agreements with overseas non-affiliated firms involved various restrictions, with 40 of the 67 firms having such licensing arrangements (60 per cent) faced with restrictive export franchises. It seems that export restrictions are relatively more im- portant, in terms of the relative number of firms faced with such restrictiohs, in the case of non-affiliate licensing compared with affiliate licensing. Other types of restrictions were also relatively more prevalent with non-affiliate licensing, with 11 firms reporting requirements over input purchases, and six firms with “other” forms of restrictions of the type reported for affiliates. It could be inferred from these sample results that where there is no overall control exercised over a licensee, as with direct investment, licensing agreements will entail more controls over the use of technology.
Companies were also asked about their outward flows of technology developed in the Australian enterprise, via outward licensing to affiliate and non-affiliate firms, and tech- nology swap arrangements. Of the 196 firms in the sample, 32 did license some domestic technology to overseas firms, with 13 firms licensing to overseas affiliates for fees or royalties and 19 licensing to overseas non-affiliated firms for fees or royalties. In addition to the outward licensing of domestic technology for fees and royalties, 39 firms provided the results of domestic technology to overseas firms in exchange for foreign technology rather than fees or royalties. Firms were in general unable to estimate the value of such
zlThough as Brash [ 3 ] pointed out, the real significance of the export restraint only arises if the Australian firm has the ability to compete successfully in export markets.

1979 TECHNOLOGY FLOWS AND FOREIGN INVESTMENT 113
technology swaps, though the few estimates suggest that such swap arrangements are fairly substantial.
A number of issues associated with licensing and technology flows via the foreign- owned enterprise are highlighted in the correlation matrix. First, there is a positive cor- relation between the extent of licensing from the foreign affiliate (V33) and the pro- portion of R&D expenditure devoted to modifying overseas technology (V10).22 There is no significant correlation, however, between modification and licensing from overseas non-affiliated firms (V43). One possible interpretation of this result is that non-affiliate technology is less in need of modification, otherwise it would not be purchased by the Australian firm. By comparison, affiliate technology will tend to be transferred even if modification is necessary, because of the advantages to the MNE of utilizing technology which it has developed as widely as p~ssible.~’ Alternatively, but less likely, it could be argued that the correlation reflects the fact that more effort is made to adapt affiliate technology to the domestic market compared with non-affiliate technology.
There is a significant and positive correlation between licensing from non-affiliates by the Australian enterprise (V43) and outward licensing abroad by the Australian firm 0152). Further, there is a significant inverse correlation between the proportion of foreign ownership of the Australian firm (V67) and the extent of non-affiliate licensing to the Australian firm (V43), and a significant inverse correlation between the proportion of foreign ownership of the Australian firm and the extent of outward licensing by the Australian firm to both affiliated and non-affiliated firms. Together, these results may suggest greater “technological independence” with lower foreign ownership of the Aust- ralian enterprise. Both access to non-affiliate technology and the outward licensing of technology to foreign firms varies inversely with the degree of foreign ownership. To be weighed against the possibility of “technological independence” with lower foreign ownership is the possibility that 100 per cent foreign ownership does convey freer access to affiliate technology, even if non-affiliate technology is not as readily accessible. Further, if non-affiliates do impose greater restrictions attached to licensing agreements, as may be concluded from the sample results above, then “technological independence” associ- ated with access to independent technology arrangements may bear a cost in terms of restrictive conditions which are not as prevalent with affiliate technology arrangements.
Looking at the outward licensing of technology by Australian operations, it appears that the I.R.&D. scheme may have an impact on foreign sales of technology. Outward licensing (V52) is positively and significantly correlated with financing of R&D via the Commonwealth I.R.&D. scheme (Vl 2).24 Furthermore, the proportion of foreign ownership held in the Australian enterprise is inversely and significantly correlated with the receipt of I.R.&D. funds. It is possible that the I.R.&D. scheme does favour less than wholly-owned foreign subsidiaries in Australian manufacturing, or alternatively that wholly-owned foreign subsidiaries tend not to apply to the same extent as domestic firms for these I.R.&D. funds.
::At the 10 per cent significance level.
24tion is fully adapted to suit local market conditions. As argued in 191, the key issue, of course, is whether affiliate technology which does need modifica-
Which, of course, may reflect the fact that firms which export technology are more research oriented and, hence, more likely to apply for and receive these I.R.&D. funds.

114 AUSTRALIAN ECONOMIC PAPERS JUNE
EXPORTS
Information was obtained from firms on the percentage of total sales which were ex- ported because of the concern over manufacturing exports in Australia and the role of foreign investment in export performance. One hundred and eighty-two firms did export some of their total output, with 41 firms (23 per cent) having greater than ten per cent of sales accounted for by exports. In absolute terms, the sample firms accounted for a significant quantity of export sales in manufacturing. There is a significant and positive correlation between weighted R&D expenditure 0169) and exports as a percentage of sales (V61), and a similar positive and significant correlation between receipt of I.R.&D. payments 0112) and exporting (V61).” It seems then, that commitment to technology generation associated with R&D effort is related to success in export performance. Further the I.R.&D. scheme may promote technological developments which result in export success. Alternatively, the administration of that scheme may favour firms with established export markets.
Inversely related with exports as a percentage of sales (V61) is the reliance on non- affiliate licenses (V43). This may simply reflect the fact that non-affiliate licenses tend to have relatively more restrictive export franchises imposed than affiliate licenses. Finally, the proportion of R&D devoted to modifying overseas technology (V10) is inversely related with exports as a percentage of sales. One possible interpretation is that it is pure research which is more likely to generate advantages which are exploitable in export markets, and hence a greater proportion of R&D devoted to modification will limit the technology-based export results. Alternatively, it is arguable that firms which are more export intensive enjoy a comparative advantage such that they rely less on imported technology and hence require less commitment to modification.
CONCLUSIONS
A number of interesting results emerge from the questionnaire data and associated analysis of technology flows associated with foreign direct investment in the Australian manufacturing sector:
(1) A large proportion of the sample firms did undertake R&D work within the Australian enterprise. While Australian R&D commonly accounted for only a very small proportion of total group R&D, the absolute commitment to R&D is not unimportant. While it appears that foreign direct investment does not necessarily imply an absence of R&D within the host market, it would be valuable to compare the relative commitment to R&D among foreign-owned and domestically-owned firms in comparable industries. There is some suggestion that greater domestic ownership, in those firms where there is some foreign-owned equity, is linked with a greater commitment to local R&D employ- ment. The commitment to R&D by foreign subsidiaries appears to have some relation- ship ‘with export itensity. It would be necessary, however, to compare the association between R&D and export activity among domestically-owned firms in comparable industry groups in order to draw any further conclusions about the role of foreign owner- ship, R&D and export activity.
2sAt the 10 per cent level.

1979 TECHNOLOGY FLOWS AND FOREIGN INVESTMENT 115
(2) A large proportion of the firms with local R&D expenditure devoted some of these resources to “modification of overseas technology”. Given the various problems associated with “inappropriate” technology, it is of some value to have an indication of the commitment to modifying imported technology. While the extent of modification appears significant, qualitative information is needed about the type of modification for the domestic market. Similarly, it would be desirable to compare the extent and type of modification undertaken by foreign-owned and domestically-owned firms in comparable industries. One important point to emerge from the study was the relative emphasis on modification of affiliate rather than non-affiliate technology. This raises the question of whether there are differences in the inherent “suitability” of affiliate versus non-affiliate technology which is available to the domestic manufacturing sector.
(3) Although levies paid by the parent company did not emerge as important in financing the R&D activities of the sample firms, at least not in the recent past,26 43 per cent of sample firms undertaking R&D in Australia currently receive or had recently received Commonwealth I.R.&D. grants. The importance of the I.R.&D. scheme raises the question whether the objectives of that scheme are effectively promoted via pay- ments to foreign subsidiaries (see [ 141 ). For example, it may be argued that parent levies would finance any R&D which was currently supported by the I.R.&D. scheme. Simi- larly, it may be considered desirable to require a larger proportion of I.R.&D. funds to be allocated to modification of overseas technology in order to minimize the difficulties encountered with “inappropriate” te~hnology.~’ From the sample data, it appears that approximately the same proportion of I.R.&D. funds as all R&D funds is allocated to modification by foreign subsidiaries.
(4) The study provides new information about the importance of restrictions attached to the use of foreign technology. A large proportion of the firms in the sample licensed from foreign affiliates (63 per cent), of which 37 per cent had export restrictions tied to the agreement. While other restrictions were less important, the restrictive export franchise appears to be of continuing importance in Australian manufacturing. While fewer firms in the sample licensed technology from overseas non-affiliates (67 firms), what was interesting was the apparently more widespread incidence of both restrictive export franchises and other restrictions tied to the technology agreement. Unfortunately, our sub-samples by industry groups were too small, largely because of missing values for matched responses, to pursue a more detailed analysis of restrictions attached to tech- nology agreements. It would be of considerable value to go into more detail about the nature of restrictions attached to technology agreements, with both affiliate and non- affiliate firms abroad, and the extent of inter-industry differences in these practices. It would also be interesting to examine restrictions attached to outward technology flows from foreign- and domestically-owned firms in Australian manufacturing, something which was not attempted in the present study.
( 5 ) In fact, the outflow of technology from subsidiaries providing this information in the sample appears to be of some importance in overall technology flows. Thirty-two
::Which is not to say that parent levies were not important in early R&D activities. Alternatively it could be argued that I.R.&D.funds should be entirely devoted to basic research and the affiliate should bear the costs of modifying technology. Clearly this is a policy choice.

116 AUSTRALIAN ECONOMIC PAPERS JUNE
firms licensed domestic technology to both affiliated and non-affiliated firms abroad, and 39 firms undertook some non-pecuniary technology swaps. The outflow of tech- nology via swap arrangements appears quite important. As such swap transactions do not show up in official statistics for technology payments, the actual payments position may well be quite different from that suggested in official statistics (see [S]). It would be worthwhile quantifying non-pecuniary swap arrangements in order better to appreciate the real importance of technology inflow and outflow for both foreign- and domestically- owned firms.
(6) Finally, the question of “technological independence” arose with the apparent link between the proportion of foreign ownership and access to non-affiliate licenses and overall outward licensing of domestic technology. While there may be less “technological independence” associated with higher degree of foreign ownership, presumably reflecting foreign control, the access to affiliate technology may be easier with less restrictions than with non-affiliate technology. Further, the extent of modification required seems to vary as between affiliate and non-affiliate technology which is relevant in an assessment of “technology independence”.
REFERENCES
1. H. W. Arndt and D. R. Sherk, “Export Franchises of Australian Companies with Overseas Affili- ations”, Economic Record, vol. 35,1959.
2. J. Baranson, Industrial Technologies for Developing Countries (Praeger, 1969). 3. D. T. Brash, American Investment in Australian Industry (Canberra: A.N.U. Press, 1966). 4. Commonwealth Treasury, Treasury Economic Paper No. 1, Foreign Investment in Australia
(Government Printer, 1972). 5. Department of Science, Project SCORE -Research and Development in Australia (Government
Printer, 1976). 6. W. P. Hogan, “British Manufacturing Subsidiaries in Australia and Export Franchises”, Economic
Papers, No. 22,1966. 7. W. P. Hogan. “British Investment in Australian Manufacturing: The Technical Connection”,
Manchest6 School, June, 1967. 8. B. L. Johns, “The Production and Transfer of Technology” in W. Kasper and T. G. Parry (eds.),
Growth, Trade and Structural Change in an Open Australian Economy (Center for Applied
-
Economic Research, 1978). 9. H. G. Johnson, “The Efficiency and Welfare Implications of the International Corporation”, in
C. P. Kindleberner (ed.1. The International Cornration (M.I.T. Press. 1970). 10. O.E.C.D., “Impact ‘of Multinational Enterprises on National Scientibc and Technical Capacities”
(Directorate for Science, Technology and Industry, 1978). 11. T. G. Parry, “The International Firm and National Economic Policy: A Survey”, Economic
Journal, vol. 83,1973. 12. T. G. Parry, “Size of Plant, Capacity Utilization and Economic Efficiency: Foreign Investment in
the Australian Chemical Industry”, Economic Record, vol. 50,1974. 13. P. Stubbs, fnnovation and Research: A Study in Austrahhn Industry (Cheshire, 1968). 14. C. Tisdell, “The Australian Research Subsidy to Overseas Firms and Other Aspects of the Distri-
bution of Research Grants”, Economic Record, vol. 49,1973. 15. E. L. Wheelwright, “Overseas Investment in Australia”, in A. Hunter (ed.), The Economics of
Australian Industry (Melbourne University Press, 1963).

1979 TECHNOLOGY FLOWS AND FOREIGN INVESTMENT 117
APPENDIX Correlation Matrix Variable Code*
V7 Number of R&D personnel. V8 Australian R&D budget. V9 Proportion of group R&D expenditure world-wide accounted for by the Australian enterprise’s
R & D budget. V10 Proportion of R&D budget devoted to “modifying” overseas technology. V12 Receipt of I.R.&D. grants.’ ~ 3 3 Licensing from overseas affiliates.2 ~ 4 3 Licensing from overseas nona~i l ia tes .~ V52 Outward licensing of technology by Australian fm overseas! V55 Exchange of technology in lieu of fees.’ V60 Annual sales of the Australian fm. V61 Proportion of sales exported V67 Proportion of equity of Australian firm foreign owned. V68 Country of foreign ownership: V69 Australian firm’s R&D budget weighted by sales.
*The variable code comes from the original questionnaire which generated 69 variables, only 14 of which have been included in the correlation matrix. Firms answered YES or NO to the question “Do you obtain financial support from the Common-
,wealth Government’s I.R.&D.scheme ’. V10 is the number of firms answering YES. V33 is the number of f m s which license technology from their overseas affiliate(s). :V43 is the number of firms which license technology from overseas non-affiliate f m s . V52 is the number of Australian firms which license technology abroad to both affiliated and non- affiliated firms. ’V55 is the number of Australian f m s which provide the results of their local R&D to overseas affiliated and nonaffiliated firms in exchange of overseas technology rather than specific royalties or fees.
% h e “Directory of Overseas Investment in Australian Manufacturing Industry” gives information on the country of ownership by proportion of equity held by overseas firms and/or residents. In the few cases of dual or multiple foreign ownership, the country of ownership was selected according to the relative equity holdings of the foreign countries.

118 AUSTRALIAN ECONOMIC PAPERS JUNE
CORRELATlON MATRlX
V7 V8 V9 V10 V12 V33 V43 V52 V55 V60 V61 V67 V68 V69
v7
V8
v9
v10
v12
v33
v43
v52
V55
V60
V6 I
V67
V68
V69
1,0000 ,7009 .OX31 ,0075 (.OOl)‘ (.748) (.922)
181 134 174
1,0000 ,0054 ,0196 (.952) 0 0 1 )
129 167
1.0000 -.0433 (.625)
130
1.0000
.1804 .0616 (.012)b (.398)
192 190
,3001 ,0218
179 177
.0120 -.0191 (.891) C.827)
133 134
,0863 ,1500 ( 2 5 8 ) (.051)c
174 170
1.0000 .0403 (.581)
190
1 .oooo
(.OOlP (.773)
,1575 (.030)b
189
.1405 (.062)c
177
-.0574 (513)
132
,1230 (.110)
170
,1860
189
,0580 (.429)
188
1 .oooo
(.OlOY‘
,1355 (.060)c
193
,1987 (.007Y‘
180
,0821 (.345)
134
-.1117 (.143)
173
,2606
193
,0241 C.740)
192
,1864
191
1.0000
(.OOlyr
(.OlOP
,1204 (.107)
180
,2132
169
-0673 (452)
127
,1016 (.190) 168
,1828 (.014)b
182
-.0174 (.817)
179
,0778 (.302)
178
,0483 (517)
182
1.0000
(.OOSP
,3652 ,0096 (.OOlP (.898)
172 180
,5166 ,0474
160 167
,2189 -.0662 (.017)b (.461)
119 126
,0754 -.1736 (.351) (.027)b
155 162
,1365 ,1322 (.073)‘ c.076)‘
173 181
,0700 -.1193 (.363) C.111)
171 180
,0750 -2116 (.331) (.OOSyr
170 178
,1596 -.0265 (.036)b (.723) 173 182
,1602 ,0913 (.041)b (234)
163 172
1.0000 .0655 (.392)
173
1.0000
(.OOlP (.543)
o - Indicates the coefficient is slgnilicant at the one per cent level. h - Indicates the coefficient is significant at the five per cent level. c - Indicates the coefficient is significant at the ten per cent level. Nurnhcr m brackets 1s the actual sknificance level.
) ) )
Two-tailed significance test.
-2217 - . O N ( .OOZY’ 6697)
193 194
-.0963 -.0290 (.199) (.699)
180 181
-.1296 -.0497 (.136) 0 6 8 )
134 134
,0579 .0413 (.450) ( 5 8 8 )
173 174
-.1839 -.0398 (.OlO)” (.581)
193 194
4 4 4 2 ,0350 (S43) (.629)
191 192
-.1653 ,0195
191 191
-2787 -.0644 (.OOlY (.371)
194 195
,0767 -.0496 (.305) (506)
181 181
-.1483 -.0136 (.051)c (.859)
173 174
-.0013 .0183 (.987) (.807)
181 182
1.0000 ,0784 (276)
195
1.0000
(.022)b (.789)
,2664
160
,3327
160
.05 1 1 C.589)
114
-.0793 6338)
148
.1787 (.024)b
159
-.lo53 (.189)
157
-.0598 (.457)
157
-.0387 (.628)
159
,1487 (.068)
151
-.0328 (.681)
160
,1896 (.017)b
159
-.lo25 (.199)
159
-.0141 (.860)
160
1 .oooo
(.OOlP
(.OOlP
~ ~~.~ ~
Number below brackets is the-iuGbe-rof observations.