2011 report on financial resource flows - oecd.org · 2011 report on financial resource flows ......
TRANSCRIPT

ENSURING FRAGILE STATES ARE NOT LEFT BEHIND
2011 Report on Financial Resource Flows
DAC INTERNATIONAL NETWORK ON CONFLICT AND FRAGILITY

2 FINANCIAL RESOURCES FLOWS IN FRAGILE AND CONFLICT-AFFECTED STATES: 2011 REPORT
About this report
This report is part of a project to monitor resource flows in fragile situations, which was launched by the OECD Development Assist-ance Committee (DAC) in 2005. While originally focussed on of-ficial development assistance (ODA), this annual report of the DAC International Network of Conflict and Fragility (INCAF) has evolved to include sources of development co-operation from beyond DAC membership, as well as domestic revenues, peacekeeping expen-ditures, private flows (mainly foreign direct investment, trade and remittances) and illicit outflows.
In recognition of the fact that aid is only one part of the equation in fragile situations, and that it can be dwarfed or have its effects swept away by other flows, this report provides evidence on the main resources in fragile situations, how they interact, and what issues and countries should be of concern.
The 2011 report compiles and analyses the latest available data, which is mostly from 2009 for ODA flows, and includes data on forward spending for 2012-15. It was prepared by a team led by Juana de Catheu, including James Eberlein (editorial and data visualisation) and Franziska Nix (research assistant) of the OECD Secretariat, and Sumedh Rao (GSDRC, data collection). It draws on OECD-wide research, including statistics on development co-op-eration; reviews of whole-of-government donor performance; data on aid effectiveness; regional economic outlooks; and policy work by DAC-INCAF and its members. It has benefitted from valuable comments from the INCAF Task Team on Financing and Aid Archi-tecture, including Henrik Hammargren (Sweden), Chair of the Task Team, Kristoffer Nilaus Tarp (UN Peacebuilding Support Office), and Yasmin Ahmad, Elena Bernaldo, Olivier Bouret, Ben Dickinson, Fredrik Ericsson, Masato Hayashikawa, Hanna-Mari Kilpelainen, Stephan Massing, Erwin Van Veen, Simon Scott and Asbjorn Wee (OECD DAC Secretariat). However, any error or omission remain the authors’ responsibility.
It builds on the factsheet Ensuring Fragile States Are Not Left Behind (2011), which was launched at the Fourth High-Level Forum on Aid Effectiveness in Busan (Korea).
Will fragile states meet the MDGs by 2015?
The international community cannot claim success in the fight against global poverty, as most fragile states will simply not meet the Millennium Development Goals (MDGs) by 2015, and the lack of progress is most acute in fragile states (see list in Table 1). Six out of ten people living under the poverty line live in a low- or middle-income fragile state, and seven out of ten school-age children in fragile states are not enrolled in primary school. A child living in a fragile state is twice as likely to be undernourished as a child in another developing country (see Figure 2). While the poverty target is within reach for more than 70% of low-income countries as a result of recent economic growth and an improvement in policies, GDP growth in fragile states was about one-fifth that of other low-income countries (World Bank, 2011d). Although those low-income countries not affected by violence closed 40-70% of their MDG gap between 2000 and 2010, fragile states have closed only 20% of the same gap (World Bank 2011d, 2011e).
2007 2008 2009AfghanistanAngolaBangladeshBurkina FasoBurundiCambodiaCameroonCentral African RepublicChadComorosCongo, Dem. Rep.Congo, Rep.Côte d'IvoireDjiboutiEquatorial GuineaEritreaEthiopiaGambiaGeorgiaGuineaGuinea-BissauHaitiIraqKenyaKiribatiKorea, Dem. Rep.LaosLebanonLiberiaMalawiMauritaniaMyanmarNepalNigerNigeriaPakistanPapua New GuineaRwandaSao Tomé & PrincipeSierra LeoneSolomon IslandsSomaliaSri LankaSudanTajikistanTimor-LesteTogoTongaUgandaUzbekistanVanuatuWest Bank and GazaYemen, Rep.Zimbabwe
TAbLE 1. wORkING LIST OF FRAGILE STATES

DAC INTERNATIONAL NETWORK ON CONFLICT AND FRAGILITY (INCAF) 3
LOW-INCOME FRAGILE STATES (< USD 1 005) LOWER MIDDLE-INCOME FRAGILE STATES (USD 1 006 TO USD 3 975) UPPER MIDDLE-INCOME FRAGILE STATES (USD 3 976 TO USD 12 275)
The list of 45 countries in fragile situations used for this analysis (neither an official DAC list nor an official definition) is a compilation of two lists: the 2009 Harmonised List of Fragile Situations (World Bank, African Development Bank, Asian Development Bank) and the 2009 Fund for Peace Failed States Index (“alert” and “warning” categories). It is worth noting that not all fragile states are low-income countries: 19 of the countries considered fragile in 2009 were middle-income countries (see pages 12-13).
FIGURE 1. wHERE ARE THE FRAGILE STATES?
FIGURE 2. mOST OF THE mDG DEFICIT IS FOUND IN FRAGILE STATES
Source: Adapted from World Bank 2011a (World Bank calculations based on Gates and others 2010). Note: Current fragile and conflict-affected states account for 33 percent of the population in developing countries, and countries recovering from fragility and conflict account for an additional 14 percent of the population. Therefore, if the MDG deficit were borne evenly, these countries would account for 47 percent each of the ills described. The dark purple figures represent the percentage of the deficit for selected MDGs in fragile, conflict-affected and recovering countries. The light purple figures represent the persons afflicted in other non-OECD countries. Excluded here are Brazil, China, India and the Russian Federation, all significantly ahead of or on par with other non-OECD countries on the MDGs. Due to their size, including them in the calculations would skew any discussion involving the global population.
... of infant deaths
70%... of undernourished people
60%... of children not in primary school
77%... of people without access to safe water
65%

4 FINANCIAL RESOURCES FLOWS IN FRAGILE AND CONFLICT-AFFECTED STATES: 2011 REPORT
BOx 1. VULNERABILITy TO BOOm-AND-BUST CyCLES IN ANGOLA
Angola is one of the world’s fastest growing econo-mies. It received USD 11.6 billion in FDI inflows in 2009, making Angola the second top recipient of FDI in Africa, behind Nigeria. Angola is also the least aid-dependent fragile state with an ODA to GNI ratio of 0.2% in 2009.
Angola’s growth has been driven by oil wealth during a period of rising resource prices. Other sectors of the economy, notably financial services and construction, have also been growing. However, the 2008 global economic cri-sis and the related drop in oil revenues have had a negative impact on the Angolan economy, which contracted by 10.3% in 2009. In March 2009 the government indicated it would cut planned budgetary spending by 40%. To prevent future fiscal shocks caused by volatile oil prices, it is important for Angola to further diversify its industries. Some of the promis-ing sectors that could be developed to a more significant level include agriculture, fisheries and livestock, and forestry. Cur-rently only 3% of Angola’s arable land is used.
Source: UNCTAD (2011), OECD (2011f).
But there is evidence that progress towards the MDGs is still pos-sible in countries that are recovering from conflict and fragility. For example, Mozambique more than tripled its primary school com-pletion rate in just eight years: from 14% in 1999 to 46% in 2007. Rwanda cut the prevalence of under-nutrition from 56% of the pop-ulation in 1997 to 40% in 2005 (World Bank WDR, 2011). The cor-relation between fragility and poor MDG performance suggests that the structural causes of conflict and fragility must be addressed in order to accelerate and sustain progress towards the MDGs.
How have financial, food and fuel crises affected resource flows?
In fragile states as in all developing countries, the international community needs to look beyond aid and harness the full range of resource flows to take advantage of their potential contributions to development results. For example, over the last decade, the telecommunications industry has invested USD 77 billion in sub-Saharan Africa, boosting the number of mobile subscribers from 10 million to 400 million, creating thousands of jobs, injecting cash into cities and remote communities alike, and improving the ease of doing business across the board.
The main resource flows in fragile states are domestic revenue, FDI, remittances, trade, aid and peacekeeping expenditures (see Figure 3). Domestic revenue and FDI dominate the resource equation, even in countries that are highly aid dependent.1 While all of these financial flows have a different impact on development, the coher-ence of international policies for trade, investment, agriculture, en-ergy, migration and illicit transnational flows with the aid agenda is of crucial importance. Adverse or incoherent policies can wipe out the benefits of millions of dollars in ODA, for example as a result of externally-stimulated brain drain and commodity price bubbles (see Box 1). A whole-of-government approach is particularly important in fragile states, given the acute and inter-related challenges faced by these countries: for example, a lack of investment in security or reconciliation can derail the whole post-crisis transition.
The overall mix of resource flows to fragile states has changed sig-nificantly between 2005 and 2009 (see Figure 3). Nonetheless, the composition of resource flows and their relative importance varies from country to country.
1 The top three aid-dependent countries in 2010 were Liberia (CPA-to-GNI ratio of 64%), Afghanistan (59%) and the Solomon Islands (41%).
-100
0
100
200
300
400
500
600
700
2005 2006 2007 2008 2009
TRADE
REMITTANCES
DOMESTIC REVENUE
FDI
ODA
-100
0
100
200
300
400
500
600
700
2005 2006 2007 2008 2009
TRADE
REMITTANCES
DOMESTIC REVENUE
FDI
ODA
-100
0
100
200
300
400
500
600
700
2005 2006 2007 2008 2009
TRADE
REMITTANCES
DOMESTIC REVENUE
FDI
ODA
-100
0
100
200
300
400
500
600
700
2005 2006 2007 2008 2009
TRADE
REMITTANCES
DOMESTIC REVENUE
FDI
ODA
-100
0
100
200
300
400
500
600
700
2005 2006 2007 2008 2009
TRADE
REMITTANCES
DOMESTIC REVENUE
FDI
ODA
600
500
400
300
200
100
0
-100
2005 2006 2007 2008 2009
REMITTANCES 27.0 33.0 42.2 52.2 54.7
DOM REVENUE 164.8 208.2 230.6 311.6 230.3
FDI 110.4 134.4 169.4 188.8 214.6
ODA 53.9 48.6 44.4 49.4 46.8
TRADE -0.6 -3.0 -10.2 -4.3 -66.4
FIGURE 3. RESOURCE FLOwS IN FRAGILE STATES (2005-09)
355.5
421.2
476.4
597.7
480.0
USD
BILL
IONS
(cur
rent
pric
es)
Note: Resource flow
totals include outflows by trade. O
DA is based on figures for gross disbursements. Data: O
ECD CRS, UN Statistics, UNCTAD, IM
F, World Bank (2011).

DAC INTERNATIONAL NETWORK ON CONFLICT AND FRAGILITY (INCAF) 5
-10%
-5%
0%
5%
10%
15%
20%
25%
30%
35%
2001 2002 2003 2004 2005 2006 2007 2008 2009
2001 2002 2003 2004 2005 2006 2007 2008 2009
30%
25%
20%
15%
10%
5%
0%
-5%
GROW
TH (%
CHA
NGE
IN G
DP; I
N CO
NSTA
NT
USD)
FUEL-EXPORTING FRAGILE STATES
% OF TOTAL EXPORTS
Angola 98.6
Iraq 98.4
Chad 90.8
Nigeria 90.5
Yemen 90.1
Sudan 88.5
Congo 81.3
Timor-Leste 74.6
Cameroon 49.2
Myanmar 32.7
Côte d’Ivoire 32.6
NON-FUEL MINERAL EXPORTERS
% OF TOTAL EXPORTS
DR Congo 78.3
Guinea 65.2
Sierra Leone 54.3
Papua New Guinea 54.0
Burkina Faso 40.7
Central African Rep. 35.8
Georgia 33.7
Somalia 33.4
Zimbabwe 26.8
OTHER FRAGILE STATES
Afghanistan Nepal
Bangladesh Niger
Burundi Korea, DPR
Comoros Pakistan
Eritrea Sao Tome & Principe
Ethiopia Solomon Islands
Guinea Bissau Sri Lanka
Haiti Tajikistan
Kenya Togo
Kiribati Uganda
Lebanon Uzbekistan
Liberia West Bank & Gaza
Malawi
GROwTH IN FRAGILE STATES DECLINING SINCE 2008
Although fragile states are largely isolated from international financial markets and were thus insulated from the initial stages of the 2008 financial crisis, the subsequent economic downturn led to a sharp fall in growth after 2008, with fuel exporters particularly hard-hit (see graph below).
Looking ahead, growth in fragile states may rebound. Growth projections for fragile states are at 6.9% in 2012. These projections are more positive than those for the overall world economy (3.3%) and the collective projection for emerging and developing countries (5.4%) (IMF, 2012). Most notably, Niger is expected to grow by 12.5% in 2012 and Angola by 10.8%. Not all fast-growing fragile states are fuel or mineral exporters: Ethiopia is expected to achieve a 5.5% growth rate in 2012, and almost 10% between 2013 and 2015. As for commodity exports, prices are expected to fall from their 2010-11 levels, but the risk of further price volatility still remains high (OECD-FAO, 2011).
At the same time, there is a risk of new or aggravated situations of fragility. The societal pressures for change that brought about the Arab Spring, the possibility of prolonged financial turmoil, continued commodity price volatility, rapid urbanisation, youth unemployment, demo-graphic pressures and environmental degradation are all factors that will challenge state stability and resilience. Between the projected negative growth in the Eurozone for 2012 (IMF 2012) and continued pushes for fiscal austerity, aid budgets are under pressure. Fragile states may therefore face not only more challenges to stability but also less international development support.
Data
: Wor
ld B
ank
(201
1).
Data
: UN
CTAD
/ W
orld
Ban
k (2
011)

6 FINANCIAL RESOURCES FLOWS IN FRAGILE AND CONFLICT-AFFECTED STATES: 2011 REPORT
BOX 2. CENTRAL AFRICAN REpUBLIC: ODA OFFSETS REDUCTIONS IN OTHER RESOURCE FLOwS
In the Central African Republic (CAR), 2006 and early 2007 saw a worsening of the conflict between the Union of Demo-cratic Forces for Unity-led rebels and government-led forces, before a peace agreement was signed in April 2007.
Over this period, there was a significant drop in domestic revenue (27%) and FDI (32%). During the same period, ODA nearly doubled to USD 118 million. Though overall resource flows were lower in 2007 than in 2006, the rise in ODA helped compensate for the 2007 fall.
Source: OECD-DAC (2011)
Foreign direct investment (FDI) and remittances: These fi-nancial flows have continued to grow throughout the crisis in both fuel-exporting and other fragile states. Remittances to fragile states overtook ODA volumes in 2008.
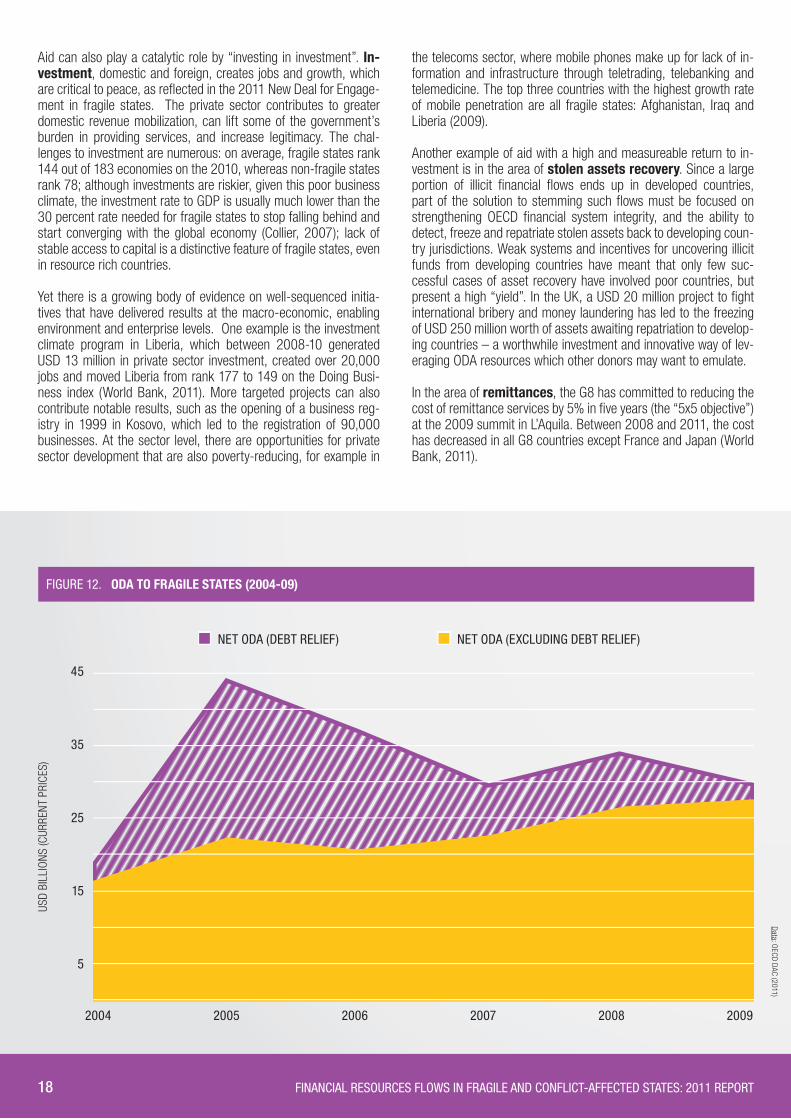
ODA: The percentage of bilateral ODA from DAC countries to fragile states is shrinking: from 53% in 2005 to 35% in 2009. Bilateral ODA from DAC countries to fragile states fell by 35.6% during the period 2005-09 (constant prices). This decline is explained by the fact that ODA in 2005 and 2006 included exceptionally high debt relief, particularly for Iraq and Nigeria (see Figure 12). When debt relief is excluded from the equation, ODA to fragile states increased slightly over the same period (12%). It is also worth noting that ODA has been less affected by the 2008 financial crisis than other flows, such as domestic revenue and trade. Between 2008 and 2009, DAC donors cut their ODA to all countries by 1.6%. In fragile states this figure was 11.2%. The fragile states that lost the most ODA between 2008 and 2009 were Iraq (-72%), North Korea (-67%) and Liberia (-58%).
Domestic revenues: There was a dramatic contraction of domestic revenues between 2008 and 2009, threatening cuts in education, health and social protection programmes. In Kenya, for example, do-mestic revenues contracted by half in the two-year period. In Angola, the economy contracted by 10.3% in 2009, in response to which the government indicated budgetary cuts of 40% (see Box 1).
Trade: The overall trade deficit has worsened since 2005. In 2009, 40 out of 45 fragile states faced a trade deficit — all of them with a trade deficit exceeding 6% of GDP (see Figure 4). No African country exceeded USD 250 billion in merchandise trade in 2010. For Africa, fuels and mining products constitute the main exports, accounting 66% of their total merchandise exports in 2010 (WTO International Trade Statistics 2011).
In addition, fragile states suffer from illicit outflows of capital, which are estimated at USD 1.3 trillion globally, in addition to le-gal forms of capital flight.2 Illicit flows from the 48 least developed countries (LDCs), of which 43 are affected by a recent conflict, have increased from USD 9.7 billion in 1990 to USD 26.3 billion in 2008, a nearly three-fold increase (UNDP, 2011). For example, an estimated USD 2 billion in illegal narcotics trade transits through
2 Illicit flows are defined as “flows of money associated with tax evasion, criminal activity such as drug trafficking, and corruption and theft by government of-ficials” (Task Force on Financial Integrity and Economic Development, 2011).
West Africa every year (UNODC 2009). An estimated 90% of gold exports from the Democratic Republic of the Congo (DRC) go unde-clared (Global Witness, 2009). These huge outflows fuel instability, exacerbate poverty and limit the domestic resources available to finance development (See OECD, 2012).
peacekeeping expenditures: In 2011, ten fragile states hosted a UN peacekeeping mission, with a combined budget of nearly USD 7 billion, of which nearly USD 1.7 billion for UNAMID (Darfur) and USD 1.5 billion for MONUSCO (DRC). In DRC, UN peacekeeping expenditures represented half of the country’s ODA in 2009.3
Are fragile states raising domestic revenues?
Raising domestic revenues is essential to build capable states, to encourage engaged societies and to strengthen domestic account-ability. Raising taxes in order to reduce aid dependency is an ex-plicit goal for several fragile states (e.g. Liberia). Many developing countries, including DRC, Haiti, Mozambique, Nicaragua, Rwanda and Sierra Leone, have implemented far-reaching administration reforms since the early 1990s. Where these reforms have enjoyed success, a common factor has been sustained political commit-ment at the highest levels (IMF, 2011b).
Between 2005 and 2009, domestic revenues alone represented half of the total resource flows in fragile states — over USD 230 billion in 2009. All but four fragile states managed to mobilise gov-ernment revenue representing more than 15% of GDP in 2009 which is usually considered a reasonable target for developing countries. But compared to 2008, when 12 fragile states mobilised 35% or more of their GDP in tax revenue, only four fragile states continued to manage this level of mobilisation in 2009 (IMF 2011a) (see Table 2).
3 Peacekeeping includes developmental and non-developmental activities, and is generally not counted as ODA, except i) the net bilateral costs to donors of car-rying out the following activities within UN-administered or UN-approved peace operations: human rights, election monitoring, rehabilitation of demobilised soldiers and of national infrastructure, monitoring and training of administrators, including customs and police officers, advice on economic stabilisation, repa-triation and demobilisation of soldiers, weapons disposal and mine removal. (Net bilateral costs means the extra costs of assigning personnel to these activities, net of the costs of stationing them at home, and of any compensation received from the UN.); and ii) similar activities conducted for developmental reasons outside UN peace operations.

DAC INTERNATIONAL NETWORK ON CONFLICT AND FRAGILITY (INCAF) 7
-16 -14 -12 -10 -8 -6 -4 -2 0 2 4
Cote d'IvoireMyanmarAngolaNigeriaCongo, RepSao Tome & PrincipeSolomon IslandsComorosCentral African Rep.Sierra LeoneSomaliaBurundiGuineaZimbabwePapua New GuineaTogoKorea, Dem. Rep.MalawiCongo, Dem. Rep.LiberiaBurkina FasoTajikistanChadHaitiCameroonNigerUgandaGeorgiaSri LankaYemenNepalSudanKenyaEthiopiaBangladeshLebanonPakistan
Sao Tome & PrincipeSolomon IslandsComorosCentral African Rep.Sierra LeoneSomaliaburundiGuineaZimbabwePapua New GuineaTogoKorea, Dem. Rep.MalawiCongo, Dem. Rep.Liberiaburkina FasoTajikistanChadHaitiCameroonNigerUgandaGeorgiaSri LankaYemenNepalSudanKenyaEthiopiabangladeshLebanonPakistan
Cote d’IvoireMyanmar
AngolaNigeria
Congo, Rep
FIGURE 4. TRADE IN FRAGILE STATES (2009) IN USD BILLIONS
-14 -12 -10 -8 -6 -4 -2 0 +2
<15% 15-25% 25-35% 35-45% >45%
Myanmar 6.11 Uganda 15.10 Yemen 25.00 Uzbekistan 36.72 Solomon Islands 49.80
bangladesh 10.50 Sudan 15.40 Papua New Guinea 27.45 Guinea 41.00 Iraq 71.73
Sri Lanka 14.53 Eritrea 15.91 Georgia 29.27 Kiribati 78.39
Pakistan 14.70 Central African Republic 16.07 Liberia 29.90 burundi 109.16
Ethiopia 16.29 Angola 30.86 Timor-Leste 347.93
Zimbabwe 16.71 São Tomé and Príncipe 32.42
Nepal 16.78 Malawi 34.16
Haïti 17.68
Cameroon 18.38
Togo 18.47
Niger 19.11
burkina Faso 19.36
Côte d'Ivoire 19.49
Sierra Leone 19.74
Nigeria 19.93
Chad 20.01
Afghanistan 20.57
Tajikistan 23.41
Kenya 23.67
Congo, Dem. Rep. of 24.32
Congo, Rep. of 24.32
Lebanon 24.35
Guinea-bissau 24.80
TAbLE 2. GOVERNmENT REVENUE (2009); IN % OF GDp
Note: 2009 trade data unavailable for Afghanistan, Eritrea, Guinea-Bissau, Iraq, Kiribati, Timor-Leste, Uzbekistan, and West Bank and Gaza. Source: UNCTAD (2011), Exports and Imports of Merchandise and Services (1980-2010).
Data
: IM
F (2
011)
. Not
e: D
ata
unav
aila
ble
for D
PR K
orea
, Som
alia
and
Wes
t Ban
k &
Gaz
a.

8 FINANCIAL RESOURCES FLOWS IN FRAGILE AND CONFLICT-AFFECTED STATES: 2011 REPORT
This is not the whole story: In all countries, the size of the tax base matters just as much as the overall volume of taxes assessed. When governments depend on a large number of taxpayers for revenue, rather than only a few (e.g. multina-tional oil and gas companies), they have incentives to promote broad prosperity and to be responsive to their citizens. The rise of a middle class in many fragile states presents an op-portunity to enlarge this tax base, for example by introducing a value-added tax (VAT). In Africa, an estimated 60 million households earn over USD 3,000 annually, and this number is set to reach 100 million households — the current size of the Indian middle class — by 2015 (The Economist, 2012). Burundi introduced a national value-added tax (VAT) in 2009, and Sierra Leone and Liberia did the same in 2010.
What about trade and fragile states?
Trade, both formal and informal, provides thousands of jobs, including for women and youth. Informal trade alone provides an estimated 20-75% of total employment in most African countries (UNECA, 2005). In macroeconomic terms, howev-er, fragile states’ total trade deficit has worsened alarmingly since 2005. The total trade deficit in fragile states reached USD 66 billion in 2009. Among the five fragile states that registered a trade surplus, three are fuel exporters. At the extreme, Haiti has a trade deficit of 26% of GDP.
In addition, most fragile states’ exports remain poorly diversi-fied in terms of sectors. Twenty out of 45 fragile states are natural resource-dependent (i.e. fuel or minerals represent more than 25% of exports), which makes them dependent on boom-and-bust cycles (see Boxes 1 and 3). Both fuel and non-fuel primary commodity prices peaked in 2008 before hitting a five-year low in early 2009.
Most fragile states’ exports are also poorly diversified in terms of destination markets. Although exports to emerg-ing markets accounted for 19% of African exports in 2009, growing from 8% ten years earlier (OECD-UNECA, 2011), exports from African fragile states (57% of all fragile states) remain oriented towards OECD markets, for which projec-tions are sluggish.
Are fragile states attracting FDI?
Foreign direct investment (FDI) represents a major portion of gross capital formation (total spending on investments) in fragile states.
FDI is a source of economic development and modernisation, growth and employment. But the benefits of FDI do not accrue automatically and evenly across countries, sectors and local communities. Despite the fact that fragile states rank at the bottom of international business climate and corruption indexes (see Table 3), FDI to fragile states grew almost fourfold from 2000 to 2009, to USD 214 billion in 2009. However, the major-ity of this FDI (57%) went to the 11 fuel-exporting fragile states (see list on page 5 and Figure 5), as well as to Lebanon (mostly in real estate) and Pakistan (communications and finance).
DOING BUSINESS RANkINGS (2009)
181 Congo, Dem. Rep.
180 Central African Republic
179 Guinea-Bissau
178 Congo, Rep.
177 Burundi
176 São Tomé and Principe
175 Chad
174 Venezuela
173 Eritrea
172 Niger
171 Guinea
170 Timor-Leste
169 Benin
168 Angola
167 Equatorial Guinea
166 Mali
165 Lao PDR
164 Cameroon
163 Togo
162 Afghanistan
161 Côte d’Ivoire
160 Mauritania
159 Tajikistan
158 Zimbabwe
157 Liberia
156 Sierra Leone
155 Comoros
154 Haiti
153 Djibouti
152 Iraq
151 Gabon
150 Bolivia
149 Senegal
148 Burkina Faso
147 Sudan
146 Suriname
145 Ukraine
144 Madagascar
143 Cape Verde
142 Iran
141 Mozambique
140 Philippines
139 Rwanda
138 Uzbekistan
137 Syria
136 Ecuador
135 Cambodia
134 Malawi
133 Honduras
132 Algeria
131 West Bank and Gaza
130 Gambia, The
CORRUpTION pERCEpTIONS INDEx (2009)
180 Somalia
179 Afghanistan
178 Myanmar
176 Sudan
176 Iraq
175 Chad
174 Uzbekistan
168 Turkmenistan
168 Iran
168 Haiti
168 Guinea
168 Equatorial Guinea
168 Burundi
162 Venezuela
162 Kyrgyzstan
162 Guinea-Bissau
162 Congo, Dem. Rep.
162 Congo, Rep.
162 Angola
158 Tajikistan
158 Lao PDR
158 Central African Republic
158 Cambodia
154 Yemen
154 Paraguay
154 Papua New Guinea
154 Côte d’Ivoire
146 Zimbabwe
146 Ukraine
146 Timor-Leste
146 Sierra Leone
146 Russian Federation
146 Kenya
146 Ecuador
146 Cameroon
143 Nepal
143 Comoros
143 Azerbaijan
139 Philippines
139 Pakistan
139 Belarus
139 Bangladesh
130 Uganda
130 Nigeria
130 Nicaragua
130 Mozambique
130 Mauritania
130 Maldives
130 Libya
130 Lebanon
130 Honduras
126 Tanzania
TAbLE 3. EASE OF DOING BUSINESS AND CORRUpTION: FRAGILE STATES RANk AT THE BOTTOm (2009)
FRAGILE STATES
Source: World Bank (2011), Transparency International (2011).

DAC INTERNATIONAL NETWORK ON CONFLICT AND FRAGILITY (INCAF) 9
0.0 10.0 20.0 30.0 40.0 50.0
NigeriaLebanon
SudanPakistan
CongoAngola
MyanmarGeorgia
Côte d'IvoireBangladesh
IraqUganda
Sri LankaCameroon
YemenEthiopia
LiberiaUzbekistan
ChadCongo-Kinshasa
KenyaAfghanistan
Guinea-ConakryPapua New Guinea
Korea, Dem. Rep.Zimbabwe
NigerTajikistan
Burkina FasoMalawi
Sierra LeoneSomalia
HaitiSolomon Islands
EritreaCentral African Republic
Guinea-BissauNepal
São Tomé and PríncipeTimor-Leste
BurundiComoros
KiribatiPalestinian Adm. Areas
NigeriaLebanon
SudanPakistan
CongoAngola
MyanmarGeorgia
Côte d’Ivoirebangladesh
IraqUganda
Sri LankaCameroon
YemenEthiopiaLiberia
UzbekistanChad
Congo-KinshasaKenya
AfghanistanGuinea-Conakry
Papua New GuineaKorea, Dem. Rep.
ZimbabweNiger
Tajikistanburkina Faso
MalawiSierra Leone
SomaliaHaiti
Solomon IslandsEritrea
Central African RepublicGuinea-bissau
NepalSão Tomé and Príncipe
Timor-Lesteburundi
ComorosKiribati
West bank & Gaza
FIGURE 5. FDI IN FRAGILE STATES (2009) IN USD BILLIONS
0.0 10.0 20.0 30.0 40.0 50.0
FUEL-EXPORTING FRAGILE STATES
NON-FUEL MINERAL EXPORTERS
OTHER FRAGILE STATES
BOX 3. AID, TAx AND RESpONSIBLE mINERALS IN DR CONGO
The Democratic Republic of Congo (DRC) is highly aid-dependent, with an ODA to GNI ratio of 22.6% in 2009 (compared to an average of 3.9% across all fragile states). DRC also depends on the international community for security, hosting the largest UN peacekeeping operation after that in Darfur, representing over 16,000 troops and a budget of USD 1.4 billion for 2011-12. However, there is potential for DRC’s aid dependency to subside over the coming years: growth projections are optimistic, and there is a unique opportunity to reform the mining sector (e.g. recent legislation and measures in response to the US Dodd-Frank Act; initiatives for the transparency of payments made by multinationals to government and for responsible sourcing of minerals).
In 2010, the economy began to recover from the global financial crisis, with GDP growth estimated at 7% (up from 2.8% in 2009). This growth was largely driven by mining, a sector boosted by increasing commodity prices and sizable investments in infrastructure. Minerals accounted for 73% of exports in 2000-06, and represent the largest source of FDI in the country.
If current efforts to sever the link between conflict and minerals (OECD 2011d) and to improve the business climate succeed, the mining sec-tor is expected to remain an engine for growth. With improved domestic revenue mobilisation, the mining sector could contribute up to USD 200 million annually (20-25% of GDP) by 2018. This would represent one-third of total tax receipts and thus contribute to improved welfare for ordinary citizens. In 2005, receipts from the mining sector amounted to only USD 27 million.
Source: ODI (2010), OECD (2011d, 2011e) and World Bank (2008, 2011).
Source: UNCTAD / World Bank (2011)

10 FINANCIAL RESOURCES FLOWS IN FRAGILE AND CONFLICT-AFFECTED STATES: 2011 REPORT
The sources of FDI are shifting. In 2009, South-South FDI ac-counted for 14% of total FDI going to developing countries, from 4% in 1998 (UNCTAD 2011). For example, outward FDI from India to Sudan is estimated at USD 730 million annually (2001-05 aver-age), from China to Nigeria USD 131 million (2003-09) and from Brazil to Angola USD 83 million (2001-07 average) (Mlachila and Takebe, 2011).
Is aid going where it is needed most?
Fragile states receive more aid per capita than the average devel-oping country, and this has been the case since at least 2000. In 2009, the average amount of ODA per capita to fragile states was USD 39, whilst the average across all developing countries was USD 17. This is generally justified by the level of need (as measured by low income and/or levels of poverty) which is higher in fragile states than in non-fragile developing countries.
However, most global resource allocation formulae are based not only on need, but also on performance. While fragile states gen-erally have higher needs, they also have weaker policies and in-stitutions, which constrains their ability to absorb aid and use aid strategically to deliver transformative results. Factoring in both need and performance, would some fragile states warrant more aid, and if so, which?
A recent review of four resource allocation formulae shows •that four countries can be considered under-aided on the basis of both need and performance (i.e. should receive more ODA given high needs and ‘good enough’ governance): Bangladesh, Guinea, Nepal, and Niger (OECD 2012b).
When looking at • either need or performance, 12 additional countries appear as potentially under-aided: Burkina Faso, CAR, Chad, Comoros, DRC, Eritrea, Ethiopia, Guinea-Bissau, Myanmar, Togo, Uganda and Zimbabwe.
Half of aid to fragile states goes to only eight countries
Aid volumes continue to be very concentrated. Half of ODA to fragile states goes to only eight countries (see Figure 7). This concentration has increased over the past decade, and aid projections (2009-12) confirm this trend. There is a growing risk that countries of lesser geopolitical importance and/or that are mired in chronic crisis will fall further behind. In 2009, nine of these countries received lower ODA levels compared to 2000 (in constant terms). A more optimal allocation of resources across countries, taking into account both the need and the quality of a country’s policies and institutions, is in order.
To which sectors does aid go?
In fragile states, aid can play a particularly important counter-cycli-cal role, given that these countries are particularly vulnerable to the external shocks that frequently occur during times of financial tur-moil. Since the onset of the financial crisis in 2008, ODA to fragile states has helped keep children in school and health clinics open, while building states’ ability to raise revenues, deliver basic services and improve state-society relations (see examples from CAR in Box 2 and Kenya in Box 4).
STATEbUILDING, PEACEbUILDING AND SECURITY 36%
OTHER SOCIAL INFRASTRUCTURE AND SERVICES 11%
EDUCATION 17%
HEALTH 16%
POPULATION POLICIES, PROGRAMMES & REPRODUCTIVE HEALTH 13%
WATER SUPPLY AND SANITATION 7%
SOCIAL INFRASTRUCTURE AND SERVICES 43.7%
ECONOMIC INFRASTRUCTURE AND SERVICES 11.8%
PRODUCTION SECTORS 6.0%
MULTI-SECTOR/ CROSS-CUTTING 3.9%
COMMODITY AID/GENERAL PROGRAMME ASSISTANCE 7.7%
ACTION RELATING TO DEbT 10.6%
HUMANITARIAN AID 15.7%
OTHER ODA <0.01%
Total ODA
USD 46.7 bn
FIGURE 6. SECTORAL ALLOCATION OF ODA TO FRAGILE STATES (2009)
Data: OECD Creditor Reporting System
/CRS (2011).

DAC INTERNATIONAL NETWORK ON CONFLICT AND FRAGILITY (INCAF) 11
FIGURE 7. ODA FROm DAC COUNTRIES TO FRAGILE STATES (IN USD BILLIONS)
AFGHANISTAN
ETHIOpIA
pAkISTAN
wEST BANk AND GAzA
IRAq
CONGO, DEm REp
CôTE D’IVOIRE
SUDAN
Kenya
Haiti
bangladesh
Uganda
Nigeria
burundi
Sri Lanka
burkina Faso
Nepal
Georgia
Cameroon
Central African Rep
Malawi
Zimbabwe
Lebanon
Somalia
Chad
Yemen
Togo
Liberia
Niger
Sierra Leone
Papua New Guinea
Tajikistan
Myanmar
Congo, Rep
Angola
Guinea
Uzbekistan
Timor-Leste
Solomon Islands
Guinea-bissau
Eritrea
Korea, Dem Rep
Comoros
Sao Tome and Principe
Kiribati
0 1 2 3 4 5 6
AfghanistanEthiopiaPakistan
Palestinian Adm. AreasIraq
Congo, Dem. Rep.Cote d'Ivoire
SudanKenya
HaitiBangladesh
UgandaNigeria
BurundiSri Lanka
Burkina FasoNepal
GeorgiaCameroon
Central African Rep.Malawi
ZimbabweLebanonSomalia
ChadYemen
TogoLiberia
NigerSierra Leone
Papua New GuineaTajikistanMyanmar
Congo, RepAngolaGuinea
UzbekistanTimor-Leste
Solomon IslandsGuinea-Bissau
EritreaKorea, Dem. Rep.
ComorosSao Tome & Principe
Kiribati
6.24
3.84
3.48
3.03
2.79
2.56
2.53
2.35
2.01
1.95
1.89
1.81
1.71
1.56
1.23
1.12
0.98
0.96
0.80
0.78
0.78
0.74
0.69
0.66
0.61
0.60
0.54
0.54
0.49
0.46
0.45
0.44
0.36
0.33
0.30
0.28
0.22
0.22
0.21
0.17
0.15
0.07
0.06
0.03
0.03
Data
: OEC
D Cr
edito
r Rep
ortin
g Sy
stem
/CRS
(201
1).

12 FINANCIAL RESOURCES FLOWS IN FRAGILE AND CONFLICT-AFFECTED STATES: 2011 REPORT
500 1 000 2 000 5 000
80
75
70
65
60
55
50
45
LOW-INCOME COUNTRIES MIDDLE-INCOME COUNTRIES
China
India
USA
Indonesia
Brazil
Paki-stan
Bangladesh
Russia
Nigeria
Japan
Mexico
Philippines
Vietnam
Germany
Egypt
Ethiopia
TurkeyIran
Congo, DR
France
UK
Italy
South Korea
Myanmar
Ukraine
Colo- mbia
South Africa
Sudan
Argen- tina
Spain
Tanzania
Poland
Kenya
Morocco
Algeria
Canada
Thailand
Afghanistan
Uganda
Nepal
Peru
Uzbe-kistan Iraq
Saudi Arabia
VenezuelaMalaysia
NorthKorea
Ghana
Taiwan
Yemen
Romania
Australia
Sri Lanka
Mozambique
Madagascar
Syria
Côte d'Ivoire
Cameroon
NetherlandsChile
Kazakhstan
Burkina Faso
Cambodia
Ecuador
Malawi
Niger
Guatemala
Angola
Senegal
Zimbabwe
Mali
Zambia
CubaGreecePortugal
Chad
Bel-gium
Tunisia
Belarus
Czech Rep.
Guinea
Serbia
Hungary
DR
Somalia
Bolivia
Rwanda
Sweden
Haiti
Burundi
Benin
Austria
Azerbaijan
Tajikistan
Honduras
Switzerland
Bulgaria
El Salvador
Hong KongAndorra
Paraguay
Laos
Israel
Sierra Leone
Jordan
Libya
Papua New
Guinea
Togo
Nicaragua
Denmark
Slovakia
Kyrgyzstan
Finland
Turkmenistan
Eritrea
Norway
Georgia
Singa-pore
Bosnia & H.
Moldova
Croatia
Central African Rep.
Costa Rica
Ireland
New Zealand
Leba-non
Puerto Rico
Congo, Rep.
Albania
Lithuania
Uruguay
Mauritania
Liberia
OmanPanama
Armenia
Mongolia
Jamaica
UAEKuwait
Kosovo
Bhutan
Latvia
Namibia
Macedonia
Slovenia
Lesotho
GambiaBotswana
Guinea-Bissau
Gabon
Estonia
Mauritius
Swaziland
Timor-Leste
Trinidad &Tobago
Fiji
Qatar
Guyana
Comoros
Bahrain
Solo-mon Isl.
Equatorial Guinea
Djibouti
Lux-embourg
Suriname
Cape Verde
Malta
Brunei
Bahamas
Iceland
Belize
Barbados
Vanuatu
São Tomé & P.
SamoaTonga
Kiribati
Micronesia
Grenada
Seychelles
Antigua & Barbuda
Dominica
Marshall Isl.Palau
Nauru
Tuvalu
St Kitts & N.
Maldives
Liechten-stein
3
6
54
21
Size by population:
1000millions
100103
or less
Palestinian Adm. Areas
L
IFE
ExpE
CTAN
Cy (A
t birt
h; in
yea
rs)
GDp (Per person in USD, purchasing power adjusted; log scale)
A GROUp OF COUNTRIES HAS FALLEN BEHIND
Fragile states

DAC INTERNATIONAL NETWORK ON CONFLICT AND FRAGILITY (INCAF) 13
5 000 10 000 20 000 50 000
MIDDLE-INCOME COUNTRIES HIGH-INCOME COUNTRIES
China
India
USA
Indonesia
Brazil
Paki-stan
Bangladesh
Russia
Nigeria
Japan
Mexico
Philippines
Vietnam
Germany
Egypt
Ethiopia
TurkeyIran
Congo, DR
France
UK
Italy
South Korea
Myanmar
Ukraine
Colo- mbia
South Africa
Sudan
Argen- tina
Spain
Tanzania
Poland
Kenya
Morocco
Algeria
Canada
Thailand
Afghanistan
Uganda
Nepal
Peru
Uzbe-kistan Iraq
Saudi Arabia
VenezuelaMalaysia
NorthKorea
Ghana
Taiwan
Yemen
Romania
Australia
Sri Lanka
Mozambique
Madagascar
Syria
Côte d'Ivoire
Cameroon
NetherlandsChile
Kazakhstan
Burkina Faso
Cambodia
Ecuador
Malawi
Niger
Guatemala
Angola
Senegal
Zimbabwe
Mali
Zambia
CubaGreecePortugal
Chad
Bel-gium
Tunisia
Belarus
Czech Rep.
Guinea
Serbia
Hungary
DR
Somalia
Bolivia
Rwanda
Sweden
Haiti
Burundi
Benin
Austria
Azerbaijan
Tajikistan
Honduras
Switzerland
Bulgaria
El Salvador
Hong KongAndorra
Paraguay
Laos
Israel
Sierra Leone
Jordan
Libya
Papua New
Guinea
Togo
Nicaragua
Denmark
Slovakia
Kyrgyzstan
Finland
Turkmenistan
Eritrea
Norway
Georgia
Singa-pore
Bosnia & H.
Moldova
Croatia
Central African Rep.
Costa Rica
Ireland
New Zealand
Leba-non
Puerto Rico
Congo, Rep.
Albania
Lithuania
Uruguay
Mauritania
Liberia
OmanPanama
Armenia
Mongolia
Jamaica
UAEKuwait
Kosovo
Bhutan
Latvia
Namibia
Macedonia
Slovenia
Lesotho
GambiaBotswana
Guinea-Bissau
Gabon
Estonia
Mauritius
Swaziland
Timor-Leste
Trinidad &Tobago
Fiji
Qatar
Guyana
Comoros
Bahrain
Solo-mon Isl.
Equatorial Guinea
Djibouti
Lux-embourg
Suriname
Cape Verde
Malta
Brunei
Bahamas
Iceland
Belize
Barbados
Vanuatu
São Tomé & P.
SamoaTonga
Kiribati
Micronesia
Grenada
Seychelles
Antigua & Barbuda
Dominica
Marshall Isl.Palau
Nauru
Tuvalu
St Kitts & N.
Maldives
Liechten-stein
3
6
54
21
Size by population:
1000millions
100103
or less
Palestinian Adm. Areas
Colour by region:
1) S
an M
arin
o; 2
) Mon
aco;
3) C
ypru
s; 4
) Mon
tene
gro;
5) S
aint
Luc
ia; 6
) St V
ince
nt &
Gre
nadi
nes
Sour
ce: A
dapt
ed fr
om G
apm
inde
r (20
10).
14 FINANCIAL RESOURCES FLOWS IN FRAGILE AND CONFLICT-AFFECTED STATES: 2011 REPORT
BOX 4. THE COUNTERCyCLICAL ROLE OF AID IN kENyA
Early 2008 was marked by post-election violence across Kenya. Over 1 200 people were killed and 300 000 displaced. This unrest, coupled with the effects of the financial crisis, reduced gross domestic product (GDP) growth to 1.7% in 2008. Domestic revenues contracted by half between 2008-09, threatening funding for vital social services.
However, in 2009, ODA rose in real terms by 34%, with 5.2% of sector allocable aid spent on education, 6.6% on health, 4.9% on government and civil society (which includes 1.2% of ODA on conflict peace and security), and 18.4% on humanitarian aid.
The economy recovered in 2010, but in 2011, Kenya’s economy experienced further shocks, including drought, higher food and fuel prices and electricity shortages.
Source: OECD-DAC (2011)
In 2009, 44% of ODA to fragile states went to • social infra-structure and services (education; health; population poli-cies, programming and reproductive health; water and sanita-tion; statebuilding; peacebuilding and security).
Humanitarian aid • plays a particularly critical role in fragile states. In 2009, humanitarian aid represented 16% of total ODA (see Figure 6). In Somalia this figure was as high as 69%. 31% of humanitarian aid is long-term (see OECD 2012c), which might crowd out other types of assistance. Humanitar-ian aid per capita is highest in West Bank and Gaza (USD 183), Somalia (USD 50) and Georgia (USD 32) (see Figure 9).
ODA to “peacebuilding and security” • (OECD DAC Credi-tor Reporting System/CRS code 152) and “statebuilding” (code 151) have all increased from 2005 to 2009, with the ex-ception of ODA to strengthen core public sector management systems and capacity. However, assessing whether more or less aid supports peacebuilding and statebuilding goals would require going beyond the DAC CRS codes to conduct country-specific analyses of what activities can be considered critical to peacebuilding or statebuilding. Job creation, for example, can contribute to peacebuilding just as much as the activities traditionally labelled as “peacebuilding”.
Is ODA to fragile states effective?
Fragile situations are characterised by high need and limited capac-ity — two reasons for aid to be more, not less, effective. However, the combined monitoring survey of the Paris Declaration on Aid Ef-fectiveness and the Principles for Good International Enlargement in Fragile States and Situations shows that the quality of aid to fragile states is generally poorer than in other developing countries (see Figure 14, OECD 2011a and 2011b).4 In particular:
4 The sample of fragile states in this combined Survey is twelve countries: Burundi; DRC; Central African Republic; Chad; Comoros; Guinea-Bissau; Haiti; Liberia; Sierra Leone; Somalia; Timor-Leste; Togo. South Sudan also partici-pated but was not an independent country at the time of the combined Survey.
Use of public financial management (PFM) systems is marked-•ly lower in fragile states than other developing countries (27% aid versus 48% average for all developing countries). This is in spite of fragile states having on average made more progress towards reliable PFM systems: 44% fragile states have moved up at least one measure on the PFM/CPIA scale since 2005, versus 38% developing countries.
Use of local procurement systems is also lower in fragile states •(20% aid versus 44% for all developing countries).
Joint missions and analytical work, and the provision of aid in •the context of programme-based approaches, are also lesser in fragile states than in other developing countries.
Aid is less predictable in fragile states. While this can in some •cases be explained by crises and opportunities, stop-and-go aid can create damaging shocks.
There are three main issues of concern with regard to aid effec-tiveness in fragile states: i) volatile aid; ii) too few donors in some countries and too many in others; and iii) projections of aid reduc-tions from DAC donors.
Fragile states experience much higher rates of volatil-•ity and much lower rates of predictability than other developing countries. Two-thirds of aid shocks between 1970 and 2006 occurred in fragile states, just where country systems are the weakest and the risks of instability highest.5 Such volatility is estimated to shave 15% off the value of ODA. Recent examples include CAR, Guinea-Bissau, Haiti, Liberia and Sierra Leone (see Figure 13).
There are too few donors in some countries and too •many in others. Despite limited capacity, fourteen fragile states have partnerships with 30 donors or more, half of which
5 Aid shocks can be measured as a difference of more than 15% of aid per capita from one year to another or fluctuations of aid in excess of 5% of GDP. See, for example, Levin and Dollar (2005), Fielding and Mavrotas (2005), McGil-livray and Feeny (2006), Celasun and Walliser (2008) and Kharas (2008).

DAC INTERNATIONAL NETWORK ON CONFLICT AND FRAGILITY (INCAF) 15
0% 10% 20% 30% 40% 50% 60% 70% 80% 90% 100%
Kiribati
Sao Tome & Principe
Togo
Nigeria
Uzbekistan
Solomon Islands
Guinea-Bissau
Malawi
Cote d'Ivoire
Congo, Rep
Comoros
Sierra Leone
Papua New Guinea
Angola
Timor-Leste
Burkina Faso
Cameroon
Tajikistan
Guinea
Liberia
Nepal
Bangladesh
Uganda
Niger
Afghanistan
Lebanon
Yemen
Haiti
Burundi
Georgia
Ethiopia
Iraq
Central African Rep.
Pakistan
Kenya
Eritrea
Congo, Dem. Rep.
Palestinian Adm. Areas
Sri Lanka
Myanmar
Korea, Dem. Rep.
Zimbabwe
Chad
Sudan
Somalia
Chart Title%HUM %ODA
SomaliaSudanChad
ZimbabweKorea, Dem. Rep.
MyanmarSri Lanka
West bank and GazaCongo, Dem. Rep.
EritreaKenya
PakistanCentral African Rep.
IraqEthiopiaGeorgiaburundi
HaitiYemen
LebanonAfghanistan
NigerUganda
bangladeshNepal
Liberia GuineaTajikistan
Cameroonburkina FasoTimor-Leste
AngolaPapua New Guinea
Sierra LeoneComoros
Congo, RepCote d’Ivoire
MalawiGuinea-bissau
Solomon IslandsUzbekistan
NigeriaTogo
Sao Tome & PrincipeKiribati
0% 10% 20% 30% 40% 50% 60% 70% 80% 90% 100%
HUMANITARIAN AID OTHER ODA
FIGURE 8. HOw mUCH AID IS HUmANITARIAN?
WEST bANK AND GAZA $180.05
FIGURE 9. TOp 10 RECIpIENTS OF HUmANITARIAN AID per capita (2009) IN USD
= USD 1 PER CAPITA
HAITI $14.41
IRAQ $15.76
$17.13
LEbANON $17.60
CHAD $28.39
ZIMbAbWE $29.06
SUDAN $30.12
GEORGIA $32.13
SOMALIA $50.44
AFGHANISTAN
Data
: OEC
D DA
C (2
011)
Data
: OEC
D DA
C (2
011)

16 FINANCIAL RESOURCES FLOWS IN FRAGILE AND CONFLICT-AFFECTED STATES: 2011 REPORT
are considered non-significant (see Figure 11).6 By contrast, four fragile states are each dependent on only one donor for at least 50% of their aid. These are Iraq (89%), Solomon Islands (81%), Papua New Guinea (68%) and Afghanistan (53%). Whilst donor concentration should generally be encouraged, changes in donor priorities could have a significant impact on countries dependent on exceptionally few donors (see Figure 11).
Current trends and forward projections show aid re-•ductions from DAC donors to fragile states. Looking for-ward, projections for 2012-15 show little change in total coun-try programmable assistance (CPA), with some large increases expected in Bangladesh, Nigeria and Kenya, but large falls ex-pected in Côte d’Ivoire, Guinea and the Solomon Islands. The largest falls in percentage terms are expected in Sao Tome and Principe (-13.8%), the Solomon Islands (-8.3%) and Côte d’Ivoire (-7.6%).
The growing role of non-DAC donors
USD 46.7 billion in net ODA goes to fragile states, or 37% of total ODA. In 2009, the top three doors to fragile states were the United States (USD 12 billion), the United Kingdom (USD 2.9 billion) and France (USD 2.25 billion). The top three in proportion of their total bilateral aid were Italy (48%), the United States (48%) and Australia (40%) (OECD database). Furthermore, DAC donors provide most of the UN peacekeeping budget and other non-ODA funds for security, statebuilding and peacebuilding. The top donors to the 2011-12 UN peacekeeping budget were the United States (27%), Japan (12%) and the United Kingdom (8%) (UNDPKO, 2011).
However, between 2005 and 2009, DAC donors cut their ODA to all countries by 1.8% and to fragile states by 19.9%. While their contribution to fragile states is shrinking, emerging bilateral donors, global funds and philanthropy continue to play a growing role.
Notably, China’s engagement in fragile states is growing on multiple fronts: co-operation, investment, trade and technology. In Novem-ber 2009, the Chinese prime minister announced a USD 10 bil-lion loan package for Africa, including in agriculture, education and health. The state-owned Export-Import Bank of China (EXIM) lent USD 67.2 billion to sub-Saharan African countries between 2001 and 2010, compared to the World Bank’s USD 54.7 billion. Most of the Chinese loans were used for infrastructure projects (Fitch Ratings 2011).7
6 An aid relation (i.e. between an individual donor and partner country) is consid-ered “significant” in financial terms if: a) the donor provides a higher share of aid to the partner country than the donor’s overall share of global aid; and/or b) the donor is among the largest donors that cumulatively account for at least 90% of the partner country’s aid.
7 These are loans on concessional terms for countries who have signed frame-work agreements with China’s EXIM Bank. At least twenty fragile states have signed such framework agreements: Angola, Bangladesh, Cameroon, Congo Rep., DR Congo, Cote d’Ivoire, Djibouti, Eritrea, Ethiopia, Kenya, Laos, Liberia, Nigeria, Pakistan, Papua New Guinea, Sudan, Tajikistan, Togo, Uzbekistan, Yemen and Zimbabwe.
Non-DAC donors reporting to the DAC reduced their overall ODA by 19%, but increased their focus on fragile states (+64.9%).8 The most notable increase was from the United Arab Emirates, whose aid was multiplied by eight over 2007-08 and by 26 over 2008-09.
Can aid be catalytic?
Aid is only a modest part of the resource equation, but it can cata-lyse greater domestic revenue mobilisation, support a better in-vestment environment (e.g. through better policy, regulations and infrastructure), foster trade and combat illicit flows out of fragile states. Donors also have a role to play by harnessing whole-of-government efforts to reduce global average remittance costs, help stabilise commodity prices and make migration policies a force for development.
Aid can play a catalytic role by helping reduce aid dependency, notably by helping countries raise domestic revenues. Although donor support on tax matters is still limited (around 0.1% of annual ODA across all developing countries), experience shows that it can be a high-return investment. Since 1990, 15 African countries have formed revenue authorities with donor support, including Uganda, where tax revenue increased from 55% of government expenditure to 68% in 2010 (Gleenie, 2012). In El Salvador, a USD 10 million project helped the tax department increased its revenue collection from 2004 to 2010 by about 1.5% of GDP (USD 350 million annu-ally, adjusted for cyclical factors) (USAID, 2011).
In the area of trade, fragile states often lack the capacity (institu-tions, policies, infrastructure and access) to negotiate and imple-ment trade agreements and trade-related structural adjustment programmes; to diversify and increase exports and compete ef-fectively in global markets; and more generally to benefit from in-ternational trade. Aid that builds the trade capacity of fragile states can enhance growth prospects, improve the balance of payments and, in some cases, reduce commodity-export dependency. For example, Sierra Leone is building the productive capacity of its cash crops sector as part of its Agenda for Change 2008-12 through a European Union-funded aid-for-trade programme. With the support from the Inter-American Development Bank, Haiti introduced the Automated System for Customs Data (ASYCUDA) customs clear-ance system in the country, reducing customs clearance times for some declarations from four days to two hours.
8 Non-DAC donors reporting to the DAC are: Chinese Taipei, Cyprus, Czech Republic, Estonia, Hungary, Iceland, Israel, Kuwait, Latvia, Liechtenstein, Lithu-ania, Malta, Poland, Romania, Russia, Saudi Arabia, Slovak Republic, Slovenia, Thailand, Turkey and the United Arab Emirates.

DAC INTERNATIONAL NETWORK ON CONFLICT AND FRAGILITY (INCAF) 17
Kore
a, D
em. R
ep.
Sao
Tom
e an
d Pr
inci
pe
Kirib
ati
Com
oros
Tim
or-L
este
Cong
o, R
ep
Uzbe
kist
an
Som
alia
Mya
nmar
Libe
ria
Chad
Ango
la
ZIm
babw
e
Guin
ea-b
issa
u
Guin
ea
Togo
Nige
r
buru
ndi
Solo
mon
Isla
nds
Papu
a N
ew G
uine
a
Cent
ral A
fric
an R
ep
Yem
en
Eritr
ea
Mal
awi
bang
lade
sh
burk
ina
Faso
Tajik
ista
n
Cam
eroo
n
Ugan
da
Sier
ra L
eone
Haiti
Suda
n
Nep
al
Keny
a
Leba
non
Wes
t ban
k &
Gaza
Ethi
opia
Nige
ria
Côte
d’Iv
oire
Sri L
anka
Cong
o, D
em R
ep
Geor
gia
Iraq
Paki
stan
Afgh
anis
tan
Data: OECD CRS (2011)
35
30
25
20
15
10
5
0
FIGURE 11. ExTREmE DONOR FRAGmENTATION, ExTREmE DONOR CONCENTRATION
Afgh
anist
an
Pakis
tanIraq
Geor
gia
Cong
o, De
m. R
ep.
Sri L
anka
Cote
d'Ivo
ire
Nige
ria
Ethiop
ia
Pales
tinian
Adm
. Are
as
Leba
non
Keny
a
Nepa
l
Suda
n
Haiti
Sierra
Leon
e
Ugan
da
Came
roon
Tajik
istan
Burk
ina Fa
so
Bang
lades
h
Mala
wi
Eritr
ea
Yeme
n
Cent
ral A
frica
n Rep
.
Papu
a New
Guin
ea
Solom
on Is
lands
Buru
ndi
Nige
r
Togo
Guine
a-Con
akry
Guine
a-Biss
au
Zimba
bwe
Ango
la
Chad
Liber
ia
Mya
nmar
Soma
lia
Uzbe
kistan
Cong
o, Re
p
Timor
-Leste
Como
ros
Kiriba
ti
Sao T
ome &
Princ
ipe
Kore
a, De
m. R
ep.
Number of non-significant donor relations Number of significant donor relations
NUMbER OF NON-SIGNIFICANT DONOR RELATIONS NUMbER OF SIGNIFICANT DONOR RELATIONS
ODA TO FRAGILE STATES AS % OF bILATERAL AID ODA TO FRAGILE STATES IN USD bILLIONS
FIGURE 10. ODA TO FRAGILE STATES (2009)
- 2.00 4.00 6.00 8.00 10.00 12.00 14.00 0.0%10.0%20.0%30.0%40.0%50.0%60.0%
United States
United Kingdom
France
Germany
Japan
Canada
Spain
Australia
Norway
Netherlands
Sweden
Denmark
belgium
Italy
Switzerland
Ireland
Finland
Korea
Austria
Portugal
New Zealand
Luxembourg
Greece
49.4
39.3
31.3
25.5
26.9
34.1
22.1
40.8
28.0
17.4
25.1
34.0
34.5
56.7
26.7
38.9
24.1
25.2
22.6
28.4
29.5
23.3
17.9
12.44
2.90
2.25
1.81
1.66
1.07
0.99
0.94
0.89
0.84
0.76
0.65
0.55
0.50
0.47
0.27
0.19
0.15
0.11
0.08
0.07
0.06
0.05
0 2 4 6 8 10 1250% 40% 30% 20% 10% 0%
Data
: OEC
D DA
C (2
011)
18 FINANCIAL RESOURCES FLOWS IN FRAGILE AND CONFLICT-AFFECTED STATES: 2011 REPORT
Aid can also play a catalytic role by “investing in investment”. In-vestment, domestic and foreign, creates jobs and growth, which are critical to peace, as reflected in the 2011 New Deal for Engage-ment in fragile states. The private sector contributes to greater domestic revenue mobilization, can lift some of the government’s burden in providing services, and increase legitimacy. The chal-lenges to investment are numerous: on average, fragile states rank 144 out of 183 economies on the 2010, whereas non-fragile states rank 78; although investments are riskier, given this poor business climate, the investment rate to GDP is usually much lower than the 30 percent rate needed for fragile states to stop falling behind and start converging with the global economy (Collier, 2007); lack of stable access to capital is a distinctive feature of fragile states, even in resource rich countries.
Yet there is a growing body of evidence on well-sequenced initia-tives that have delivered results at the macro-economic, enabling environment and enterprise levels. One example is the investment climate program in Liberia, which between 2008-10 generated USD 13 million in private sector investment, created over 20,000 jobs and moved Liberia from rank 177 to 149 on the Doing Busi-ness index (World Bank, 2011). More targeted projects can also contribute notable results, such as the opening of a business reg-istry in 1999 in Kosovo, which led to the registration of 90,000 businesses. At the sector level, there are opportunities for private sector development that are also poverty-reducing, for example in
the telecoms sector, where mobile phones make up for lack of in-formation and infrastructure through teletrading, telebanking and telemedicine. The top three countries with the highest growth rate of mobile penetration are all fragile states: Afghanistan, Iraq and Liberia (2009).
Another example of aid with a high and measureable return to in-vestment is in the area of stolen assets recovery. Since a large portion of illicit financial flows ends up in developed countries, part of the solution to stemming such flows must be focused on strengthening OECD financial system integrity, and the ability to detect, freeze and repatriate stolen assets back to developing coun-try jurisdictions. Weak systems and incentives for uncovering illicit funds from developing countries have meant that only few suc-cessful cases of asset recovery have involved poor countries, but present a high “yield”. In the UK, a USD 20 million project to fight international bribery and money laundering has led to the freezing of USD 250 million worth of assets awaiting repatriation to develop-ing countries – a worthwhile investment and innovative way of lev-eraging ODA resources which other donors may want to emulate.
In the area of remittances, the G8 has committed to reducing the cost of remittance services by 5% in five years (the “5x5 objective”) at the 2009 summit in L’Aquila. Between 2008 and 2011, the cost has decreased in all G8 countries except France and Japan (World Bank, 2011).
FIGURE 12. ODA TO FRAGILE STATES (2004-09)
0
5,000
10,000
15,000
20,000
25,000
30,000
35,000
40,000
45,000
50,000
2004 2005 2006 2007 2008 2009
Fragiles States Total ODA Net Fragiles States ODA Tot excl.Debt
NET ODA (DEbT RELIEF) NET ODA (EXCLUDING DEbT RELIEF)
2004 2005 2006 2007 2008 2009
45
35
25
15
5
USD
BILL
IONS
(CUR
REN
T PR
ICES
)
Data: OECD DAC (2011)

DAC INTERNATIONAL NETWORK ON CONFLICT AND FRAGILITY (INCAF) 19
0 20 40 60 80 100
FIGURE 14. AID EFFECTIVENESS IN 12 FRAGILE STATES COmpARED TO ALL COUNTRIES pARTICIpATING IN THE 2011 pARIS DECLARATION mONITORING SURVEy
0 20 40 60 80 100
1. Operational development strategies
2a. Reliable public financial management systems
3. Aid flows are aligned on national priorities
4. Strengthen capacity by co-ordinated support
5a. Use of country PFM systems
5b. Use of country procurement systems
7. Aid is more predictable
8. Aid is untied
9. Use of common arrange-ments or procedures
10a. Joint missions
10b. Joint country analytic work
11. Results-oriented frameworks
12. Mutual accountability
37%
38%
41%
57%
48%
44%
43%
86%
45%
19%
43%
20%
38%
75%
50%
85%
55%
71%
89%
66%
40%
66%
36%
100%
9%
44%
45%
50%57%
27%
20%
35%
90%
29%
16%
38%
0%
8%
75% ALL COUNTRIES FRAGILE STATES TARGET LEVEL
-100
-50
0
50
100
150
200
2000 2001 2002 2003 2004 2005 2006 2007 2008 2009
Ann
ual
% c
hang
e in
OD
A p
er C
apit
a
Central African Rep. Guinea-Bissau Haiti Liberia Sierra Leone
2000 2001 2002 2003 2004 2005 2006 2007 2008 2009
150
100
50
0
-50
ANN
UAL
% C
HANG
E IN
ODA
PER
CAP
ITAFIGURE 13. AID VOLATILITy IN SELECTED FRAGILE STATES (2000-09)
CENTRAL AFRICAN REPUbLIC GUINEA-bISSAU HAITI LIbERIA SIERRA LEONE
2009
Sour
ce: A
dapt
ed fr
om O
ECD
(201
1b).
Sour
ce: A
dapt
ed fr
om W
orld
Ban
k (2
011e
).

20 FINANCIAL RESOURCES FLOWS IN FRAGILE AND CONFLICT-AFFECTED STATES: 2011 REPORT
ANNEX STATISTICAL DIGEST (2009)
• CONFLICT-AFFECTED TOP THIRD MIDDLE THIRD bOTTOM THIRD
DEVELOpmENT INDICATORS RESOURCE FLOwS
TOTAL POPULATION1
POPULATION UNDER 152
URbAN POPULATION3
GDP GROWTH4
MObILE SUbSCRIPTIONS5 REMITTANCES6 DOMESTIC
REVENUE7 NET FDI8 ODA NET9
ODA PER CAPITA10
Million % of total % of total %∆ 2008-09 per 100 people USD Million % of GDP USD Billion USD Billion USD
Afghanistan • 32.30 47 24.80 8.20 35.89 - 20.57 1.60 6.24 186.47
Angola • 19.60 46 58.50 2.30 43.70 - 30.86 11.58 0.30 12.91
Bangladesh 150.50 34 28.10 6.07 34.28 10.520 10.50 5.16 1.89 8.34
Burkina Faso 17.00 46 20.40 9.24 20.64 0.100 19.36 0.86 1.12 67.81
Burundi 8.60 44 11.00 3.90 10.26 0.030 109.16 0.07 1.56 68.86
Cameroon 20.00 41 58.40 2.60 38.58 0.150 18.38 4.16 0.80 33.87
Central African Rep • 4.40 42 38.90 3.30 3.89 - 16.07 0.25 0.78 56.09
Chad • 11.50 46 27.60 4.30 24.56 - 20.01 3.32 0.61 51.31
Comoros 0.80 42 28.20 2.10 13.97 - - 0.05 0.06 70.79
Congo, Dem Rep • 20.20 47 35.20 7.24 15.83 0.190 19.49 3.06 2.53 122.43
Congo, Rep 67.80 42 62.10 8.75 55.08 - 24.32 13.17 2.56 36.66
Cote d'Ivoire 4.10 41 50.10 3.01 68.97 0.020 24.32 6.20 0.33 71.79
Eritrea 5.40 43 21.60 2.20 2.77 - 15.91 0.38 0.15 28.40
Ethiopia • 84.70 44 17.60 10.14 4.99 0.260 16.29 3.92 3.84 47.05
Georgia 4.30 18 52.90 6.37 64.32 0.710 29.27 7.21 0.96 205.84
Guinea • 10.20 43 35.40 1.93 57.44 0.060 41.00 1.48 0.28 22.01
Guinea-Bissau 1.50 48 30.00 3.47 37.76 0.050 24.80 0.18 0.17 98.93
Haiti 10.10 37 49.60 -5.05 36.98 1.380 17.68 0.45 1.95 113.59
Iraq • 32.70 41 66.40 0.84 63.43 0.070 71.73 5.06 2.79 89.78
Kenya • 41.60 43 22.20 5.30 49.07 1.690 23.67 1.84 2.01 45.07
Kiribati 0.10 31 44.00 1.80 1.02 - 78.39 0.01 0.03 277.27
Korea, DPR 4.30 23 63.40 - 0.29 7.560 - 1.44 0.07 2.75
Lebanon 4.10 28 87.20 7.00 36.36 0.030 24.35 25.51 0.69 152.72
Liberia 15.40 47 61.50 5.51 21.95 - 29.90 3.71 0.54 133.74
Malawi 48.30 47 19.80 7.10 16.62 0.120 34.16 0.80 0.78 53.48
Myanmar • 30.50 26 33.90 10.42 0.94 2.990 6.11 7.52 0.36 7.50
Nepal 16.10 38 18.20 4.55 25.88 0.090 16.78 0.17 0.98 29.07
Niger 162.50 48 16.70 8.81 17.36 9.590 19.11 1.21 0.49 31.39
Nigeria • 24.50 44 49.80 7.85 47.32 - 19.93 50.11 1.71 10.74
Pakistan • 176.70 36 37.00 4.14 60.40 8.720 14.70 14.61 3.48 16.31
Papua New Guinea 7.00 40 12.50 8.00 13.43 0.010 27.45 1.45 0.45 61.71
Sao Tome & Principe 0.20 41 62.20 4.50 39.38 0.002 32.42 0.16 0.03 188.97
Sierra Leone 6.00 43 38.40 4.95 20.21 0.050 19.74 0.46 0.46 78.45
Solomon Islands 0.60 40 18.60 7.00 5.72 0.002 49.80 0.39 0.21 392.86
Somalia • 9.60 44 37.40 - 7.03 - - 0.45 0.66 72.55
Sri Lanka • 21.00 23 15.10 8.01 68.20 3.360 14.53 4.35 1.23 34.05
Sudan • 44.60 40 45.20 4.45 36.11 2.990 15.40 19.14 2.35 53.88
Tajikistan 7.00 38 26.50 3.80 72.24 1.750 23.41 0.87 0.44 60.28
Timor-Leste 1.20 45 28.10 7.42 - - 347.93 0.12 0.22 197.25
Togo 6.20 43 43.40 3.37 37.06 0.340 18.47 - 0.54 84.55
Uganda • 34.50 49 13.30 5.18 28.99 0.750 15.10 5.01 1.81 55.17
Uzbekistan 27.80 32 36.90 8.50 59.13 - 36.72 3.64 0.22 6.85
West Bank & Gaza 4.20 - 72.10 - 30.27 1.160 - -0.22 3.03 748.44
Yemen • 24.80 45 31.80 - 16.47 1.220 25.00 4.08 0.60 21.42
Zimbabwe 12.80 38 38.30 9.00 23.98 - 16.71 1.38 0.74 59.06
Note: To make this data easier to understand, the group of fragile states have been divided into terciles for each column (upper 1/3, middle 1/3, bottom 1/3). The colours used to indicate the three groups are given above.
Sources: 1World Bank (2011); 2 World Health Organisation (2010); 3United Nations WDI (2011); 4World Bank/OECD (2011); 5World Bank/ITU (2011); 6World Bank (2011); 7IMF (2011); 8IMF (2011); 9OECD-DAC (2011); 10OECD-DAC/World Bank (2011).

DAC INTERNATIONAL NETWORK ON CONFLICT AND FRAGILITY (INCAF) 21
Bakarania, S. and Lucas, B. (2009), The Impact of the Financial Crisis on Conflict and State Fragility in Sub-Saharan Africa, Is-sues Paper, Governance and Social Development Resource Centre (GSDRC), www.gsdrc.org/docs/open/EIRS6.pdf.
Belasco, A. (2011), The Cost of Iraq, Afghanistan, and Other Global War on Terror Operations Since 9/11, Congressional Research Serv-ice, www.fas.org/sgp/crs/natsec/RL33110.pdf.
Baliamoune-Lutz, M. (2009), “Institutions, trade, and social cohe-sion in fragile states: Implications for policy conditionality and aid allocation”, Journal of Policy Modeling 31(6), pp 877-890, http://dx.doi.org/10.1016/j.jpolmod.2009.07.003.
Beine, M., F. Docquier and H. Rapoport (2006), Measuring Interna-tional Skilled Migration: New Estimates Controlling for Age of Entry, World Bank, Washington.
Brinkman, H-J and Hendrix, C. (2010), Food Insecurity and Con-flict: Applying the WDR Framework, Background Paper, World De-velopment Report 2011, World Bank, Washington, http://wdr2011.worldbank.org/sites/default/files/pdfs/WDR%20Background%20Paper_Brinkman%20and%20Hendrix.pdf.
Chandy, L. and G. Gertz (2011), “Poverty in Numbers: The Chang-ing State of Global Poverty from 2005 to 2015”, Policy Brief, Brook-ings Institution, Washington.
Chami, R., et al. (2003), “Are Immigrant Remittance Flows a Source of Capital for Development?”, Working Paper. International Mon-etary Fund, Washington.
Collier, P. et al. (2003), “Breaking the Conflict Trap: Civil War and Development Policy”, Research Report, World Bank/Oxford Univer-sity Press, Oxford, www-wds.worldbank.org/external/default/WDS-ContentServer/WDSP/IB/2003/06/30/000094946_0306190405396/Rendered/PDF/multi0page.pdf.
De Catheu, J. (2008), Celtel and Celpay in the Democratic Republic of Congo, GIM Case Study No. A010. United Nations Development Programme, New York, http://growinginclusivemarkets.org/media/cases/DRC_Celtel_2008.pdf.
Fitch Ratings (2011), The Africa-China Connection, Fitch Ratings.
Geopolicity (2011), The Economics of Piracy: Pirate Ransoms & Livelihoods off the Coast of Somalia, www.geopolicity.com/upload/content/pub_1305229189_regular.pdf.
Glaeser, L. et al. (2011), Haiti Prospective Food Security Assess-ment, United States Agency for International Development (USAID), Washington, www.fantaproject.org/downloads/pdfs/Haïti_Prospec-tive_FoodSecurity_Assessment_Nov2011.pdf.
Global Humanitarian Assistance (GHA) (2011), GHA Report 2011, Global Humanitarian Assistance, Somerset, www.globalhumanitari-anassistance.org/wp-content/uploads/2011/07/gha-report-2011.pdf.
Global Witness (2009), “Faced with a gun, what can you do?”, Glo-bal Witness, London.
International Monetary Fund (IMF) (2011a), World Economic Out-look Database.
IMF (2011b), Revenue Mobilization in Developing Countries, IMF, Washington, www.imf.org/external/np/pp/eng/2011/030811.pdf.
IMF (2012) World Economic Outlook Update, IMF, Washington, www.imf.org/external/pubs/ft/weo/2012/update/01/index.htm.
Lindley, A. (2007), Remittances in Fragile Settings: a Somali Case Study, Households in Conflict Network (HiCN) Working Paper 27, Institute of Development Studies, University of Sussex, www.hicn.org/papers/wp27.pdf.
Margesson, R. (2010), United Nations Assistance Mission in Af-ghanistan: Background and Policy Issues, Congressional Research Service, Washington, www.fas.org/sgp/crs/row/R40747.pdf.
Minot, N. (2011), Transmission of World Food Price Changes to Markets in Sub-Saharan Africa, International Food Policy Research Institute, Washington.
ODI (Overseas Development Institute) (2010), “Democratic Republic of Congo, Phase 2”, ODI Global Financial Crisis Discussion Papers 15, ODI, London.
OECD (2008) Making Trade Work for Developing Countries, Policy Brief, OECD, Paris, www.oecd.org/dataoecd/47/4/40672245.pdf.
OECD (2011a), International Engagement in Fragile States: Can’t We Do Better?, Conflict and Fragility, OECD, Paris, http://dx.doi.org/10.1787/9789264086128-en.
OECD (2011b), Aid Effectiveness 2011: A Progress Report on Imple-menting the Paris Declaration, Better Aid, OECD, Paris, http://dx.doi.org/10.1787/9789264125780-en.
OECD (2011c), Multilateral Aid 2010, OECD, Paris, http://dx.doi.org/10.1787/9789264046993-en.
OECD (2011d), OECD Due Diligence Guidance for Responsible Sup-ply Chains of Minerals from Conflict-Affected and High-Risk Areas, OECD, Paris, http://dx.doi.org/10.1787/9789264111110-en.
OECD (2011e), African Economic Outlook 2011: Africa and its Emerg-ing Partners, OECD, Paris, http://dx.doi.org/10.1787/aeo-2011-en.
OECD (2011f), Economic Diversification in Africa: A review of selected countries, OECD, Paris, http://dx.doi.org/10.1787/9789264096233-en.
OECD (2012a), International Support to Post-Conflict Transition: Re-thinking Policy, Changing Practice, DAC Guidelines and Reference Series, OECD, Paris, http://dx.doi.org/10.1787/9789264168336-en.
References
22 FINANCIAL RESOURCES FLOWS IN FRAGILE AND CONFLICT-AFFECTED STATES: 2011 REPORT
OECD-FAO (2011), OECD-FAO Agricultural Outlook 2011-2020, OECD, Paris, http://dx.doi.org/10.1787/agr_outlook-2011-en.
Schlenker, W. and Lobell, D. (2010), “Robust Negative Impacts of Climate Change on African Agriculture”, Environmental Research Letters 5 (2010), http://dx.doi.org/10.1088/1748-9326/5/1/014010.
Task Force on Financial Integrity and Economic Development (2011), Task Force website, www.financialtaskforce.org, accessed 22 November 2011.
UNCTAD (2011), UNCTAD Stat website, http://unctadstat.unctad.org, accessed 22 November 2011.
UNDESA (2011), Population Division, Population Estimates and Projections Section website, http://esa.un.org/unpd/wpp/unpp/pan-el_population.htm, accessed 22 November 2011.
United Nations Development Programme (UNDP) (2011), Illicit Fi-nancial Flows from the Least Developed Countries 1990-2008, UNDP, New York, www.beta.undp.org/content/dam/undp/library/Poverty%20Reduction/Trade,%20Intellectual%20Property%20and%20Migration/FINAL%20_IFFs_from_LDCs.pdf.
UNDP (2010), What Will It Take to Achieve the Millenium Develop-ment Goals? An International Assessment, UNDP, New York.
United Nations Economic Commission for Africa (2010), Informal Trade in Africa, UNECA, Addis Ababa, www.uneca.org/atpc/Brief-ing_papers/7.pdf.
UNICEF (2010), Haiti’s Children and the MDGs: Overcoming Disas-ter and Ensuring Development with Equity for All Children in Haiti, UNICEF Haiti, Port-au-Prince, www.unicef.it/Allegati/Bambini_di_Haiti_e_OSM.pdf.
United Nations Population Fund (2001), State of the World Popula-tion 2011, UNFPA, New York.
United Nations Office on Drugs and Crime (UNODC) (2009), World Drug Report 2009, UNODC, Vienna.
UNODC (2011), Global Study on Homicide, UNODC, Vienna, www.unodc.org/documents/data-and-analysis/statistics/Homicide/Globa_study_on_homicide_2011_web.pdf.
UN Peacekeeping (2011), Financing peacekeeping website, www.un.org/en/peacekeeping/operations/financing.shtml.
World Bank (2007), IDA at Work: Sierra Leone: Recovering from Years of Conflict, World Bank, Washington, http://siteresources.worldbank.org/IDA/Resources/IDA-SierraLeone.pdf.
World Bank (2008), Growth with Governance in the Mining Sector, World Bank, Washington, www.congomines.org/wp-content/up-loads/2011/10/BanqueMondiale-2008-GrowthWithGovernance.pdf.
World Bank (2011a), Democratic Republic of Congo: Country Brief, World Bank, Washington.
World Bank (2011b), World Development Indicators website, http://data.worldbank.org/data-catalog/world-development-indicators
World Bank (2011c), Ease of Doing Business Index website, www.doingbusiness.org/rankings.
World Bank (2011d), Improving the Odds of Achieving the MDGs: Global Monitoring Report 2011, World Bank, Washington, http://go.worldbank.org/SUEMHZMEW0.
World Bank (2011e), World Development Report 2011: Conflict, Se-curity and Development, World Bank, Washington, http://wdr2011.worldbank.org.

DAC INTERNATIONAL NETWORK ON CONFLICT AND FRAGILITY (INCAF) 23

The DAC International Network on Conflict and Fragility works on specific development challenges in conflict-affected and fragile states, supporting peacebuilding and statebuilding processes that concentrate on promoting lessons and experi-ences from the field, setting international norms and standards, tracking global results and providing practical guidance to help improve responses. To this end, the Conflict and Fragility Series brings together both in-depth analysis and practical recommendations. Free electronic copies may be downloaded from the OECD bookshop (www.oecd-ilibrary.org). For more information, contact the INCAF Secretariat at [email protected].
Effective Engagement in Fragile States
International Engagement in Fragile States: Can’t we do better?http://dx.doi.org/10.1787/9789264086128-en
Four years after DAC ministers endorsed the Principles for Good International Engagement in Fragile States and Situations, 13 countries have decided to take stock of the quality and impact of international engagement across the areas of diplomacy, development and security. The 2011 Monitoring Report synthesises main find-ings and recommendations from across these 13 countries, providing evidence from the ground of what works and what doesn’t. The report is one of the key inputs for the Fourth High-Level Forum on Aid Effectiveness (busan) and its follow-up.
Financing and Aid Architecture
International Support to post-Conflict Transition: Rethinking policy, Changing practicehttp://dx.doi.org/10.1787/9789264168336-en
1.5 billion people live in countries affected by repeated cycles of violence and insecurity. These countries face tremendous challenges as they transition from conflict to peace. International support can play a crucial role in these contexts, but has so far struggled to deliver transformative results. This volume presents clear policy recommendations for better practice in order to improve the speed, flexibility, predictability and risk manage-ment of international support during post-conflict transition.
managing Risks in Fragile and Transitional Contexts: The price of success?http://dx.doi.org/10.1787/9789264092198-en
From the anarchy of Somalia to the relative stability of Nepal, fragile and transitional situations represent a broad spectrum of contexts. However, they share some common features: these are risky environments – for the people who live there, for their governments, for neighbouring countries, and for those who seek to provide assistance. International engagement in these situations presents significant risks for donors and implementing partners, but also holds the potential for substantial rewards. This publication provides the evidence to help donors understand how to balance risks and opportunities in order to protect the integrity of their institutions while delivering better results to those who need it most.
Peacebuilding, Statebuilding and Security
Supporting Statebuilding in Situations of Conflict and Fragility: policy guidancehttp://dx.doi.org/10.1787/9789264074989-en
This publication presents new thinking on statebuilding and clear recommendations for better practice. Draw-ing from best practices from the field, it offers guidance on how donors can better facilitate positive endog-enous statebuilding processes and strengthen the foundations upon which capable, accountable and respon-sive states are built.
Conflict and Fragility
International Engagement in Fragile StatesCan’t wE do bEttEr?
PrELIMInarY VErSIon
www.oecd.org/publishing
S
upporting Statebuilding in S
ituations of Confl ict and Fragility
DAC Guidelines and Reference Series
Supporting Statebuilding in Situations of Confl ict and FragilityPOLICY GUIDANCEFunctioning states are essential for reducing poverty, sustaining peace and achieving agreed development goals. Despite receiving growing international attention in recent years, fragile states are falling behind other low-income countries in human development. Fragility – and its negative consequences – can destabilise entire regions and have global repercussions. Tackling the challenges associated with fragility requires a concerted international effort to support sustainable statebuilding processes, based on robust state-society relations.
Supporting Statebuilding in Situations of Confl ict and Fragility: Policy Guidance presents new thinking on statebuilding and clear recommendations for better practice. It provides an internationally accepted conceptual framework for statebuilding, informed by today’s realities of confl ict-affected and fragile situations. Building on good practices already being successfully applied on the ground, this guidance lays out how developing and developed countries can better facilitate positive statebuilding processes and strengthen the foundations upon which capable and legitimate states are built. The recommendations in this guidance address critical areas for better international engagement from strategy development and programme design and delivery to day-to-day operations in the fi eld and at headquarters.
ISBN 978-92-64-07496-543 2011 03 1 P-:HSTCQE=U\Y^[Z:
DA
C G
uidelines and Reference S
eries
Please cite this publication as:
OECD (2011), Supporting Statebuilding in Situations of Confl ict and Fragility: Policy Guidance, DAC Guidelines and Reference Series, OECD Publishing.http://dx.doi.org/10.1787/9789264074989-en
This work is published on the OECD iLibrary, which gathers all OECD books, periodicals and statistical databases. Visit www.oecd-ilibrary.org, and do not hesitate to contact us for more information.
DAC Guidelines and Reference Series
Supporting Statebuilding in Situations of Conflict and FragilityPOLICY GUIDANCE
THE CONFLICT AND FRAGILITy SERIES
Additional titles available online at www.oecd.org/dac/incaf