effect of foreign portfolio flows on the growth of capital
TRANSCRIPT

EFFECT OF FOREIGN PORTFOLIO FLOWS ON THE GROWTH OF
CAPITAL MARKET IN KENYA
BY
JANET KIAMBA
D61/6747/2017
A3 RESEARCH3 PROJECT3 PRESENTED3 IN3 PARTIAL3 FULFILLMENT3
OF3 THE3 REQUIREMENTS3 FOR3 THE3 AWARD3 OF3 THE3 DEGREE3 OF3
MASTER3 OF3 BUSINESS3 ADMINISTRATION, 3 SCHOOL3 OF3 BUSINESS,
3 UNIVERSITY3 OF3 NAIROBI3
NOVEMBER 2019

ii
DECLARATION
I3 declare3 that3 this3 project3 is3 my3 original3 work3 and3 has3 never3 been3 submitted3
for3 a3 degree3 in3 any3 other3 university3 or3 college3 for3 examination/academic3
purposes. 3
Signature: 3……………………. Date………………………………….3
Janet Kiamba
D61/6747/2017
This3 research3 project3 has3 been3 submitted3 for3 examination3 with3 our3 approval3
as3 the3 University3 Supervisors.
Signature…………………………………….… Date………………………………….
Ronald Chogii
Lecturer, Department3 of Finance and3 Accounting
School3 of3 Business3
University3 of Nairobi.
Signature…………………………………….… Date………………………………….
James Karanja
Lecturer, Department3 of Finance and3 Accounting
School3 of3 Business3
University3 of Nairobi.

iii
DEDICATION
This research project is wholeheartedly dedicated1 to1 my1 beloved1 mother and father
who have been my source of inspiration and have given me strength.
I1 am1 and1 will1 forever1be1grateful1 for your endless love, support and encouragement.

iv
ACKNOWLEDGEMENT
My1 deepest1 gratitude1 goes1to1God1who1 has1 provided1 all1 that1 was1 needed1 to1
complete1 this1 project1 and1 the1 program1 for1 which1 it1 was1 undertaken1 for. 1 There1
was1never1lack1or1want. 1Throughout1 this1 entire1 study, 1He1 took1 care1 of1
everything1that1would1have1stopped1me1in1my1tracks1and1strengthened1 me1 through1
and through.
I would like to express my sincere gratitude to Mr. Ronald Chogii and Mr. James
Karanja for the selfless encouragement as I prepared this research project. Your
invaluable guidance, support and decisive input in all the stages of conceptualizing,
developing, improving and finalizing this research project enabled the successful
completion of this project.
I am extremely grateful to my parents and siblings who have walked with me
throughout this entire journey and for their tireless love, care and support.
I1 appreciate1 all1 my1 friends; 1 who1 one1 way1or1the1other1have1been1there1and1
have1continually1prayed1for1my1success. 1 God bless you.

v
TABLE OF CONTENTS
DECLARATION.......................................................................................................... ii
DEDICATION............................................................................................................. iii
ACKNOWLEDGEMENT .......................................................................................... iv
ABBREVIATIONS ................................................................................................... viii
LIST OF FIGURES .................................................................................................... ix
LIST OF TABLES ....................................................................................................... x
ABSTRACT ................................................................................................................. xi
CHAPTER ONE .......................................................................................................... 1
INTRODUCTION........................................................................................................ 1
1.1 Background to the Study ...................................................................................... 1
1.1.1 Foreign Portfolio Flows ................................................................................. 2
1.1.2 Growth of the Capital Market in Kenya ........................................................ 3
1.1.3 Foreign Portfolio Flows and Growth of the Capital Markets ........................ 3
1.1.4 Capital Market in Kenya ................................................................................ 4
1.2 Research Problem ................................................................................................. 4
1.3 Objectives of the Study ........................................................................................ 5
1.4 Value of the Study ................................................................................................ 5
CHAPTER TWO ......................................................................................................... 7
LITERATURE REVIEW ........................................................................................... 7
2.1 Introduction .......................................................................................................... 7
2.2 Theoretical Foundation ........................................................................................ 7
2.2.1 Purchasing Power Parity (PPP) ..................................................................... 7
2.2.2 Adam Smith’s Theory of Absolute Advantage ............................................. 8
2.2.3 The Comparative Advantage Theory ............................................................ 8
2.3 Determinants of Growth of Capital Market ......................................................... 9
2.3.1 Portfolio Debt (Bonds) Inflows ..................................................................... 9
2.3.2 Portfolio Equity Inflows .............................................................................. 10
2.3.3 Foreign Direct Investment ........................................................................... 10
2.3.4 Exchange Rates ............................................................................................ 11
vi
2.3.5 Inflation ....................................................................................................... 12
2.3.6 Gross Domestic Product Growth ................................................................. 12
2.4 Empirical Review ............................................................................................... 13
2.5 Summary of Empirical Literature and Research Gap ........................................ 15
2.6 Conceptual Framework ...................................................................................... 16
CHAPTER THREE ................................................................................................... 17
RESEARCH METHODOLOGY ............................................................................. 17
3.1 Introduction ........................................................................................................ 17
3.2 Research Design ................................................................................................. 17
3.3 Data Collection ................................................................................................... 17
3.4 Diagnostic tests .................................................................................................. 17
3.5 Data Analysis ..................................................................................................... 18
3.5.1 Analytical Model ......................................................................................... 18
3.5.2 Tests of significance .................................................................................... 19
CHAPTER FOUR ...................................................................................................... 20
DATA ANALYSIS, FINDINGS AND INTERPRETATION ................................ 20
4.1 Introduction ........................................................................................................ 20
4.2 Descriptive Statistics ........................................................................................ 20
4.3 Diagnostic Tests ................................................................................................ 22
4.3.1 Stationarity Test/ Unit Root Test ............................................................. 22
4.3.2 Autocorrelation .......................................................................................... 23
4.3.3 Cointegration Test ..................................................................................... 23
4.4 Pearson Correlation Analysis ............................................................................. 24
4.5 Regression Analysis ........................................................................................... 25
4.6 Interpretation of the Findings ......................................................................... 27
CHAPTER FIVE ....................................................................................................... 29
SUMMARY, CONCLUSION AND RECOMMENDATIONS ............................. 29
5.1 Introduction ...................................................................................................... 29
5.2 Summary ........................................................................................................... 29
5.3 Conclusion ......................................................................................................... 30
5.4 Limitations ........................................................................................................ 30
5.5 Recommendations .............................................................................................. 31

vii
REFERENCES ........................................................................................................... 33
APPENDICES ............................................................................................................ 38
Appendix I: Secondary Data Collection Sheet ......................................................... 38
Appendix II: Measurement of the Variables ............................................................ 39
Appendix III: Secondary Data.................................................................................. 40
viii
ABBREVIATIONS
AEs Advanced Economies
AFC: Asian Financial Crisis
AfDB African Development Bank
ANOVA Analysis1 Of1 Variance1
ATS: Automated1 Trading1 System1
CBK Central1 Bank1 of1 Kenya1
CMA: Capital Market Authority
EMs: Emerging Markets
ERER Equilibrium Real Exchange Rate
FDI: Foreign1 Domestic1 Investment1
GDP: Gross1 Domestic1 Product1
ICT Information1 and1 Communication1 Technology1
KIPPRA Kenya1 Institute1 for1 Public1 Policy1 Research1 and1 Analysis1
KNBS: Kenya1 National1 Bureau1 of1 Statistics1
OECD Organization for Economic1 Co-operation and Development
PPP Purchasing1 Power1 Parity1
SPSS Statistical1 Package1 for1 Social1 Sciences1
WITS World Integrated Trade Solution

ix
LIST OF FIGURES
Figure 1: Conceptual Framework ................................................................................ 16

x
LIST OF TABLES
Table 4. 1: Descriptive Statistics ................................................................................. 21
Table 4. 2: Stationarity Test/ Unit Root Test ............................................................... 22
Table 4. 3: Autocorrelation Results ............................................................................ 23
Table 4. 4: Cointegration Test Results ......................................................................... 23
Table 4. 5: Correlation Matrix ..................................................................................... 24
Table 4. 6: Model Summary ........................................................................................ 25
Table 4. 7: ANOVA Analysis ...................................................................................... 25
Table 4. 8: Coefficients ................................................................................................ 26

xi
ABSTRACT
The objective1 of1 the1 study1 was1to1 establish1the1effect1of1portfolio flows on the
growth of the capital market in1 Kenya. 1 The1 study1 used1 descriptive1 research1
design1 because it sought to establish how emerging market portfolio flows is related
with growth of the capital1markets1in1 Kenya. 1Data1from1CMA, CBK, KNBS,
KIPPRA, Ministry of Finance, public libraries, national budget and other government
records and World Integrated Trade Solution (WITS) was1 collected1 as1 the1 study’s1
secondary1 data. 1 The1 collected data was sorted in Ms Excel1 and1 the1 analysed1
using1 the1 Statistical1 Package1 for1 Social1 Sciences1 (SPSS version 25.0). 1 The study
used quantitative analysis through descriptive statistics such as central tendency
measures to generate relevant percentages, frequency counts, kurtosis and skewness
and mean and standard deviation. Inferential statistics was also adopted where the1
study1 conducted1 regression1 analysis1 to1 establish the association between portfolio
flows and growth of the capital market in Kenya. 1 The1 findings1 of1 the1 study1 were1
that1 foreign1 direct1 investment1 (FDI) 1 is positively and1 significantly1 related1 to
growth of the capital market in Kenya, that real exchange rate is1 positively1 and1
significantly1 related1 to1 growth1 of the capital market in Kenya and inflation1 rate1
and1 real1 GDP1 growth1 rate1 as1 control1 variables1 are1 significantly related to
growth1 of1 the1 capital1 market1 in1 Kenya. 1 The1 study concluded that Portfolio debt
(bonds) inflows is1 positively1 and1 significantly1 related1 to1 growth1 of the capital
market in Kenya, that portfolio equity inflows is positively1 and1 significantly1 related1
to1 growth1 of the capital market in Kenya, that foreign direct investment (FDI) is
positively and significantly1 related1 to1 growth1 of the capital market in Kenya and that
real exchange rate is positively and significantly related to1 growth1 of1 the1 capital1
market1 in1 Kenya. 1 The1 study1 recommends1 that1 measures1 should1 be1 put1 in1
place1 to1 ensure1 that1 inflows1 of1 short1 term1 capital1 are1 not1 disruptive1 as1 they1
lead1 to1 appreciation1 of1 the1 currency, 1 making1 the1 country1 uncompetitive1, and
increase in interest rates leading to high costs of credit and affects investment. The
study also recommends that foreign1 investors1 liquidate1 their1 positions1 due1 to1 so1
many1 factors1 including1 but1 not1 limited1 the1 expectations1 and1 sentiments1 of1
foreign1 investors, 1 terrorism, 1 political1 instability1 and1 sovereign1 risk. 1 The1 study1
recommends1 that1 the1 government1 should1 put1 in1 place1 measures1 that1 discourage1
foreign1 outflows. 1
1
CHAPTER ONE
INTRODUCTION
1.1 Background to the Study
The equity securities (shares) and debt securities (bonds) medium of buying and selling
so that long term financing can be raised is called capital market. The venues and stock
markets are used as tradeable assets that are involved in the broad spectrum of capital
market. Capital market which is a highly specialized and organized financial market
that represents the facilities and institutional arrangements for the sale and purchase of
medium- and long-term funds. The capital market comprises of a primary market and
a secondary market. The primary market deals with the issue of new securities. Issuers
exchange financial securities for long term funds (Omar, Abduh & Sukmana, 2013).
The primary market allows the formation of capital in the country and for accelerated
industrial and economic development. In this way newly issued financial assets are
bought and sold (Nassr & Wehinger, 2016). Securities are issued to members of the
general public and it is the most popular method of raising long-term funds; the rights
issue where instead of going public and calling the general public to buy its shares a
company issues a certain number of shares that are proposed to existing shareholders
as a pre-emptive right (Kaya, Schildbach & Hoffmann, 2015).
In the capital market, capital resources are raised using capital market instruments. The
most frequently used capital market instruments include preferential shares preferential
rights and equity shares (Valdez & Molyneux, 2015). Then there are also non-voting
equity shares which are shares that result in additional issuance of shares by a company
which is done without changing the interests of the existing shareholders; warrants
which are a financial instrument which provides buyers the right to buy shares in a
company at a given price during a certain fixed period; and debentures which are
documents that show that a company has borrowed a certain amount of money that will
be repaid following some agreed to terms and conditions (Mwijuka, 2016).
A country’s economic growth can be contributed by portfolio flows globally. Trade
flow and direct investments are facilitated by financial markets that are increasingly
effective, which also contribute to the high living standards that are present in the world.
2
On the other hand, the volatility of portfolio flows has disrupted financial markets and
economic activity. Therefore, identifying the drivers of portfolio flows into emerging
market economies could shed light on potential solutions to help emerging market
economies reach higher living standards, while pointing to the sources of volatility that
may be outside their control (Hwa, Raghavan & Huey, 2017).
The relationship between equity investment and total portfolio investment is significant
when compared to the debt investment equities and total portfolio flows which is weak.
South Africa’s inward investment increase substantially due to Exchange control
reform and global financial integration (Hassan, 2016). Demand for exports, imports
and domestic currency are determined by unanticipated currency fluctuations. Most of
the investments developing countries have are not well financed due to lack of national
savings which is a major problem. In the 1980s though the commercial bank lending
dried up which forced the developing countries to reform their investment policies so
that they could attract foreign capital stable reforms; FDI also became another easy way
where the countries could be given foreign capital without much risks in debts involved.
FDI is therefore the greatest alternative source for the capital inflows for bank loans
(Lawal, Kazi, Adeoti, Osuma, Akinmulegun & Ilo, 2017).
1.1.1 Foreign Portfolio Flows
A developed market is the country’s main feature of an emerging market, but this
market does not have all the standards meant for a developed market. Emerging markets
are being developed greatly from the frontier markets in Kenya, which have continued
to attract investment globally. Portfolio inflows can have two effects in emerging
markets; lowering the cost of capital for the economies and helping in financing their
growth (Hassan, 2016). According to Nyaga (2017), foreign portfolio investments have
benefits to the developing and emerging markets. Foreign direct investment net inflows
were high in 1970s supported by high economic growth and favourable market size,
but this declined in 1980s mainly due to uncertainty caused by policy reversals,
especially implementation of structural adjustment (Nyaga, 2017).
Portfolio flows are theoretical bundles there are also non-voting equity shares which
are shares that result in additional issuance of shares by a company which is done
without changing the interests of the existing shareholders; Capital flows are an

3
important feature in the analysis of the vulnerability of financial systems in emerging
market economies. Other portfolios in the market include Aggressive Portfolio, income
portfolio and speculative portfolio flows (Sakyi, Villaverde, & Maza, 2015).
1.1.2 Growth of the Capital Market in Kenya
The capital markets are regulated by the Capital Markets Authority (CMA); as defined
in the Capital Markets Act (Cap. 485) of the Kenyan laws (CMA, 2015). Markets in
Kenya have grown rapidly and have shown a great capital rise in capacity in the past
years. However, the capital markets in Kenya have faced a lot of challenges slowing its
growth (Daily nation, 13 June, 2018). The capital markets have also been having the
challenge of an illiquid corporate bond market.
When there is exchange, the hybrid bond market model helps in on and off trading
through the introduction and implementation of bonds after a consultancy is procured
by CMA. Local currency bonds are done by AfDB insurers as focused by CMA, as
markets are inspired by corporate companies that are large and with balance sheets
(Daily Nation, May 14, 2019).
1.1.3 Foreign Portfolio Flows and Growth of the Capital Markets
Portfolio flows have benefits to the development and growth of capital markets. The
reason given is that investors’ participation in the domestic market leads to a lower risk
premium of stocks. This induces local investors to offload their stocks as prices
increase. They thus proceed to acquire stocks of other companies trading at lower costs,
increasing the overall market portfolio equity inflows at the security exchange. As this
continues, there is growth of the capital market through resource mobilization and
confidence of investors to source for capital through the stock market. The sourcing
may be by initial public offers, private settlement or selling of debt securities such as
corporate bonds (Jassaud & Kang, 2015).
Portfolio1 flows1 to1 developing1 countries1 and1 capital market have been increasing
over time. The increase1 in1 foreign1 portfolio1 investments in the developing countries
is attributed to a1 number1 of1 factors. 1 These1 factors include1 the1 opening up of1 the1
capital markets in the early 1990s, which resulted to a shift in external financing from
4
long term bank loans and official development assistances to private capital inflows
(Kaya, Schildbach & Hoffmann, 2015).
1.1.4 Capital Market in Kenya
Capital mobilization has not been well determined by capital market in Kenya, though
economic growth can be increased through these funds if they are properly organised
(Nassr & Wehinger, 2016). Growth of GDP is maintained through urgent need to add
the supply of capital. Citizens can be transferred to the foreign corporations’ business
ownership through capital market as the medium in Kenya. The stock market is
developed through capital market functions which is very efficient. Appropriate
investments have been channelled and savings mobilized in the stock market in
Southeast Asia by the emerging capital markets (CMA Report, 2019). In Kenya, the
capital market has gone through several liberalization reforms from the mid-1990s. This
has led to opening up of the market to foreign investment (Nyaga, 2017). As a result,
there have been more foreign investors looking for high returns and diversification in
Kenya and who have invested through the Nairobi Securities Exchange (NSE) enabling
the country to enjoy the benefits associated with foreign portfolio investment. First,
with foreign portfolio inflows, the country has seen a decrease in the cost of capital.
Secondly, the decreasing costs of capital are enabling companies to finance their growth
by listing in Nairobi Securities Exchange.
1.2 Research Problem
Despite numerous efforts to stabilise and enable growth of the capital markets, most of
them have been small, underdeveloped and illiquid. Capital markets in developing
countries are in isolation, their volumes to trade are low, have low global competition,
their national regulations and their capital mobility leads to face barriers as their
infrastructure is under developed. The undue unpredictability of stock prices often
poses a challenge in the efficient performance of the financial markets and eventually
negatively affects the market, which is evident in past occurrences (Omoke, 2010).
As per to Rodrik (2014) in his research on effect of emerging market portfolio flows on
capital markets growth in UK found that emerging market portfolio flows have a
positive impact on growth of capital markets. On contrary, Bayrakdaroglu, Ege and
Yazici (2013) in their article on how emerging market portfolio flows plays a role in

5
growth of capital markets in Turkey established that emerging market portfolio flows
has a limited impact on growth of the Turkish capital markets. Moreover, Obamuyi
(2013) in his study in Nigeria on effect of emerging market portfolio flows on growth
of capital markets found that emerging market portfolio flows have no significant effect
on growth of capital market. Therefore, it is not clear whether emerging market
portfolio flows have or don’t have an effect on the growth of capital market.
Capital mobilization has not been well emphasized by capital markets in Kenya, thus
economic growth can result from capital being properly organized (Ali, 2014). The
growth of capital markets have been slowed by challenges they are facing in Kenya.
The international investors are being attracted to Kenya but corruption in the country is
the major cause of slow flow of foreign capital in the economy (CMA Report, 2019).
Recently the Capital Markets Authority (CMA) have focused on reduction of cheats at
the Nairobi Securities Exchange (NSE) which has been a threat to capital markets
growth to (CMA Report, 2019). The capital markets have also been having the
challenge of an illiquid corporate bond market (Daily Nation, 14 May, 2019). Various
studies have been conducted in relation to growth of the capital market in Kenya such
as Ozurumba (2012), Nyang’oro (2013), Nyaga (2017) and Gatuhi (2015).E. However,
none of the studies focused on impact1 of1 portfolio1 flows1 on1 the1growth of1 the1
capital1 market1 in1 Kenya, 1 a gap that this study sought to bridge.
1.3 Objectives of the Study
The1 objective1 of1 the1 study1 was1 to1 establish the effect of portfolio flows on the
growth of the capital market in Kenya.
1.4 Value of the Study
The1 study1 will1 be1 important1 to1 various1 stakeholders, 1 chief1 among1 them1 being:
1To contribute to the existing1 body1 of1 knowledge1 on1 the1 growth of the capital
market in Kenya. Investors will also be better placed to manage and further help
develop the economy.
The capital markets regulatory authorities will use the information to advise the
Government on policymaking and areas local market may be seeking Foreign Direct
Investments. Policies must encourage capital growth to attract investors. The

6
information will also help policymakers better manage the economy and be more
efficient in developing stock markets.
Moreover, the research will1 be1 of1 great1 value1 to1 researchers1 and1 academicians.
This1 study1 will1 contribute1 to1 the1 limited literature1 that exists in Kenya in regard
to the effect of portfolio1 flows1 on1 the1 growth of1 the1 capital market1 in1 Kenya1 and
thus, 1 serve1 as1 a1 source1 of1 reference1 for1 further1 research. 1 The1
recommendations1 for1 future1 research1 will1 also1 help1 researchers1 to1 carry1 out1
more1 studies1 to1 extend1 the1 understanding1 growth of the capital market in Kenya.

7
CHAPTER TWO
LITERATURE REVIEW
2.1 Introduction
This1 chapter1 reviews1 and analyses previous studies1 and1 other related1 literature. 1
It1 opens1 with1 an1 attempt1 to1 define1 some1 aspects of portfolio flows on1 the1
growth1 of1 the1 capital1 markets. 1The1 section in this chapter will be Theoretical
foundation, empirical1 studies, 1summary1 of1 the1 literature1 and1 research1 gap1 and1
conceptual1 framework. 1
2.2 Theoretical Foundation
This1section1 looks1 at1 the1 theoretical1 underpinning1 of1 the1 study1 by1 specifically1
reviewing1 the1 purchasing power parity, Adam1Smith’s1 theory1 of1absolute1
advantage1 and1 the1 comparative1 advantage1 theory. 1
2.2.1 Purchasing Power Parity (PPP)
The relative national price of a foreign country relative to the level or volatility and
exchange rate between a country’s relationships is involved in Purchasing power parity
(PPP). The domestic currency’s unit of purchasing power is the same in the other
economy when it is changed to the foreign currency in the absolute PPP exchange rate
as stated by PPP (Ahmad, Draz & Yang, 2015). The PPP indicated that the two
currencies nominal exchange rate should have an equal ratio (Vives, 2017).
The PPP theory1 indicates1 that1 when1 a currency of one country buys a basket of
goods, the same basket of goods should also cost the same in the foreign country and
that exchange rates should be equal in the two countries between buying and selling so
that parity can be seen in the two country’s currency (Jolliffe & Prydz, 2015). Two
currencies exchange rates and their level of difference is determined by their nominal
exchange rates which leads to changes in the national price as relative to PPP. The
factors include; low power, breaking of structures, error terms which are either
stationary or non-stationary and cross sectional dependence that is neglected when
usage of exchange rate panel is applied (Jolliffe & Prydz, 2015).
8
2.2.2 Adam Smith’s Theory of Absolute Advantage
Modern economics was founded by Smith (1776) among others and he was among the
famous1 thinkers1 who1 were in1 favour1 of1 the establishment of free1 international1
trade. 1 Smith1 (1776) 1 argued that for successful trading to take place between two
countries, the two countries must gain from each other and from the process. When
one1 country1 has1 an1 absolute1 advantage1 in1 production1 of certain goods, the other
county advantages from importing of the goods and in return they export the goods that
they are absolute good at therefore both economies advantage from each other through
the exchange of outputs with each gaining absolute disadvantage.
There will be rise in output of commodities when the resources available are well
utilized in free trade. The laissez-faire policy was advocated for by Smith as he believed
that all countries would advantage from free trade. There would be maximum welfare
and resources would be well utilized under free trade. Most of the investments
developing countries have are not well financed due to lack of national savings which
is a major problem (Dunkley, 2016).
2.2.3 The Comparative Advantage Theory
The1 absolute advantage1 theory1 based1 the1 idea1 of how to divide labour which then
indicated that specialization in production was important in the trade theory. Smith
(1776) wrote1 a1 book1 called1 “The1 Wealth1 of1 Nations’1 where1 he1 explained1 the
advantages that would lead to international trade between all countries and the
development that would result from free trade. The international trade’s classical
theory was created by David Ricardo as generally agreed, despite the fact that there
were many ideas on trading before he created the theory.
The theory indicates that international1 trade1 is determined by1 the1 difference1 in1
comparative costs of1 production1 in goods. The production techniques are reflected in
this difference (Feenstra, 2015). The theory concludes that whatever one country
produces is used by the other country while it also provides to the country whatever
they produce which bolsters the goals of both nations and thus growth in trade. David
Ricardo theory indicates that countries advantage from one another from the goods that
they produce then trade with each other despite one not being very productive.

9
2.3 Determinants of Growth of Capital Market
The public foreign exchange reserves are the major foreign assets that are the structural
net private debtors of portfolio flows. The EM domestic assets remain held by foreign
investors while their key financial centres are concentrated in the AEs. International
trade has been assessed through facilitation of the foreign portfolio investment to
promote innovate ways by some governments. Capital markets are growing drastically
due to the changes in the environment in trading due to various such as technology, for
example in Mexico where the international markets were involved in issuing of bonds.
2.3.1 Portfolio Debt (Bonds) Inflows
The debt crisis was the starting point of the government finding ways to repay foreign
loans that had been imposed previously to find a permanent resolution. In 1994, the
establishment of the latter of the sovereign credit ratings took place, which led South
Africa into re-entering into the international bond markets. Access to International
borrowing has provided to the government so that even other borrowers can be able to
access the international capital. This step is crucial as most of the borrowers are able to
access funds which is key in public sector financing for most of the countries (Bakari,
2017).
Volatility has been experienced less in equity investment than in the South African
Foreign portfolio investments. The domestic bond market net transactions and gross
volume have a great disparity between monthly flows and the net annual volatility.
Since 1997, there has been per quarter basis that are negative in the debt securities of
the Net portfolio investment, the South African alternative assets proceeds on
investment were chosen for the South African capital outflows as translated by (Najeeb,
Bacha & Masih, 2015).
Domestic bonds sales are purchased by non-residents due to repayment of international
bonds associated with portfolio debt investment flows. The local debt securities non-
resident investment are accounted for by the portfolio debt investment’s volatile
pattern. There is high liquidity in the domestic bond, where international investors’
positions are turned over by interest rates provided by scope (Berensmann, Dafe &
Volz, 2015).
10
2.3.2 Portfolio Equity Inflows
In the past years, the equity inflows volume has varied, where the non-resident’s
portfolio equity investment has accumulated as a long term and substantial outcome.
There was a 37% increase from 7% in GDP in 1994 and 2017 to a drop of 26% in 2008
after the global crisis. The South African equities are held for a long time by investors
as it appeared in the reports (López, et al., 2018).
Volatile capital flows and frequent international crises are a result of small emerging
economies managed by macroeconomic risks and other regulation forms recognized by
the approach. Costly policy reversals have continued to be avoided by the sequenced
approach, especially when there are periodic domestic currency crises. The 2008 to
2009 global crisis that took place in South Africa was moderately impacted by
prudential regulation of foreign exposure as indicated by the government (López, et al.,
2018).
All other financial markets are covered and organized in the Portfolio investment
covers. The financial infrastructure, frameworks for regulations, market-making
dealers and a sufficient volume of buyers and sellers are all involved in Portfolio
investment. Regulated markets and less public activities are involved in portfolio
investment to ensure that shares in hedge funds acquisition is done, private equity funds
and venturing of capital (Lin, Kim & Lee, 2015).
2.3.3 Foreign Direct Investment
The countries with very high income close their technology gap through sources1 of1
finance1 such1 as1 foreign1 direct1 investment, 1 upgrading of managerial skills, and
development of export materials and improvement of the efficiency of the economy.
Trade has grown rapidly the same as FDI in the past decade for the same reasons (Vives,
2017). FDI which is one of the major effects of large capita is1 one1 of1 the1 less1
desirable1 macroeconomic1 effects1 that widens current account deficits. Most of the
developing countries are dealing with issues on deficit problems on their current
accounts that have led to international capital flows surge in most of the countries.
11
Portfolio flows have benefits to the development and growth of capital markets. The
reason given is that investors’ participation in the domestic market leads to a lower risk
premium of stocks. This induces local investors to offload their stocks as prices increase
(Sunde, 2017). They thus proceed to acquire stocks of other companies trading at lower
costs, increasing the overall market portfolio equity inflows at the security exchange.
As this continues, there is growth of the capital market through resource mobilization
and confidence of investors to source for capital through the stock market. The sourcing
may be by initial public offers, private settlement or selling of debt securities such as
corporate bonds (Adams, Klobodu & Lamptey, 2017).
2.3.4 Exchange Rates
The currency value is an important factor1 influencing1 equity1 prices1 and1 business
profitability. 1 The importance of the currency value has been due to the high rise in
capital movements and world trade (Akong’a, 2014). Exchange rate changes influence
the competitiveness of international companies as it affects the prices of exports and
imports. For this reason, the value of a currency affects the overall performance of a
company as its affects the flow of cash in the future. For economic theory, variations in
investment of a company and its impact is seen in the financial performance of that
particular company. Consequently, movements in a firm’s operations influence stock
returns. Given the long-term view of an investor the share returns will be affected due
to the fluctuations of the exchange rate. Exchange rate fluctuations affects translation,
transaction and economic exchange risk exposure leading to operating cash flows and
firm value changes (Akong’a, 2014).. The stock market is very volatile and what
happens in the macro-economic environment is evidently experienced in the share
movements. A weak currency can make investor incur huge losses after the translation
to the desired currency. A depreciation in the currency leads to a depressed security
market (Jamil & Ullah, 2013).
Exchange rate risk occurs as a result of investing in foreign stock markets. Higher
exchange rate uncertainty leads to a high-risk premium. With the drastic exchange rate
changes, higher investment returns are demanded because of the high expected risk.
This leads to a decline in the stock market performance due to lowered discounted value
of expected future cash flow (Rabai & Khakan, 2016). This exchange1 rate1 risk
12
exposure1 is1 as a result of investing in foreign stock markets. In such a case, higher
exchange rate will tend to highly result to the local stock market volatility thus highly
affecting the local stock market performance. The inverse is experienced in the foreign
stock market performance. This comes as1 a1 result1 of1 the1 exchange1 rate1 being more
correlated with the performance of the local stock market than the foreign market
performance (Nyongesa & Muchoki, 2016).
2.3.5 Inflation
Inflation is a macro-economic factor that a number of scholars have identified to
influence the business environment (Kimani & Mutuku, 2013). Inflation is the sudden
increase in the prices of products both goods and services in an economy which leads
to fall in purchasing power or value of money (Ahmad & Naseem, 2011). The effect of
inflation was realized if the inflation was anticipated. This is because the markets have
sufficient time to adjust their interest rates accordingly. High rates of inflation can have
very adverse effects to the securities market. Many market participants will lack the
purchasing power to invest in the securities market leading to low market portfolio
equity inflows. The lower the number of investors in the stock markets the lower the
demand of the shares leading to low prices. The low prices discourage the shareholder
from participated due to fear to incur losses (Ariss, 2014).
High inflation rates can also affect the1 purchasing1 power1 of1 consumers1 in1 the1
economy. 1 Therefore they may use most of, if not entirely, their income in consumption
and thus may not have money left for savings to be deposited in banks which in turn
reduces the cash reserves and limits the ability to issue loans (Ahmad & Naseem, 2011).
This leads to reduced profitability.
2.3.6 Gross Domestic Product Growth
The annual financial value calculated from the final goods and services is called Gross1
domestic1 product1 (GDP). 1 The1 amount1 of1 goods1 and1 services’1 total output of the
economic1 growth1 is1 GDP. 1 The1 production1 of1 goods1 and1 services1 by an
economy and the value created for a period of time is also termed as GDP. More
valuable ways that resources are rearranged leads to economic growth. Nominal terms
are used in measuring of economic1 growth1 for1 example1 by1 use1 of1 inflation which
leads to increase1 in GDP (Byrne & Fiess, 2016).

13
Development aspects are measured through monetary terms which result to economic
growth. Here is both negativity and positivity in economic growth. When there is
shrinking in economic growth, then it is said to be negative. Recession and depression
in the economy is also termed as negative growth. Gross domestic product is also used
in measuring of Gross national product (GNP) as an alternative. Economic growth
results from institutions and markets that function well, augment technological
innovation and capital accumulation. Thus GDP growth rates are enhanced by higher
returns from projects and allocation of capital (Laichena & Obwogi, 2015).
2.4 Empirical Review
Previuosly studies has been done on growth of the capital markets such as Ozurumba
(2012) studied the effects foreign portfolio flows have on stock returns in Nigeria. He
used linear regression analysis to capture the effects of foreign portfolio flows as well
as inflation on the returns in the securities exchange and Granger causality to analysis
the direction of causality between the variables.
Chepkoiwo (2011) did a study on factors affecting the development of emerging capital
markets based on the case of Nairobi Stock Exchange. The study establishes both the
external (macro-economic and social cultural factors) and market (legal, regulatory and
Institutional) factors which have constrained the development of the Stock Market.
However, there are some variables which didn’t clearly show the above relationship,
namely macroeconomic stability-inflation and private capital inflows. Using the
regression analysis, the study established that liquidity of the stock market, quality of
the institution, capital’s income, inflation stability, domestic savings, capital flows and
development of the bank are the determinants of stock market development.
Nyang’oro (2013), study on the effects of portfolio flows on stock market performance
shows that the returns at Nairobi Securities Exchange are affected by portfolio flows.
Using arbitrage pricing theory(APT) in the study, Nyang’oro found that foreign
portfolio flows push stock prices up when they come in, which may be due to rising
demand. The paper also found that exchange and interest rates are significant in
determining stock market performance, which he linked to market portfolio equity
inflows. With higher prices and stability of interest rates, there are more inflows of
foreign investors in the country.

14
Further, Nyaga (2017) did a study on Effects of Foreign Portfolio Flows on the Capital
Market in Kenya. This research paper aims at studying the foreign portfolio investment
and how they related to market portfolio equity inflows in Kenya. The paper uses the
neoclassical theories of capital flows in developing the analysis. The study uses
secondary data in carrying out the analysis. For this purpose, times series monthly data
from 2007 to 2015 is used. On the basis of stationary ordinary least square model is
used to examine how foreign portfolio investment, interest rates, exchange rate, and
returns in foreign and domestic markets influence and affect market portfolio equity
inflows in Kenya. The study shows that there is a significant positive impact of foreign
portfolio investment on market portfolio equity inflows in the Kenyan capital market.
In addition, Omoke (2010) did a study on the relationship between capital market
development and economic growth in Kenya. Causal research design was used for this
study. The population of the study was all the listed firms at the Nairobi Stock Exchange
for the period 2004-2009. The Central bank of Kenya provided economic growth
figures for the same period. There are 47 listed firms at the Nairobi stock exchange.
The sampling procedure for this study was simple random sampling. The researcher
used financial institutions that had been listed in the NSE in the years between 2004
and 2009 to come up with the sample size. The sample size for this study was therefore
8 financial institutions and the sample period was 2004-2009. Secondary data was used
for this study. The data collected for the study was analyzed using a multivariate
regression model. Statistical package for social sciences (SPSS) version 17 was used to
aid in analysis of the data. The independent variables of this study are market portfolio
equity inflows, trading volume, and change in stock market prices. Where Y was
economic growth indicated by GDP per capita growth and GDP growth rate, X1 was
market portfolio equity inflows, X2 was trading volume, and X3 was change in stock
market prices. This study concludes that capital market development affects the growth
of the financial sector. This study also revealed that market portfolio equity inflows,
change in stock market price and trading volume affect economic growth
NSE was investigated by Gatuhi (2015) on how its stock market Performance was
influenced by macroeconomic environment. How stock market performance was
influenced by exchange rate, Interest rates, inflation and Money supply was established
as the study objectives in Kenya. The study used the companies that were active in NSE

15
between January 2004 to November 2014 and a causal research design was also
adopted. The study also made use of Time Series Regression model to examine how
the variables related. Stock market performance was positively influenced by inflation
while all other sectors were influenced negatively. The Automobile sectors’ stock
market Performance was negatively influenced by money supply and all other sectors
were positively influenced as the study concluded.
2.5 Summary of Empirical Literature and Research Gap
Various studies have been conducted in relation to growth of the capital market in
Kenya. For instance, Ozurumba (2012) studied the effects foreign portfolio flows have
on stock returns in Nigeria, Chepkoiwo (2011) did a study on factors affecting the
development of emerging capital markets based on the case of Nairobi Stock Exchange,
Nyang’oro (2013), the effects of portfolio flows on stock market performance show
that the returns at Nairobi Securities Exchange are affected by portfolio flows and
Nyaga (2017) did a study on Effects of Foreign Portfolio Flows on the Capital Market
in Kenya. In addition, Gatuhi (2015) did a study on influence of macroeconomic
environment on the stock market Performance at the NSE. However none of the studies
focused on impact of portfolio flows on the growth of the capital market in Kenya, a
gap that this study seeks to bridge.

16
2.6 Conceptual Framework
Figure 1: Conceptual Framework
Portfolio debt (bonds) inflows
Portfolio equity inflows
Foreign direct investment (FDI)
Growth of Capital markets in
Kenya
Market Capitalization
Independent Variables Dependent Variables
Exchange rates
Inflation
GDP growth
Control Variables

17
CHAPTER THREE
RESEARCH METHODOLOGY
3.1 Introduction
This1 chapter1 includes1 the1 various1 stages1 that1 was1 followed1 to1 complete1 the1
study. 1 Therefore, 1 the1 chapter1 comprise1 of1 the1 following1 subsections: 1 research1
design, 1target1population, 1sample1 population, 1data1collection1and1analysis1
techniques. 1
3.2 Research Design
The research problems answers are generated through an outlined plan or scheme
known as a research design according to Lewis (2015). The investigation’s structure
and plan is the research design. A quantitative comparative design was adopted by the
study to quantify the variables’ relationship. In particular, the study used descriptive
research design because it seeks to establish how emerging market portfolio flows is
related with growth of the capital markets in Kenya.
3.3 Data Collection
Data from CMA, 1 CBK, 1 KNBS, 1 KIPPRA, 1 and1 Ministry1 of1 Finance, 1 public1
libraries, 1 national1 budget1 and1 other1 government1 records1 and1 World1 Integrated1
Trade1 Solution1 (WITS) was collected as the study’s secondary1 data. 1 The1 researcher
collected secondary data form all the reviewed variables under study. The secondary
data was from 2009 to 2018 a period of 10 years. The monthly data collected included
Growth of the capital market, Portfolio debt (bonds) inflows, Portfolio equity inflows
and foreign direct investment (FDI).
3.4 Diagnostic tests
The Augmented Dickey-Fuller (ADF) tests were used to establish the presence of a unit
root through the stationarity test that was conducted. Presence of a unit root was
determined when a null hypothesis of less that 5% p-value was implied. The tabulated
critical value helped compare the DFT statistic calculated. There was rejection of the
unit root null hypothesis if the table value was negative of DFT statistic. The unit root
18
of null hypothesis were more rejected when there is stronger evidence of a DF test
statistic that is more negative.
To find out whether the variables had a long term or short term relationship was
conducted through the VAR analysis before Cointegration prior. The presence of
cointegration was detected using the Johansen test. The data was concluded not to be
normally distributed f the there is a less than 0.05 p-value obtained. Mulicolinearlity
was tested using all the variable’s VIF values. Multicollinearity symptoms were found
when the variable was found to have a less than 10 VIF value.
3.5 Data Analysis
The1 collected1 data1 was1 sorted1 in1 Ms1 Excel1 and1 the1 analysed1 using1 the1
Statistical1Package1for1Social1Sciences1 (SPSS1version125.0). The study used
quantitative analysis through descriptive statistics such as central tendency measures to
generate relevant percentages, frequency counts, kurtosis and skewness and mean and
standard deviation. Inferential statistics was also adopted where the study conducted
regression analysis to1 establish1 the1 association1 between1 portfolio1 flows1 and1
growth1 of1 the1 capital1 market1 in1 Kenya. 1
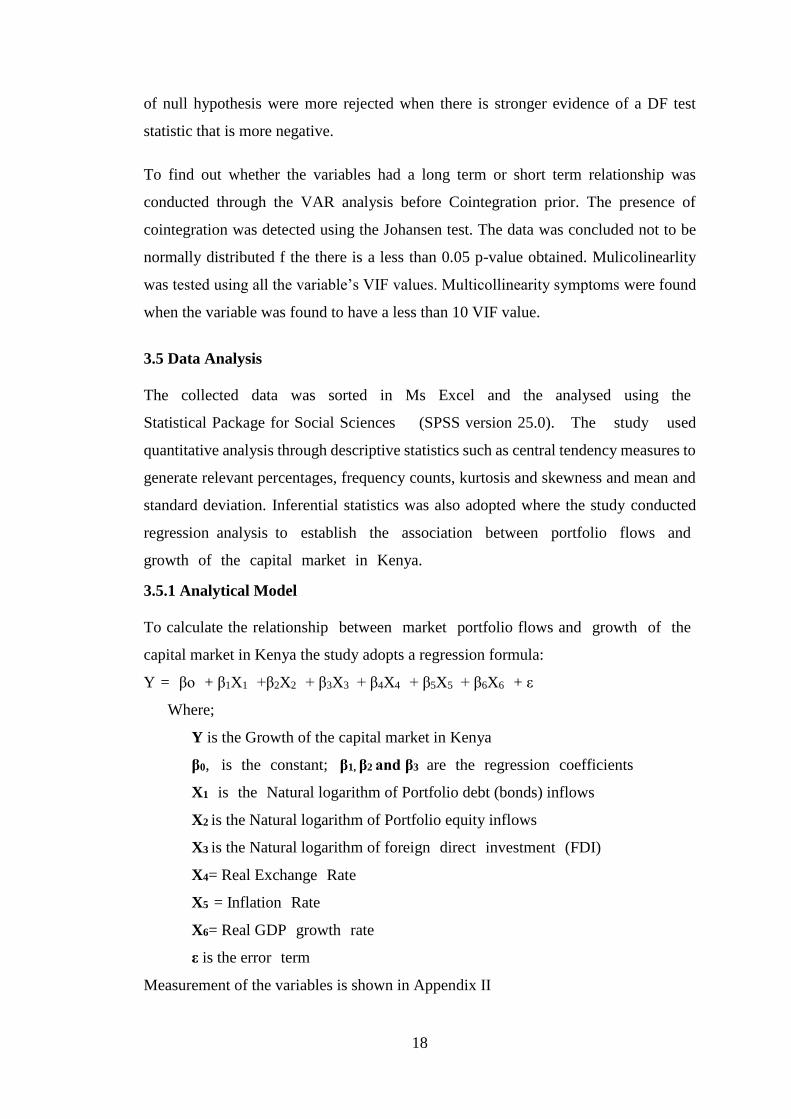
3.5.1 Analytical Model
To calculate the relationship1 between1 market1 portfolio flows and1 growth1 of1 the1
capital market in Kenya the study adopts a regression formula:
Y1=1 βо1 + β1X11 +β2X2
1 + β3X31 + β4X4
1 + β5X51
+ β6X61 + ε1
Where;
Y is the Growth of the capital market in Kenya
β0, 1 is1 the1 constant; 1 β1, β2 and β31 are1 the1 regression1 coefficients
X11 is1 the1 Natural logarithm of Portfolio debt (bonds) inflows
X2 is the Natural logarithm of Portfolio equity inflows
X3 is the Natural logarithm of foreign1 direct1 investment1 (FDI) 1
X4= Real Exchange1 Rate1
X51= Inflation1 Rate1
X6= Real GDP1 growth1 rate1
ε is the error1 term1
Measurement of the variables is shown in Appendix II

19
3.5.2 Tests of significance
To measure the extent to which the variations in Growth1 of1 the1 capital1 market1 in1
Kenya1 are explained by portfolio flows, the1study1used1the1coefficient1of1
determination1 (R2). 1 The study was also computed F-statistic1 and1 t-statistics1 at1
95%1 confidence1 level1 to1 test1 whether1 there1 is1any1 significant1 relationship1
between1 portfolio flows and growth of the capital market in Kenya.
20
CHAPTER FOUR
DATA ANALYSIS, FINDINGS AND INTERPRETATION
4.1 Introduction
This1 chapter1 illustrates sections that give the1 analysis1 of1 the1 data1 collected1
concerning1 the1 relationship1 between1 foreign1 portfolio1 flows1 and1 growth of
capital market1 in1 Kenya, 1 its presentation (in tables) and the subsequent interpretation
of the findings that were drawn.
4.2 Descriptive Statistics
This1 presents1 the1 general1 description1 of1 the1 study1 variables1 characteristics1
including1 the1 Mean, 1 standard1 deviation1 (Std. Dev), 1 Skewness and Kurtosis.
21
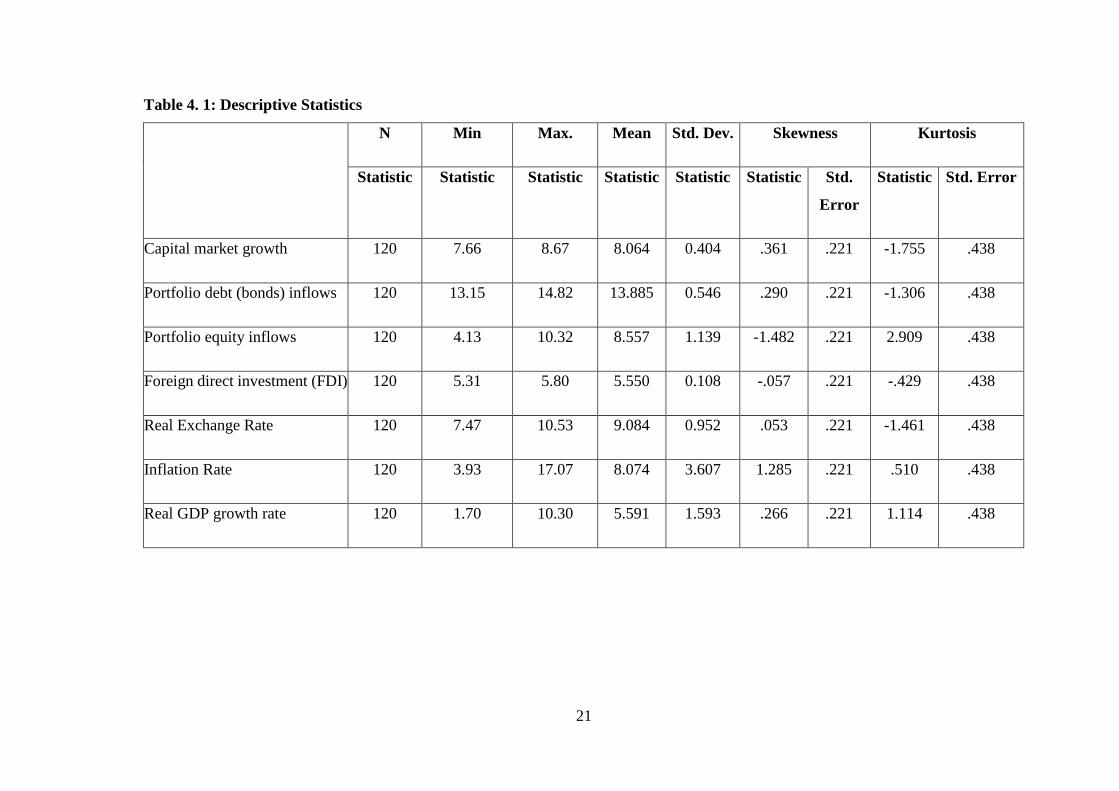
Table 4. 1: Descriptive Statistics
N Min Max. Mean Std. Dev. Skewness Kurtosis
Statistic Statistic Statistic Statistic Statistic Statistic Std.
Error
Statistic Std. Error
Capital market growth 120 7.66 8.67 8.064 0.404 .361 .221 -1.755 .438
Portfolio debt (bonds) inflows 120 13.15 14.82 13.885 0.546 .290 .221 -1.306 .438
Portfolio equity inflows 120 4.13 10.32 8.557 1.139 -1.482 .221 2.909 .438
Foreign direct investment (FDI) 120 5.31 5.80 5.550 0.108 -.057 .221 -.429 .438
Real Exchange Rate 120 7.47 10.53 9.084 0.952 .053 .221 -1.461 .438
Inflation Rate 120 3.93 17.07 8.074 3.607 1.285 .221 .510 .438
Real GDP growth rate 120 1.70 10.30 5.591 1.593 .266 .221 1.114 .438

22
From1 the1 findings, 1 the1 study1 revealed1 that1 capital1 market1 growth had a mean of
8.064, portfolio debt (bonds) inflows had a mean of 13.885, portfolio equity inflows
had a mean of 8.557, foreign direct investment (FDI) had a mean of 5.550, real
exchange1 rate1 had1 a1 mean1 of 9.084, inflation rate had a mean of 8.074 and real1
GDP1 growth1 rate1 had1 a1 mean1 of1 5.591. On skewness the results showed that
capital market growth, Portfolio debt (bonds) inflows, real exchange rate, inflation rate1
and1 real1 GDP1 growth1 rate1 are1 asymmetrical1 to1 the1 right1 around1 their1 mean. 1
On1 the1 kurtosis, 1 all the variables exhibited negative kurtosis except portfolio equity
inflows, inflation rate and real GDP1 growth1 rate. 1
4.3 Diagnostic Tests
The conducted diaagnostic tests1 were1 to1 evaluate1 the1 model1 assumptions1 and1
investigate1 whether1 or1 not1 there1 are1 observations1 with1 a1 large, 1 undue1
influence1 on1 the1 analysis. 1The1 study1 conducted1 stationarity1 test/ unit1 root1 test, 1
cointegration1 test, 1 normality1 test, 1 multicollinearity1 and1 autocorrelation. 1
4.3.1 Stationarity Test/ Unit Root Test
The1 study1 conducted1 a1 stationarity1 test1 to1 establish1 the1 presence1 of1 a1 unit1
root1 using1 Augmented1 Dickey-Fuller1 (ADF) 1 tests. 1 The1 findings1 are1 as1 shown1
in1 Table1 4.2. 1
Table 4. 2: Stationarity Test/ Unit Root Test
Critical value at 95% DFT statistic P-value
Growth of the capital
market in Kenya
-2.661 -3.170 0.001
Natural logarithm of
Portfolio debt (bonds)
inflows
-2.661 -3.236 0.043
Natural logarithm of
Portfolio equity
inflows
-2.661 -4.647 0.000
Natural logarithm of
foreign direct
investment (FDI)
-2.661 -3.654 0.006
Real Exchange Rate -2.661 -3.095 0.002
Inflation Rate -2.661 -4.725 0.000
From1 the1 findings, 1 the1 p-values1 for1 all1 the1 variables1 were less than 0.05 and the
DFT statistic were more negative than their corresponding critical values. This is an

23
indication that null1 hypothesis1 that1 there1 is1 a1 unit1 root1 was1 rejected1 and1 study
concluded that the variables did not have unit roots.
4.3.2 Autocorrelation
The1 study1 conducted1 Breusch1 Godfrey1 LM1 test1 to1 confirm1 if1 there1 is1
autocorrelation. 1 The1 findings1 are1 shown1 in1 Table1 4.3. 1
Table 4. 3: Autocorrelation Results
F-Statistic 18.308 Prob. (6,113) .000
Obs*R-square 40.936 Prob. Chi-Square (2) .001
From the findings, it’s clear that p-values for the Chi-square statistic is less 0.05 and
hence the residuals1 of1 the1 empirical1 model1 are1 not1 auto1 correlated. 1
4.3.3 Cointegration Test
The study1 used1 Johansen1 test1 to1 detect1 presence1 of1 cointegration. 1 The1 findings1
are1 as1 shown1 in1 Table1 4.3. 1
Table 4. 4: Cointegration Test Results
Eigen Value Trace
Statistic
Critical
value at
95%
P-value
Natural logarithm of
Portfolio debt (bonds)
inflows
0.134 23.45 26.09 0.000
Natural logarithm of
Portfolio equity inflows
0.094 61.23 62.12 0.001
Natural logarithm of
foreign direct investment
(FDI)
0.307 21.09 26.90 0.009
Real Exchange Rate 0.068 18.78 19.11 0.011
Natural logarithm of
Portfolio debt (bonds)
inflows
0.193 27.32 28.92 0.010
From1 the1 findings, 1 the1 study1 shows1 that1 all1 the1 variables had their p values less
than 0.05 and hence the study concluded that variables exhibit long-run or short run
relationship.

24
4.4 Pearson Correlation Analysis
According1 to1 Ward1 (2013), 1 correlation1 technique1 was1 used1 to1 analyze1 the1
degree1 of1 association1 between1 two1 variables. 1 Pearson1 correlation1 coefficient1
was1 used1 to1 determine1 the1 strength1 and1 the1 direction1 of1 the1 relationship1
between1 the1 dependent1 variable1 and1 the1 independent1 variable. 1 The1 analysis1
using1 Pearson’s1 product1 moment1 correlation1 was1 based1 on1 the1 assumption1 that1
the1 data1 is1 normally1 distributed1 and1 also1 because1 the1 variables1 are1 continuous.
1
Table 4. 5: Correlation Matrix
Gro
wth
of
the
capit
al m
arket
Port
foli
o
deb
t (b
on
ds)
infl
ow
s
Port
foli
o e
quit
y i
nfl
ow
s
Fore
ign
dir
ect
inves
tmen
t
(FD
I)
Rea
l ex
chan
ge
rate
Infl
atio
n r
ate
Rea
l G
DP
Gro
wth
Rat
e
Growth of the
capital market
Pearson Correlation 1
Sig. (2-tailed) .
Portfolio debt
(bonds)
inflows
Pearson Correlation . 724 1
Sig. (2-tailed) .023 .
Portfolio
equity inflows
Pearson Correlation .711 .513 1
Sig. (2-tailed) .027 .026 .
Foreign direct
investment
(FDI)
Pearson Correlation .822 .423 .327 1
Sig. (2-tailed) .028 .012 .018 .
Real exchange
rate
Pearson Correlation .672 .533 .520 .431 1
Sig. (2-tailed) .001 .009 .002 .014 .
Inflation rate Pearson Correlation .616 .501 .412 .418 .312 1
Sig. (2-tailed) .006 .000 .002 .014 .003 .
Real GDP
Growth Rate
Pearson Correlation .706 .478 .512 .339 .417 .278 1
Sig. (2-tailed) .042 .009 .002 .014 .001 .000 .
As per findings in Table 4.5, 1 there1 is1 a1 positive1 relationship1 between1 growth1 of
the capital market and portfolio debt (bonds) inflows as1 shown1 by1 coefficient1 of1
0.724, a positive1 relationship1 between1 growth of the capital market and portfolio
equity inflows as1 shown1 by1 coefficient1 of 0.711, a1 positive1 relationship1 between1
25
growth of the capital market and foreign direct investment (FDI) as1 expressed1 by1
coefficient1 of1 0.822, a positive1 relationship1 between1 growth of the capital market
and real foreign exchange as expressed1 by1 coefficient1 of1 0.672, a positive1
relationship1 between1 growth of the capital market and inflation rate as1 illustrated1
by1 a1 coefficient1 of1 0.616 and1 a positive1 relationship1 between1 growth of the capital
market and real GDP growth rate as expressed by coefficient of 0.706. This1 shows1
all1 variable1 were1 significant1 in1 determining1 the1 growth of the capital market in
Kenya.
4.5 Regression Analysis
Inferential statistics was also adopted where the study1 conducted1 regression1 analysis1
to1 establish the association between1 portfolio flows and growth of the capital market1
in1 Kenya. 1 To1 calculate the1 relationship1 between1 market portfolio flows and growth
of1 the1 capital market1 in1 Kenya1 the1 study adopts a regression formula:
Y= βо + β1X1 +β2X2 + β3X3 + β4X4 + β5X5 + β6X6 + ε.
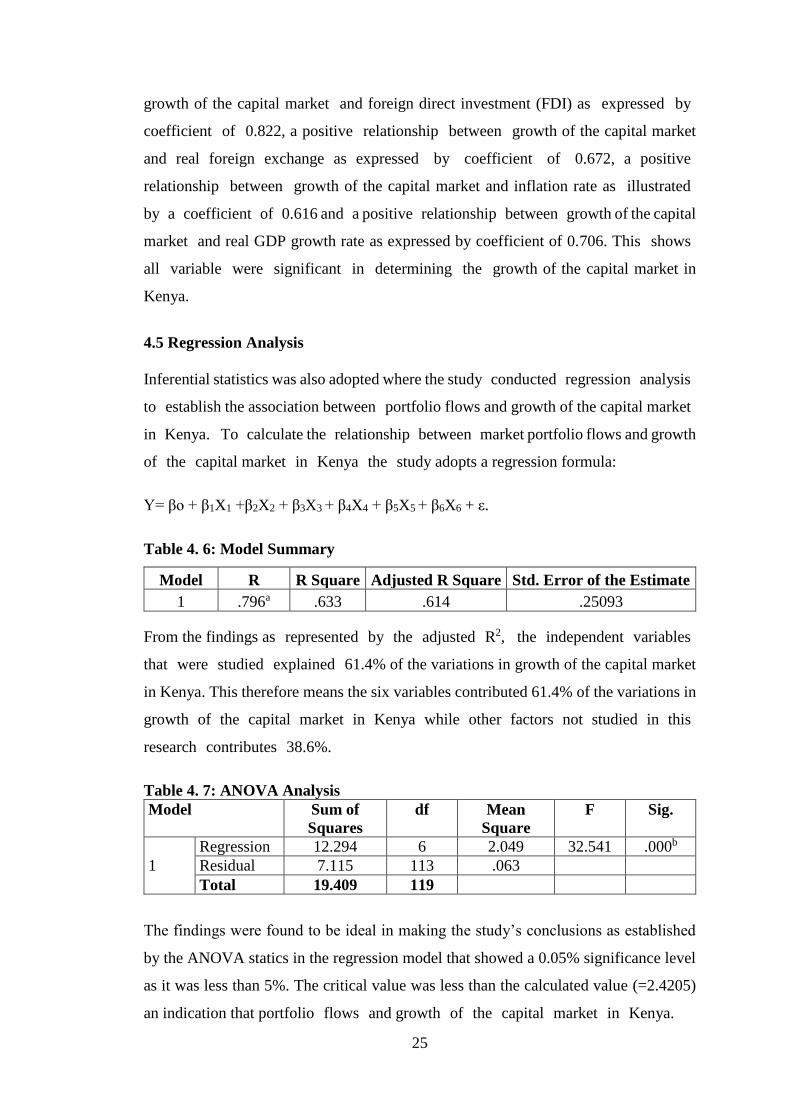
Table 4. 6: Model Summary
Model R R Square Adjusted R Square Std. Error of the Estimate
1 .796a .633 .614 .25093
From the findings as1 represented1 by1 the1 adjusted1 R2, 1 the1 independent1 variables1
that1 were1 studied1 explained1 61.4% of the variations in growth of the capital market
in Kenya. This therefore means the six variables contributed 61.4% of the variations in
growth1 of1 the1 capital1 market1 in1 Kenya1 while1 other1 factors1 not1 studied1 in1 this1
research1 contributes1 38.6%.
Table 4. 7: ANOVA Analysis
Model Sum of
Squares
df Mean
Square
F Sig.
1
Regression 12.294 6 2.049 32.541 .000b
Residual 7.115 113 .063
Total 19.409 119
The findings were found to be ideal in making the study’s conclusions as established
by the ANOVA statics in the regression model that showed a 0.05% significance level
as it was less than 5%. The critical value was less than the calculated value (=2.4205)
an indication that portfolio1 flows1 and growth1 of1 the1 capital1 market1 in1 Kenya. 1

26
Table 4. 8: Coefficients
Model Unstandardize
d Coefficients
Standardized
Coefficients
t Sig.
B Std.
Error
Beta
1
(Constant) 2.564 0.855 2.999 .004
Portfolio debt (bonds)
inflows
0.767 0.293 0.618 2.618 .012
Portfolio equity inflows 0.736 0.214 0.598 3.439 .000
Foreign direct investment
(FDI)
0.825 0.239 0.713 3.452 .001
Real exchange rate 0.658 0.278 0.581 2.367 .021
Inflation rate 0.643 0.204 0.459 3.152 .002
Real GDP Growth Rate 0.712 0.189 0.661 3.767 .000
a. Dependent Variable: Growth of the capital market in Kenya
The1 coefficient1 of1 regression1 in1 table1 4.81 above1 was1 used1 in1 coming1 up1 with1
the1 model1 below: 1
Y = 2.564 + 0.767X1 + 0.736X2 + 0.825X3 + 0.658X4. + 0.643X5 + 0.712X6
Where:
X1 = Portfolio debt (bonds) inflows; X2 = Portfolio equity inflows; X3= Foreign direct
investment (FDI); X4 = Real1 Exchange1 Rate; 1 X5= Inflation1 Rate; 1 X6 = Real1 GDP1
growth1 rate. 1 From the findings, taking all factors constant at zero, growth1 of1 the1
capital1 market1 in1 Kenya1 was1 2.564. 1 The1 data1 findings1 also1 illustrates1 that1
taking1 all1 other1 independent1 variables1 at1 zero, 1 a1 unit1 growth in Portfolio debt
(bonds) inflows will1 lead1 to1 a 0.767 increase1 in1 growth1 of1 the capital market in
Kenya; a unit1 increase1 in1 portfolio equity inflows lead1 to1 a 0.736 increase1 in1
growth of the capital market in Kenya; a1 unit1 increase1 in1 foreign direct investment
(FDI) will translate to a 0.825 increase1 in1 growth1 of1 the capital market in Kenya; a1
unit1 increase1 in real exchange rate will1 lead1 to1 0.658 increase in growth1 of1 the1
capital1 market1 in1 Kenya; 1 a unit increase in inflation rate1 will1 lead1 to1 0.6431
increase1 in1 growth1 of1 the1 capital market in Kenya; a1 unit1 increase1 in1 real1 GDP1
growth1 rate1 will1 lead1 to1 0.7121 increase1 in1 growth1 of1 the1 capital1 market1 in1
Kenya. 1 As1 per1 the1 model, 1 all1 the1 variables1 were1 vital1 as1 their1 P- value1 was1
less1 than1 0.05. 1

27
4.6 Interpretation of the Findings
From1 the1 above1 regression1 model, 1 the1 study1 found1 out1 that, 1 Portfolio debt
(bonds) inflows; Portfolio equity inflows; Foreign direct investment (FDI); Real1
Exchange1 Rate; 1 Inflation1 Rate1 and1 Real1 GDP1 growth1 rate1 had1 a1 positive1
and1 significant1 relationship1 with1 growth1 of1 the1 capital1 market1 in1 Kenya. 1 The1
study1 concluded1 that1 the1 intercept1 was1 8.4221 for1 all1 years. 1
The1 six1 independent1 variables1 that1 were1 studied1 (Portfolio debt (bonds) inflows;
Portfolio equity inflows; Foreign direct investment (FDI); Real1 Exchange1 Rate; 1
Inflation1 Rate1 and1 Real1 GDP1 growth1 rate) 1 explain a substantial 61.4% of growth
of the capital market1 in1 Kenya1 as1 represented1 by1 adjusted1 R21 (0.614). This
consequently meant that the four variables add to 61.4% of liquidity ratio, while other1
factors1 not1 studied1 in1 this1 research1contribute138.6% of growth of the capital
market in Kenya. This is in line with Bakari (2017) who argues that access to
International borrowing has provided to the government so that even other borrowers
can be able to access the international capital. This step is crucial as most of the
borrowers are able to access funds which is key in public sector financing for most of
the countries.
The study found that Portfolio debt (bonds) inflows with a coefficient of 0.767 meant
that it is positively1 and1 significantly1 related1 to1 growth1 of1 the1 capital1 market1 in1
Kenya. 1 This is in line with Najeeb, Bacha and Masih (2015) who argues that domestic
bonds sales are purchased by non-residents due to repayment of international bonds
associated with portfolio debt investment flows. The local debt securities non-resident
investment are accounted for by the portfolio debt investment’s volatile pattern.
The study established that portfolio equity inflows as shown by a coefficient of 0.736
means that it is positively1 and1 significantly1 related1 to1 growth of the capital market
in Kenya. This concurs with López, et al. (2018) who argues that volatile capital flows
and frequent international crises are a result of small emerging economies managed by
macroeconomic risks and other regulation forms recognized by the approach. Costly
policy reversals have continued to be avoided by the sequenced approach, especially
when there are periodic domestic currency crises or there is a global financial crisis
28
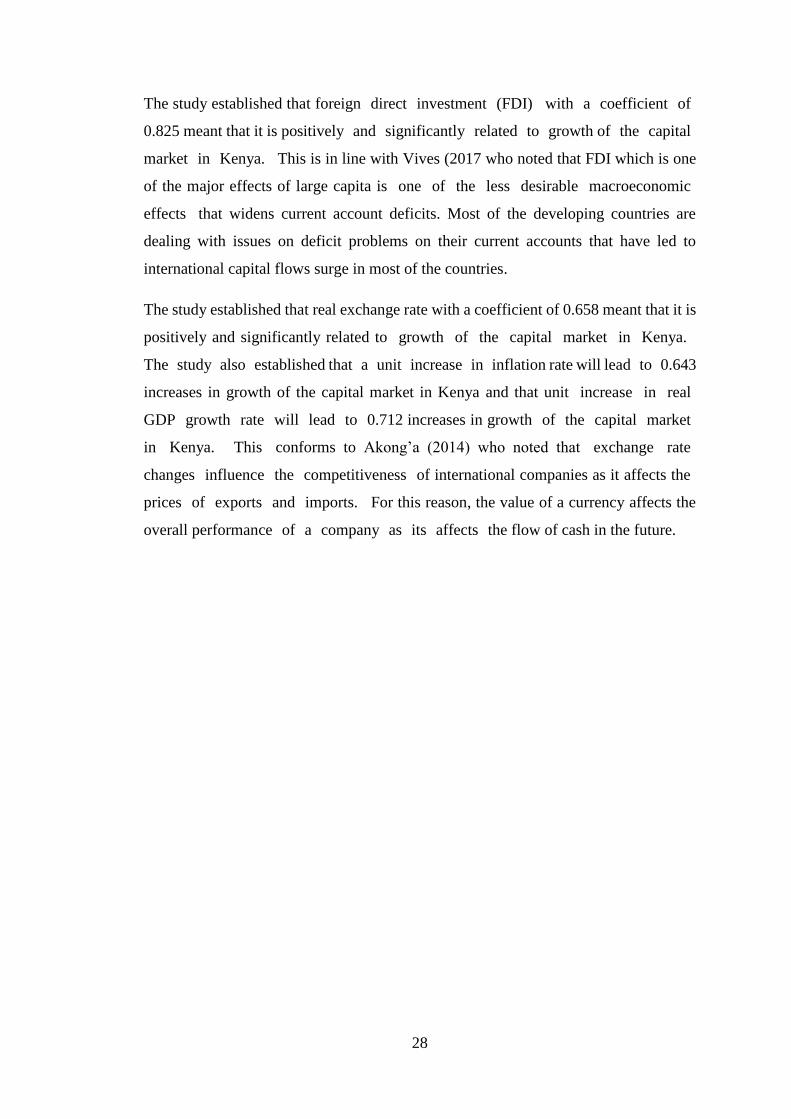
The study established that foreign1 direct1 investment1 (FDI) 1 with1 a1 coefficient1 of1
0.825 meant that it is positively1 and1 significantly1 related1 to1 growth of1 the1 capital1
market1 in1 Kenya. 1 This is in line with Vives (2017 who noted that FDI which is one
of the major effects of large capita is1 one1 of1 the1 less1 desirable1 macroeconomic1
effects1 that widens current account deficits. Most of the developing countries are
dealing with issues on deficit problems on their current accounts that have led to
international capital flows surge in most of the countries.
The study established that real exchange rate with a coefficient of 0.658 meant that it is
positively and significantly related to1 growth1 of1 the1 capital1 market1 in1 Kenya. 1
The1 study1 also1 established that1 a1 unit1 increase1 in1 inflation rate will lead1 to1 0.643
increases in growth of the capital market in Kenya and that unit1 increase1 in1 real1
GDP1 growth1 rate1 will1 lead1 to1 0.712 increases in growth1 of1 the1 capital1 market1
in1 Kenya. 1 This1 conforms to Akong’a (2014) who noted that1 exchange1 rate1
changes1 influence1 the1 competitiveness1 of international companies as it affects the1
prices1 of1 exports1 and1 imports. 1 For this reason, the value of a currency affects the
overall performance1 of1 a1 company1 as1 its1 affects1 the flow of cash in the future.

29
CHAPTER FIVE
SUMMARY, CONCLUSION AND RECOMMENDATIONS
5.1 Introduction
This chapter covers a summary, conclusion and recommendations of the findings on
effect of portfolio flows on growth of the capital market in1 Kenya. 1 This1 chapter1
presents1 the1 summary1of1the1findings, 1conclusions1of1the1study, 1 recommendations1
of1 the1 study, 1 limitation1 of1 the1 study1 and1 suggestions1 for1 further1 studies. 1
5.2 Summary
Despite numerous efforts to stabilise and enable growth of the capital markets, most of
them small, underdeveloped and illiquid. Capital markets that are in isolation, their
volumes to trade are low, have low global competition, their national regulations and
their capital mobility leads to face barriers as their infrastructure is under developed.
The undue unpredictability of stock prices often poses a challenge in the efficient
performance of the financial markets and eventually negatively affects the market,
which is evident in past occurrences
A quantitative comparative design1 was1 adopted1 by1 the1 study1 to1 quantify1 the1
variables’1 relationship. 1 The1 target1 population1 for1 this1 study1 was1 the1 Capital1
Market1 in1 Kenya1 comprising of both the debt and equity markets over a ten year
period from 2009 to 2018. The research used secondary information that was obtained
from Data from CMA, CBK, KNBS, 1 KIPPRA, 1 and1 Ministry1 of1 Finance, 1 public1
libraries, 1 national1 budget1 and1 other1 government1 records1 and World Integrated
Trade Solution (WITS). The collected data was therefore sorted, coded and analytically
arranged in a way that can facilitate it. The1 study1 found that the independent variables
contribute to 61.4% of growth1 of1 the1 capital1 market1 in1 Kenya1 and that a unit
increase in Portfolio debt (bonds) inflows leads to 0.767 increases in growth1 of1 the1
capital1 market1 in1 Kenya. 1 From the findings, the study concludes that Portfolio debt
(bonds) inflows is positively and significantly related to growth1 of1 the1 capital1
market1 in1 Kenya1. The study concluded that portfolio equity inflows is positively and
significantly related to1 growth1 of1 the1 capital1 market1 in1 Kenya.1

30
The study established that foreign direct investment (FDI) is positively and significantly
related to1 growth1 of1 the1 capital1 market1 in1 Kenya. The1 study established that real
exchange rate is1 positively1 and1 significantly1 related1 to11 growth1 of1 the1 capital1
market1 in1 Kenya. The1 study also established1 inflation1 rate1 and1 real1 GDP1 growth1
rate1 as1 control1 variables1 are1 significantly related to growth of the capital1 market1
in1 Kenya. 1
5.3 Conclusion
The study established that real exchange rate with a coefficient of 0.658 meant that it is
positively and significantly related to1 growth1 of1 the1 capital1 market1 in1 Kenya. 1
The1 study1 also1 established that1 a1 unit1 increase1 in1 inflation rate will lead1 to1 0.643
increases in growth of the capital market in Kenya and that unit1 increase1 in1 real1
GDP1 growth1 rate1 will1 lead1 to1 0.712 increases in growth1 of1 the1 capital1 market1
in1 Kenya. 1 Exchange1 rate1 changes1 influence1 the1 competitiveness1 of international
companies as it affects the1 prices1 of1 exports1 and1 imports. 1 For this reason, the value
of a currency affects the overall performance1 of1 a1 company1 as1 its1 affects1 the flow
of cash in the future.
5.4 Limitations
The study was limited to foreign portfolio flows only as the determinant of capital
market growth in Kenya and yet there are many factors which affect growth of capital
market like stock market liquidity. The study was also limited to capital market in
Kenya only. The study was limited to CMA only and the study was also limited to 10
year period from year 2009 to year 2018.
The1 study1 was1 limited1 to1 secondary1 data, 1 which1 was1 collected1 from1 CMA, 1
CBK, 1 KNBS, 1 KIPPRA, 1 and1 Ministry1 of1 Finance, 1 public1 libraries, 1 national1
budget1 and1 other1 government1 records1 and World Integrated Trade Solution
(WITS). The research considered the relationship between portfolio flows and growth
of the capital market in Kenya. However, there are other factors that might be
significantly related to growth of the capital market in Kenya.
The quality of data was another limitation, whereby the study employed secondary data
that is already obtained and accessible unlike primary data that is a first-hand information
whose quality can be enhanced. Secondary data once they are recorded cannot be altered,

31
therefore if errors were made in arriving at that amount then there are no chances of
rectifying and therefore the result can be affected by those errors.
5.5 Recommendations
The1 study1 recommends1 that1 measures1 should1 be1 put1 in1 place1 to1 ensure1 that1
inflows1 of1 short1 term1 capital1 are1 not1 disruptive1 as1 they1 lead1 to1 appreciation1
of1 the1 currency, 1 making1 the1 country1 uncompetitive, and increase in interest rates
leading to high costs of credit and affects investment. Hence, with the growing volume
of short-term capital flows into the country, focus should be on how well the inflows
can be harnessed to support growth, while at the same time ensuring macroeconomic
stability.
The study also recommends that foreign1 investors1 liquidate1 their1 positions1 due1 to1
so1 many1 factors1 including1 but1 not1 limited1 the1 expectations1 and1 sentiments1 of1
foreign1 investors, 1 terrorism, 1 political1 instability1 and1 sovereign1 risk. The1 study1
recommends1 that1 the1 government1 should1 put1 in1 place1 measures1 that1 discourage1
foreign1 outflows.
The study further recommends improvement of the participation of local investors in
the capital market. The capital market regulator, CMA, should increase investor
education and awareness campaigns for local investors so that their participation at the
stock market can increase. Active participation of local investors is necessary to drive
liquidity and bring confidence to the market and this may further attract the foreign
investors, creating a mutually beneficial cycle. In addition, increased participation of
the local investors will make the stock market to withstand the shock of unexpected
foreign portfolio outflows.
Monetary authorities should ensure macroeconomic stability prevails, especially in the
exchange rate and interest rates as this will reduce uncertainty and improve confidence
in the stock market fuelling further participation of the foreign investors.
The study also recommends favourable legal and taxation rules. FDI inflow should be
encouraged to develop stock market and economy as well and measures should be put
in place to ensure continued flow of Foreign Portfolio Equity Investments into the stock
market. The government should ensure that certain regulations such as the recently re-
introduced capital gains tax do not unnecessarily interfere with the operations of the
32
stock market as this may make the market less competitive as compared to other
markets in the emerging economies.
5.6 Recommendations for Further Research
The study established that 61.4% of the variations in growth of the capital market in
Kenya was attributed to foreign portfolio flows and control variables. Therefore, there
a need to conduct another study based on other factors affecting growth of capital
market which have not been covered in this study like stock market liquidity.
The study used secondary data. Primary data should also be used to see if the same
result findings still hold. This study targeted Capital markets. Further research should
be done targeting to establish the relationship between the portfolio flows and financial
performance.
Finally, further research should involve a panel data that cuts across more than 20 years.
The current study only focused 1999 to 2018 data. This study was done in Kenya only
and hence future researchers should extend the population of the study to cover East
Africa region.

33
REFERENCES
Adams, S., Klobodu, E. K. M., & Lamptey, R. O. (2017). The effects of capital flows
on economic growth in Senegal. Margin: The Journal of Applied Economic
Research, 11(2), 121-142.
Ahmad, F., Draz, M. U., & Yang, S. C. (2015). Determinants of foreign portfolio
inflows: Analysis and implications for China. Asian Journal of Finance &
Accounting, 7(2), 66-77.
Ahmad, M. I. & Naseem, M. A. (2011). Does Inflation Hurt the Stock Market Returns?
Accessed online from https://www.researchgate.net/publication/228311038 on
27/6/2016
Akong’a, G. M. (2014). Crossing the lines: The conditional relation between exchange
rate exposure and stock returns in emerging and developed markets. Journal of
International Money and Finance, 31(4):766-792
Ali, M. B. (2014). The impact of selected micro and microeconomic variables on the
stock prices of emerging stock market: A case of Dhaka Stock Exchange (DSE)
(Doctoral dissertation).
Ariss, R. T. (2012). Understanding Inflation and Revising National Price Data.
Lebanese Economic Association, Beirut- Lebanon.
Bakari, S. (2017). The impact of domestic investment on economic growth: New
evidence from Malaysia.
Bayrakdaroglu, A., Ege, I., & Yazici, N. (2013). A panel data analysis of capital
structure determinants: Empirical results from Turkish capital
market. International Journal of Economics and Finance, 5(4), 131-140.
Berensmann, K., Dafe, F., & Volz, U. (2015). Developing local currency bond markets
for long-term development financing in Sub-Saharan Africa.
Byrne, J. P., & Fiess, N. (2016). International capital flows to emerging markets:
National and global determinants. Journal of International Money and
Finance, 61, 82-100.

34
Chepkoiwo, N. K. (2011). Factors Affecting the Development of Emerging Capital
Markets. The Case of Nairobi Stock Exchange. Unpublished MBA Project,
University of Nairobi.
Dunkley, G. (2016). One World Mania: A Critical Guide to Free Trade,
Financialization and Over-globalization. Zed Books Ltd.
Feenstra, R. C. (2015). Advanced international trade: theory and evidence. Princeton
university press.
Gatuhi, S. K. (2015). Macroeconomic factors and stock market performance in
Kenya (Doctoral dissertation, JKUAT).
Hwa, T., Raghavan, M., & Huey, T. (2017). Macro-Financial Effects of Portfolio
Flows: Malaysia's Experience.
Jamil, M., & Ullah, N. (2013). Impact of Foreign Exchange Rates on Stock Prices,
Journal of Business and Management, 7(3): 45-51
Jassaud, N., & Kang, M. K. (2015). A strategy for developing a market for
nonperforming loans in Italy (No. 15-24). International Monetary Fund.
Jolliffe, D., & Prydz, E. B. (2015). Global poverty goals and prices: how purchasing
power parity matters. The World Bank.
Kaya, O., Schildbach, J., AG, D. B., & Hoffmann, R. (2015). Capital Markets
Union. Deutsche Bank Research. EU Monitor. Frankfurt am Main.
Kimani, D. K. & Mutuku, C. M. (2013). Inflation Dynamics on the Overall Stock
Market Performance: The Case of Nairobi Securities Exchange in Kenya.
Economics and Finance Review, 2 (11), 01 – 11
Laichena, K. E. & Obwogi, T. N. (2015). Effects of Macroeconomic Variables on Stock
Returns in the East African Community Stock Exchange Market. International
Journal of Education and Research, 3 (10), 305-320
35
Lawal, A. I., Kazi, K. P., Adeoti, J. O., Osuma, O. G., Akinmulegun, S. O., & Ilo, B.
(2017). Capital flight and the economic growth: Evidence from Nigeria. Binus
Business Review, 8(2), 125-132.
Lewis, S. (2015). Qualitative inquiry and research design: Choosing among five
approaches. Health promotion practice, 16(4), 473-475.
Lin, L., Kim, I., & Lee, B. (2015). What drives international portfolio flows?. Journal
of International Money and Finance, 60, 53-72.
López, F., Iamsiraroj, S., & Ulubaşoğlu, M. A. (2018). Foreign direct investment and
economic growth: A real relationship or wishful thinking?. Economic
Modelling, 51, 200-213.
Moore, T., & Wang, P. (2014). Dynamic linkage between real exchange rates and stock
prices: Evidence from developed and emerging Asian markets. International
Review of Economics & Finance, 29, 1-11.
Mwijuka, A. (2016). Analysis of performance of listed companies on USE and Capital
Markets in Uganda 2010-2015.
Najeeb, S. F., Bacha, O., & Masih, M. (2015). Does heterogeneity in investment
horizons affect portfolio diversification? Some insights using M-GARCH-DCC
and wavelet correlation analysis. Emerging Markets Finance and Trade, 51(1),
188-208.
Nassr, I. K., & Wehinger, G. (2016). Opportunities and limitations of public equity
markets for SMEs. OECD Journal: Financial Market Trends, 2015(1), 49-84.
Nyaga, L. K. (2017). Effects of Foreign Portfolio Flows on the Capital Market in
Kenya. Unpublished MA Economic Project.
Nyang`oro, O. (2013). Foreign Portfolio Flows and Stock Market Performance in
Kenya: Case of Nairobi Securities Exchange. Presentation at the CSAE
conference on Economic Development in Africa, March 2013
36
Nyongesa, D. N., & Muchoki, M. M. (2016). Cointegration Relationship Between
Exchange Rate Volatility and Performance of Nairobi Securities Exchange
Market, Kenya. Research Journal of Finance and Accounting, 7(20), 73-86.
Obamuyi, T. M. (2013). Factors influencing investment decisions in capital market: A
study of individual investors in Nigeria. Organizations and markets in emerging
economies, 4(07), 141-161.
Okoye, O. V., Kenechukwu, N. J., & Eze, O. R. (2013). Capital market and industrial
sector development in Nigeria: A theoretical analysis. Journal of emerging
trends in economics and management sciences, 4(1), 20-30.
Omar, A., Abduh, M., & Sukmana, R. (2013). Fundamentals of Islamic money and
capital markets. John Wiley & Sons.
Omoke, J. M. (2010). The relationship between capital market development and
economic growth in Kenya. Unpublished MBA Project, University of Nairobi.
Ozurumba, B, A. (2012). The impact of stock market return on foreign portfolio
investment in Nigeria. IOSR journal of Business and Management, 2 (4), 10-19
Rabai, N., & Khakan, N. (2016). A Study of Exchange Rates Movement and Stock
Market Volatility. International Journal of Research- Granthaalayah, 4(1),
70-79
Rodrik, D. (2014). The past, present, and future of economic growth. Challenge, 57(3),
5-39.
Sakyi, D., Villaverde, J., & Maza, A. (2015). Trade openness, income levels, and
economic growth: The case of developing countries, 1970–2009. The Journal
of International Trade & Economic Development, 24(6), 860-882.
Sunde, T. (2017). Foreign direct investment, exports and economic growth: ADRL and
causality analysis for South Africa. Research in International Business and
Finance, 41, 434-444.

37
Valdez, S., & Molyneux, P. (2015). An introduction to global financial markets.
Macmillan International Higher Education. Vives, J. V. (2015). Economic
History of Spain (Vol. 2416). Princeton University Press.

38
APPENDICES
Appendix I: Secondary Data Collection Sheet
2009
2010
2011
2012
2013
2014
2015
2016
2017
2018
Value of the
Exports
Value1 of1 the1
Imports1
Portfolio1 debt1
(bonds) 1 inflows1
(country's1 debt1
that1 has1 been1
borrowed1 from1
foreign1 lenders1
including1
commercial1
banks, 1
governments1 or1
international1
financial1
institutions) 1
Portfolio1 equity1
inflows1
Actual FDI
inflow
Market portfolio
equity inflows
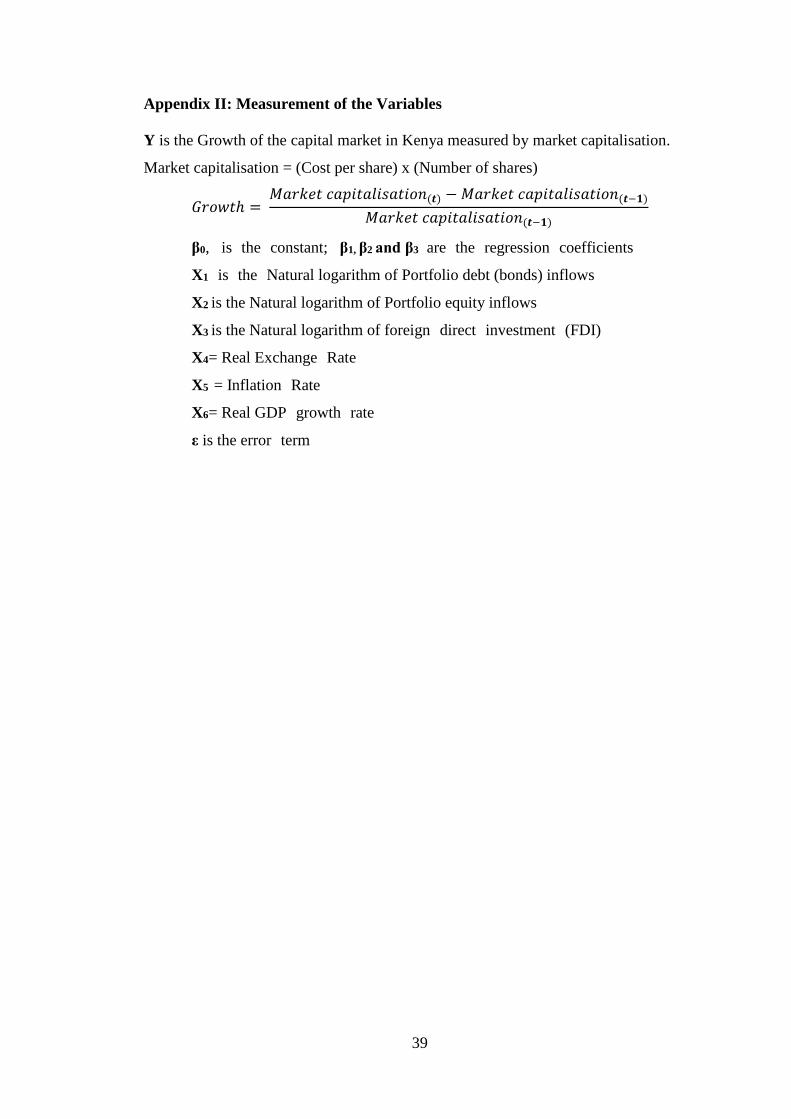
39
Appendix II: Measurement of the Variables
Y is the Growth of the capital market in Kenya measured by market capitalisation.
Market capitalisation = (Cost per share) x (Number of shares)
𝐺𝑟𝑜𝑤𝑡ℎ = 𝑀𝑎𝑟𝑘𝑒𝑡 𝑐𝑎𝑝𝑖𝑡𝑎𝑙𝑖𝑠𝑎𝑡𝑖𝑜𝑛(𝒕) − 𝑀𝑎𝑟𝑘𝑒𝑡 𝑐𝑎𝑝𝑖𝑡𝑎𝑙𝑖𝑠𝑎𝑡𝑖𝑜𝑛(𝒕−𝟏)
𝑀𝑎𝑟𝑘𝑒𝑡 𝑐𝑎𝑝𝑖𝑡𝑎𝑙𝑖𝑠𝑎𝑡𝑖𝑜𝑛(𝒕−𝟏)
β0, 1 is1 the1 constant; 1 β1, β2 and β31 are1 the1 regression1 coefficients
X11 is1 the1 Natural logarithm of Portfolio debt (bonds) inflows
X2 is the Natural logarithm of Portfolio equity inflows
X3 is the Natural logarithm of foreign1 direct1 investment1 (FDI) 1
X4= Real Exchange1 Rate1
X51= Inflation1 Rate1
X6= Real GDP1 growth1 rate1
ε is the error1 term1
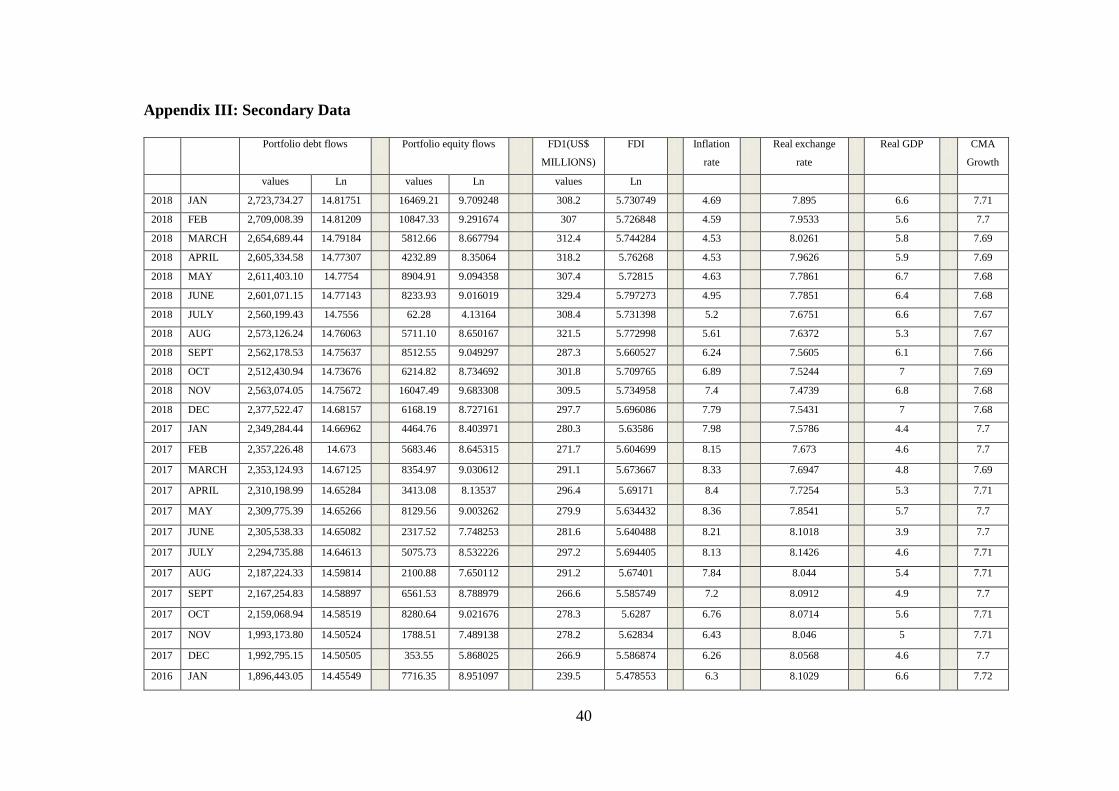
40
Appendix III: Secondary Data
Portfolio debt flows Portfolio equity flows FD1(US$
MILLIONS)
FDI Inflation
rate
Real exchange
rate
Real GDP CMA
Growth
values Ln values Ln values Ln
2018 JAN 2,723,734.27 14.81751 16469.21 9.709248 308.2 5.730749 4.69 7.895 6.6 7.71
2018 FEB 2,709,008.39 14.81209 10847.33 9.291674 307 5.726848 4.59 7.9533 5.6 7.7
2018 MARCH 2,654,689.44 14.79184 5812.66 8.667794 312.4 5.744284 4.53 8.0261 5.8 7.69
2018 APRIL 2,605,334.58 14.77307 4232.89 8.35064 318.2 5.76268 4.53 7.9626 5.9 7.69
2018 MAY 2,611,403.10 14.7754 8904.91 9.094358 307.4 5.72815 4.63 7.7861 6.7 7.68
2018 JUNE 2,601,071.15 14.77143 8233.93 9.016019 329.4 5.797273 4.95 7.7851 6.4 7.68
2018 JULY 2,560,199.43 14.7556 62.28 4.13164 308.4 5.731398 5.2 7.6751 6.6 7.67
2018 AUG 2,573,126.24 14.76063 5711.10 8.650167 321.5 5.772998 5.61 7.6372 5.3 7.67
2018 SEPT 2,562,178.53 14.75637 8512.55 9.049297 287.3 5.660527 6.24 7.5605 6.1 7.66
2018 OCT 2,512,430.94 14.73676 6214.82 8.734692 301.8 5.709765 6.89 7.5244 7 7.69
2018 NOV 2,563,074.05 14.75672 16047.49 9.683308 309.5 5.734958 7.4 7.4739 6.8 7.68
2018 DEC 2,377,522.47 14.68157 6168.19 8.727161 297.7 5.696086 7.79 7.5431 7 7.68
2017 JAN 2,349,284.44 14.66962 4464.76 8.403971 280.3 5.63586 7.98 7.5786 4.4 7.7
2017 FEB 2,357,226.48 14.673 5683.46 8.645315 271.7 5.604699 8.15 7.673 4.6 7.7
2017 MARCH 2,353,124.93 14.67125 8354.97 9.030612 291.1 5.673667 8.33 7.6947 4.8 7.69
2017 APRIL 2,310,198.99 14.65284 3413.08 8.13537 296.4 5.69171 8.4 7.7254 5.3 7.71
2017 MAY 2,309,775.39 14.65266 8129.56 9.003262 279.9 5.634432 8.36 7.8541 5.7 7.7
2017 JUNE 2,305,538.33 14.65082 2317.52 7.748253 281.6 5.640488 8.21 8.1018 3.9 7.7
2017 JULY 2,294,735.88 14.64613 5075.73 8.532226 297.2 5.694405 8.13 8.1426 4.6 7.71
2017 AUG 2,187,224.33 14.59814 2100.88 7.650112 291.2 5.67401 7.84 8.044 5.4 7.71
2017 SEPT 2,167,254.83 14.58897 6561.53 8.788979 266.6 5.585749 7.2 8.0912 4.9 7.7
2017 OCT 2,159,068.94 14.58519 8280.64 9.021676 278.3 5.6287 6.76 8.0714 5.6 7.71
2017 NOV 1,993,173.80 14.50524 1788.51 7.489138 278.2 5.62834 6.43 8.046 5 7.71
2017 DEC 1,992,795.15 14.50505 353.55 5.868025 266.9 5.586874 6.26 8.0568 4.6 7.7
2016 JAN 1,896,443.05 14.45549 7716.35 8.951097 239.5 5.478553 6.3 8.1029 6.6 7.72

41
2016 FEB 1,834,914.33 14.42251 2774.54 7.92824 244.2 5.497988 6.43 8.1473 6.7 7.7
2016 MARCH 1,844,474.96 14.42771 18024.97 9.799513 239.9 5.480222 6.48 8.4206 5.3 7.71
2016 APRIL 1,849,019.87 14.43017 5697.56 8.647793 235.1 5.460011 6.5 8.389 6.1 7.71
2016 MAY 1,803,260.48 14.40511 2580.59 7.855773 239.8 5.479805 6.47 8.5433 7 7.7
2016 JUNE 1,797,696.38 14.40202 6817.81 8.827294 239.4 5.478136 6.44 8.9049 5.9 7.72
2016 JULY 1,803,256.30 14.4051 18007.50 9.798544 239.7 5.479388 6.46 8.9898 6 7.71
2016 AUG 1,680,631.83 14.33468 7559.14 8.930513 238.9 5.476045 6.59 9.2786 4.8 7.71
2016 SEPT 1,685,269.16 14.33744 1801.46 7.496353 253.5 5.535364 6.72 9.6357 4 7.72
2016 OCT 1,665,578.04 14.32568 1938.49 7.569665 238.8 5.475626 6.88 10.127 5.8 7.7
2016 NOV 1,646,555.21 14.3142 9054.21 9.110985 231.9 5.446306 6.87 9.3676 5.9 7.72
2016 DEC 1,654,744.49 14.31916 1591.56 7.37247 238.7 5.475208 6.77 8.6663 6.7 7.71
2015 JAN 1,615,184.20 14.29496 5699.10 8.648064 261 5.56452 6.58 8.6343 6.4 7.71
2015 FEB 1,562,515.56 14.26181 8513.57 9.049417 261 5.56452 6.42 8.3176 6.6 7.72
2015 MARCH 1,490,713.76 14.21477 6201.88 8.732608 256 5.545177 6.31 8.2897 5.3 7.71
2015 APRIL 1,550,232.74 14.25392 16147.43 9.689516 258 5.55296 6.29 8.3188 6.1 7.71
2015 MAY 1,530,678.61 14.24122 6668.02 8.805078 241 5.484797 6.34 8.4384 7 7.72
2015 JUNE 1,473,143.70 14.20291 2436.57 7.798347 271 5.602119 6.54 8.4789 5.6 7.71
2015 JULY 1,408,613.59 14.15812 3982.82 8.289745 261 5.56452 6.63 8.414 5.8 7.72
2015 AUG 1,381,156.98 14.13843 12164.69 9.406293 262 5.568345 6.65 8.4075 4.8 7.71
2015 SEPT 1,326,835.19 14.09831 2805.46 7.939323 261 5.56452 6.69 8.4613 5.1 7.71
2015 OCT 1,278,107.87 14.06089 2074.55 7.6375 269 5.594711 6.63 8.5112 4.9 7.72
2015 NOV 1,296,748.46 14.07537 4442.90 8.399063 258 5.55296 6.63 8.5629 5 7.72
2015 DEC 1,163,350.79 13.96682 5366.94 8.588013 281 5.638355 6.74 8.5994 5.8 7.71
2014 JAN 1,170,696.28 13.97311 353.44 5.867714 282.7 5.644386 6.88 8.69 5.9 7.73
2014 FEB 1,088,951.54 13.90073 1791.20 7.490641 281.9 5.641552 6.97 8.7446 6.4 7.71
2014 MARCH 1,088,832.15 13.90062 10276.86 9.23765 282.8 5.64474 7.08 8.5818 5.6 7.72
2014 APRIL 1,087,827.67 13.89969 15480.92 9.647364 283.4 5.646859 7.19 8.4189 5.2 7.72
2014 MAY 1,090,984.32 13.90259 15576.02 9.653488 282.1 5.642262 7.33 8.4146 7 7.71
2014 JUNE 1,089,655.77 13.90137 12122.10 9.402786 282.9 5.645093 7.19 8.5488 5.3 7.94
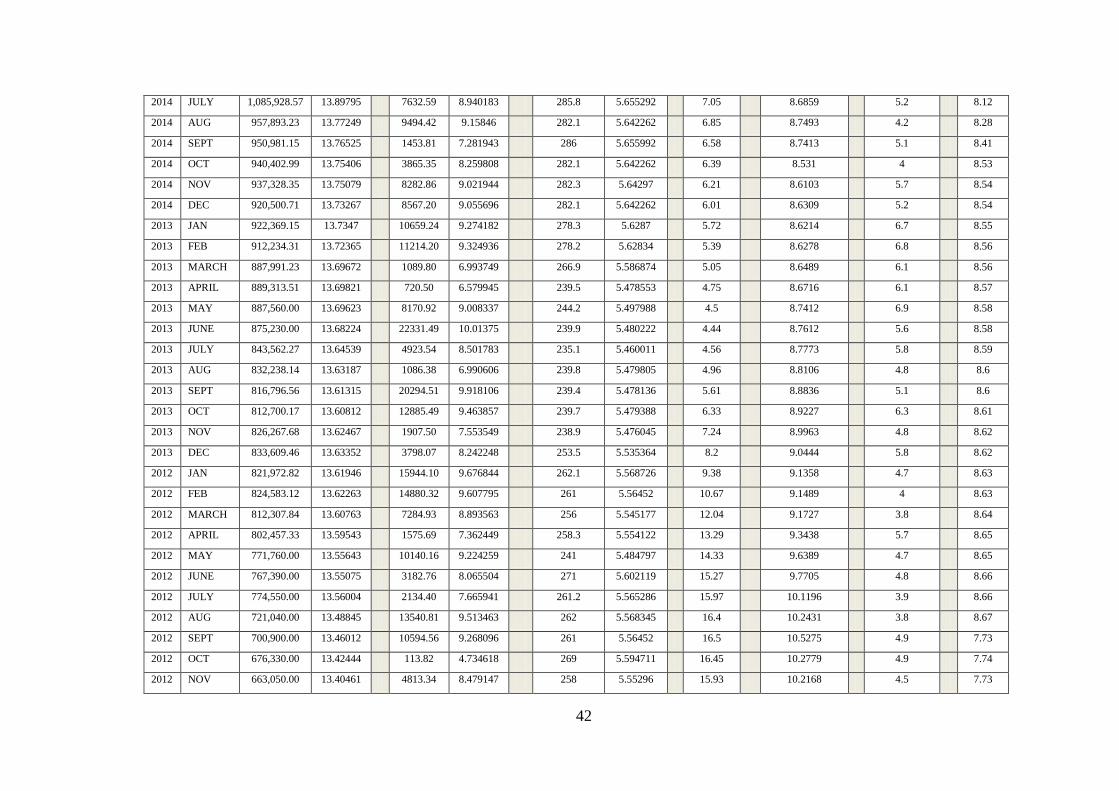
42
2014 JULY 1,085,928.57 13.89795 7632.59 8.940183 285.8 5.655292 7.05 8.6859 5.2 8.12
2014 AUG 957,893.23 13.77249 9494.42 9.15846 282.1 5.642262 6.85 8.7493 4.2 8.28
2014 SEPT 950,981.15 13.76525 1453.81 7.281943 286 5.655992 6.58 8.7413 5.1 8.41
2014 OCT 940,402.99 13.75406 3865.35 8.259808 282.1 5.642262 6.39 8.531 4 8.53
2014 NOV 937,328.35 13.75079 8282.86 9.021944 282.3 5.64297 6.21 8.6103 5.7 8.54
2014 DEC 920,500.71 13.73267 8567.20 9.055696 282.1 5.642262 6.01 8.6309 5.2 8.54
2013 JAN 922,369.15 13.7347 10659.24 9.274182 278.3 5.6287 5.72 8.6214 6.7 8.55
2013 FEB 912,234.31 13.72365 11214.20 9.324936 278.2 5.62834 5.39 8.6278 6.8 8.56
2013 MARCH 887,991.23 13.69672 1089.80 6.993749 266.9 5.586874 5.05 8.6489 6.1 8.56
2013 APRIL 889,313.51 13.69821 720.50 6.579945 239.5 5.478553 4.75 8.6716 6.1 8.57
2013 MAY 887,560.00 13.69623 8170.92 9.008337 244.2 5.497988 4.5 8.7412 6.9 8.58
2013 JUNE 875,230.00 13.68224 22331.49 10.01375 239.9 5.480222 4.44 8.7612 5.6 8.58
2013 JULY 843,562.27 13.64539 4923.54 8.501783 235.1 5.460011 4.56 8.7773 5.8 8.59
2013 AUG 832,238.14 13.63187 1086.38 6.990606 239.8 5.479805 4.96 8.8106 4.8 8.6
2013 SEPT 816,796.56 13.61315 20294.51 9.918106 239.4 5.478136 5.61 8.8836 5.1 8.6
2013 OCT 812,700.17 13.60812 12885.49 9.463857 239.7 5.479388 6.33 8.9227 6.3 8.61
2013 NOV 826,267.68 13.62467 1907.50 7.553549 238.9 5.476045 7.24 8.9963 4.8 8.62
2013 DEC 833,609.46 13.63352 3798.07 8.242248 253.5 5.535364 8.2 9.0444 5.8 8.62
2012 JAN 821,972.82 13.61946 15944.10 9.676844 262.1 5.568726 9.38 9.1358 4.7 8.63
2012 FEB 824,583.12 13.62263 14880.32 9.607795 261 5.56452 10.67 9.1489 4 8.63
2012 MARCH 812,307.84 13.60763 7284.93 8.893563 256 5.545177 12.04 9.1727 3.8 8.64
2012 APRIL 802,457.33 13.59543 1575.69 7.362449 258.3 5.554122 13.29 9.3438 5.7 8.65
2012 MAY 771,760.00 13.55643 10140.16 9.224259 241 5.484797 14.33 9.6389 4.7 8.65
2012 JUNE 767,390.00 13.55075 3182.76 8.065504 271 5.602119 15.27 9.7705 4.8 8.66
2012 JULY 774,550.00 13.56004 2134.40 7.665941 261.2 5.565286 15.97 10.1196 3.9 8.66
2012 AUG 721,040.00 13.48845 13540.81 9.513463 262 5.568345 16.4 10.2431 3.8 8.67
2012 SEPT 700,900.00 13.46012 10594.56 9.268096 261 5.56452 16.5 10.5275 4.9 7.73
2012 OCT 676,330.00 13.42444 113.82 4.734618 269 5.594711 16.45 10.2779 4.9 7.74
2012 NOV 663,050.00 13.40461 4813.34 8.479147 258 5.55296 15.93 10.2168 4.5 7.73
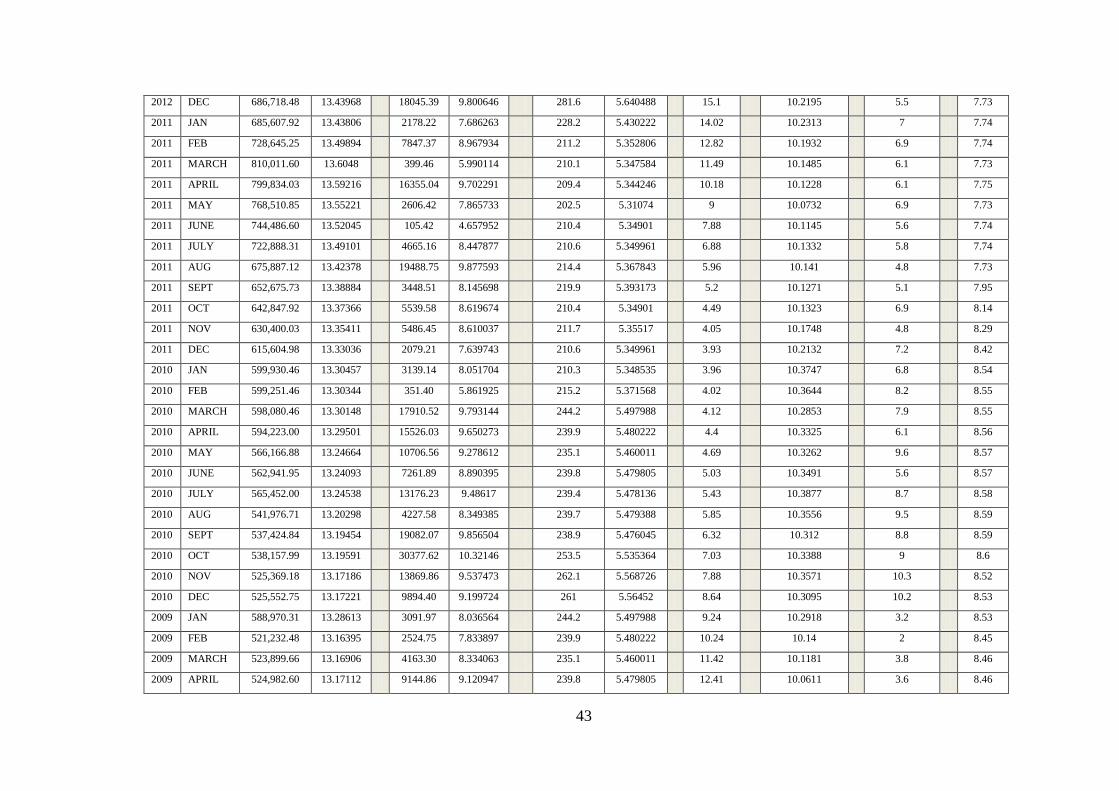
43
2012 DEC 686,718.48 13.43968 18045.39 9.800646 281.6 5.640488 15.1 10.2195 5.5 7.73
2011 JAN 685,607.92 13.43806 2178.22 7.686263 228.2 5.430222 14.02 10.2313 7 7.74
2011 FEB 728,645.25 13.49894 7847.37 8.967934 211.2 5.352806 12.82 10.1932 6.9 7.74
2011 MARCH 810,011.60 13.6048 399.46 5.990114 210.1 5.347584 11.49 10.1485 6.1 7.73
2011 APRIL 799,834.03 13.59216 16355.04 9.702291 209.4 5.344246 10.18 10.1228 6.1 7.75
2011 MAY 768,510.85 13.55221 2606.42 7.865733 202.5 5.31074 9 10.0732 6.9 7.73
2011 JUNE 744,486.60 13.52045 105.42 4.657952 210.4 5.34901 7.88 10.1145 5.6 7.74
2011 JULY 722,888.31 13.49101 4665.16 8.447877 210.6 5.349961 6.88 10.1332 5.8 7.74
2011 AUG 675,887.12 13.42378 19488.75 9.877593 214.4 5.367843 5.96 10.141 4.8 7.73
2011 SEPT 652,675.73 13.38884 3448.51 8.145698 219.9 5.393173 5.2 10.1271 5.1 7.95
2011 OCT 642,847.92 13.37366 5539.58 8.619674 210.4 5.34901 4.49 10.1323 6.9 8.14
2011 NOV 630,400.03 13.35411 5486.45 8.610037 211.7 5.35517 4.05 10.1748 4.8 8.29
2011 DEC 615,604.98 13.33036 2079.21 7.639743 210.6 5.349961 3.93 10.2132 7.2 8.42
2010 JAN 599,930.46 13.30457 3139.14 8.051704 210.3 5.348535 3.96 10.3747 6.8 8.54
2010 FEB 599,251.46 13.30344 351.40 5.861925 215.2 5.371568 4.02 10.3644 8.2 8.55
2010 MARCH 598,080.46 13.30148 17910.52 9.793144 244.2 5.497988 4.12 10.2853 7.9 8.55
2010 APRIL 594,223.00 13.29501 15526.03 9.650273 239.9 5.480222 4.4 10.3325 6.1 8.56
2010 MAY 566,166.88 13.24664 10706.56 9.278612 235.1 5.460011 4.69 10.3262 9.6 8.57
2010 JUNE 562,941.95 13.24093 7261.89 8.890395 239.8 5.479805 5.03 10.3491 5.6 8.57
2010 JULY 565,452.00 13.24538 13176.23 9.48617 239.4 5.478136 5.43 10.3877 8.7 8.58
2010 AUG 541,976.71 13.20298 4227.58 8.349385 239.7 5.479388 5.85 10.3556 9.5 8.59
2010 SEPT 537,424.84 13.19454 19082.07 9.856504 238.9 5.476045 6.32 10.312 8.8 8.59
2010 OCT 538,157.99 13.19591 30377.62 10.32146 253.5 5.535364 7.03 10.3388 9 8.6
2010 NOV 525,369.18 13.17186 13869.86 9.537473 262.1 5.568726 7.88 10.3571 10.3 8.52
2010 DEC 525,552.75 13.17221 9894.40 9.199724 261 5.56452 8.64 10.3095 10.2 8.53
2009 JAN 588,970.31 13.28613 3091.97 8.036564 244.2 5.497988 9.24 10.2918 3.2 8.53
2009 FEB 521,232.48 13.16395 2524.75 7.833897 239.9 5.480222 10.24 10.14 2 8.45
2009 MARCH 523,899.66 13.16906 4163.30 8.334063 235.1 5.460011 11.42 10.1181 3.8 8.46
2009 APRIL 524,982.60 13.17112 9144.86 9.120947 239.8 5.479805 12.41 10.0611 3.6 8.46
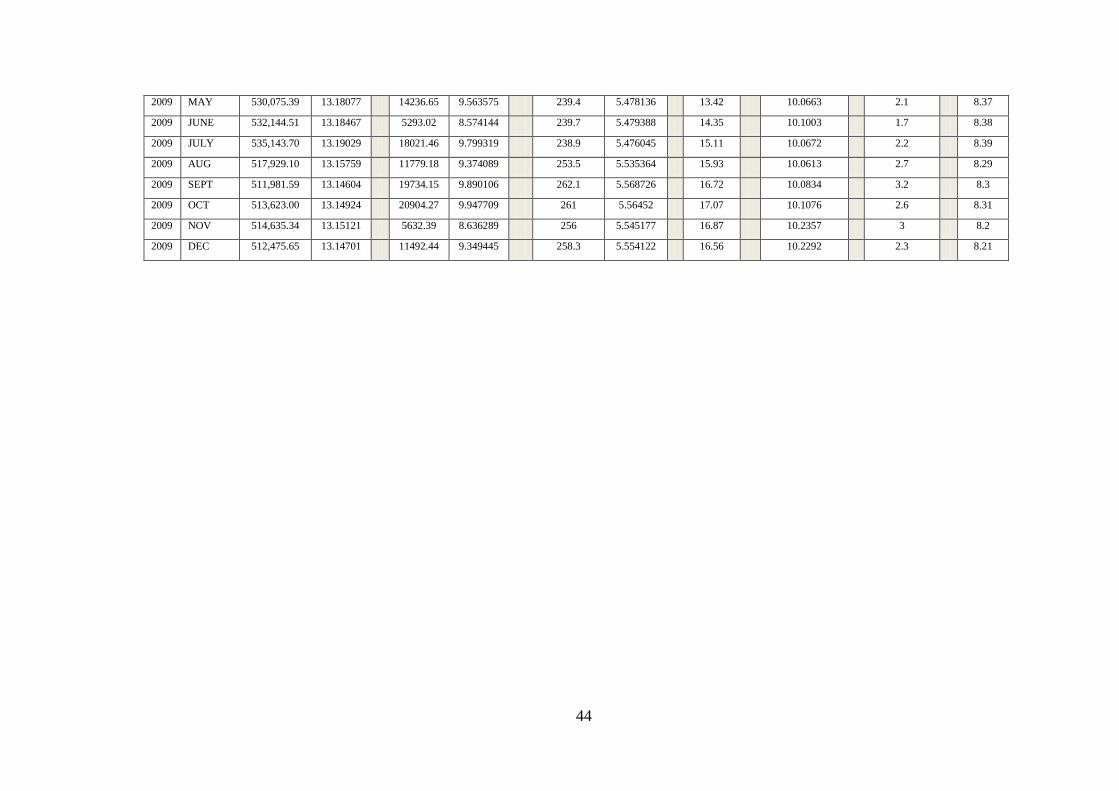
44
2009 MAY 530,075.39 13.18077 14236.65 9.563575 239.4 5.478136 13.42 10.0663 2.1 8.37
2009 JUNE 532,144.51 13.18467 5293.02 8.574144 239.7 5.479388 14.35 10.1003 1.7 8.38
2009 JULY 535,143.70 13.19029 18021.46 9.799319 238.9 5.476045 15.11 10.0672 2.2 8.39
2009 AUG 517,929.10 13.15759 11779.18 9.374089 253.5 5.535364 15.93 10.0613 2.7 8.29
2009 SEPT 511,981.59 13.14604 19734.15 9.890106 262.1 5.568726 16.72 10.0834 3.2 8.3
2009 OCT 513,623.00 13.14924 20904.27 9.947709 261 5.56452 17.07 10.1076 2.6 8.31
2009 NOV 514,635.34 13.15121 5632.39 8.636289 256 5.545177 16.87 10.2357 3 8.2
2009 DEC 512,475.65 13.14701 11492.44 9.349445 258.3 5.554122 16.56 10.2292 2.3 8.21