technology development for the reduction of nox in flue … combustion plants 94,602 89,127 86,636...
TRANSCRIPT

1619
Korean J. Chem. Eng., 34(6), 1619-1629 (2017)DOI: 10.1007/s11814-017-0029-x
INVITED REVIEW PAPER
pISSN: 0256-1115eISSN: 1975-7220
INVITED REVIEW PAPER
†To whom correspondence should be addressed.E-mail: [email protected], [email protected] by The Korean Institute of Chemical Engineers.
Technology development for the reduction of NOx in flue gasfrom a burner-type vaporizer and its application
Jeongeun Son*, Huicheon Yang*, Geonjoong Kim*,†, Sungwon Hwang*,†, and Hyunseok You**
*Graduate School of Chemistry and Chemical Engineering, Inha University, 100 Inha-ro, Nam-gu, Incheon 22212, Korea**New Energy Technology Center, KOGAS Research Institute, 1248, Suin-ro, Sangnok-gu, Ansan-si, Gyeonggi-do 15328, Korea
(Received 25 November 2016 • accepted 6 February 2017)
Abstract−We developed a modified process of a submerged combustion vaporizer (SMV) to remove nitric oxides(NOx) efficiently from flue gas of the SMV at liquefied natural gas (LNG) terminals. For this, excess oxygen is injectedinto exhaust gas that contains NOx from SMV burner. Then, the mixed gas spreads into a hydrogen peroxide solutionor water bath. We initially performed experiments of the modified system to estimate the effect of various process vari-ables (temperature, excess O2 concentration, pH of water, residence time of flue gas in water tank, and H2O2 concentra-tion) on NOx conversion, and developed a mathematical model of the system based on the experiment results. Lastly,we confirmed higher performance of the modified system and validated the feasibility for its field application.Keywords: deNOx, Modeling, Optimization, Submerged Combustion Vaporizer, Kinetic
INTRODUCTION
The exhaust gas discharged from combustion processes includesa variety of different types of air pollutants and hazardous com-pounds. In particular, nitrogen oxides (NOx=NO, NO2, N2O, N2O3,N2O4, N2O5) are well-known air pollutants. Among them, nitro-gen oxide and nitrogen dioxide are the most common nitrogenoxides in the atmosphere. Pollutants from power plants and indus-trial boilers are highly toxic for humans, and they participate inthe formation of photochemical smog. Furthermore, they are oneof the sources to produce particulate matters in the atmosphere.Thus, this research focuses on the control of NOx emission fromcombustion processes such as SMVs (submerged combustion vapor-izers) at LNG (liquefied natural gas) terminal.
Nitrogen oxides are mainly produced from combustion, with
power, heat engineering facilities and transporters are the major con-tributors of these pollutants. Table 1 illustrates the amount of nitro-gen emissions from various sources [1]. Note that total emissionsfrom industry have decreased over the past few years. NOx emis-sions from combustion in the energy and transformation indus-tries have substantially decreased. In addition, we are expecting thatNOx emission will decrease further thanks to combustion technol-ogy improvement. Furthermore, NOx regulations will be restrictedmore and more around the world to prevent NOx generation [2].For example, in Europe, EURO 6 has been implemented since2014 to reduce air contaminants discharged from vehicles. Simi-larly, pollutant load management for industrial fields, a proactivemethod to manage total emissions, has been conducted in SouthKorea. For these reasons, improvement of NOx reduction technol-ogy is vital to prepare for these restrictions in the near future.
Table 1. Emissions of nitrogen oxides in South Korea as NO2
Emission sources2003 2006 2009 2012
[t∙yr−1]Combustion in energy and transformation industries 396,070 364,310 143,274 169,346Non-industrial combustion plants 94,602 89,127 86,636 87,935Combustion in the manufacturing industry 123,221 101,197 159,511 172,761Production processes 53,664 56,577 41,409 59,002Road transport 472,245 450,080 368,048 345,666Other mobile sources and machinery 203,583 196,441 207,829 225,561Waste treatment and disposal 18,755 17,237 7,426 14,782Other sources and sinks - - 185 154Total 1,362,140 1,274,969 1,045,103 1,075,207

1620 J. Son et al.
June, 2017
water. ORVs are commonly utilized at LNG terminals to supplynatural gas. Meanwhile, SMV is used when the demand for natu-ral gas goes beyond the capacity of ORVs, or the production capac-ity is reduced by a low water temperature during the winter. Aportion of the NOx from the flue gas is absorbed into the water,and the rest is discharged to atmosphere.
In Korea, KOGAS (Korea Gas Corporation, headquartered inIncheon and Pyeongtaek, Korea) was recently classified as the first-class discharger since 2015 in accordance with a revised Clean AirConservation Act. Accordingly, NOx in the exhaust gas dischargedfrom the SMV is now regarded as one of major pollutants, whichhas been restricted by regulation. Therefore, we planned to miti-gate the discharged amount of NOx. The exhaust gas emitted fromSMV has a temperature range of 298 to 303 K. The operating tem-perature is too low to adopt post treatment technologies such asSCR or SNCR that require much higher temperature for activa-tion of reactions to remove NOx. In fact, there has not been muchrequirement in industry to remove NOx from flue gas at low-tem-perature for a large capacity, in particular using SMVs. Further-more, KOGAS has dozens of these SMVs at each field of LNGterminals. Thus, our research focused on developing a new tech-nology to remove NOx from the flue gas at low temperature withless capital investment to achieve economic feasibility.
After considering several technical alternatives and their eco-nomic feasibility, we devised a system to inject additional oxidants(oxygen, hydrogen oxide) into flue gas after combustion, and todistribute the flue gas at the bottom of a water bath as bubbles. Inthis way, NO can be converted to NO2 that is more soluble andabsorbed in water, diluted by H2O2 (Table 2). The pH of water be-comes lower due to generation of acids throughout the reaction.So, the acidity of water should be controlled to maximize the NOxremoval efficiency.
To prove the efficiency and find an optimum operating condi-tion of a newly developed system, we set the experiments at a smallscale. First, the oxidation of NO and absorption of NO2 in waterbath were conducted under various operating conditions, and theconcentration of NOx that was discharged from the bath was meas-ured. Secondly, the system was mathematically modeled based onthe experimental results, and the final NO conversions were pre-dicted based on different values of process variables (temperature,excess O2 concentration, pH of water, residence time of flue gas inwater tank, and H2O2 concentration). Lastly, the parameters of thereaction system were fitted to minimize the differences betweenthe experimental and calculated results to increase accuracy of themodel. The model allows us to evaluate a newly developed sys-
Numerous technologies have been developed to reduce NOxemissions, and they belong to one of three types: pre-treatment, com-bustion modification, and post-treatment process. Pre-treatment isa preventive technique that reduces NOx generation before com-bustion. The feed materials, such as fuel and oxidizer (includingnitrogen components), are treated to reduce NOx formation. Com-bustion modification minimizes NOx formation by modifying thecombustion process. Several methods, such as low NOx burners(LNB), low excess air (LEA), and flue gas recirculation (FGR), havebeen considered for the modification of the combustion process.However, these processes may reduce the thermal efficiency of thecombustion process and increase carbon monoxide formation. Thepost-treatment process reduces NOx from exhaust gases by usingcertain chemical and physical treatments, such as catalytic reduc-tion (selective catalytic reduction (SCR), selective non-catalytic reduc-tion (SNCR)), adsorption, and absorption. Although post-treatmentprocesses have higher NOx removal efficiency and productivity thanthe other NOx removal methods, they are capital-intensive, andthus require sufficient feasibility study for field applications.
Vaporizers, such as ORVs (open rack vaporizers) and SMVs, arenormally used to vaporize LNG to natural gas. SMVs use naturalgas as fuel for the burner, and the amount of NOx discharged fromthe SMV stack is currently restricted to 50ppm. Fig. 1 shows a sche-matic diagram of an SMV. The combustion gas is generated fromthe burner, which heats the water in the water bath. LNG is thenvaporized inside tubes through heat exchange from the heated
Fig. 1. Schematic diagram of a submerged combustion vaporizer(SMV) [3].
Table 2. Classification and characteristics of nitrogen oxides [4]Formula Name Nitrogen valence Physical properties Henry constantN2O Nitrous oxide 1 Colorless gas, water solubleNO Nitric oxide 2 Colorless gas, slightly water soluble KH=1.9×10⁻³ mol·atm−1
N2O3 Dinitrogen trioxide 3 Black solid, water soluble, decomposes in waterNO2 Nitrogen dioxide 4 Red-brown gas, very water soluble, decomposes in water KH=1.0×10⁻² mol·atm−1
N2O5 Dinitrogen pentoxide 5 White solid, decomposes in water
Technology development for the reduction of NOx in flue gas from a burner-type vaporizer and its application 1621
Korean J. Chem. Eng.(Vol. 34, No. 6)
tem more effectively in terms of economic feasibility, operabilityand potential scale-up issues.
RESEARCH METHODS
1. Experimental SettingThe configuration of experimental apparatus setting is shown in
Fig. 2. Feeds of O2 (99.5%), NO (0.1% NO, 99.9% N2) and N2
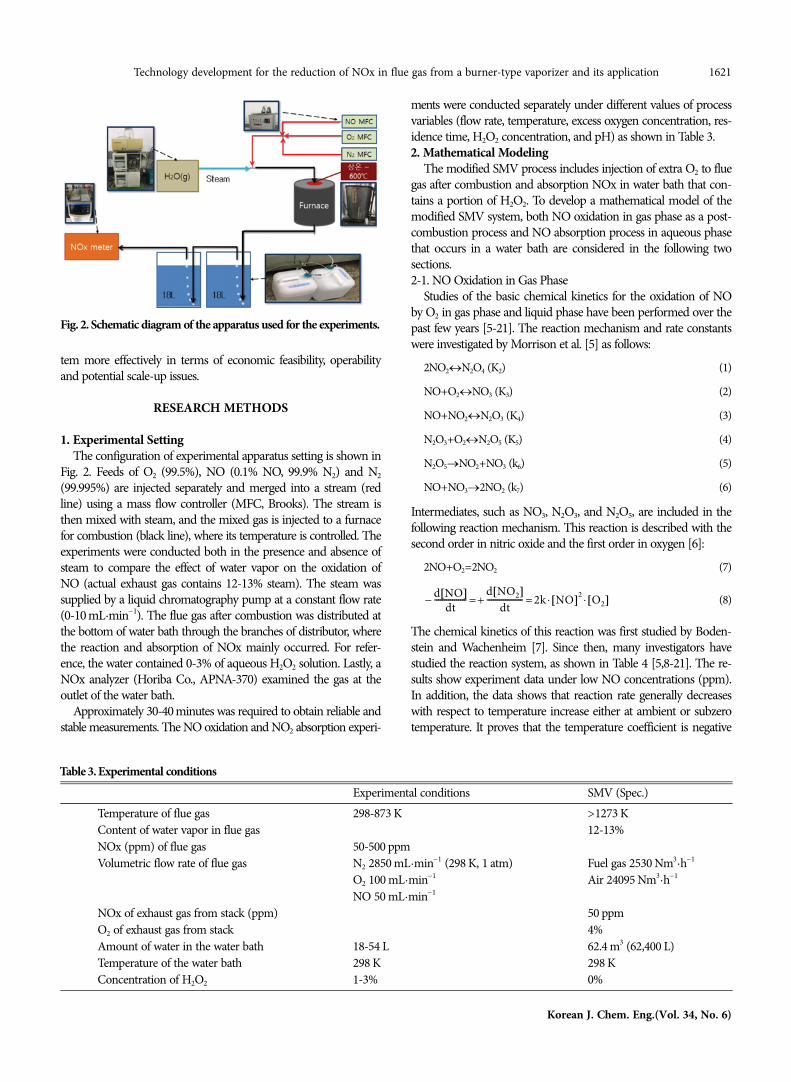
(99.995%) are injected separately and merged into a stream (redline) using a mass flow controller (MFC, Brooks). The stream isthen mixed with steam, and the mixed gas is injected to a furnacefor combustion (black line), where its temperature is controlled. Theexperiments were conducted both in the presence and absence ofsteam to compare the effect of water vapor on the oxidation ofNO (actual exhaust gas contains 12-13% steam). The steam wassupplied by a liquid chromatography pump at a constant flow rate(0-10 mL·min−1). The flue gas after combustion was distributed atthe bottom of water bath through the branches of distributor, wherethe reaction and absorption of NOx mainly occurred. For refer-ence, the water contained 0-3% of aqueous H2O2 solution. Lastly, aNOx analyzer (Horiba Co., APNA-370) examined the gas at theoutlet of the water bath.
Approximately 30-40 minutes was required to obtain reliable andstable measurements. The NO oxidation and NO2 absorption experi-
ments were conducted separately under different values of processvariables (flow rate, temperature, excess oxygen concentration, res-idence time, H2O2 concentration, and pH) as shown in Table 3.2. Mathematical Modeling
The modified SMV process includes injection of extra O2 to fluegas after combustion and absorption NOx in water bath that con-tains a portion of H2O2. To develop a mathematical model of themodified SMV system, both NO oxidation in gas phase as a post-combustion process and NO absorption process in aqueous phasethat occurs in a water bath are considered in the following twosections.2-1. NO Oxidation in Gas Phase
Studies of the basic chemical kinetics for the oxidation of NOby O2 in gas phase and liquid phase have been performed over thepast few years [5-21]. The reaction mechanism and rate constantswere investigated by Morrison et al. [5] as follows:
2NO2↔N2O4 (K2) (1)
NO+O2↔NO3 (K3) (2)
NO+NO2↔N2O3 (K4) (3)
N2O3+O2↔N2O5 (K5) (4)
N2O5→NO2+NO3 (k6) (5)
NO+NO3→2NO2 (k7) (6)
Intermediates, such as NO3, N2O3, and N2O5, are included in thefollowing reaction mechanism. This reaction is described with thesecond order in nitric oxide and the first order in oxygen [6]:
2NO+O2=2NO2 (7)
(8)
The chemical kinetics of this reaction was first studied by Boden-stein and Wachenheim [7]. Since then, many investigators havestudied the reaction system, as shown in Table 4 [5,8-21]. The re-sults show experiment data under low NO concentrations (ppm).In addition, the data shows that reaction rate generally decreaseswith respect to temperature increase either at ambient or subzerotemperature. It proves that the temperature coefficient is negative
− d NO[ ]
dt---------------- = +
d NO2[ ]dt
------------------ = 2k NO[ ]2 O2[ ]⋅ ⋅
Fig. 2. Schematic diagram of the apparatus used for the experiments.
Table 3. Experimental conditionsExperimental conditions SMV (Spec.)
Temperature of flue gas 298-873 K >1273 KContent of water vapor in flue gas 12-13%NOx (ppm) of flue gas 50-500 ppm Volumetric flow rate of flue gas N2 2850 mL·min−1 (298 K, 1 atm) Fuel gas 2530 Nm3·h−1
O2 100 mL·min−1 Air 24095 Nm3·h−1
NO 50 mL·min−1
NOx of exhaust gas from stack (ppm) 50 ppmO2 of exhaust gas from stack 4%Amount of water in the water bath 18-54 L 62.4 m3 (62,400 L)Temperature of the water bath 298 K 298 KConcentration of H2O2 1-3% 0%

1622 J. Son et al.
June, 2017
over a wide range of temperatures.The mechanism and kinetics derived by Morrison et al. [5]
were adopted to model the oxidation of NO in gas phase in thisresearch because the concentration of NOx discharged from theSMV was relatively low (approximately 50 ppm). The results fromthe kinetics were found to be very similar to those of other investi-gators.
It is assumed that reactions (1) to (4) are in rapid equilibrium,and (5) to (6) occur at a measurable rate. The intermediates (NO3,N2O3, and N2O5) were observed, and were postulated in previousstudies, supporting the validity of these reaction schemes. The rateexpression for the oxidation of NO derived from reactions (1) to(6) is shown on the paper by Morrison and coworkers [5]:
(9)
The concentration change with respect to time or conversion ofthe reaction can be calculated according to Eq. (9), where [NO],[NO2], and [O2] indicate the concentrations of each (mol·L−1). Therate is influenced by the concentration of NO2. K3, K4, and K5 arethe equilibrium constants, and k6 and k7 are the rate constants foreach reaction. The values for 2k7K3 and k6K4K5 are 1.313×10⁴
L2∙mol−2∙s−1 and 1.276×10⁴ L2∙mol−2∙s−1, respectively [5].In addition, the actual exhaust gas discharged from the SMV
contains methane, nitrogen, and water vapor; the effects of thesecomponents on the reaction of NO and O2 were investigated. How-ever, the rate constant was not affected by moisture or the othercomponents [6,7,9,18]. The water reacted with NO2, while waterdid not react with NO in absence of oxidant.2-2. NO Oxidation in Liquid Phase
The process of SMV has a very small residence time. Therefore,NO oxidation in liquid phase is more dominant than in gas phase.This reaction mechanism and kinetics were established as shownin Eqs. (10) and (11) by Pogrebnaya et al. [22]. The reaction of NOoxidation to NO2 in aqueous solution is expressed in the second
order with nitric oxide and the first order in oxygen. The kineticexpression is equal to that in gas phase, while its rate constant isabout 1,000 times faster than that in gas phase.
4NO+O2+2H2O→4H++4NO2− (10)
(11)
In this research, the detailed kinetic scheme proposed by Lewinand Deen [23] was used:
2NO+O2→2NO2(k1) (12)
NO+NO2↔N2O3(k2, k3) (13)
N2O3+H2O→2H++2NO2−(k4) (14)
The kinetic expressions based on the kinetic scheme are:
RNO=−2k1[NO]2[O2]−k2[NO][NO2]+k3[N2O3] (15)
RO2=−k1[NO]2[O2] (16)
R−
NO2=2k4[N2O3] (17)
where, Ri (i=NO, NO2, N2O3) is the volumetric rate of formationand [NO], [NO2], [O2], and [N2O3] indicate the concentrations ofeach component. According to Lewin and Deen [23], k1, k2, k3,and k4 in reaction schemes (12)-(14) are rate constants for each reac-
− d NO[ ]
dt---------------- = 2k7K3 NO[ ]2 O2[ ] + k6K4K5 NO[ ] NO2[ ] O2[ ]
d NO2−[ ]
dt------------------- = k1 NO[ ]2 O2[ ]⋅ ⋅
Table 4. Rate constants for the reaction 2NO+O2=2NO2 in gas phase [6]Reference [NO]0 (mol∙L−1) [O2]0 (mol∙L−1) Rate constant, k (L2∙mol−2∙s−1) Temperature (K)Morrison et al. [5] 9.0×10⁻⁸-3.1×10⁻⁶ 1.3×10⁻³-1.0×10⁻² 4.5×10³-1.1×10³ 290-311Bodenstein and Wachenheim [7] 4.5×10⁻⁴-8.0×10⁻⁴ 1.4×10⁻⁴-7.3×10⁻⁴ 4.5×10³-8.9×10³ 273-363Tipper and Williams [8] 5.5×10⁻⁴-5.5×10⁻³ 1.0×10⁻⁴-4.9×10⁻³ 1.6×10³-7.8×10³ 293-843Treacy and Daniele [9] 5.4×10⁻⁴ 2.7×10⁻⁴-1.1×10⁻³ 3.8×10³ 298Mahenc et al. [10] 4.0×10⁻⁴-1.0×10⁻³ 4.5×10⁻⁴-8.0×10⁻⁴ 5.4×10³-8.9×10³ [5.0×102×0339/T] 274-333Hisatsune and Zafonte [11] 3.1×10⁻⁴-1.4×10⁻² 4.5×10⁻⁴-8.0×10⁻⁴ 3.8×103×1081/T 277-329Olbregts [12] 9.0×10⁻⁵-1.2×10⁻³ 1.2×10⁻⁵-1.4×10⁻³ 3.0×10³-2.1×10⁴ [10(−.18+2.70log(T)+700/T)] 225-760Smith [13] 5.9×10⁻⁵-2.7×10⁻³ 1.7×10⁻⁴-1.4×10⁻³ 4.9×10³-7.4×10³ 298Cueto and Pryor [14] 3.9×10⁻⁵ 8.6×10⁻³ 6.7×10³ 296Brown and Crist [15] 1.1×10⁻⁶-6.8×10⁻⁶ 4.2×10⁻⁴-1.2×10⁻³ 6.8×10³-7.8×10³ 298Greig and Hall [16] 1.1×10⁻⁶-2.2×10⁻⁶ 2.7×10⁻⁵-1.3×10⁻² 6.8×10³-1.1×10³ 293-372Greig and Hall [17] 6.9×10⁻⁷-3.1×10⁻⁶ 7.4×10⁻³ 9.6×10³-1.1×10³ 293Aida et al. [18] 4.1×10⁻⁷-6.5×10⁻⁶ 8.3×10⁻³-4.0×10⁻² 7.3×10³-8.4×10³ 298-310Stedman and Niki [19] 2.0×10⁻⁷-4.1×10⁻⁵ 2.7×10⁻³-3.5×10⁻² 7.2×10³ 298Bufalini and Stephens [20] 1.3×10⁻⁷-8.1×10⁻⁷ 8.6×10⁻³ 9.0×10³ 299Glasson and Tuesday [21] 8.2×10⁻⁸-2.1×10⁻⁶ 8.2×10⁻⁴-2.5×10⁻² 6.0×10³- 8.5×10³ 296
Table 5. Rate constants for the reaction 2NO+O2=2NO2 in liquidphase [23]
Referencek1 (106 L2∙mol−2∙s−1) Eact
(kcal·mol−1)288 K 295-298 K 308-310 KPogrebnaya et al. [22] 1.9±0.1 2.2±0.1 −2.8Lewin et al. [23] 2.1±0.4 2.4±0.3 −2.0Wink et al. [24] 1.5±0.4 0.9±0.2 −6.5Awad et al. [25] 1.9 2.1 2.2 −1.0

Technology development for the reduction of NOx in flue gas from a burner-type vaporizer and its application 1623
Korean J. Chem. Eng.(Vol. 34, No. 6)
tion and are 2.1×10⁶ L2∙mol−2∙s−1, 1.1×10⁹ L∙mol−1∙s−l, 3.7×10⁴ s−1,and 0.03×k3, respectively. The values of k1 have been studied byother investigators, as shown in Table 5.
[NO2] and [N2O3] are expressed by the concentration of NO.Each component is present in a marginal amount; thus, the mass-balanced equation of the system can be illustrated as:
(18)
where, kG and AG are the mass transfer coefficient in liquid phaseand surface area, respectively, and mass transfer of NO and O2
across gas-liquid interface is expressed with (kGAG/V=7.3×10−4 s−1).[NO]* is the saturated nitric oxide concentration in equilibriumwith its gas phase concentration.
It is difficult to increase the removal efficiency of nitric oxide,which has a low solubility in wet process that uses water as themedium. For the removal of NOx from the exhaust gas dischargedfrom various stationary sources, such as power plants, steel pick-ling plants, or other plants that include combustion processes, sev-eral different solutions (sodium sulfite, sodium hypochlorite, hy-drogen peroxide) have been studied by investigators [26-29]. Theuse of H2O2 as a medium in the wet process was found to be suit-able for the SMV system with the withdrawal of nitric acid that isproduced from the process. In theory, H2O2 reacts with both nitricoxide and nitrogen dioxide to form nitrous acid and nitric acid.Nitric oxide has a low solubility and reactivity in water, and a rela-tively high solubility and reactivity in H2O2. The presence of H2O2
in the NOx absorption process could be beneficial to the oxida-tion system [29-31]:
2NO+2H2O2→2NO2+2H2O (19)
2NO2+H2O2→2HNO3 (20)
The overall reaction can be represented as:
2NO+3H2O2→2HNO3+2H2O (21)
The ratio of NO conversion or NO removal was estimated for eachexperiment by:
(22)
where, [NO]i and [NO]f are the initial and final concentrations ofthe system. All the experimental results were obtained after 30-40minutes after the system becomes stable.2-3. Modeling the Reaction System
As shown in Fig. 1, the water bath, where the reaction occurs, isa multiphase reactor to mix the gas-phase with the liquid-phase.In gas phase, the feed is injected, passes through the reactor, and isthen discharged; in liquid phase, there is no inlet and outlet, andaccumulation rate of NO of the system changes by the mass trans-fer and hydrodynamic effects. The equilibria between gas phaseand liquid phase in the system are exhibited in Fig. 3. There arevarious forms of NOx in each phase; the equilibria relationships areformed by the non-reactive partitioning of a solute, as describedby Henry’s law [32]. In this research, the modified SMV systemwas modeled as a PFR (plug flow reactor) that includes the masstransfer impact between gas and liquid phases.
After modeling the reaction system, the parameters were esti-mated using MATLAB software. Parameter estimation plays a sig-nificant role in modeling the behavior of a system mathematically.It is a process to augment the accuracy and reliability of the modelby minimizing the difference between the calculated and experi-mental values [33]. We used fifteen data sets to fit each reactionparameter, and each set was obtained at steady-state condition.The objective function, F, was used for optimization in this proce-dure, and is expressed as:
(23)
d NO[ ]dt
---------------- = − 4k1 NO[ ]2 O2[ ] + kGAG
V------------
⎝ ⎠⎛ ⎞
NONO[ ]* − NO[ ]( )
Conversion of NO %( ) = NO[ ]i − NO[ ]f
NO[ ]i---------------------------------- 100×
Fobj = Σi=1NrespΣj=1
Nexp yexp, i − ycal, i( )2
Fig. 3. Equilibria relating the gaseous and aqueous nitrogen oxides and oxyacids [32].
1624 J. Son et al.
June, 2017
where, yexp, i and ycal, i represent the experimental and calculated re-sults for component i for the jth experiment. Nresp and Nexp are thenumber of species in the system and experimental runs, respectively.
RESULTS AND DISCUSSION
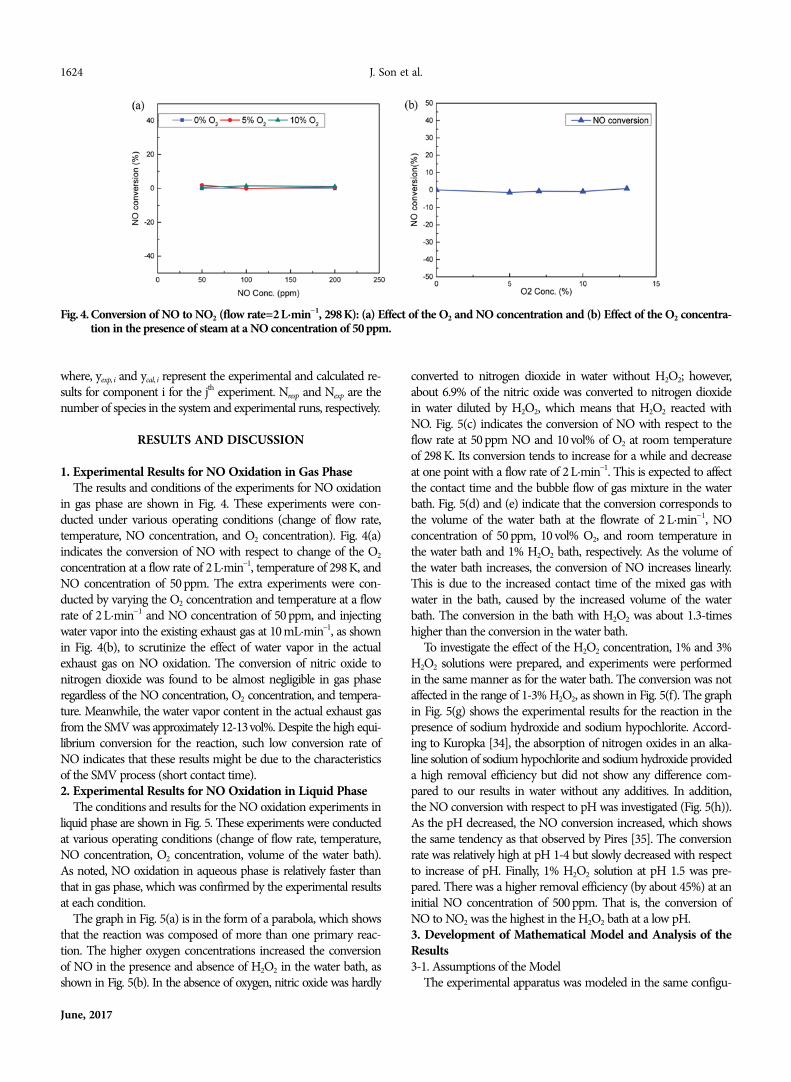
1. Experimental Results for NO Oxidation in Gas PhaseThe results and conditions of the experiments for NO oxidation
in gas phase are shown in Fig. 4. These experiments were con-ducted under various operating conditions (change of flow rate,temperature, NO concentration, and O2 concentration). Fig. 4(a)indicates the conversion of NO with respect to change of the O2
concentration at a flow rate of 2 L·min−1, temperature of 298 K, andNO concentration of 50 ppm. The extra experiments were con-ducted by varying the O2 concentration and temperature at a flowrate of 2 L·min−1 and NO concentration of 50 ppm, and injectingwater vapor into the existing exhaust gas at 10 mL·min−1, as shownin Fig. 4(b), to scrutinize the effect of water vapor in the actualexhaust gas on NO oxidation. The conversion of nitric oxide tonitrogen dioxide was found to be almost negligible in gas phaseregardless of the NO concentration, O2 concentration, and tempera-ture. Meanwhile, the water vapor content in the actual exhaust gasfrom the SMV was approximately 12-13vol%. Despite the high equi-librium conversion for the reaction, such low conversion rate ofNO indicates that these results might be due to the characteristicsof the SMV process (short contact time).2. Experimental Results for NO Oxidation in Liquid Phase
The conditions and results for the NO oxidation experiments inliquid phase are shown in Fig. 5. These experiments were conductedat various operating conditions (change of flow rate, temperature,NO concentration, O2 concentration, volume of the water bath).As noted, NO oxidation in aqueous phase is relatively faster thanthat in gas phase, which was confirmed by the experimental resultsat each condition.
The graph in Fig. 5(a) is in the form of a parabola, which showsthat the reaction was composed of more than one primary reac-tion. The higher oxygen concentrations increased the conversionof NO in the presence and absence of H2O2 in the water bath, asshown in Fig. 5(b). In the absence of oxygen, nitric oxide was hardly
converted to nitrogen dioxide in water without H2O2; however,about 6.9% of the nitric oxide was converted to nitrogen dioxidein water diluted by H2O2, which means that H2O2 reacted withNO. Fig. 5(c) indicates the conversion of NO with respect to theflow rate at 50 ppm NO and 10 vol% of O2 at room temperatureof 298 K. Its conversion tends to increase for a while and decreaseat one point with a flow rate of 2 L·min−1. This is expected to affectthe contact time and the bubble flow of gas mixture in the waterbath. Fig. 5(d) and (e) indicate that the conversion corresponds tothe volume of the water bath at the flowrate of 2 L·min−1, NOconcentration of 50 ppm, 10 vol% O2, and room temperature inthe water bath and 1% H2O2 bath, respectively. As the volume ofthe water bath increases, the conversion of NO increases linearly.This is due to the increased contact time of the mixed gas withwater in the bath, caused by the increased volume of the waterbath. The conversion in the bath with H2O2 was about 1.3-timeshigher than the conversion in the water bath.
To investigate the effect of the H2O2 concentration, 1% and 3%H2O2 solutions were prepared, and experiments were performedin the same manner as for the water bath. The conversion was notaffected in the range of 1-3% H2O2, as shown in Fig. 5(f). The graphin Fig. 5(g) shows the experimental results for the reaction in thepresence of sodium hydroxide and sodium hypochlorite. Accord-ing to Kuropka [34], the absorption of nitrogen oxides in an alka-line solution of sodium hypochlorite and sodium hydroxide provideda high removal efficiency but did not show any difference com-pared to our results in water without any additives. In addition,the NO conversion with respect to pH was investigated (Fig. 5(h)).As the pH decreased, the NO conversion increased, which showsthe same tendency as that observed by Pires [35]. The conversionrate was relatively high at pH 1-4 but slowly decreased with respectto increase of pH. Finally, 1% H2O2 solution at pH 1.5 was pre-pared. There was a higher removal efficiency (by about 45%) at aninitial NO concentration of 500 ppm. That is, the conversion ofNO to NO2 was the highest in the H2O2 bath at a low pH.3. Development of Mathematical Model and Analysis of theResults3-1. Assumptions of the Model
The experimental apparatus was modeled in the same configu-
Fig. 4. Conversion of NO to NO2 (flow rate=2 L·min−1, 298 K): (a) Effect of the O2 and NO concentration and (b) Effect of the O2 concentra-tion in the presence of steam at a NO concentration of 50 ppm.

Technology development for the reduction of NOx in flue gas from a burner-type vaporizer and its application 1625
Korean J. Chem. Eng.(Vol. 34, No. 6)
Fig.5.Absorption ratio of NO (298K): (a) Effect of the NO concentration with water and H2O2 at a flow rate of 2 L·min−1 and 10 vol% O2, (b)Effect of the O2 concentration with water and H2O2 at a flow rate of 2 L·min−1 and 50 ppm NO, (c) Effect of the flow rate with waterand H2O2 at a 50ppm NO and 10vol% O2, (d) Effect of the water bath volume and NO concentration at a flow rate of 2 L·min−1 and10 vol% O2, (e) Effect of the H2O2 bath volume and NO concentration at a flow rate of 2 L·min−1 and 10 vol% O2, (f) Effect of the H2O2concentration and O2 concentration at a flow rate of 2 L·min−1 and 50 ppm NO, (g) Effect of the O2 concentration with sodium hypo-chlorite and sodium hydroxide at a flow rate of 2 L·min−1 and 50 ppm NO, and (h) Effect of the pH and NO concentration at a flowrate of 2 L·min−1 and 10 vol% O2.

1626 J. Son et al.
June, 2017
ration as that in the SMV reaction system. The modeling was per-formed to verify the feasibility of this approach for field applications.Several assumptions were applied: (i) the radial flow was consid-ered to be marginal, (ii) the Zeldovich mechanism for thermalNOx formation was ignored, (iii) the post-combustion NO con-centration was 50 ppm, (iv) the effect of pressure was excluded, (v)the amount by which the combustion process heated the waterwas the same as the heat of vaporization for the LNG processes,and (vi) the temperature of the water bath was constant.3-2. Modeling Results for NO Oxidation
NO oxidation to NO2 in gas phase is described as the secondorder in nitric oxide and the first order in oxygen. The reactionrate decreases as the temperature increases. Eq. (9), which is basedon the kinetics of the reaction mechanism that includes NO3, N2O3,and N2O5 as intermediates, was used to model the system. Theconversion of NO was predicted at various operating conditions(of concentration of O2, concentration of NO, and the flow rate).However, the effects of various conditions on the reaction of thegas remained as almost 0% as described earlier. These results havea different tendency from NO oxidation at equilibrium conditions.The reaction rate decreased if the initial concentration of NO waslow because of the reaction orders. These results are reasonablebecause the SMV system has a short residence time. In addition,the kinetics and mechanism in the presence of steam were investi-gated, and the results also showed no further impacts on the reac-tion, which is the same as the experimental results.
NO oxidation in aqueous phase is described in the second orderwith respect to nitric oxide and the first order with respect to oxy-gen. The rate constant for the oxidation of nitric oxide in liquidphase is about 1,000 times higher than that in gas phase. The kinet-
ics of the reaction mechanism that includes NO2, HNO2, and NO3
as intermediates (Eqs. (15) to (18)) was indicated in Eq. (24). Inthe mathematical model, the concentrations of NO2 and N2O3 areexpressed as the concentration of NO:
(24)
The results of the experiments and modeling of the liquid NOoxidation reaction are compared in Fig. 6. The NO conversion in-creased with respect to the oxygen concentration, while the NOconversion decreased when the flow rate was reduced. The experi-mental results showed that the NO conversion increased by 17%in an oxygen range of 0-13%, flow rate of 1-3 L·min−1, and vol-ume of 18-54 L, which was consistent with the modeling results.However, when additional air or oxygen only was injected, an insig-nificant NOx conversion rate was expected for the application toSMV. According to the experimental and modeling results, therewas no substantial change in the NOx conversion at oxygen con-centrations of 10% or more when the O2 concentration was in-creased. An additional method was required for a large reductioncompared to the existing NOx conversion because the oxygencontent in the exhaust gas that was discharged from the stack inthe SMV was about 4%.
The injection of H2O2 into the solution accelerated the NO oxi-dation reaction, which increased the conversion. The oxidationreaction of NO by H2O2 was shown in the first order with respectto both NO and H2O2, and the second order in overall [36]. How-ever, Thomas et al. [37] indicated that this reaction is shown in
d NO[ ]dt
---------------- = − 2k1 NO[ ]2 O2[ ] − k2 NO[ ] NO2[ ] + k3 N2O3[ ]
− kGAG
V------------
⎝ ⎠⎛ ⎞
NONO[ ]* − NO[ ]( )
Fig. 6. Effect of oxygen concentration, flow rate, and volume of the bath in the aqueous phase.

Technology development for the reduction of NOx in flue gas from a burner-type vaporizer and its application 1627
Korean J. Chem. Eng.(Vol. 34, No. 6)
to other algorithms [39]. This method might not be proper to finda global minimum point because the objective functions mighthave several local optimum points. However, we restricted the oper-ating conditions of the model to meet the condition for field appli-cations. Therefore, the Levenberg-Marquardt algorithm was con-sidered to be appropriate enough to evaluate the validity and param-eters with good initial values.
Table 6 shows the estimated parameters, from which the initialvalues were obtained in the section “Mathematical Modeling.” Theresults of the parameter estimation did not deviate significantlyfrom the literature. Parity plots were drawn using MATLAB tocompare the estimated parameters with the initial values (Fig. 7).The experimental results were more consistent with the predictedresults for the data shown in Fig. 7(b) than that in Fig. 7(a), whichsupports the validity of the parameter estimation. Lastly, the ten-dency for NO oxidation under various operating conditions isshown in Fig. 8. It shows the final modeling results for liquid-phasereaction with respect to the O2 concentration, volume of the bath,flow rate (gas velocity), H2O2 concentration, and pH value. It isillustrated as 3D diagrams for understanding, which has the sametendency as the results of Fig. 6. The graphs of Fig. 8(a) and (b)show the NO conversion with respect to the volume of the bathand flow rate, and to the O2 concentration and flow rate, respec-tively. The NO conversion with respect to the pH value and H2O2
concentration of the bath is exhibited in Fig. 8(c). These are moreconsistent with the experimental results than the before parame-
zero order with respect to the concentration of H2O2 in solutionscontaining a small amount of H2O2. In this work, the reaction wasalso considered in zero order with H2O2. The results of the experi-ments and modeling of the oxidation reaction of NO in the pres-ence of H2O2 are compared in Fig. 6. The NO oxidation in thepresence of H2O2 showed a higher conversion of NO than in thepresence of water. However, there was no conversion difference forthe 1% and 3% H2O2 baths at the same volume, flow rate, and O2
concentration.The predicted and experimental results differ with respect to
the effect of the flow rate within a certain range of flowrate (i.e.<1L/min) because of the formation of larger bubbles and the coales-cence of bubbles caused in the system. The low flow rate increasedthe residence time but decreased the gas-liquid interfacial area[38]. Additional modifications reflecting the flow model might berequired, but have not been considered in this research because suchlow flowrate is generally not considered for actual SMV operation.3-3. Results of Parameter Estimation
The MATLAB optimization tool was used (Table 6 and Fig. 7)to yield optimal parameters for the kinetic model. It is a nonlinearproblem; thus, the optimization was performed with the fsolve func-tion of the optimization tool, which is nonlinear system solver. Thefsolve function has three algorithms for optimization: trust region dog-leg, trust region reflective, and Levenberg-Marquardt. The Leven-berg-Marquardt algorithm was used because it has a greater stabilityand provides prompt results to find the optimal value compared
Table 6. Parameter estimation results for modelingParameter Value Unit Parameter Value UnitK3, g 3.480E-04 L∙mol−1 (kGAG/V)NO 1.000E-03 s−1
K4, g 1.240E+01 L∙mol−1 (kGAG/V)O2 1.000E-03 s−1
K5, g 1.660E+05 L∙mol−1 kH2O2 4.650E-02 s−1
k6, g 6.200E-03 s−1 k (pH 1.5) 6.720E+06 L2∙mol−2∙s−1
k7, g 2.960E+07 L∙mol−1∙s−1 k (pH 3) 6.063E+06 L2∙mol−2∙s−1
k1, l 2.284E+06 L2∙mol−2∙s−1 k (pH 7) 2.284E+06 L2∙mol−2∙s−1
k2, l 1.077E+09 L∙mol−1∙s−l k (pH 12) 2.247E+06 L2∙mol−2∙s−1
k3, l 3.700E+04 s−1
k4, l 1.110E+03 s−1
Fig. 7. Parity plots: (a) Initial values and (b) Estimated values.

1628 J. Son et al.
June, 2017
ter estimation. Therefore, the model results are reliable enough topredict the properties of the system.
CONCLUSION
We developed a new method to reduce NOx from the SMV fluegas further with minimum modification of the existing system. Forthis, reaction mechanism and kinetics were investigated throughexperiment, and a mathematical model of the system was devel-oped based on the experiment results in this research.
For the oxidation of NO to NO2, we conducted two separateexperiments in gas and aqueous phases. In gas phase, nitric oxideis rarely converted to NO2, regardless of the operating conditions(e.g., presence of water vapor, temperature, flow rate, and initialconcentrations of NO and O2). Even though the NO oxidation reac-tion has a high equilibrium conversion, it is considered that thisresult comes from the short residence time and the reduction ofthe reaction rate by a small amount of NO. We found that in thissystem, injecting additional oxygen and air to the exhaust gas, dis-charged from the burner, did not have a significant effect on NOxremoval.
In the absorption experiments, namely, the liquid-phase reactionof NO, the following aspects were observed.
• The experimental results exhibited a tendency to increase theNO conversion as the flow rate was reduced, or the initial concen-tration of NO or O2 was increased.
• At oxygen concentrations of 10% or greater, the NO conver-sion did not change significantly with increasing oxygen concen-trations. There are expected economic and efficiency limitations ifadditional NO conversion is required by injecting only additionalair or oxygen into the system.
• The conversion of NO in the H2O2 bath was approximately1.3-times higher than that in the water bath without H2O2. In par-ticular, the NO was partially converted to NO2 in the H2O2 bath inthe absence of oxygen, which shows that H2O2 reacts directly withnitric oxide. There was little change in the conversion of NO inthe water bath in the presence of ≥10% O2, and the conversionrate increased relatively linearly when the oxygen concentrationincreased in the H2O2 bath.
• The experimental results for the effects of pH indicated that ahigh conversion occurred at low pH. A low pH in the H2O2 bathincreased the NO conversion by up to 23% at a NO concentra-
Fig. 8. (a) Effect of the gas velocity and volume of the bath, (b) Effect of the gas velocity and O2 concentration, and (c) Effect of the pH andH2O2 concentration.
Technology development for the reduction of NOx in flue gas from a burner-type vaporizer and its application 1629
Korean J. Chem. Eng.(Vol. 34, No. 6)
tion of 50 ppm.The modeling results for the liquid-phase reaction also indicated
that the NO conversions in the water bath and H2O2 bath increasedwith respect to the O2 concentration and volume of the bath, butthe conversion decreased with respect to the flow rate. For thechange of flowrate, the modeling results deviated from the experi-mental results in the range of low flow rate because of the effect ofbubbles. However, such low flowrate is not applicable to field applica-tions because it must not lose its function as a heat exchanger. Forthis reason, the modeling results are reliable enough to predict thefinal NOx amount from the SMV system. This model was estab-lished based on the mechanisms and kinetics from the literature,enabling prediction of the actual experimental system. In addi-tion, parameters of the model were adjusted to achieve high accu-racy of the simulation results. For the optimization algorithm, weadopted the Levenberg-Marquardt in the research.
Based on the experimental and modeling results, the feasibilityand availability for field applications were examined prior to thedemonstration study of an actual SMV by injecting additional airor oxygen into the system, using a 1-3% H2O2 solution bath insteadof a conventional water bath, and controlling the pH. This approachcan be directly used without significant changes to the operatingconditions of the existing SMV system, which makes it possible todeal with the strict environmental regulations for NOx, dischargedfrom the stack while not losing its inherent function as a heat ex-changer. In this regard, the modified process can be easily applica-ble to field without high economic burdens, including additionalcapital and operating costs.
ACKNOWLEDGEMENTS
This work was supported by Korea Gas Corporation and a re-search project of the Development of Integrated Interactive Modelfor Subsea and Topside System to Evaluate the Process Design ofOffshore Platform, funded by the Ministry of Trade (project No.10060099).
REFERENCES
1. NIER, National Air Pollutants Emission 2012, 11-1480523-002293-01, Ministry of Environment, Korea (2012).
2. Z. Guan, J. Ren, D. Chen, L. Hong, F. Li, D. Wang, Y. Ouyang andY. Gao, Korean J. Chem. Eng., 33, 3102 (2016).
3. S. Egashira, Kobelco Technol. Rev., 32, 64 (2013).4. K. Lee, Appl. Chem. Eng., 21, 243 (2010).5. M. E. Morrison, R. G. Rinker and W. H. Corcoran, Ind. Eng. Chem.
Fundam., 5, 175 (1966).
6. H. Tsukahara, T. Ishida and M. Mayumi., Nitric Oxide, 3, 191 (1999).7. M. Bodenstein and L. Wachenheim, Z. Elektrochem., 24, 183 (1918).8. C.F.H. Tipper and R.K. Williams, Trans. Faraday Soc., 57, 79 (1961).9. J. C. Treacy and F. Daniels, J. Am. Chem. Soc., 77, 2033 (1955).
10. J. Mahenc, G. Clot and R. Bes, Bull. Soc. Chim. Fr., 5, 1578 (1971).11. I. C. Hisatsune and L. Zafonte, J. Phys. Chem., 73, 2980 (1969).12. J. Olbregts, Int. J. Chem. Kinet., 17, 835 (1985).13. J. H. Smith, J. Am. Chem. Soc., 65, 74 (1943).14. R. Cueto and W. A. Pryor, Vib. Spectrosc., 7, 97 (1994).15. F. B. Brown and R. H. Crist, J. Chem. Phys., 9, 840 (1941).16. J. D. Greig and P. G. Hall, Trans. Faraday. Soc., 63, 655 (1967).17. J. D. Greig and P. G. Hall, Trans. Faraday. Soc., 62, 652 (1966).18. A. Aida, K. Miyamoto, S. Saito, T. Nakano, M. Nishimura, Y.
Kawakami, Y. Omori, S. Ando, T. Ichida and Y. Ishibe, Nihon KyobuShikkan Gakkai Zasshi, 33, 306 (1995).
19. D. H. Stedman and H. Niki, J. Phys. Chem., 77, 2604 (1973).20. J. J. Bufalini and E. R. Stephens, Int. J. Air Water. Poll., 9, 123 (1965).21. W. A. Glasson and C. S. Tuesday, J. Am. Chem. Soc., 85, 2901 (1963).22. V. L. Pogrebnaya, A. P. Usov, A. V. Baranov, A. I. Nesterenko and
P. I. Bez’yazychnyi, Zh. Prikl. Khim., 48, 954 (1975).23. R. S. Lewis and W. M. Deen, Chem. Res. Toxicol., 7, 568 (1994).24. D. A. Wink, J. F. Darbyshire, R. W. Nims, J. E. Saavedra and P. C.
Ford, Chem. Res. Toxicol., 6, 23 (1993).25. H. H. Awad and D. M. Stanbury, Int. J. Chem. Kinet., 25, 375 (1993).26. X. L. Long, Z. L. Xin, M. B. Chen, W. Li, W. D. Xiao and W. K.
Yuan, Sep. Purif. Technol., 58, 328 (2008).27. D. S. Jin, B. R. Deshwal, Y. S. Park and H. K. Lee, J. Hazard. Mater.
B, 135, 412 (2006).28. J. M. Kasper, C. A. Clausen III and C. D. Cooper, J. Air Waste Man-
age. Assoc., 46, 127 (1996).29. A. D. Bhanarkar, R. K. Gupta, R. B. Biniwale and S. M. Tamhane,
Int. J. Environ. Sci. Technol., 11, 1537 (2014).30. D. Thomas and J. Vanderschuren, Ind. Eng. Chem. Res., 36, 3315
(1997).31. D. Thomas and J. Vanderschuren, Sep. Purif. Technol., 18, 37 (1999).32. S. E. Schwartz and W. H. White, Adv. Environ. Sci. Eng., 4, 1 (1981).33. S. Park, Y. Lee, G. Kim and S. Hwang, Korean J. Chem. Eng., 33,
3417 (2016).34. J. Kuropka, Environ. Prot. Eng., 37, 13 (2011).35. M. Pires, M. J. Rossi and D. S. Ross, Int. J. Chem. Kinet., 26, 1207
(1994).36. K. K. Baveja, D. S. Rao and M. K. Sarkar, J. Chem. Eng. Jpn., 12, 322
(1979).37. D. Thomas and J. Vanderschuren, Chem. Eng. Sci., 51, 2649 (1996).38. T. Wang and J. Wang, Chem. Eng. Sci., 62, 7107 (2007).39. H. Lee, S. Lee, S. Hwang and D. Jin, Korean Chem. Eng. Res., 54,
340 (2016).