technique polytechnic institute
TRANSCRIPT

TECHNIQUE POLYTECHNIC
INSTITUTE
Panchrokhi, Sugandhya, Hooghly

Compass 2018 Technique Polytechnic Institute, Hooghly
Board of Editors
Mr. B. G. Dey, Lecturer, Technique Polytechnic Institute
Mr. S. Polley, Technical Assistant, Technique Polytechnic Institute
Faculty members of Survey Engineering Deptt.
Mr. H. Bakshi, Lecturer, Technique Polytechnic Institute
Mr. Kausik Patra, Lecturer, Technique Polytechnic Institute
Mr. B. G. Dey, Lecturer, Technique Polytechnic Institute
Mr. M. K. Mondal, Technical Assistant, Technique Polytechnic Institute
Mr. S. Polley, Technical Assistant, Technique Polytechnic Institute
Our Sincere Thanks to
Mr. T. K. Saha, Chairman, Governing Body, Technique Polytechnic Institute
Mr. S. N. Basu, Executive Director, Technique Polytechnic Institute
Prof. A. Chakraborty, Principal, Technique Polytechnic Institute
Mr. P. S. Bhattacharya, Coordinator, Technique Polytechnic Institute
PUBISHER
Department of Survey Engineering.
Technique Polytechnic Institute, Hooghly

Compass 2018 Technique Polytechnic Institute, Hooghly
EDITORIAL
The idea of the magazine being published by our department is
gradually proving out to be the best thing since sliced bread. The
faculties and technical assistants are getting engrossed and their
partaking has amplified. Initially we thought it might happen that we
are trying to bite off more than we can chew. Fortunately we are proved
erroneous. One of the prime flair is that they are getting the basic idea
to write paper. It is an attempt which will positively instill the art of
observation in them.
Survey is one of the old engineering subjects. In the field of industry
people cannot move without survey work. Hope this technical magazine
of the department will enrich it through their valuable writings. This
will also highlight the industry-institute-interaction program.

Compass 2018 Technique Polytechnic Institute, Hooghly
CONTENTS
1. Special Maps, Graphs and Diagrams Used in Cartography - 01
2. Hydroponics - 08
3. Topographic Surveying - 14
4. A look at India’s e-waste regulations and
what you can do to manage your e-waste - 18
5. Floating Concrete - 22

Compass 2018 Technique Polytechnic Institute, Hooghly
Page No. 01
SPECIAL MAPS, GRAPHS AND
DIAGRAMS USED IN
CARTOGRAPHY
Increasingly it is appreciated that out of the five
sense organs for acquisition of knowledge the
visual method contributes the maximum
towards that end. The successful harnessing of
visual language in symbology adopted for
mapping to impart effortlessly gainful
knowledge to engineers, geographers and
geologists, foresters and revenue officials, has
attracted attention of many disciplines (sciences
and humanities) to make its use. The vital data
for their basic use is focused in a frame for
visual assimilation through design, drawing,
survey and reproduction. Even newspapers and
magazines are using the Technique.
In such cases angles, distances, directions
and even areas have less and less relevance.
Only relevant factor may be land boundary.
In some cases even the latter may also be
dispensed with and the globe or a part
thereof may be the focus of attention.
Because the emphasis of study may not be
land but natural elements like wind,
pressure, temperature etc. or items like
population, crops, industrial production and
growth etc. Naturally then, in such cases
even a projection may not be necessary.
Inspite of the aforesaid dispensations the
work may remain a cartographic feat called
thematic cartography. The writer envisions
that erelong cartography will occupy
revered place as the easiest and most
effective way of comprehensions of
statistical knowledge.
THE BASIS OF THEMATIC
CARTOGRAPHY
The basis in most if not invariable cases is
statistical data, It may be depiction of
climate like seasonal wind velocities with
direction, rainfall dispersion, temperature
distribution; or it may be depiction of
economic studies like agricultural statistics,
industrial data, transport and
communication net, income standards; Or
social studies for population distribution,
sex and age or ethnic or occupation figures,
education contents etc. mortality and
morbidity rates; settlements groupings,
housing patterns; scientific depictions of
soils; shales and crusts, meteorological data.
Various kinds of symbols for their
communications are used like dots, lines,
patterns and designs, bars and columns
pictures and colours, wheels and divided
circles etc. These may be shown in the
concerned area on the map or otherwise.
SYMBOLOGY
For such wide and varied depiction the
symbols can be limitless conditioned only
by the flight of imagination of the
cartographer. Some symbols in frequent use
are given below. Main thing to be
remembered is that choice of symbol may
also include a psychological impact on
mind. Symbol shall tell its tale fully and
well. Legibility to be main caution, better
show one type on one map without
unwanted details or names.
1) Dots: Very useful and easy to draw to
show numerically quantities unevenly
spread in an area. The range of such
quantities (i.e. highest—lowest) shall be
known to assign such value to one dot
that they shall neither be so dense that
they could not be counted nor so rare
that in a large area only one or two small
dots appear. Suppose we depict growth
of mechanised farming in UP district-

Compass 2018 Technique Polytechnic Institute, Hooghly
Page No. 02
wise. In this Meerut has 500 units,
Etawah 100 and Gazipur only 20, then
giving one dot for 10 units we have 50
for Meerut, 10 for Etawah and 2 for
Gazipur. The location could also be
retained on map like the Tehsil in the
district having more units should get
denser dots.
Even variety in dot size, shape and colour
can bring distinction, e.g. production of
food grains say wheat, rice, different kinds
of pulses are to be shown. If we show wheat
by round dot, rice by a triangle and three
kinds of pulses by squares in three different
colours or different pattern like one solid
filled, other inside blank third half-filled etc.
thus colours, and/or shapes bring variety.
Sizes in drawing should be so selected as to
avoid becoming too tiny on reduction or too
clumsy on enlargement.
2) Proportional Symbols: Symbols like
circles, spheres, squares rectangles,
cubes, bars can be used to show
quantities. It is good to represent data
meaning area by symbols which show
area like circle, square etc., and those
representing volume could be shown by
cubes, spheres etc. For example, say
U.P.'s area is X sq. km of which a, b, c,
d sq. km are respectively used as
agriculture, forests, waterlogged, barren
Then a circle with radius V x will show
total area on some suitably chosen scale.
Now if x sq km is placed in 360° around
the centre of the circle then, a, b, c & d
will take
(a/b) x 360° or [(b/x), (c/x), (d/x)]/360°
These segments can accordingly be drawn.
Similarly, suppose population of Calcutta x
lakh, Bombay, y; Delhi, z; etc. then we can
show by spheres by taking cube-roots of x,
y and z. These can be drawn on the map in
their proper location on suitable scale,
which shall match well with scale of map.
Again volume of trade from different cities
or countries is to be represented, then cubes
may be better choice.
3) Isopleths: (Iso= same; plethos=
multitude) lines joining points having
same numerical value. The most
important example is a contour line.
Such lines joining same temperature is
called isotherm: same pressure; isobar,
same magnetic declination, isogons,
rainfall, isohyets; sea-depths, isobaths.
The regions between consecutive isopleths
can be tinted with colours going from light
for lowest value to darkest for the highest
value. Here geographers may show
vegetation belts depending on height above
MSL or Subsoil water content etc.
4) Choropleths: Quantitative areal
distribution can best be shown by this
method. If such distribution be
contiguous the way is still more
effective. Areas for each type of
distribution can be shown by different
colours using light for lower quantity
and going darker for increasing values.
Instead of colour patterns of lines
(horizontal, verticals, slanting, grills etc.
with denser and rarer patterns for high to
low quantities, can be used.
For example physical features of a country
could be shown by light colour for one
height belt near M.S.L., and darkest for a
belt of snow line etc. or areas of soil quality
like sand, alluvial, forest covered, hilly etc.
can be shown in different colour or pattern.
5) Pictorial: These can be classed in two
viz.
a) A picture of the item depicted e.g.
production of cars, coal, milk, food

Compass 2018 Technique Polytechnic Institute, Hooghly
Page No. 03
grains can be shown by a picture of
car representing a number, or a coal
or food-grain bag or a milk bottle
similarly shown. Now if we make
comparison of production in each
five year block since independence
say 500, 2000, 8000, etc. units of
production, we make 1000 units as
one picture (car or bag) and block of
years shown on. Horizontal
direction. This in first block half
picture, second two, third eight. The
unit should be so chosen that the
final or last depiction may not
become unwieldy or too large,
shown as radii from origin.
b) Other pictorial methods include
i) Star used for depiction of vector
quantities like wind (direction,
velocity etc.) or trade flow,
population migration, etc. These
are also called clock vector or
rose diagrams. They are on
proper place on map.
ii) Columns or Bars: Consist of
columns or bars drawn
proportional in length to the
represented quantities. They can
be drawn horizontal or vertical
depending on convenience and
effective impact. They could be
simple i.e. each bar showing a
total value or compound when,
constituents in total are shown.
For example, a country's total
food produce is 10 m. tonnes of
which 40% wheat, 30% rice,
20% pulses and 10% others.
Thus a 10 cm bar or column
shown as 4 cm in one way, 3 cm
in another and so on to represent
wheat, rice etc. A bar of this kind
can be made a little broader to
accommodate pattern (lines, grill
or dots) and also percentage
numbers of produce inside. Such
diagrams are called divided
rectangles.
iii) Bars become very handy in
showing comparative production
figures in blocks of years or
expenditures in items, e.g.
comparing production of coal,
iron ore, steel in each five year
plan of India. For four plans a
compound bar three columns
each proportional to quantities,
say coal 500 tonnes (5 cm
black). Iron ore 200 tonnes (line
shaded 2 cm) Steel 100 tonnes (1
cm white or blank). Similarly for
the other 3 plans. The patterns
like black for coal well-chosen
also add to understanding.
Similar comparison of
production level and expenditure
can be drawn, say Iron produced
500 tonnes and consumed 800
will have a compound bar say 5
cm while joined to 8 cm black. It
gives a good comparative view.
iv) Divided Circles (also called
wheel or pie graphs): Like
divided rectangles circle gives
greater perceptual impact. Here
the division is in sectors
proportional to quantities
represented. As in the example
of food grains the 360° will
represent total produce then how
many degrees sector will be for
wheat, rice, maize etc. will be
worked out and drawn. This sort
of drawing helps in scale
expanding in one direction. Say
produce 5000 m tons having
2500 m ton wheat, 1250 m ton
rice then in the circle we colour
2500/5000 X 360° =180° wheat,
similarly 90° rice portions etc.

Compass 2018 Technique Polytechnic Institute, Hooghly
Page No. 04
There may be a real representation
and sometimes comparative too, e.g. say
in 18 states, in India we total cultivable
land and division of such land under
different important crops. Take for
example U.P. and Rajasthan total
respective figures.
State U.P. Rajasthan
Wheat 4900 ha 100 ha
Maize 2500 ha 400 ha
Gram 1600 ha 100 ha
Other 1000 ha 300 ha
Total
cultivation 10000 ha 900 ha
If the full area of circle shows area
of cultivation, then in πr2 the area of
circle, π will in each case be common. It
is r3 which will vary. Therefore the
quantity could go proportional to r2.
Hence for U.P. the radius of circle will
be square-root i.e. 100 units and for
Rajasthan 30 units. These again could be
scaled to fit well the scale of base map,
and such that circle comes in most cases
within the area of the state. Here we
could take a circle of 1 cm and 0.3 cm
radius. These will further be divided in 4
parts proportional to produce, and each
distinguished by pattern or colour, such
symbols are good for statistics related to
area.
v) Cubes and spheres: They are
generally to show volume. The
cube root of the quantity gives
side of a cube or radius of
sphere.
Such proportional symbols can be
quantitative i.e. representing
quantity and locational as well i.e.
placed in the area the quantity
represents. For example population
distribution in towns is shown by
spheres.
THEMATIC MAPPING
For thematic mapping we need quantities
and outline map will have only such detail
and boundaries that reader could understand
what he sees, and where.
LIST OF THEMES AND THEIR MAPS
AND DIAGRAMS
1) Climatic Depletions: It includes
temperature, rainfall, wind, sunshine and
cloud, humidity, visibility and weather
reports. The data is obtained from
concerned department or sample survey.
Ways of Depiction
a) Isopleths: Isopleths for similar
temperature, pressure, rainfall i.e. lines
joining places having same values:
isobars (Pressure) isotherms (Temp.)
isohyets (rain), isohels (sunshine) etc.
These may be shown by isopleths i.e.
lines (drawn like contours) joining
points of same value (of temp, rainfall
etc.) The examples only apprise reader
of scope.
b) Columnar diagrams: These can be
used to show rhythm of changes diurnal
or seasonal. It can show monthly rain as
a single column in proportional height
for rain each month or number of clear
days per month in the year. Compound
columns can be drawn to show
comparisons of different places in the
year. These can be drawn in their
geographical locations on maps too.
These are called base maps. Imaginative
reader can adopt many combinations.
c) Linegraphs: Temperature, humidity are
plotted as quantities on one axis of a
graph say ordinate and the time on other
axis. The points plotted are joined by

Compass 2018 Technique Polytechnic Institute, Hooghly
Page No. 05
line. Simple graphs are for time and
quantity (like month & Temp.) plot.
d) Histogram: A graph showing frequency
distribution. The frequency percentage
of values taken on ordinate and actual
values on abscissa, then the peak of such
graph will show highest frequency.
e) Some interesting studies can be had as:
i) Take values of rainfall for each
month of each year for number of
years. Then plot maximum and
minimum values for each month in
12 bars, their standard deviation,
mean of the month for the whole
range of years. Such a compound
column is hyetograph. In a map at
location of each town taking rainfall
of each month yearly hyetographs
can be drawn.
ii) Similarly plotting temperature in 12
bars—one for each month-showing
in each tar minimum, maximum,
mean of max, and min. and monthly
mean etc.
iii) Precipitation and evaporation
simultaneous on one graph in
centimetres then drawing a line
graph. Say plotting rainfall per
month and the average loss per
month of land water by
evapotranspiration and joining each
type by line, tells of climate.
iv) Climatograph—Mean monthly
temperatures are plotted from the
centre of circle divided in 12
segments of 30° each representing a
month. The scale of plotting is so
chosen that distance x to plot 0°F
=1/10 of 100°F then to plot any
distance for t° the distance, y= x co
log t/100
If then limiting temperatures for
hot, warm, cool and cold seasons are
decided a id with their distance as
radius circles are drawn, then the
areas enclosed within, these circles
and temperature graph will give the
extent of season of the place.
v) Various types of wind-rose diagrams
can be drawn. Like diagram to show
wind velocities with direction are
shown as a star or octagon, e.g. of
Northern wind in a month 1-3 km
per hour for 5 days 4 km 2 days, 6
km. 1 day etc. can be plotted for all
the directions on uniform scale for
days or percentage of the period
considered.
Such diagrams can be made for
important towns on a map in their
locations to give immediate
comparison or information.
vi) Climographs: The temperature and
relative humidity values are plotted
for each month and joined by line
graph. From this we can study
weather of the place. During the
period when temperature and
humidity are both less the climate is
good.
2) Economic Maps and Diagrams: These
show spatial distribution and inter-relations
of various economic activity of the region
like production, distribution, consumption
of commodities. Amounts, values, rates
areas etc. may have to be suitably depicted.
Agricultural statistics may involve areas,
yields, sales livestock, farm labour, soil
samples etc. Areas may be shown by line
patterns and colours, yields differences in
areas by different kinds in pattern, other
things by letters, dots etc. as convenient,
round square, triangles etc.
Industrial statistics may include fuel, power,
raw materials as in-put and finished goods,
employment ratios, per capita income,
expenditure, etc. dots and circles differing in
shape, size and colour as applicable
generally show quantities, bar or wheels and

Compass 2018 Technique Polytechnic Institute, Hooghly
Page No. 06
divided circles as comparison of values, like
in-put and output.
Transport and communications by rail, road,
steamer services, delimitations of their
hinterland, analysis of port or rail head
activity. Dots, choropleths, bars, line graphs,
arrows are mostly used for their depiction.
Choice of symbol depends on what appeals
best.
a) By dots we can show location and
roughly quantity of different items to be
shown. The shape of dot will represent
different item—say, a circle wheat, a
triangle rice etc.
b) By choropleth showing say wheat
production per 100 hectares in each
region or distribution of milch cattle.
c) Proportional symbols like circles with
varying radius can show coal mining or
any quantitative produce in different
location of the country. The size related
to produce will give comparative look.
d) Locational bars for different years for
different regions giving immediate
comparison of different productions.
e) In these cases one aspect can be shown
in several ways, e.g. total industrial
(engineering goods) is worth 1600 cores
that is exported 20% America, 30%
Russia, 15% Africa, 20% Australia and
rest to Japan.
i) Show as divided rectangle 0.8 on
width 16 cm length and then divide
for various exports.
ii) Show as divided circle 1600 cores
representing 360° and percentage
export by divided sectors and so on.
iii) As star from a small circle. Putting
1600 inside the circle then
percentage flow in different
directions by big and small rays
proportional to data can be drawn to
the stars. To avoid long rays
comparative Thickness can be used.
Flow-line maps.—Show movement in
direction or route followed by road, rail
or waterway. The quantity is projected
by width of lines. For example to show
movement of coal from Bengal mines to
various states or say passenger
movement in various ports by Indian Air
Lines, the lines varying in thickness
proportional to quantity can be drawn in
direction of flow.
What is needed to make such a map is
the flow data say from Delhi x air-
passengers to Madras, y to Calcutta, z
Bombay and t Amritsar. Then seeing
max. and min. quantities, such suitable
scale has to be chosen to show quantities
by thickness of route that on the scale of
outline of map the thick lines do not
eclipse wholly the background for
locational reading.
3) Population Maps and Diagrams—Many
economic aspects if not all are dependent on
population data, often; therefore,
cartographer will be called upon to make
such visual information available for those
who need them, like planning departments.
There are various sources to obtain data for
a region the census records are the best.
Many countries including India conduct
census and collect variety of data like total
population, male and female composition,
gainful employment for various age groups,
education structure, etc.
For local studies house tax data, voters lists,
toll tax records, etc. made useful data.
Types of Studies.—(i) Area-wise
distribution to show density, (ii) Social
structure like rural and urban, (iii) Sex and
age depiction, (iv) Ethnic distribution, (v)
Occupation, (vi) migration, (vi) growth,
mortality & morbidity rates etc.

Compass 2018 Technique Polytechnic Institute, Hooghly
Page No. 07
Symbols.—Dots, choropleths, proportional
circles, spheres, rectangles, and some
ingenious diagrams are used like bars,
pyramids.
Most effective use of pyramids is to show
male and female population in different age
groups. They are made as under:
i) Of the total population male and
female population is separated.
ii) Their separate percentages of
different age groups with a range of
5 or 10 yrs. (i.e. 0, 5, 5 to 10 etc.) are
determined.
iii) The age scale is taken vertically.
Since range is same the distance
apart will be the same. Percentage
scale is made horizontally separately
pointing to opposite direction for
male and female. The age scale runs
vertically up at a small gap. Thus
there will be right and left sides of
age scale made with a gap, say left
for male, right female.
iv) Now the percentages of each age are
plotted as horizontal bars giving a
pyramid of which one side shows
female and other male.
4) Science Maps — Geological Studies,
oceanography etc. can be presented in charts
and graphs. They are good for geographers
to study land forms, for miners, engineers
(tunnelling, water-bearing strata and
artesian bores) for army (for dugouts) and
soils, tides and tidal Currents etc.
Geological Maps generally have relief
depiction as an essential part and therewith
land forms are shown. They can also be
shown by cross sections with structural
relationship in the profile of land. It includes
study of (i) rocks and minerals, (ii) rock
Structure, tectonics, (iii) landscape and
erosion geomorphology, (iv) study of
earth’s gravity magnetism, etc. i.e.
geophysics, (v) chemical composition of
earth’s crust, i.e. geochemistry, (vi) study of
geological forms for bridges, dams and
tunnels, i.e. engineering geology.
The other effective way is drawing of Block
of earth’s crust with one or two vanishing
points. It can bring out land-use land types.
W. M. Davis has made it an enchanting way
of graphic expression of geomorphology.
Block diagrams as said above are Blocks of
earth’s crust such that sides to a depth and
tops are visible with vanishing point
technique. Vanishing points are points to
which extended edge-lines converge and
meet. In one vanishing point lying behind
the block, only one face of Block comes in
front; in two vanishing points (left and
right) a corner and two edges could be
viewed.
Oceanography gives profile of sea bottom,
tides etc. Soil and vegetation maps give a
rich tapestry of foliage and land use.
The ways of graphic communications of the
story of geographer, meteorologist,
economist, are almost infinite. They show
statistical data either with precise numerical
values like census figures, rainfall or other
precipitation figures or may show quality
like wheat producing, rice growing areas
without numerical data of produce; or Hindu
or Muslim predominant areas. Hence such
mapping could be quantitative or
qualitative. For quantitative mapping
statistical data is essential.
- Mr. Kausik Patra (Lecturer in Survey
Deptt.)
Compass 2018 Technique Polytechnic Institute, Hooghly
Page No. 08
HYDROPONICS
Look, no soil! We're so used to plants growing
in fields and gardens that we find anything else
completely extraordinary. But it's true. Not only
will plants grow without soil, they often grow a
lot better with their roots in water or very moist
air instead. Growing plants without soil is
known as hydroponics. It might sound weird,
but many of the foods we eat—including
tomatoes on the vine—are already grown
hydroponically. Let's take a closer look at
hydroponics and find out how it works!
What is hydroponics?
Plants grow through a process
called photosynthesis, in which they use
sunlight and a chemical inside their leaves
called chlorophyll to convert carbon dioxide (a
gas in the air) and water into glucose (a type of
sugar) and oxygen. Write that out chemically
and you get this equation:
6CO2 + 6H2O → C6H12O6 + 6O2
There's no mention of "soil" anywhere in
there—and that's all the proof you need that
plants can grow without it. What they do need is
water and nutrients, both easily obtained from
soil. But if they can get these things somewhere
else—say, by standing with their roots in a
nutrient-rich solution—they can do without soil
altogether. That's the basic principle behind
hydroponics. In theory, the word "hydroponics"
means growing plants in water (from two Greek
words meaning "water" and "toil"), but because
you can grow plants without actually standing
them in water, most people define the word to
mean growing plants without using soil.
Why grow things hydroponically?
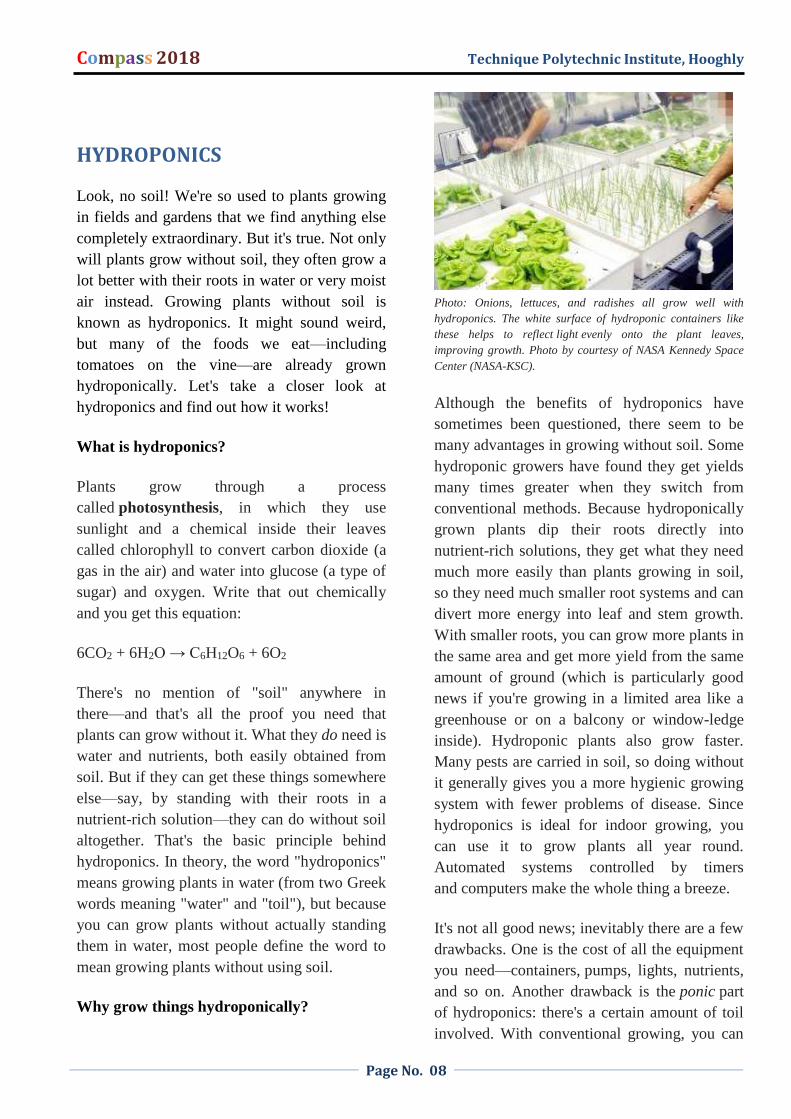
Photo: Onions, lettuces, and radishes all grow well with
hydroponics. The white surface of hydroponic containers like
these helps to reflect light evenly onto the plant leaves,
improving growth. Photo by courtesy of NASA Kennedy Space
Center (NASA-KSC).
Although the benefits of hydroponics have
sometimes been questioned, there seem to be
many advantages in growing without soil. Some
hydroponic growers have found they get yields
many times greater when they switch from
conventional methods. Because hydroponically
grown plants dip their roots directly into
nutrient-rich solutions, they get what they need
much more easily than plants growing in soil,
so they need much smaller root systems and can
divert more energy into leaf and stem growth.
With smaller roots, you can grow more plants in
the same area and get more yield from the same
amount of ground (which is particularly good
news if you're growing in a limited area like a
greenhouse or on a balcony or window-ledge
inside). Hydroponic plants also grow faster.
Many pests are carried in soil, so doing without
it generally gives you a more hygienic growing
system with fewer problems of disease. Since
hydroponics is ideal for indoor growing, you
can use it to grow plants all year round.
Automated systems controlled by timers
and computers make the whole thing a breeze.
It's not all good news; inevitably there are a few
drawbacks. One is the cost of all the equipment
you need—containers, pumps, lights, nutrients,
and so on. Another drawback is the ponic part
of hydroponics: there's a certain amount of toil
involved. With conventional growing, you can

Compass 2018 Technique Polytechnic Institute, Hooghly
Page No. 09
sometimes be quite cavalier about how you treat
plants and, if weather and other conditions are
on your side, your plants will still thrive. But
hydroponics is more scientific and the plants are
much more under your control. You need to
check them constantly to make sure they're
growing in exactly the conditions they need
(though automated systems, such as lighting
timers, make things quite a bit easier). Another
difference (arguably less of a drawback) is that,
because hydroponic plants have much smaller
root systems, they can't always support
themselves very well. Heavy fruiting plants
may need quite elaborate forms of support.
Photo: Waste not, want not: A researcher at the US Department
of Agriculture examines the roots of a hydroponic strawberry
plant that's being nourished on wastewater from a trout farm!
Photo by Scott Bauer courtesy of US Department of Agriculture
(USDA) Agricultural Research Service (ARS).
How does hydroponics work?
Artwork: In the nutrient-film technique, nutrient constantly
drips past the roots of the plants, which grow out from an
inclined tray. The nutrient is pumped back up to the tray and a
second pump adds oxygen through an air stone (a piece of
porous rock that lets air bubble through it—just like in a fish
tank).
There are various different ways of growing
things hydroponically. In one popular method,
you stand your plants in a plastic trough and let
a nutrient solution trickle past their roots (with
the help of gravity and a pump). That's called
the nutrient-film technique: the nutrient is like
a kind of liquid conveyor belt—it's constantly
sliding past the roots delivering to them the
goodness they need. Alternatively, you can
grow plants with their roots supported by a
nutrient-enriched medium such as rockwool,
sand, or vermiculite, which acts as a sterile
substitute for soil. Another method is
called aeroponics and it's typified by a popular
product called the AeroGarden (see box below).
Although the name suggests you're growing
plants in air, the roots are actually suspended
inside a container full of extremely humid air.
Effectively, the roots grow in a nutrient-rich
aerosol a bit like a cloud packed full of
minerals.
In theory, you can grow any plant
hydroponically but—as is always the case with
gardening—some things inevitably do better
than others. Fruit crops such as tomatoes and
strawberries, and lettuces and herbs, are among
plants that do particularly well.
Advantages & Disadvantages of Hydroponics
Advantages:
1. No soils needed
In a sense, you can grow crops in places where
the land is limited, doesn't exist, or is heavily
contaminated. In the 1940s, Hydroponics was
successfully used to supply fresh vegetables for
troops in Wake Island, a refueling stop for Pan
American airlines. This is a distant arable area

Compass 2018 Technique Polytechnic Institute, Hooghly
Page No. 010
in the Pacific Ocean. Also, Hydroponics has
been considered as the farming of the future to
grow foods for astronauts in the space (where
there is no soil) by NASA.
2. Make better use of space and location
Because all that plants need are provided and
maintained in a system, you can grow in your
small apartment, or the spare bedrooms as long
as you have some spaces.
Plants' roots usually expand and spread out in
search for foods, and oxygen in the soil. This is
not the case in Hydroponics, where the roots are
sunk in a tank full of oxygenated nutrient
solution and directly contact with vital minerals.
This means you can grow your plants much
closer, and consequently huge space savings.
3. Climate control
Like in greenhouses, hydroponic growers can
have total control over the climate -
temperature, humidity, light intensification, the
composition of the air. In this sense, you can
grow foods all year round regardless of the
season. Farmers can produce foods at the
appropriate time to maximize their business
profits.
4. Hydroponics is water-saving
Plants grown hydroponically can use only 10%
of water compared to field-grown ones. In this
method, water is recirculated. Plants will take
up the necessary water, while run-off ones will
be captured and return to the system. Water loss
only occurs in two forms - evaporation and
leaks from the system (but an efficient
hydroponic setup will minimize or don't have
any leaks).
It is estimated that agriculture uses up to 80%
water of the ground and surface water in the
US.
While water will become a critical issue in the
future when the food production is predicted to
increase by 70% according to the FAQ,
Hydroponics is considered a viable solution to
large-scale food production.
5. Effective use of nutrients
In Hydroponics, you have a 100% control of the
nutrients (foods) that plants need. Before
planting, growers can check what plants require
and the specific amounts of nutrients needed at
particular stages and mix them with water
accordingly. Nutrients are conserved in the
tank, so there are no losses or changes of
nutrients like they are in the soil.
6. pH control of the solution
All of the minerals are contained in the water.
That means you can measure and adjust the pH
levels of your water mixture much more easily
compared to the soils. That ensures the optimal
nutrients uptake for plants.
7. Better growth rate
Is hydroponically plants grown faster than in
soil? Yes, it is.
You are your own boss that commands the
whole environment for your plants' growth -
temperature, lights, moisture, and especially
nutrients. Plants are placed in ideal conditions,
while nutrients are provided at the sufficient
amounts, and come into direct contacts with the
root systems. Thereby, plants no longer waste
valuable energy searching for diluted nutrients
in the soil. Instead, they shift all of their focus
on growing and producing fruits.
8. No weeds
If you have grown in the soil, you will
understand how irritating weeds cause to your
garden. It's one of the most time-consuming
tasks for gardeners - till, plow, hoe, and so on.
Weeds are mostly associated with the soil. So

Compass 2018 Technique Polytechnic Institute, Hooghly
Page No. 011
eliminate soils, and all bothers of weeds are
gone.
9. Fewer pests & diseases
And like weeds, getting rids of soils helps make
your plants less vulnerable to soil-borne pests
like birds, gophers, groundhogs; and diseases
like Fusarium, Pythium, and Rhizoctonia
species.Also when growing indoors in a closed
system, the gardeners can easily take controls of
most surrounding variables.
10. Less use of insecticide, and herbicides
Since you are using no soils and while the
weeds, pests, and plant diseases are heavily
reduced, there are fewer chemicals used. This
helps you grow cleaner and healthier foods. The
cut of insecticide and herbicides is a strong
point of Hydroponics when the criteria for
modern life and food safety are more and more
placed on top.
11. Labor and time savers
Besides spending fewer works on tilling,
watering, cultivating, and fumigating weeds and
pests, you enjoy much time saved because
plants' growth is proven to be higher in
Hydroponics. When agriculture is planned to be
more technology-based, Hydroponics has a
room in it.
12. Hydroponics is a stress-relieving hobby
This interest will put you back in touch with
nature. Tired after a long working day and
commute, you return to your small apartment
corner, it's time to lay back everything and play
with your hydroponic garden. Reasons like lack
of spaces are no longer right. You can start
fresh, tasty vegetables, or vital herbs in your
small closets, and enjoy the relaxing time with
your little green spaces.
Seem like there are lots of benefits of
Hydroponics and the image below seems to try
to persuade you into Hydroponic growing. But
keep reading to learn about its downsides.
Disadvantages and Challenges:
1. A Hydroponic garden requires your time
and commitment
Just like any things worthwhile in life, hard-
working and responsible attitude gives
satisfactory yields. However, In soil-borne
counterparts, plants can be left on its own for
days and weeks, and they still survive in a short
time. Mother nature and soils will help regulate
if something is not balancing. That's not the
case in Hydroponics. Plants will die out more
quickly without proper care and adequate
knowledge. Remember that your plants are
depending on you for their survival. You must
take good care of your plants, and the
system upon initial installation. Then you can
automate the whole thing later, but you still
need to gauge and prevent the unexpected
issues of the operations, and do frequent
maintenance.
2. Experiences and technical knowledge
You are running a system of many types of
equipment, which requires necessary specific
expertise for the devices used, what plants you
can grow and how they can survive and thrive
in a soilless environment. Mistakes in setting up
the systems and plants' growth ability in this
soilless environment and you end up ruining
your whole progress.
3. Organic debates
There have been some heated arguments about
whether Hydroponics should be certified as
organic or not. People are questioning whether
plants grown hydroponically will get
microbiomes as they are in the soil. But people
around the world have grown hydroponic plants
- lettuces, tomatoes, strawberries, etc. for tens
of years, especially in Australia, Tokyo,

Compass 2018 Technique Polytechnic Institute, Hooghly
Page No. 012
Netherland, and the United States. They have
provided food for millions of people. You
cannot expect perfection from anything in life.
Even for soil growing, there are still more risks
of pesticides, pests, etc. compared to
Hydroponics. There are some organic growing
methods suggested for Hydroponic growers. For
example, some growers provide microbiomes
for plants by using organic growing media such
as coco coir and add worm casting into it.
Natural-made nutrients are commonly used
such as fishes, bones, alfalfas, cottonseeds,
neems, etc.
For this debate for the organic product issue,
there will still be researches done currently and
in the near future. And we'll know the answer
then.
4. Water and electricity risks
In a Hydroponic system, mostly you use water
and electricity. Beware of electricity in a
combination of water in close proximity.
Always put safety first when working with the
water systems and electric equipment,
especially in commercial greenhouses.
5. System failure threats
You are using electricity to manage the whole
system. So suppose you do not take preliminary
actions for a power outage, the system will stop
working immediately, and plants may dry out
quickly and will die in several hours. Hence, a
backup power source and plan should always be
planned, especially for great scale systems.
6. Initial expenses
You are sure to spend under one hundred to a
few hundreds of dollars (depending on your
garden scale) to purchase equipment for your
the first installation. Whatever systems you
build, you will need containers, lights, a pump,
a timer, growing media, nutrients). Once the
system has been in place, the cost will be
reduced to only nutrients and electricity (to
keep the water system running, and lightning).
7. Long return per investment
If you follow news on agriculture start-up, you
may have known that there have been some new
indoor hydroponic business started recently.
That's a good thing for the agriculture sector
and the development of Hydroponics as well.
However, commercial growers still face some
big challenges when starting with Hydroponics
on a large scale. This is largely because of the
high initial expenses and the long, uncertain
ROI (return on investment). It's not easy to
detail a clear profitable plan to urge for
investment while there are also many other
attractive high-tech fields out there that seem
fairly promising for funding.
8. Diseases & pests may spread quickly
You are growing plants in a closed system using
water. In the case of plant infections or pests,
they can escalate fast to plants on the same
nutrient reservoir. In most cases, diseases and
pests are not so much of problem in a small
system of home growers.
So don't care much about these issues if you are
beginners.
It's only complicated for big hydroponic
greenhouses. So better to have a good disease
management plan beforehand. For example, use
just clean disease-free water sources and
growing materials; checking the systems
periodically, etc.
Should the diseases happen, you need to
sterilize the infected water, nutrient, and the
whole system fast.
So would I still recommend Hydroponics?
Absolutely!
There are downsides to Hydroponics, just like
any other things in life. But you can overcome
most of them with just some planning and

Compass 2018 Technique Polytechnic Institute, Hooghly
Page No. 013
experiences. Meanwhile considering the pros it
can offer, Hydroponics is worth doing. It is
always a part of modern agriculture. Compared
with the soil-counterparts, Hydroponics is a
highly effective growing method.
And here are the summarized winning key
points of Hydroponics over soils.
Hydroponics vs. Soil
• Space saver.
• Effective use of plant nutrients.
• Water-efficient.
• No weeds, fewer pests, and plant
diseases.
• Stable and higher yields.
• Control of the whole system.
• Growing media can be chosen and
sterilized fast.
• Fewer fertilizers and insecticides used.
• Easy to transplant.
• Able to grow crops all year round.
- Mr. Monoj Kumar Mondal (Technical
Assistant in Survey Deptt.)
Compass 2018 Technique Polytechnic Institute, Hooghly
Page No. 014
TOPOGRAPHIC SURVEYING
Topographic Surveying
• determining the relative locations of
points (places) on the earth's surface by
measuring horizontal distances,
differences in elevation and directions
• topos (Gr.): place; topographic maps
give the locations of places (observable
features); they serve as base maps
Use of topographic surveying in geography:
producing topographic maps
constructing topographic (cross-
sectional) profiles
establishing vertical and horizontal contr
ol for accurately defining locations
General Principles
1. select a scale in advance; this determines
the plotable error
2. work from the most accurate to the least
accurate methods
3. orient each survey, preferably with
respect to true north
4. the first stage of surveying is always
establishing horizontal and vertical contr
ol: the distance, direction and difference
in elevation between key fixed points
5. establish a survey plan that includes
checks on accuracy, e.g. redundant
points, pacing of measured distances,
surveying between fixed positions, etc.
Methods
1. horizontal distance
o tachymetry: a rapid optical
means of measuring distance
using a telescope with cross hairs
and a stadia rod (one stadium =
about 607 feet)
o measuring slopes distance with a
tape and reducing it to horizontal
distance using the cosine of the
slope gradient
2. difference in elevation
o leveling with a level telescope
and a stadia rod, or
o measuring a vertical angles and
a slope distance (height is the
product of the distance and sine
of the angle)
Leveling is more accurate since
elevation differences are measured not
calculated. Two readings are taken at
each position of the automatic level:
a backsight towards a station located
before the level on the traverse and
a foresight to the next station on the
traverse. Thus the stadia rod occupies
two stations, before and after the level
on the survey. The difference in
elevation between successive stations if
the difference between the backsight and
the foresight read from the stadia
rod. For each position of the level, the
lengths of the foresights and backsights
should be approximately the same since
accuracy is a function of the distance of
a sighting. The level operator should
anticipate the distance to the next station
and set up the level midway along this
distance (note: the distance that can be
sighted decreases with increase in slope,

Compass 2018 Technique Polytechnic Institute, Hooghly
Page No. 015
since the stadia rod will disappear above
or below the level line of sight). The
lengths of backsight and foresight can be
paced by the rod person or measured by
the interval between the upper and lower
cross hairs (tachymetry).
3. direction
• horizontal angle measured with a
compass
• precise measuring devices use vernier
scales
• direction is expressed relative to a
reference line or meridian
• true meridian: a north-south line
• magnetic meridian: a line parallel with
the earth's magnetic lines of force
• assumed meridian: an arbitrary line
Types of horizontal angles
1. bearing: angles expressed relative to a
meridian using the quadrant and an
acute angle, e.g. N37oE, S62oE, N20oW
2. azimuth: the clockwise angle from the
north branch of a meridian, e.g.
45o (northeast), 180o (south)
3. deflection angle: the angle between a
line and the prolongation of a preceding
line; it is a right or left angle depending
on whether the new line is right
(clockwise) or left (counterclockwise) of
the preceding line
4. interior angle: an angle inside a closed
polygon
Types of Traverses
1. azimuth: along a single direction
(azimuth); common for slope profile
surveys where the profile is always
perpendicular to contours (i.e. maximum
slope angle)
2. closed traverse: begins and ends at fixed
control points of known location;
permits calculation and adjustment for
closure error
3. closed-loop traverse: begins and ends at
the same station; permits calculation and
adjustment for closure error and use of
interior and deflection angles
4. open traverse: surveying from a known
position to a point of unknown position;
does not enable computational checks
for error, rather all measurements must
be repeated to check for error
Shape of The Earth And Error: The two basic
problems in topographic surveying
The shape of the earth (the geoid) is a
consideration only in geodetic surveying, where
over long distances flat surfaces are not level,
plumb lines are not parallel and the sum of the
angles in a triangle is greater than 180o; thus
precise surveys over large areas employ the
principles of geodesy (the mathematical
properties of an ellipsoid that emulates the
earth); however with most surveys, including
virtually all topographic surveying in
geography, the departure of horizontal lines
from level and plane angles from spherical
angles are negligible and can be ignored
plane surveying: where the earth's surface is
regarded as a plane; level lines are considered
straight, angles are considered to be plane
angles and plumb lines are considered to be
parallel within the survey
with these assumptions, the relative locations of
points can be calculated using the principles of
plane trigonometry:

Compass 2018 Technique Polytechnic Institute, Hooghly
Page No. 016
a. for right angles: sinA = a/c, sinB = b/c,
and c2 = (a2 + b2), where A & B are the
acute angles, C is the right angle and a,
b & c are the sides opposite the angles
designated with the same letter; thus the
sides and angles can be calculated with a
knowledge of 1 side and 1 angle or 2
sides
b. for oblique triangles: a/sinA = b/sinB =
c/sinC; thus given 2 angles and one side
or 2 sides and 1 angle are the other sides
and angles can be calculated
Error
Distances and angles can never be determined
exactly; measurements are subject to error.
Error can be controlled through procedure and
instrumentation. Surveys are conducted
according to standard levels of accuracy (first
order, second order, etc.). The desired level of
accuracy depends on the intended us of the
survey data (e.g. locating permanent stations or
surveying bridges and dams versus surveying
for terrain analysis or orienteering).
For topographic mapping, the desired level
accuracy is the plottable error, the shortest
distance that can be depicted on a map at a
given scale. The drafting of lines generally is
accurate to within 0.25 mm. At 1:1000, 0.25 =
250 mm or 0.25 m on the ground. Optical
measuring devices will provide this level of
accuracy. At 1:25,000, 0.25 mm = 6.25 m on
the ground. Pacing of distance will provide this
level of accuracy, although in practise accuracy
is greater than the plottable error by as much as
one-third (e.g. 80 mm rather than 250 mm at a
scale of 1:250,000) so that plotting and
surveying errors are not compounded.
Adjusting For Closure Error
Horizontal angles
• In a closed polygon, the sum of the
interior angles = 180o (n-2), where n is
the number of sides in the polygon, thus
the sum of the horizontal angles in a
triangle (n = 3) is 180o; an equal angle is
subtracted or added to each
measurement to satisfy the equation for
interior angles; if the closure error is not
equally divisible by n, make the largest
adjustments to the largest angles.
• The sum of deflection angles for any
closed polygon is always 360o; this
provides for another means of
determining and adjusting for closure
error.
Difference in elevation
Closure error can be determined for closed and
closed-loop traverses. The closure error can be
divided by the number of stations on the
traverse or the correction at each station can be
calculated according to the distance from the
origin of the survey:
Ci = di/L * Ec, where
• Ci = the correction applied to station I
• di = the distance to station i from the
origin of the
traverse
• L = the total length of the traverse
• Ec = the closure error
This method accounts for the propagation of
error with distance.
Horizontal distances
As with leveling, closure error can be
determined for closed and closed-loop traverses,
where the coordinates of the end points are
identical or known. Location in the horizontal
plane are given by x and y coordinates (e.g.
Compass 2018 Technique Polytechnic Institute, Hooghly
Page No. 017
northing and easting). Using the measured
horizontal distances and adjusted angles,
calculate the coordinates of each station. The
difference between the calculated and known
coordinates of the end control point is dx and
dy, the closure error in x and y. As with
leveling, the adjustment is a function of the
distance traversed (Li) relative to the total
length of the traverse (L):
Cdxi = dx * Li/L Cdyi = dy * Lii/L, where
Cdxi and Cdyi are the adjustments in x and y
coordinates at station i
The relative accuracy of distance measurements
can be expressed as ((dx2 + dy2)1/2)/L. An
angular error of one minute is equivalent to a
distance measurement error of 3 cm over a
distance of 100 m, since the sine of 1/60o is
.00029.
- Mr. Suman Polley (Technical Assistant in
Survey Deptt.)
Compass 2018 Technique Polytechnic Institute, Hooghly
Page No. 018
E-WASTE
The production of electrical and electronic
equipment (EEE) is one of the fastest growing
global manufacturing activities. Rapid
economic growth, coupled with urbanization
and a growing demand for consumer goods, has
increased both the consumption and the
production of EEE. The Indian information
technology (IT) industry has been one of the
major drivers of change in the economy in the
last decade and has contributed significantly to
the digital revolution being experienced by the
world. New electronic gadgets and appliances
have infiltrated every aspect of our daily lives,
providing our society with more comfort, health
and security and with easy information
acquisition and exchange. The knowledge
society however is creating its own toxic
footprints.
E-waste broadly covers waste from all
electronic and electrical appliances and
comprises of items such as computers, mobile
phones, digital music recorders/players,
refrigerators, washing machines, televisions
(TVs) and many other household consumer
items.
The increasing ‘market penetration’ in the
developing countries, ‘replacement market’ in
the developed countries and ‘high obsolescence
rate’ make e-waste one of the fastest waste
streams. This new kind of waste is posing a
serious challenge in disposal and recycling to
both developed and developing countries. While
having some of the world's most advanced high-
tech software and hardware developing
facilities, India's recycling sector can be called
medieval. All this has made e-waste
management an issue of environment and health
concern.
Magnitude of the problem
In India, about 1.2 million tonne of e-waste is
generated every year, as per a study conducted
by the Central Pollution Control Board (CPCB).
Of the total e-waste generated in the country,
western India accounts for the largest
population at 35%, while the southern, northern
and eastern regions account for 30, 21 and 14%,
respectively. The top states in order of highest
contribution to waste electrical and electronic
equipment (WEEE) include Maharashtra,
Andhra Pradesh, Tamil Nadu, Uttar Pradesh,
West Bengal, Delhi, Karnataka, Gujarat,
Madhya Pradesh and Punjab. The city-wise
ranking of the largest WEEE generators is
Mumbai, Delhi, Bengaluru, Chennai, Kolkatta,
Ahmedabad, Hyderabad, Pune, Surat and
Nagpur.
While northern India is not a leading generator,
it happens to be the leading processing centres
of e-waste in the country. Over 1 million poor
people in India are involved in the manual
recycling operations. Most of the people
working in this recycling sector are the urban
poor with very low literacy levels and hence
very little awareness regarding the hazards of e-
waste toxins. There are a sizeable number of
women and children who are engaged in these
activities and they are more vulnerable to the
hazards of this waste.
The main sources of computer usage and
thereby e-waste generations are the business
sector (government departments, public or
private sector, multinational corporation offices,
etc.), accounting for 78% of the total installed
PCs today. Other sources are individual
households (22%), foreign embassies, PC
manufacturing units, PC retailers, secondary
markets of old PCs and imported electronic
scrap of other countries.
The following three categories of WEEE
account for almost 90% of the generation

Compass 2018 Technique Polytechnic Institute, Hooghly
Page No. 019
• Large household appliances: 42%
• Information and communications
technology equipment: 33.9 %
• Consumer electronics: 13.7%.
What is e-waste?
Electronic waste or e-waste is the term used to
describe old, end-of-life electronic appliances
such as computers, laptops, TVs, DVD players,
mobile phones, mp3 players, etc., which have
been disposed by their original users.
E-waste has been categorized into three main
categories, i.e., Large Household Appliances, IT
and Telecom and Consumer Equipment.
Refrigerator and washing machine represent
large household appliances; PC, monitor and
laptop represent IT and Telecom, while TV
represents Consumer Equipment.
Each of these e-waste items has been classified
with respect to 26 common components found
in them. These components form the ‘building
blocks’ of each item and therefore they are
readily ‘identifiable’ and ‘removable.’ These
components are metal, motor/ compressor,
cooling, plastic, insulation, glass, LCD, rubber,
wiring/electrical, concrete, transformer,
magnetron, textile, circuit board, fluorescent
lamp, incandescent lamp, heating element,
thermostat, brominated flamed retardant (BFR)-
containing plastic, batteries,
CFC/HCFC/HFC/HC, external electric cables,
refractory ceramic fibers, radioactive substances
and electrolyte capacitors (over L/D 25 mm).
The composition of WEEE/e-waste is very
diverse and differs in products across different
categories. It contains more than 1000 different
substances, which fall under ‘hazardous’ and
‘non-hazardous’ categories. Broadly, it consists
of ferrous and non-ferrous metals, plastics,
glass, wood and plywood, printed circuit
boards, concrete and ceramics, rubber and other
items. Iron and steel constitutes about 50% of
the WEEE followed by plastics (21%), non-
ferrous metals (13%) and other constituents.
Non-ferrous metals consist of metals like
copper, aluminium and precious metals, e.g.
silver, gold, platinum, palladium, etc. The
presence of elements like lead, mercury,
arsenic, cadmium, selenium and hexavalent
chromium and flame retardants beyond
threshold quantities in WEEE/e-waste classifies
them as hazardous waste.
The electronic and electrical goods are largely
classified under three major heads, as: ‘white
goods,’ comprising of household appliances like
air conditioners, dishwashers, refrigerators and
washing machines; ‘brown goods,’ comprising
of TVs, camcorders, cameras, etc.; ‘grey
goods,’ like computers, printers, fax machines,
scanners, etc. The grey goods are comparatively
more complex to recycle due to their toxic
composition.
Health and environmental impact of e-waste
EEEs are made of a multitude of components,
some containing toxic substances that have an
adverse impact on human health and the
environment if not handled properly. Often,
these hazards arise due to the improper
recycling and disposal processes used. It can
have serious repercussions for those in
proximity to places where e-waste is recycled or
burnt. Waste from the white and brown goods is
less toxic as compared with grey goods. A
computer contains highly toxic chemicals like
lead, cadmium, mercury, beryllium, BFR,
polyvinyl chloride and phosphor compounds.
Environment and health hazards.
Lead
exerts toxic effects on various systems in the
body such as the central (organic affective
syndrome) and peripheral nervous systems
(motor neuropathy), the hemopoietic system

Compass 2018 Technique Polytechnic Institute, Hooghly
Page No. 020
(anaemia), the genitourinary system (capable of
causing damage to all parts of nephron) and the
reproductive systems (male and female).
Mercury
causes damage to the genitourinary system
(tubular dysfunction), the central and peripheral
nervous systems as well as the foetus. When
inorganic mercury spreads out in the water, it is
transformed into methylated mercury, which
bio-accumulates in living organisms and
concentrates through the food chain,
particularly by fish.
Cadmium
is a potentially long-term cumulative poison.
Toxic cadmium compounds accumulate in the
human body, especially in the kidneys. There is
evidence of the role of cadmium and beryllium
in carcinogenicity.
Polycyclic aromatic hydrocarbons (PAH)
Affects lung, skin and bladder. Epidemiological
studies in the past on occupational exposure to
PAH provide sufficient evidence of the role of
PAH in the induction of skin and lung cancers.
Existing legislations and policy related to e-
waste
The E-waste (Management & Handling) Rules,
2016 have been notified on March 23 2016.
The new rules include Compact Fluorescent
Lamp (CFL) and other mercury containing
lamps, as well as other such equipment.
The Rules also brings the producers under
Extended Producer Responsibility (EPR), along
with targets.
Organizations/networks working on e-waste
issues in India
Knowledge bank for e-waste management in
India
The Asia Pro Eco-programme supported by the
European Commission is dedicated to the
environmental performance in Asian Economic
sectors through the exchange of environmental
policies, technologies and practices and to
promote sustainable investment and trade
between the European Union Member States
and South Asia, South-East Asia and China.
The E-waste Guide, India
An Initiative of the Indo–German–Swiss
Partnership [Ministry of Environment and
Forests, German Federal Ministry for Economic
Cooperation and Development and Swiss State
Secretariat for Economic Affairs] It is designed
to serve as an information resource on e-waste
as well as a common collaborative work
platform for stakeholders.
National Solid Waste Association of India
(NSWAI)
A leading professional non-profit organization
in the field of solid-waste management,
including toxic and hazardous waste and also
biomedical waste in India. It was formed in
1996. Its objectives include development of
solid-waste management as a profession,
research and development, development of
expertise, standards and goods practices with
regards to solid-waste management. Some of
the others include improvement in legislation
and creating awareness and community
involvement.
Toxics Link
A Delhi-based environment activist group with
a mission of working for environmental justice
and freedom from toxics. It is also actively
involved in creating public awareness on
environmental issues through publications,

Compass 2018 Technique Polytechnic Institute, Hooghly
Page No. 021
reports, articles and environment news bulletins
besides organizing various events.
Others are STEP Workweb, WEEE Forum,
Clean India, Indian Environmental Society,
INDIA HABITAT CENTRE and Microbial
Biotechnology Area of Tata Energy Research
Institute.
How can we control e waste?
• Don't trash them. First, we should never
throw e-waste in the trash!
• Recycle them.
• Find a good e-waste recycler.
• Staples stores.
• Do a cell phone recycling drive and
fundraiser in your school.
• Learn to fix broken gadgets yourself.
• Buy less. Buying things we simply do
not need is probably the biggest cause of
e-waste. ...
• Organize what you have. ...
• Give away or donate your e-waste. ...
• Take them back to the store. ...
• Sell. ...
• Learn about your local recycling
options. ...
• Think ahead. ...
• Live in the cloud.
- Mr. Himanshu Bakshi (Lecturer in
Survey Deptt.)

Compass 2018 Technique Polytechnic Institute, Hooghly
Page No. 022
Floating Concrete
Floating concrete is a fluid mixture of density
less than water, which is suitable to build
floating structures, reducing the consumption of
land for buildings. This project report addresses
the procedure of preparation of mix proportion
of floating concrete, materials used & various
test results of compressive strength at the age of
7 days & flow, for acceptance of this concrete.
Also, it presents an application of this concrete
for canoe construction along with a light weight
but, strong reinforcement. Despite the self
weight of the canoe, it can bear a certain
amount of external load.
What is concrete? (Conventional & Floating
Concrete)
Concrete is the most widely-used composite
material in the construction industry. It is
durable, weather-resistant, environmentally
neutral and economically affordable.
There are many types of concrete each designed
for fulfilling specific technical, structural and
aesthetic requirements. In the broadest
definition, concrete is a mixture of Portland
cement, aggregate (gravel and sand) and potable
water.
Fresh concrete is a workable, form-able, non-
toxic paste that can be easily poured and formed
as per design requirements. During the
hydration process, the water reacts with
Portland cement to form a crystallized and
permanent matrix holding aggregates together.
In few days after casting the concrete, the
concrete body reaches the pick of its strengths
provided curing process is supervised by
experienced and trained team in a conditioned
environment.
Concrete compressive strength can easily
surpass the compressive strength of many
naturally occurring rocks; a compressive
strength of 70 MPa can be easily achieved in a
precast concrete factory and many cast-in-situ
concrete elements achieve a compressive
strength of 40 MPa and more.
What is floating concrete structure?
A floating concrete structure is usually a solid
body made of reinforced concrete & an inner
chain of chambers filled with a lightweight
impermeable material, typically polystyrene
but, here the concrete is made to float by
addition of aluminium powder as an air
entraining agent. In addition to this, the
concrete includes polypropylene fibers for good
binding, nano silica for increasing its strength,
CaCl2 as an accelerator & Dr. Fixit for water
proofing. Aluminium mesh instead of steel
mesh is used for reinforcement, for making it
light weight & corrosion resistant.
MATERIALS USED:
The cement used is somewhat similar to
Ferrocement but, instead of steel wire mesh,
aluminium wire mesh is used possessing a light
weight than regular chicken mesh making an
innovative type of “Aluminicement”(Carbon
fiber mesh can also replace the aluminium mesh
as it is the best among the light weight but
strong meshes available). Pozzolanic Portland
Cement (PPC) reinforced with polypropylene
fibers, for increasing the binding among
particles was used, pursuing following physical
& chemical properties:
Physical properties of Portland Pozzolanic
Cement and OPC
Property
Results
Ordinary
Portland
Cement
Blended
Pozzolanic
Cement

Compass 2018 Technique Polytechnic Institute, Hooghly
Page No. 023
Compressive Strength (MPa)
3 Day 11.3 10.7
7 Day 13.2 14.3
28 Day 16.9 21.2
Setting time (min)
Initial 120 164
Final 166 203
Specific
Gravity 3.107 2.936
Fineness % 85.4 86.2
Soundness
(mm) 0.5 1
Chemical properties of Portland Pozzolanic
Cement and OPC
Property
Results
Ordinary
Portland
Cement ( %)
Blended
Pozzolanic
Cement (%)
Loss on
Ignition 2.05 1.05
Insoluble
Residue 4.1 20
Total alkalis 0.59 0.71
Chloride
Content 0.07 0.01
SiO2
Content 28.7 23.5
Al2O3
Content 13.5 12.9
CaO Content 53.6 47
MgO
Content 2.21 1.74
Fe2O3
Content 2.27 2.04
SO3 Content 2.9 2.21
Ordinary Portland cement is replaced by PPC
because of its pozzolanic property as well as
making it economical by the use of cheaper
pozzolanic material such as fly ash for
sustainable development.
Aggregate
Locally available natural sand with 300 microns
maximum size was used as fine aggregate.
Admixtures
• Aluminium fine powder is used as gas
forming admixture. It generates
fluffiness in the concrete same as
baking soda does in a cake. This
admixture when added to mortar or
concrete mixture react chemically
with hydroxides present in the cement
& form minute bubbles of hydrogen
gas of size ranging from 0.1 to 1 mm
throughout the cement-water
• To shorten the setting time of the mix,
the accelerating admixture used is
Calcium Chloride (CaCl2).
Mineral additives
Since we have made a light weight concrete
with density less than that of water, it possesses
a little less strength as compared to the
conventional concrete. So, to overcome this
drawback, nanotechnology is taken as a support.
• Nano-SiO2 having particle size less
than 100 nm, has been found to
improve concrete workability &
strength, increase resistance to water

Compass 2018 Technique Polytechnic Institute, Hooghly
Page No. 024
penetration & to help control the
leaching of calcium, which is closely
associated with various types of
concrete
Water proofing agent
One of the major requirements of floating
concrete is it should not have any leakage
through it. The porosity of the concrete mortar
should almost be equal to zero.
For this reason a water proofing substance is
required.
• Fixit powder is added to the mortar
for making it water resistant.
Images of materials used
3. PROPERTIES
Light Weight: Density range from 650 Kg/m3
to 1850 Kg/m3 as compared to 1800 Kg/m3 to
2400 Kg/m3 for conventional brick and
concrete respectively. Despite millions of tiny
air filled cells, it is strong and durable. There is
Lightweight advantage for the structure design,
leading to savings in supporting structures and
foundation.
Compressive Strength: 2.0 to 7.0N/mm2.
Excellent Acoustic Performance: It can be
used as effective sound barrier and for acoustic
solutions. Hence, highly suitable for partition
walls, floor screens/roofing and panel material
in auditoriums.
Earthquake Resistant: Since lighter than
concrete & brick, the lightness of the material
increases resistance against earthquake.
Insulation: Superior thermal insulation
properties compared to that of conventional
brick and concrete, so reduces the heating and
cooling expenses. In buildings, light-weight
concrete will produce a higher fire rated
structure.
Workability: Products made from lightweight
concrete are lightweight, making them easy to
place using less skilled labor. The bricks can be
sawed, drilled and shaped like wood using
standard hand tools, regular screws and nails. It
is simpler than brick or concrete.
Lifespan: Weather proof, termite resistant and
fire proof.
Savings in Material: Reduces dead weight of
filler walls in framed structures by more than
50% as compared to brickwork resulting in
substantial savings. Due to the bigger and
uniform shape of blocks, there is a saving in bed
mortar and plaster thickness. In most cases the
higher cost of the light-weight concrete is offset
by a reduction of structural elements, less
reinforcing steel and reduced volume of
concrete.
Water Absorption: Closed cellular structures
and hence have lower water absorption.
Skim Coating: Do not require plaster and water
repellent paint suffices. Wallpapers and plasters
can also be applied directly to the surface.
Modulus of Elasticity: The modulus of
elasticity of the concrete with lightweight
aggregates is lower, 0.5 – 0.75 to that of the
normal concrete.

Compass 2018 Technique Polytechnic Institute, Hooghly
Page No. 025
Therefore more deflection is there in
lightweight concrete
4. EXPERIMENTAL VALUES
Compressive Strength Test:
Concrete is primarily meant to withstand
compressive stresses. Hence, behavior of
concrete in compression is of foremost
importance.
A cube of 10cm×10cm×10cm was prepared by
taking cement:sand ratio as 1:3 & adding 0.08%
of aluminium powder by volume of cement,
polypropylene fibers in equal amount of
cement, 2% CaCl2 by weight of cement, 10%
nano silica by weight of cement & a small
quantity of Dr. Fixit powder.
The sample was then tested in compressive
strength testing machine as shown above and
below.
Recommended limit for compressive strength of
the concrete is 2-7 N/mm2 & the calculated
result came to be 3 N/mm2.
Flow test:
This test gives an indication to the quality of
concrete with respect to consistency,
cohesiveness & the proneness to segregation.
The mix proportion of concrete is same as
mentioned in compressive strength test
Concrete is filled in the mould in two layers,
each layer is tamped 25 times & then after
removal of the mould, the table on which mould
is kept is raised & dropped for 15

Compass 2018 Technique Polytechnic Institute, Hooghly
Page No. 026
The diameter of the spread concrete is measured
in about 6 directions & average spread is
Flow is calculated as given below:
Flow, percent = (Spread diameter in cm-25)
×100) / 25
• The value could range anything from
0-150
• The calculated value of flow came to
be 14%.
Conclusions on the basis of Compressive
strength test:
• Test results obtained show that
floating concrete is not as effective in
compression as the conventional
• Its strength can be improved by
addition of substances such as carbon
nano fibers & silica nano particles
which provide sufficient strength to
the
• With this amount of strength, floating
concrete can be used at harbors &
docks for loading & unloading of
materials to & from the ships,
respectively.
• Also, a hollow cube can be built with
floating concrete slabs & later it can
be filled with Styrofoam for making it
compact & can be used in floating
structures & hence its load bearing
capacity can be
• Pumice stone (aggregate size
approximately equal to 20 mm) can
be used as coarse aggregates in the
concrete mix to increase its
compressive
Conclusions on the basis of Flow test:
• The concrete can be used for marine
structures as the flow is within the
specified
• The durability of the structures is also
high in comparison to that of the
conventional concrete
• The problem of segregation is also
reduced to a large extent so; it can be
used for construction of piers of
marine
- Mr. Braja Gopal Dey (Lecturer in Survey
Deptt.)