technical report # 31infohouse.p2ric.org/ref/18/17795.pdf · technical report # 31 ... objectives...
TRANSCRIPT

180 Second Street Chelsea, Massachusetts 02150 Tel: 617-887-2300 Fax: 617-887-0399
Technical Report # 31
Characterization of Foundry Sand Waste
October 2000

CHARACTERIZATION OF FOUNDRY SAND WASTE
Eric S. Winkler, Ph.D. - Principal InvestigatorAlexander A. Bol'shakov, Ph.D. - Project Engineer
Center for Energy Efficiency and Renewable EnergyUniversity of Massachusetts at Amherst
CHELSEA CENTER FOR RECYCLING AND ECONOMIC DEVELOPMENTTECHNICAL RESEARCH PROGRAM
October 2000
This report has been reviewed by the Chelsea Center for Recycling and Economic Development and approved for publication.Approval does not signify that the contents necessarily reflect the views and policies of the Chelsea Center, nor does themention of trade names or commercial products constitute endorsement or recommendation for use.
All rights to this report belong to the Chelsea Center for Recycling and Economic Development. The material may be duplicatedwith permission by contacting the Chelsea Center. This project was funded by EOEA through the Clean Environment Fund,which is comprised of unredeemed bottle deposits.
The Chelsea Center for Recycling and Economic Development, a part of the University of Massachusetts’ Center forEnvironmentally Appropriate Materials, was created by the Commonwealth of Massachusetts in 1995 to create jobs, supportrecycling efforts, and help the economy and the environment by increasing the use of recyclables by manufacturers. Themission of the Chelsea Center is to develop an infrastructure for a sustainable materials economy in Massachusetts, wherebusinesses will thrive that rely on locally discarded goods as their feedstock and that minimize pressure on the environment byreducing waste, pollution, dependence on virgin materials, and dependence on disposal facilities. Further information can beobtained by writing the Chelsea Center for Recycling and Economic Development, 180 Second Street, Chelsea, MA 02150.
© Chelsea Center for Recycling and Economic Development, University of Massachusetts Lowell

Center for Energy Efficiency and Renewable Energy (CEERE)
The Center for Energy Efficiency and Renewable Energy (CEERE) is located at the Universityof Massachusetts at Amherst campus and administered within the Department of Mechanical andIndustrial Engineering. The center works with issues of energy and its use, production,economics and environmental impact. CEERE's primary mission is to promote energy efficienttechnologies, practices and the use of renewable energy resources while minimizing negativeimpacts on the environment. CEERE's activities are designed to support state, federal and privatestakeholders that deal with issues of energy and its environmental impact.
Acknowledgements
The authors wish to thank all the reviewers of this report, including: the MassachusettsDepartment of Environmental Protection; representatives from the foundry industry inMassachusetts, New Hampshire, Michigan and other states; the FIRST Consortium for MarketDevelopment of Beneficial Use of Foundry By-Products; and the Chelsea Center for Recyclingand Economic Development.

i
TABLE OF CONTENTS
List of Tables................................................................................................................................. ii
List of Figures .............................................................................................................................. iii
EXECUTIVE SUMMARY............................................................................................................... iviv
INTRODUCTION............................................................................................................................... 1Recycling, reclamation, reuse ........................................................................................... 2Sand characterization and the BUD process..................................................................... 4Residual sand applications ................................................................................................ 7Objectives of the study...................................................................................................... 8
REGULATED AND RECOMMENDED STANDARDS ............................................................................ 9Drinking water standards .................................................................................................. 9Non-hazardous waste characteristics .............................................................................. 10
ANALYTICAL TECHNIQUES........................................................................................................... 13Leaching procedures (TCLP and SPLP) ......................................................................... 14Methods for determination of metals .............................................................................. 16Methods for organic compound analysis ........................................................................ 17Statistical treatment ........................................................................................................ 18
CHARACTERIZATION OF VIRGIN AND SPENT FOUNDRY SAND ..................................................... 20Physical characteristics of spent sand ............................................................................. 20Characteristics of foundry binders and resins ................................................................. 22 Chemical composition of foundry sand binders....................................................... 23
CONTAMINANTS IN SPENT FOUNDRY SAND ................................................................................. 31Metallic contaminant s ..................................................................................................... 31Leaching of organics ....................................................................................................... 34Emissions of hazardous air pollutants............................................................................. 36
IMPLICATIONS AND CONCLUSIONS ............................................................................................... 38Future work ..................................................................................................................... 40
TABLES....... ................................................................................................................................. 41
REFERENCES ................................................................................................................................ 69

ii
LIST OF TABLES
Table 1. Regulated and Recommended Maximum Contaminant Levels, mg/l......................... 41
Table 2. Regulatory Limits and Guidelines for Organic Chemicals, µg/l................................. 42
Table 3. Allowable Contaminant Levels for Reuse and Disposal of Contaminated Soil atMassachusetts Landfills .............................................................................................. 44
Table 4. Proposed Illinois tier system for ranking waste .......................................................... 45
Table 5. Indiana tier system for ranking waste ......................................................................... 46
Table 6. Analysis of Semi-Volatile Organic Compounds by TCLP.......................................... 47
Table 7. Analysis of Volatile Organic Compounds by TCLP ................................................... 48
Table 8. Metallic Contaminants Analytical Methods................................................................. 49
Table 9. Detection Limits for Metallic Contaminants (30 CMR 22.06).................................... 50
Table 10. EPA Analytical Methods (SW-846) for Organic Contaminants................................ 51
Table 11. Physical Properties of Foundry Sands........................................................................ 54
Table 12. Geotechnical Characteristics of Foundry Sand Wastes ............................................. 54
Table 13. Chemical Analysis of Typical Foundry Sands............................................................ 55
Table 14. Spent Foundry Sand Chemical Oxide Composition................................................... 55
Table 15. Conventional Sand Binder Systems and Processes..................................................... 56
Table 16. Leachability of Metals from Foundry Sand Waste ..................................................... 57
Table 17. Bulk Content of Metals in Foundry Sand Waste, Reference Sands and Soils............ 58
Table 18. Typical TCLP and SPLP Results from Smelting Operation Sludge ........................... 59
Table 19. Lead Leachability versus Total Element Analysis of Red Brass Foundry Sand Samples and Synthesized Mixtures............................................................................. 59
Table 20. Binders and Sources for Organic Analysis ................................................................. 60
Table 21. Leach Test Variability (Leachate Concentrations) ..................................................... 61
Table 22. Core Oil Binder System Sample: Volatile Analyte Concentrations from GC-FIDAnalysis....................................................................................................................... 62
Table 23. Core Oil Binder System Sample: Volatile Analyte Concentrations from GC-MSAnalysis....................................................................................................................... 63
Table 24. Summary of Concentrations of Organic Compounds in Laboratory Extracts ........... 63
Table 25. Comparison of Binder System Waste Streams .......................................................... 65
Table 26. Data for Organic Compounds from Two New England Foundries ........................... 66
Table 27. Variability of Organic Content in Sand from a New England Foundry.................... 67
Table 28. Major Volatile Components Emitted from Novolac Resin at 980°C ........................ 68

iii
LIST OF FIGURES
Fig. 1. Distribution of metalcasting facilities in the United States, 1998 ..................................... 2
Fig. 2. Locations of Massachusetts foundries (after Winkler et al. [1]) ...................................... 3
Fig. 3. Massachusetts classification of industrial waste................................................................ 5
Fig. 4. Beneficial Use Determination in Massachusetts (MA DEP, 1999)................................... 6
Fig. 5. Illinois tier grading classification system …… ............................................................... 11
Fig. 6. Grain size distribution of foundry sands.......................................................................... 20
Fig. 7. Thermal degradation products of Novolac resins versus temperature............................. 38
iv
EXECUTIVE SUMMARY
INTRODUCTION
Metal casting foundries in the U.S. dispose of about 9 million tons of spent sand in landfills peryear. A typical foundry can generate from 8 to 40 individual waste products. These wastes canhave significant regulatory implications. Environmental constraints on the foundries’ operationsand handling of waste products are becoming increasingly more costly to the industry. Aprevious study on the use of spent foundry sand in Massachusetts identified several issueslimiting beneficial use of waste sand. Some of those include: a lack of understanding in chemicalcharacteristics of sands, life cycle issues, waste management practices, and a lack of clearregulatory guidance, in particular the Beneficial Use Determination (BUD) process. Issuesrelative to risk analysis and appropriate methodology for characterizing sands were alsoidentified.
Molding sand is mixed with binder and additives. The two basic binder systems are clay-bondedsand (“green sand”) and chemically-bonded sand. Chemical binders include phenolic, furan(furfuryl alcohol), and other systems. Additives include a catalyst to promote the bindingprocess. Foundry waste sand is physically suitable for many applications, although long-termenvironmental effects are not well documented. The BUD application process requires specificphysical and chemical characterization of the waste material. Results of waste characterizationshould identify hazardous wastes, determine disposal needs, and other issues. Currently, BUDapplied to spent foundry sand includes wide use as intermediate cover in landfills and a limiteduse in construction practices. Other uses for spent sand are documented across the literature. Adetailed characterization of the foundry waste materials is needed to facilitate these uses. Riskassessment, including fate of metal and organic contaminants, is also needed to characterize thespent sand.
This study focuses on chemical-specific hazards as it relates to the BUD process and reusepractices. This information will potentially make the process of permitting more cost effectiveand timely. The primary objective of this study is to characterize foundry sand waste streams,process sands and to qualify its impact on human health and the environment.
REGULATED STANDARDS AND ANALYTICAL TECHNIQUES
Regulations concerning the disposal requirements and environmental effects of utilization of thespent foundry sand are currently being developed in Massachusetts. Waste classification is usedto specify the handling and storage procedures that minimize impact to the environment. Theanalysis of wastes for the BUD applications is performed using approved EPA methods for solidwaste analysis. Most regulated metals are measured using inductively coupled plasma atomicemission - mass spectrometry (ICP-AES, ICP-MS) and regulated organic compounds aremeasured using gas chromatography interfaced with a mass spectrometer (GC-MS). The toxicitycharacteristic of solid waste leachates is determined using the Toxicity Characteristic LeachingProcedure (TCLP, Method 1311). Alternative methods for measuring leaching potential include:Synthetic Precipitation Leaching Procedure (SPLP) and Extraction Procedure (EP) Toxicity test.

v
Currently, EP has been replaced by TCLP. TCLP is now the most commonly used method toevaluate leachability of wastes and estimate likely risks to ground water. TCLP requiresdetermination of 25 organic chemicals in addition to eight metals and six pesticides regulatedunder the Resource Conservation and Recovery Act (RCRA). The TCLP is designed to modelthe leaching behavior of a materials codisposed in a decomposing municipal solid waste landfill.Based on results of this study, the various methods for analysis offer different scenarios of fateand risk estimate. For the purpose of evaluating the impact or reuse practices, the method ofextraction may be important in accurately evaluating risk potential.
Massachusetts’s foundries have not found it economical to provide waste information that wouldadequately fulfill the requirements of the BUD process, beyond the current use as daily cover inlined landfills. Several institutional barriers to broader acceptance of foundry waste sand as abeneficially usable material still exist.
CHARACTERIZATION OF VIRGIN AND SPENT FOUNDRY SAND
The major components in foundry sand are quartz sand (70-80%), clay (5-15%), additives (2-5%), and water (up to 4%). Clean, uniformly sized silica sand is bonded via binder(s) to formmolds for ferrous (iron and steel) and non-ferrous (aluminum, copper, zinc, etc.) metal castings.The largest volumes of foundry sand are used as ‘green sand’ (clay-bonded). Green sand consistsof high-quality silica sand, approximately 10% bentonite clay, 2 to 5% water and approximately5% sea-coal (a carbonaceous ingredient used to improve casting finish). Chemically bonded sandcast systems use one or more organic binders mixed with catalysts and hardeners. Chemicallybonded sand is typically 97% silica sand by weight.
Numerous authorities have investigated suitability of foundry sands for beneficial use practices.Some of these practices include: asphalt, brick, utility trench backfill, flowable fill, landfill linersand covers, Portland cement road sub-base and soil amendments. Physical characteristics ofspent foundry sand are similar to that of fine silica sand. Nearly all types of spent casting sandsfall in the particle range between 0.1 and 0.6 mm. The uniformity of these byproducts suggeststheir utility in manufacturing. Precise quantification of physical properties of the residual sand isimportant for the marketability of the spent foundry sand. Fineness and compactability (grainsize distribution) is considered in construction applications. For most applications, strengthproperties and low hydraulic conductivity are essential. The American Society for Testing andMaterials (ASTM) has developed a 1997 national specification for use of by-products instructural fills, E1861-97. Additional research is being conducted to support specification ofspent sands in construction materials.
Binders are used to bond sand grains in mold castings. Chemically bonded systems fall into twobroad categories: organic and inorganic systems. The majority of them are self–setting binders.The most common types of binders include various phenolic urethane resins, “furan” (furfurylalcohol) resin, alkyd urethane, sodium silicate, phosphate. Composition and relative proportionsof materials used in binder systems are often proprietary. Foundry cores and molds are subjectedto intense heat from the molten metal. The temperature of the mold-metal interface approaches1000°C. As a result, all organic materials (binders, additives, coatings) undergo thermaldegradation and oxidation (burning). The nature and distribution of combustion and degradation
vi
products are complex and not entirely predictable. Residual organic compounds in spent foundrysands are found only in small quantities. Therefore, spent sand, after casting, typically does notcontain organic contaminants above regulatory threshold levels.
CONTAMINANTS IN SPENT FOUNDRY SAND
The environmental stability of spent foundry sand is reported in several investigations. Variousprocedures for evaluation of leachability of chemicals to ground water exist. In these studies themethods of determining is variable and include: TCLP (EPA Method 1311), SPLP (EPA Method1312), a multiple extraction procedure (EPA Method 1320), or a "total" analysis. While samplesfrom the same type of foundry often demonstrate a large scatter in chemical parameters, adefinite similarity of characteristics exists across the foundries regardless of the metals cast.Studies suggest that spent sand disposed of in a monofill or used in highway construction leachesmetallic and organic constituents below the toxicity characteristic levels. This may be due toinsoluble forms or contaminants or materials not exposed to leaching processes. These studiessuggest that while the presence of the constituents in a bulk waste stream exists, it may not beleachable.
Metallic Contaminants
Several studies have been conducted on metal contaminants in foundry sands. Foundry sandwastes, in monofills, leach metals one to two orders of magnitude less than typical municipalmixed-waste municipal landfills. Spent foundry sand segregated from the other waste streams,disposed of in monofills or used in construction fills leaches regulated metals well below thetoxicity characteristic levels. TCLP and EP Toxicity laboratory tests usually yield significantlyhigher leachability results than what may occur under all conditions. This is because the toxicitytests are designed to simulate the worst-case conditions in a municipal landfill in the presence ofcarboxylic acids as the leachate. The Synthetic Precipitation Leaching Procedure (SPLP) may bemore appropriate to simulate conditions other than those observed in a municipal waste landfill.Under the SPLP test, leachability of lead from smelting sludge was reported to be two orders ofmagnitude lower than that under TCLP.
Even under the TCLP test, extracts from spent foundry sand contained metal concentrationsbelow the regulatory toxicity characteristic levels, provided the sand was not mixed with otherwaste streams (e.g., dust, slag, sludge). Only iron and manganese, which are not regulated underRCRA, were recorded at increased leaching potentials in a number of occasions. Several reportssuggest that mixed foundry wastes leach below the regulatory levels. However, lead, chromium,copper and zinc are reported to be of a concern for mixed foundry wastes. There is no directcorrelation between the total metal content and the leachability under TCLP. Quantities of totalmetal content in spent and virgin sands and in sandy soils are typically of the same order ofmagnitude.
Leaching of Organics
Few peer-reviewed studies have been conducted to determine organic residues in spent foundrysand and leachates from disposal sites. Laboratory studies indicate that several organic

vii
compounds are present in the spent foundry sand but leachable at low concentrations. Studies ongreen sands have demonstrated lower organic compound leaching potential compared tochemically bonded systems.
In several studies on chemically bonded sands, samples typically had concentrations below theregulated toxicity characteristic limits. However, benzoic acid, naphthalene, methylnaphthalenes,phenol, methylenebisphenol, diethylphenol, and 3-methylbutanoic acids, were reported at levelsover 300 µg/l in one or more samples. Phenolic urethane and core oil binder systems were morelikely to be of environmental concern than other binder systems. The furan hotbox, alkydisocyanate, and furan warm box sample leachates contained few compounds and atconcentrations below 100 µg/l. Xylenes were among the most common organic compoundsreported using TCLP, although at concentrations 2 to 4 orders of magnitude lower than thenational drinking water limits. Additional compounds present included benzenesulfonate,benzo(a)anthracene, bi-n-octyl phthalate, crysene, di-n-butylphthalate, fluoranthrene, pyrene,toluene-2,4-disulfonate, and 3 isomeric forms of toluenesulfonate.
Organic compounds detected in many spent chemically bonded sands, included: acetone,diethylbenzenes, p-ethyltoluene, isopropylbenzene, 1,2,4-trimethylbenzene, both 1- and 2-methylnaphthalene, dimethylnaphthalene isomers, naphthalene, and all three isomeric forms ofxylene. Benzene, tetrachloroethene, cresols, acetone, 1,1,1-trichloroethane, and toluene weredetected in the foundry waste leachates at concentrations well below the toxicity characteristiclimits and below the drinking water standards. However, benzene and trichloroethane weremeasured at concentrations around the drinking water limits.
Efforts to reduce the organic compound content should likely focus on the phenolic urethane andthe phenolic isocyanate binder systems, since they contribute more organic content than otherbinder systems. Unreacted resins and solvents in freshly mixed sand-binder systems not exposedto the catalyzing agent or high temperature are also likely sources of leachable organics.Therefore, fresh casting mixtures and core sand that have not been in contact with hot metalshould be separated from the other waste streams.
Emission of Hazardous Air Pollutants
Thermal decomposition of additives in process sand generates permanent gases in the areasproximal to the mold-metal interface. The principal evolving gases were found to be hydrogen,carbon monoxide, carbon dioxide, methane, nitrogen, oxygen, and water vapor. Volatilehydrocarbons, including: ethane, ethylene, propane, propylene, acetylene, furfuryl alcohol,methanol, and ethanol, constitute up to 5% of the gas volume. Pyrolysis is likely to be nearlycomplete at the mold to metal boundary. Inside the mold body farther from the mold/metalinterface, partial decomposition can be expected. At lower temperature and in an oxygen-leanatmosphere, more complex organic compounds are formed. Benzene, toluene, nitrous oxide, andhydrogen cyanide were identified in the atmosphere near a pouring line in a foundry using alkydisocyanate resin bonded molds. Concentrations detected in the foundry atmosphere weregenerally low.

viii
IMPLICATIONS AND CONCLUSIONS
Utilization of foundry waste products in Massachusetts is subject to Beneficial UseDeterminations by the Department of Environmental Protection under current regulations.Detailed physical and chemical characterization of the foundry waste materials is necessary inorder to obtain permits. Quantities of twelve metals and regulated organic compounds extractedfrom foundry sand waste with the Toxicity Characteristic Leaching Procedure suggest that spentfoundry sand can be beneficially used posing no or limited environmental or human health risk.Limited data on separate waste streams, suggests that spent sand be segregated from other,potentially hazardous waste streams (unprocessed molding mix, bag house dust, or sludge), untilsuch time as detailed characterization can be performed. Some of these wastes have highlyvariable levels of the toxicity characteristic constituents. Therefore, mixed foundry wastes areessentially complex and must be evaluated independently. Non-ferrous foundries may producespent sands with contaminants such as, lead, chromium, copper and zinc. Inherent variability ofchemicals in wastes ceases to be a cause for concern when their concentrations are significantlybelow the regulated standards. No direct correlation between leaching concentrations and bulkelement content was generally found.
The physical and chemical properties of foundry sands make them well suited for several reuseapplications. Detailed information about leaching potential, methods for measuring risk, andwaste management practices are still subject, which require further study. In some cases,leaching of chemicals from spent foundry sands does not appear to be a limitation for utilizationof foundry sand wastes in Massachusetts. Additional work in support of developing riskassessment should include more detailed analysis of different waste streams and use of moreappropriate analytical methods. Further work in the market acceptance of spent foundry sandswill also support this process, specifically, product specification and risk reduction measures.Regulatory practices in other states also suggest that BUD permit issues may allow for sandutilization under numerous applications and limit potential risks to health and the environment.
1
INTRODUCTION
The purpose of this work is to evaluate spent foundry sand chemical characteristics. It follows aprevious study [1], which surveyed the possibilities for various uses of the spent foundry sand inMassachusetts. The report [1] identified several issues, including a lack of understanding inchemical characteristics of spent foundry sands, temporal variations, life cycle analysis, andmethodology for characterizing sands. This study is designed as a foundation to the BeneficialUse Determinations (BUD) process with the potential to map out practices which have the leastprobability to cause environmental consequences. The BUD process is mandated statewide bythe Massachusetts Department of Environmental Protection (MA DEP). Limitations in the BUDprocess stem from a lack of understand ing of waste characteristics and evaluation of wasteminimization and beneficial use opportunities based on those characteristics.
Metalcasting foundries in the U.S. and Canada dispose of millions of tons of spent sand inlandfills. A typical foundry can generate from 8 to 40 individual waste products, including: spentmolding sand, core sand waste, cupola slag, scrubber sludge, baghouse dusts, shotblast fines,buffing wastes, and others. Identification of each generation point is important to avoidoverlooking wastes generated infrequently or in small quantities. Small-quantity wastes may nothave a major impact on disposal expenses or handling requirements. But these wastes can havesignificant regulatory implications. Environmental constraints on the foundries’ operations andhandling of pollution control and waste products are increasingly more costly to the industry. Ina 1997 survey of North American foundries, 66% had planned to change one or more processesin the next three years to ensure environmental compliance [2].
Economic and environmental concerns dominate the issue of recycling foundry sand. Thepresently accepted practice of spent sand disposal in landfills is becoming an economic burdenfor foundries as landfills close and regulations grow stricter. This economic burden may in turnencourage foundries to move into states with regulations more favorable to beneficial use orcheaper costs to dispose of spent sand. There is also concern over the environmentalramifications of using process wastes that may contain contaminants in applications where itmay be exposed to people or the environment. Furthermore, technical and economic feasibilityissues are raised for foundries that want to beneficially use their spent sands. Institutionalbarriers, such as market, business, and regulatory realities and perceptions hinder the transition tobeneficial use of foundry sand.
The significance of beneficial use barriers should be discussed in order to clarify the real andperceived problems associated with the utilization of foundry residuals and to promote furtherdiscussion among members involved in beneficial use. This process may help eliminate artificialbarriers. Beneficial use practices in other states have demonstrated that spent foundry sand canbe used in manufacturing processes with varying degrees of success in terms of physical,environmental, and economic feasibility. These projects are reported to illustrate research effortsin support of advancing foundry sand utilization practices in Massachusetts.

2
Figure 1. Distribution of metalcasting facilities in the United States, 1998
Most of U.S. metalcasting facilities are concentrated in the Midwest, Southwest, and California,with the majority of capacity (77%) located in ten states: Alabama, Illinois, Indiana, Michigan,Ohio, Pennsylvania, Tennessee, Texas, Virginia, and Wisconsin. Illinois and Ohio are home tomore than 200 foundries. Foundry locations have traditionally been sited close to raw materials,energy supplier, water and transportation. More recently, new foundries have been built nearinexpensive supplies of scrap metal and electricity as well as local markets for the cast products.Figure 1 illustrates the present distribution of foundries in the United States. Figure 2 indicatesthe geographic locations of foundries in Massachusetts [1].
RECYCLING, RECLAMATION, REUSE
Currently, there are no universally accepted definitions for the terms related to wastemanagement such as recycling, reclamation, and reuse. The federal and states regulations definethese terms in a number of somewhat different ways depending on purpose of a specificdocument. In this report recycling is defined as a cyclic process of collection of materials fromwaste or materials that would otherwise become waste, and their subsequent reprocessing orremanufacturing to produce useful products and return them to the previous stage of use.Recycling of materials implies that there exists a commercially demonstrated processing or

3
manufacturing technology which uses the material as a raw material. A common example isrecycling of scrap metals. With this definition, repeated use of spent sand (after reclamation)within the same foundry is on-site recycling, which is not currently affected by any regulatoryrequirement of a recycling plan approval, nor by a BUD application procedure. Reclamationrequires specialized machinery that recovers a quality portion of spent sand applicable to furtheruse in mold or core making.
Figure 2. Locations of Massachusetts foundries (after Winkler et al. [1])
The term reuse is controversial. In legislative language on solid waste, ‘reuse’ is reserved for thehighest level in the hierarchy of pollution prevention [3]. An EPA guide “Reuse Resources ofNew England” [4] specifies reuse as ‘the use of a product or material again in its originalunmodified form or with little enhancement or change to be utilized again for the same purpose.’An example is the reuse of soda bottles (reuse = refill). Spent foundry molds and cores can notbe reused in this sense, i.e. without crushing them down to a raw material (sand) and itsreclamation. On the other hand, within the foundry technical terminology, reuse of by-products isunderstood as their various uses outside the foundry for non-casting purposes (as opposite toreclamation for internal use). The industry meaning of ‘reuse’ sharply contradicts with theEnvironmental Protection Agency (EPA) definitions.
In this report, spent sand processing is referred to either reclamation or beneficial use. Bothterms have distinct meaning. ‘Reclamation’ is a process of restoring the durable condition of aspent material to be used in its original function (it may be considered as one cycle in the on-siterecycling process). ‘Beneficial use’ is any further use, other than the original use, of a discardedmaterial or by-product that would otherwise become waste. Presumably, a material is discardedonce it is fully used up and can not be reclaimed again for the original process, e.g., because it is

4
worn out. A certain portion of spent foundry sand is discarded during the reclamation processbecause of the reduction in sand grain sizes that precludes any further use of spent sand fines inmold or core making.
SAND CHARACTERIZATION AND THE BUD PROCESS
Molding sand is typically mixed in a specific weight proportion with binder and additives. Theamount of binder required is primarily determined by the process and quality of the sand beingused. Foundries using high quality sand typically require less binder to achieve desired shapingabilities in the mold. Although the production variables of each particular plant result in the useof many different types of binders, there are two basic binder systems: clay-bonded sand (“greensand”) and chemically bonded sand [5]. Green sand is most frequently used in iron foundrieswhereas chemically bonded sand is used primarily in non-ferrous casting. Chemically bondedsands are also used by many “green sand” foundries in their core making operations. Chemicalbinders include phenolic, furfuryl alcohol, and other inorganic binders. Other additives include acatalyst to promote the binding process. Other casting processes such as die casting and lostfoam process are used in the industry but are beyond the scope of this report.
Often the chemical characteristics of sand used in the casting process are not fully known.Additionally, the molding sand mixtures may be proprietary information, especially whenchemically bonded sands are bought pre-mixed. The casting process causes pyrolization andother decomposition reactions that change the chemical form of the binders and additives in thesand.
Spent sand must receive its own Material Safety Data Sheets (MSDS) if it is to be considered araw material for a new market [6]. The BUD application requires specific physical and chemicalcharacterization of the waste material in order to identify potentially usable waste streams andseparate potentially hazardous those. Results of a full waste characterization study (not requiredfor the BUD process) should also include biological (microbial) characterization of waste,estimation of future waste treatment, determination of disposal needs, risk assessment, and wasteminimization opportunities, such as recycling, beneficial use, or altering the production process.Other important issues are life cycle analysis and cost effectiveness.
Foundry waste sand is physically suitable for many applications, although long termenvironmental effects are not as well known or documented. Federal and state waste regulationsare designed to determine how wastes should be handled and disposed of or recycled. Wherebeneficial use is allowed, human exposure and environmental quality are important to thedecision making process. The EPA drinking water standards [7] stipulate threshold levels fornumerous metals and organic substances that are common residuals in the waste sand. Therefore,understanding the characteristics of waste is fundamental to selecting, designing andimplementing waste management solutions in the foundry industry. A clear understanding of thewaste materials will result in defensible engineering and regulatory decisions regardingbeneficial use of spent molding sand while minimizing environmental impact and maximizingeconomics.
Environmental concerns, expressed by MA DEP, include a lack of quantitative data supportingenvironmental health risk assessment of beneficial use practices for spent sand.

5
The classification of industrial by MA DEP is shown in Fig. 3. Foundry sand classified as non-hazardous conventional waste is eligible for BUD. Whether wastes are classified as hazardous ornon-hazardous is subject to tests under the Resource Conservation and Recovery Act (RCRA)for ignitability, corrosivity, reactivity, and toxicity. The Toxicity Characteristic LeachingProcedure (TCLP) test is used to characterize leachability of solid waste disposed of in anenvironment where organic acidic conditions are present, such as in a municipal landfill. Theimportance and limitations of this test are discussed in following chapters.
Figure 3. Massachusetts classification of industrial waste
States use different means of classifying a waste's degree of hazard. In general, states with multi-tiered classification systems, or systems with several "grades" of hazard level, have set standardsby which waste materials can qualify as an acceptable beneficial use material.
While many states have set beneficial use standards [8], Massachusetts, New York, and Georgiain particular do not stipulate specific test parameters for either metals or organics. InMassachusetts, the TCLP and total metal content are used to differentiate hazardous from non-hazardous industrial solid wastes. If total metal content is under a threshold, then there is no needfor the TCLP test. Spent foundry sand generally falls into a conventional waste category, since itis not defined as special (special wastes such as asbestos are specifically identified because theyrequire special handling). Specific metal and organic compound test data and other criteria areused to qualify a material for beneficial use. The distinctive parameters for spent foundry sandare not yet determined. Measurement of eight TCLP metals specified by RCRA, and EPAmethod 8270 for organic analysis may be suitable for input into various risk assessmentscenarios, although risk assessments are not required currently for the BUD applications.
Special waste(requires special controlof handling and disposal)
Industrial Waste
Hazardous Non hazardous
Conventional waste

6
The current BUD process in Massachusetts allows producers of conventional solid waste, withcertain exceptions, to apply for a permit to beneficially use their waste. Following application,MA DEP reviews the case and determines whether the waste is suitable for beneficial use. Ageneral scheme of steps in this process is depicted in Fig. 4. The specific parameters to bedetermined in "typical foundry sand" include at least eight RCRA metals: Arsenic, Barium,Cadmium, Chromium, Lead, Mercury, Selenium, Silver, and a suite of polyaromatichydrocarbons and chlorinated compounds.
Figure 4. Beneficial Use Determination in Massachusetts (MA DEP, 1999)
Health and environmental risks are a function of both the degree of exposure and the nature andconcentration of the regulated chemicals. This report is focused on the first step of riskassessment, namely substance-specific hazard identification. Once completed, the informationcan be used in many assessments of various exposure scenarios (e.g., landfill – ground water orbeneficial use – new product – ground water pathways). Since the regulatory toxicity thresholdsare based on upper estimates of exposures, the conclusions from this report will likelyoverestimate risks, until real-life frequency and duration of exposures are determined. On theother hand, the results of spent sand characterization compiled in this report will help toeliminate the need for evaluation of those chemical parameters that clearly do not present anyrisk because of their minimal leaching potentials. Questions regarding the exposure and riskassessments, other physical hazards, nuisance conditions, life cycle analysis, and possible risk
Beneficial UseRecycling
7
management proposals are still unanswered and are in need of further exploration. These aresubjects for further study.
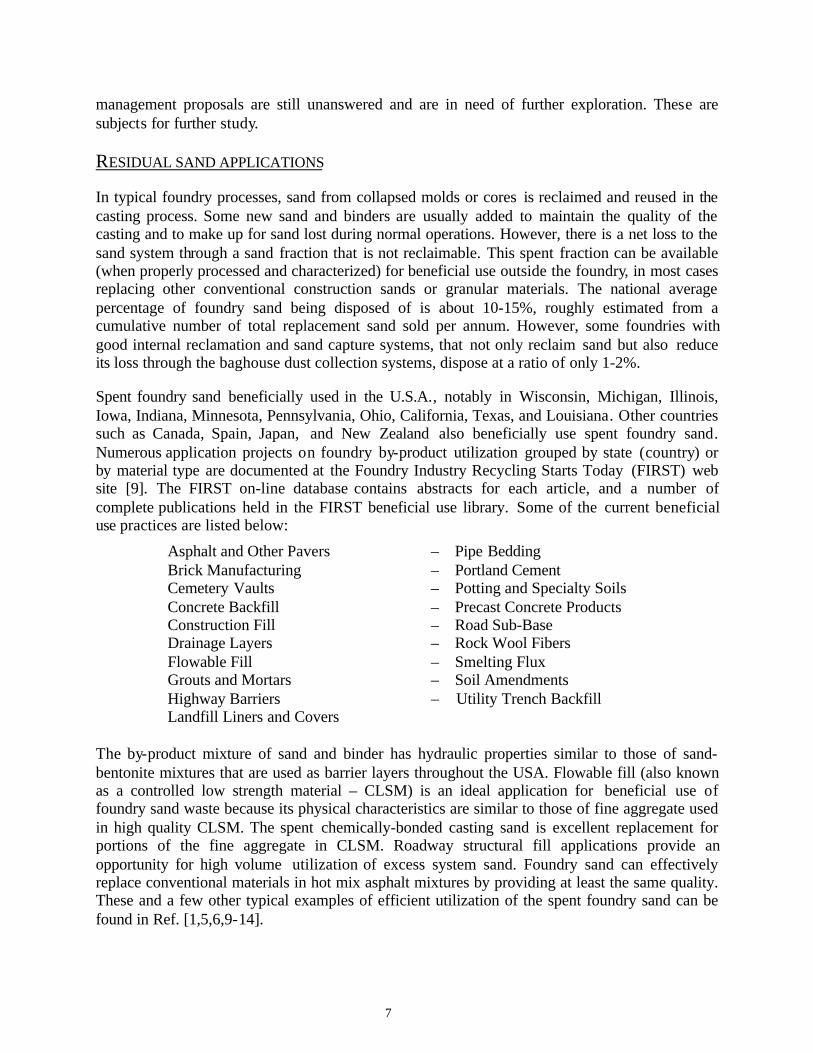
RESIDUAL SAND APPLICATIONS
In typical foundry processes, sand from collapsed molds or cores is reclaimed and reused in thecasting process. Some new sand and binders are usually added to maintain the quality of thecasting and to make up for sand lost during normal operations. However, there is a net loss to thesand system through a sand fraction that is not reclaimable. This spent fraction can be available(when properly processed and characterized) for beneficial use outside the foundry, in most casesreplacing other conventional construction sands or granular materials. The national averagepercentage of foundry sand being disposed of is about 10-15%, roughly estimated from acumulative number of total replacement sand sold per annum. However, some foundries withgood internal reclamation and sand capture systems, that not only reclaim sand but also reduceits loss through the baghouse dust collection systems, dispose at a ratio of only 1-2%.
Spent foundry sand beneficially used in the U.S.A., notably in Wisconsin, Michigan, Illinois,Iowa, Indiana, Minnesota, Pennsylvania, Ohio, California, Texas, and Louisiana. Other countriessuch as Canada, Spain, Japan, and New Zealand also beneficially use spent foundry sand.Numerous application projects on foundry by-product utilization grouped by state (country) orby material type are documented at the Foundry Industry Recycling Starts Today (FIRST) website [9]. The FIRST on-line database contains abstracts for each article, and a number ofcomplete publications held in the FIRST beneficial use library. Some of the current beneficialuse practices are listed below:
� Asphalt and Other Pavers – Pipe Bedding� Brick Manufacturing – Portland Cement� Cemetery Vaults – Potting and Specialty Soils� Concrete Backfill – Precast Concrete Products� Construction Fill – Road Sub-Base� Drainage Layers – Rock Wool Fibers� Flowable Fill – Smelting Flux� Grouts and Mortars – Soil Amendments� Highway Barriers – Utility Trench Backfill� Landfill Liners and Covers
The by-product mixture of sand and binder has hydraulic properties similar to those of sand-bentonite mixtures that are used as barrier layers throughout the USA. Flowable fill (also knownas a controlled low strength material – CLSM) is an ideal application for beneficial use offoundry sand waste because its physical characteristics are similar to those of fine aggregate usedin high quality CLSM. The spent chemically-bonded casting sand is excellent replacement forportions of the fine aggregate in CLSM. Roadway structural fill applications provide anopportunity for high volume utilization of excess system sand. Foundry sand can effectivelyreplace conventional materials in hot mix asphalt mixtures by providing at least the same quality.These and a few other typical examples of efficient utilization of the spent foundry sand can befound in Ref. [1,5,6,9-14].
8
One of the most comprehensive listing of beneficial use applications of spent molding sand andother foundry byproducts has been summarized in a database assembled at the University ofWisconsin [10]. This database identifies materials and markets where methods and specificationswith acceptable performance exist as well as areas in need of further research. Overall, 90projects involving beneficial use of foundry by-products were evaluated or referenced, andtechnical reviews of most significant projects in the U.S. and Canada were performed. Thedatabase portrays a common problem in beneficial use practices: a lack of field performance dataand documentation for all materials. Furthermore, these reports are focused on physicalproperties and not fate of chemical constituents. Hence their applicability to the BUD process isanecdotal.
Spent foundry sand must possess several qualities to be beneficially used. It must beenvironmentally benign, i.e., it should not leach metals, alkalis, or organics in amounts thatwould pose a hazard to human health or the environment under its service condition. It must beeconomically favorable. And finally, it should be technically equivalent to the material it isreplacing in the application. These three factors require a set of definitions acceptable to theindustry, regulatory and policy stakeholders.
Beneficially used foundry sand is often diluted with other materials in its final use, although“dilution” is not always the best approach. In actual end-use scenarios, spent foundry sand maybe coated or embedded in another material (such as asphalt or concrete) making it unavailable toinfiltrating water – hence it would not leach. Furthermore, the chemical form of the metal (e.g.,oxide or silicate) may have limited solubility.
The TCLP test simulates the worst case scenario and is limited to a codisposal situation. TCLPtesting of the end-use compositions would be very helpful. However, the leachability of spentfoundry sand in its end-use structures has not been fully investigated.
OBJECTIVES OF THE STUDY
The main objective of this study is to characterize the chemical contaminants of spent foundrysand. Detailed characterization of the foundry waste materials is needed to support the BUDregulatory protocols and to specify the beneficial practices with the least probable environmentalconsequences and minimum waste. Chemical characterization must be performed in accordancewith the EPA-recommended procedures using the approved standard methods. Such provisionsnecessitate an overview of regulated standards and analytical techniques.
A second objective is to understand the complete extent of regulated elements and compoundspresent in spent foundry sand and to qualify their potential or actual impact on human health andthe environment. Furthermore, the detailed BUD regulations are expected to provide wastegenerators with a mechanism to divert safely and beneficially as much of their wastes fromlandfills as possible. This would provide numerous benefits to the environment, includingconservation of natural resources and less land needed for disposal.

9
REGULATED AND RECOMMENDED STANDARDS
Policies and regulations concerning the disposal requirements and environmental effects ofutilization of the spent foundry sand are currently being developed in Massachusetts. Wasteclassifications are used in order to specify the procedures by which wastes should be handled andstored so as to minimize impact to human health and environmental quality. Development ofbeneficial use policies ensures that materials are used in ways that do not cause harm to humanhealth or degrade environmental quality. Materials are considered to be solid wastes if they areused in a manner constituting disposal. Once a BUD is granted, the waste material ceases to beconsidered a solid waste.
DRINKING WATER STANDARDS
The potential adverse effect of land disposal of solid waste materials is on surface and groundwater quality. Drinking water standards [7] are set by EPA to control the level of contaminants inthe nation's drinking water. These standards are part of the "multiple barrier" approach todrinking water protection under the Safe Drinking Water Act (SDWA), which includes assessingand protecting drinking water sources; making sure water is treated by qualified operators; andensuring the integrity of distribution systems. In most cases EPA delegates responsibility forimplementing drinking water standards to states. The SDWA, passed in 1974 and amended in1986 and 1996, gives the EPA the authority to set drinking water standards. There are twocategories of drinking water standards: National Primary Drinking Water Regulation (or primarystandard) and National Secondary Drinking Water Regulation (or secondary standard).
National Primary Standards are legally enforceable standards that apply to public water systems.They protect drinking water quality by limiting the levels of specific contaminants (in form ofMaximum Contaminant Levels or Treatment Techniques) that can adversely affect public healthand are anticipated to occur in water.
Secondary standards are non-enforceable guidelines regarding contaminants that may causecosmetic effects (such as skin or tooth discoloration) or aesthetic effects (such as taste, odor, orcolor) in drinking water. EPA recommends secondary standards to water systems but does notrequire systems to comply. States may establish higher or lower levels which may be appropriatedependant upon local conditions. MA DEP encourages the suppliers of water to meet thesecondary drinking water standards. Additionally, MA DEP mandates that all detection ofsodium (Na) be reported. The agency defines 20 mg/l of Na and 0.1 mg/l of nickel (Ni) as theconcentrations in drinking water at or below which adverse, non-cancer health effects areunlikely to occur after chronic (lifetime) exposure [15]. MA DEP does not regulate levels ofsodium and nickel but only indicates a potential need for further legislative action to be decidedby its Office of Research and Standards.
Drinking water standards apply to public water systems that provide water for humanconsumption. The 1996 Amendments to SDWA require EPA to go through several steps todetermine via technological evaluation (analytical methods of detection; technical feasibility;impacts of regulation on water systems, the economy and public health) whether setting a certainstandard is appropriate for a particular contaminant.

10
In most cases, the enforceable standard is a maximum contaminant level (MCL), the maximumpermissible level of a contaminant in water which is delivered to any user of a public watersystem. The SDWA defines MCL as the level that may be achieved with the use of the bestavailable technology and other means which EPA finds available. When there is no reliablemethod that is economically and technically feasible to measure a contaminant at particularlylow concentrations, an action level for a treatment technique is set rather than MCL. A treatmenttechnique is an enforceable procedure or level of technological performance which public watersystems must follow to ensure control of a contaminant. An example of treatment technique rulesis the lead and copper rule for the optimized corrosion control and prohibition on lead use.
The EPA drinking water standards divides all regulated contaminants that can adversely affectpublic health into four groups: inorganic chemicals, organic chemicals, radionuclides, andmicroorganisms. The two latter groups of contaminants have little relevance to the foundry sandwaste, but the metals and organics are of a predominate concern. Maximum contaminant levelsof metals that are mandatory for monitoring under primary and secondary drinking waterregulations [7] are listed in the first column of Table 1. Regulatory limits for organic chemicalsare summarized in Table 2.
The drinking water regulations are closely related to the ground water monitoring requirementsas well as to the monitoring, analysis, inspection, quality assurance in implementing thehazardous waste management and land disposal restrictions. Under the existing regulations anowner or operator must sample ground water and analyze those samples for the presence andconcentration of constituents that are routinely analyzed for in the Superfund program(Comprehensive Environmental Response, Compensation, and Liability Act, 1980). Based onthis information, Regional Administrator sets the ground water protection standards, or levels forthe constituents in ground water [16]. If these levels are exceeded in the ground water, correctiveaction must be implemented.
NON-HAZARDOUS WASTE CHARACTERISTICS
The hazardous waste characteristics promulgated by EPA designate broad classes of wastes withinherent properties which would result in harm to health or the environment if mismanaged. Testmethods and regulatory levels for each characteristic property are then established. The EPAmethod 1311 (TCLP) is designed to measure the potential for toxic constituents in the waste toleach out of the solid phase [17] and contaminate ground water. The Toxicity Characteristic ismet when sample leachate exceeds the maximum concentration of any of the specified [16]contaminants. The maximum metal concentrations for TCLP toxicity and ground water are listedin Table 1. In Massachusetts, the total metals content and the TCLP test among other criteria areused to regulate reuse and disposal of contaminated soil at landfills [18]. The allowablecontaminant levels for reuse of soil at Massachusetts landfills are listed in Table 3.
Appropriate sampling procedures are needed to meet state and federal reporting requirements.Sampling protocols required by MA DEP establish the number and frequency of samples andshould include procedures for sample collection, sample preservation, chemical analysis, qualitycontrol, chain-of-custody, and data management.

11
Often, the characterization reports of spent sand from foundries have been inadequate fordetermining the risk of beneficially used materials on public health or the environment. A riskassessment, including metal and organic contaminants and life cycle effects, is needed tocharacterize the material. Changes in use of a building or road structure, for example, may resultin exposures not specified in the original use determination. While leachable metals or organicsmay be locked into a solid substance such as concrete, reducing the risk of environmentalcontact, a structure that is demolished has a renewed risk potential that may not be expected.Though long-term behavior of asphalt, brick, concrete and other materials in the environment iswell known, more specific research is necessary on the stability of those materials that have beenmade with addition of foundry waste. Generally, long-term behavior evaluation is needed for allthe applications going through the BUD process.
In states, where the foundry industry is large, they have developed multi-tiered schemes forclassifying a degree of hazard for solid wastes. Winkler et al. [1] reviewed the BUD practices inthose cases. In Illinois, a score is given to each constituent of the waste based on TCLP, pH, andwaste stream size. Values are compared to a toxicological database compiled from the Registryof Toxic Effects of Chemical Substances and other sources to give an equivalent toxicity score.These scores are then added to give a final ranking, as illustrated in Fig. 5. Materials that score alow or negligible rank may be considered for beneficial use, after issues of liability and specialwaste are addressed.
Figure 5. Illinois tier grading classification system
Constituents measured in the TCLP are often present in various chemical forms in foundrywastes. Some of these include benzene, phenols, metal oxides and silicates. These species wereconsidered in the Illinois tests for determining the level of hazard for foundry waste material [5].The Illinois four-tier grading classification system is similar to Indiana's, with the maximumallowed concentrations for both systems shown in Tables 4 and 5. Under the Indianaclassification system, wastes qualifying as type III or IV may be approved for certain beneficialuses. Wisconsin also uses a four tier classification for foundry wastes based on a detailedcharacterization of foundry by-products. The Wisconsin preventive action limit standard (PALS)determines a benchmark, typically 10% or 20% of the drinking water standard, as the "not-to-exceed" target in ground water [5].
Among the North-East states, New York regulations specify sixteen items with pre-determinedBUDs [19] allowing beneficial use of specific materials for specific purposes without projectreview. These include specific application of such materials as compost, wood chips,
Hazard level:
Score:
High Negligible
High Moderate Low Negligible

12
newspaper/newsprint, glass, tire chips, concrete, asphalt, brick, various soils and ashes. Insituations where a particular proposed beneficial use is not specifically identified, generators andpotential users shall petition for a case-specific BUD. Particularly, the New York StateDepartment of Environmental Conservation has granted a number of BUD permits for the use ofspent foundry sand as an aggregate in the production of concrete, cement, asphalt, and flowablefill. Foundry slag has been granted BUDs for the use as road base/sub-base, railroad ballast,backfill and structural fill within building foundations. Both foundry sand and slag may be usedas daily covers and barriers at New York landfills.
New Jersey DEP has also approved several BUD projects for the beneficial uses of variousfoundry waste streams: spent foundry sand as a component in cement, asphalt and concreteproducts; baghouse dust as an additive in asphalt products and roadbed aggregate; slag as anaggregate component in asphalt products or as additive in concrete products; and mixed foundrywaste in roadbed fill and asphalt aggregate.
MA DEP has received an application for a BUD proposing the foundry waste use as a base in theconstruction of a paved parking lot at a recreational facility in Middleboro. However, a BUDpermit has not been granted because of high concentration of benzo-anthracenes and benzo (a)pyrene found in a composite foundry waste sample.
In Massachusetts, general policies have not yet been developed for foundry sand as a reusablematerial. Moreover, Massachusetts foundries have not found it economical to provide wasteinformation that would adequately fulfill the requirements of the BUD process. The latter isbecause the Massachusetts foundry industry is dominated by small foundries with smallquantities of residual material that are difficult to market, but cost of necessary testing is ratherprohibitive. Several institutional barriers to broader acceptance of foundry waste sand as abeneficially usable material are cited and explained [1] in terms of Massachusetts goals in thefollowing:
1) The wide variety of regulatory and test systems employed by states to manage industrialwastes present many inconsistencies.
a) Threshold levels of leachable metals and organic compounds in industrial wastes canvary by a factor of 30 or more.
b) Environmental differences between states such as soil type and climate often are reflectedin policy differences. However, similar broad policy goals -- namely, protection ofhuman health and short- and long-term environmental quality, should promote efforts tobring some level of uniformity.
2) No universally accepted practice exists to evaluate the hazard posed by beneficially usedfoundry waste. Decision science tools, such as total life cycle or risk analysis method, wouldmake the beneficial use approval process more comprehensive and capable of assessingoverall risks and benefits.
3) State agencies do not have coordinated regulations that achieve both short and long-termobjectives. A good example of a potentially beneficial coordinated policy would be between

13
the MA DEP and Massachusetts Highway Department to address utilization of foundry sandfor transportation material related applications.
4) In some cases the criteria used to determine the health and safety of recycled materials maybe more stringent (or may not exist) than for virgin materials or natural environmentalconditions.
5) Environmental regulations and policies are complex and difficult for the business communityto understand. This deters foundries from seeking beneficial use permits, especially amongsmall foundries with limited personnel.
Recently, the Commonwealth of Massachusetts has taken several actions to assist parties seekingregulatory acceptance of innovative technologies. Particularly, MA DEP has re-organized itsmanagement structure. One of the goals of the re-organization is to bring together programs thatwork on the same problems or sites into consolidated offices, breaking up the older structure oforganizing by the environmental medium regulated, or by enabling legislation. This might helpbeneficial use technologies gain regulatory acceptance more efficiently.
14
ANALYTICAL TECHNIQUES
The chemical analysis for the BUD application procedures is normally performed using the EPAapproved methods for analysis of solid wastes (SW 846). However, the equivalent standardmethods developed and approved by other consensus organizations, such as American Societyfor Testing and Materials (ASTM) or American Water Works Association (AWWA), may beapplied in some cases. EPA accepts the performance-based measurement system as a set ofprocesses wherein the data needs, mandates, or limitations are specified, and serve as criteria forselecting appropriate methods to meet those needs in a cost-effective manner.
Several analytical techniques and methods may be used to separate, identify and quantifycontaminant species contained in both virgin and spent foundry sands and binders used in thecasting process. Most of metallic components can be quantitatively detected by inductivelycoupled plasma (ICP) atomic emission and mass spectrometry. The EPA methods for organiccompound analysis typically involve routine analytical instrumentation which include gaschromatography (GC) interfaced with either mass spectrometer (MS) or flame ionizationdetector (FID). Another common method is pyrolysis interfaced with gas chromatography andmass spectrometry (Py-GC-MS).
Toxicity characteristic of solid waste leachates is determined by Toxicity CharacteristicLeaching Procedure (TCLP, Method 1311). Leaching potential of spent foundry sand can also betested by Synthetic Precipitation Leaching Procedure (SPLP, Method 1312), Multiple ExtractionProcedure (Method 1320), Column Leaching Lysimeter Tests and other sequential tests. Someolder data were accumulated using the Extraction Procedure (EP) Toxicity test (Method 1310A)that was then replaced by the TCLP (both latter tests are similar but direct comparison of resultsfrom them is not always possible). A few modifications included in TCLP relative to the EPToxicity test are the use of 0.7 �m filter, the extraction fluid determination step, and the choiceof two fluids depending on pH of the sample. The EP Toxicity and TCLP tests were designed toapproximate one set of disposal conditions that might occur when a material was codisposedwith municipal solid waste.
Currently, TCLP is most commonly used to evaluate the leaching potential of wastes, and toestimate likely risks to ground water. TCLP requires determination of the 25 organic chemicalsin addition to the eight metals and six pesticides on the existing list of constituents regulatedunder RCRA. The TCLP is meant to model the leaching behavior of a material disposed in anactively decomposing municipal solid waste landfill in which carboxylic acids are formed frommicrobial processes. It is not meant to model the leaching behavior of materials disposed in otherscenarios. If disposal conditions are different from the municipal landfill conditions, another testmay better predict the actual leaching of a waste and provide better numerical estimates ofleaching.
Alternative analytical leaching methods, such as the SPLP are becoming increasingly popularwith regulatory agencies. The SPLP, Method 1312, was developed to simulate leaching underacid rain condition, similar to an industrial waste monofill. The procedure is similar to the TCLP,however the amount of acidity used in the test is significantly less. Furthermore, an aqueoussolution of nitric/sulfuric acid mixture is used in the SPLP as an extraction fluid, unlike a morerigorous buffered acetic acid in the TCLP. States have begun to allow the use of the SPLP for

15
characterization of waste in BUD applications. This procedure may soon become the preferredapproach, since it simulates more closely the field conditions for beneficial use.
Besides the acidic toxicity tests, the ASTM D3987-85 shake water leach test is a useful indicatorin considering the potential environmental impact of foundry sand waste and its beneficial usepractices. Moreover, a total analysis may precede the leach/extraction testing. If a total analysisof the waste demonstrates that individual analytes are present at such low concentrations that theappropriate toxicity levels could not be exceeded, the leaching tests need not be run. Routinetotal analysis at the first instance is the most common current practice in Massachusetts.
LEACHING PROCEDURES (TCLP AND SPLP)
The TCLP is the test required to determine whether a solid or multiphasic waste is a toxicitycharacteristic hazardous waste under RCRA regulations. TCLP estimates the leachability ofmetals, volatile and semi-volatile organic compounds, and pesticides under a defined set oflaboratory conditions. TCLP was developed to simulate the leaching of constituents into groundwater under conditions found in municipal solid waste (MSW) landfills. The TCLP does notsimulate the release of contaminants to non-ground water pathways or conditions which are notcharacteristic of MSW disposal sites.
In the TCLP, solid samples are extracted with an acetate buffer solution. The extraction fluidemployed is a function of the alkalinity of the solid phase of the waste. A liquid-to-solid ratio of20:1 by weight is used for an extraction period of 18 ± 2 hours. After extraction, the solids arefiltered through a 0.6 to 0.8 µm filter from the liquid extract, and analyses are conducted on theleachate to determine the constituent concentrations. If the extract contains any of the specifiedconstituents at a concentration equal to or greater than the respective regulatory limit (see Tables1 and 2, Toxicity Limits), then the waste is considered hazardous under the toxicitycharacteristic.
Method performance studies have been performed to determine the effect of variousperturbations on specific elements in the TCLP protocol. Ruggedness testing determines thesensitivity of small procedural variations which might be expected to occur during routinelaboratory application. None of the parameters had a significant effect on the results of theruggedness test.
Many TCLP precision (reproducibility) studies have been performed, and have shown that ingeneral the precision of the TCLP is comparable to or exceeds that of the EP Toxicity test, andthat method precision is adequate. One of the more significant contributions to poor precisionappears to be related to sample homogeneity, inter-laboratory variation (due to the nature ofwaste materials), and the inability of the laboratory to obtain a representative subsample of 100grams.
The results of a study of semi-volatile organic compounds, in Table 6 [17], showed excellentprecision, with greater than 90 percent of the results exhibiting relative standard deviations(RSD) less than 25%. Over 85% of all individual compounds in the multi-laboratory study fell inthe RSD range of 20-120%. It was determined that the high acetate content of the extraction fluiddid not present problems (i.e., column degradation of the gas chromatograph) for the analytical

16
conditions used. However, in some instances, the acetate matrix causes the lab to report elevatedresults.
A special extractor vessel, the zero-headspace extractor (ZHE) is used when testing for volatileanalytes. The ZHE allows for liquid/solid separation, extraction, and final extract filtrationwithin the device without opening the vessel and effectively precludes headspace.
Eleven laboratories participated in a collaborative study of the use of the ZHE with two wastetypes which were fortified with a mixture of volatile organic compounds (VOC). The results ofthe study are shown in Table 7 [17]. Precision results for VOC tend to occur over a considerablerange. However, the range and mean RSD compared very closely to the same collaborative studydone for metals. Blackburn and Show [20] concluded that at the 95% level of significance: 1)recoveries among laboratories were statistically similar, 2) recoveries did not vary significantlybetween the two sample types, and 3) each laboratory showed the same pattern of recovery foreach of the two samples.
EPA Method 1312, the SPLP is an agitated extraction method used to evaluate the potential forleaching metals into ground and surface waters. This method provides a more realisticassessment of metal mobility under actual field conditions, and therefore, may be oftenpreferable in waste characterization for BUD applications. However, the SPLP test may not beused for discriminating hazardous from non-hazardous waste under RCRA regulations. For thelatter purpose, the TCLP is the only approved method.
The SPLP extraction fluid is intended to simulate precipitation. For the eastern part of the USA(east of the Mississippi River), the fluid is slightly more acidic at pH 4.20 reflecting the airpollution impacts of heavy industrialization and coal utilization. A pH of 5.00 is used west of theMississippi. When the leachability of VOC or cyanide is being evaluated, reagent water is usedas the extraction fluid. The procedure requires particle size reduction to less than 9.5 mm, and aswith the TCLP, extraction for volatile constituents is performed in a zero-headspace extractor.
The SPLP is a method of choice when evaluating fate and transport of metals in a properlyengineered waste land disposal facility from which municipal solid waste is excluded. Othersituations may dictate the selection of a different leaching procedure.
METHODS FOR DETERMINATION OF METALS
EPA standard methods specify procedures for sample preparation techniques, samplingapproaches, and accurate quantitative analysis within specified concentration ranges. Theseprocedures are significantly different for organic and inorganic constituents. Table 8 lists theanalytical methods approved by EPA for sample preparation and determination of metalliccontaminants. Included are methods for the analysis of environmental samples (such as drinkingor ground water samples): both the EPA methods [21] and ASTM methods [22], and for theanalysis of solid waste leachate samples [17].
Determining concentrations of most of the metals can be achieved by inductively coupled plasmaatomic emission (EPA 200.7, EPA 6010, ASTM C1111-98 methods) or mass spectrometry (EPA200.8, EPA 6020, ASTM D5673-96 methods). Also, highly suitable for most of metals but less

17
expensive technique is atomic absorption spectrometry (EPA 200.9, EPA 7000 series, ASTM3919-99, ASTM4691-96 methods). Table 9 represents the analytical techniques used for theanalysis of metallic contaminants in drinking water and their detection limits as specified by MADEP [15].
Inductively coupled plasma – atomic emission spectrometry (ICP-AES) determines traceelements, including metals, in solution. All matrices, including ground water, TCLP and EPToxicity extracts, and solid wastes, require digestion prior to analysis. Samples must besolubilized or totally digested using appropriate sample preparation methods (e.g., EPA 3005-3060 methods). The ICP-AES is characterized by simultaneous, or rapid sequential,multielemental determination of elements. Detection limits, sensitivity, and optimum ranges ofthe metals vary with the matrices and model of analyzer. Use of this technique should berestricted to spectroscopists who are knowledgeable in the correction of spectral, chemical, andphysical interferences.
Inductively coupled plasma – mass spectrometry (ICP-MS) is applicable to the determination ofsub-µg/l concentrations of a large number (over 60) of elements in water samples and in wasteextracts or digests. Acid digestion prior to analysis is required for ground water and solid wastesas with the ICP-AES technique. Detection limits in simple matrices are generally below 0.1 µg/l,except for the less sensitive elements (e.g., Se and As) that may be 1.0 µg/l or higher. Thegreatest disadvantage of ICP-MS is isobaric elemental interferences. Mathematical correction forinterfering isotopic ions can minimize these interferences. An appropriate internal standard isrequired for each analyte determined by ICP-MS. In general ICP-MS exhibits superior sensitivitythan other techniques for most elements.
Flame atomic absorption spectrometry (Fl-AAS) direct aspiration determinations are normallycompleted as single element analyses and are relatively free of interelement spectralinterferences. Either a nitrous-oxide/acetylene or air/acetylene flame is used as an energy sourcefor dissociating the aspirated sample. In the analysis of some elements, the temperature or typeof flame used is critical. If the proper flame and analytical conditions are not used, chemical andionization interferences can occur. Fl-AAS and ICP-AES have comparable detection limits(within a factor of 4), except that ICP-AES exhibits greater sensitivity for refractories (Al, Ba,etc.).
Graphite furnace atomic absorption spectrometry (GF-AAS) uses an electrically heated graphitefurnace for sample atomization. In a furnace, the processes of dissolution, drying, decompositionof sample, and formation of atoms may be allowed to occur over a much longer time period thanin a flame or ICP, and at controlled temperatures. This allows an experienced analyst to removeunwanted matrix components by using temperature programming and/or matrix modifiers. Themajor advantage of this technique is that it affords very low detection limits, in general, lowerthan those in ICP-AES or Fl-AAS. Because this technique is so sensitive, interferences can be aproblem for complex matrices.
For arsenic and selenium, the hydride generation atomic absorption technique may be utilized toreduce and separate these two elements selectively from a sample digestate. Selective reductionof mercury is used in cold-vapor atomic absorption technique. These procedures are sensitive butsubjected to interferences from oxidizing agents and volatile compounds.
18
METHODS FOR ORGANIC COMPOUND ANALYSIS
The most commonly used technique for determination of organic constituents is the capillary gaschromatography with mass spectrometric detection (GC-MS). With this technique, EPAestablished two different methods for detection of volatile organic compounds (Method 8260)and for detection of semi- volatile organic compounds (Method 8270). These methods appear tohave the scope of analytes which may be present in residues of spent foundry sand. For somespecific compounds, other methods could be also useful. Method 8151, capillary gaschromatography with an electron capture detector may be applied for determining certainchlorinated acidic compounds and pentachlorphenols in aqueous, soil and waste matrices.Method 8082, capillary gas chromatography with electron capture detectors or electrolyticconductivity detectors is used to determine the concentrations of polychlorinated biphenyls(PCB) in extracts from solid and aqueous matrices. All relevant analytical methods for organiccompound detection are summarized in Table 10.
Method 8270 is used to determine the concentration of semi-volatile organic compounds inextracts prepared from various types of matrices such as solid waste, soils and ground water.This method can be used to quantitate most neutral, acidic and basic organic compounds that aresoluble in methylene chloride and capable of being eluted without derivatization. The estimatedquantitation limit of the method for determining an individual semi-volatile compound isapproximately 10 µg/l for ground water samples. Some of these organic compounds may befound in spent foundry sand.
Method 8260 is used to determine volatile organic compounds in a variety of solid wastematrices. This method is applicable to nearly all types of samples, including ground and surfacewater, waste solvents, soils, and sediments. Method 8260 can be used to quantitate most volatileorganic compounds that have boiling points below 200°C (low molecular weight halogenatedhydrocarbons, aromatics, ketones, nitriles, acetates, acrylates, ethers, and sulfides). Thequantitation limits of Method 8260 for individual compounds are instrument dependent anddependent on the choice of sample preparation/introduction method. Using standard quadrapoleinstrumentation and the purge-and-trap technique, limits should be approximately 0.5 mg/kg(wet weight) for wastes, and 5 µg/l for ground water. Lower limits may be achieved using an iontrap mass spectrometer or other instrumentation of improved design.
Method 8250 (the packed column version of Method 8270) was tested by 15 laboratories usingorganic-free reagent water, drinking water, surface water, and industrial waste water spiked at sixconcentrations over the range 5-1300 µg/l. Single operator accuracy and precision, and methodaccuracy were found to be directly related to the concentration of the analyte and essentiallyindependent of the sample matrix.
Chromatograms from calibration standards analyzed with Day 0 and Day 7 samples werecompared to detect possible deterioration of GC performance. These recoveries (using Method3510 extraction) range from 70 to 108%. The method is applicable to concentration techniquesfor preparing the extract for the appropriate determinative methods (see Table 10).
Several EPA methods were designed exclusively for analysis of drinking water [23]. Theseinclude Method 524.2 for detection of volatile organics, Method 525 for detection of extractable

19
semi-volatile organics, and Methods 508 and 508A for detection of polychlorinated biphenyls(PCB). EPA Methods 624, 625, and 608 were correspondingly allocated for determination ofvolatile, semi-volatile organic contaminants, and PCBs in surface water and wastewater.
STATISTICAL TREATMENT
To establish and analyze chemical characteristics for a wide spectrum of foundry sand wastesthat shows a high degree of random variation, statistical protocols must be used. The statisticalanalysis play a critical role in the interpretation of results and in regulatory determinations madewith regard to beneficial use applications. Statistical inference obtained from an array of datarequires systematic techniques that provide unbiased, accurate, and reproducible results. Theseresults require interpretation in accordance with the objective for which the raw data wasobtained. Different interpretations may be reached from the same data set if different parametersare used for evaluation. Consistent techniques of categorizing and testing data can be establishedonly on the statistical basis. In deciding which statistical test is appropriate, one needs toconsider the theoretical properties of the test and the characteristics of the data.
Statistical tests are used as a means of examining and comparing highly variable values of thespent sand leaching potential. It is important to be able to determine whether or not there is astatistically significant difference from an average level for each parameter and constituent. Inmaking this comparison, the analyst must apply a statistical procedure to make a determinationwhether there is statistically significant change. Such a variation can be a result of samplingerror, analysis error, or natural variation. The total expected error is usually considered in thepropagation of errors treatment. It is usually done by determining the summation of the variancesof all the measurements made in the process.
Almost all statistical procedures are based on the assumption that samples are independent andselected at random, and therefore reflect the true range of natural variability. Replicate samplesare not considered to be statistically independent measurements. Several statistical parameterssuch as simple maxima, means, medians, and relative standard deviations can be used to providean overview of the randomly scattered data. However in chemical analysis of spent foundry sand,the data scatter is so large that the relative standard deviations are often greater than therespective mean values, and therefore, the normality of data sets is violated.
The factors more appropriate for large multivariate data sets are measures of the central tendencyand the variance. These measures include the mean, median and mode; the upper confidencelevel for normally distributed data and the use of non-parametric statistics for data that is notnormally distributed (i.e., the Wilcoxon test), and the use of quartiles. For the purpose ofevaluating solid wastes, the confidence interval of 80% on normally-distributed data sets hasbeen selected. For non-normal data sets, a variety of transformations (e.g., square root,logarithmic, arcsine square root, and etc.) can be performed to stabilize the variances, improvethe normality of data distribution, and obtain the confidence intervals. If either trans formation isapplied, all subsequent statistical evaluations are performed at the transformed scale. The 80%upper confidence limit is then compared with the appropriate regulatory threshold. If the upperlimit is less than the regulatory value the chemical contaminant is not considered to be present inthe waste at a hazardous level; otherwise the opposite conclusion is drawn.

20
CHARACTERIZATION OF VIRGIN AND SPENT FOUNDRY SAND
PHYSICAL CHARACTERISTICS OF SPENT SAND
Spent foundry sands have been found suitable for various beneficial use applications. For sanduse in construction applications, its fineness and compactability (grain size distribution) must beconsidered. Its physical characteristics have been characterized as having good strengthproperties and a relatively low hydraulic conductivity. The latter quality assures that the materialis not freely draining after compaction into highway embankments [11]. Bulk specific gravity,moisture content, and grain size distribution are the most useful characteristics of beneficiallyused sand. Large foreign objects (metallic entrapments, etc.) are typically screened out beforeutilizing foundry sand waste.
The grain size distribution of spent casting sands is usually uniform, with all of the particlespassing the 600 µm sieve; more than 50 percent of the particles passing the 300 µm sieve; andnearly all of the particles retained at the 150 µm sieve. The finest content passing the 200 µmsieve constitutes up to 20% of waste foundry sand. The uniform size of spent casting sandprovides good flowability. The material properties of five samples of foundry sands and areference sample of siliceous river-run sand are given in Table 11 and the particle sizedistribution is shown in Fig. 6 [12]. Distribution of the grain sizes influences many properties ofthe material. Most notable are the effects upon permeability and surface fineness, both associatedwith the strength properties.
Figure 6. Grain size distribution of foundry sands
A – Siliceous river-run sandB – Thermally reclaimed sandC – Mechanically reclaimed sandD – Spent clay-bonded sandE – Spent clay-bonded sand

21
The material characteristics of spent foundry sand are similar to that of fine silica sand, but differin a few aspects. Nearly all types of spent casting sands fall in the particle range between 0.1 and0.6 mm. Because of a very thin band in grain sizes, waste foundry sands are blended with acoarse crushed limestone for flowable fill applications. Sand B in Fig. 6 was thermally reclaimedafter casting to burn off the excess polymer bonding agents [12]. Sand C is the same material asB, except the bonding agents were not removed, but sand was screened to separate any cores.Sands D and E are spent bentonite-bonded sands with different absorption percent, both screenedof excess residuals. The bentonite was more fully fused in the sample D, and it was coarser thansand E. The uniformity of these byproducts suggests their utility in manufactured productsprocesses.
Green (clay-bonded) sand, commonly used in metalcasting, is composed of uniform high-qualityquartz sand (85-95%), cohesive bentonite clay (4-10%) as the binder, a volatile carbonaceoussea-coal additive (2-10%) to improve casting surface finish, iron oxide (0.5-5%) for strength, andwater (2-5%). Spent chemically bonded casting sand has a very low moisture absorption. Clay-bonded sands have higher absorption with 5 to 10 percent clay minerals. The clay remaining inspent sand after the casting cycle is partially sintered and not present as raw bentonite. For greensand processes, reclaiming the sand may be as simple as capturing it once the metal casting isremoved and returning it directly to the beginning of the process. Other green sand processesmay require mechanical lump reduction to separate the sand into reusable grains.
Precise quantification of physical properties of the residual sand material is important for themarketability of the spent foundry sand. The sand wastes from the green sand systems aretypically characterized by specific gravity (2.39-2.69 g/cm3), permeability (10-3 - 10-6 cm/sec),and moisture content (0.1-10 %). Molding sands are refractory to temperatures approaching1700°C, although phase transformations involving volume changes may occur at lowertemperatures.
The American Society for Testing and Materials (ASTM) has developed a 1997 nationalspecification for use of by-products in structural fills (E1861-97). A successful use of wastefoundry sand in flowable fill was reported by Tikalsky et al. [12] and Stern [13]. Naik et al. [14]reported on utilization of used foundry sand in concrete. When foundry sands are used as apartial replacement for fine aggregates in the production of concrete the combined fineaggregates should have the gradation recommended by the ASTM C33 standard. Partridge et al.[11] conducted geotechnical investigations to determine the engineering properties of spentfoundry sand for highway embankment construction. Results from the latter study arerepresented in Table 12.
Asphalt production may benefit from the sub-angular shape of foundry waste sand if used as amix ingredient. Current regulations in many states are discouraging the use of rounded riverbottom aggregate and are instead using more angular, manufactured aggregates. Foundry sandcould potentially meet the needs of this market. A successful decade-long project using wastesand in asphalt production has been demonstrated in Canada [6]. Some concern of a possiblenegative impact on air emissions resulting from the processing of waste sand containing organicshas been addressed. It has been proven that these materials add very little to the air emission ofan asphalt plant and that these additions may be adequately captured by the facilities’ existing airpollution control equipment.

22
In order to establish technical specifications and performance standards for various engineeredbeneficial uses of spent foundry sands and slags, an industry-sponsored consortium for marketdevelopment, the Foundry Industry Recycling Starts Today (FIRST) has been recently founded.The FIRST web site [9] compiles a comprehensive list of foundry by-product utilization projects.The FIRST library contains a large number of technical publications related to beneficial use,marketability, characterization, and minimization of foundry waste streams. However, additionaltesting for materials properties is needed to support development of specifications includingfoundry sand.
CHARACTERISTICS OF FOUNDRY BINDERS AND RESINS
The annual generation of foundry waste (including dust and spent foundry sand) in the UnitedStates alone is reported to range from 9 to 13.6 million metric tons [24]. Typically, about 1 ton offoundry sand is required for each ton of iron or steel casting produced. Massachusetts foundriesuse more than 40 thousand tons of sand and spend a total of about $0.6 million on sand disposalper year [1].
A brief description of the chemical composition of typical foundry sand is useful, particularly asit relates to the various binder systems employed. The makeup of residual sand material fromiron and non-ferrous foundries in Massachusetts is typical to other states. The major componentsare 70-80% quartz sand, 5-15% clay, 2-5% additives, and up to 4% moisture. Foundry sandconsists primarily of clean, uniformly sized silica sand that is bonded via binder(s) to form moldsfor ferrous (iron and steel) and non-ferrous (copper, aluminum, brass) metal castings. Thechemical composition of typical foundry sand is given in Table 13.
The most common casting process used in the foundry industry is the sand cast system.Virtually all sand cast molds for ferrous castings are of the green sand type. In addition to greensand molds, chemically bonded sand cast systems are also used. The latter systems involve theuse of one or more proprietary organic binders in conjunction with catalysts using differenthardening and setting procedures. In chemically bonded sand cast systems, additions may be asmuch as 3% of mixture by weight. Chemically bonded systems are most often used for makingcores (used to produce cavities in molding operations) and molds for non-ferrous castings. Thetype of metal being cast determines which additives and what gradation of sand is used.
Spent foundry sand consists primarily of silica sand, coated with a thin film of burnt carbon,residual binder and dust. Silica sand is hydrophilic and consequently attracts water to its surface.Table 14 lists the chemical composition of a typical sample of spent foundry sand as determinedby X-ray fluorescence. Depending on the binder and type of metal cast, the pH of spent foundrysand can vary from approximately 4 to 8. It has been reported that some spent foundry sandsmixed with untreated sludges can be corrosive to metals (due to pH of the sludge).
Virgin foundry sand is a uniformly graded material. However after casting, sand often containsmetal, mold and core materials containing partially degraded binder. Spent foundry sand mayalso contain leachable contaminants, including heavy metals and organic compounds such asphenols that are captured between sand grains or coated on the grain surface during the moldingprocess and casting operations. Among foundry by-products, baghouse dusts often have thehighest contaminant leaching potential, partially because of the small size of their particles. The
23
dusts vary in their composition and physical makeup. Large quantities of silicon oxide, carbonsilicate, metals (Fe, Zn), and metal oxides have been detected in foundry dusts.
The main volume of all foundry sand is being used as green (clay-bonded) sand. Spent sand fromthe green sand process is the major by-product, and it seems to pose the least environmentalconcern. A possible reason for this is that the virgin green system is environmentally harmlessand it does not form potentially harmful compounds during an optimized casting process. Incontrast, virgin chemically-bonded systems may contain toxic/irritant constituents (binders,hardeners) that decompose for the most part when molten metal is poured into molds. Therefore,fate of binders and resins shall be particularly concerned and be given further consideration.
Chemical Composition of Foundry Sand Binders
All foundries, worldwide, employ the use of binders to “hold” together individual grains of sandthat are used to form mold castings. A binder is any material, added to virgin sand, which bymeans of adhesion and/or cohesion, bonds sand grains to a degree suitable for metal castingrequirements. The two principle types of binders are clay-bonded "green sand" and chemicallybonded sand. This section includes the characterization of foundry sand binders and resins withrespect to their organic compound content.
Due to the proprietary nature of the composition of foundry sand binders, there is little publiclyavailable information regarding the relative proportions of materials used in common binders andresins. A qualitative list of the composition of some binders is provided in the AmericanFoundrymen’s Society publications [25-27]. A variety of foundry binder systems is categorizedby type of the curing/setting process in Table 15. The most common types of binders currently inuse include the following:
– Furan (Furfuryl Alcohol) Resin– Phenolic Urethane– Phenolic Nobake-Acid– Phenolic Resole-Ester– Sodium Silicate– Phosphate– Alkyd (Oil) Urethane– Shell Liquids/Powders and Flake Resins
The majority of binder systems used in modern foundries are self–setting chemical binders.Phenolic Urethane and Sodium Silicate binders are most prevalent among Massachusettsfoundries. Oil-based and cement-based systems are old technologies and rarely used today. Allsystems fall into two broad categories: organic and inorganic systems. The most common bindersfor both types of systems are described below.
Furan Systems
Furan resins are organic systems. They were first introduced to the foundry industry in the late1950’s. In the early 1960’s the furan nobake (FNB) process emerged. In the furan process, theresin converts from liquids to solids at room temperature when exposed to an acid catalyst; aprocess termed polymerization. The polymerization reaction is exothermic and produces a small

24
amount of water as a by-product. The system is considered one of the easiest chemical systemsto reclaim.
There are two main chemicals in the furan process: furfuryl alcohol based resin and an acidcatalyst. The term “furan” is only a generic term that denotes the basic structure of a class ofcompounds. There is no dioxin furan used in making furan resins. The main component used informulating the resins is furfuryl alcohol, which is a colorless to pale yellow liquid andpolymerizes very readily in the presence of acid.
There are several grades of resins, usually classified under three general categories, dependingon the nitrogen and water content:
Resin Grade Nitrogen (%) Water (%)Low 0 – 3 0 – 5Medium 2 – 8 5 – 15High 5 – 11 10 – 30
All of the furan resins contain furfuryl alcohol either as the monomeric chemical or in apolymeric form. Other chemicals that may be incorporated in the resin system are urea,formaldehyde, water, phenol or phenolic derivatives, and other chemicals, depending upon theproprietary formula. Typically, optimum binder levels may vary from approximately 0.8 to 1.5%of the sand mixture by weight [25].
The second part of the FNB system is the acid catalyst that causes the furan resin/sand mix tocure or harden. Catalysts are usually proprietary mixtures of acids and solvents, water andmethanol. The two main classes of catalysts are the phosphoric acid-based (normally 70 – 85%phosphoric acid) and the sulfonic acid-based (solutions of benzensulfonic acid (BSA) ortoluenesulfonic acid (TSA), or other sulfonic acids, at times in combination). The solvents arewater or methanol. The concentrations of the acids vary from 50 to 80%.
Phenolic Acid-Cured Systems
The phenolic acid-cured system became popular in the 1970’s as an alternative to the furansystem. The system is organic and based on complex polymers that are formed in a condensationreaction which takes place when phenol and formaldehyde are reacted at elevated temperatures.The polymerization reaction is exothermic and produces water as a by-product (0.2%). Phenolicresins do not require the use of additional additives to the sand mixture. Sand reclamation is veryeasy due to the brittle nature of the bond at room temperature. The brittleness can cause“veining” and some foundries add 1 – 2% iron oxide to reduce this problem.
The resins are modified with silane, an adhesion promoter. In general, resin contents are in therange of 1.0 to 1.5% for cores and 0.8 to 1.3% for molds. The acid catalysts most commonlyused in this system are TSA, BSA or blends of the two. Xylenesulfonic acid (XSA) is also usedas a catalyst. Acids are used at between 20 to 40% of the resin weight.

25
Phenolic Ester-Cured Systems
The ester cured phenolic self-setting system has been under development for 30 years inEngland. However, only in the past several years have the developments in the chemistries forfoundry applications been available [26].
The chemical components are relatively simple; however, the reaction between the chemicals issophisticated. The two components are a phenolic compound and an ester, and by combining thetwo, the ester causes the phenolic compound to polymerize into an insoluble gelled binder. Theby-products of the reaction are a polymerized phenol/formaldehyde resin, a metallic salt and analcohol. All conventional, commercially available mixing devices work with the ester curedphenolic system [26].
One of the unique properties of the ester cured phenolic system is that it undergoes a secondarycure during the casting process. This thermosetting phase allows for some sand expansion, butalso causes the system to increase in hot strength and reduce distortion. The result is a thermallystable bond during the casting process. All metals can be cast on the system and the system isreadily reclaimable.
Chemicals used in this process are resins and catalysts. The phenolic compound resin is analkaline liquid containing:
– Less than 0.5% formaldehyde– Less than 2% phenol– A significant portion of an inorganic compound
The reaction between the ester and the resin is a balanced reaction; therefore, the proper ratiomust be maintained as recommended by the manufacturer. The total level of chemicals based onsand is determined by the strength requirements of the cores/molds. Depending on the sand type,the levels recommended are 0.75% for zircon sand and up to 3% for olivine sand. The resin isalkaline in nature and proper care must be taken when handling it.
The catalyst/hardeners are compounds of commercially available esters. There are a largenumber of esters that can be used for the polymerization process. The important aspect is thatthey are relatively non-toxic. The recommended level of ester is determined by the resin orbinder.
The cure rate is not affected by the acid demand value (ADV) which is a measure of the amountof basic material present in the sand that is soluble in dilute acidic solution. Since the reactionwhich cures many resins systems is acid catalyzed, and since the acid used is typically very mild,the presence of basic substances which can neutralize the weak acid will retard the curingreaction. The ADV of the sand should therefore be continually evaluated, since drastic changescan require a catalyst modification.
The ester cured phenolic system can be reclaimed by attrition or thermal reclaimers. The netamount of usable sand returned is similar to other systems and is a function of loss on ignition(LOI) of the sand. Depending on the metal cast, the LOI has to be controlled through loss in thereclamation unit and new sand additions.

26
Alkyd Urethane Systems
The urethane family of organic binders was developed in the middle 1960s. The alkyd urethanesystem was the first developed when it was discovered that an isocyanate reacted with the coreoil, causing the metallic dryer to perform better, thereby creating a urethane bond.
Alkyd urethane systems cure in three stages. The first stage is the urethane reaction and unitesthe hydroxyl groups from the resin with the cyano groups in the isocyanate (coreactant). A weakurethane bond develops which is then strengthened as the unsaturated alkyd resin reacts withoxygen, i.e., the oxidation of the unsaturated oil bonds (stage two). The third stage occurs duringheating the mold to 350 – 400°F when additional crosslinking develops. This final stagedetermines the ultimate strength of the resin.
Chemicals used in the process are resins, catalysts, and coreactants. The resin is a modifiedvegetable or natural oil capable of forming a urethane bond when reacted with a polyisocyanateand catalyst. The catalyst is a combination of amines and metallic drying agents which facilitateboth urethane and oxidization reactions. The coreactant is polyisocyanate (or polymericisocyanate) which is the coreactant to resin and contains about 10% by weight nitrogen. It reactswith water to form a urethane polymer and CO2 gas as a by-product and should be added at 18 –20% of resin. Too much coreactant will increase the possibility of gas defects and should be usedaccordingly.
This system is less sensitive to sand chemistry than acid catalyzed systems and is completelycompatible with silica, alumina silicate, zircon, chromite and olivine sands.
Sometimes, the reclaimed sand from the alkyd urethane systems must be bonded with a differenttype of chemical system than used originally. Some foundries use a different type of chemicalbinder system to make cores, but not molds, and that can cause a problem in reclamation.Chemical compatibility in a reclaimed sand is dependent upon the sand to metal ratio,reclamation method, amount of new sand and chemical systems. In general, reclaimed sandfrom an alkyd resin system can be rebound with silicates but is not always compatible withphenolic urethane, furan and phenolic acid systems.
The system may require an iron oxide addition to control lustrous carbon, veining, and /ornitrogen pinhole defects. Magnetite (black) oxide or Hematite (red) oxide should be added to 2 –3% or 1 – 2% based on silica sand, respectively.
All metals can be poured using this system. Some steels may pick up surface carbon, althoughthe properties of the castings are generally not affected. With the proper iron oxide addition,nitrogen pinholing is not a problem.
Phenolic Urethane No-Bake Systems
The phenolic urethane system is an organic system. It was introduced to U.S. foundries in 1970.This system is cured by the reaction between a polybenzylic-ether-phenolic resin and apolyphenyl polyisocyanate in the presence of a catalyst, such as a derivative of pyridine.

27
The unique feature of the system is the curing reaction itself. There is a delay in the curingreaction after the three components are mixed with the sand. This delay is the “work life” of themix and enables the sand mix to remain free flowing until the curing reaction begins.
The resin and coreactant may be modified with solvents. Total binder level is based on theweight of the sand and is usually in the range of 0.7 – 2.0%. The normal ratio of resin to catalystis 50:50. Catalyst usage is generally 0.4 – 10% of the weight of resin, depending on the strip timedesired, type of sand, sand temperature and catalyst type. The resin has a polymeric isocyanate(coreactant) which will react with water to form a urethane polymer and CO2 gas as a by-product.
Additives can be used to correct many problems which occur on casting. Iron oxide, either black(Fe3O4) or red (Fe2O3), is the most common and is used to reduce gas defects in steel castings.Once the reaction starts, it is extremely rapid and thorough. Because this crosslinking reactiondoes not evolve side products, the curing rate is constant throughout the entire sand mass.
The bonded sand is readily reusable through reclamation by current methods. However, as withother chemical binders, care should be exercised to assure efficient binder removal, as measuredby LOI tests. The use of sands having a high LOI (greater than 2%) can result in greater gasevolution and less than optimum tensile strength development.
Phenolic Urethane Cold Box Systems
The phenolic urethane cold box process uses two resin components, Part I phenolic resin andPart II polymeric isocyanate, and a gaseous catalyst vapor. Both resin components are mixedwith sand and the catalyst vapor is then passed through the sand mix. Hardening is achievedalmost instantly at room temperature. Catalyst vapor is followed by an air purge, which sweepsthe catalyst from the now hardened core. Water based coatings, alcohol lightoff, or solventrefractory coatings may be applied to the core surface.
The phenolic resin is a phenol-formaldehyde polymer blended with solvents and additives toproduce a low viscosity resin solution. The polymeric isocyanate is amethylchloroisothiazolinone (MCI) type blended with solvents and additives. No by-products,such as water, are formed during curing. The two resin components are mixed in equal parts onthe sand, i.e. 0.75% Part I and Part II.
Two tertiary amine catalysts are commonly used to cure the combined resins. Triethylamine(TEA) and dimethylethylamine (DMEA) are both volatile, flammable corrosive liquids.Warming the catalyst gas and the following air purge can reduce cycle times and minimizecatalyst usage. The exhaust gas from the corebox during the gassing and purging cycle willcontain the amine vapor, since it does not react with the core binders. This exhaust gas should becollected in a wet scrubber with a solution of dilute acid that neutralizes the amine to form toform non-volatile acid salt.
Clay/sugar blends are proprietary powdered sand mix additives used to suppress veining inferrous casting. They are typically used at 1 – 1.5% based on sand. Iron oxides of various typesare also used as additives. Depending on the need levels, from 0.25 to 3.0% are used.

28
Sodium Silicate Ester-Cured Systems
The sodium silicate/ester cured system is an inorganic system. It was developed in the late 1960sas an alternative to existing sodium silicate nobake systems using powdered dicalcium silicate,Portland cements, or ferosilicon as curing agents. The organic ester is hydrolyzed at a controlledrate by the alkaline sodium silicate. The acid produced reacts with sodium silicate to form asilica gel, which bonds the mold or core. No heat or gas is generated on curing.
The system provides an inorganic alternative to the organic chemical setting processes. Someadvantages are: low cost, ability to use with impure sands, low gas emission and resistance toexpansion defects in casting. The curing rate is mildly temperature dependent. Curing speeddepends upon the SiO 2 :Na2O ratio of the sodium silicate binder and the composition of the esterhardener. High ratio silicates are needed for fast curing.
Sodium silicate binders consist of solutions of sodium silicate in water. Many proprietary sodiumsilicate resins contain additions of sugars, carbohydrates, or polymers, primarily to improveshakeout. Most suppliers market a range of silicates varying in SiO 2 :Na2O ratio, solid contentand additives. Sodium silicates are nonflammable, nonexplosive alkaline liquids of relatively lowtoxicity.
The catalysts used are low viscosity liquid aliphatic organic esters with a sweet or acetic acid-like smell. Typical organic esters are:
– Glycerol diacetate (Diacetin) fast cure– Ethylene glycol diacetate (EGDA) medium cure– Glycerol triacetate (Triacetin) slow cure
Some of the esters may be weakly acidic but there are no known specific hazards associated withthe use of these materials. These esters are usually supplied as blends to obtain a desired striptime. Mixtures generally contain between 2.5-4.0% sodium silicate as a weight/weight additionto the sand. The ester catalyst (hardener) addition rate is 10-15% calculated by weight of thesodium silicate (binder). Fine sands generally require more binder.
Additives to the binder system are generally liquid organic polymers that enhance shakeout andimprove humidity resistance. The presence of sugar or polymer breakdown agents increase thegas evolution during pouring. Since the binders are nitrogen, sulfur and phosphorus free, thesystem is suitable for most cast metals.
Sand reclamation is usually by mechanical/attrition methods. The system is reclaimable to alesser extent than the organic systems and unless special binders are used, the utilization isusually less than 50%. Reclaimed sands previously bonded using acid catalyst must not beincluded in a mixture. The buildup of alkaline residues in the recycled sand may increase the riskof sand “burn-on.”

29
Cement Bonded Sand Systems
Cement has been used as an inorganic binder for foundry mold and core sands since the late1800s. But it was not until the early 1930s that the use of cement as a foundry binder becamesignificant. The major drawback of cement sand involves its slow curing rate.
Hydraulic cement is defined as a finely powdered, calcareous material that, when mixed withwater, forms a plastic paste that sets and hardens to rocklike consistency. The formation of arigid interlocking matrix of hydration products binds the composite cement mass together.
The hydraulic cement-bonded sands are quite sensitive to temperature variations. Temperaturesbelow about 68°F require the use of additives such as calcium chloride, polyphosphate,aluminum salts, carbon dioxide and molasses which are added in an effort to increase the curerate. The mechanical reclamation of hydraulic cements is a dry process with, reportedly, 80%reclaimed sand mixtures successfully reused in foundries.
Phosphate Systems
The phosphate self-setting inorganic system was developed as an alternative to sodium silicatewith improved shakeout properties and reclaimability. The chemical process is based on thereaction of the catalyst/hardener with water. This provides a mildly alkaline reaction and thecatalyst/hardener slowly undergoes hydration which alters its chemical reactivity and physicalstate. The reaction between the resin and catalyst is very exothermic.
Chemicals of the process include a resin and a catalyst. Recommended resin levels are 2.5 –3.0% for molds and 3.5 – 4.0% for core production. The catalyst/hardener level varies from 18 –35% of the resin depending on the sand temperature, impurities, mixing efficiency, and desiredwork life. The system consists of water soluble acidic aluminum phosphate liquid resin and apowdered magnesium oxide catalyst/hardener. The resin is acidic and all equipment used mustbe acid resistant. The phosphate sand system, after pouring and shakeout, can be mechanicallyreclaimed and recycled.
Castable/Fluid Sand Systems
This is a novel inorganic system in which chemically bonded sand mixtures are converted intofluid slurries from which molds or cores are cast and then self hardened. Variations include theuse of sodium silicate, cement, or synthetic organic resins. The system is mainly used infoundries in Russia and Europe.
The fluid properties result from the addition of foaming agents to a sand mixture and airentrainment during mixing. Sodium silicate binders are hardened by the addition of dicalciumsilicate, while the Portland cement binders react with water to form a bond. Alternatively, acidcatalyzed phenol furfuryl resins are used for bonding purposes.
In the silicate system, high SiO 2 :Na2O ratio binders are used without the addition of sugars orpolymers for breakdown purposes. In the various versions of the fluid sand system the mainbinders are:
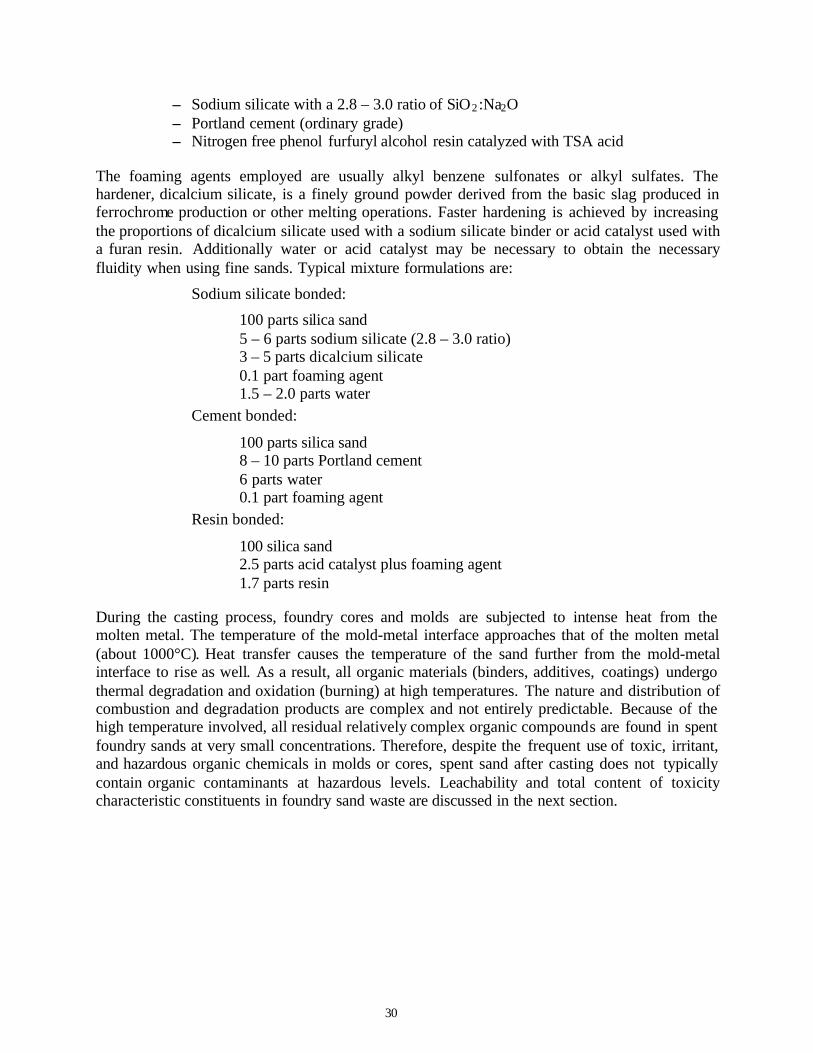
30
– Sodium silicate with a 2.8 – 3.0 ratio of SiO2 :Na2O– Portland cement (ordinary grade)– Nitrogen free phenol furfuryl alcohol resin catalyzed with TSA acid
The foaming agents employed are usually alkyl benzene sulfonates or alkyl sulfates. Thehardener, dicalcium silicate, is a finely ground powder derived from the basic slag produced inferrochrome production or other melting operations. Faster hardening is achieved by increasingthe proportions of dicalcium silicate used with a sodium silicate binder or acid catalyst used witha furan resin. Additionally water or acid catalyst may be necessary to obtain the necessaryfluidity when using fine sands. Typical mixture formulations are:
Sodium silicate bonded:
100 parts silica sand5 – 6 parts sodium silicate (2.8 – 3.0 ratio)3 – 5 parts dicalcium silicate0.1 part foaming agent1.5 – 2.0 parts water
Cement bonded:
100 parts silica sand8 – 10 parts Portland cement6 parts water0.1 part foaming agent
Resin bonded:
100 silica sand2.5 parts acid catalyst plus foaming agent1.7 parts resin
During the casting process, foundry cores and molds are subjected to intense heat from themolten metal. The temperature of the mold-metal interface approaches that of the molten metal(about 1000°C). Heat transfer causes the temperature of the sand further from the mold-metalinterface to rise as well. As a result, all organic materials (binders, additives, coatings) undergothermal degradation and oxidation (burning) at high temperatures. The nature and distribution ofcombustion and degradation products are complex and not entirely predictable. Because of thehigh temperature involved, all residual relatively complex organic compounds are found in spentfoundry sands at very small concentrations. Therefore, despite the frequent use of toxic, irritant,and hazardous organic chemicals in molds or cores, spent sand after casting does not typicallycontain organic contaminants at hazardous levels. Leachability and total content of toxicitycharacteristic constituents in foundry sand waste are discussed in the next section.

31
CONTAMINANTS IN SPENT FOUNDRY SAND
The environmental stability of spent foundry sand (collected with at least a minimum qualitycontrol) has been shown very clearly by a number of investigations [8,11,28-37]. Variations maybe attributed to differences in processes, sand quality control, and testing procedures. Chemicalcharacteristics are essential to the determination of the sand product as an environmentallybenign material. On the other hand, long term environmental and human health effects fromcommon beneficial use practices are still being studied and are not well documented in thetechnical literature. Results of the chemical analysis obtained for the Toxicity CharacteristicLeaching Procedure and bulk element content of foundry sand waste and other wastecomponents are discussed below.
METALLIC CONTAMINANTS
Different procedures for evaluation of leachability of chemicals to ground water exist. For manyinorganic compounds, Toxicity Characteristic Leaching Procedure, Synthetic PrecipitationLeaching Procedure ("acid rain" test), sequential aqueous extraction procedure, or "total" bulkmetal laboratory analysis may be used. To properly evaluate the fate of contaminants in wastes,the pH of the ground water that is expected to migrate through the sand waste must be observed.The exposure of beneficially used materials to the environment in different practices is variable.For example, Portland cement in a foundation versus fill material in a bridge abutment have verydifferent exposures. However, it is useful to analyze for total metals because the soil ingestionand inhalation remediation objectives are also measured in this way. For metals in ground water,investigative samples should be unfiltered.
While samples from the same type of foundry often demonstrate a large scatter in chemicalparameters, a definite similarity of the spent sand characteristics exists across the foundriesregardless of the metals cast [28]. This result signifies that the type of molding process,additives, type of charge (virgin or scrap) and type of metal poured may not be suitable terms formeasuring statistical differences in a degree of hazard. Therefore, specific characterization offoundry sand waste based on process type or metal poured is not always feasible. However abroader statistical analysis should be performed instead. Although this variation is present inmany cases, especially in characterizing mixed foundry waste, there are other situations whenindividual waste streams and mixed waste alike have quite acceptable (small) coefficients ofvariation in chemical characteristics.
Review of Available Data on Metal Leaching
An overview of publicly available results on leachability of metals from foundry sand waste isrepresented in Table 16. The Federal primary and secondary drinking water standards as well asthe toxicity characteristic levels are included in the table to facilitate reference to regulatorystandards. Four significantly different methods were used for the characterization of leachabilityof metals from foundry waste sands. The first is field leachate measurements obtained withground water monitoring lysimeters. The second is TCLP and/or EP Toxicity acetic acid tests.The third is sequential aqueous extraction tests. Finally, fourth is a rigorous leaching inconcentrated aqua regia (German standard method DIN 38 414 S7).

32
Random scattering around mean values is very large. The standard deviations are usually greaterthan the respective mean concentrations. Within this scatter the differences between TCLP andEP Toxicity test results become statistically insignificant. One of the consequences of theextensive fluctuations is an inconsistency in data representation by different researchers.Average, median, or maximum values are occasionally reported. Only a few projects [28, 29]were completed with comprehensive statistical analyses that included the determination of aroster of statistical parameters to characterize a vast pool of analytical data. A detailed discussionof waste stream variability and sampling techniques for leaching from foundry waste waspresented by Krueger et al. [30].
Several conclusions can be drawn from the Table 16. Perhaps the most important is that spentfoundry sand disposed of in a foundry monofill [31] or used in highway construction [8] leachesregulated metals well below the toxicity characteristic levels. This is usually because theconstituents are either present in forms that are not soluble or are unavailable to the leachingmedia. Even when the presence of the constituents in a bulk waste stream can be traced, it doesnot always imply that they could readily be leached. A comparison to a mixed-waste municipallandfill [32] indicates that the foundry sand waste leaches one to two orders of magnitude lessthan the typical waste in a municipal landfill. The latter is otherwise known to leach highconcentrations of toxic substances in many instances [33]. Unlike usually neutral foundrymonofills, an actively decomposing municipal landfill is contaminated with organic acids typicalof microbial action.
The Table 16 also shows that the TCLP and EP Toxicity laboratory tests usually yieldsignificantly higher leachability results than that in real field conditions. This is because thetoxicity characteristic tests are designed to simulate the worst case conditions in a municipallandfill in the presence of carboxylic acids as the leachate. Such conditions do not necessarilyrealize in other disposal scenarios, and never realize in foundry monofills. An "acid rain" testwith a mixture of nitric and sulfuric acids [34] also proved to be less aggressive than the aceticacid used in the TCLP (see Table 18 for a comparison of metal leachability in TCLP and SPLP).To accurately simulate real field conditions the sequential aqueous extraction method seems tobe the most appropriate.
Nonetheless, even under the more rigorous TCLP test, extract contained concentrations typicallybelow the regulatory toxicity characteristic levels if the spent foundry sand was not mixed withthe other foundry waste streams (e.g., dust, slag, or sludge). In most occasions, mixed foundrywaste also leaches below the regulatory levels. For example, a Michigan ferrous foundry mixesspent sand with several kinds of baghouse dust, after separately analyzing and characterizingeach of them as non-hazardous. The resulting mixture meets all (primary and secondary)drinking water standards and may thus be allowed for various beneficial uses, including directland application. On the other hand, an examination of Table 16 reveals in at least one eventwhen a mixture of spent green sand and dusts from a brass foundry was reported to leach lead(Pb) in both TCLP and EP Toxicity tests above the toxicity characteristic threshold. In that case,spent sand was not analyzed separately from dusts, but some of the dusts leached up to 170 mg/lof lead [36]. Table 19 demonstrates elevated concentrations of lead (well above the toxicitycharacteristic level) leached from spent molds after casting of highly leaded copper-based alloys(5-25% Pb).

33
Different dusts/fines and slags behave differently. Slags from ferrous and aluminum foundriesare usually non-hazardous and often beneficially used. In other occasions, all foundry wastestreams are mixed for landfill disposal posing no environmental risk. But there is less data onchemical characterization of foundry waste streams other than spent sand. Some of those streamsare known to be hazardous, especially leaded brass/bronze baghouse and shotblast dusts whichcontain elevated levels of lead. Characterization of dusts and fines should be subject to separateinvestigation. This report is focused on spent foundry sand, chiefly because it is a major bulk by-product and enough data on chemical analysis of foundry sands exist to draw some unambiguousconclusions.
Results of the laboratory analysis depend significantly on type of leaching procedure that isapplied. A rigorous extraction in the German DIN 38 414 S7 test (with aqua regia) causes veryhigh leaching of chromium and somewhat elevated leaching of lead from foundry wastecompared to TCLP or EP Toxicity tests (see Table 16). Since the DIN 38 414 S7 is notably moreaggressive that TCLP, results from this test are not applicable for a comparison with the toxicitycharacteristic levels adopted in the USA. Contrary to the DIN 38 414 S7 test, the SPLP methoddisplays two orders of magnitude decrease in lead leachability relative to TCLP, while chromiumleachability in latter tests differs only about 5 times (see Table 18). Finally, the results fromsequential aqueous extraction procedure do not raise a concern on metal leachability of foundrywaste (Table 16).
Table 17 summarizes the results of the total metal analysis of the foundry waste sand as well asunprocessed molding sand and natural sand and sandy soil. It is clear from this table thatquantities of total metal content in spent and virgin sand and in sandy soils are of the same orderof magnitude. Most often, less metals were found in sands than in soils. Taking intoconsideration a 20x dilution factor included in the TCLP method, the data in Table 17 may bedivided 20 times in order to estimate the upper limits for leaching concentrations (with anassumption that 100% of metal content would leach in the TCLP test). From the data in Table17, such upper estimates for leachate concentrations are below the toxicity characteristic levelsfor all regulated metals except chromium. However, actual TCLP leachability of chromium fromfoundry sand is rather weak as seen in Table 16. No meaningful correlation between the totalmetal content and the leachability of it from foundry waste in the TCLP tests was generallyobserved (see Table 19).
The chemical forms of the actual metallic species and compounds (e.g., oxides, silicates) presentin the foundry by-products have not yet been investigated. Each metal compound exhibits uniquefate, transport, and toxicity characteristics. In this sense, elemental metals analysis represents a“worst case” scenario, assuming that all metal forms exhibit maximum degree of risk to humanhealth and the environment. Model experiments with leachability of lead present in severalchemical forms, portray a significant difference between leaching potential of metalparticles/droplets, metal oxides, or metal silicates (Table 19). Moreover, there is an apparent lackof quantitative data on differences between the results from the TCLP and SPLP, or otherextraction methods, with most of the research concentrated only on the TCLP or EP Toxicitytests.
Mixed materials add significant complexity to understanding the waste sands. However, as longas a mixture of spent sands and foundry fines/dusts is categorized as a non-hazardous material, it

34
can find its way into a variety of applications. Although fines can sometimes downgrade themarketability of a given mix because of size gradation issues (e.g., in asphalt), some applicationsrequire finer material, such as flowable fill (low-strength concrete), where the fines help achievethe desired maximum compressive strength needed. The testing procedure can identify allcontaminants whether they come from the casting molds, cores , fines or sweepings from thecleaning room. This suggests further need to assess materials in the content of recycling,beneficial use and handling practices.
LEACHING OF ORGANICS
A limited number of investigations have been conducted to determine the potential and extent oforganic residues in spent foundry sand and leachates from disposal sites containing spentfoundry sand.
Green sand appears to be of very low organic compound leaching potential compared to thechemically-bonded sands. This result seems reasonable if one recognizes that mineral green sandsystems would leach little organic matter. Since the major volume of spent foundry sand comesfrom the green sand processes, the foundry waste is rarely analyzed for the organic content.
A detailed study by Ham et al. [35] specified organic compounds in ferrous foundry processwaste leachates. The study determined the potential and extent of ground-water contamination byorganic contaminants arising from ferrous solid-waste monofills. TCLP was used on wastesamples representing nine common binder systems to identify organic compounds released fromthe spent foundry sand in monofills. No other wastes other than foundry sand were in themonofill. Leachates were analyzed by GC-MS (mass spectroscopic detection) for qualitativeanalysis and by GC-FID (flame ionization detection) for quantitative analysis. Laboratory resultsindicate that a wide variety of organic compounds were present in the spent foundry sandleachates and that most are present at low concentrations. No samples produced concentrationsabove the regulatory toxicity limits.
Table 20 provides information on the types of binders evaluated and sample sources for each ofthe binders. A core oil binder system sample (#6) resulted in the most leachable organiccompounds of the nine systems tested. Overall error introduced by sample selection, leaching,and analysis, was evaluated. The entire leaching procedure for volatile compounds was carriedout four times on composites of a core oil binder sample, and then analyzed. The results for allvolatile organic compounds present at quantifiable concentrations are given in Table 21. Theaverage concentration and the relative standard deviation of the four measurements for eachcompound are also given.
Tables 22 – 25 list the concentrations measured against the calibration standards on the GC-FIDand estimated from GC-MS data for a core oil binder system sample, as an example of theresults. Table 22 gives the average of four leach test results from GC-FID analysis. Theseorganic leachate concentrations are compared to quantitation limits of the detector and toMassachusetts Drinking Water Standards and Guidelines [38]. None of the averaged quantity ofthe 29 volatile chemicals exceeded the regulatory levels. Table 23 gives results from GC-MSanalysis of volatile organic compounds. Some compounds identified by GC-MS could not be

35
obtained as standards for the GC-FID. Tables 24 and 25 provide a summary of organiccompounds for various binder systems and an overall comparison of binder systems respectively.
Three compounds from the toxicity characteristic list (benzene, tetrachloroethene, and cresols)and another three from the Massachusetts Standards and Guidelines for Drinking Water (acetone,1,1,1-trichloroethane, and toluene) were detected in the foundry waste leachates at measurableconcentrations. Maximum concentrations measured in any of the composite waste leachates werewell below the regulatory toxicity characteristic limits (see Table 24). Only benzene andtrichloroethane in three binder system samples were close to the drinking water maximumconcentration limits of 5 and 200 µg/l, respectively. Trichloroethane is one of the constituents ofcore coating or core pattern spray.
The phenolic urethane and core oil binder systems were more likely to be of environmentalconcern than the others, both from the number of compounds leached and concentration of thecompounds (see Table 24). Benzoic acid, naphthalene, methylnaphthalenes, phenol,methylenebisphenol, diethylphenol, and 3-methylbutanoic acid were at the highest level at over300 µg/l in one or more samples. Foundry waste from a core oil process appeared to leach thelargest quantities of organic compounds relative to the other binder system processes.Fortunately, only a few modern foundries still use core oil binders.
Table 25 demonstrates that the core room sweepings contribute the most to the organic content inthe samples with the phenolic urethane and the phenolic isocyanate binder systems. For the coreoil systems, the molding sand contributes the most organic compounds in the leachate. Theremaining binder systems leached very little. The furan hot box, alkyd isocyanate, and furanwarm box sample leachates contained only a few compounds at concentrations below 100 µg/l.
Xylenes are among the most common organic compounds leached in the TCLP procedure,although at concentrations 2 to 4 orders of magnitude lower than the drinking water limits. Atleast some of the xylene isomeric forms were detected in the leachates from all of the nine bindersystems analyzed (see Tables 24, 25). Toluene was present at levels 20 to 2000 times lower thanthe drinking water standards in seven of nine binder systems. Naphthalene was found in six ofnine binder systems sampled.
A detailed report from two New England foundries provided information for total concentrationsof semi-volatile organic compounds in mixed waste (spent sand and baghouse dust). Tables 26and 27 include the data for the organic compounds listed in the report. Additional compoundsdetected, not found in the previous study, include benzo(a)anthracene, bi-n-octyl phthalate,crysene, di-n-butylphthalate, fluoranthrene, and pyrene. Most of them (benzo(a)anthracene,crysene, fluoranthrene, and pyrene) would be present only after contact with molten iron. Thesedata suggest that organic compounds, most notably mono- and polyaromatic hydrocarbons(PAH), are present at relatively low levels. Taking into consideration a 20x dilution factorincluded in the TCLP method, the data in Tables 26 and 27 should be divided 20 times in orderto estimate the upper limits for leaching concentrations (with an assumption that 100% oforganic matter would leach in the TCLP test). Such upper estimates for organic compounds arewell below the drinking water standards.

36
It can reasonably be accepted that several organic compounds are present in most if not all spentfoundry sands. From the detailed study outlined in this report, it appears that acetone,diethylbenzenes, p-ethyltoluene, isopropylbenzene, 1,2,4-trimethylbenzene, both 1- and 2-methylnaphthalene, dimethylnaphthalene isomers, naphthalene and all three isomeric forms ofxylene are present at sufficient concentrations to be detected by modern analytical instruments,but none of these components are specified by the toxicity characteristic regulations.
While not having an exhaustive and comprehensive list of all organic compounds present infoundry sand and their binders, sufficient data, as given in this report, exist to draw someconclusions about the nature of and related implications of both virgin and spent foundry sand.All foundry sands and specifically their binders/resins are composed of materials which includea large number of organic compounds. Most of the organic constituents are volatilized withinthat inner part of the mold starting where the sand “kisses” the molten metal at about 1000°C.The remainder of the core sand is clearly affected by hot evolving gases. Major decomposition ofbinders occurs until temperature drops below 200°C. Some heavy compounds, such as phthlates,could then condense in the peripheral areas.
Unreacted resins and solvents in freshly mixed sand-binder systems not exposed to thecatalyzing gas or high temperature, would be the most likely source of leachable organics.Therefore, fresh casting mixtures and core sand that have not been in contact with hot metal,should be excluded or separated from the other foundry waste streams. It may also be concludedthat improper handling of waste streams increases the risk of contamination of spent sand.
EMISSIONS OF HAZARDOUS AIR POLLUTANTS
The reaction of sand binder systems subjected to hot liquid metal is their thermal decomposition.As a result of this process major permanent gases are produced in the vicinity of the mold-metalinterface. The principal evolving gases are hydrogen, carbon monoxide, carbon dioxide,methane, nitrogen, oxygen, and water vapor. Total gaseous hydrocarbons, including: ethane,ethylene, propane, propylene, acetylene, furan, methanol, and ethanol, constitute up to 5% ofmethane volume [39].
Every organic binder can be expected to behave similarly at the mold-metal interface. Pyrolysisis likely to be nearly complete at the mold to metal boundary. Further from the interface, deeperinto the mold body, partial decomposition can be expected. At lower temperatures and in anoxygen-lean atmosphere, more complex organic compounds are formed. The mixture of paraffinhydrocarbons should be produced, as well as some of the aromatics, especially duringdecomposition of the polymers that are built around phenolic rings. Formaldehyde and ammoniamay also be formed.
Benzene, toluene, nitrous oxide, and hydrogen cyanide were identified [40] in the atmospherenear a pouring line in a foundry using alkyd isocyanate resin bonded molds. The concentrationsdetected in the foundry atmosphere were generally low. Many species evolve as vapor at hightemperature but they may condense in the cooler regions of the mold. For example, methylenediphenyl isocyanate (used as a reactant in the binder [40]) was found in the effluent in theshakeout operation.

37
Thermal decomposition of phenol-formaldehyde resins consists of breaking the bonds betweenaromatic rings and methylene bridges. Phenol and methylphenols are then created from formedradicals. Bisphenols, trisphenols, etc., and their methyl derivatives are also produced. The othervolatile products are components with three condensed rings: fluorene, dibenzofuran, xanthene,anthracene and phenanthrene. Hetper and Sobera [41] recorded twenty major compounds thatvolatilize from Novolac resin at 770°C within 1 second. High boiling components were benzene,toluene, o-xylene, p-xylene, phenol, o-cresol, p-cresol, 2,6- and 2,4-dimethylphenol, 2,4,6-trimethylphenol, diphenylmethane, dibenzofuran, fluorene, 10H-xanthene, 1-methylfluorene,anthracene and phenanthrene, methyl-2-benzylphenols, hydroxybenzylphenols and their mono-and dimethyl derivatives, bis(hydroxybenzyl)phenols and their mono- and dimethyl derivatives.
The majority of volatile organics from the Novolac resin containing 15% hexamethylene-tetramine evolve between 150-195°C and 450-650°C [42]. The volume of volatilizedcomponents (benzene, toluene and cresols) ranges from 0.3 to 1.5% by weight. The source ofthese compounds is suspected to be core washing process before use. Table 28 lists theconcentration of the major volatile components emitted from the Novolac resin at 980°C. Theseconditions closely resemble the pouring environment. Quantities of emissions of benzene,toluene, phenol, and naphthalene are displayed as a function of temperature in Fig. 7. These areall air pollutants and will not be present to a large degree on the waste sand, but rather will becaptured in the core machine emission controls.
The amount of volatiles produced below 500°C is rather insignificant compared to the volumesreleased at 750 and 980°C. Fixed gases are the major resin degradation products at all pyrolysistemperatures. Except for these permanent gases, phenol is the major pyrolysis product. At 750°Cbenzene, toluene and naphthalene begin to evolve. At 980°C phenol is no longer the majorcomponent. Benzene becomes the major product and the amount of naphthalene increasesapproximately by a factor of 20.
Patterson indicated that oxidizing conditions at the mold-metal interface (because of the evolvinggases) can promote penetration of molten metal into the core sand [43]. The latter process maycause an increase in leachability of metals from the used sand.

38
Figure 7. Thermal degradation products of Novolac resins versus temperature
IMPLICATIONS AND CONCLUSIONS
Possible utilization of foundry waste products in Massachusetts is regulated under Beneficial UseDeterminations by the Department of Environmental Protection (310 CMR 19). The detailedchemical characterization of foundry waste materials is necessary as part of the applicationprocess. On the other hand, further development of the BUD regulatory protocols can only bebased on collected information regarding typical characteristics of spent foundry sand. Withthese objectives, the statistical data collected from foundries in several U.S. states and othercountries has been summarized and analyzed.
Quantities of twelve heavy metals and a number of organic compounds extracted from foundrysand waste with the Toxicity Characteristic Leaching Procedure (TCLP) suggests that spentfoundry sand can be beneficially used posing no environmental or human health risk. Only ironand manganese, not regulated under RCRA, showed increased leaching potential in a number ofoccasions. This is provided that spent sand is separated from other waste components such asunprocessed sand, baghouse dust, slag, or sludge, which may be hazardous at some instances.Some of these waste streams have highly variable levels of toxic constituents. Therefore, mixedfoundry wastes are complex and must be evaluated with a high degree of scrutiny. For mixedfoundry wastes, lead, chromium, copper and zinc could also be of a concern in leaded brass andbronze foundries. On the other hand, inherent variability of chemicals in wastes ceases to be a
Pea
k a
rea
, °C

39
cause for concern when their concentrations are anyway well below drinking water standards. Nomeaningful correlation between leaching metal concentrations and bulk element content wasgenerally observed.
Several organic compounds are present in most spent core sands though at low levels. Acetone,diethylbenzenes, p-ethyltoluene, isopropylbenzene, 1,2,4-trimethylbenzene, both 1- and 2-methylnaphthalene, dimethylnaphthalene isomers, naphthalene and all three isomeric forms ofxylene are present at low concentrations. Compounds from the toxicity characteristic list(benzene, 1,1,1-trichloroethane, phenol, tetrachloroethene, toluene, and cresols) were detected inthe foundry waste leachates at concentrations well below the regulatory toxicity limits, andgenerally below the drinking water standards. Benzene and trichloroethane were found atconcentrations around the drinking water limits.
It is reasonable to expect organic compounds to be present in virgin mixtures of foundry sandand binders, given the initial composition of binders and resins. The presence of phenol,polybenzylic ether, benzenesulfonic acid and formaldehyde in commonly used binder systems isof special concern. These compounds possibly give rise to other compounds formed in spentsand but not initially found in virgin sand. Many of these are aromatic compounds, and should beevaluated in risk assessment studies to determine if their concentrations pose any impact tohuman health and the environment.
Additional efforts should be exercised to fully understand the complete extent of compoundspresent in foundry sand and their potential or actual deleterious effects to human health and theenvironment.
Despite the fact that a few semi-volatile organic compounds were found in the laboratory sandleach tests, none of the 45000 compounds in the library were measured above the instrumentaldetection limit of 1 µg/l in the ground water samples collected around foundry landfills inWisconsin. Several volatile compounds were tentatively identified in ground water at trace levelsbelow the instrumental quantitation limits which are below the maximum concentration limits fordrinking water. Of the compounds measured in ground water, naphthalene, tetrachloroethane,and 1,1,1-trichloroethane were also detected in laboratory leachate tests, suggesting that theymay originate from foundry sand waste.
The absence of detectable quantities of organic compounds in ground water around foundrylandfills appears to be caused by low levels of organic content leached from most foundrywastes. Both the mixed waste samples and isolated foundry sand waste streams could not beconsidered hazardous by characteristics based on the release of organic contaminants. However,any effort to reduce the organics should focus on the phenolic urethane and the phenolicisocyanate binder systems, since they contribute the most to organic compound content.
Leaching of chemicals from spent molding sand and technical requirements for beneficial useapplications do not restrict the utilization of foundry sand wastes. Keeping such utilizationpractices in mind, any mixing of spent sand with the other foundry waste streams (baghousedust, slag and sludge) or unused virgin sand-binder blends should be avoided. Furthermore,metal reclaimers can use separated baghouse dusts as feedstocks and recycle them into rawmaterials. A better understanding of the chemical reactions at the mold-metal interface may lead

40
to process substitutions, mold additives or binder formulations that can result in environmentallysafer processes and products.
FUTURE WORK
There is a need to study a broader group of foundry sand wastes in order to quantify andcategorize potential risks of spent sand in each. Leachability characterization of the otherfoundry waste streams (baghouse and shotblast dusts, fines, slags, and sludges) should beinvestigated. Additional attention should be paid to specific molecular forms of metals present inwastes. Furthermore, a comparative study of sensitivity of foundry waste samples to differentleaching procedures (SPLP versus TCLP) is needed to evaluate dependence of leachingpotential of foundry by-products on different fate scenarios (disposal at foundry monofills,disposal at municipal landfills, various beneficial uses followed by disposal at municipallandfills, and etc.). Exposure analysis and risk assessment of specific use practices must becompleted on known contaminants, commonly measured in mixed waste sands.

41
Table 1. REGULATED AND RECOMMENDED MAXIMUM CONTAMINANT LEVELS, mg/l
Standards Drinking Watera
Ground Waterb
Toxicity Limitsc
European Landfilld
Method: Total Analysis (Digestion) TCLP / EPA TCLP / EPA DIN 38414 S4 / TVA
As 0.05 0.05 5.0 0.1Ba 2.0 1.0 100.0 5.0Be 0.004Cd 0.005 0.01 1.0 0.1Cr 0.1 0.05 5.0 CrIII: 2.0, CrIV: 0.1Cu 1.3* 0.5Hg 0.002 0.002 0.2 0.01Pb 0.015* 0.05 5.0 1.0Sb 0.006Se 0.05 0.01 1.0Tl
U.S
. Prim
ary
Reg
ulat
ions
0.002Ag 0.1 0.05 5.0Al 0.05-0.2 10Cu 1.0 0.5Fe 0.3Mn 0.05Zn U
.S. S
econ
dary
Reg
.
5 10Ni ** 2.0Co 0.5Sn 2.0
* Action level which triggers treatment of water system if exceeded in more than 10% tap watersamples.** Ni is mandatory for monitoring along with other contaminants tabulated by the NationalPrimary Drinking Water Regulations, but no maximum contaminant level is currently specifiedby EPA. MA DEP defines 0.1mg/l of Ni as the concentration in drinking water at or below which,adverse, non-cancer health effects are unlikely to occur after chronic (lifetime) exposure. At thistime MA DEP only indicates a potential need for further action to be decided.
a Code of Federal Regulations. Title 40. Parts 141, 143. Washington. US Government Printing
Office.b Code of Federal Regulations. Title 40. Parts 264. Washington. US Government Printing
Office.c Code of Federal Regulations. Title 40. Parts 261. Washington. US Government Printing
Office.d Schweizerische Technische Verordnung über Abfälle (TVA). 10.12.1990, SR 814015, Bern
1990.

42
Table 2. REGULATORY LIMITS AND GUIDELINES FOR ORGANIC CHEMICALS, µg/l
Standards Drinking Watera, aa
Ground Waterb
Toxicity Limitsc
Total Analysis (Digestion) TCLP TCLP Method:
Acrylamide 79-06-1 (0.5)* 5000Alachlor 15972-60-8 2 100000Atrazine 1912-24-9 3Benzene 71-43-2 5 500Benzo(a)pyrene 50-32-8 0.2Carbofuran 1563-66-2 40Carbon tetrachloride 56-23-5 5 500Chlordane 57-74-9 2 30Chlorobenzene 108-90-7 100 1000002,4-D acid 94-75-7 70 100 10000Dalapon 75-99-0 2001,2-Dibromo-3-chloropropane (DBCP)
96-12-8 0.2
o-Dichlorobenzene 95-50-1 600p-Dichlorobenzene 106-46-7 75 75001,2-Dichloroethane 75-34-3 5 5001,1-Dichloroethylene 75-35-4 7 700cis-1, 2-Dichloroethylene 156-59-2 70trans-1,2-Dichloroethylene
156-60-5 100
Dichloromethane 75-09-2 51,2-Dichloropropane 78-87-5 5Di(2-ethylhexyl)adipate 103-23-3 400Di(2-ethylhexyl)phthalate 117-81-7 6Dinoseb 88-85-7 7Dioxin (2,3,7,8-TCDD) 1746-01-6 0.00003Diquat 85-00-7 20Endothall 145-73-3 100Endrin 72-20-8 2 0.2 20Epichlorohydrin 106-89-8 (2)*Ethylbenzene 100-41-4 700Ethylene dibromide 106-93-4 0.05Glyphosate 1071-53-6 700Heptachlor 76-44-8 0.4Heptachlor epoxide 1024-57-3 0.2 } 8
Hexachlorobenzene 118-74-1 1 130Hexachloropentadiene 77-47-4 50 500Lindane 58-89-9 0.2 4 400Methoxychlor 72-43-5 40 100 10000Oxamyl (Vydate) 23135-22-0 200Polychlorinated biphenyls(PCBs)
1336-36-3 0.5
Pentachlorophenol 87-86-5 1 100000
…continued on next page…
U.S
. Pri
mar
y D
rink
ing
Wat
er R
egul
atio
ns a
Compound / CAS #

43
Picloram 1918-02-1 500Simazine 122-34-9 4Styrene 100-42-5 100Tetrachloroethylene 127-18-4 5 700Toluene 108-88-3 1000Trihalomethanes, total(TTHMs)
100
Toxaphene 8001-35-2 3 5 5002,4,5-TP (Silvex) 93-72-1 50 10 10001,2,4-Trichlorobenzene 120-82-1 701,1,1-Trichloroethane 71-55-6 2001,1,2-Trichloroethane 79-00-5 5Trichloroethylene 79-01-6 5 500Vinyl chloride 75-01-4 2 200Xylenes, total 1330-20-7 10000Foaming agents Secondary 500
Acetone 67-64-1 3000Aldicarb 116-06-3 3Aldicarb sulfone 1646-88-4 2Aldicarb sulfoxide 1646-87-3 4Bromomethane 74-83-9 10Chloroform 67-66-3 5 6000o-Cresol 95-48-7 200000m-Cresol 108-39-4 200000p-Cresol 106-44-5 200000Cresols, total 1319-77-3 200000Dichlorodifluoromethane 75-71-8 14001,1-Dichloroethane 75-34-3 701,3-Dichloropropene 10061-01-5 0.52,4 Dinitrotoluene(2,4-DNT)
121-14-2 130
1,4-Dioxane 123-91-1 50Ethylene glycol 107-21-1 1400Hexachloroethane 67-72-1 3000Methyl ethyl ketone 78-93-3 350 200000Methyl isobutyl ketone 108-10-1 350Methyl tertiary butyl ether 1634-04-4 70Metolachlor 51218-45-2 100Nitrobenzene 98-95-3 2000Pyridine 110-86-1 5000Tetrahydrofuran 109-99-9 13002,4,5-Trichlorophenol 95-95-4 4000002,4,6-Trichlorophenol 88-06-2 2000Trichlorotrifluoroethane(Freon 113)
76-13-1 210000
* Action level which triggers treatment of water system if exceeded in more than 10% tap water samples.aa
Guide to the Regulation of Toxic Chemicals in Massachusetts Waters. Office of Research andStandards, MA DEP, Boston, 1990.
See the other references under Table 1.
Table 2. …continued …
U.S
. Pri
mar
y D
rink
ing
Wat
er R
egul
atio
ns a
Mas
sach
uset
ts D
rink
ing
Wat
er G
uide
lines
aa

44
Table 3. ALLOWABLE CONTAMINANT LEVELS FOR REUSE AND DISPOSAL OFCONTAMINATED SOIL AT MASSACHUSETTS LANDFILLS
Reuse Levels (mg/kg) a
CONTAMINANT
Lined Landfills Unlined Landfill
Total Arsenic 40 40Total Cadmium 80 30Total Chromium 1000 1000Total Lead 2000 1000Total Mercury 10 10Total Petroleum Hydrocarbons (TPH) 5000 2500
Total Polychlorinated Biphenyls (PCB) b < 2 < 2
Total SVOC c 100 100
Total VOC d 10 4
Electric Conductivity e (µmho/cm) 8000 µmho/cm 4000 µmho/cm
Listed or CharacteristicHazardous Waste (TCLP)
f NONE NONE
Notes:a The reuse levels are expressed as total levels in mg/kg and apply to reuse of soil as daily cover, intermediate cover,
and pre-capping contour material at lined landfills and unlined landfills.b Total concentrations of polychlorinated biphenyls EPA Method 8080.
c Total concentrations of compounds listed in EPA Method 8270.
d Total concentration of compounds listed in EPA Method 8260.
e For soil which may be expected to contain elevated NaCl.
f TCLP testing shall be performed for metals or organic compounds when the total concentrations in the soil are above
the theoretical levels at which the TCLP criteria may be exceeded. For guidance parties shall consult United StatesEnvironmental Protection Agency, Memorandum #36, "Notes on RCRA Methods and QA Activities", pp. 19-21, GailHanson, January 12, 1993.
[Please note that the methods specified in footnotes d, e, and f indicate the universe of chemicals to be added incalculating the total concentrations for these classes of contaminants. Section 5.0 of the Policy # COMM-97-001 providesguidance for determining which specific chemicals must be considered chemicals of concern (e.g., contaminants) withinthe soil. The Policy does not specify the analytical test methods to be used to quantify the specific contaminants. Readerscan consult 310 CMR 40.0017 Environmental Sample Collection and Analysis, 310 CMR 30.110 Criteria, Procedures forDetermining Which Wastes are to be Regulated as Hazardous Waste or Non-Hazardous Waste and 310 CMR 30.151Representative Sampling Methods for additional information which may be applicable to the selection of appropriatesampling and analytical methods.]

45
Table 4. PROPOSED ILLINOIS TIER SYSTEM FOR RANKING WASTE
Waste type ChemicalWaste
Low Risk PotentiallyUsable
BeneficiallyUsable
Hazard level Highest LowestParameter, mg/l Maximum allowed concentrations: Primary standards
Arsenic * 0.25 0.05 0.05Barium * 5.0 1.0 1.0
Cadmium * 0.05 0.01 0.01Chromium * 0.25 0.05 0.05
Lead * 0.25 0.05 0.05Nitrate * 50 10 10
Selenium * 0.05 0.01 0.01Silver * 20 4 4
Maximum allowed concentrations: Secondary standardsChloride * 500 250 250
Manganese * 3.75 0.75 0.15Copper * 10 5 5
Iron * 15 5 5Sulfates * 800 400 400
Zinc * 50 10 5Total Dissolved
Solids* 5000 1200 1200
* Wastes leaching above Low Risk levels would be considered Chemical Wastes andhandled under disposal requirements of a Chemical Waste.

46
Table 5. INDIANA TIER SYSTEM FOR RANKING WASTE
Waste type I II III IVHazard level Highest Lowest
Parameter, mg/l Maximum allowed concentrations: EP Toxicity TestArsenic 5.0 1.25 0.5 0.05Barium 100 25 10 1
Cadmium 1.0 0.25 0.1 0.01Chromium 5.0 1.25 0.5 0.05
Lead 5.0 1.25 0.5 0.05Mercury 0.2 0.05 0.02 0.002Selenium 1.0 0.25 0.1 0.01
Silver 5.0 1.25 0.5 0.05Maximum allowed concentrations: Leaching Method Test
Barium * 25 10 1Boron * 50 20 2
Chlorides * 6.250 2.500 250Copper * 6.25 2.5 .25
Cyanide, total * 5 2 .2Fluoride * 35 14 1.4
Iron * * 15 1.5Manganese * * .5 .05
Nickel * 5 2 .2Phenols * 7.5 3 .3Sodium * 6.250 2.500 250Sulfate * 6.250 2.500 250
Sulfide, total * 12.5 5 1Total Dissolved
Solids* 12.500 5.000 500
Zinc * 62.5 25 2.5Acceptable range (standard units)
pH * 4-11 5-10 6-9 * Testing is not required for these parameters.

47
Table 6. ANALYSIS OF SEMI-VOLATILE ORGANIC COMPOUNDS BY TCLP

48
Table 7. ANALYSIS OF VOLATILE ORGANIC COMPOUNDS BY TCLP

49
Table 8. METALLIC CONTAMINANTS ANALYTICAL METHODS
Environmental Samples Solid Waste Leachates MethodAnalyte Sample Preparation
EPA ASTM EPA (SW-846)
As 3005A, 3010A, 3015,3050A, 3051
200.7,200.8, 200.9
D2972-93C,D2972-93B
6010A, 6020, 7060A,7061A, 7062
Ba 3005A, 3010A, 3015,3050A, 3051
200.7, 200.8 6010A, 6020, 7080A,7081
Be 3005A, 3010A, 3015,3020A, 3040, 3050A,
3051
200.7,200.8, 200.9
D3645-93B 6010A, 6020, 7090,7091
Cd 3005A, 3010A, 3015,3020A, 3040, 3050A,
3051
200.7,200.8, 200.9
6010A, 6020, 7130,7131A
Cr 3005A, 3010A, 3015,3020A, 3040, 3050A,
3051
200.7,200.8, 200.9
6010A, 6020, 7190,7191, 7195, 7196A,
7197, 7198Cu 3005A, 3010A, 3015,
3040, 3050A, 3051200.7,
200.8, 200.9D1688-95C,D1688-95A
6010A, 6020, 7210,7211
Hg 3051 245.1,245.2, 200.8
D3223-91 7470A, 7471A
Pb 3005A, 3010A, 3015,3040, 3050A, 3051
200.8, 200.9 D3559-95D 6010A, 6020, 7420,7421
Sb 3005A, 3015, 3040,3051
200.8, 200.9 D3697-92 6010A, 6020, 7040,7041, 7062
Se 3005A, 3010A, 3015,3050A, 3051
200.8, 200.9 D3859-93A,D3859-93B
6010A, 7740, 7741A,7742
Tl
Prim
ary
Dri
nkin
g W
ater
Con
tam
inan
ts
3005A, 3010A, 3015,3020A, 3050A, 3051
200.8, 200.9 6010A, 6020, 7840,7841
Ag 3005A, 3015, 3050A,3051
200.7,200.8, 200.9
6010A, 6020, 7760A,7761
Al 3005A, 3010A, 3015,3050A, 3051
200.7,200.8, 200.9
6010A, 6020, 7020
Fe 3005A, 3010A, 3015,3040, 3050A, 3051
200.7, 200.9 6010A, 7380, 7381
Mn 3005A, 3010A, 3015,3040, 3050A, 3051
200.7,200.8, 200.9
6010A, 6020, 7460,7461
Zn
Seco
ndar
y D
.W.
Con
tam
inan
ts
3005A, 3010A, 3015,3050A, 3051
200.7, 200.8 6010A, 6020, 7950,7951
Na 3005A, 3010A, 3015,3050A, 3051
200.7 D4191-97,D6071-96
6010A, 7770
Ni
**
3005A, 3010A, 3015,3040, 3050A, 3051
200.7,200.8, 200.9
6010A, 6020, 7520
** Mandatory for monitoring, but no maximum contaminant level is currently specified by EPA.
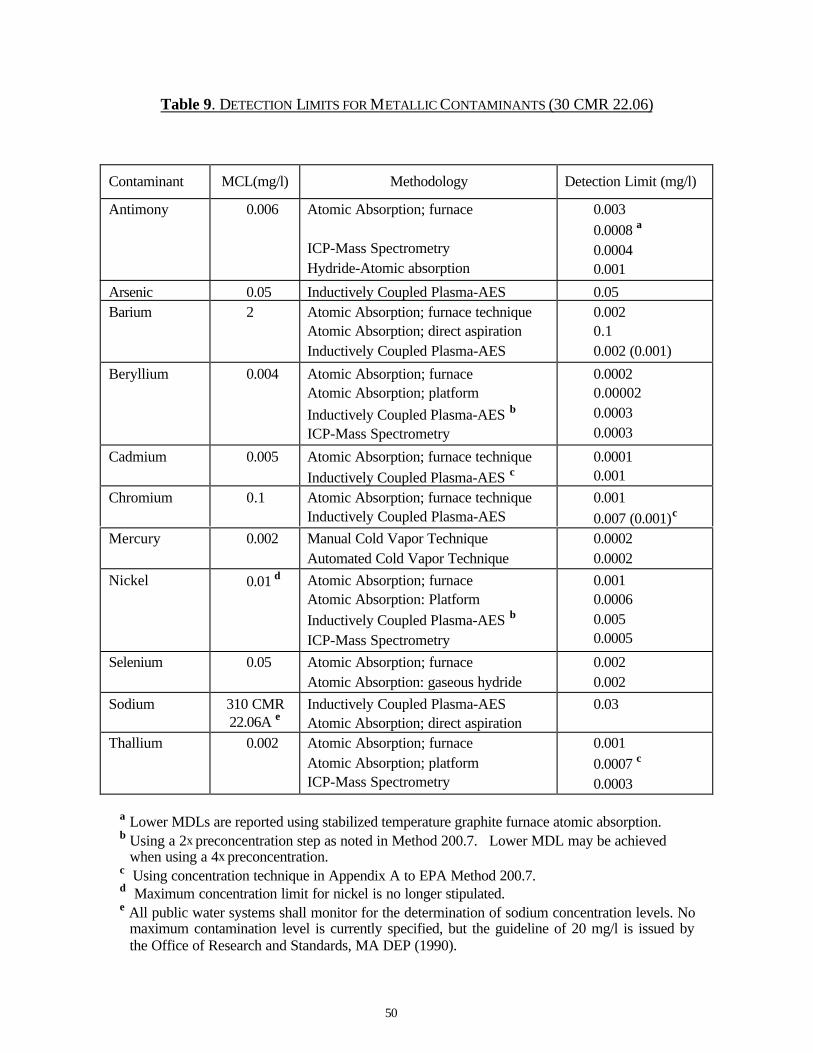
50
Table 9. DETECTION LIMITS FOR METALLIC CONTAMINANTS (30 CMR 22.06)
Contaminant MCL(mg/l) Methodology Detection Limit (mg/l)
Antimony 0.006 Atomic Absorption; furnace
ICP-Mass SpectrometryHydride-Atomic absorption
0.0030.0008 a
0.00040.001
Arsenic 0.05 Inductively Coupled Plasma-AES 0.05Barium 2 Atomic Absorption; furnace technique
Atomic Absorption; direct aspirationInductively Coupled Plasma-AES
0.0020.10.002 (0.001)
Beryllium 0.004 Atomic Absorption; furnaceAtomic Absorption; platformInductively Coupled Plasma-AES b
ICP-Mass Spectrometry
0.00020.000020.00030.0003
Cadmium 0.005 Atomic Absorption; furnace techniqueInductively Coupled Plasma-AES c
0.00010.001
Chromium 0.1 Atomic Absorption; furnace techniqueInductively Coupled Plasma-AES
0.0010.007 (0.001)c
Mercury 0.002 Manual Cold Vapor TechniqueAutomated Cold Vapor Technique
0.00020.0002
Nickel 0.01 d Atomic Absorption; furnaceAtomic Absorption: PlatformInductively Coupled Plasma-AES b
ICP-Mass Spectrometry
0.0010.00060.0050.0005
Selenium 0.05 Atomic Absorption; furnaceAtomic Absorption: gaseous hydride
0.0020.002
Sodium 310 CMR22.06A e
Inductively Coupled Plasma-AESAtomic Absorption; direct aspiration
0.03
Thallium 0.002 Atomic Absorption; furnaceAtomic Absorption; platformICP-Mass Spectrometry
0.0010.0007 c
0.0003
a Lower MDLs are reported using stabilized temperature graphite furnace atomic absorption.b Using a 2x preconcentration step as noted in Method 200.7. Lower MDL may be achieved
when using a 4x preconcentration.c Using concentration technique in Appendix A to EPA Method 200.7.d Maximum concentration limit for nickel is no longer stipulated.e All public water systems shall monitor for the determination of sodium concentration levels. No
maximum contamination level is currently specified, but the guideline of 20 mg/l is issued bythe Office of Research and Standards, MA DEP (1990).

51
Table 10. EPA ANALYTICAL METHODS (SW-846) FOR ORGANIC CONTAMINANTS
Analyte Name CAS No. Prep.M.* Analyte Detection MethodsAcetone 67-64-1 5041 8240B, 8260A, 8315Acrylamide(2-Propeneamide)
79-06-1 8032, 8316
Alachlor 15972-60-8 8081, 8082AAldicarb sulfone 1646-88-4 8318Aldicarb (Temik) 116-06-3 8318Aroclor-1242(PCB-1242) 53469-21-9 8080A, 8081, 8082A, 8250A, 8270BAroclor-1248(PCB-1248) 12672-29-6 8080A, 8081, 8082A, 8250A, 8270BAroclor-1254(PCB-1254) 11097-69-1 8080A, 8081, 8082A, 8250A, 8270BAroclor-1260(PCB-1260) 11096-82-5 8080A, 8081, 8082A, 8250A, 8270BAtrazine 1912-24-9 8141ABenz(a)anthracene(Benzo(a)anthracene)
56-55-3 3640A,3650A
8100, 8250A, 8270B, 8310, 8410
Benzene 71-43-2 5041 8020A, 8021A, 8240B, 8260ABenzo(a)pyrene 50-32-8 3640A,
3650A8100, 8250A, 8270B, 8275, 8310, 8410
Benzoic acid 65-85-0 3640A 8250A, 8270B, 8410Bis(2-ethylhexyl)phthalate(Diethylhexylphthalate)
117-81-7 3640A 8060, 8061, 8250A, 8270B, 8410
Bromomethane(Methyl bromide)
74-83-9 5041 8010B, 8021A, 8240B, 8260A
2-Butanone (MEK,Methyl ethyl ketone)
78-93-3 8015A, 8240B, 8260A
sec-Butylbenzene 135-98-8 8021A, 8260Atert-Butylbenzene 98-06-6 8021A, 8260ACarbofuran (Furadan) 1563-66-2 8270B, 8318Carbon tetrachloride(Tetrachloromethane)
56-23-5 5041 8010B, 8021A, 8240B, 8260A
Chlordane 57-74-9 3650A 8270BChlorobenzene 108-90-7 5041 8010B, 8020A, 8021A, 8240B, 8260AChloroform(Trichloromethane)
67-66-3 5041 8010B, 8021A, 8240B, 8260A
Cresols (Methyl phenols) 1319-77-3 3650A 8040A2,4-D (Dichlorophenoxyacetic acid)
94-75-7 3640A,3650A
8150B, 8151, 8321
Dalapon 75-99-0 8150B, 8151, 83211,2-Dibromo-3-chloropropane (DBCP)
96-12-8 3640A 8010B, 8011, 8021A, 8081, 8240B, 8260A, 8270B
1,2-Dibromoethane (EDB,Ethylene dibromide)
106-93-4 3640A 8010B, 8011, 8021A, 8240B, 8260A
1,2-Dichlorobenzene(o-Dichlorobenzene)
95-50-1 3640A 8010B,8270B,
8020A,8410
8021A, 8120A, 8121, 8250A, 8260A,
1,4-Dichlorobenzene(p-Dichlorobenzene)
106-46-7 3640A 8010B,8270B,
8020A,8410
8021A, 8120A, 8121, 8250A, 8260A,
Dichlorodifluoromethane 75-71-8 8010B, 8021A, 8240B, 8260A1,1-Dichloroethane 75-34-3 5041 8010B, 8021A, 8240B, 8260A
continued on next page …

52
1,2-Dichloroethane 107-06-2 5041 8010B, 8021A, 8240B, 8260Acis-1,2-Dichloroethene(cis-1,2-Dichloroethylene)
156-59-2 8021A, 8260A
1,1-Dichloroethene(1,1-Dichloroethylene)
75-35-4 5041 8010B, 8021A, 8240B, 8260A
trans-1,2-Dichloroethene(trans-1,2-Dichloroethylene)
156-60-5 5041 8010B, 8021A, 8240B, 8260A
2,4-Dichlorophenol 120-83-2 3640A 8040A, 8250A, 8270B, 8275, 84101,2-Dichloropropane 78-87-5 5041 8010B, 8021A, 8240B, 8260A1,1-Dichloropropene 563-58-6 8021A, 8260ADicyclohexyl phthalate 84-61-7 80612,4-Dimethylphenol 105-67-9 3640A,
3650A8040A, 8250A, 8270B
Di-n-butyl phthalate 84-74-2 3640A 8060, 8061, 8250A, 8270B, 84102,4-Dinitrotoluene(2,4-DNT)
121-14-2 3640A,3650A
8090, 8250A, 8270B, 8275, 8330, 8410
Dinoseb (DNBP, 2-sec-Butyl-4,6- dinitrophenol)
88-85-7 3640A 8040A, 8150B, 8151, 8270B, 8321
Di-n-octyl phthalate(Dioctyl ester)
117-84-0 3640A, 8060, 8061, 8250A, 8270B, 8410
1,4-Dioxane 123-91-1 8240B, 8260AEndrin 72-20-8 3640A 8080A, 8081, 8250A, 8270BEpichlorohydrin(Chloromethyl oxirane)
106-89-8 8010B, 8240B, 8260A
Ethyl acetate 141-78-6 8260AEthylbenzene 100-41-4 5041 8020A, 8021A, 8240B, 8260AFluoranthene 206-44-0 3640A 8100, 8250A, 8270B, 8310, 84102-Fluorobiphenyl 321-60-8 3542 8250A, 8270B2-Fluorophenol 367-12-4 3542 8250A, 8270BFormaldehyde 50-00-0 8315Heptachlor 76-44-8 3640A,
3650A8080A, 8081, 8250A, 8270B
Heptachlor epoxide 1024-57-3 3640A 8080A, 8081, 8250A, 8270BHexachlorobenzene 118-74-1 3640A,
3650A8081, 8120A, 8121, 8250A, 8270B, 8275, 8410
Hexachlorobutadiene (1,3-Hexachlorobutadiene)
87-68-3 3640A,3650A
8021A, 8120A, 8121, 8250A, 8260A, 8270B, 8410
γ-Hexachlorocyclohexane(γ -BHC, Lindane)
58-89-9 3640A 8080A, 8081, 8121, 8250A, 8270B
Hexachlorocyclopentadiene
77-47-4 3640A,3650A
8081, 8120A, 8121, 8250A, 8270B, 8410
Hexachloroethane 67-72-1 3640A,3650A
8120A, 8121, 8250A, 8260A, 8270B, 8410
Isopropylbenzene 98-82-8 8021A, 8260A4,4'-Methoxychlor(Methoxychlor)
72-43-5 3640A 8080A, 8081, 8250A, 8270B
Methylene chloride(DCM, Dichloromethane)
75-09-2 5041 8010B, 8021A, 8240B, 8260A
2-Methylnaphthalene 91-57-6 3640A 8250A, 8270B, 84104-Methyl-2-pentanone(MIBK, Methyl isobutylketone)
108-10-1 8015A, 8240B, 8260A
continued on next page …
Table 10. …continued …

53
2-Methylphenol(o-Cresol, 2-Cresol)
95-48-7 3640A 8041, 8250A, 8270B, 8410
3-Methylphenol(m-Cresol, 3-Cresol)
108-39-4 3640A 8041, 8270B
4-Methylphenol(p-Cresol, 4-Cresol)
106-44-5 3640A 8041, 8250A, 8270B, 8275, 8410
Naphthalene 91-20-3 3640A,3650A
8021A,8410
8100, 8250A, 8260A, 8270B, 8275, 8310,
Nitrobenzene (NB) 98-95-3 3640A,3650A
8090, 8250A, 8260A, 8270B, 8330, 8410
Pentachlorophenol (PCP) 87-86-5 3640A,3650A
8040A, 8041, 8151, 8250A, 8270B, 8410, 4010
Phenanthrene 85-01-8 3640A 8100, 8250A, 8270B, 8275, 8310, 8410Phenol 108-95-2 3640A,
3650A8040A, 8041, 8250A, 8270B, 8410
Phenolics -- 9065, 9066, 9067Picloram 1918-02-1 8151Pyrene 129-00-0 3640A,
3650A8100, 8250A, 8270B, 8275, 8310, 8410
Pyridine 110-86-1 3650A 8240B, 8260A, 8270BSimazine 122-34-9 8141AStyrene 100-42-5 5041 8021A, 8240B, 8260A2,4,5-TP (2,4,5-Trichlorophenoxy-α-proprionicacid, Silvex)
93-72-1 3640A,3650A
8150B, 8151, 8321
2,3,7,8-Tetrachlorodibenzo-p-dioxin(2,3,7,8-TCDD)
1746-01-6 8280, 8290
1,1,1,2-Tetrachloroethane 630-20-6 8010B, 8021A, 8240B, 8260ATetrachloroethene(Tetrachloroethylene)
127-18-4 5041 8010B, 8021A, 8240B, 8260A
Toluene (Methyl benzene) 108-88-3 5041 8020A, 8021A, 8240B, 8260AToxaphene 8001-35-2 3650A 8080A, 8081, 8250A, 8270B2,4,6-Tribromophenol 118-79-6 3542 8250A, 8270B1,2,4-Trichlorobenzene 120-82-1 3640A 8021A, 8120A, 8121, 8250A, 8260A, 8270B, 84101,1,1-Trichloroethane 71-55-6 5041 8010B, 8021A, 8240B, 8260A1,1,2-Trichloroethane 79-00-5 5041 8010B, 8021A, 8240B, 8260ATrichloroethene(Trichloroethylene)
79-01-6 5041 8010B, 8021A, 8240B, 8260A
Trichlorofluoromethane 75-69-4 5041 8010B, 8021A, 8240B, 8260A2,4,5-Trichlorophenol 95-95-4 3640A 8250A, 8270B, 8410,2,4,6-Trichlorophenol 88-06-2 3640A 8250A, 8270B, 84101,2,4-Trimethylbenzene 95-63-6 8021A, 8260A1,3,5-Trimethylbenzene 108-67-8 8021A, 8260AVinyl chloride(Chloroethene)
75-01-4 5041 8010B, 8021A, 8240B, 8260A
m-Xylene 108-38-3 8021A, 8260Ao-Xylene 95-47-6 8021A, 8260Ap-Xylene 106-42-3 8021A, 8260AXylenes, total 1330-20-7 5041 8020A, 8240B
* Sample Preparation Methods (3542, 5041) and Cleanup Methods (3640A, 3650A).
Table 10. …continued …

54
Table 11. PHYSICAL PROPERTIES OF FOUNDRY SANDS
Code Description Bulk specificgravity (dried)
Absorptionpercent
Finenessmodulus
A Siliceous river-run sand (reference) 2.56 0.7 2.62
B Thermally reclaimed chemically-bonded sand
2.68 0.2 0.81
C Mechanically reclaimed chemically-bonded sand
2.69 0.3 1.10
D Spent clay-bonded sand 2.30 4.2 0.66
E Spent clay-bonded sand 2.50 1.1 1.75F Spent clay-bonded sand 2.48 2.3 1.05
Table 12. GEOTECHNICAL CHARACTERISTICS OF FOUNDRY SAND WASTES
Weathered wastefoundry sand
Fresh waste foundrysand
Specific gravity, g/cm3 2.53 2.46
Percentage of fines passing 200 µm sieve, % 22 40Clay particles with size below 0.005 mm, % 9 –Optimum moisture content in a standardProctor compaction test, %
27.1 23.1
Cohesion intercept (drained), kN/m2 6.9 – 13.1 13.8 – 15.2Internal friction angle (drained) 35° – 38° 33° – 39°Percentage of swelling, % 0 0.9Hydraulic conductivity, 10-8 m/sec 1.2 –

55
Table 13. CHEMICAL ANALYSIS OF TYPICAL FOUNDRY SANDS
Compound Chelford WS (50) Silica Sand (%) Manfield Red Sand (%)SiO2 97.91 78.2Al2O3 1.13Fe2O3 0.50
10.12
TiO2 0.04 -CaO 0.11 2.4MgO 0.02 1.8K2O 0.65 3.1Na2O 0.07 0.2LOI* 0.21 4.1*Loss on Ignition
Table 14. SPENT FOUNDRY SAND CHEMICAL OXIDE COMPOSITION
Constituent Percentage (%)SiO2 87.91Al2O3 4.70Fe2O3 0.94CaO 0.14MgO 0.30SO3 0.09Na2O 0.19K2O 0.25TiO2 0.15P2O5 0.00Mn2O3 0.02SrO 0.03LOI* 5.15
*Loss on Ignition

56
Table 15. CONVENTIONAL SAND BINDER SYSTEMS AND PROCESSES
Thermosetting Processes Self-Setting Processes Gas-Cured Processes
1. Shell process: Novolac ("shell") resin Phenol Formaldehyde2. Hot Box processes: Urea Formaldehyde Phenol Formaldehyde a. Novolac b. Resole Furan Modified
a. UF + FAb. PF + FAc. PF + UF
3. Warm Box process: Furan (furfuryl alcohol)
a. free formaldehydeb. UF or PF
4. Core Oil process: Oils
1. Acid No-Bake processes: Furan no-bake
a. H3PO4b. TSAc. BSA
Phenol Formaldehydea. TSAb. BSAc. xelenesulfonic acid
2. Ester Cured processes: Phenolic Resole a. free phenol b. free formaldehyde3. Urethane No-Bake (Amine Cured) processes: Alkyd Urethane a. vegetable oil b. polyisocyanate Phenolic Urethane a. pyridine derivative b. polyphenyl PIC Polyol Urethane
1. Free Radical Curing: Vinyl Urethane Oligomer a. N2 + SO22. Cold Box processes: Phenolic Urethane Polymeric Isocyanate
a. TEA vapor + airb. DMEA vapor + air
Furan + SO2
a. methyl alcoholb. organic peroxides
Acrylic/Epoxy + SO2
a. hydroperoxide Phenolic Resole + Ester
a. glycol ethersb. methylformate vapor
1. Clay Based processes: Bentonites Fire Clays Kaolin Clay
1. Ester Cured processes: Sodium Silicate
a. glycerol diacetateb. EGDAc. glycerol triacetate
Ethyl Silicate2. Cement Bonding process: Hydraulic Cements3. Oxide Cured process: Phosphates
a.aluminum phosphateb.magnesium oxide
1. CO2 Silicate process: Sodium Silicate (SiO2:Na2O) + CO2
Notes: FA = furfuryl alcohol PIC = polyisocyanateUF = urea formaldehyde TSA = toluenesulfonic acidPF = phenol formaldehyde BSA = benzenesulfonic acidTEA = triethylamine EGDA = ethylene glycol diacetateDMEA = dimethylethylamine
(TSA+BSA)
{
{
Inor
gani
c B
inde
rsO
rgan
ic B
inde
rs

57
Table 16. LEACHABILITY OF METALS FROM FOUNDRY SAND WASTE
Primary Contaminants (mg/l) Secondary Contaminants (mg/l) **LeachingMethod As Ba Cd Cr Hg Pb Se Ag Cu Fe Mn Zn Ni R
ef.
Drinking Water Maximum Contaminant Level Total Elem 0.05 2.0 0.005 0.01 0.002 0.015* 0.05 0.1 1.0 0.3 0.05 5.0 7
Toxicity Characteristic Level TCLP 5.0 100 1.0 5.0 0.2 5.0 1.0 5.0 16
Highway embankment constructed with Indiana ferrousfoundry waste sand. Maximum measured values.
FieldLeachate
0.054 – – – 0.85 0.09 11
Median Wisconsin field leachate values, averaged oversix ferrous foundry mixed waste landfills.
FieldLeachate
<.005 <0.46 <.001 <0.02 <.005 <0.02 <0.13 <.002 0.02 0.54 0.27 0.15 31
Typical Wisconsin mixed municipal solid wastelandfill. Maximum values.
FieldLeachate
0.07 1 1.1 0.3 54 1.7 50
Spent molding sands. Average over 52 Penn foundries. TCLP 0.06 0.4 0.03 0.1 0.005 0.3 0.08 <.049 0.25 70 0.9 2.2 0.2 37Spent sand waste. Average over a cluster of 28 out of33 Pennsylvania ferrous and non-ferrous foundries.
TCLP,ASTM D346 0.006 0.33 0.03 0.1 .0005 0.25 0.03 0.06 0.2 28 0.35 0.4 0.1 29
Mixed molding waste (sand, binder, dust, sludge).Gostyn foundry, Poland.
TCLPEP
–0.1
––
0.25–
10.2
1331
1.62.2
1.40.9
7–
44
Wisconsin brass foundry sands + dusts. Average value. TCLP+EP 11 36Wisconsin brass foundry sands + dusts, chemicallytreated to convert metals into non-leaching forms.
TCLP+EP – – 0.018 – – 0.18 – – 36
Wisconsin ferrous foundry waste sand. Average of two. EP 0.04 1.1 31Wisconsin typical ferrous foundry mixed waste landfill. EP <.005 <0.46 <.001 <.003 <0.01 <0.13 <.002 <.002 66 2.9 0.4 31
Molding sand (6% western bentonite, 7% sea-coal)subjected to process temperature. Maximum values.
3 LeachingCycles, H2O
<0.75 <1.1 1.1 15 <0.75 1.2 45
Brown-black furan-bonded sand waste + dust (1:1), airdried. Dessau foundry, Germany.
DIN 38414 S4H2O pH=7.5
0.01 <0.1 0.07 <.001 0.6 0.25 0.5 0.3 46
Black-brown silicate waterglass-bonded fine sandwaste, air dried. Magdeburg foundry, Germany.
DIN 38414 S4H2O, pH=10.1
0.13 <0.1 0.08 <.001 0.6 0.5 1.1 0.6 46
Brown-black furan-bonded sand waste + dust (1:1), airdried. Dessau foundry, Germany.
DIN 38414 S7Aqua Regia
0.45 0.3 69 0.02 11 27 33 6 46
Black-brown silicate waterglass-bonded fine sandwaste, air dried. Magdeburg foundry, Germany.
DIN 38414 S7Aqua Regia
0.67 0.3 79 <.002 4.6 8.5 17 16 46
Notes: TCLP concentration value exceeding the RCRA regulated level is given in bold. See other notes under Table 17.

58
Table 17. BULK CONTENT OF METALS IN FOUNDRY SAND WASTE, REFERENCE SANDS AND SOILS
Primary Contaminants (mg/kg) Secondary Contaminants (mg/kg) ** Method
As Ba Cd Cr Hg Pb Se Ag Cu Fe Mn Zn Ni Ref
.
Drinking Water Maximum Contaminant Level Total Elem 0.05 2.0 0.005 0.01 0.002 0.015* 0.05 0.1 1.0 0.3 0.05 5.0 7
Toxicity Characteristic Level, mg/l TCLP 5.0 100 1.0 5.0 0.2 5.0 1.0 5.0 16
Brown-black furan-bonded sand waste + dust (1:1), airdried. Dessau foundry, Germany.
Total ElemX-ray fluo
<2 <2 284 <2 14 27 33 5 46
Black-brown silicate waterglass-bonded fine sandwaste, air dried. Magdeburg foundry, Germany.
Total ElemX-ray fluo
<2 <2 5870 <2 7 7 32 21 46
Spent molding sands. Average over 52 Penn foundries. Total Elem 2.3 24 2.2 29 1.5 49 2.2 <1.9 308 1.5% 108 246 37Spent sand waste. Average over a cluster of 30 out of33 Pennsylvania ferrous and non-ferrous foundries.
Total Elem 1.1 13 1.9 8.9 0.06 24 1.2 2.4 117 3.9% 72 26 29 29
Molding waste (sand, binder, dust, sludge). Medianvalues derived from 14 samples. Gostyn foundry,Poland
Total Elem 3 101 45 15 15% 291 112 32 44
Black spent sand piles. Samples averaged over twoNew England iron casting foundries.
Total ElemEPA 6010
2 30 <0.2 2.8 0.02 7.5 <5 <0.5 1
Black spent sand + dust. Massachusetts iron foundry.Average of 4 samples collected within 6 months.
Total ElemEPA 6010
4.5 35 0.2 3.4 0.01 9 <5 <0.5 1
Florida natural soil: Candler fine sand (96.7% sand,2.5% clay, 0.8% silt, 0.8% organics, pH=6.5).
8 LeachingCycles, H2O
0.23 0.20 0.44 0.08 47
Unprocessed sand for molding. Median values obtainedwith 5 samples. Gostyn foundry, Poland.
Total Elem 1 – 6 0.4 970 – 21 – 44
US sandy soils, lithosols on sandstones. Vegetation safe Total Elem 5.1 400 40 0.08 17 0.5 14 1-3% 345 40 175 37US non-contaminated soils. Maximum values. Total Elem 60 3000 0.7 1000 0.3 200 2 5 100 5% 3000 300 300 48,49
Note: A cell is blank if a parameter was not measured.< Below detection limit.– Below unspecified detection limit* Action level which triggers treatment of water system if exceeded in more than 10% tap water samples.** Ni is mandatory for monitoring along with other contaminants tabulated by the National Primary Drinking Water Regulations, but no maximum
contaminant level is currently specified by EPA. MA DEP defines Ni 0.1mg/l as the concentration in drinking water at or below which, adverse,non-cancer health effects are unlikely to occur after chronic (lifetime) exposure. MA DEP only indicates a potential need for further legislativeaction to be decided.
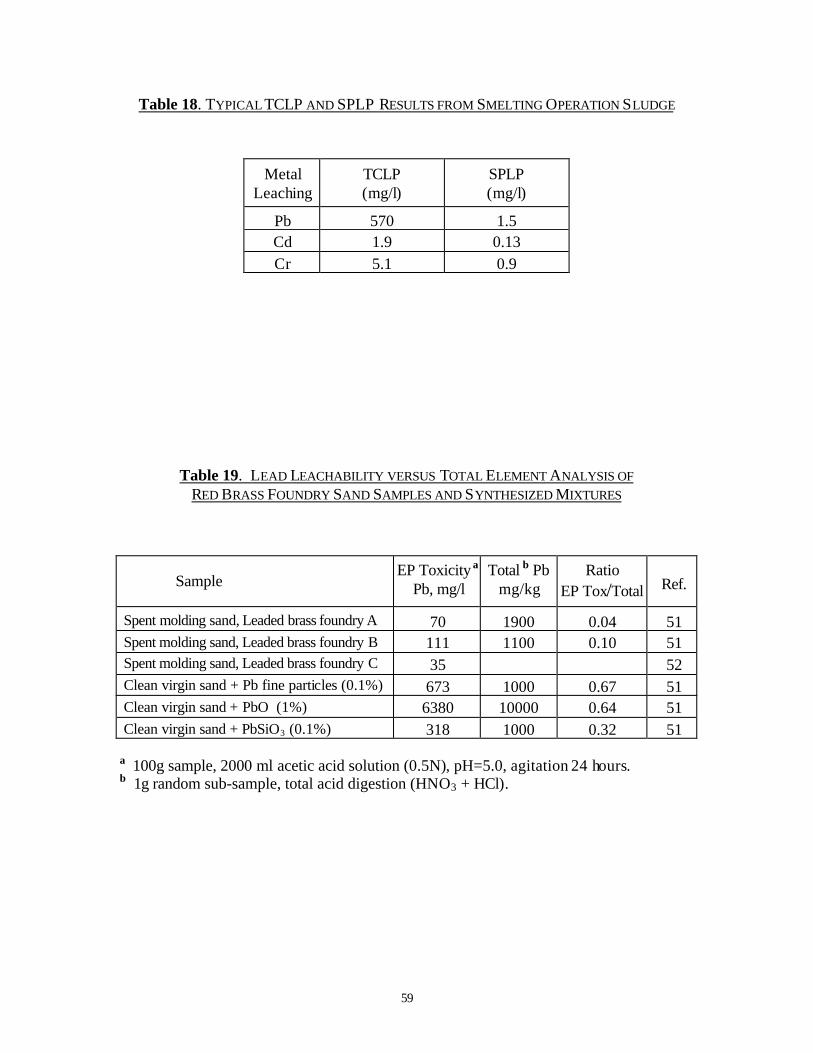
59
Table 18. TYPICAL TCLP AND SPLP RESULTS FROM SMELTING OPERATION SLUDGE
MetalLeaching
TCLP(mg/l)
SPLP(mg/l)
Pb 570 1.5Cd 1.9 0.13Cr 5.1 0.9
Table 19. LEAD LEACHABILITY VERSUS TOTAL ELEMENT ANALYSIS OFRED BRASS FOUNDRY SAND SAMPLES AND SYNTHESIZED MIXTURES
SampleEP Toxicity a
Pb, mg/lTotal b Pb
mg/kgRatio
EP Tox/Total Ref.
Spent molding sand, Leaded brass foundry A 70 1900 0.04 51Spent molding sand, Leaded brass foundry B 111 1100 0.10 51Spent molding sand, Leaded brass foundry C 35 52Clean virgin sand + Pb fine particles (0.1%) 673 1000 0.67 51Clean virgin sand + PbO (1%) 6380 10000 0.64 51Clean virgin sand + PbSiO3 (0.1%) 318 1000 0.32 51
a 100g sample, 2000 ml acetic acid solution (0.5N), pH=5.0, agitation 24 hours.b 1g random sub-sample, total acid digestion (HNO3 + HCl).

60
Table 20. BINDERS AND SOURCES FOR ORGANIC ANALYSIS
Sample Description and/or Collection PointCore BinderSystem
SampleNumber
System(Molding)Sand Type
System Sand Core Butts Core RoomWastes
Phenolformaldehyde 1 Green sand
Spent systemsand
Core butt dumphopper
Core sand fromfloor and
broken cores
Phenolicurethane
2 Green sand Prior to mullerFrom scalpingarea on return
sand belt
Ungassed sandfrom feed after
mixing
Furan hot box 3 Green sand From silo Separated fromwaste sand
Core roomfilter
Furana no-bake 4 N.A.Sand
reclamationdust
Core buttsfrom sand
reclamationReacted sand
Phenolica ester 5 N.A.Sand
reclamationdust
Core butts Reacted sand
Core oil 6 Green sand N.A. Waste corebutts
N.A.
Phenolicisocyanate 7 Green sand
Virgin sandafter muller
Open storageare separatedfrom system
sand
Core roomsweepings
Alkydisocyanate 8 No-bake
Raw sand frommixer
Spent corebutts
Core sand fromfloor and
broken coresFuran warmbox
9 Green sand N.A. Core butts Off floor
a Same foundryN.A. = not available

61
Table 21. LEACH TEST VARIABILITY (LEACHATE CONCENTRATIONS)
Replicate Leachate Samples, µg/lVolatile Analytes in aCore Oil Binder System Sample 1 2 3 4 Mean
% RSD*
Acetone 180 130 180 170 165.0 14Sec-Butylbenzene 8.9 9.0 9.2 12 9.8 15Diethylbenzenes 110 100 120 160 122.5 211,3-Dimethylnapthalene 61 60 49 44 53.5 16
1,5- & 2,3-Dimethylnapthalene 30 30 24 22 26.5 162,6-Dimethylnapthalene 21 21 18 16 19.0 13Ethylbenzene 25 22 23 22 23.0 6p-Ethyltoluene 360 330 430 670 447.5 34Isopropylbenzene 37 35 44 65 45.2 301-Methylnapthalene 75 75 68 64 70.5 82-Methylnapthalene 86 86 79 74 81.2 7Naphthalene 360 340 330 370 350.0 5Toluene 9.9 7.1 8.1 7.2 8.1 161,2,4-Trimethylbenzene andt-Butylbenzene
270 250 300 470 322.5 31
m/p-Xylene 85 77 84 88 83.5 6o-Xylene 122 120 140 170 138.0 17
*Percent Relative Standard Deviation

62
Table 22. CORE OIL BINDER SYSTEM SAMPLE: VOLATILE ANALYTE CONCENTRATIONSfrom GC-FID Analysis
Analyte Quantitation limit(µg/l)
Composite LeachConcentration*
(µg/l)
MA Standards andGuidelines for
Drinking Water (µg/l)Acetone 100 160 3000Benzene 2 <2 5sec-Butylbenzene 0.4 9.8Chloroform 2 <2 5Dichloromethane 3 <3 5Diethylbenzenes 0.3 1201,3-Dimethylnaphthalene 1 531,5- and 2,3-Dimethylnaphthalene
2 27
2,6-Dimethylnaphthalene 1 19Ethyl Acetate 8 <8Ethylbenzene 0.4 23 700p-Ethyltoluene 0.4 450n-Hexane 0.4 <0.4Isopropylbenzene 0.4 45Methyl ethyl ketone 0.8 <0.8 350Methyl isobutyl ketone 20 <20 3501-Methylnaphthalene 2 702-Methylnaphthalene 1 81Naphthalene 1 350Tetrachloroethene 2 <2Toluene 0.5 8.1 10001,1,1-Trichloroethane 2 <2 2001,2,4-Trimethylbenzeneand t-Butylbenzene
0.3 320
1,3,5-Trimethylbenzene 0.4 <0.4m- & p-Xylene 0.4 84o-Xylene 0.4 140
} 10000
*Average of four leach tests
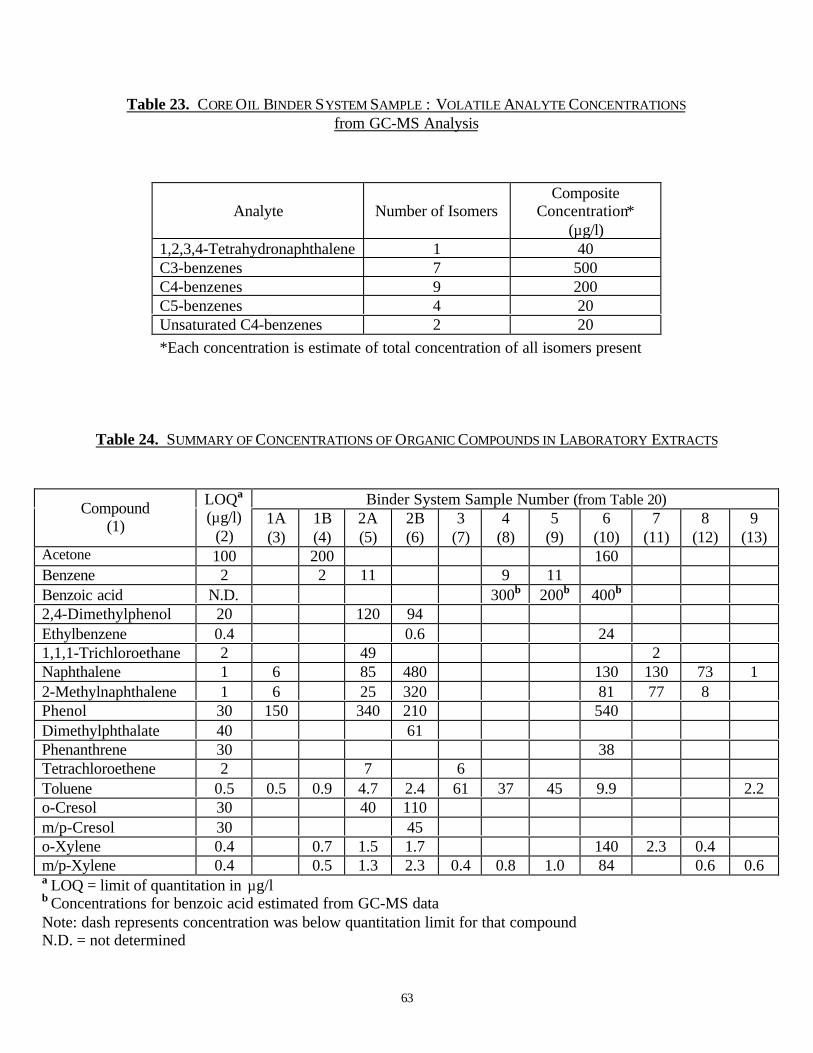
63
Table 23. CORE OIL BINDER SYSTEM SAMPLE : VOLATILE ANALYTE CONCENTRATIONSfrom GC-MS Analysis
Analyte Number of IsomersComposite
Concentration*(µg/l)
1,2,3,4-Tetrahydronaphthalene 1 40C3-benzenes 7 500C4-benzenes 9 200C5-benzenes 4 20Unsaturated C4-benzenes 2 20*Each concentration is estimate of total concentration of all isomers present
Table 24. SUMMARY OF CONCENTRATIONS OF ORGANIC COMPOUNDS IN LABORATORY EXTRACTS
Binder System Sample Number (from Table 20)Compound(1)
LOQa
(µg/l)(2)
1A(3)
1B(4)
2A(5)
2B(6)
3(7)
4(8)
5(9)
6(10)
7(11)
8(12)
9(13)
Acetone 100 200 160Benzene 2 2 11 9 11Benzoic acid N.D. 300b 200b 400b
2,4-Dimethylphenol 20 120 94Ethylbenzene 0.4 0.6 241,1,1-Trichloroethane 2 49 2Naphthalene 1 6 85 480 130 130 73 12-Methylnaphthalene 1 6 25 320 81 77 8Phenol 30 150 340 210 540Dimethylphthalate 40 61Phenanthrene 30 38Tetrachloroethene 2 7 6Toluene 0.5 0.5 0.9 4.7 2.4 61 37 45 9.9 2.2o-Cresol 30 40 110m/p-Cresol 30 45o-Xylene 0.4 0.7 1.5 1.7 140 2.3 0.4m/p-Xylene 0.4 0.5 1.3 2.3 0.4 0.8 1.0 84 0.6 0.6a LOQ = limit of quantitation in µg/lb Concentrations for benzoic acid estimated from GC-MS dataNote: dash represents concentration was below quantitation limit for that compoundN.D. = not determined


65

66
Table 25. COMPARISON OF BINDER SYSTEM WASTE STREAMS
Sample 2BPhenolic Urethane
Sample 6Core Oil
Sample 7Phenolic Isocyanate
Sample 8Alkyd Isocyanate
Concentration (µg/l) Concentration (µg/l) Concentration (µg/l) Concentration (µg/l)Analyte
(1)LOQ*
(µg/l)S.S.(3)
C.B.(4)
F.S.(5)
S.S.(6)
C.B.(7)
F.S.(8)
S.S.(9)
C.B.(10)
F.S.(11)
S.S.(12)
C.B.(13)
F.S.(14)
Benzene 2 8 - - - - - - - - - - -sec-Butylbenzene 0.4 - - - 5.6 - - - - - - 1.0 1.0Diethylbenzenes 0.3 - - 42 35 1.7 27 1.5 4.3 8.1 19 23 141,3-Dimethylnaphthalene 1 1 6 250 45 - - 1 2 13 8 6 11,5- & 2,3-Dimethylnaphthalene 2 - 3 - 22 - - - - - - - -2,6-Dimethylnaphthalene 1 - 2 110 16 - - - - 6 4 2 -Ethylbenzene 0.4 0.7 - - 30 - 1.0 - - - - 0.7 1.3p-Ethyltoluene 0.4 - - 34 36 5.2 143 - 30 0 7.5 - -n-Hexane 0.4 - - 14 - - - - - - - - 2.2Isopropylbenzene 0.4 - - 2.7 5.6 - 14 - - 1.8 - 0.7 0.41-Methylnaphthalene 2 5 10 1,300 59 - - 3 10 60 19 34 92-Methylnaphthalene 1 5 12 2,100 67 - 2 6 16 91 31 44 15Naphthalene 1 17 14 550 100 6 47 11 37 150 81 250 190Tetrachloroethene 2 - 7 - - - - - - - - - -Toluene 0.5 2.1 2.4 58 14 - - - - - - 1.7 1.01,1,1-Trichloroethane 2 - 88 - - - - - - 11 - - -1,2,4-Trimethylbenzene andt-Butylbenzene
0.3 0.4 - 32 50 2.5 93 0.7 2.2 81 7.3 13 0.9
1,3,5-Trimethylbenzene 0.4 - - - - - - 0.6 - 5.9 - 6.2 4.0m/p-Xylene 0.4 0.5 0.7 4.1 83 0.5 9.1 - - 0.8 - 1.4 2.6o-Xylene 0.4 0.5 - 5.7 49 0.7 34 - 0.5 55 - 2.0 2.4*LOQ = limit of quantitation in µg/lNote: S.S. = system sand; C.B. = core butts; F.S. = core room floor sweepingsDash represents concentration was below quantitation limit for that compound

67
Table 26. DATA FOR ORGANIC COMPOUNDS FROM TWO NEW ENGLAND FOUNDRIES
Test Performed Method Units MDL ResultsComposite: Black sand pile and baghouse dust
03/19/96baghouse
03/19/96N.E. Co #1
03/19/96N.E. Co #2
B/NA EXTRACTABLESPhenol EPA 8270 µg/kg 700 ND ND ND2-Chloroethyl ether EPA 8270 µg/kg 300 ND ND NDChlorophenol EPA 8270 µg/kg 500 ND ND ND1,3 Dichlorobenzene EPA 8270 µg/kg 100 ND ND ND1,4 Dichlorobenzene EPA 8270 µg/kg 100 ND ND ND1,2 Dichlorobenzene EPA 8270 µg/kg 100 ND ND ND2-cholorisopropyl ether EPA 8270 µg/kg 200 ND ND NDNitroso-di-n-propylamine EPA 8270 µg/kg 300 ND ND NDHexachloroethane EPA 8270 µg/kg 500 ND ND NDNitrobenzene EPA 8270 µg/kg 200 ND ND NDIsophorone EPA 8270 µg/kg 200 ND ND NDNitrophenol EPA 8270 µg/kg 200 ND ND ND2,4-Dimethylphenol EPA 8270 µg/kg 300 1180 650 6162-chloroethoxy EPA 8270 µg/kg 200 ND ND ND2,4-Dichlorophenol EPA 8270 µg/kg 200 ND ND ND1,2,4-Trichlorobenzene EPA 8270 µg/kg 200 ND ND NDNaphthalene EPA 8270 µg/kg 200 3000 1930 2150Hexachlorobutadiene EPA 8270 µg/kg 300 ND ND ND4-Chloro-3-methylphenol EPA 8270 µg/kg 200 ND ND NDHexachlorophenol EPA 8270 µg/kg 100 ND ND ND2,4,6-Trichlorophenol EPA 8270 µg/kg 100 ND ND ND2,4,5-Trichlorophenol EPA 8270 µg/kg 100 ND ND ND2-Chloronaphthalene EPA 8270 µg/kg 200 ND ND NDDimethyl Phthalate EPA 8270 µg/kg 100 ND ND NDAcenaphthylene EPA 8270 µg/kg 200 ND ND NDAcenapthene EPA 8270 µg/kg 200 ND ND ND2,4-Acenapthene EPA 8270 µg/kg 200 ND ND ND4-Nicrophenol EPA 8270 µg/kg 200 ND ND ND2,4-Dinitrotoluene EPA 8270 µg/kg 100 ND ND NDDiethyl Phthalate EPA 8270 µg/kg 200 ND ND NDFluorene EPA 8270 µg/kg 300 ND ND ND4-ChloroPhenyl Phenyl Ether EPA 8270 µg/kg 200 ND ND ND2-Methyl-4,6dinitrophenol EPA 8270 µg/kg 200 ND ND NDN-Nitrosodiphenylamine EPA 8270 µg/kg 300 ND ND ND4-Bromophenyl Phenyl Ether EPA 8270 µg/kg 100 ND ND NDHexachlorobenzene EPA 8270 µg/kg 200 ND ND NDPentachlorophenol EPA 8270 µg/kg 100 ND ND NDPhenanthrene EPA 8270 µg/kg 100 850 560 745Anthracene EPA 8270 µg/kg 200 ND ND NDDi-n-butylphthalate EPA 8270 µg/kg 100 160 ND 731Fluoranthene EPA 8270 µg/kg 100 162 131 181Benzidine EPA 8270 µg/kg 500 ND ND NDPyrene EPA 8270 µg/kg 300 ND ND NDButyle Benzyl Phthalate EPA 8270 µg/kg 100 ND ND NDBenzo (a) anthracene EPA 8270 µg/kg 100 ND ND ND3,3'-Dichlorbenzidine EPA 8270 µg/kg 100 ND ND ND
continued on next page….

68
….continued from previous page
Crysene EPA 8270 µg/kg 100 ND ND NDBis(2-Ethylexyl)phthalate EPA 8270 µg/kg 400 ND ND NDBi-n-octyl phthalate EPA 8270 µg/kg 1000 ND ND NDBenzo (b) fluoranthene EPA 8270 µg/kg 500 ND ND NDBenzo (k) fluoranthene EPA 8270 µg/kg 500 ND ND NDBenzo (a) pyrene EPA 8270 µg/kg 100 ND ND NDIndeno (1,2,3-cd)Pyrene EPA 8270 µg/kg 100 ND ND NDDibenzo (a,h) Anthracena EPA 8270 µg/kg 100 ND ND NDBenzo (g,h,i) perylene EPA 8270 µg/kg 100 ND ND ND2-FLUOROPHENOL (SURR) %PHENOL-D5 (SURR) %NITROBENZENE-D5 (SURR) %2-FLUOROBIPHENYL (SURR) %2,4,6-Tribromophenol (SURR) %TERPHENYL-D14 (SURR) %Formaldehyde MSTH,HACH mg/l 0.1 8.93 5.33 8.26
Table 27. VARIABILITY OF ORGANIC CONTENT IN SAND FROM A NEW ENGLAND FOUNDRY
Test Performed Method Unit MDL ResultsComposite: Black sandpile and bag house dust
12/18/96 01/08/97 02/03/97 04/11/97 06/11/97
B/NA EXTRACTABLESPhenol EPA 8270 µg/kg 700 7200 5700 5510 5840 ND2,4-Dimethylphenol EPA 8270 µg/kg 300 2600 1600 930 1330 NDNaphthalene EPA 8270 µg/kg 200 4600 3500 2360 2870 2140Phenanthrene EPA 8270 µg/kg 100 1800 980 640 790 NDDi-n-butylphthalate EPA 8270 µg/kg 100 360 ND ND ND NDFluoranthene EPA 8270 µg/kg 100 430 160 ND ND NDPyrene EPA 8270 µg/kg 300 320 ND ND ND NDBenzo (a) anthracene EPA 8270 µg/kg 100 150 ND ND ND NDCrysene EPA 8270 µg/kg 100 230 140 ND ND NDBi-n-octyl phthalate EPA 8270 µg/kg 1000 300 ND ND ND ND2-Fluorophenol (SURR) % 64 67 52 94 108PHENOL-D5 (SURR) % 77 76 55 99 106Nitrobenzene-D5 (SURR) % 65 62 43 75 522-Fluorobiphenyl (SURR) % 79 66 58 80 632,4,6-Tribromophenol(SURR)
% 74 102 52 86 70
Terphenyl-D14 (SURR) % 82 73 67 75 56Formaldehyde MSTH,HACH mg/l 0.1 <0.1 <0.1 <0.1 11.9 <.01

69
Table 28. MAJOR VOLATILE COMPONENTS EMITTED FROM NOVOLAC RESIN AT 980°C
Components Concentration (µg/g)
Carbon monoxide 73000Methane 47000Ethene 10400Propene 2600HCN small amount1,3-Butadiene 7001-Butene 5001,3-Cyclopentadiene 3001-Pentene 1002-Propenenitrile 1001,3-Pentadiene 63.8Benzene 23.1Phenol 13.8Naphthalene 8.8Toluene 6.52-Methyl phenol 6.04- Methyl phenol 4.62-Methyl,1-1'-biphenyl 3.3Biphenyl 2.1Phenanthrene 2.9Acenaphthylene 2.12,4-Dimethyl phenol 1.82,5-Dimethyl phenol 0.9Indene 1.61-Methylnaphthalene 1.22-Methylnaphthalene 1.2Anthracene 1.1Benzofuran 1.0Dibenzofuran 0.7Flourene 0.9
* Only components that are greater than 0.8% of the total emitted volatiles are listed Average relative standard deviation is equal to 15%.

70
REFERENCES
1. E.S. Winkler, B. Kosanovic, T. Genovese, I. Roth, Survey of Foundry Participation in theMassachusetts Beneficial Use Determination Process: Final Report to Chelsea Center forRecycling and Economic Development, Univ. of Massachusetts, Amherst, 1999.
2. R. Laitar, M. Geoffrey, Modern Casting, v.88, No.10, p.33 (1997).3. The Solid Waste Dilemma: An Agenda for Action, EPA, 1989, Publication 530-SW-89-019.4. R. Herman, Reuse Resources of New England, EPA, Region 1, (1999).5. American Foundrymen’s Society, Inc., Alternate Utilization of Foundry Waste Sand, Final
(Phase I) Report. AFS Inc., Des Plaines, IL, 1991.6. American Foundrymen’s Society, Inc., Foundry Sand Beneficial Reuse Manual, Des Plaines,
IL, 1996.7. Code of Federal Regulations. Title 40. Parts 141, 143. Washington. US Government Printing
Office.8. P. Kauffman, R. Regan, R. Voigt, Trans. Am. Foundrymen’s Soc., v.104, p.527 (1996).9. WWW.foundryrecycling.org – The Foundry Industry Recycling Starts Today (FIRST),
consortium for market development of beneficial use of foundry by-products.10. T. Abichou, C.H. Benson, T.B. Edil, Database on Beneficial Reuse of Foundry By-Products,
GSP No. 79, GeoCongress-98, Boston, pp.210-223., (1998).11. B.K. Partridge, J.E. Alleman, P.J. Fox, D.G. Mast, Transportation Res. Rec, v.1619, p.55
(1998).12. P.J. Tikalsky, E. Smith, R.W. Regan, ACI Materials J., v.95, No.6, p.740 (1998).13. K. Stern, Foundry Manag. Technol., v.123, No.9, p.78 (1995).14. T. Naik, M. Viral, M. Dhaval, P. Mathew, J. Materials Civil Eng., v.6, No.2, p.254 (1994).15. Code of Massachusetts Regulations. 310 CMR 22.06. State Publishing House. Boston. 1997.16. Code of Federal Regulations. Title 40. Parts 260-299. Washington. US Government Printing
Office.17. Test Methods for Evaluating Solid Waste, Physical/Chemical Methods, U.S. EPA Publication
SW-846. Third Edition (1995).18. Reuse and Disposal of Contaminated Soil at Massachusetts Landfills. Department of
Environmental Protection. Policy # COMM-97-001. Boston. 1997.19. Codes, Rules and Regulations of the State of New York . 6 NYCRR Part 360-1.15.20. W.B. Blackburn and I. Show, Collaborative Study of the Toxicity Characteristic Leaching
Procedure (TCLP). Final Report. Contract No 68-03-1958 (1986).21. Methods for the Determination of Metals in Environmental Samples. Suppl. I. EPA/600/R-
94/111, Cincinnati, OH, 1994.22. Annual Book of ASTM Standards, v. 11.01, 11.02, American Society for Testing and
Materials. 1994 and 1996.23. Methods for the Determination of Organic Compounds in Drinking Water, EPA-600/4-88-
039, 1988, Revised, 1991; Suppl. I, EPA 821-B-94-005, 1994; Suppl. II, EPA/600/R-92/129,1992.
24. Energy and Environmental Profile of the Metalcasting Industry. U.S. Department of Energy.Office of Industrial Technologies, Washington, D.C., Report (1999).
25. Form R, Reporting of Binder Chemicals Used in Foundries, 2nd Ed., American Foundrymen’sSociety, (1998).
26. Guide to Sand Additives, American Foundrymen’s Society, (1976).27. Chemically Bonded Cores and Molds, American Foundrymen’s Society, (1987).28. J.B. Echard, R.W. Regan, R.C. Voigt, Trans. Am. Foundrymen’s Soc., v.103, p.463 (1995).

71
29. R.W. Regan, R.C. Voigt, W.T. Paletski, R.P. Massel, Trans. Am. Foundrymen’s Soc., v.102,p.749 (1994).
30. R.C. Krueger, R.K. Ham, W.C. Boyle, Proc. of 43rd Annual Purdue Industrial Waste Conf.,Lewis Publishers, Chelsea, MI, pp.605-616 (1989).
31. R.K. Ham, W.C. Boyle, F.J. Blaha, D. Oman, D. Trainer, T.J. Kunes, D.G. Nichols,R.R.Stanforth, Trans. Am. Foundrymen’s Soc., v.94, p.935 (1986).
32. D.P. Komilis , R.K. Ham, R. Stegmann, Waste Manag. Res., v.17, p.10 (1999).33. R.A. Landon, J. Ground Water, v.7, p.9 (1969).34. T.R. Ostrom, P.K. Trojan, Trans. Am. Foundrymen’s Soc., v.96, p.435 (1988/89).35. R.K. Ham, W.C. Boyle, E.C. Engroff, R.L. Fero, J. of Environ. Eng., v.119, p.34 (1993).36. R.R. Stanforth, P.D. Turpin, Trans. Am. Foundrymen’s Soc., v.99, p.261 (1991).37. D.E. Fahnline, R.W. Regan, 7th AFS Environmental Affairs Conf., Arlington Heights, IL,
1995. Part XVII-C, pp.1-20.38. Guide to the Regulation of Toxic Chemicals in Massachusetts Waters. Office of Research and
Standards, MA DEP, Boston, 1990.39. C.E. Bates, W.D. Scott, Trans. Am. Foundrymen’s Soc., v.84, p.793 (1976).40. G.E. Tubich, Trans. Am. Foundrymen’s Soc., v.74, p.448 (1966).41. J. Hetper, M. Sobera, J. Chromatogr. A, v.833, p.277 (1999).42. C.A. Lytle, W. Bertsch, M. McKinley, J. Anal. Appl. Pyrol., v.45, p.121 (1998).43. H. Patterson, Trans. Am. Foundrymen’s Soc., v.49, p.35 (1951).44. T.Stefanowicz, S. Napieralska-Zagozda, M. Osiñska, S. Szwankowski, Archiwum Ochrony
Œrodowiska, v.1994, No.1-2, p.177 (1995).45. R.K. Ham, W.C. Boyle, T.P. Kunes, J. Environ. Eng. Div., v.107, p.155 (1981).46. A. Paschke, R. Wennrich, P. Morgenstern, G. Schumann, G. Schüürmann, Chemische
Technik , v.49, p.157 (1997).47. A.K. Alva, O. Prakash, S. Paramasivam, J. Environ. Sci. Health , v.A34, p.1473 (1999).48. W.L. Bradford, J. Flanzenbaum, Application of Leaching Algorithms and Worst-Case
Analysis to Assessment of Risk to Ground Water from Contaminated Soils. Versar,Springfield, VA, 1990.
49. R.E. Cameron, Guide to Site and Soil Description for Hazardous Waste Characterization.v.1, EPA/600/4-91/029, 1991.
50. D.P. Komilis , R.K. Ham, R. Stegmann, Waste Manag. Res., v.17, p.10 (1999).51. P.K. Trojan, T.R. Ostrom, J. Biel, R.A. Flinn, Trans. Am. Foundrymen’s Soc., v.92, p.793
(1984).52. P.K. Trojan, T.R. Ostrom, Trans. Am. Foundrymen’s Soc., v.95, p.711 (1987).