treatment standards technical foundry document sandinfohouse.p2ric.org/ref/18/17218.pdf · foundry...
TRANSCRIPT
I , -* /?$ /= I , & / Y
TECHNICAL SUPPORT DOCUMENT
TREATMENT STANDARDS FOR FOUNDRY SAND
NOVEMBER 1989
Prepared by: Nancy S. Ostrom
Under the Direction of Jan Radimsky, P.E.
Gary Murchison, P.E.
DEPARTMENT OF HEALTH SERVICES TOXIC SUBSTANCES CONTROL PROGRAM
ALTERNATIVE TECHNOLOGY DIVISION

ACKNOWLEDGEMENTS - The Department wishes to acknowledge all the foundries that participated in the foundry survey and provided information and data on foundry operations and waste treatment. The Department also wishes to thank the Califomia Cast Metals Association for their assistance in gathering information for this report
DISCLAIMER - Mention of a commercial product or organization does not constitute endorsement or recommendation for use by the Department of Health Services
ii
EXECUTIVE SUMMARY
Pursuant to Senate Bill 1500 (SB 1500, Roberti, 1986), chaptered as the Hazardous Waste
Management Act of 1986, Article 7.7, Division 20 of the Health and Safety Code (HSC), the
Department of Health Services (the Department) must adopt treatment standards establishing the
level of treatment required prior to land disposal of hazardous waste. This report presents staffs
findings of treatment technologies available to treat waste foundry sand and the associated
treatment levels. Only hazardous wastes destined for land disposal are required to meet the
treatment standards.
Staff considered the information contained in the Hazardous Waste Information System, Biennial
Generator Reports, the literature and a survey of generators to characterize the volumes and
chemical composition of waste foundry sand. DHS-funded waste reduction grant projects, the
literature and the affected industry provided information on the availability and effectiveness of the
applicable treatment technologies.
Staff estimates approximately 18,200 tons of hazardous waste foundry sand are generated each
year in California. Staff further estimates approximately 8 1 % of the generators reclaim metal from
their waste foundry sand, approximately 88% recycle some portion of the waste and about 30%
treat the unrecycled portion of the waste onsite using chemical stabilization. The overlap indicates
that many generators both reclaim metal from the sand and recycle some portion of the sand.
Foundry sand is generated by foundries that use sand to form casting molds. The sand generated
by brass foundries may contain hazardous levels of copper, lead, zinc, cadmium and nickel. The
treatment standard proposes that prior to land disposal the five hazardous constituents must meet
the following soluble extractable levels:
iii
copper 200 mgfl lead 30 mgfl Zinc 250 mg/l C a d " 1.0 mg/l nickel 20 mg/l
The concentration of soluble metals in waste foundry sand must be determined using the Waste
Extraction Test outlined in the California Code of Regulations (CCR) in $66700. The treatment
standard also proposes that hazardous waste foundry sand that contains metals in addition to the
five metals listed is subject to the general treatment standard for solids with metals and hazardous
waste foundry sand that contains organic compounds is subject to the general treatment standard
for solids with organics.
Adequate commercial capacity exists to treat the volume of hazardous waste foundry sand
generated is available at a single facility only. To provide time for generators to establish contracts
with this facility, staff proposes this treatment standard become effective six months from the date
the regulation is adopted.
iv
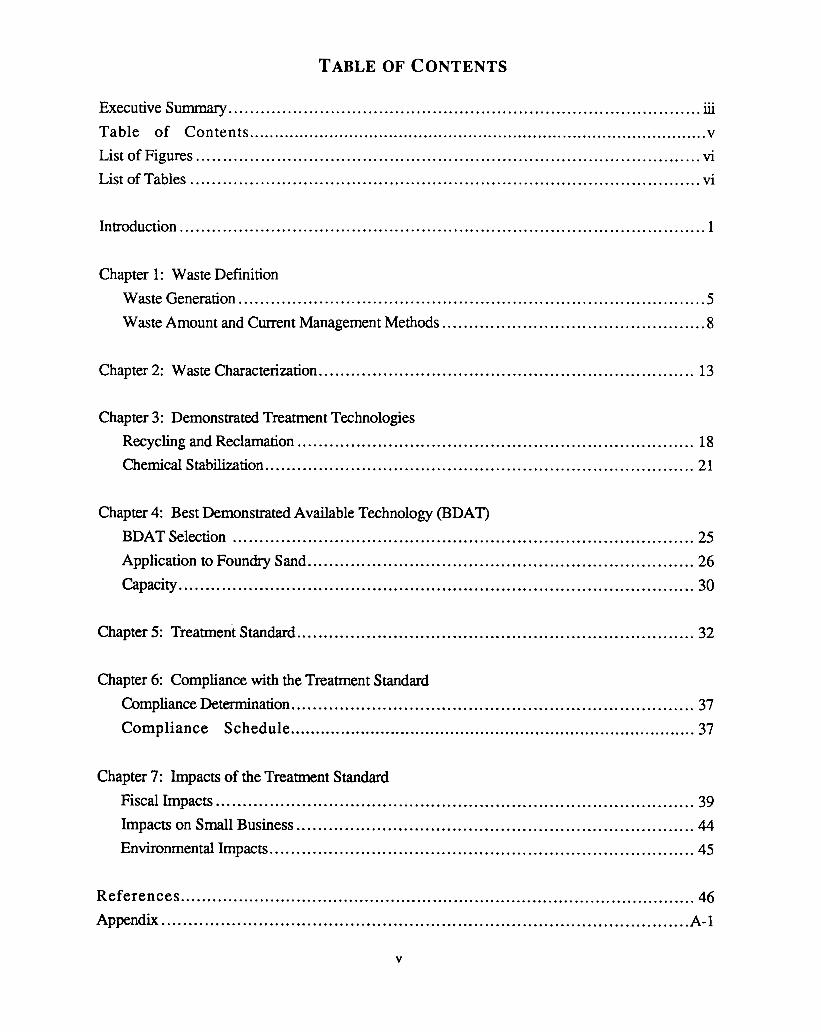
TABLE OF CONTENTS
... Executive Summary ........................................................................................ IU
List of Figures .............................................................................................. vi List of Tables ......................................................................................... ......vi
Table of Contents ............................................................................................ v
Introduction .................................................................................................. 1
Chapter 1: Waste Definition Waste Generation ....................................................................................... 5 Waste Amount and Current Management Methods ................................................. 8
Chapter 2: Waste Characterization ...................................................................... 13
Chapter 3: Demonstrated Treatment Technologies Recycling and Reclamation .......................................................................... 18 Chemical Stabilization ................................................................................ 21
Chapter 4: Best Demonstrated Available Technology (BDAT) BDAT Selection ...................................................................................... 25 Application to Foundry Sand ........................................................................ 26
Capacity ................................................................................................ 30
Chapter 5: Treatment Standard .......................................................................... 32
Chapter 6: Compliance with the Treatment Standard Compliance Determination ........................................................................... 37
Compliance Schedule ................................................................................. 37
Chapter 7: Impacts of the Treatment Standard Fiscal Impacts ......................................................................................... 39 Impacts on Small Business .......................................................................... 44 Environmental Impacts ............................................................................... 45
References .................................................................................................. 46 Appendix .................................................................................................. A- 1
V
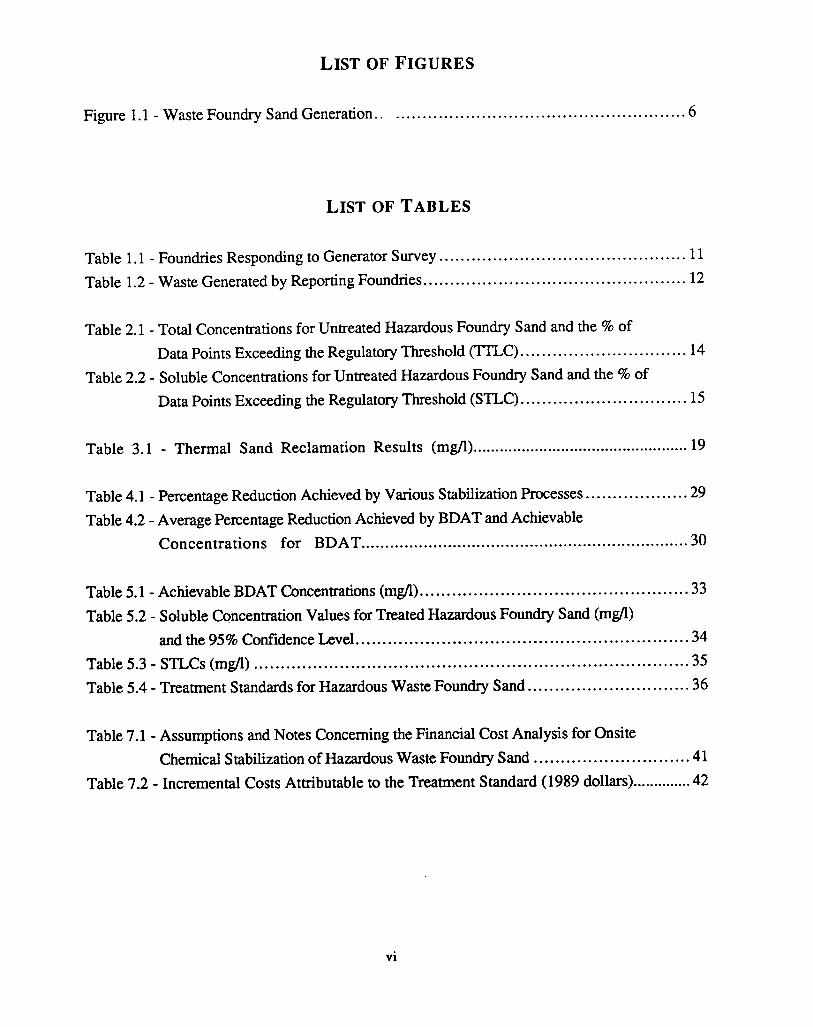
LIST OF FIGURES
Figure 1.1 . Waste Foundry Sand Generation ........................................................ 6
LIST OF TABLES
.............................................. Table 1.1 . Foundries Responding to Generator Survey 11
Table 1.2 . Waste Generated by Reporting Foundries ................................................. 12
Table 2.1 . Total Concentrations for Untreated Hazardous Foundry Sand and the % of
Table 2.2 . Soluble Concentrations for Untreated Hazardous Foundry Sand and the % of
Data Points Exceeding the Regulatory Threshold ("LC) ............................... 14
Data Points Exceeding the Regulatory Threshold (STLC) ............................... 15
Table 3.1 . Thermal Sand Reclamation Results (mg/l) ................................................. 19
Table 4.1 . Percentage Reduction Achieved by Various Stabilization Processes ................... 29
Table 4.2 . Average Percentage Reduction Achieved by BDAT and Achievable Concentrations for BDAT .................................................................... 30
Table 5.1 . Achievable BDAT Concentrations (mu) .................................................. 33
and the 95% Confidence Level .............................................................. 34 Table 5.3 . STLCs ( m d ) ................................................................................. 35 Table 5.4 . Treatment Standards for Hazardous Waste Foundry Sand .............................. 36
Table 5.2 . Soluble Concentration Values for Treated Hazardous Foundry Sand (mg/l)
Table 7.1 . Assumptions and Notes Concerning the Financial Cost Analysis for Onsite
Table 7.2 . Incremental Costs Attributable to the Treatment Standard (1989 dollars) .............. 42
Chemical Stabilization of Hazardous Waste Foundry Sand ............................. 41
vi
INTRODUCTION
In California land disposal restrictions provide an incentive for generators of hazardous waste to
move away from using land disposal as the primary option for hazardous waste management. A
number of factors drive this movement away from land disposal, including uncertainty in the
ability of land disposal units to contain certain wastes and declining land disposal capacity.
Incidents of migration of hazardous constituents from land disposal facilities have focused attention
on both the need to treat hazardous wastes before they are placed in land disposal units and on the
need to ensure land disposal units meet minimum engineering standards that will enhance their
integrity and ability to contain wastes. In addition, the available capacity for land disposal for
hazardous waste is likely to continue to decline if existing land disposal facilities close and siting
new facilities becomes increasingly difficult.
To facilitate the movement away from land disposal and to spark development of alternative
methods for managing hazardous waste, Califomia passed a number of laws and regulations
restricting land disposal and emphasizing alternative management methods. California’s original
restrictions prohibited the land disposal of liquids containing cyanide, certain metals, high levels of
acid, PCBs, and liquids and solids containing halogenated organics (California Code of
Regulations (CCR) 566900 et seq). The regulation specifies the waste concentrations and schedule
of restrictions. California’s most recent land disposal restrictions, described in the Hazardous
Waste Management Act of 1986, expand the original program by prohibiting all land disposal of
untreated hazardous waste in California. These restrictions parallel the federal land disposal
restrictions applied to wastes classified as hazardous under the federal regulations.
The Hazardous Waste Management Act of 1986, initially proposed as SB 1500 (Roberti 1986), is
chaptered as Article 7.7 in Division 20 of the California Health and Safety Code (HSC 525179.1 et
seq). This law requires the Department of Health Services (the Department) to prohibit the land
1
disposal of all untreated hazardous waste on or before May 8, 1990 and to specify the treatment
levels, or standards, for treating hazardous waste prior to land disposal. Because the treatment
standards are based on the best demonstrated available technology (BDAT) and focus on waste
reduction, recycling, and treatment in that order of priority, the law encourages industry to develop
alternative waste management options, shifting the burden away from land disposal. In addition,
since the Department sets the treatment standards at a level that minimizes the hazardous
characteristics of the waste, the waste becomes more suitable for land disposal, reducing the
likelihood that hazardous constituents will bioaccumulate or migrate into air, land or water.
The Department develops these treatment standards for wastes considered hazardous in California.
The U.S. Environmental Protection Agency (EPA) is developing treatment standards for wastes
considered hazardous by the federal regulations and California will review and adopt EPA’s
treatment standards within six months after they are completed (51 FR 19300). If the Department
fails to adopt a treatment standard for a waste, all land disposal of that waste will be prohibited
after May 8, 1990.
With some exceptions, all hazardous waste destined for land disposal must meet the appropriate
treatment standard and deadline before it can be placed in a land disposal facility. The Department
may grant a renewable one-year variance to a generator demonstrating, among other things, that the
waste cannot be recycled or treated to meet the treatment standard. In addition the Department may
grant exemptions to a generator with a special waste classification for its waste if the generator
demonstrates no economically and technologically feasible alternatives exist to meet the treatment
standard. If the Department fails to adopt a treatment standard for a waste, the Department cannot
grant variances or exemptions for that waste.
To ensure the treatment standards are based on realistic asshnptions and reflect the best
demonstrated available technology, the Department works with the affected industries, whenever
2
possible, to solicit waste characterization and treatment data. After the treatment standard is
developed, the Department issues a draft staff report summarizing the findings and data supporting
the treatment standard. The draft report forms the basis for discussion at the subsequent workshop
and serves as the foundation for the final technical report supporting the treatment standard
regulation. Through the land disposal restrictions and treatment standard regulations, California
hopes to ensure that bioaccumulation and migration of hazardous wastes from land disposal
facilities will be reduced, and encourage generators to reduce their dependence on land disposal
and aggressively pursue alternative methods of hazardous waste management.
FOUNDRY SAND
Typically, foundries generate hazardous waste foundry sand when sand, used as a molding
material, becomes contaminated at some point in the production of a casting and exhibits hazardous
waste characteristics as determined by CCR Title 22, Article 1 1. The sand also may be considered
hazardous according to federal criteria if it contains any of the eight metals identified in 40 CFR
5261.24 above the federal thresholds or exhibits any other hazardous characteristics pursuant to 40
CFR Part 261, Subpart C. Wastes classified as hazardous according to the federal criteria are
known as “RCRA” hazardous wastes. Hazardous waste considered hazardous only according to
California’s criteria are known as “non-RCRA” hazardous waste.
The Department is proposing treatment standards for the levels of copper, zinc, lead, cadmium and
nickel in non-RCRA hazardous waste foundry sand. If the waste exhibits hazardous
characteristics according to federal criteria and is a RCRA hazardous waste, then federal treatment
standards as adopted by California apply to the waste. If non RCRA hazardous waste foundry
sand contains contaminants other than the five metals the proposed treatment standard sets levels
for, or exhibits other hazardous characteristics according to the state regulations, the waste will be
required to meet the appropriate generic treatment standard for solids with metals, solids with
organics, aqueous waste with metals and aqueous waste with organics.
3
Two workshops for the proposed treatment standard for foundry sand were held on August 15 and
18,1989. The workshop announcement and lists of workshop attendees are included in the
Appendix. The comments received in the workshops and additional information gathered form the
basis for the revisions in this report.
4
WASTE DEFINITION
Defining the waste stream for a treatment standard requires identifying the specific waste types
included in the waste stream, the industries generating the wastes, the amounts generated and
current methods of managing the waste. To gather this information staff consulted a number of
sources including literature, manifests, biennial generator reports and trade associations. Due to
the limitations discovered in the available data, staff also conducted a survey of generators.
WASTE GENERATION
Waste foundry sand is generated by foundries that use sand to form molds for casting. Foundries
casting copper-based alloys (brass or bronze foundries), in particular, generate hazardous waste
sand contaminated with cadmium, lead, copper, nickel and zinc, often in high total and extractable
concentrations. The treatment standard for foundry sand focuses on the hazardous waste sand
from these brass and bronze foundries, but any foundry generating waste sand that is considered
hazardous according to either the state or Federal requirements will be subject to this and/or other
treatment standard(s).
Most foundries reuse some portion of their foundry sand; in many cases most of the sand is
reused. However, some new sand and binder is typically added to the used sand to maintain the
molding properties of the sand and enhance casting quality. Although some sand is lost to spills
and shakeout, an additional amount of sand must often be removed so the system can
accommodate the portion of new sand that must be added. This amount of removed sand,
combined with the sand lost to spills, shakeout and sand not reused, becomes the “waste” sand.
Figure 1.1 illustrates the primary sources of waste sand. In brass foundries such waste sand is
often hazardous because it contains high levels of copper, lead, zinc and sometimes cadmium and
nickel.
5
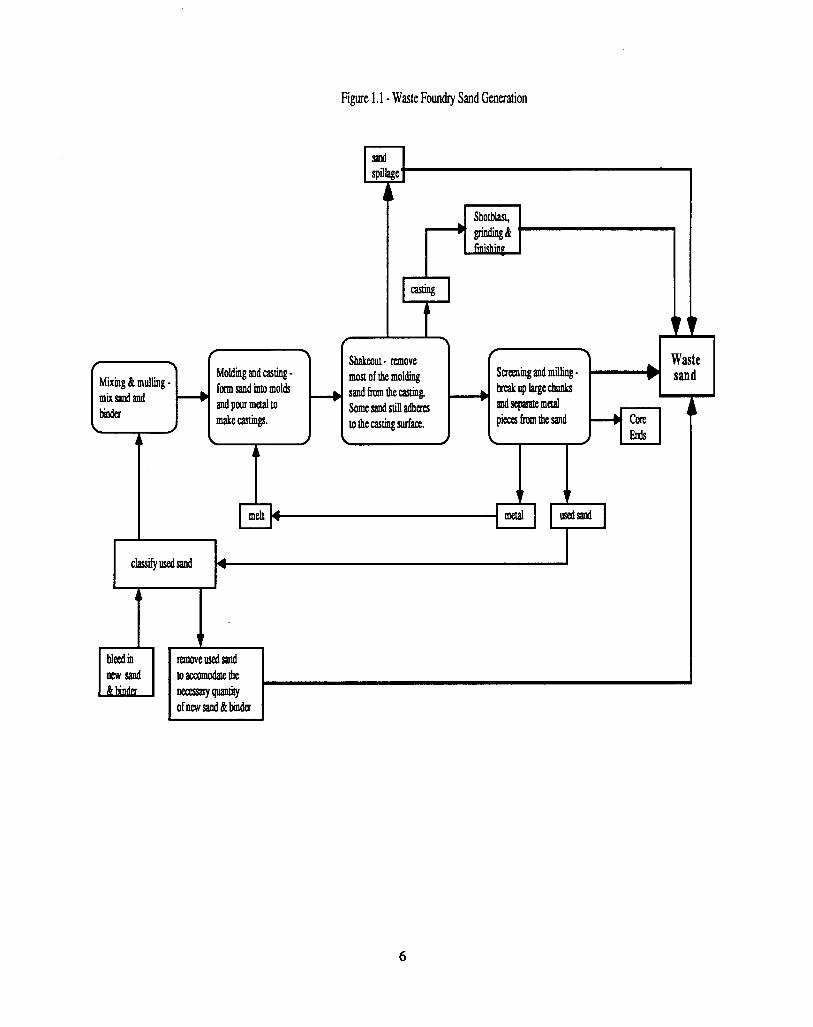
Figure 1.1 - Waste Foundry Sand Generation
treak up luge chunks 4 sandfromthecasting. form sand into molds m i p o u r m a a i t
Mixing & mulling - mixsandand binder
Some sand still adhm andscpamtemaal + +
r
6
The proposed treatment standards apply to the levels of copper, lead, zinc, cadmium and nickel in
nonRCRA hazardous waste foundry sand or waste sand residue generated by foundries using sand
as a molding material. As defined earlier, nonRCRA hazardous waste are hazardous wastes
considered hazardous only according to California's hazardous waste criteria, as determined
according to CCR Title 22, Article 11. If the nonRCRA hazardous waste foundry sand contains
metals other than the five listed, or it contains organic contaminants, this treatment standard for
foundry sand specifies that the waste must also meet the treatment standards for solid waste with
metals and solid waste with organics.
If the hazardous waste foundry sand is a RCRA waste (hazardous according to federal criteria),
however, it is subject only to the applicable federal treatment standard. It is not subsequently
subject to state treatment standards. However, if the Department adopts a more stringent standard
than the federal standard, the state may require that foundries generating RCRA waste meet the
state treatment standard instead of the federal treatment standard. The Department anticipates the
federal treatment standards will be promulgated by May 8,1990 and will evaluate the relative
stringency of the standards at that time.
Staff has identified approximately 65 brass foundries (not all cast exclusively in brass) in the 1988
edition of the California Manufacturer's Re~s te r (CMR). Since most of the foundries listed in the
CMR employ fewer than 50 people and collect less than $1 million per year in gross receipts, most
appear to be small businesses. Because not all of the 65 foundries listed in the CMR specified the
casting method used, it is not clear how many of those foundries use sand as a molding material.
Although other sources have indicated, but not confirmed, that the number of foundries that pour
some brass in California is likely to be higher, in the absence of better information, staff will
assume for this report that all 65 of the foundries staff identified use the sand casting method and
they represent the brass foundries in California.
7
WASTE AMOUNT AND CURRENT WASTE MANAGEMENT
While it is clear that the waste sand generated by brass foundries casting in sand is likely to be
hazardous, it is less obvious how much of this waste is generated and how it is currently managed.
Typically, this information is readily available from manifest records and biennial generator
reports. However, in the case of brass foundries the usual sources did not yield adequate data. To
supplement this reporting information, staff surveyed over 200 foundries (both those casting in
brass and those casting in other metals, including iron and aluminum) enlisting the help of the
California Cast Metals Association (CCMA) to survey the brass foundries. Unfortunately, despite
CCMA’s support, few brass foundries participated in the survey. Hence, staffs estimates of
waste amounts generated and current waste management practices reflect extrapolations from the
available data.
Manifest Records
With some exceptions, every shipment of hazardous waste transported off the site of generation
must be accompanied by a hazardous waste manifest signed by the generator, the transporter and
eventually the receiving facility. Under this system both the generator and the receiving facility
send copies of the manifest to DHS notifying the Department both when the waste leaves the site of
generation and when it arrives at the receiving facility. These manifest records, maintained in the
Hazardous Waste Information System (HWIS), enable DHS to track shipments of hazardous
waste identifying the type and amount of waste shipped and its destination. Using HWIS
information, staff identified, by the Standard Industrial Classification (SIC) code, eight foundries
generating California Waste Code (CWC) 181 in 1987. These eight foundries shipped a total of
254 tons of CWC 181 offsite in that year. Records from 1988 had not been entered into HWIS at
the time of this analysis.
However, the information gathered from manifest records is of limited use if the manifest
documents are not completed, if they are completed incorrectly, if all waste management takes
8

place onsite, or if the waste type cannot be clearly distinguished from other waste types due to the
waste codes used on the manifests. For example, the 254 tons of waste attributed to foundries in
the 1987 manifest records may not represent only waste sand; other inorganic solid waste may be
included in these amounts. Since California does not have a waste code designated specifically for
waste foundry sand, these wastes fall under the waste code 181, other inorganic solid waste.
Clearly, this is a broad category and not all generators of California Waste Code (CWC) 18 1 are
foundries. In addition not all foundries may classify their sand as CWC 181. If the foundry mixes
its waste sand with other waste such as machining waste or baghouse waste, it may choose another
waste code, such as CWC 172, metal dust or machining waste, or CWC 591, baghouse waste, for
the waste sand mixture. Finally, of those foundries using CWC 181, the entire volume of that
waste may not be waste sand. All or a portion of the waste classified as CWC 18 1 may actually be
some other inorganic solid hazardous waste generated by the foundry. Without a method for
confirming that the waste identified as CWC 181 is indeed waste sand and not another waste
stream, and that CWC 18 1 is the only waste code used for waste sand, the uncertainty inherent in
the exising system of waste codes will persist.
Perhaps more significant, however, is the error introduced because manifests are not used. The
eight foundries identified by HWIS are not all brass foundries nor do they all use sand castings or
generate waste sand. Staff postulates that few of the 65 brass foundries identified in California
used manifests in 1987 either because they managed hazardous waste sand onsite, they managed
the foundry sand as nonhazardous or they were unaware that a manifest was required. Many
foundries were beginning to learn around 1986 and 1987 that the sand from brass foundries may
be considered hazardous and may not have known at that time that manifests were required for that
waste stream.
9
Biennial Generator Reports
Because hazardous waste manifest records only track wastes shipped offsite, biennial generator
reports are important information sources for all activities including onsite waste management and
waste reduction. All hazardous waste generators are required to submit reports every other year
describing hazardous waste generation and management methods for the previous year. In
addition, all facilities with treatment, storage or disposal permits are required to submit a report
every year describing the permitted activities. The most recent information available at the time of
this analysis were reports submitted in 1987 summarizing 1986 activities. In 1987 the Department
received reports from only six generators identifying themselves as foundries. Of these, three were
brass foundries but none reported generating hazardous waste foundry sand. The three brass
foundries generated 7 1.5 tons of baghouse waste primarily containing zinc oxide. Again, the low
reporting rates may be due to foundries not realizing in 1986 that the waste sand may be hazardous
and that the biennial generator report is required of hazardous waste generators.
Foundry Survey
Because very little information on waste foundry sand and its generators is available from the
manifest system and the biennial reports, staff elected to conduct a survey of foundries in the state
to better characterize the foundry industry in California. Staff administered a written survey to
over 200 foundries, enlisting CCMA’s aid to send surveys to all the brass foundries on CCMA’s
list (the Appendix contains a copy of the survey). Of the 48 foundries responding to the survey,
18 were brass foundries (see Table 1.1). Of the 18 brass foundries responding, 16 reported
generating approximately 4,500 tons of waste foundry sand in 1988, each foundry averaging
around 280 tons/year (see Table 1.2). Of the brass foundries responding to the survey, 81%
reclaim metal from the sand, 88% reuse or recycle some portion of the sand and 31% treat the
waste sand onsite (see Appendix for raw survey data). Clearly, many foundries both reclaim metal
and reuse some portion of their sand.
10
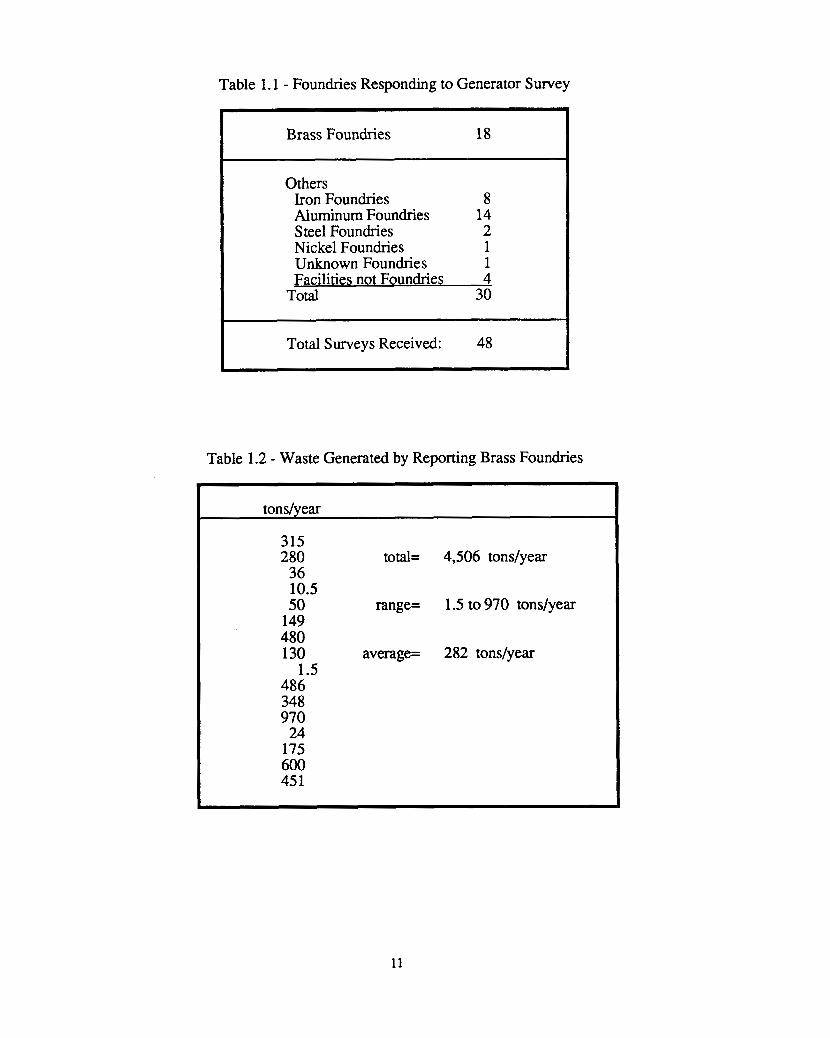
Table 1.1 - Foundries Responding to Generator Survey
~
Total Surveys Received: 48
Brass Foundries 18 I Others
Iron Foundries 8 Aluminum Foundries 14 S tee1 Foundries 2 Nickel Foundries 1 Unknown Foundries 1 - Facilities not Foundries 4
Total 30
Table 1.2 - Waste Generated by Reporting Brass Foundries
ton s/year
315 280 total=
36 10.5 50 range=
149 480 130 average=
486 348 970 24
175 600 45 1
1.5
4,506 tons/year
1.5 to 970 tons/year
282 tons/year
11
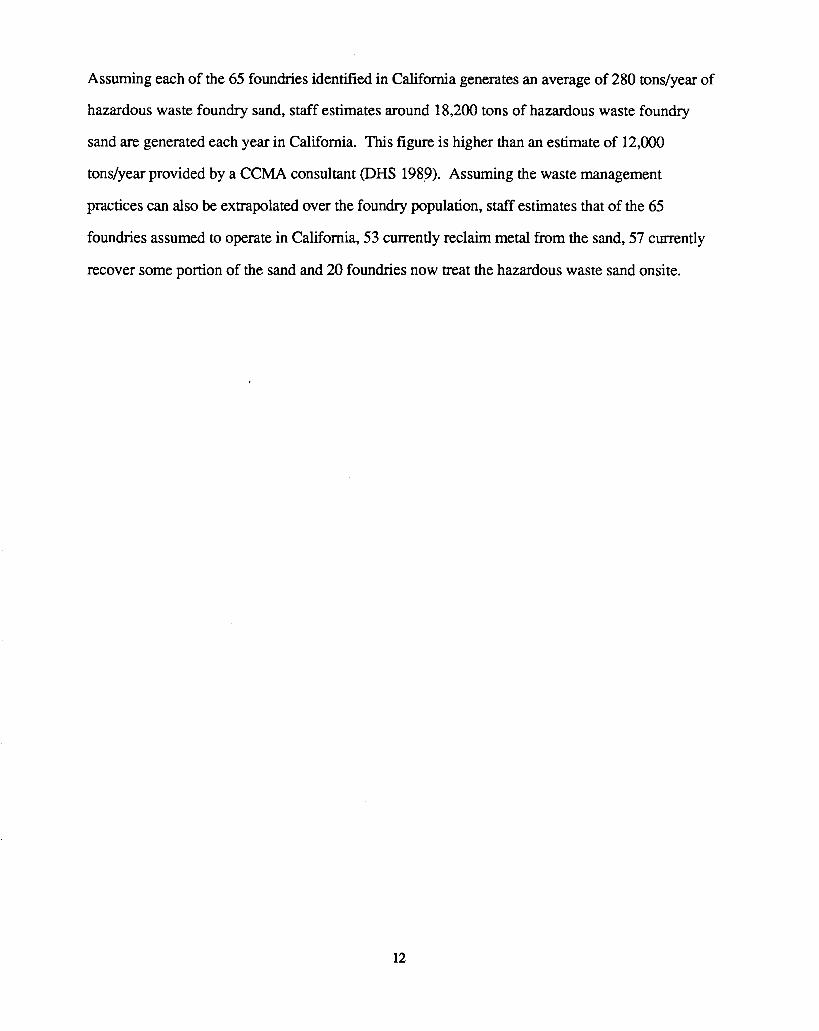
Assuming each of the 65 foundries identified in California generates an average of 280 tons/year of
hazardous waste foundry sand, staff estimates around 18,200 tons of hazardous waste foundry
sand are generated each year in California. This figure is higher than an estimate of 12,000
tons/year provided by a CCMA consultant (DHS 1989). Assuming the waste management
practices can also be extrapolated over the foundry population, staff estimates that of the 65
foundries assumed to operate in California, 53 currently reclaim metal from the sand, 57 currently
recover some portion of the sand and 20 foundries now treat the hazardous waste sand onsite.
12
WASTE CHARACTERIZATION
From the literature and analyses of hazardous waste foundry sand obtained from the two DHS-
funded waste reduction grant projects, DHS sampling and the foundry survey, staff determined
that untreated hazardous waste foundry sand may contain a number of hazardous constituents. For
example, when analyzed for totaZ concentrations of inorganic Persistent and Bioaccumulative Toxic
Substances, as described in CCR Title 22, Article 1 1, waste foundry sand from brass foundries
may exhibit levels copper, lead, zinc and nickel that exceed the regulatory thresholds for each
substance. These regulatory thresholds are known as the Total Threshold Limit Concentrations
W C s ) and are found in CCR §66699(b). Similarly, when analyzed for soluble (or extractable)
concentrations using the Califomia Waste Extraction Test (WET) procedure (CCR §66700), the
soluble levels of copper, lead, zinc and cadmium typically exceed the regulatory thresholds, known
as the Soluble Threshold Limit Concentration (STLC) also found in CCR §66699(b). When the
constituents of a waste exceed either of these thresholds or the waste exhibits other hazardous
characteristics included in Article 11, the waste is considered hazardous in California.
In addition to classification as a hazardous waste in California, the literature demonstrates that
waste foundry sand from brass foundries has also been classified as a RCRA hazardous waste, or
hazardous according to federal criteria. The concentration of lead in waste brass foundry sand is
typically greater than 5.0 mgA, using EPA’s Extraction Procedure (EP) toxicity test, classifying it
as DO08 waste or EP toxic for lead (Zirschky 1988). Although EPA has not yet developed
treatment standards for RCRA characteristic wastes, such as DO08 waste, standards are scheduled
to be promulgated by May 8,1990. All foundry sand exhibiting hazardous waste characteristics
under the federal regulations (40 CFR Part 261, Subpart C) will be subject to the federal treatment
standards for characteristic wastes.
13
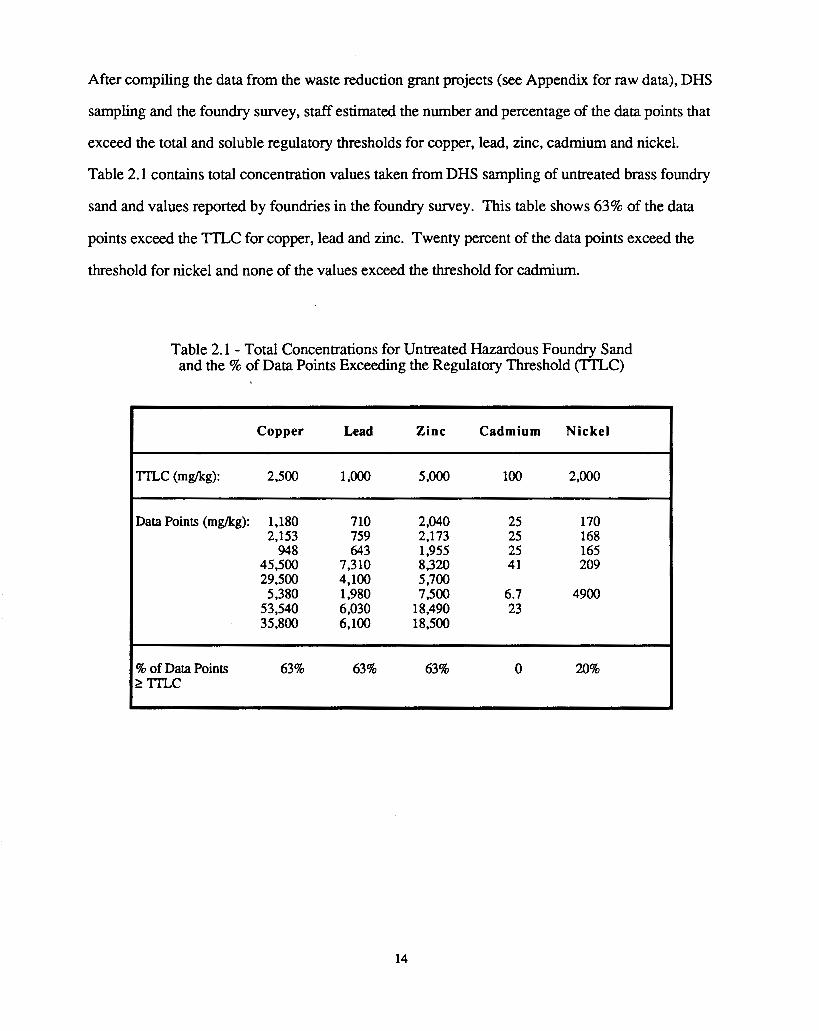
After compiling the data from the waste reduction grant projects (see Appendix for raw data), DHS
sampling and the foundry survey, staff estimated the number and percentage of the data points that
exceed the total and soluble regulatory thresholds for copper, lead, zinc, cadmium and nickel.
Table 2.1 contains total concentration values taken from DHS sampling of untreated brass foundry
sand and values reported by foundries in the foundry survey. This table shows 63% of the data
points exceed the 'ITLC for copper, lead and zinc. Twenty percent of the data points exceed the
threshold for nickel and none of the values exceed the threshold for cadmium.
. Copper Lead Zinc Cadmium Nickel
n-Lc (mgflrg): 2,500 1 ,OOo 5,000 100 2,000
Data Points (mag): 1,180 2,153 948
45,500 29,500 5,380 53,540 35,800
710 759 643
7,310 4,100 1,980 6,030 6,100
2,040 25 170 2,173 25 168 1,955 25 165 8,320 41 209 5,700 7,500 6.7 4900 18,490 23 18,500
96 of Data Points 63% 63% 63% 0 20% 2 TIZC I
14
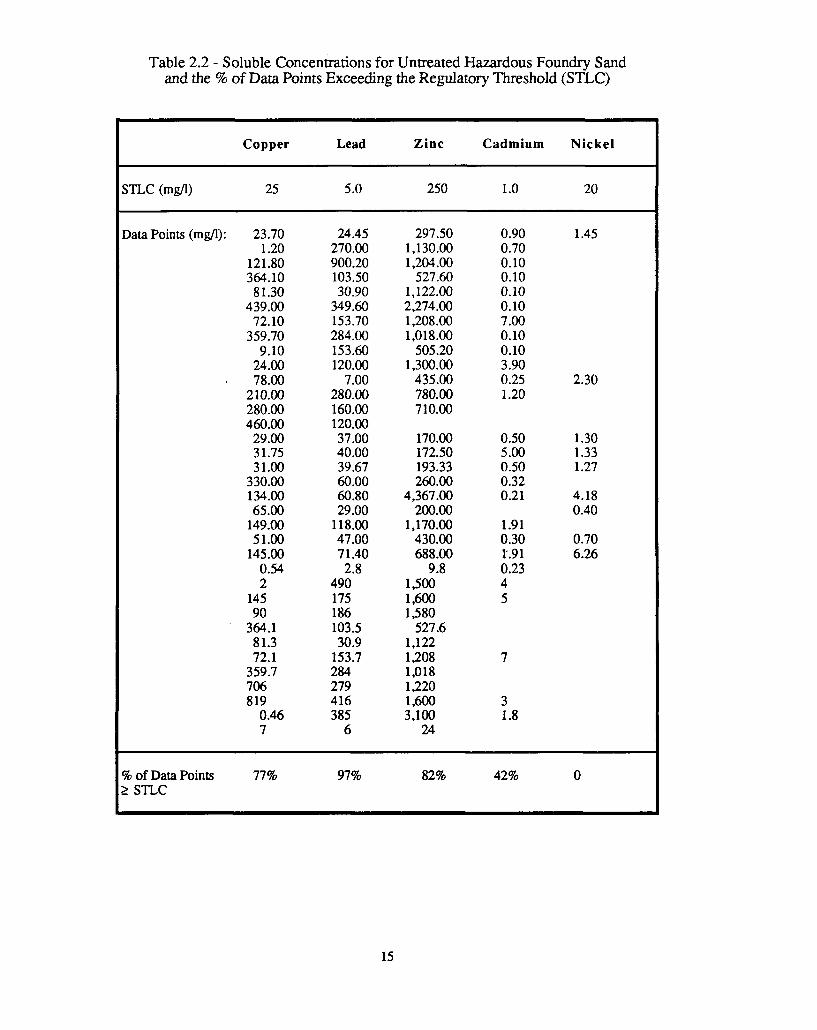
Table 2.2 - Soluble Concentrations for Untreated Hazardous Foundry Sand and the % of Data Points Exceeding the Regulatory Threshold (STLC)
Copper Lead Zinc Cadmium Nickel
;TLC (md) 25 5.0 250 1 .o 20
lata Points (md): 23.70 1.20
121.80 364.10 8 1.30
439.00 72.10
359.70 9.10
24.00 9 78.00
210.00 280.00 460.00 29.00 31.75 31.00
330.00 134.00 65.00
149.00 51.00
145.00 0.54 2
145 90
364.1 81.3 72.1
359.7 706 819
0.46 7
24.45 270.00 900.20 103.50 30.90
349.60 153.70 284.00 153.60 120.00
7.00 280.00 160.00 120.00 37 .OO 40.00 39.67 60.00 60.80 29 .OO
118.00 47.00 7 1.40 2.8
490 175 186 103.5 30.9
153.7 284 279 416 385
6
297.50 1,130.00 1,204 .00
527.60 1,122.00 2,274.00 1,208.00 1,018.00
505.20 1,300.00
435.00 780.00 7 10.00
170.00 172.50 193.33 260.00
4,367.00 200.00
1,170.00 430.00 688.00
9.8 1,500 1,600 1,580
1,122 1,208 1,018 1220 1,600 3,100
24
527.6
0.90 0.70 0.10 0.10 0.10 0.10 7.00 0.10 0.10 3.90 0.25 1.20
0.50 5 .00 0.50 0.32 0.21
1.91 0.30 1.91 0.23 4 5
7
3 1.8
1.45
2.30
1.30 1.33 1.27
4.18 0.40
0.70 6.26
Ib of Data Points 77% 97% 82% 42% 0 E STLC
15
Table 2.2 contains values of the soluble or extractable concentrations, as determined using the
Waste Extraction Test procedure specified in CCR 566700. The raw data for this table
include data from the DHS grant-funded waste reduction demonstration project, data from DHS
sampling and data reported by foundries in the foundry survey (see Appendix for raw data). In
instances where the data reported in the survey were the same as those reported in the
demonstration project, the data were used only once. As depicted in Table 2.1,77% of the data
points exceed the STLC for copper, 97% of the data points exceed the STLC for lead, 82% exceed
the STLC for zinc, 42% exceed the STLC for cadmium and none of the data points exceed the
STLC for nickel.
As shown in Tables 2.1 and 2.2, most of the data points of untreated brass foundry sand exceed
the STLC, and many exceed the TI'LC, for copper, lead and zinc. Some of the data points also
exceed the STLC for cadmium and the TLZC for nickel. Hence, assuming the data reported in
Tables 2.1 and 2.2 are typical, staff concludes that 97% of the time waste foundry sand will be
hazardous because its WE)-soluble lead concentration exceeds the STLC for lead, and much of the
time that waste will also be hazardous because it exceeds the STLC for copper, zinc and cadmium
and the lTLC for nickel.
Special Waste
Under $66740 in Title 22, CCR, foundry sand may qualify as a special waste if it is not considered
a RCRA waste under the federal regulations. California's special waste classification, obtained
through written approval from the Waste Evaluation Unit of the Department, does not relieve the
generator or transporter of any of the generator or transporter requirements. Although special
wastes remain hazardous wastes, they may be disposed to a land disposal facility that is not
permitted as a hazardous waste disposal facility if the Regional Water Quality Control Board issues
waste discharge requirements to the nonhazardous disposal facility allowing disposal of the special
16
waste, and the facility has a variance issued by the Department allowing disposal of the special
waste. In addition generators of special wastes may petition for an exemption to the treatment
standard if the generator can demonstrate that no economically or technologically feasible
alternatives exist to meet the treatment standard. This five year exemption is renewable.
17

DEMONSTRATED TREATMENT TECHNOLOGIES
Hazardous waste foundry sand can be managed in a number of different ways. Because a large
pomon of foundry sand is reused in the molding process and the metals that can be recovered from
the sand contain a high percentage of valuable copper, the opportunities for recycling and
reclamation are extensive. A chemical treatment process to extract metals from the sand is
undergoing study, but is not currently available on a commercial basis (Warren 1988).
For the portion of the waste stream that cannot be recycled, chemical stabilization has been
demonstrated to be an effective technology for reducing the degree of hazard associated with these
wastes. Most chemical stabilization used for treating hazardous waste employs cement or
pozzolanic materials as stabilizing agents. These methods, described in detail in this chapter, have
been widely used. Some related technologies, encapsulation and thermoplastic binding, are not as
widely used and we have no data demonstrating these methods on hazardous waste foundry sand.
Vitrification, or glassification, has been demonstrated on sludges containing metals (FOO6 waste).
In this process the waste is incorporated into molten glass and cooled. Thermoplastic binders are
organic polymers that are fluid at high temperatures but behave as solids at ordinary temperatures.
When used for stabilization, thermoplastics bind waste components into a solidified, impermeable
matrix.
RECYCLING AND RECLAMATION
The foundry industry recycles much of its waste sand, reusing the molding sand and remelting or
recycling metal. The type of treatment foundries may apply to the sand and metal before reuse
varies from complex approaches, such as thermal reclamation, to simple steps, such as screen
separation.
18
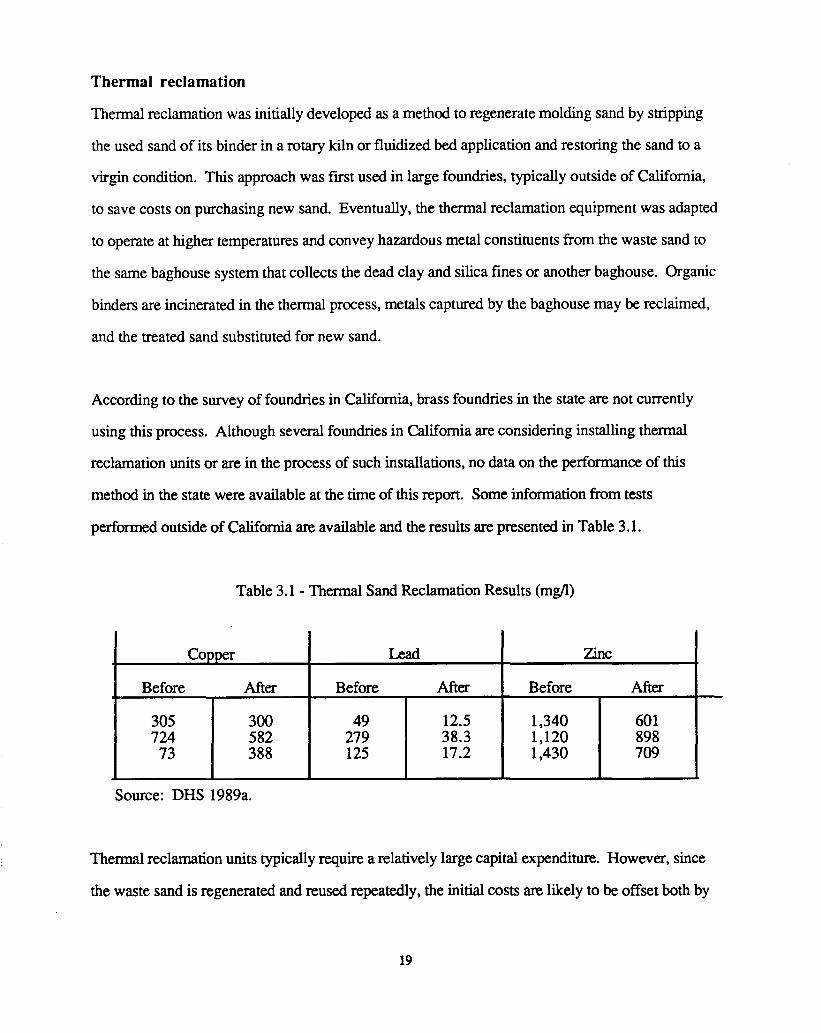
Thermal reclamation
Thermal reclamation was initially developed as a method to regenerate molding sand by stripping
the used sand of its binder in a rotary kiln or fluidized bed application and restoring the sand to a
virgin condition. This approach was first used in large foundries, typically outside of Califomia,
to save costs on purchasing new sand. Eventually, the thermal reclamation equipment was adapted
to operate at higher temperatures and convey hazardous metal constituents from the waste sand to
the same baghouse system that collects the dead clay and silica fines or another baghouse. Organic
binders are incinerated in the thermal process, metals captured by the baghouse may be reclaimed,
and the treated sand substituted for new sand.
Copper Lead
Before After Before After
305 300 49 12.5 724 582 279 38.3 73 388 125 17.2
According to the survey of foundries in Califomia, brass foundries in the state are not currently
using this process. Although several foundries in Califomia are considering installing thermal
reclamation units or are in the process of such installations, no data on the performance of this
method in the state were available at the time of this report. Some information from tests
perfmed outside of California are available and the results are presented in Table 3.1.
Zinc
Before After
1,340 601 1,120 898 1,430 709
Table 3.1 - Thermal Sand Reclamation Results ( m d )
Source: DHS 1989a.
Thermal reclamation units typically require a relatively large capital expenditure. However, since
the waste sand is regenerated and reused repeatedly, the initial costs are likely to be offset both by
19

the cost savings of not having to treat the sand and dispose of the treated sand in a hazardous or
nonhazardous waste landfill, and by the cost savings of not having to purchase new raw sand.
Based on these cost savings, the payback time for a thermal reclamation system can be relatively
short. A drawback of this option is the stringent air pollution controls that will be imposed. In
some areas of the state, air pollution control permits to operate thermal reclamation units may be
difficult to obtain.
Screening and separation
Most brass foundries currently screen used sand before reusing the sand, some employing several
different screen types and vibrating mechanisms to break down large masses of sand mixed with
metal chips. Coarse screens are used to remove large chunks of metal and core butts. The larger
metal pieces collected in the screens are usually remelted in the furnace. Increasingly finer screens
remove additional metal particles and help to classify the sand before it is molded. Some foundries
remelt these smaller metal particles, other foundries sell this portion to metal reclaimers. The metal
recovered during the screening process is often mixed with coarser sand components or has sand
adhering to it, so remelting these pieces in the furnace generates large amounts of slag, especially
when the smaller particles are remelted.
After separating the reusable metal from the sand, the used sand is often mixed with a portion of
new sand to produce adequate molding properties and new binder material is often added to
preserve appropriate binding characteristics. To accommodate this new sand volume, some of the
used sand must be removed. When tested, this waste sand often contains high levels of copper,
lead and zinc, classifying it as hazardous waste. In some foundries when the new sand is added, it
is screened with the used sand to help blend and classify the entire sand volume and
simultaneously remove metals and other large sand pieces.
20
Some primary smelters will accept waste foundry sand as an adjunct to the ore normally processed.
One smelter uses the sand as a flux replacement in the smelting process; others accept the sand to
reclaim the copper. In addition some foundries have explored using foundry sand in road beds,
asphalt and cement manufacture, making certain that these options are not considered “use in a
manner constituting disposal.”
CHEMICAL STABILIZATION
For the waste foundry sand that cannot be reclaimed in the sand system, chemical stabilization has
been demonstrated as a treatment option for metal-containing solid wastes in general and for
foundry sand in particular. Chemical stabilization, often referred to as solidification or fixation,
encompasses treatment processes that chemically reduce the mobility of metal constituents in a
waste thereby minimizing the tendency for metals to leach from the treated sand. This technology
is applicable to wastes containing heavy metals with a high level of suspended solids, low total
organic content and low oil and grease content. Stabilizing agents, generally lime- or cement-
based, form a lattice structure and/or chemical bonds that bind the metal constituents to the solid
matrix. This process reduces the leachability of the metals when the treated sand comes in contact
with water or a mildly acidic solution, such as that likely to be found in a land disposal facility.
The stabilization process may also employ additives, such as soluble silicates, that accelerate the
curing rates or enhance the stabilizing properties of the treated sand.
A number of physical and chemical characteristics can affect the performance of chemical
stabilization. For example, the particle size of the waste will have an impact on the amount of free
water available for the stabilization reaction. The viscosity of the mixture of waste, water and
binder, also affected by particle size and shape, can be used as an indicator of free water and the
likely effectiveness of the reaction. Particle size also determines the amount of surface area
available for the stabilization reaction. Large particles will not have enough surface area available
21
to bind well and must be ground into smaller particles before being treated by chemical
Stabilization.
The presence of organic compounds and certain inorganic compounds, namely sulfate and
chloride, in the waste interferes with the chemical stabilization reactions and bond formation.
These compounds inhibit curing of the stabilized material. In particular, sulfate and chloride may
reduce the dimensional stability of the cured matrix resulting in reduced resistance to leaching and
weakened structural strength. Also, high oil and grease content, over 3% by weight, will coat the
waste particles and inhibit the bond between the stabilizing agent and the waste particles. This
weakened bond may decrease the treated waste's resistance to leaching and weaken its structural
strength.
Although there are many variations, two basic forms of stabilization, cement-based and lime-
based, are most often used. The cement-based stabilization process combines portland cement and
water to form calcium hydroxide and a calcium silicate hydrate called tobermorite gel, the main
cementing component of concrete. For most effective stabilization the waste must be completely
covered by this gel filling any void spaces in the cemendwaste mixture. As the mixture sets and
cures, the compounds in the portland cement complete the hydration reactions and the waste
constituents are incorporated into the interstices of the cement matrix. The high pH of the cement
mixture helps to keep metals in the form of insoluble hydroxides and carbonate salts. The lime-
based process uses pozzolan, a finely divided, noncrystalline siIica, such as fly ash or cement kiln
dust. When combined with lime and water, the pozzolan becomes cementitious and incorporates
the waste into the stabilized structure. This process also results in a highly alkaline mixture.
In most stabilization applications the process consists of first mixing the waste, stabilizing agent
and additives, and then curing the mixture for seven to 28 days. Frequently, commercial concrete
mixing and handling equipment, including weighing conveyors, metering cement hoppers and
22
cement mixers, can be applied to stabilization. In addition most stabilizing agents are readily
available commercially either in a generic form or in spcially blended formulations. The selection
of stabilizing agents and additives and their amounts depends upon the chemical and physical
characteristics of the waste. To select the best stabilizing procedure for a particular waste stream,
the waste should be tested with a variety of materials to determine the best combination of agents
and additives. The mixing and curing conditions should also be carefully controlled to ensure
optimum stabilization.
For example, to determine the appropriate weight ratios of waste to stabilizing agent, water and
other additives, different mix ratios should be tested for strength and leaching characteristics of the
stabilized material. If too little water is added, mixing will be difficult and the hydration reactions
needed to bind the waste to the stabilizing mamx may not be completed. Too much water will
result in low compressive strength of the stabilized material. The structural strength of the material
is an important measurement because it can be used as an indicator of chemical stabilization.
Unconfined compressive strength (UCS) above 50 pounds per square inch (psia) is characteristic
of chemically stabilized waste (40 CFR 264.3 14).
The mixing and curing parameters are also important to developing an effective stabilizing
procedure. If the waste and stabilizing agent are not mixed well, some waste particles will not
chemically bond to the stabilizing agent and will not be held within the stabilized lattice structure.
However, overmixing may inhibit gel formation. Testing the results of different mixing
procedures will reveal the optimum conditions for a particular waste stream. Similarly, testing
various curing times and temperature and humidity conditions will help determine the appropriate
curing methods for the waste stream and stabilizing agent. High temperature and low humidity
generally increase the curing rate by increasing the rate of water evaporation. However, if the
temperature is too high, the rate of evaporation will be too rapid and inadequate water will be
available to complete the hydration reaction.
23
Staff has collected some data on chemical stabilization of hazardous waste foundry sand. This data
is presented and discussed in the fifth chapter entitled “Treatment Standard.”
24

BEST DEMONSTRATED AVAILABLE TECHNOLOGY (BDAT)
In selecting the best, demonstrated, available technology (BDAT) for a treatment standard, staff
considers a number of factors including the effectiveness, applicability and availability of different
treatment technologies. The “best” technology treats the waste most effectively. “Demonstrated”
technologies have been employed in full-scale operations. “Available” technologies are ones in
which the equipment to perform the treatment are commercially available and/or commercial
treatment capacity is sufficient to treat the expected amount of waste to be generated. When
considering treatment technologies, staff must evaluate the applicability of waste reduction first,
recycling second and treatment last.
BDAT SELECTION
Encapsulation and viaification have been demonstrated on some inorganic waste streams, but they
have not been demonstrated on hazardous waste foundry sand and they are not yet available.
Hence, they are eliminated from consideration as BDAT. Similarly, although thermal treatment has
been demonstrated on foundry sand and looks promising as a method to reduce the amount of
waste sand generated, its successful demonstration and subsequent available data on hazardous
waste foundry sand generated by brass foundries have been limited. Although the equipment is
commercially available for onsite treatment, the technology is not yet commercially available for
offsite treatment in Califomia so this technology is also eliminated from consideration as BDAT.
Finally, because the chemical acid leach method is not commercially available and has not been
demonstrated in a full-scale operation, it was also eliminated from BDAT consideration (Warren
1988).
The technologies considered for the waste foundry sand treatment standard include methods for
recycling and reclamation and chemical stabilization.
25
According to the results of the foundry survey, many, if not most, foundries practice some form of
sand and metal reclamation as a standard foundry practice, demonstrating that sand and metal
recycling options are feasible and appropriate for hazardous waste foundry sand. These practices
reduce the hazardous fraction of the sand and may render subsequent treatment of the
unrecoverable portion more effective. Staff recognizes that waste reduction options may not apply
to the entire hazardous foundry sand waste stream and there may be some pomon of the waste
stream that will require treatment prior to land disposal under the land disposal restrictions. Hence,
staff has identified a two phase BDAT in which sand and metal recycling are followed by chemical
stabilization for the remaining unrecoverable waste fraction. In some cases particularly aggressive
recycling and reclamation efforts, either on the site of generation or by a commercial metal recovery
service, may eliminate the unrecoverable fraction and preclude chemical stabilization.
APPLICATION TO FOUNDRY S A N D
The foundries responding to the sulvey indicate that an overwhelming majority already undertake
some form of sand reclamation and metal recovery. Some sand systems use binders that make
sand reclamation prohibitively difficult, so foundries using these systems may have to rely on
metal recycling only to render the waste more amenable to treatment using chemical stabilization.
Chemical stabilization is widely recognized as an appropriate technology for solid inorganic waste
streams and waste foundry sand is particularly applicable because it typically does not contain large
amounts of the constituents, such as chlorides, acids or oil and grease, known to inhibit
stabilization. Chemical stabilization, using lime, pozzalime and Portland Cement and other
adjuncts such as silicates, has been demonstrated on hazardous waste brass foundry sand in
Califomia. In a number of cases the outcome of these demonstrations have been made available to
staff for developing the treatment standard for foundry sand. In addition an offsite commercial
treatment facility and a transportable treatment unit both perform chemical stabilization and other
offsite commercial facilities are planning to add chemical stabilization capacity. Finally, generic
26
formulations of the stabilizing agents and simple mixing equipment also contribute to making the
stabilization technology widely available.
A chemical stabilization process using pozzalime or Portland Cement with potassium silicate,
known as the Trezek process, has been demonstrated on a number of solid hazardous wastes
containing metals, including brass foundry sand. Trezek has theorized that this process forms
relatively insoluble metal metasilicates within the stabilized matrix, among other reactions (Trezek,
1987). The Appendix contains a summary of the results of this process on foundry sand.
A stabilization technique using calcium oxide (lime) and sodium silicate, known as the Fumess
process, has been demonstrated on hazardous waste foundry sand in two demonstration projects
DHS funded for the CCMA. Because the Furness process and the Trezek process both use silicate
compounds with various cementing agents, the stabilization reaction is thought to be similar. In
the first demonstration project of the Furness process the foundry sand treatment took place on the
site of two brass foundries using a transportable treatment unit. Other foundry owners and
operators were invited to visit the demonstration foundries and observe the sand treatment. The
transportable treatment unit is currently in long tenn use at a foundry in Southem Califomia. In the
second demonstration project seven brass foundries volunteered to apply the treatment process on
waste foundry sand. The foundries performed the chemical stabilization onsite using small mullers
or mixers already onsite and treatment systems that the foundries purchased . The stabilizing
agents were specially formulated for the demonstration projects, but generic substitutes are
available. A summary of the results from the demonstration projects is included in the Appendix.
The ratios of waste to the stabilizing agents and water in the Furness process vary according to the
characteristics of the sand to be treated. These ratios are usually derived empirically and may range
from 10% to 30%. In a typical procedure 15 lbs of powdered calcium oxide are mixed with 100
lbs of waste sand and 15 lbs of water. When the powdered calcium oxide is dissolved, after about
27
2 minutes of mixing, 15 lbs of sodium silicate is added and mixing continues until the mixture
begins to thicken in about 45 seconds. The mixture is then poured into ingot molds and allowed to
cure 24 to 72 hours. In these projects the treated sand was used as backing in ingot molds. After
facing the backing with a thin layer of sand an inch or two thick, the excess metal remaining in the
ladles was poured into these molds to make ingots. Reusing the treated sand in this manner in the
demonstration project was considered onsite recycling and did not require a treatment permit
(CCMA 1989).
As depicted in the Appendix, the results of chemical stabilization on waste foundry sand vary
widely. In most cases the concentrations of lead, zinc cadmium and nickel are significantly
reduced after treatment, but the process’ effectiveness on the copper contained in the sand is
inconclusive. These results for stabilization of copper have been observed in applications of the
technology on other waste streams containing copper and is not clearly understood. However,
efforts to recover metal from the sand stream by using finer screens in the screening steps seemed
to improve the stabilization results. In addition, avoiding mixing the sand with metal dust by
improving and changing the foundry ducting and baghouse systems also helped improve the
stabilization results for copper (CCMA 1989).
Although the Fumess process and Trezek process are similar, staff feels the slight differences in
stabilizing agents and procedures may have an impact on the results of the stabilization. In order to
evaluate the differences in these processes, staff calculated the percentage reduction achieved with
the processes (see the Appendix for these calculations). Results are shown in Table 4.1.
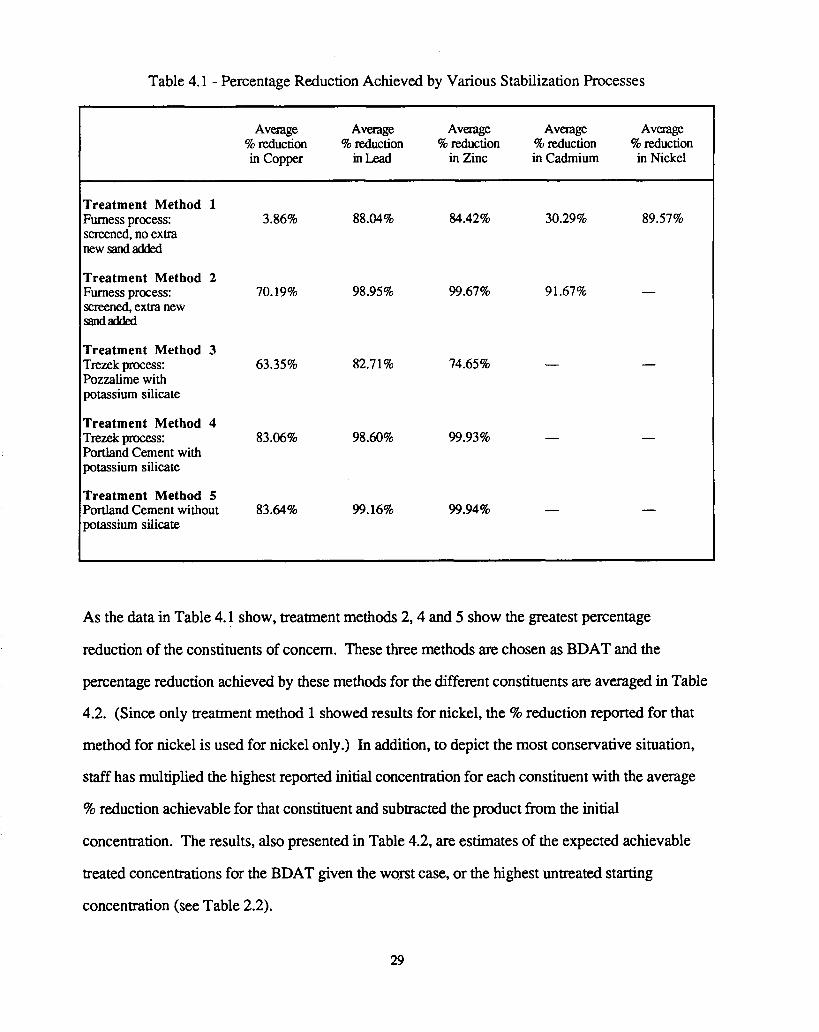
Table 4.1 - Percentage Reduction Achieved by Various Stabilization Processes
Average Average Average Avenge Average % reduction % reduction % reduction % reduction % reduction in Copper inLead in Zinc in Cadmium in Nickel
Treatment Method 1 Furness process: 3.86% 88.04% 84.42% 30.29% 89.57% screened, no extra newsandadded
Treatment Method 2
screened, extra new sandadded
Furness process: 70.19% 98.95% 99.67% 91.67% -
Treatment Method 3 Trezek process: 63.35% 82.7 1 % Pozzalime with potassium silicate
74.65%
Treatment Method 4
Portland Cement with potassium silicate
Trezek process: 83.06% 98.60% 99.93%
Treatment Method 5 Portland Cement without 83.64% 99.16% 99.94% - - potassium silicate
As the data in Table 4.1 show, treatment methods 2 ,4 and 5 show the greatest percentage
reduction of the constituents of concern. These three methods are chosen as BDAT and the
percentage reduction achieved by these methods for the different constituents are averaged in Table
4.2. (Since only treatment method 1 showed results for nickel, the % reduction reported for that
method for nickel is used for nickel only.) In addition, to depict the most conservative situation,
staff has multiplied the highest reported initial concentration for each constituent with the average
% reduction achievable for that constituent and subtracted the product from the initial
concentration. The results, also presented in Table 4.2, are estimates of the expected achievable
treated concentrations for the BDAT given the worst case, or the highest untreated starting
concentration (see Table 2.2).
29
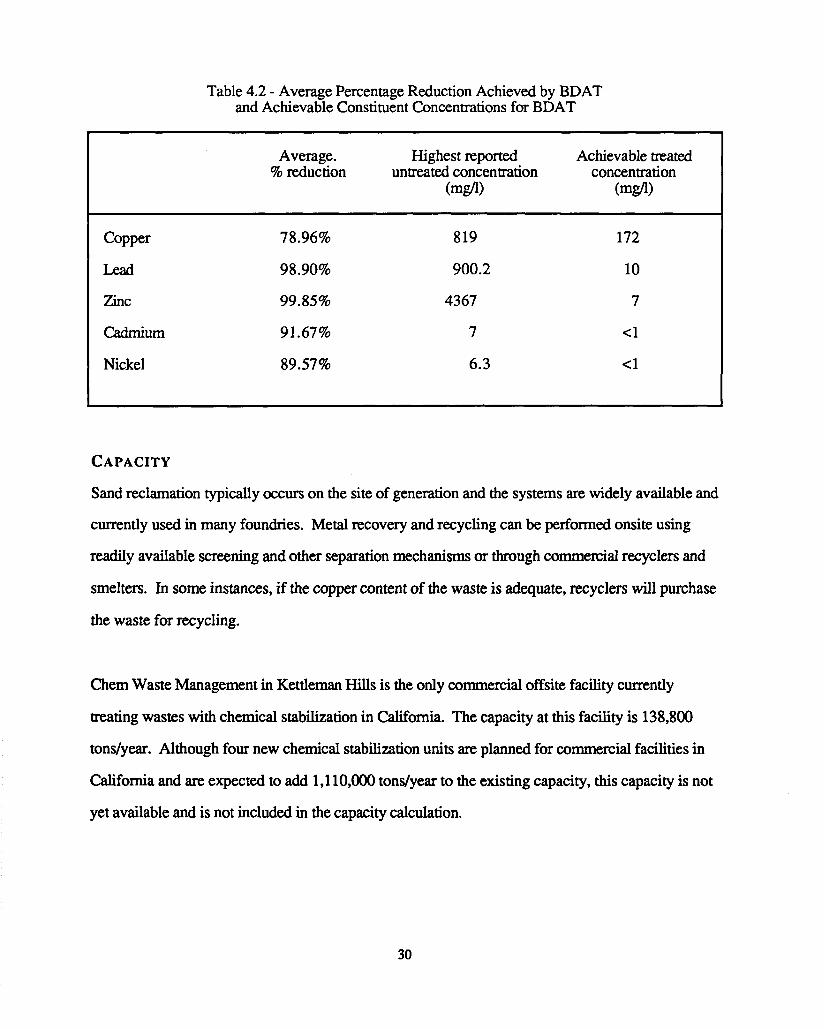
Table 4.2 - Average Percentage Reduction Achieved by BDAT and Achievable Constituent Concentrations for BDAT
Average. Highest reported Achievable mated % reduction untreated concentration concentration
(mgfl) (mgfl)
Copper 78.96% 8 19
Lead 98.90% 900.2
Zinc 99.85% 4367
cadmium 91.67% 7
Nickel 89.57% 6.3
172
10
7
<1
<1
CAPACITY
Sand reclamation typically occurs on the site of generation and the systems are widely available and
currently used in many foundries. Metal recovery and recycling can be perfonned onsite using
readily available screening and other separation mechanisms or through commercial recyclers and
smelters. In some instances, if the copper content of the waste is adequate, recyclers will purchase
the waste for recycling.
Chem Waste Management in Kettleman Hills is the only commercial offsite facility currently
treating wastes with chemical stabilization in Califomia. The capacity at this facility is 138,800
tons/year. Although four new chemical stabilization units are planned for commercial facilities in
California and are expected to add 1,110,OOO tondyear to the existing capacity, this capacity is not
yet available and is not included in the capacity calculation.
30
During a recent demonstration project, a mobile treatment unit using the Trezek process operated at
a feed rate of 65 tonshour stabilizing soil contaminated with metals. If this unit operated eight
hours each day for five days every week of the year, its annual capacity would total 135,200
tons/year. Since foundry sand is of a soil-like consistency, it is reasonable to assume the Trezek
process mobile unit could stabilize 135,200 tondyear of foundry sand. However, this unit has not
been operating long enough to generate reliable data on its typical yearly capacity, so these capacity
estimates are not included in the total capacity calculation. Because the Furness process mobile
treatment unit is committed to remain in long term use at a foundry in Southem Califomia, its
capacity is also not included in the calculation of available capacity.
In addition the capacity calculation does not include the onsite treatment capacity existing within
those foundries participating in the demonstrations of the Fumess process and those inspired by
the process to implement treatment. For example, the treatment system installed at one foundry
participating in the demonstration project was constructed to operate at 2.3 tonshour (4,800
tondyear), but is capable of operating at 16 tonshour (33,280 tons/year ) with minor modifications
(CCMA, 1986). Because onsite treatment capacity is available only to the owner foundry, this
capacity is not included in the calculation of available capacity.
Based on the chemical stabilization capacity available at Chem Waste Management at Kettleman
Hills the total capacity for chemical stabilization in California is 138,800 tons/year. This capacity
is adequate to treat the entire volume of the estimated 18,200 tons of hazardous waste foundry
generated in California in a given year. However, since this capacity is currently available at a
single commercial facility and additional commercial capacity is planned, staff proposes this
regulation become effective six months from the date it is adopted to allow time for additional
offsite capacity to become available and to allow generators to establish contracts with the facilities.
31

TREATMENT STANDARD
The treatment standard for hazardous waste foundry sand is based on sand reclamation and metal
recovery used in conjunction with chemical stabilization applied to the unrecoverable waste
fraction. Generators are required to meet the treatment standard before disposing of the waste to
land disposal. Wastes managed by methods other than land disposal are not subject to the
treatment standard.
A waste that meets its treatment standard may be disposed in a land disposal facility. If the
untreated waste meets the treatment standard before treatment, then it does not have to be further
treated prior to disposal. However, if a waste does not meet the treatment standard, it must be
treated to meet the standard before land disposal, but it can be treated using any treatment
technology-not necessarily the BDAT.
The BDAT for hazardous waste foundry sand, as described in the previous chapter, is chemical
stabilization, specifically the three best methods evaluated. The % reduction achievable by the
BDAT is the average of the three best methods. The previous chapter also reported that, based on
the highest reported starting concentrations for the five constituents of concern in hazardous waste
foundry sand, BDAT can theoretically achieve the concentrations depicted in Table 5.1.
32
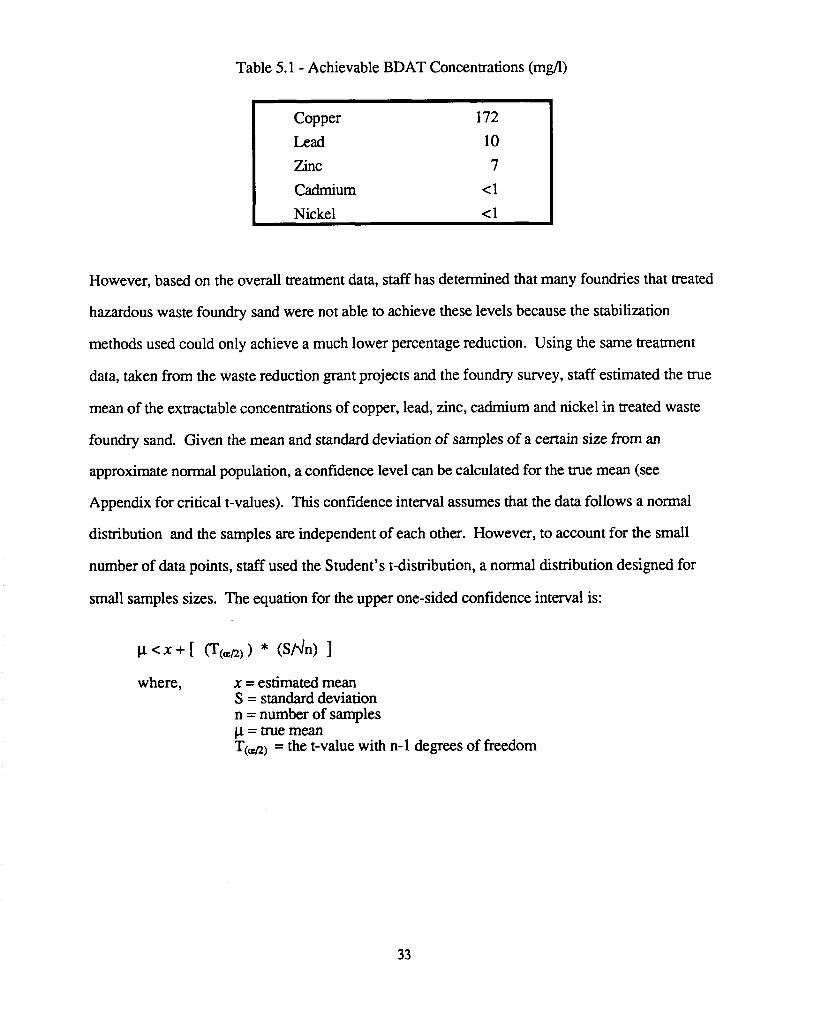
Table 5.1 - Achievable BDAT Concentrations (mg/l)
Copper 172 Lead 10 Zinc 7 Cadmium <1 Nickel <1
_I
Copper Lead Zinc Cadmium Nickel <1
_I I <1 7 1
172 10
However, based on the overall treatment data, staff has determined that many foundries that treated
hazardous waste foundry sand were not able to achieve these levels because the stabilization
methods used could only achieve a much lower percentage reduction. Using the same treatment
data, taken from the waste reduction grant projects and the foundry survey, staff estimated the true
mean of the extractable concentrations of copper, lead, zinc, cadmium and nickel in treated waste
foundry sand. Given the mean and standard deviation of samples of a certain size from an
approximate normal population, a confidence level can be calculated for the true mean (see
Appendix for critical t-values). This confidence interval assumes that the data follows a normal
distribution and the samples are independent of each other. However, to account for the small
number of data points, staff used the Student’s t-distribution, a normal distribution designed for
small samples sizes. The equation for the upper one-sided confidence interval is:
where, x = estimated mean S = standard deviation n = number of samples p=truemean *(,n, = the t-value with n-1 degrees of freedom
33
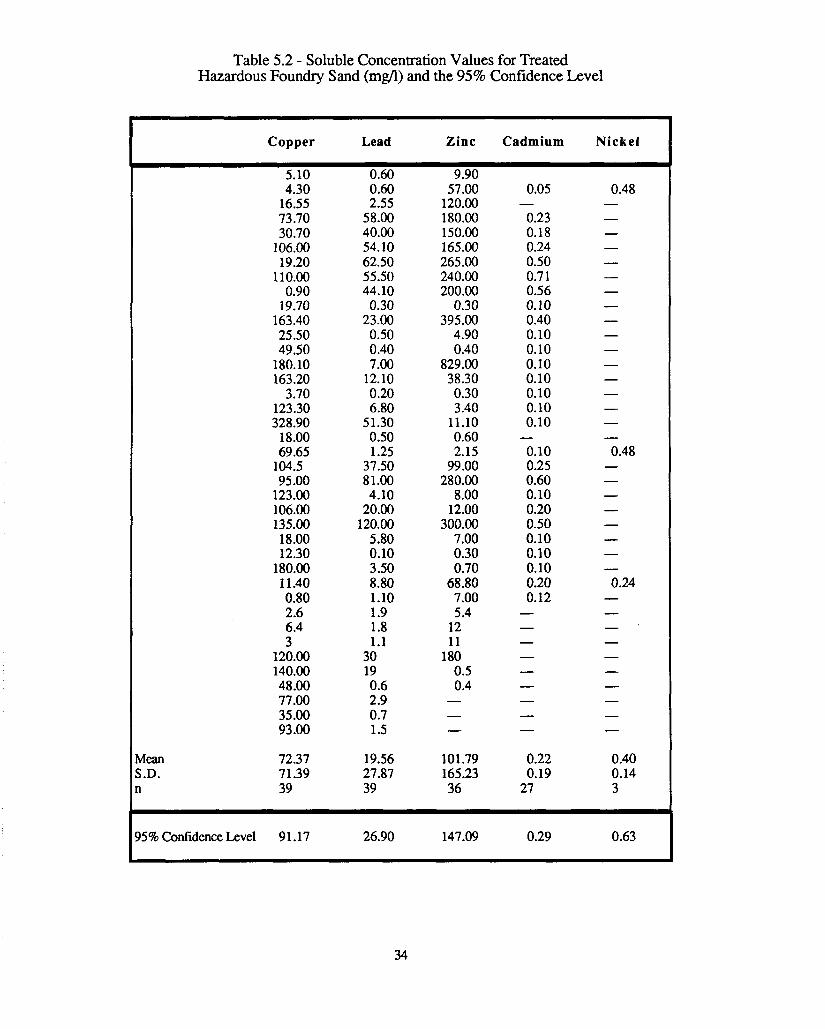
Table 5.2 - Soluble Concentration Values for Treated Hazardous Foundry Sand (m@) and the 95% Confidence Level
Copper Lead Zinc Cadmium Nickel
dean i.D.
.I
4.30 16.55 73.70 30.70
106.00 19.20
110.00 0.90
19.70 163.40 25.50 49.50
180.10 163.20
3.70 123.30 328.90
18 .OO 69.65
104.5 95.00
123.00 106.00 135.00 18 .OO 12.30
180.00 1 1.40 0.80 2.6 6.4 3
120.00 140.00 48.00 77.00 35 .OO 93 .OO
72.37 71.39 39
0.60 2.55
58.00 40.00 54.10 62.50 55.50 44.10 0.30
23.00 0.50 0.40 7.00
12.10 0.20 6.80
51.30 0.50 1.25
37.50 81.00 4.10
20.00 120.00
5.80 0.10 3.50 8.80 1.10 1.9 1.8 1.1
30 19 0.6 2.9 0.7 1.5
19.56 27.87 39
57.00 120.00 180.00 150.00 165.00 265.00 240.00 200.00
0.30 395.00
4.90 0.40
829.00 38.30 0.30 3.40
11.10 0.60 2.15
99.00 280.00
8.00 12.00
300.00 7.00 0.30 0.70
68.80 7.00 5.4
12 11
180 0.5 0.4 - - -
101.79 165.23 36
0.05
0.23 0.18 0.24 0.50 0.7 1 0.56 0.10 0.40 0.10 0.10 0.10 0.10 0.10 0.10 0.10
0.10 0.25 0.60 0.10 0.20 0.50 0.10 0.10 0.10 0.20 0.12
-
-
- - - - - - - - -
0.22 0.19
27
35% Confidence Level 9 1.17 26.90 147.09 0.29 0.63
34
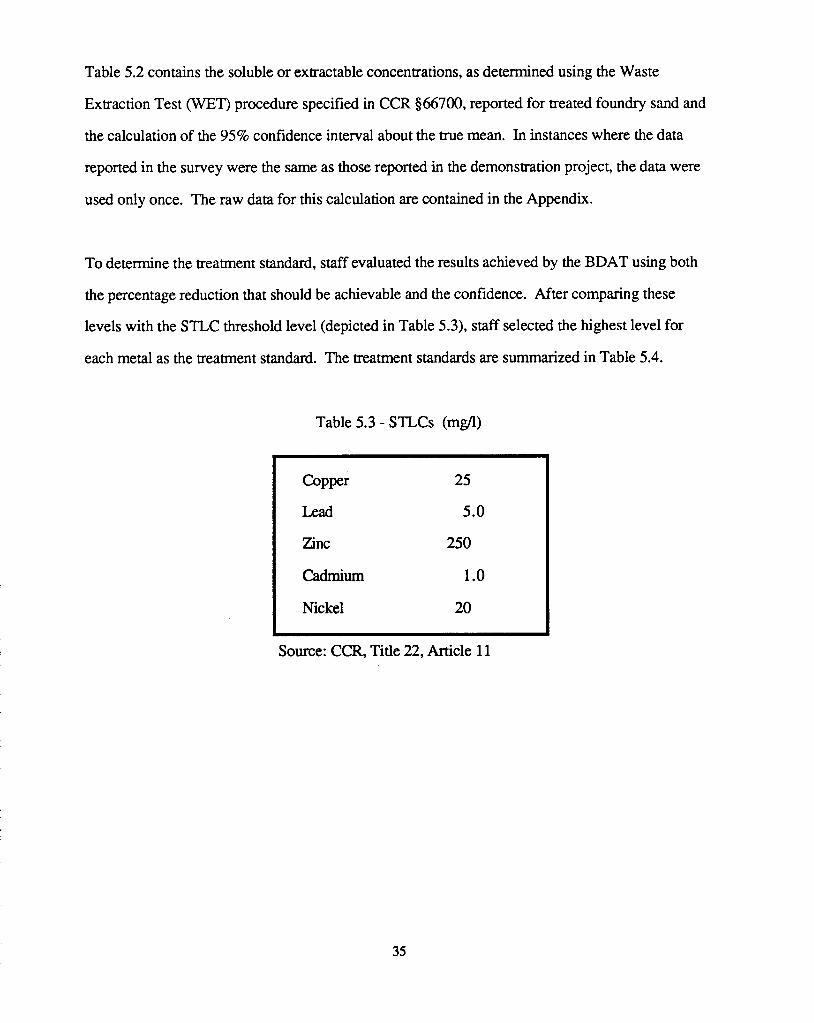
Table 5.2 contains the soluble or extractable concentrations, as determined using the Waste
Extraction Test (WET) procedure specified in CCR $66700, reported for treated foundry sand and
the calculation of the 95% confidence interval about the true mean. In instances where the data
reported in the survey were the same as those reported in the demonstration project, the data were
used only once. The raw data for this calculation are contained in the Appendix.
To determine the treatment standard, staff evaluated the results achieved by the BDAT using both
the percentage reduction that should be achievable and the confidence. After comparing these
levels with the STLC threshold level (depicted in Table 5.3), staff selected the highest level for
each metal as the treatment standard. The treatment standards are summarized in Table 5.4.
Table 5.3 - STLCs ( m a )
Copper 25
Lead 5.0
Zinc 250
cadmium 1 .o Nickel 20
Source: CCR, Title 22, Article 11
35
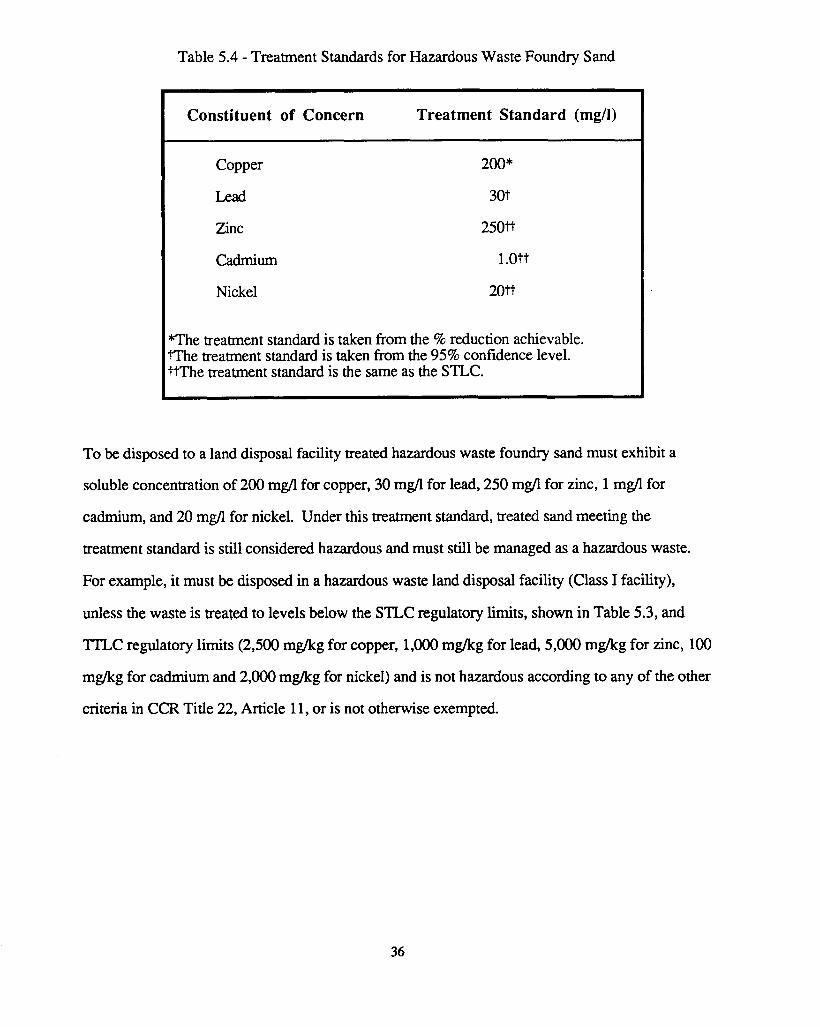
Table 5.4 - Treatment Standards for Hazardous Waste Foundry Sand
Constituent of Concern Treatment Standard (mg/l) I Copper
Lead
Zinc
Cadmium
Nickel
200*
30t
250W
l.Ott
2ol-t
*The treatment standard is taken from the % reduction achievable. tThe treatment standard is taken from the 95% confidence level. ttThe treatment standard is the same as the STLC.
To be disposed to a land disposal facility treated hazardous waste foundry sand must exhibit a
soluble concentration of 200 mg/l for copper, 30 mg/l for lead, 250 mg/l for zinc, 1 mg/l for
cadmium, and 20 mg/l for nickel. Under this treatment standard, treated sand meeting the
treatment standard is still considered hazardous and must still be managed as a hazardous waste.
For example, it must be disposed in a hazardous waste land disposal facility (Class I facility),
unless the waste is treated to levels below the STLC regulatory limits, shown in Table 5.3, and
"'LC regulatory limits (2,500 m a g for copper, 1,000 mg/kg for lead, 5,000 m a g for zinc, 100
mg/kg for cadmium and 2,000 mg/kg for nickel) and is not hazardous according to any of the other
criteria in CCR Title 22, Article 11, or is not otherwise exempted.
36

COMPLIANCE WITH THE TREATMENT STANDARD
If a generator elects to dispose of its waste to land, it is the generator’s responsibility to ensure that
the waste meets the treatment standard prior to disposal.
COMPLIANCE DETERMINATION
To determine if a waste meets the treatment standard, representative samples of the waste must be
tested by a certified hazardous waste testing laboratory using the California Waste Extraction Test
(WET) procedure as described in CCR $66700. Representative samples are defined as exhibiting
average properties of the whole waste (EPA 1986). At least three random samples must be taken
and the analytical results for each of the samples may be averaged or the samples composited to
determine if the waste meets the treatment standard. If the composite or average of the resulting
soluble concentrations is less than the treatment standard, the waste meets the treatment standard
and may be disposed to land.
If a sample of hazardous waste foundry sand contains hazardous concentrations of contaminants
other than the five metals included in this proposed treatment standard, the waste will also be
subject to appropriate generic treatment standards for solids with metals, solids with organics,
aqueous wastes with metals, and aqueous wastes with organics.
COMPLIANCE SCHEDULE
Although adequate capacity exists to treat the volume of waste the Department estimates will be
generated by foundries, this capacity is available at a single commercial facility only. One
commercially available transportable treatment unit is currently available to stabilize this waste
stream and may provide additional capacity, however, this unit has not been operating a sufficient
length of time to establish its operating capabilities and thereby estimate its capacity. Additional
capacity at other commercial facilities is planned and additional transportable treatment units may
37
become available. Until this time, however, the single facility currently operating may be flooded
with requests. To provide an opportunity for generators to establish contracts for offsite treatment
and disposal, the proposed effective date for this treatment standard is six months from the date the
treatment standard is adopted. Until the effective date, hazardous waste foundry sand may be
disposed to hazardous waste land disposal without meeting the treatment standard. In the
intervening time, the existing transportable treatment unit may be able to establish a track record of
available capacity and additional commercial capacity, both futed and mobile, may be constructed.
38
IMPACTS OF THE TREATMENT STANDARD
Treatment standards are developed to minimize the hazardous characteristics of hazardous waste
destined for land disposal, making the waste more suitable for land disposal and reducing the
likelihood that hazardous constituents will bioaccumulate or migrate into air, land or water.
Impacts in addition to the planned impacts of the treatment standard are discussed in this chapter.
FISCAL IMPACTS
The fiscal impact associated with the treatment standard is primarily the change in the costs of
hazardous waste management that arise as a result of the proposed regulations. In the case of the
treatment standard for Hazardous waste foundry sand, this change is typically an increase in the
costs of hazardous waste management for foundries that elect to dispose of the waste to land
disposal facilities. Foundries that seek alternative means of managing the waste sand, such as
through waste reduction and recycling, may actually experience a decrease in waste management
costs when compared to the existing costs of land disposal.
To evaluate the incremental cost increase resulting from onsite treatment followed by offsite land
disposal of the treated residue, staff conducted a financial cost analysis, adjusting the engineering
capital and operating expenditures for tax considerations and the timing of the required treatment
expenditures. These costs are then compared with the cost of offsite treatment and disposal.
Methodology
To evaluate the onsite treatment costs, engineering costs associated with the treatment method were
converted to an after-tax basis for each year the treatment standard is in effect by calculating the
annual net cash flow needed to fund the expenditures. The annual net cash flow, or future
treatment cost, was calculated for each year by adjusting the cash outflow occurring from capital
and operating costs of treatment equipment by the cash inflow from depreciation of that equipment.
39
Depreciation, an expense already paid for in the initial equipment investment, serves as a source of
cash because it is deducted from the foundry revenue for tax purposes, but no cash is paid out.
Operation and maintenance expenses were also adjusted on the basis of the f m s ’ marginal tax
rate.
Since future treatment costs (annual net cash flows) vary from year to year, they are discounted
back to the present, the end of 1989, to incorporate the timing of expenditures and the time value of
money, or inflation, into the calculation. The resulting calculation, the net present value, is the
present year dollar cost of annual future expenditures for onsite treatment. As capital and operating
expenditures are not all made at the same time or in the same amounts, it is necessary to annualize
the net present value estimate. Annualization provides an estimate of the annual future equal-sized
payments that a foundry can expect to pay each year over the life of the treatment equipment. The
cost of capital is used to annualize the present value estimate. The annual payments are in future
dollars and are adjusted for the effects of inflation.
The treatment method considered in this analysis is onsite chemical stabilization, at an average cost
of $120/ton, including recycling the treated residue as in the demonstration projects which did not
require a hazardous waste treatment permit. This calculation assumes that after using chemical
stabilization the waste residue meets the proposed treatment standards but is still considered
hazardous and any subsequent land disposal that may take place after recycling must take place in a
hazardous waste land disposal facility at $105/ton (DHS 1989b). Furthermore, this analysis
assumes that adding the stabilizing agent during chemical stabilization increases the total waste
amount an average of 33% by weight. Onsite stabilization costs and binder to waste ratios are
included in the Appendix. Further assumptions used in this calculation of onsite treatment costs
are outlined in Table 7.1.
40
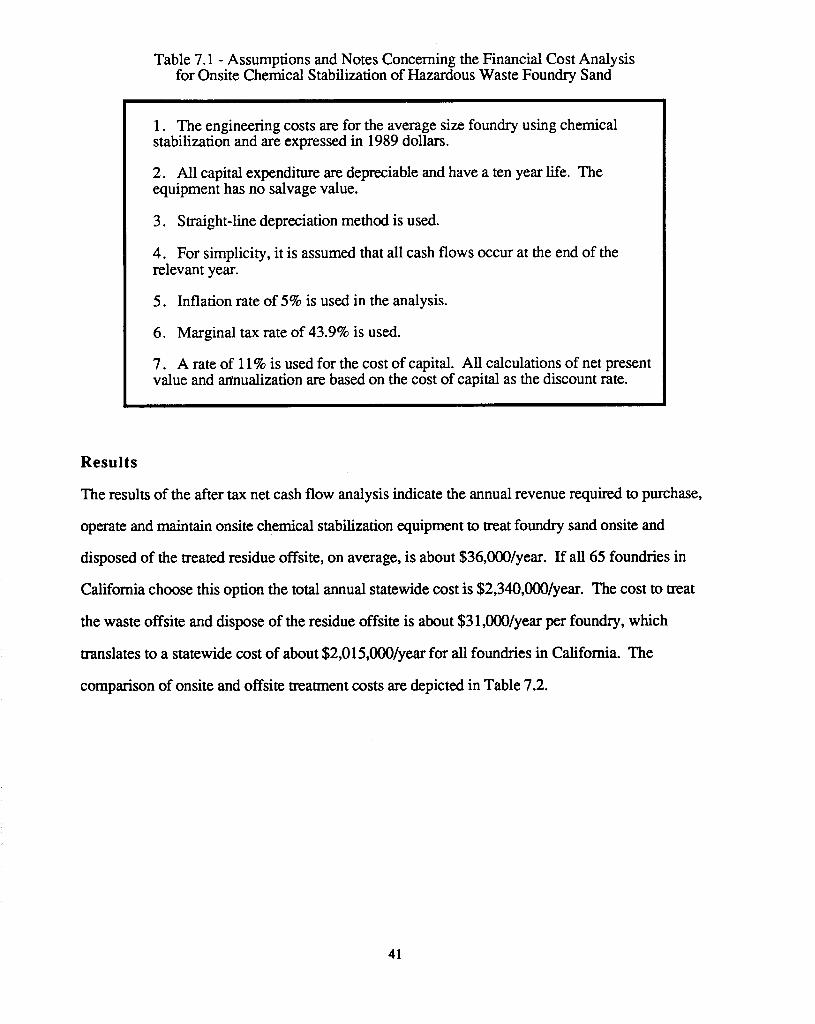
Table 7.1 - Assumptions and Notes Concerning the Financial Cost Analysis for Onsite Chemical Stabilization of Hazardous Waste Foundry Sand
1. The engineering costs are for the average size foundry using chemical stabilization and are expressed in 1989 dollars.
2. All capital expenditure are depreciable and have a ten year life. The equipment has no salvage value.
3. Straight-line depreciation method is used.
4. For simplicity, it is assumed that all cash flows occur at the end of the relevant year.
5 . Inflation rate of 5% is used in the analysis.
6. Marginal tax rate of 43.9% is used.
7. A rate of 1 1% is used for the cost of capital. All calculations of net present value and annualization are based on the cost of capital as the discount rate.
Results
The results of the after tax net cash flow analysis indicate the annual revenue required to purchase,
operate and maintain onsite chemical stabilization equipment to treat foundry sand onsite and
disposed of the treated residue offsite, on average, is about $36,OOO/year. If all 65 foundries in
California choose this option the total annual statewide cost is $2,340,000/year. The cost to treat
the waste offsite and dispose of the residue offsite is about $3 l,000/year per foundry, which
translates to a statewide cost of about $2,015,000/year for all foundries in California. The
comparison of onsite and offsite treatment costs are depicted in Table 7.2.
41
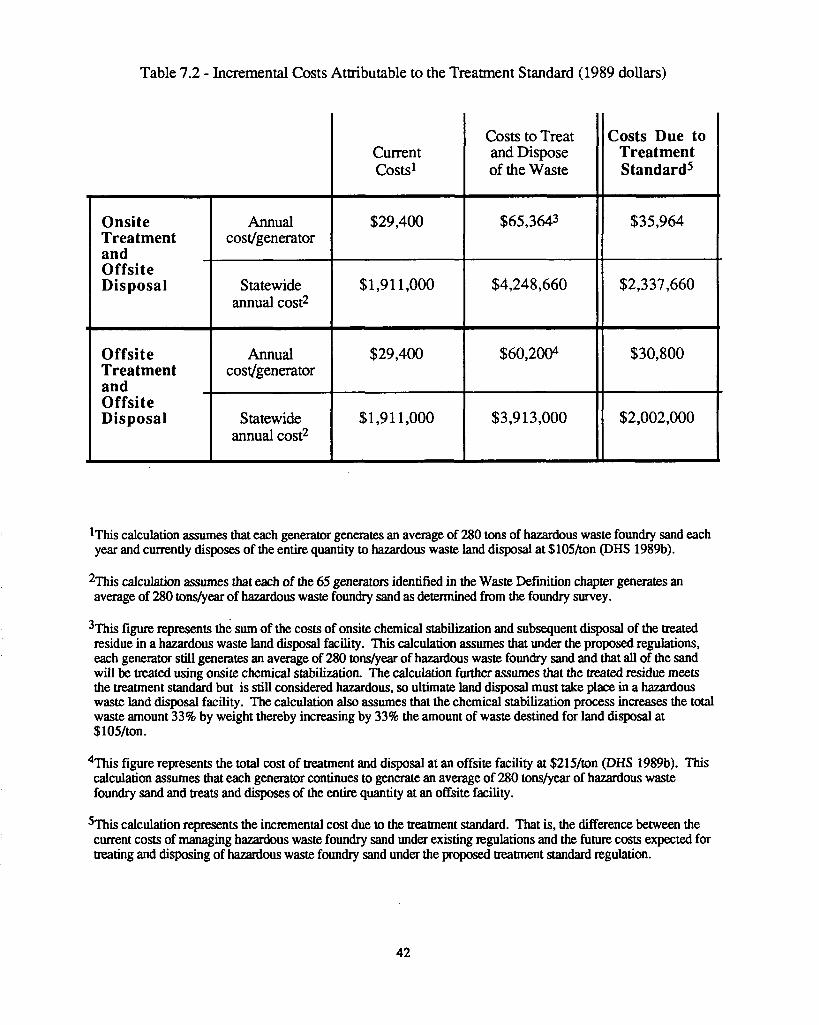
Table 7.2 - Incremental Costs Attributable to the Treatment Standard (1989 dollars)
Costs to Treat and Dispose of the Waste
cost/generator
Statewide annual cost2
Onsite Treatment and Offsite Disposal
Costs Due to Treatment Standard5
Offsite Treatment and Offsite Disposal
$65,3643
$4,248,660
Annual cost/generator
$35,964
$2,337,660
Statewide annual cost2
$60,2004
Current Costs'
$30,800
$29,400
$3,9 13,000
$1,911,000
$2,002,000
$29,400
$1,911,000
lThis calculation assumes that each generator generates an average of 280 tons of hazardous waste foundry sand each year and currently disposes of the entire quantity to hazardous waste land disposal at $105/ton @HS 1989b).
2This calculation assumes that each of the 65 generators identified in the Waste Definition chapter generates an average of 280 tons/year of hazardous waste foundry sand as determined from the foundry survey.
3This figure represents the sum of the costs of onsite chemical stabilization and subsequent dqosal of the mated residue in a hazardous waste land disposal facility. This calculation assumes that under the proposed regulations, each generator still generates an average of 280 tons/year of hazardous waste foundry sand and that all of the sand will be treated using onsite chemical stabilization. The calculation further assumes that the treated residue meets the treatment standard but is still considered hazardous, so ultimate land disposal must take place in a hazardous waste land disposal facility. The calculation also assumes that the chemical stabilization process increases the total waste amount 33% by weight thereby increasing by 33% the amount of waste destined for land disposal at $105/ton.
4This figure represents the total cost of treatment and disposal at an offsite facility at $215/ton @HS 1989b). This calculation assumes that each generator continues to generate an average of 280 tons/year of hazardous waste foundry sand and treats and disposes of the entire quantity at an offsite facility.
%"his calculation represents the incremental cost due to the treatment standard. That is, the difference between the current costs of managing hazardous waste foundry sand under existing regulations and the future costs expected for treating and disposing of hazardous waste foundry sand under the proposed treatment standard regulation.
42
These calculations assume that each of the 65 foundries identifed in the Waste Definition chapter
generates an average of 280 tons/year of hazardous waste foundry sand, as determined by the
foundry survey, and this entire volume is considered hazardous and currently disposed in a
hazardous waste land disposal facility at $105/ton @HS 1989b). These calculations also assume
that all 65 foundries do not currently treat the waste but will seek treatment and land disposal under
the proposed treatment standards regulations. Because it is unlikely that all of the waste foundry
sand generated by these foundries will be hazardous, that all the treated waste residue will be
hazardous, that no foundries are cmently treating the waste and that all foundries will choose land
disposal, thereby requiring treatment, these assumptions are consistently conservative and will
produce the greatest possible estimate of the fiscal impacts of the proposed regulations. If the
treatment renders some of the waste nonhazardous, if some generators are currently treating the
waste and if some generators employ waste management options other than land disposal for the
hazardous waste foundry sand, then the incremental costs impacts of the regulations are likely to be
lower than those estimated above.
For example, staff determined from the foundry survey that 31%, or twenty, of the 65 foundries in
California thought to generate this waste stream currently treat the waste onsite. Hence, although
some generators are already employing treatment options, in estimating the impacts of these
proposed regulations staff assumes that all of the 65 generators will be seeking treatment and
disposal options This assumption results in a most conservative estimate of the statewide cost
impacts.
In addition the Department estimates the actual impacts will be further reduced through recycling.
From the foundry survey staff estimates 81% of the foundries generating this waste stream reclaim
some portion of metal from the sand and 88% reuse or recycle some portion of the sand. The
Department expects these practices to continue and expand under the treatment standard thereby
43
reducing the amount of hazardous waste sand that will be treated and disposed to land disposal
facilities.
IMPACTS ON SMALL BUSINESSES
Fourteen foundries of the eighteen foundries responding to the foundry survey, or 78%, identified
themselves as small businesses according to the definition of small business contained in the
California Government Code $1 1342(e) (see the foundry survey in the Appendix for the text of
this section of the code). These fourteen small business foundries are listed in the Appendix. If
we assume that the percentage of small businesses in the foundry survey reflects the percentage of
small businesses in the industry population, we estimate that 78% of the 65 foundries in
California, or 51 foundries, are small businesses. While it is likely that the small businesses will
generate less hazardous waste foundry sand than the large businesses, especially if the large
business designation can be strictly attributed to foundry operations, the Department cannot assume
that the small businesses will generate less than the average 280 tons/year since the results of the
foundry survey did not indicate a relationship between the foundry size and amount of waste
generated. Hence, the incremental fiscal impact of the proposed regulations on each of these small
businesses are estimated to be the same as for large businesses.
To reduce the impact on small businesses, the Department has been and will continue to provide
technical assistance and information on grants and small business low-interest loans to help these
businesses comply with the treatment standard.
In the absence of a treatment standard the fiscal impact on small businesses is likely to be even
greater than the figures estimated above because the waste will then be required to meet the
regulatory threshold for all hazardous constituents in the waste prior to land disposal. The
regulatory threshold is lower than the treatment standard for two of the constituents in hazardous
waste foundry sand and staff determined that most generators could not achieve the regulatory
44
threshold using chemical stabilization, the best demonstrated available technology. Staff set the
proposed treatment standards at levels generators can achieve using the best demonstrated available
technology and that minimizes the hazardous characteristics and potential for bioaccumulation or
migration of the waste.
ENVIRONMENTAL IMPACTS
Because the proposed treatment standards are developed to minimize the hazardous characteristics
of hazardous waste destined for land disposal, making the waste more suitable for land disposal
and reducing the likelihood that hazardous constituents will bioaccumulate or migrate into air, land
or water, the expected environmental impacts are primarily positive.
Under the proposed treatment standard the waste destined for land disposal will be in a form that
reduces the amount of soluble metals that may be released by the waste in an acidic environment.
The treatment technology does not cause air emissions, water discharges, noise pollution or
offensive aesthetic changes. Staff does not anticipate the treatment standard will result in increased
traffic or changes in traffic patterns because foundries currently disposing of the waste to land
disposal are likely to continue this disposal method after treatment, and foundries currently not
disposing of the waste to land disposal are likely to seek alternatives that continue to avoid land
disposal.
Staff has not identified negative environmental impacts likely to result from this proposed treatment
standard.
45

REFERENCES
California Cast Metals Association. “CCMA Workshop Transcript: Detoxifying Foundry Sand.” Sacramento, CA: CCMA. December 1986.
. “Detoxifying Foundry Sand.” Sacramento, CA: CCMA. February 1989.
. “Foundry Sand Thermal Sand Reclamation Demonstration Project.” Grant Application - RFP 88-SO22. Submitted December 1, 1988.
. “Non-Ferrous Foundry Sand Detoxification Demonstration Project.” Final Report submitted to DHS. December 12, 1988a.
Califomia. California Code of Regulations. Title 22. Social Security. Division 4. Environmental Health.
California. Department of Health Services, Toxic Substances Control Program, Alternative Technology Division. A Landfill1 Criteria for Nonliauid Hazardous Waste - Technical SUDDOI-~ Document. Sacramento, CA: Department of Health Services. November 1988.
. File on Foundry Sand Treatment Standard. Simonelli, Fred, California Cast Metals Association, Memorandum on CCMA/DOHS Sand Treatment Implementation Grant. July 3, 1987.
. Personal Interview with Jim Fumess, Buckeye Brass Foundry, Huntington Park, California. April 5-6, 1989.
. Personal Interview with Jerry Reier, P.E. and David Silsby, GMD Engineered Systems, Inc. August 10, 1989a.
. Telephone communication with Suzanne Grisolia, Chemical Waste Management, Kettleman Hills. September 6, 1989b.
California. Health and Safety Code. Division 20. Chapter 6.5. Hazardous Waste Control.
California Manufacturers Association. 1988 California Manufacturers Register. Newport Beach,
“Operations Roundup - Sand Reclamation Can Be An Economical Answer to Solid Waste
CA: TMP Publishing. 1988.
Disposal,” 4. 117(4). April 1989.
Ost”, T.R., J. Biel, W. Wagner, R.A. Flinn, and P.K. Trojan. “Interface Reactions Between Molding Sand and Leaded Copper Alloys.” AFS Transactions. 90:701-709. 1982.
Trezek, G.J. Apulication of the Polvsilicate Technolorrv to Heavv Metal Waste Streams. Sacramento, CA: DHS. August 1987.
United States. Code of Federal Regulations. Title 40: Chapter I - Environmental Protection Agency.
United States. Environmental Protection Agency. Test Methods for Evaluating Solid Wastes JSW-846). Washington, DC: U.S. EPA. September 1986.
46
Walpole, Ronald E. and Raymond H. Myers. Probabilitv and Statistics for Engineers and Scientists. 3rd Edition. New York, NY: Macmillan Publishing Company. 1985.
Warren, Gary. Recvcling of Metal Values and De-Toxification of Foundry Waste Molding Sand. Quarterly Progress Report Submitted to Illinois RRT Grant Program, Hazardous Waste Research and Information Center. Tuscaloosa, Alabama: Mineral Resources Institute and Department of Metallurgical and Materials Engineering, University of Alabama. 1988.
Zirschky, J. and M. Piznar. “Cement Stabilization of Foundry Sands.” Journal of Environmental Engineering. 114(3):715-719. 1988.
47

APPENDIX
The Foundry Survey ................................................................................... A.2
Summary of Findings from the Foundry Survey ................................................. A-19
Total Concentration Values of Waste Foundry Sand Before Treatment ....................... A-22
Soluble Concentration Values of Waste Foundry Sand Before Treatment .................... A-24
Percentage Reduction Achieved During Waste Foundry Sand Treatment ..................... A-27
Soluble Concentration Values of Waste Foundry Sand After Treatment ...................... A-36
Critical Values of the t-Distribution ................................................................ A-43
Treatment Standards for Foundry Sand Workshop .............................................. A-45
. . . Costs of Chemical Stabilization ..................................................................... A-53
A-1

The Foundry Survey
A-2

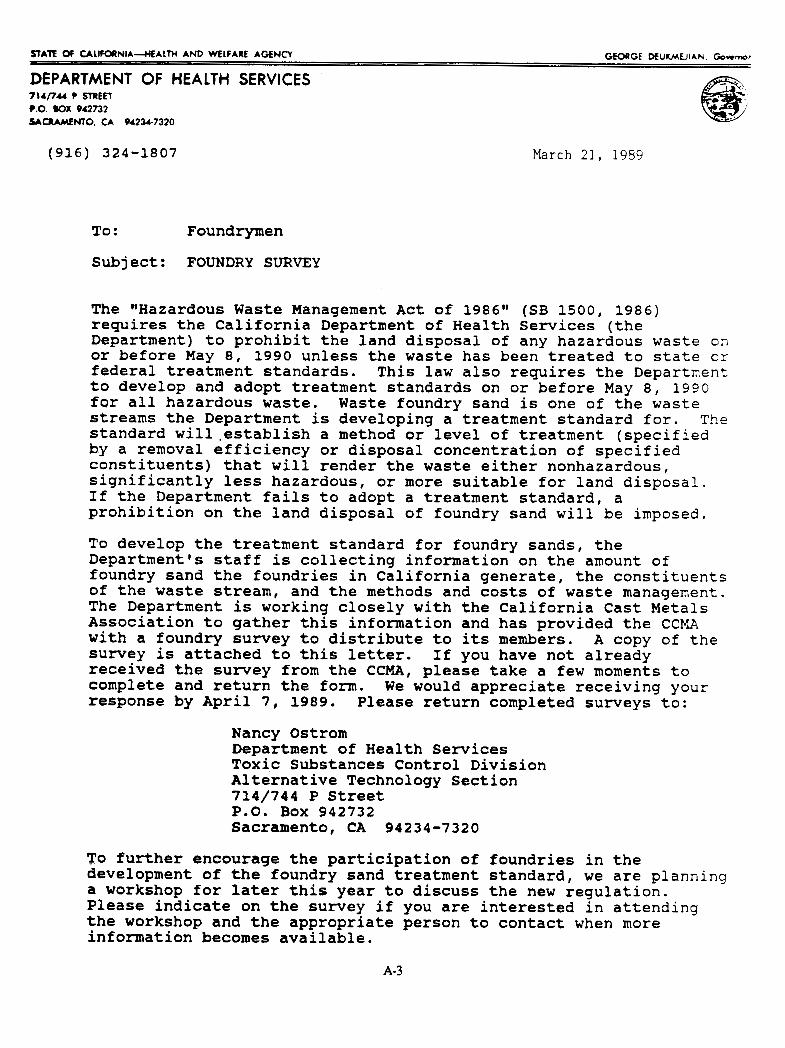
G-GE DEUKMMUIAN & " o r STATE OF C A L I F O R N I A 4 E A L T H AND WELFARE AGENCY
DEPARTMENT OF HEALTH SERVICES 714/744 C mEO 9.0 -Ox 942732 SACRAMENTO, CA 94231-7320
(916) 324-1807 March 2 1 , 1989
To: Foundrymen
Subject: FOUNDRY SURVEY
The '*Hazardous Waste Management Act of 1986" (SB 1500, 1986) requires the California Department of Health Services (the Department) to prohibit the land disposal of any hazardous waste on or before May 8, 1990 unless the waste has been treated to state or federal treatment standards. This law also requires the Department to develop and adopt treatment standards on or before May 8 , 1 9 9 0 for all hazardous waste. Waste foundry sand is one of the waste streams the Department is developing a treatment standard for. The standard wil1,establish a method or level of treatment (specified by a removal efficiency or disposal concentration of specified constituents) that will render the waste either nonhazardous, significantly less hazardous, or more suitable for land disposal. If the Department fails to adopt a treatment standard, a prohibition on the land disposal of foundry sand will be imposed.
To develop the treatment standard for foundry sands, the Department's staff is collecting information on the amount of foundry sand the foundries in California generate, the constituents of the waste stream, and the methods and costs of waste management. The Department is working closely with the California Cast Metals Association to gather this information and has provided the CCMA with a foundry survey to distribute to its members. survey is attached to this letter. received the survey from the CCMA, please take a few moments to complete and return the form. response by April 7, 1989. Please return completed surveys to:
A copy of the If you have not already
We would appreciate receiving your
Nancy Ostrom Department of Health Services Toxic Substances Control Division Alternative Technology Section 714/744 P Street P.O. Box 942732 Sacramento, CA 94234-7320
To further encourage the participation of foundries in the development of the foundry sand treatment standard, we are planning a workshop for later this year to discuss the new regulation. Please indicate on the survey if you are interested in attending the workshop and the appropriate person to contact when more information becomes available.
A-3
Foundrymen Page 2 March 21, 1989
Thank you for your assistance with this survey. already received this request from the CCMA, please excuse the duplication. We want to inform all foundries that may be affected by the treatment standard for foundry sands of our work developing the standard and give everyone the opportunity to participate and prepare f o r the standard. survey or the treatment standard for foundry sand, please contact Nancy Ostrom of my staff at (916) 322-3385.
If you have
If you have any questions about the
Sincerely, H 7
Toxic Substances Control Division
Enclosure
A 4

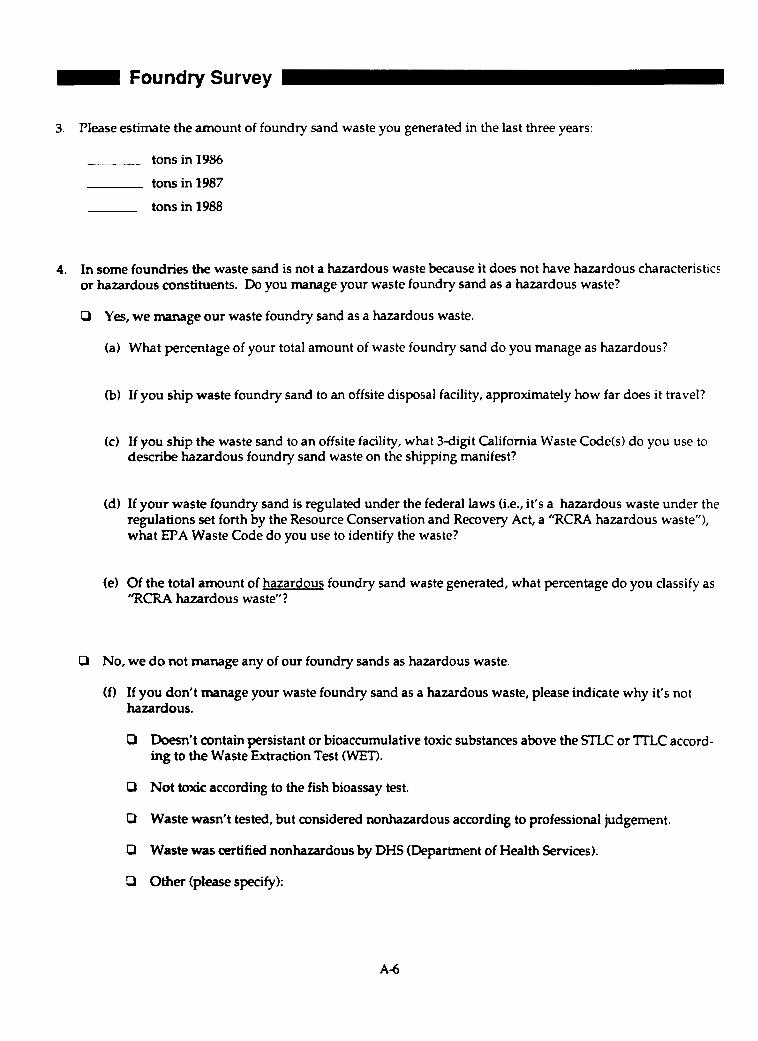
- Foundry Survey
3. Please estimate the amount of foundry sand waste you generated in the last three years:
tons in 1986
tons in 1987
tons in 1988
4. In some foundries the waste sand is not a hazardous waste because it does not have hazardous characteristics or hazardous constituents. Do you manage your waste foundry sand as a hazardous waste?
0 Yes, we manage our waste foundry sand as a hazardous waste.
(a) What percentage of your total amount of waste foundry sand do you manage as hazardous?
(b) If you ship waste foundry sand to an offsite disposal facility, approximately how far does i t travel?
(c) If you ship the waste sand to an offsite facility, what 3-digit California Waste CodeW do you use to describe hazardous foundry sand waste on the shipping manifest?
(d) If your waste foundry sand is regulated under the federal laws (Le., it‘s a hazardous waste under the regulations set forth by the Resource Conservation and Recovery Act, a ‘TCRA hazardous waste”), what €PA Waste Code do you use to identify the waste?
(e) Of the total amount of hazardous foundry sand waste generated, what percentage do you classify as “RCRA hazardous waste“?
0 No, we do not manage any of our foundry sands as hazardous waste.
(f) If you don’t manage your waste foundry sand as a hazardous waste, please indicate why it’s not hazardous.
0 Doesn’t contain persistant or bioaccumulative toxic substances above the STLC or TT’LC accord- ing to the Waste Extraction Test (WET).
0 Not toxic according to the fish bioassay test.
0 Waste wasn’t tested, but considered nonhazardous according to professional judgement.
0 Waste was certified nonhazardous by DHS (Department of Health Services).
0 Other (please specify):
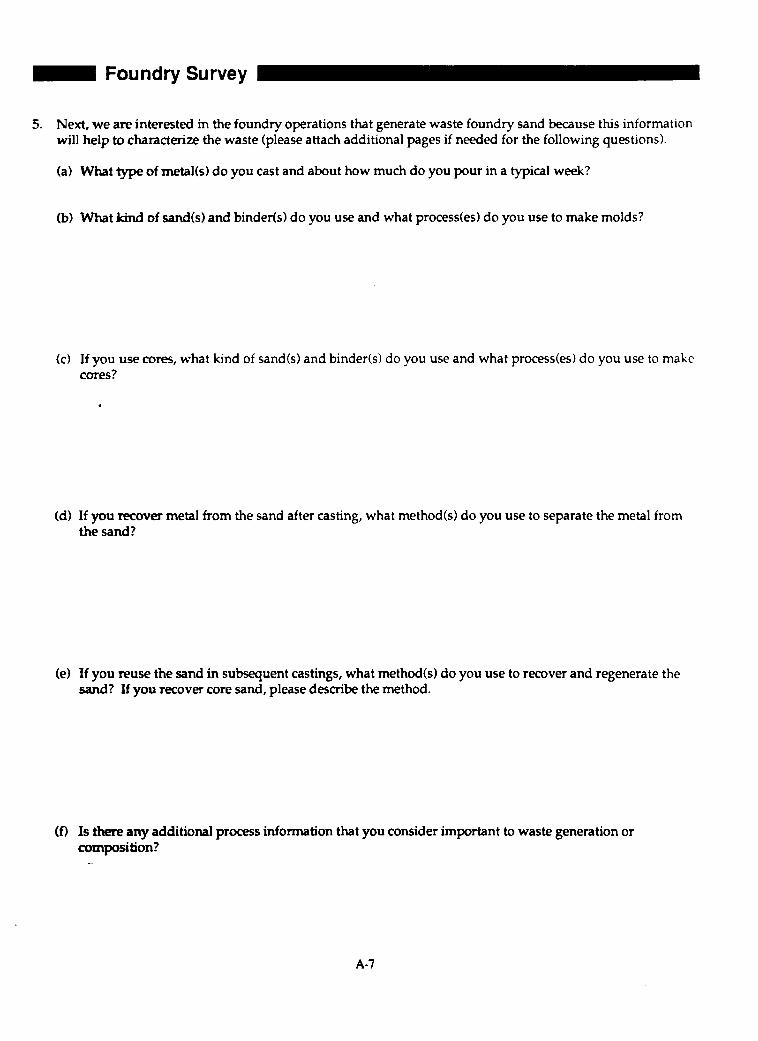
- Foundry Survey
5. Next, we are interested in the foundry operations that generate waste foundry sand because this information will help to characterize the waste (please attach additional pages if needed for the following questions).
(a) What type of metal(s) do you cast and about how much do you pour in a typical week?
(b) What kind of sand(s) and binderb) do you use and what process(es) do you use to make molds?
(c) If you use cores, what kind of sandb) and binderb) do you use and what process(es) do you use to make cores?
(d) If you recover metal from the sand after casting, what methodb) do you use to separate the metal from the sand?
(e) If you reuse the sand in subsequent castings, what methodb) do you use to recover and regenerate the sand? If you recover core sand, please describe the method.
(0 Is there any additional process information that you consider important to waste generation or compsi tion?
A-1
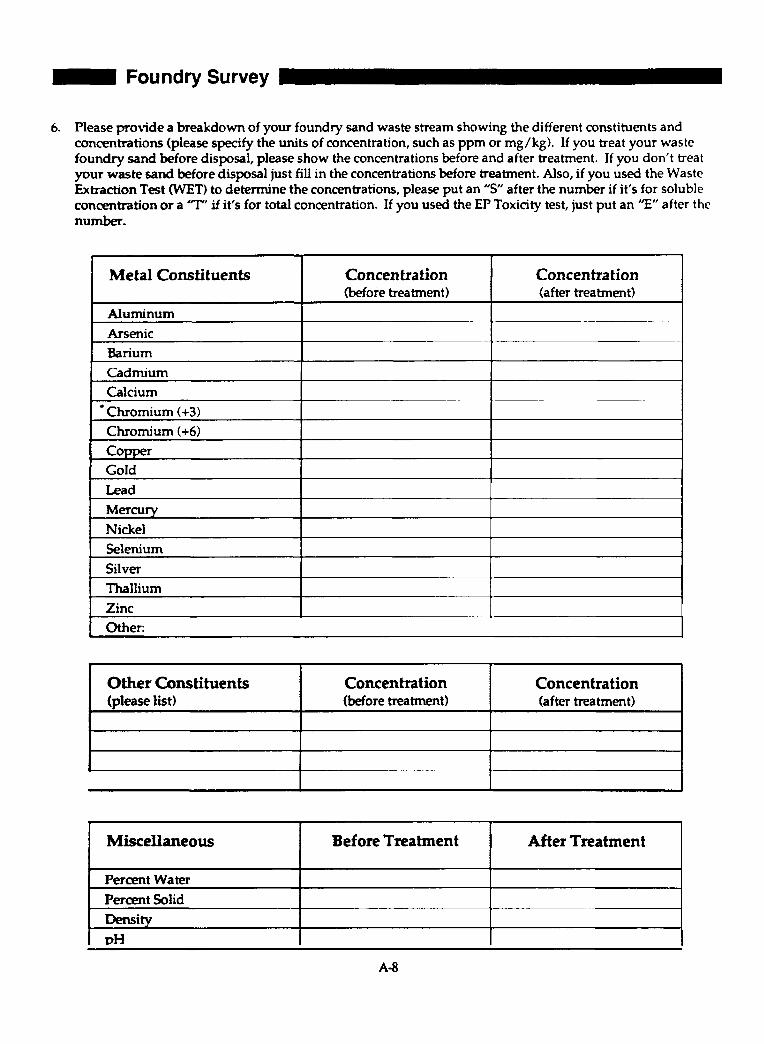
- Foundry Survey
Metal Constituents
Aluminum Arsenic Barium
6. Please provide a breakdown of your foundry sand waste stream showing the different constituents and concentrations (please specify the units of concentration, such as ppm or mg/kg). If you treat your waste foundry sand before disposal, please show the concentrations before and after treatment. If you don't treat your waste sand before disposal just fill in the concentrations before treatment. Also, if you used the Waste Extraction Test (WET) to determine the concentrations, please put an " S after the number if it's for soluble concentration or a 'T if it's for total concentration. If you used the EP Toxicity test, just put an "E" after the number.
Concentration Concentration (before treatment) (after treatment)
- Other Constituents Concentration (please list) W o r e treatment)
Cadmium Calcium Chromium (+3) Chromium (+6) Copper Gold
Concentration (after treatment)
Lead
Nickel Selenium Silver Thallium Zinc
MerCUry
Miscellaneous
Percent Water Percent Solid Density
Before Treatment After Treatment
I
- Foundry Survey
7. Please describe the methods of treatment and/or disposal you cunently use for your waste foundry sands and please indicate the costs for these treatment and/or disposal methods (specify costs in $/ton and in i
#
i percentage of your operating budget).
i i
8. Do you know of other treatment methods, including source reduction and recycling, that may be used, or are currently used, for foundry sands? If yes, please describe these methods.
A-9
March 21, 1989
Same letter sent to the following:
Ace foundry Ltd. 8240 Marbrisa Ave. Huntington Park, CA 90255
Acme Castings, Inc. 6009 S. Santa F e Ave. Bmtb*on Park, CA 90255
Em AlJoys r84D5 S. Santa Fe Ave. Cmpton, CA 90221
Aero1 Co. 3235 5an Fernando Rd. U s Angeles, CA 90065
A.3. Aluminum Casting 626 Mc Clary Ave.. Oalsland, CA 94621
Alfa Foundry 1563 E l Dorado Alviso, CA 95002
A l l i e d Aluminum Co. 8108 S. Alameda Huntington Park, CA 90255
Allied Castings , Inc. 4 4 0 Vernon Way E l Cajon, CA 92020
Aircraft Foundry Co., Inc. 5316 P a c i f i c Blvd. Huntington Park, CA 90255
A-10
Alloys Non-Ferrous Foundry 2532 Chico Ave. South El Monte, CA 91733
A & M Castings, Inc. 5325 Tweedy Blvd. South Gate, CA 90280
All Star Enterprises 3050 E. Slauson Ave. Huntington Park, CA 90255
American Brass 11030 Moorpark N. Hollywood, CA 91602
Alto Foundry & Mfg. Co. 13633 E. Rosecrans Ave. Sqnta Fe Springs, CA 90670
American Foundry 7001 Telegraph Rd. Los Angeles, CA 90040
Alum-Alloy Co. 603 S. Hope St. Ontario, CA 91761
American Pattern Co. 4943 Firestone Blvd. South Gate, CA 90280
Aluminum Castings Co. 3754 S. Durango Ave. Los Angeles, CA 90034
Angelus Aluminum Foundry C o . 3479 E. Pic0 Blvd. Los Angeles, CA 90023
Aluminum Products 1314 West 12th Street
Los Angeles, CA 90015 P.0. BOX 15002
Aluminum Specialties 13609Crenshaw Blvd. Hawthorne, CA 90250
A-R P M Corporation 1356 Santiago Santa Ana, CA 92701
A-11
W
Artworks Foundry 729 Heinz Ave. Berkeley, CA 94710
B e l l Foundry Co. 5310 Southern Ave. South Gate, CA 90280
Benic ia Foundry & I r o n Works 720 E a s t H S t . Benic ia , CA 94510
Concise Cast ing Corp. 3197 Depot Rd. Hayward, CA 94545
Covert I r o n Works 7821 S. O t i s Ave. Huntington Pk, CA 90255
Crown P a t t e r n & Foundry, I n c . 701 Date Ave Alhambra, CA 91803
Buddy-Bar Cas t ing 10801 S. Sessler South Gate , C.9 90280
Custom I r o n & Cast ing Works 2886 Bay R d . Redwood Ci ty , CA 94063
Carr P a t t e r n Co., Inc . 5236 Tweedy Blvd. South Gate, CA 90280
Dayton Foundry 11803 I n d u s t r i a l Ave. South Gate, CA 90280
C h M Aluminum Foundry, Inc . 5870 Obispo Ave Long Beach, CA 90805
Decco Cas t ings , Inc . 1596 Pioneer Way E l Cajon, CA 92020
Commercial I r o n Works Co. 2424 P o r t e r S t . U s Angeles, CA 90021
Do-A11 Foundry, Inc .
Culver C i t y , CA 90230 A-12 11844 J e f f e r s o n Blvd.
Dowel1 Aluminum Foundry, Inc. 11342 Hartland St. North Hollywood, CA 91605
Electric Casting Co., Inc. 777 N Georgia Azusa, CA 91702
Fordham Bros. Foundry 10603 S. Main St. Los Angeles, CA 90003
Future Aluminum Foundry 6107 Wilmington Ave. Los Angeles, CA 90001
Garrett Processing Co. 19800 Van Ness Ave. Torrance, CA 90509
Ellis & Vans’ Foundry, Inc. 358 West 168th St. Gardena, CA 90248
Gasser-Olds, Inc. 2618 Fruitland Ave. Los Angeles, CA 90058
El Monte Non-Ferrous Foundry 245 S. Turnbull Canyon Rd. City of Industry, CA 91745
General Foundry Service Corp. 459 Hester St. San Leandro, CA 94577
Fontana Foundry Corp. 8306 Cherry Ave. Fontana, CA 92335
Globe Iron Foundry, Inc. 5649 Randolph Los Angeles, CA 90040
Foothill Foundry, Inc. 146 S. Motor Ave. Azusa, CA 91702
Hawkins Aluminum Foundry 9220 S. Atlantic Blvd. South Gate, CA 90280
A-13
High Stress Casting Corp. 2524 Chico Ave. South El Monte, CA 91733
K P Iron Foundry, Inc. Kearneys' Mfg., Inc. Vine & Dearing Fresno, CA 93745
Hollywood Alloy Casting Co. 2000 S. Santa Fe Ave. Compton, CA 90221
Lancast Aluminum, Inc. 1644 West 135th Gardena, CA 90247
H & M Foundry 9220 S. Atlantic Ave. South Gate, CA 90280
Legaspe Aluminum Fdry 11321 Coffield Ave. El Monte, CA 91731
Industrial Pattern Shop, Inc. 1655 E. Slauson Ave. Los Angeles, CA 90011
Lodi Iron Works, Inc. P.O. Box 1150 Lodi, CA 95241
Ironsmith, Inc. 628 E. Washington Ave. Santa Ana, CA 92701
Lodi Iron Works 8169 Via Zapata Dublin, CA 94568
Jerebar C o w . 20304 5. Alameda St. Compton, CA 90221
Johnson Aluminum Foundry 16502 S. Marquardt Ave Cerritos, CA 90701
Lodi Iron Works, Inc., Alloy FOU: 609 W . Amador Galt, CA 95632
A-14
Lopez Sand & Shell Cores 1850 East 58th P1. U s Angeles, CA 90001
Monarch Aluminum Casting Co. 11211 S. Garfield Ave South Gate, CA 90280
Lynwood Pattern Service, Inc. 11233 Peach Lynwood, CA 90262
Mor-Cast Aluminum Foundry 2561 East 25th St. Los Angeles, CA 90058
Macaulay Foundry Inc. 811 Carleton St. Berkeley, CA 94710
Newton & Son Foundry 4432 Long Beach Ave. E. Los Angeles, CA 90058
Metalloy Steel Foundry, Inc. 8550 Thys Court Sacramento, CA 95828
Nieto Products 484 N. Brawley Ave. Fresno, CA 93706
Mid-State Metal Casting & Mfg. Co. 2689 South 10th St. Fresno, CA 93725
Nordhammer Art Foundry 830 East 15th St. Oakland, CA 94606
Miller Foundry Co. 1018 E. Chestnut Ave. Santa Ana, CA 92701
Ojai Artist Foundry 309-C South Fulton Ojai, CA 93023
Modern Pattern & Foundry Co, Inc. 5610 Alcoa Ave. U s Angeles, CA 90058
A-15 Pacific Alloy Castings, Inc. 5900 E. Firestone Blvd. South Gate, CA 90280
P C B P r e c i s i o n Products 7929 San Leandro St. Oakland, CA 94621
R i d g e Foundry, I n c . 1554 D o o l i t t l e D r . San Leandro, CA 94577
Roto-Cast Foundry 026 S. Santa Fe Ave. Los Angeles, CA 90021
P D Q Produc t s , Inc . W i l l o w Rd. Antioch, CA 94509
Santa Fe C a s t i n g s , I n c . 12322 E. Los Nietos Rd. Santa Fe S p r i n g s , CA 90670
Phoenix Jron Works 800 Cedar S t . Oakland, CA 94607
Sheehan Foundry 9352 San Fernando Rd. Sun Va l l ey , CA 91352
Pomona Foundry, Inc . 1479 W e s t 2nd S t . Pomona, CA 91766
Smithford P roduc t s C o . , Inc . 1401 S. Baker Ave. O n t a r i o , CA 91761
Premium C a s t i n g s Div. 1450 Rincon S t . Corona, CA 91720
Fyro Cast ings C o r p . 1914 E. Gage Ave. Los Angeles, CA 90001
Soundcast Co. /Duct i le I ron C a s t i n g s 1731 P l a c e n t i a A v e . Costa Mesa, CA 92627
South Bay Foundry 22117 Meekland Ave. Hayward, CA 94541
A-16
Pyro Castings Corp. 6525 Wilson Ave. IDS Ange les , CA 90001
Rayson Cast ing Division of Century Pattern 115 E. Gardena Blvd. Gardena, CA 90248
Rayson Cast ing D i v i s i o n of Century Pattern 13501 S . Main Los Ange les , CA 90061
A-17
South Bay Foundry 1623 Cleveland Ave. National City, CA 92050
Turner Casting Corp. 8333 Wilcox Ave. Cudahy, CA 90201
South Gate Aluminum Foundry 1861 S. Gage Ave. Los Angeles, CA 90001
United States Pipe & Foundry Co. 1295 Whipple Rd. Union City, CA 94587
Universal Aluminum Castings, Inc. 2810 Croddy Way Santa Ana, CA 92704
Universal Cast Iron Mfg. Co. 5404 Tweedy P1. South Gate, CA 90280
State Aluminum Foundry 15532 Illinois St. Paramount, CA 90723
Strategic Materials Corp. & Steel Foundry 10017 Burtis South Gate, CA 90280
Teledyne Cast Products 4200 West Valley Blvd. Pomona, CA 91768
Van Brunt Aluminum Fdry Voorhies Casting, Inc. 9220 S. Atlantic Ave South Gate, CA 90280
Tharco Aluminum 1718 West 139th St. Gardena, CA 90249
V fr W Castings/ Warren L. Rose Castings, Inc. 6032 Shull St. Bell Gardens, CA 90201
Titech International, Inc. 4000 West Valley Blvd. Pomona, CA 91768
A-18
Summary of Findings from the Foundry Survey
A-19

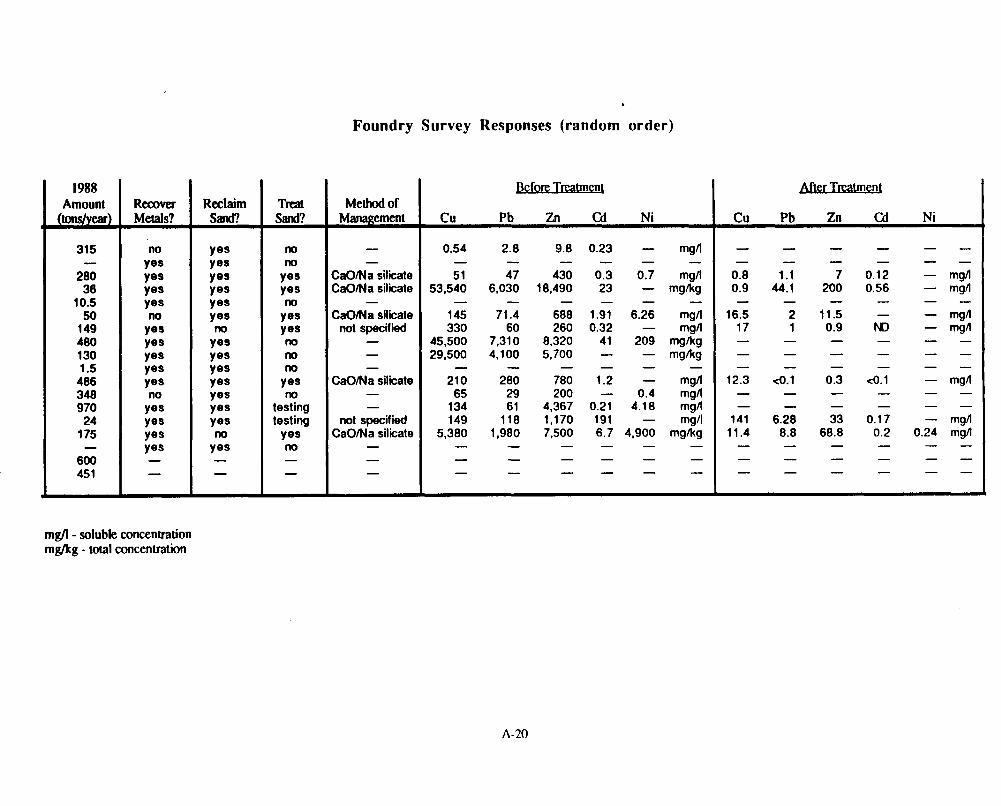
1988 Amount 0
315
280 36
10.5 50
149 480 130 1.5
486 348 970
24 1 75
600 45 1
-
-
c u Pb Zn GJ Ni I
Foundry Survey Responses (random order)
Nter Treatme nl
Cu Pb Zn Cd Ni Method of
Management
CaOMa silicate CaOMa silicate
CaOMa silicate not specified
CaOMa silicate
not specified CaOMa silicate
Before Trcamnt
0.54
51 53,540
145 330
45.500 29,500
210 65
1 34 149
5,380
-
-
-
- - -
2.8
47 6,030
71.4 60
7.31 0 4,100
280 29 61
118 1,980
-
-
-
- - -
9.8
430 18.490
688 260
8,320 5.700
780 200
4.367 1,170 7.500
-
-
-
- - -
0.23
0.3 23
1.91 0.32
41
-
-
- -
1.2
0.21 191 6.7
-
- - -
- -
0.8 0.9
16.5 17
-
- - -
12.3 - -
141 11.4 - - -
- - 7
200
11.5 0.9
-
- -
0.3 - - 33
68.8 - - -
mg/l - soluble concentration mg/kg - total concentration
A-20
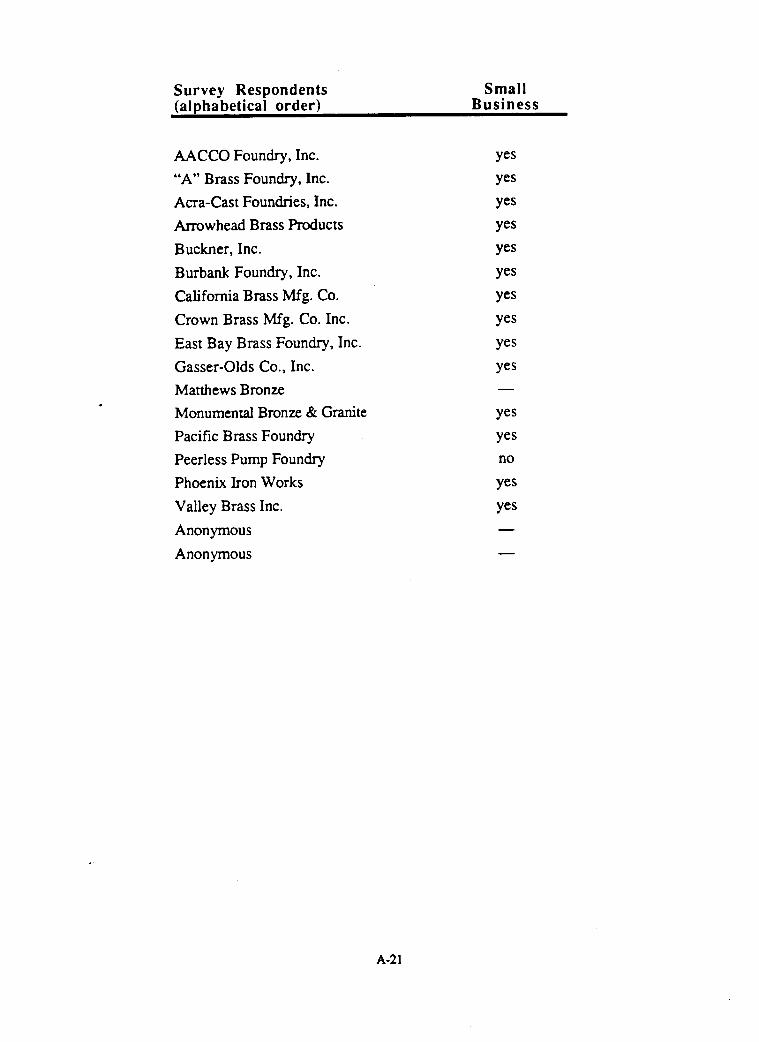
Survey Respondents Small (alphabetical order) Business
AACCO Foundry, Inc. “A” Brass Foundry, Inc. Acra-Cast Foundries, Inc. Arrowhead Brass Products Buckner, Inc. Burbank Foundry, Inc. California Brass Mfg. Co. Crown Brass M f g . Co. Inc. East Bay Brass Foundry, Inc. Gasser-Olds Co., Inc. Matthews Bronze Monumental Bronze & Granite Pacific Brass Foundry Peerless Pump Foundry Phoenix Iron Works Valley Brass Inc. Anonymous Anonymous
A-21
c Total Concentration Values of Waste Foundry Sand
Before Treatment
A-22

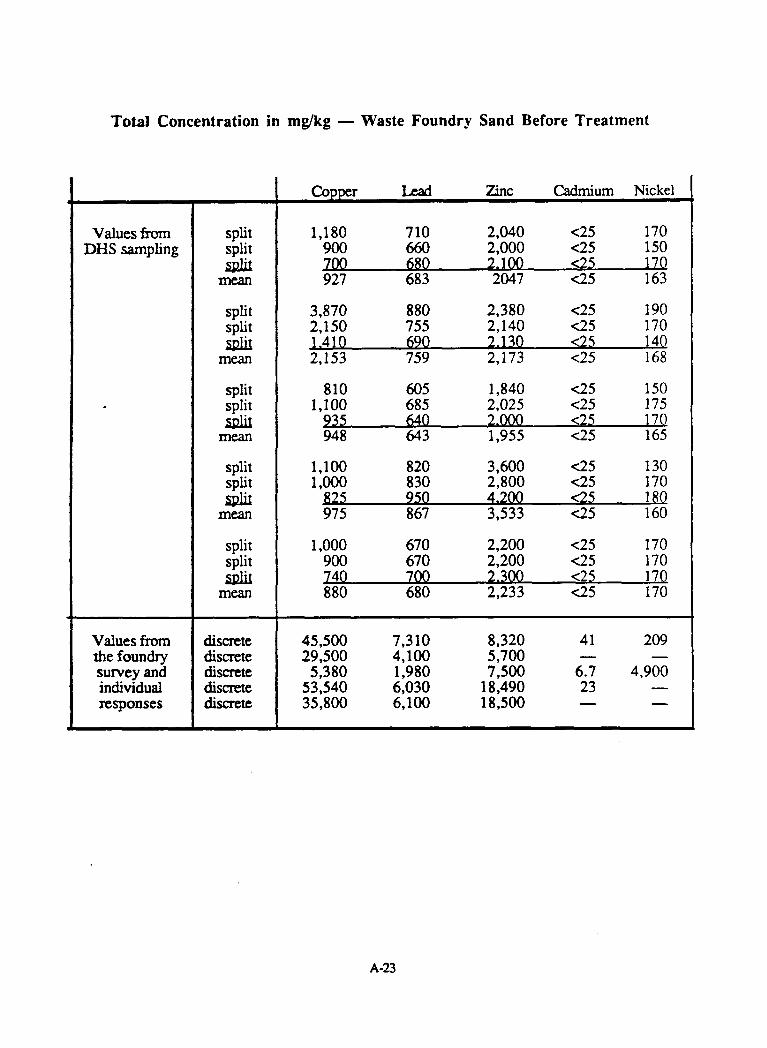
Total Concentration in mg/kg - Waste Foundry Sand Before Treatment
Values from DHS sampling
Values from rhe foundry survey and individual responses
split split sDllt
mean
split split split
mean
split split &
mean
split split split
mean
split split &
mean
discrete discrete discrete discrete discrete
Copper Lead Zinc Cadmium Nickel
1,180 710 2,040 <25 170 900 660 2,000 <25 150 700 680 2.100 e 5 17Q 927 683 2047 <25 163
3,870 880 2,380 <25 190 2,150 755 2,140 <25 170 1.410 690 2.130 <25 14Q 2,153 759 2,173 <25 168
810 605 1,840 <25 150 1,100 685 2,025 <25 175
948 643 1,955 <25 165 935 640 7,.000 <25 17Q
1,100 820 3,600 <25 130 1,000 830 2,800 <25 170
825 950 4.200 <25 I80 975 867 3,533 <25 160
1,000 670 2,200 <25 170 900 670 2,200 <25 170 740 700 2.300 <25 17Q 880 680 2,233 <25 170
45,500 7,310 8,320 41 209 29,500 4,100 5,700 - - 5,380 1,980 7,500 6.7 4,900
53,540 6,030 1 8,490 23 - 35,800 6,100 18,500 - -
A-23

I I Soluble Concentration Values of Waste Foundry Sand
Before Treatment
A-24

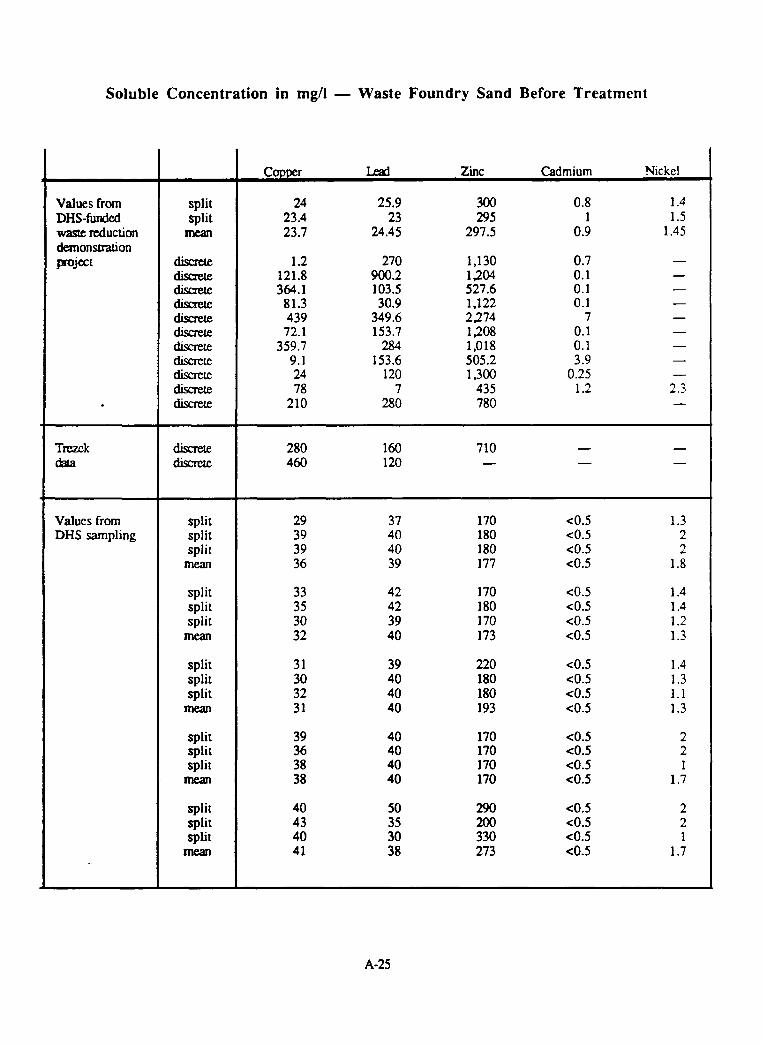
Soluble Concentration in mg/l - Waste Foundry Sand Before Treatment
Values from DHS-funded waste reduction demonstmion pojmt
Trezck data
Values from DHS sampling
split split
mean
discrete discrete cIlsmxe dlscme discrete discrete discrete cllscme discrete cllscme discrere
discrete cllscme
split split split
mean
split split split
mean
split split split
mean
split split split mean
split split split
mean
Copper IXd zinc Cadmium Nickel
24 25.9 300 0.8 1.4 23.4 23 295 1 1.5 23.7 24.4 5 297.5 0.9 1.45
1.2 121.8 364.1 81.3 439 72.1
359.7 9.1 24 78
210
270 900.2 103.5 30.9
349.6 153.7 284
153.6 120
7 280
1,130 1,204 527.6 1,122 2,274 1,208 1,018 505.2 1,300
435 780
0.7 0.1 0.1 0.1
7 0.1 0.1 3.9
0.25 1.2
- - 280 160 710 460 120 - - -
29 39 39 36
33 35 30 32
31 30 32 31
39 36 38 38
40 43 40 41
37 40 40 39
42 42 39 40
39 40 40 40
40 40 40 40
50 35 30 38
170 180 180 177
170 180 I 70 173
220 180 180 193
170 170 170 170
290 200 330 273
1.3 2 2
1.8
1.4 1.4 1.2 1.3
1.4 1.3 1.1 1.3
2 2 1
1.7
2 2 1
1.7
A-25
I'
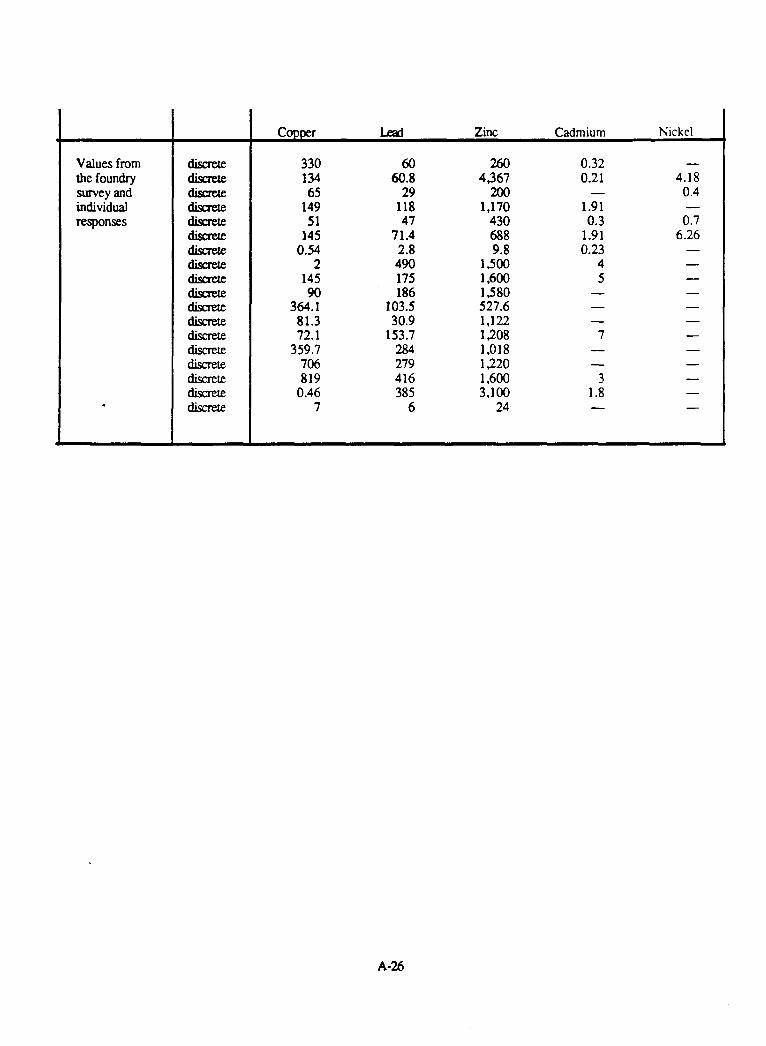
Values from the foundry survey and individual responses
Copper Lead zinc Cadmium Nickel
330 134 65
149 51
145 0.54
2 145 90
364.1 81.3 72.1
359.7 706 819
0.46 7
60 60.8
29 118 47
71.4 2.8 490 175 186
103.5 30.9
153.7 284 279 416 385
6
260 4,367 200
1.1 70 430 688 9.8
1500 1,600 1580 527.6 1,122 1208 1,018 1220 1,600 3,100
24
0.32 0.21
1.91 0.3
1.91 0.23
4 5
-
- - -
7 - -
3 1.8 -
A-26
f
Percentage Reduction Achieved During Waste Foundry Sand Treatment
A-21
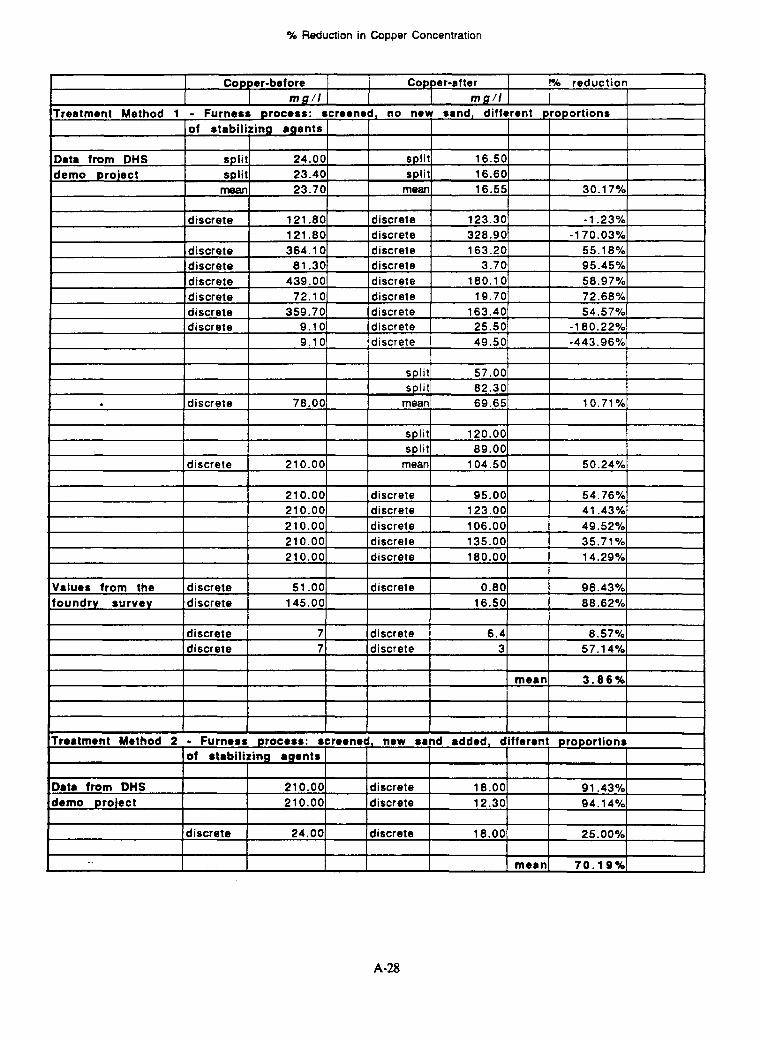
% Reduction in Copper Concentration
I I I I I I I I
I 1 I mean1 70.19361
A-28
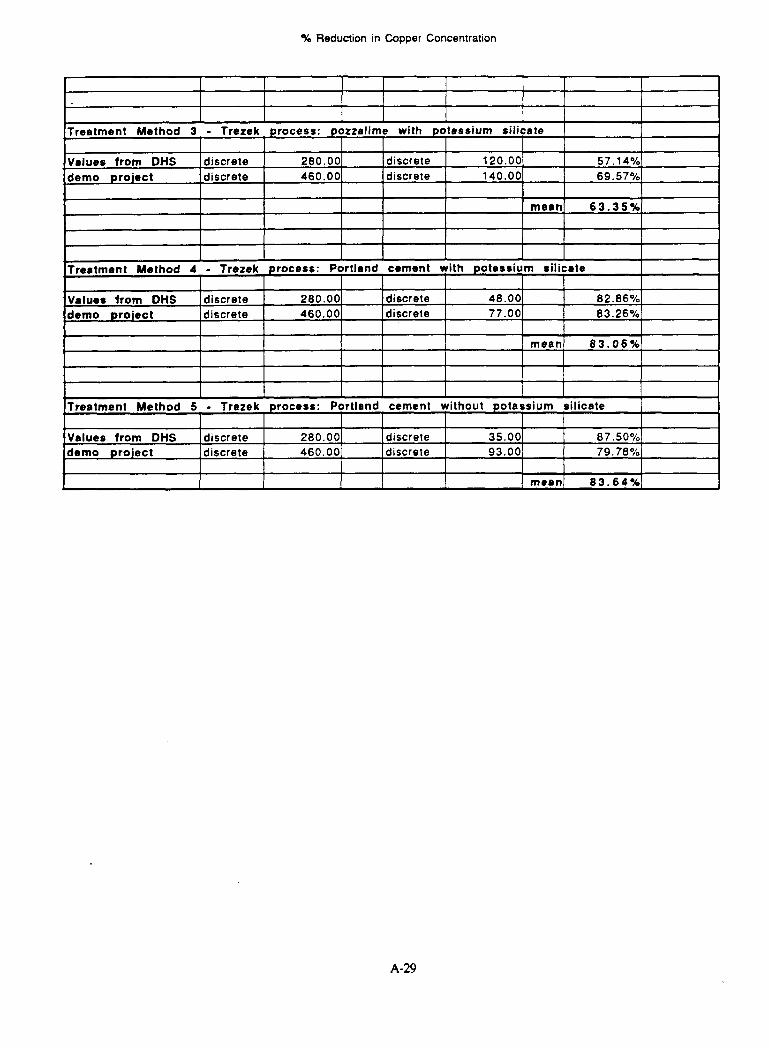
a
% Reduction in Copper Concentration
I I I I I
Treatment Method 3 - Trezek process: pozzalimc with potassium silicate 1
Values from DHS discrete 280.00 discrete 120.00 57.14% 460.00 discrete 140.00 69.57% demo pro ject discrete
I I I I
1 I I I I mean1 63.35161 I I
I I I I I I
Treatment Method 4 - Trezek process: Portland cement with potassium silicate
Values trom DHS discrete 280.00 discrete 48.00 8 2.86 Oi0
demo project discrete 460.00 discrete 77.00 8 3 .26 '10 I
I I 1 1 mean1 8 3 . 0 6 X I
I I Treatment Method 5 - Trezek process: Portland cement without potassium silicate
I I 1 I i I I Values from DHS discrete 280.00 discrete 35.00 8 7 .50% demo project discrete 460.00 discrete 93.00 79.78%
A-29

% Reduction in Lead Concentration
I I I I 1 I mean] 98.95361
A-3U
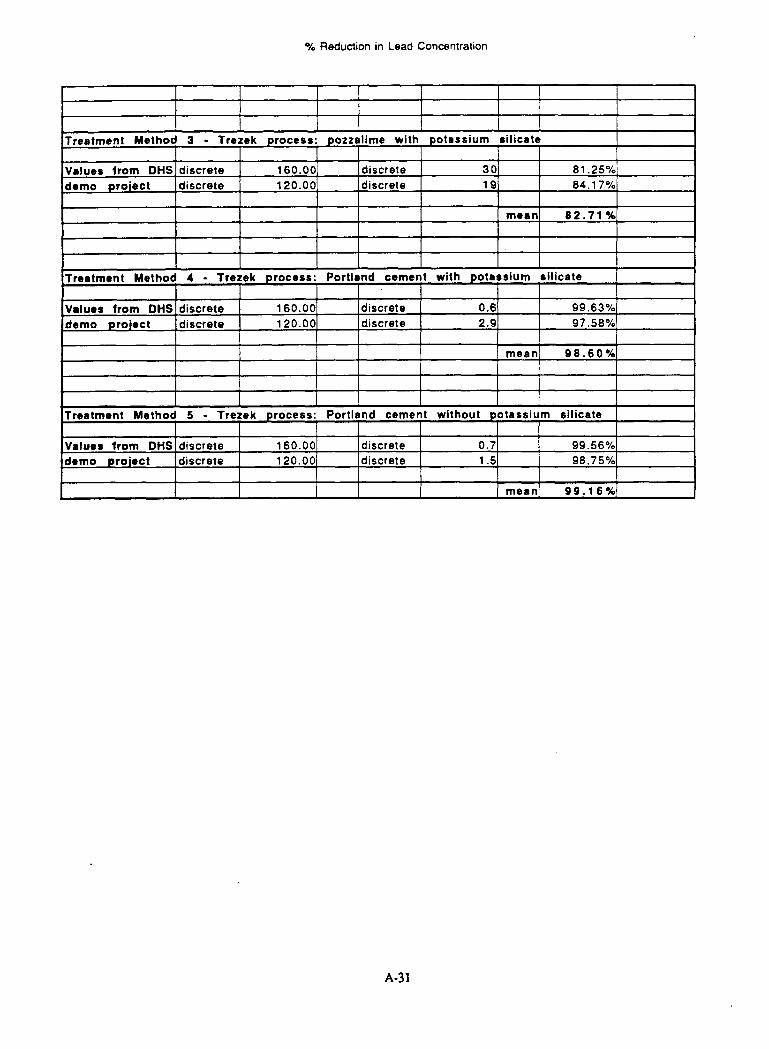
% Reduction in Lead Concentration
A-31
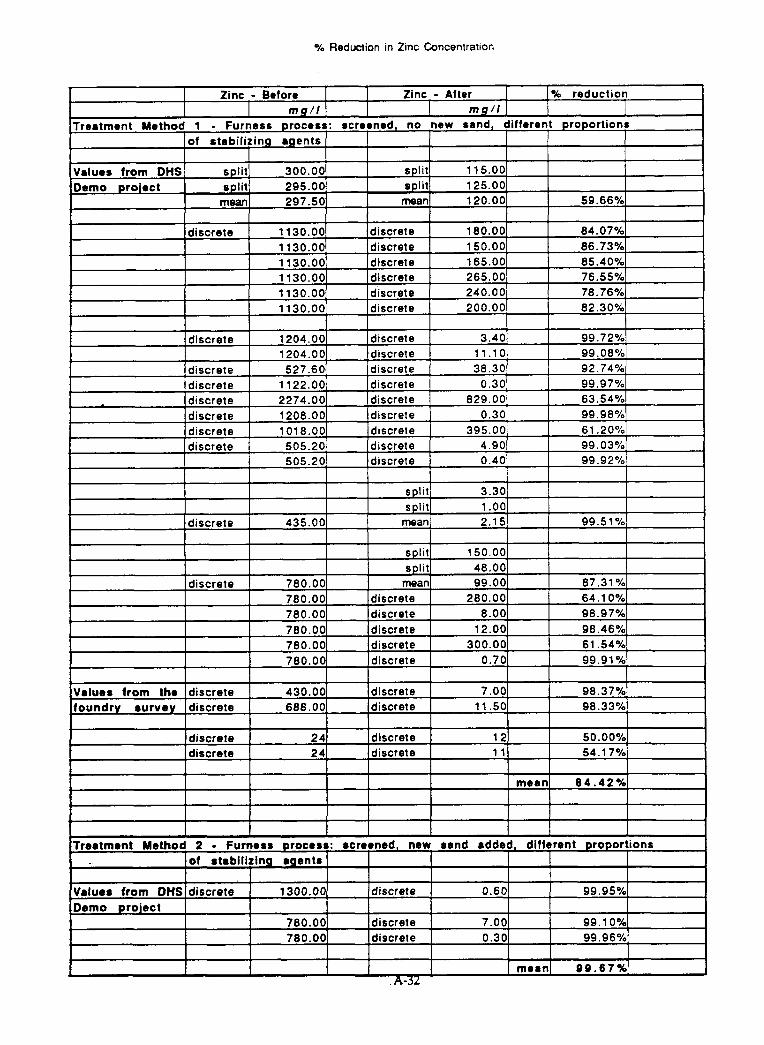
Yo Reduction in Zinc Concentration
Valuer from the discrete I 430.00 discrete 7.00 98 .3? '10 foundry survey discrete I 688.00 discrete 11.50 98.33%
I
I I I I I I I split1 3.301
~
ldiscrefe I 24 ldiscrete I 24
split 1 .oo discrete 435.00 mean 2.1 5 99.5 1 O/o
50.0 0 Yo ldiscrete 11 54.1 7% ldiscrete 12
I I I I I I 1
I split1 150.001 I I 1
mean 6 4 . 4 2 %
~~
1 I I
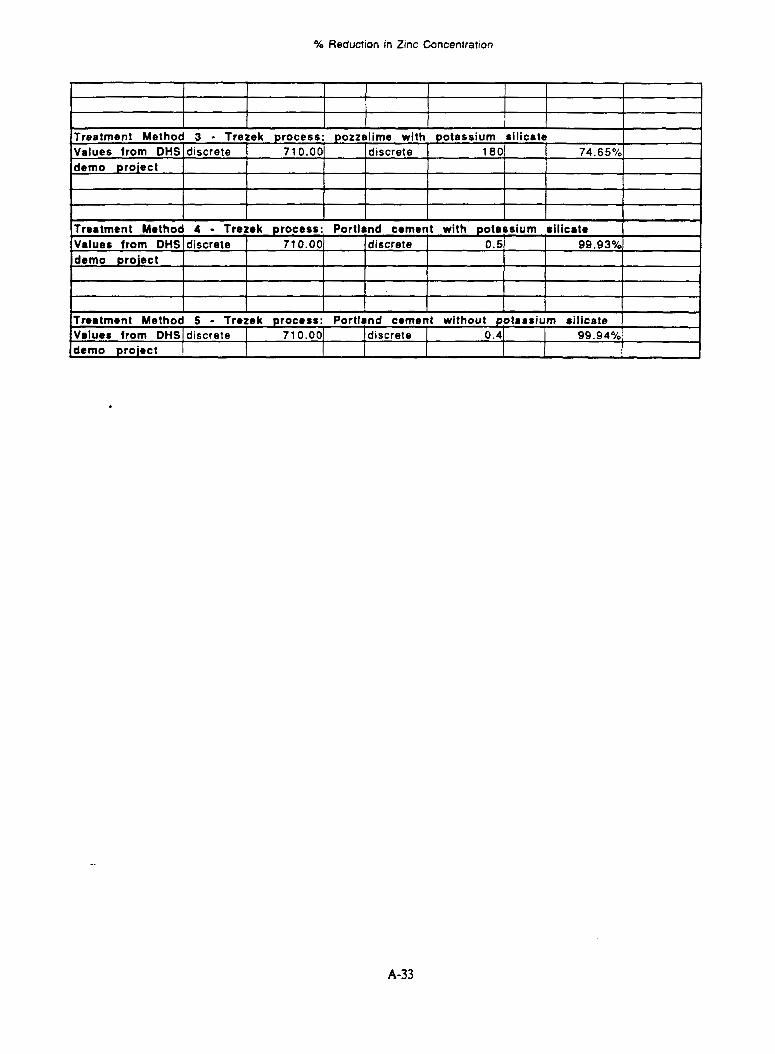
% Reduction in Zinc Concentration
Values from DHS discrete 71 0.00 discrete 180 demo project
t I I I I I I I 1 I I I I I I I
74.65%
I I I 1 I I I Treatment Method 5 - Trezek process: Portland cement without potassium silicate
I I I I I I i I I I I I I I I
A-33
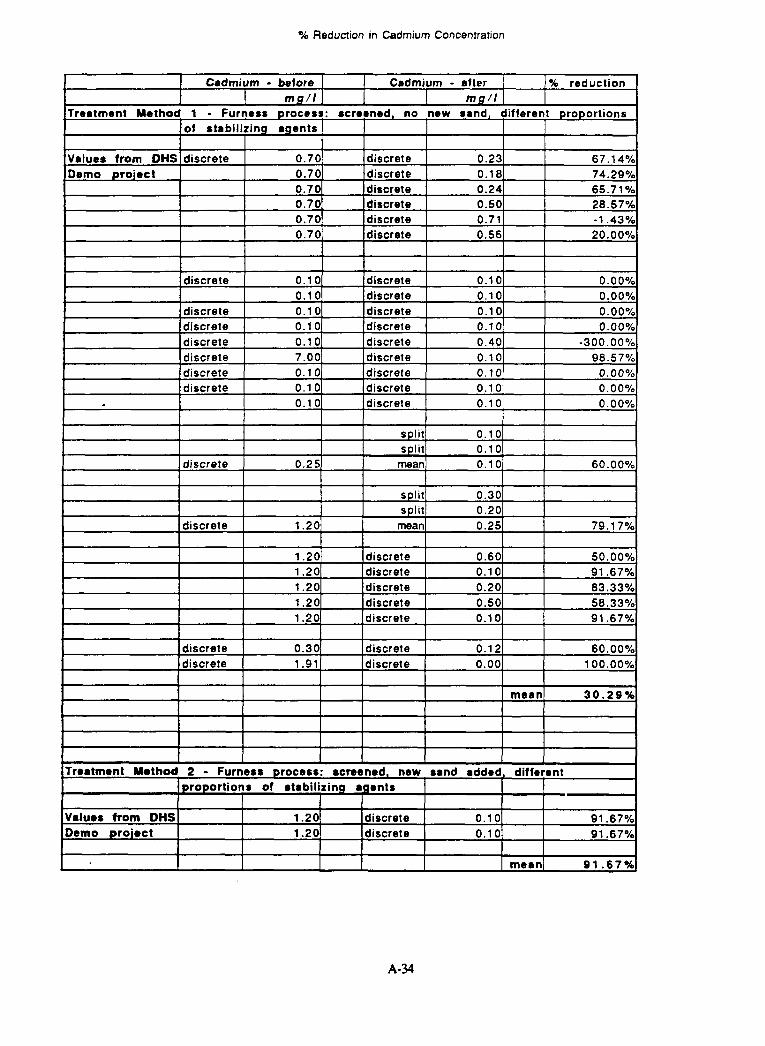
Reduction in Cadmium Concentration
a
a
a
a
>
a
a
a
>
a
a
>
a
a
a
a
a
a
l
a
a
l
a
I
, I
I
A-34
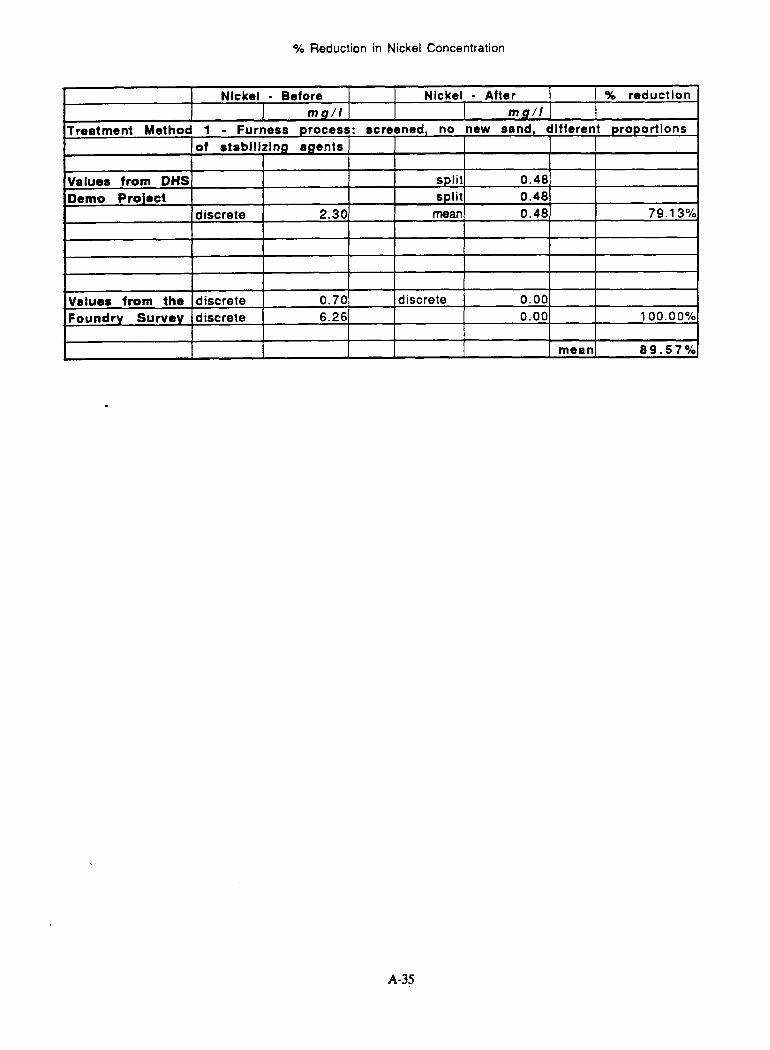
o/o Reduction in Nickel Concentration
I
Values from the discrete 0.70 discrete 0.00
Foundry Survey discrete 6.26 0.00 loo.ooo/o I I I
1
mean( 8 9 . 5 7 Yo
A-35
c Soluble Concentration Values of Waste Foundry Sand
After Treatment
A-36

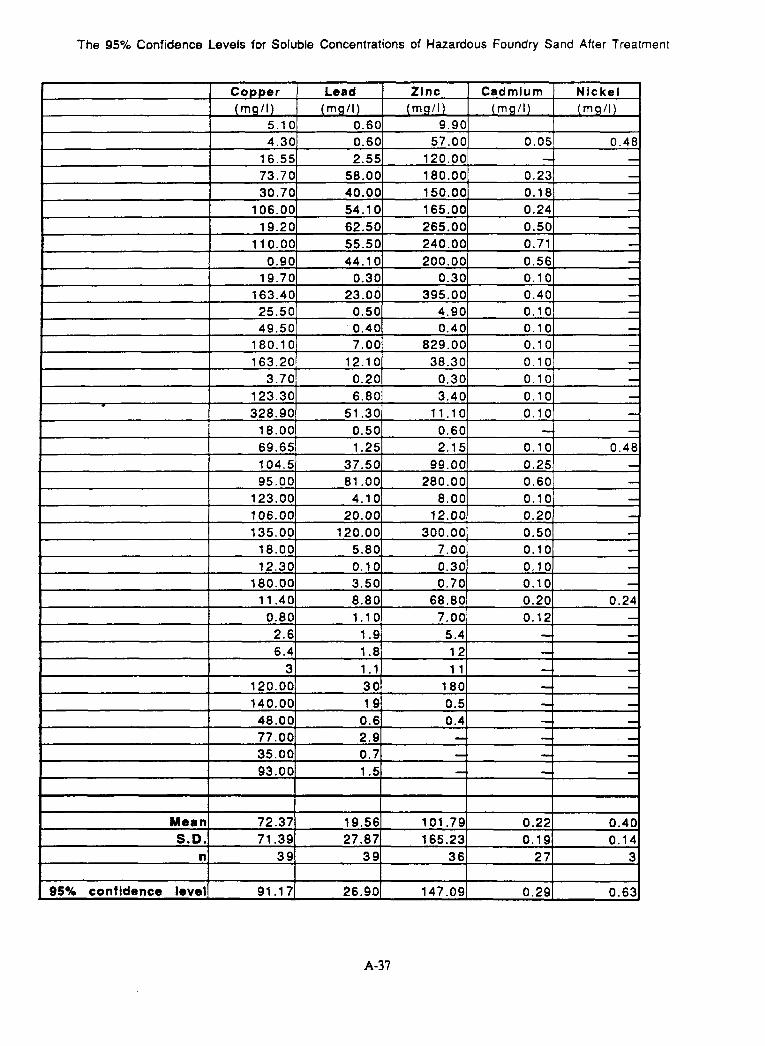
The 95% Confidence Levels for Soluble Concentrations of Hazardous Foundry Sand After Treatment
Mean S.D.
n
95W contldence level
72.37 19.56 101.79 0.22 0.40 71 -39 27.87 165.23 0.19 0.14
3 9 3 9 3 6 2 7 3
91.1 7 26.9.0 147.09 0.29 0.63
A-37
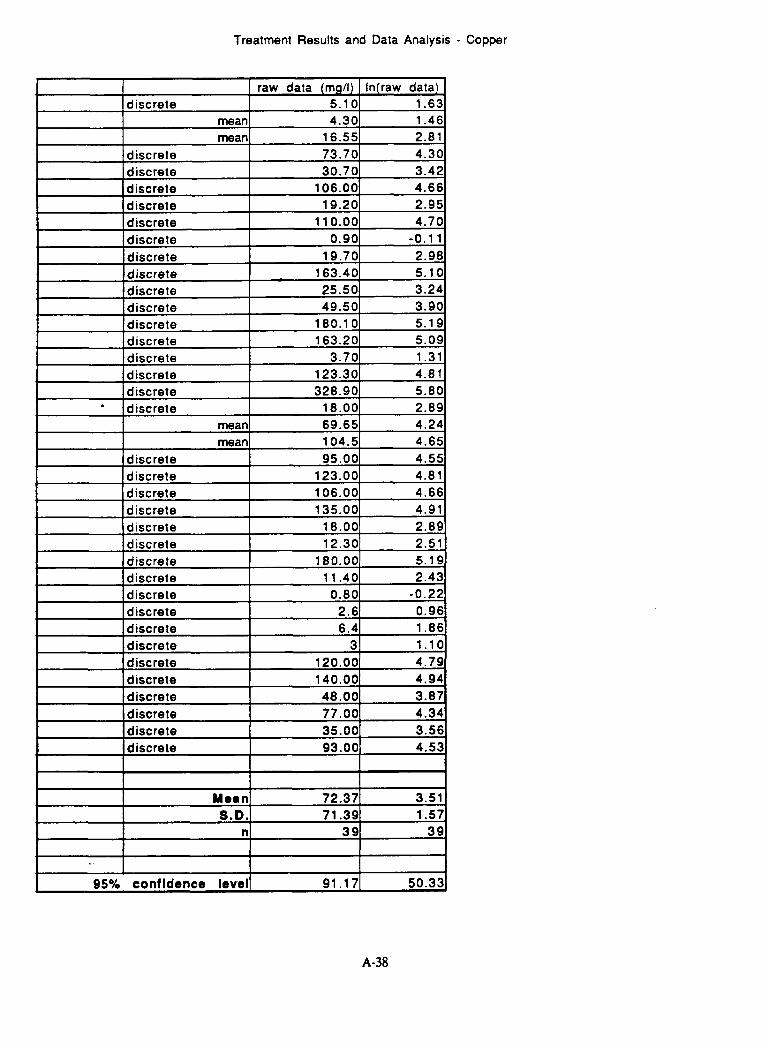
Treatment Results and Data Analysis - Copper
discrete discrete
d iscte t e 180.00 5.19 discrete 11.40 2.43 discrete 0.80 -0.22 d isc re t e 2 .6 0.96 discrete 6.4 1.86 discrete 3 1.1c discrete 120.00 4.79 discrete 140.00 4.94
35.00 3.56 93.00 4.53
t I discrete 1 48.001 3.87 ]discrete 77.001 4.34
Morn S . D .
n
72.37 3.51 71.39 1.57
3 9 3 9. I I i 1
I I I I t 95% confldence levell 91.171 50.33
I I I
A-38
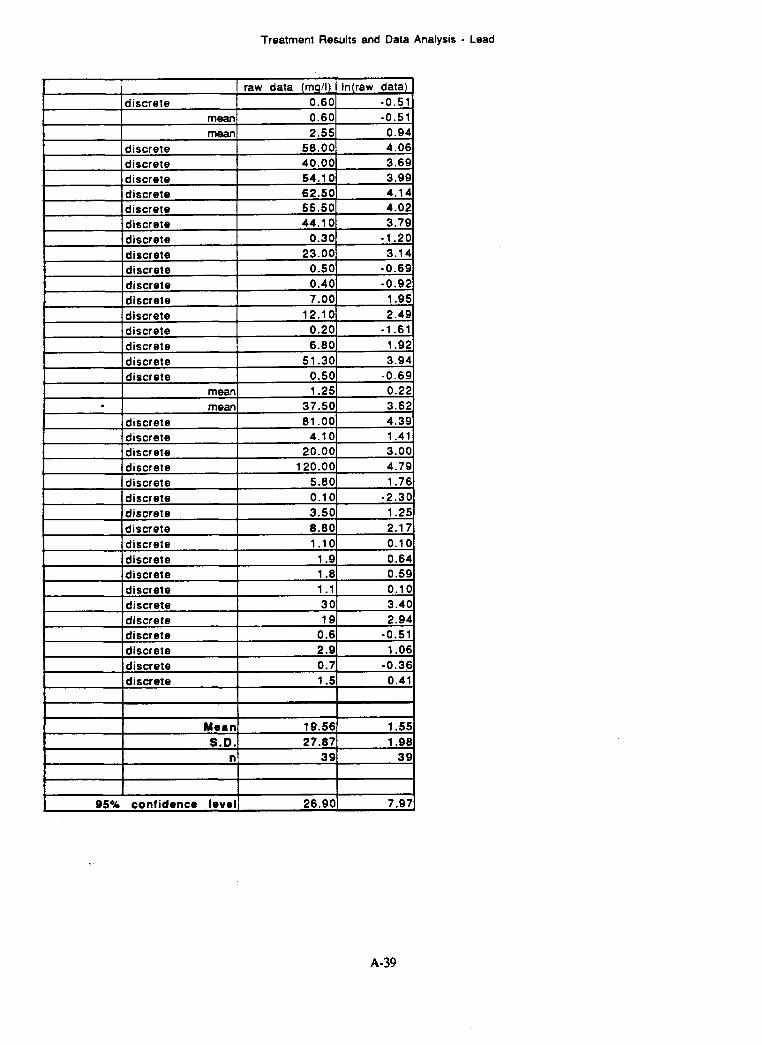
Treatment Results and Data Analysis - Lead
discrete mean
raw data (mg/l) In(raw data) 0.60 -0.51 0.60 -0.51
t I mean 2.551 ldiscrete 58.001
Mean S.D.
n
19.56 1.55 27.87 1.98
39 39
I I I I
I I I I I 05% confidence level1 26.901 7.971
A-39
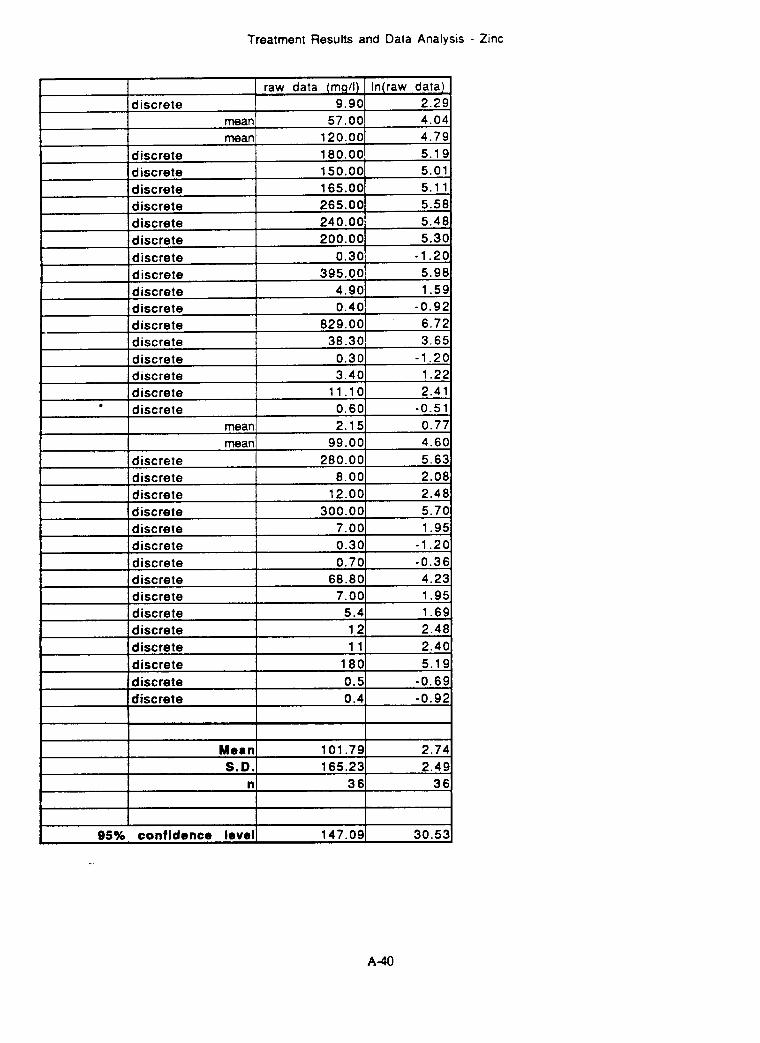
Treatment Results and Data Analysis - Zinc
Mean S.D.
n
1 I raw data (mgll) I In(raw data)
101.79 2.74 165.23 2 .49
3 6 3 6
0.60 -0.51 discrete mean 2.15 0.77
I mean 99.00 4.6C
I 95% confidence level1 147.091 30.53
A40
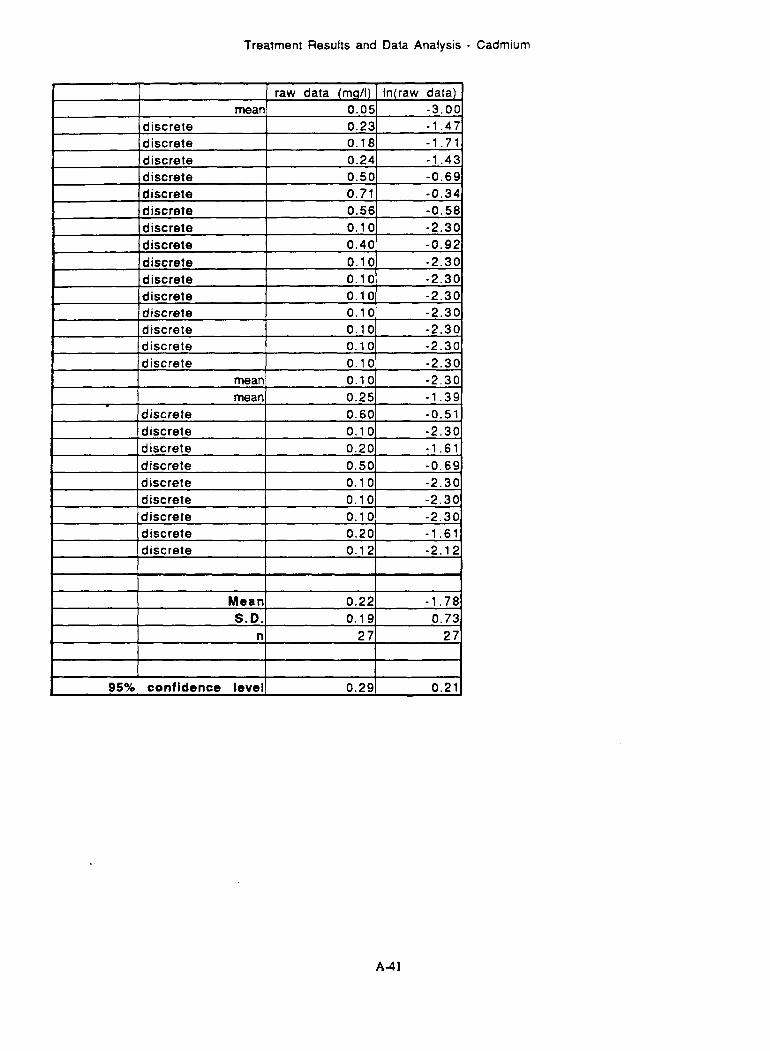
Treatment Results and Data Analysis - Cadmium
Mean S.D.
n
1 I I I I 0.22 -1.78 0.19 0.73
27 27
I I I I
I I I 1 J 95% confidence level] 0.291 0.211
A 4 1
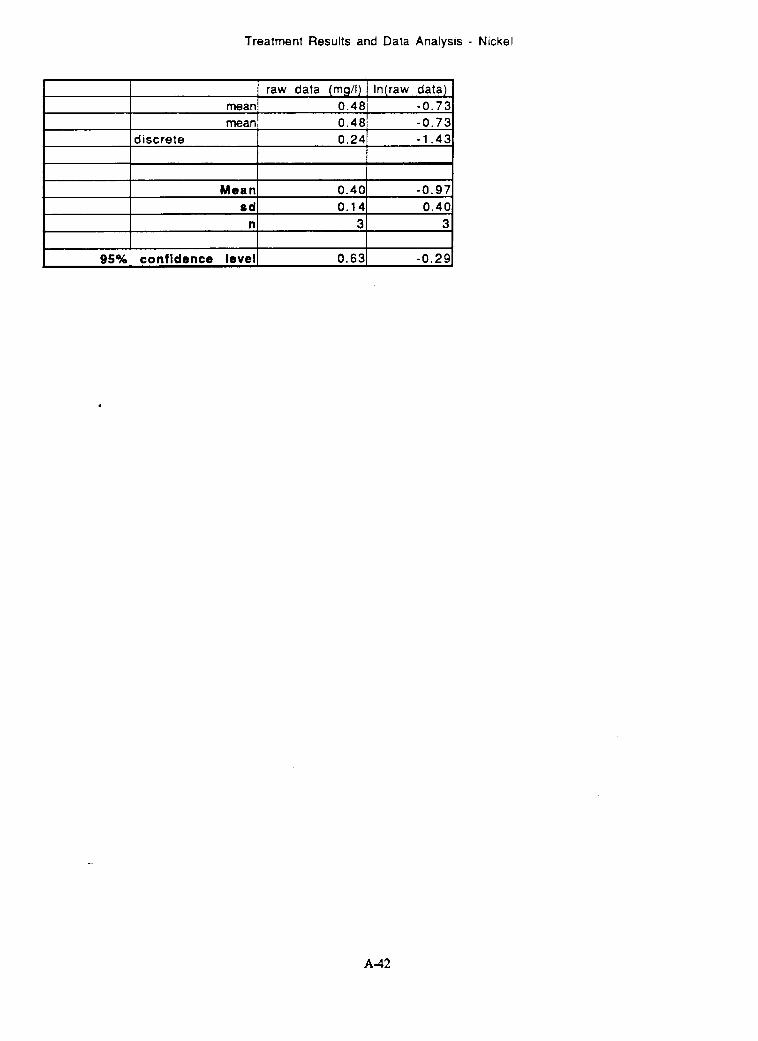
Treatment Results and Data Analysis
mean
Nickel
0.481 -0.73 mean
I discrete 0.48 -0.73 0.24 -1.43
Mean r d n
0.40 -0.97 0.14 0.40
3 3
A 4 2
95% confidence level 0.63 -0.29
~~ ~ ~
Critical Values of the t-Distribution
A43

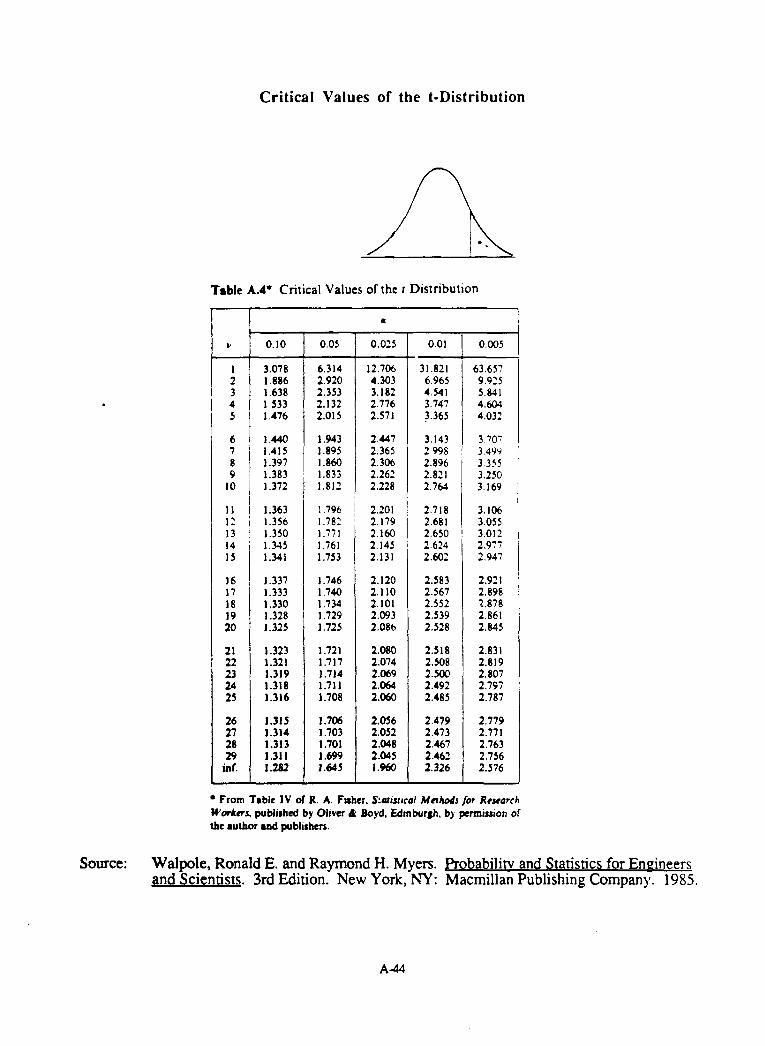
Critical Values of the t-Distribution
Table A.4. Critical Values of the r Distribution
v
1 2 3 4 5
6 7 8 9
10
11 12 13 14 15
16 17 18 19 20
21 22 23 24 25
26 27 28 29 mr. -
0.10
3.078 1 .E86 1.638 1533 1.476
1.440 1.41s I .397 1.383 1.372
1.363 1.356 1.3SO 1.34s 1.341
1.337 1.333 1.330 1.328 1.325
1.323 1.321 1.319 1.318 1.316
1.31s 1.314 1.313 1.311 1.282 -
0.0s
6.314 2.920 2.3S3 2.132 2.01 s 1.943 1.895 1 .E60 1.833 1.812
1.796 I .782 1.771 1.761 1.753
1.746 1.740 1.734 1.729 1 .725
1.721 1.717 1.714 1.711 1 .708
1.706 I .703 1.701 I .699 1.645
0.025
12.706 4.303 3.182 2.776 2.s71
2.447 2.365 2.306 2.262 2.228
2.201 2.179 2.160 2.14s 2.131
2.120 2.1 10 2.101 2.093 2.08b
2.080 2.074 2.069 2.064 2.060
2.056 2.052 2.068 2.045 1 .w
-
0.01
31.821 6.96s 4.541 3.747 3.365
3.143 2 996 2.896 2.821 2.764
2.718 2.681 2.6SO 2.614 2.602
2.583 2.567 2.5S2 2.539 2.528
2.518 2.508 2.500 2.492 2.485
2.479 2.473 2.467 2.462 2.326
-- 0.005
63.657 9.925 5.84 I 4.604 4.032
3.707 3.4YY 3.355 3.250 3.169
3.106 3.055 3.012 2.977 2.947
2.921 2.898 2.878 2.861 2.845
2.831 2.819 2.807 2.797 2.787
2.779 2.771 2.763 2.756 2.576
From Table IV of R. A. Fmher, S:aistic.ol Mrrhodsjor Research W ~ r k r r ~ publrshd by O l ~ m P Boyd, Edinburgh. by permission of tbe author and publishers.
Source: Walpole, Ronald E. and Raymond H. Myers. Prob abilitv and Statistics for Eneineers grid Scientists. 3rd Edition. New York, NY: Macmillan Publishing Company. 1985.
A 4

Costs of Chemical Stabilization
A-53

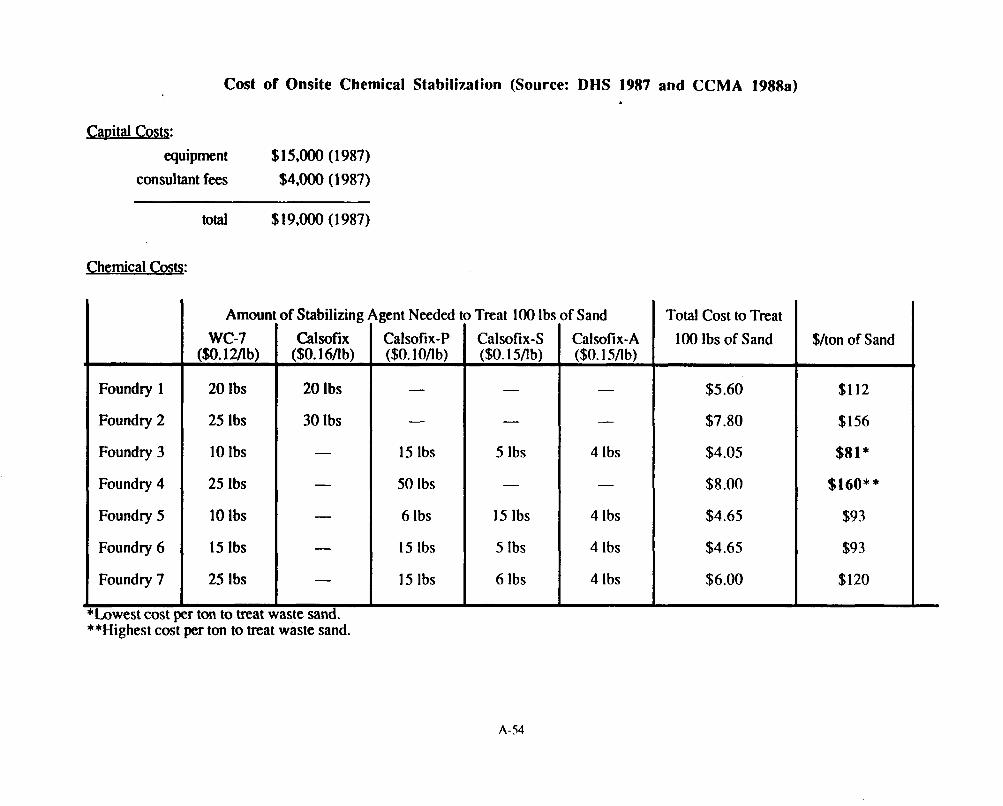
Cost of Onsite Chemical Stabilization (Source: DHS 1987 and CCMA 1988a)
Cauital Costs: equipment $15,000 (1987)
consultant fees $4,000 (1987)
total $19,000 (1987)
Chemical Costs:
Foundry 1
Foundry 2
Foundry 3
Foundry 4
Foundry 5
Foundry 6
Foundry 7
wc-7 ($0.12/lb)
20 Ibs
25 Ibs
10 lbs
25 Ibs
10 lbs
15 Ibs
25 Ibs
calsofix ($0.16/lb)
20 Ibs
30 lbs
Lowest cost per ton to treat waste sand. **Highest cost per ton to treat waste sand.
Calsofi x-P ($0.1 0/I b)
-
-
15 Ibs
50 Ibs
6 Ibs
15 Ibs
15 Ibs
Treat 100 Ib: Calsofix-S ($0.1 5/I b)
-
5 Ibs
15 Ibs
5 Ibs
6 Ibs
if Sand Calsofi x- A ($0. I 5/I b)
-
4 Ibs
4 Ibs
4 Ibs
4 Ibs
Total Cost to Treat 100 Ibs of Sand
$5.60
$7.80
$4.05
$8 .00
$4.65
$4.65
$6.00
$/ton of Sand
$1 12
$156
$81*
$160* * $93
$93
$120
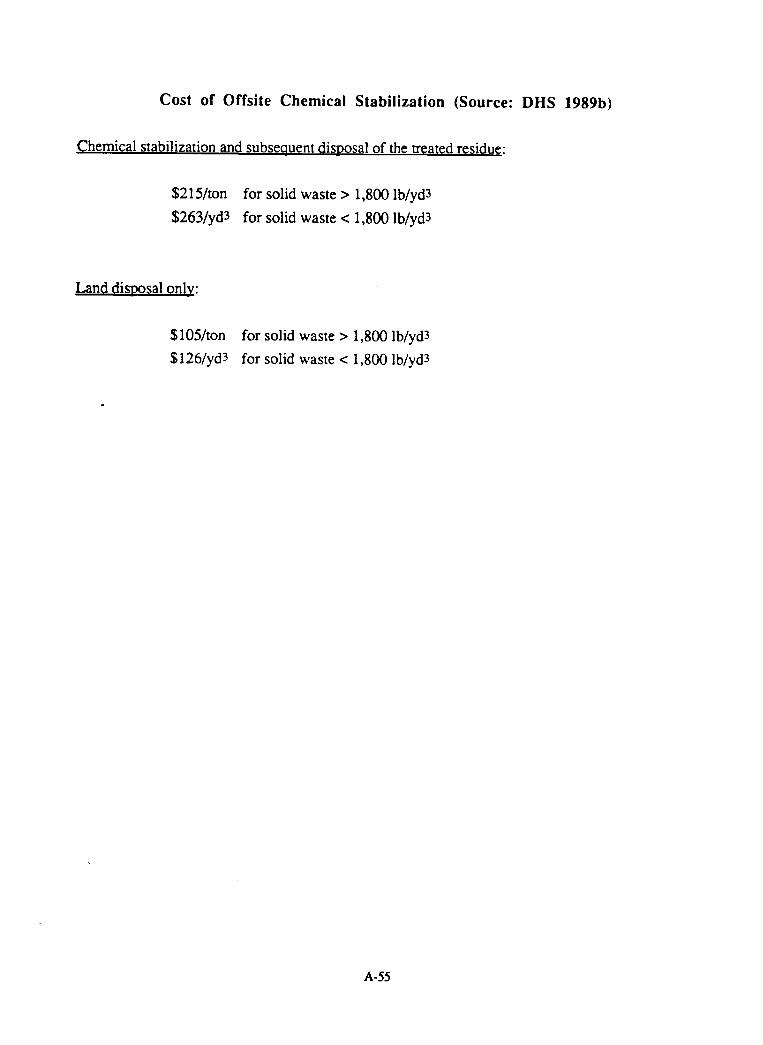
Cost of Offsite Chemical Stabilization (Source: DHS 1989b)
$215/ton for solid waste > 1,800 lb/yd3 $263/yd3 for solid waste e 1,800 lb/yd3
Land d i s~osa l onlv:
$105/ton for solid waste > 1,800 lb/yd3 $126/yd3 for solid waste < 1,800 Ib/yd3
P
A-55