technical no. report - crccare.com · crc care technical report no. 13 field assessment of ......
TRANSCRIPT

Petroleum Vapour Model Comparison: Interim Report for CRC CARE
Field assessment of vapours
technicalreport
13no.
CRC for Contamination Assessment and Remediation of the Environment
G.B. Davis, J. Wright and B.M. Patterson

G.B. Davis1, J. Wright2 and B.M. Patterson1
1CSIRO Land and Water
2Environmental Risk Sciences Pty Ltd
August 2009

CRC CARE Technical Report no. 13 Field assessment of vapours
Cooperative Research Centre for Contamination Assessment and Remediation of the Environment, Technical Report series, no. 13
August 2009
Copyright © CRC CARE Pty Ltd, 2009
This book is copyright. Except as permitted under the Australian Copyright Act 1968 (Commonwealth) and subsequent amendments, no part of this
publication may be reproduced, stored or transmitted in any form or by any means, electronic or otherwise, without the specific written permission
of the copyright owner.
CRC CARE gives permission to NEPC to use extracts of this document for the purpose of the NEPM, with appropriate citation as indicated below.
ISBN: 978-1-921431-18-0 (online)
978-1-921431-19-7 (print)
Enquiries and additional copies:
CRC CARE, P.O. Box 486, Salisbury South, South Australia, Australia 5106
Tel: +61 (0) 8 8302 5038
Fax: +61 (0) 8 8302 3124
www.crccare.com
This report should be cited as:
Davis, GB, Wright, J & Patterson, BM 2009, Field assessment of vapours, CRC CARE Technical Report no. 13, CRC for Contamination Assessment
and Remediation of the Environment, Adelaide, Australia.
Disclaimer:
This publication is provided for the purpose of disseminating information relating to scientific and technical matters. Participating organisations of CRC
CARE do not accept liability for any loss and/or damage, including financial loss, resulting from the reliance upon any information, advice or
recommendations contained in this publication. The contents of this publication should not necessarily be taken to represent the views of the
participating organisations.
Brand names:
The use of brand names in this report does not constitute endorsement by CRC CARE, CSIRO or the authors, and no such endorsement can be
inferred, claimed or advertised.
Acknowledgement:
This document was commissioned by CRC CARE from CSIRO Land and Water, and prepared by Dr Greg Davis, Jackie Wright and Dr Bradley
Patterson. The work was carried out through the CSIRO Water for a Healthy Country National Flagship.
Front cover: Image courtesy of AMS, Inc. (www.ams-samplers.com). Example of a gas vapour probe kit.

CRC CARE Technical Report no. 13 Field assessment of vapours i
Table of contents
Acknowledgements v
Executive summary vii
1. Introduction 11.1 Background 1
1.2 Australian context and scope of report 1
2. Conceptual site model and vapour behaviour 32.1 Conceptual site model 3
2.2 Vapour behaviour 62.2.1 Source zone 62.2.2 Deep soil profile zone 72.2.3 Shallow near-surface soil zone 72.2.4 In the building 82.2.5 Additional zones 92.2.6 Other considerations 9
3. Guidance documents 113.1 Australian guidance 11
3.1.1 National Environment Protection (Assessment of Site Contamination) Measure 113.1.2 NSW DECC 113.1.3 Standards Australia 12
3.2 Overseas guidance, standards and information 123.2.1 US EPA 123.2.2 ASTM International 123.2.3 ITRC 143.2.4 Canada 143.2.5 United Kingdom 153.2.6 Other jurisdictions of the United States of America 15
3.3 Industry guidance and procedures 173.3.1 American Petroleum Institute 173.3.2 Petroleum industry in Australia 173.3.3 Consulting industry 18
4. Framework for vapour assessment 194.1 Screening assessment (Tier 1): ‘Exclusion distance’ – little or no site vapour data 19
4.1.1 ‘Exclusion distance’ understanding 194.1.2 Information requirements 204.1.3 Basis for the exclusion distance estimates 20
4.2 Screening assessment (Tier 1): Comparison to health-based investigation levels (HILs) – little or no site vapour data 22
4.3 Tier 2 and Tier 3 – requires site vapour data 23
4.4 Tier 4 – mitigation 23

CRC CARE Technical Report no. 13 Field assessment of vapoursii
Table of contents
5. Design issues for field assessment of vapours 255.1 Data quality objectives 25
5.2 Variability issues 25
5.3 Biodegradable vapours 26
5.4 Measurement options 27
5.5 Data interpretation 27
6. Vapour and gas sampling and monitoring techniques 296.1 Soil gas sampling methods 29
6.1.1 Temporary spear probing 296.1.2 Permanent multi-level probes/samplers 306.1.3 On-line VOC and oxygen probe 326.1.4 Sub-slab sampling 326.1.5 Across the capillary fringe 336.1.6 Factors that may be considered when sampling soil gas 33
6.2 Flux chamber methods 346.2.1 Static chamber 346.2.2 Dynamic chamber 356.2.3 Factors that may be considered when using flux methods 36
6.3 Crawl-space and indoor/outdoor air sampling 37
6.4 Passive implant sampling 38
6.5 Sample collection and analysis 386.5.1 Active methods 386.5.2 Passive methods 426.5.3 Summary of common methods 44
7. Summary observations 45
8. References 478.1 All documents referenced 47
8.2 Guidance documents 51
Appendices
Appendix A. Parameter estimation techniques 55
Appendix B. Available US state guidance 59

CRC CARE Technical Report no. 13 Field assessment of vapours iii
Table of contents
Tables
Table 1. Summary of ‘critical distances’ beyond which a site may be excluded from further assessment under ASTM (2008) 13
Table 2. Compilation of aspects from guidance documents 16
Table 3. Summary of ‘exclusion distances’ adopted by some US states 21
Table 4. Qualitative indication of the variability caused by the sampling process, chemical analysis, and temporal and spatial variations – for a range of sample types – from Eklund (2007) 26
Table 5. Matrix of various assessment options to evaluate vapour intrusion (revised from ITRC 2007a) 28
Table 6. Advantages and disadvantages of the temporary probe methods 30
Table 7. Advantages and disadvantages of the permanent probe methods 31
Table 8. Advantages and disadvantages of the sub-slab methods 32
Table 9. Advantages and disadvantages of the static chamber method 35
Table 10. Advantages and disadvantages of dynamic chamber method 36
Table 11. Advantages and disadvantages of collecting crawl-space and indoor air samples 37
Table 12. Advantages and disadvantages of the use of carbon and multi-sorbent media 40
Table 13. Advantages and disadvantages of the use of canisters 42
Table 14. Advantages and disadvantages of the use of passive sampling media 43
Table 15. Overview of common sample collection and analysis methods 44
Table A1. Estimates of characteristic equilibration times (days) for a retardation coefficient, β=1 57
Figures
Figure 1. Conceptualisation – modified after US EPA (2002) schematic of vapour intrusion 3
Figure 2. Conceptualisation – modified from ITRC (2007a), and used as logo for the US EPA National Forum on Vapor Intrusion held in Philadelphia, PA on 12–13 January 2009 4
Figure 3. Conceptualisation – from Abreu and Ettinger (‘Understanding the Conceptual Site Model for Vapour Intrusion into Buildings’, US EPA National Forum on Vapor Intrusion, 12–13 January 2009, Philadelphia, PA) 4
Figure 4. Conceptualisation – modified after a graphic produced by Professor Paul Johnson 5
Figure 5. Conceptualisation – from ITRC (2007a) 5
Figure 6. Conceptualisation – from ITRC (2007a) 6
Figure 7. Example depth profiles of total petroleum hydrocarbon (TPH) vapours and major gases (oxygen and carbon dioxide) with a vapour source zone at 2.25–3.25 m below ground 7
Figure 8. Example PCE and TPH vapour, and oxygen depth profiles 8
Figure 9. Petroleum hydrocarbon vapour depth cross-section section beneath a slab-on-ground building 8
Figure 10. Temporal variations in oxygen and total petroleum hydrocarbon vapour (Hc) concentrations determined using oxygen and VOC probes buried 0.5 m below ground 9
Figure 11. Schematic of multiple depth soil gas sampling installations (after API 2005) 30
Figure 12. Schematic of the dynamic chamber method (after URS 2008) 35
Figure 13. Example sorbent tubes (source: Air Toxics Ltd and SKC) 39
Figure 14. Canisters commonly used for the sampling of air (source: Air Toxics Ltd) 41
Figure 15. Examples of passive sampling devices (source: SKC and Radiello) 43

CRC CARE Technical Report no. 13 Field assessment of vapoursiv

CRC CARE Technical Report no. 13 Field assessment of vapours v
Our thanks go to many regulator and industry colleagues who commented and contributed to the work reported here.Thanks also to Dr Mike Trefry from CSIRO for discussions and insights on vapour behaviour.
Acknowledgements

CRC CARE Technical Report no. 13 Field assessment of vapoursvi

CRC CARE Technical Report no. 13 Field assessment of vapours vii
Australia has no current guidance on the field assessmentof volatile compounds for sites where vapours have thepotential to migrate into buildings and pose risks to humanhealth. There are recommendations to provide suchnational guidance. This report updates knowledge availableinternationally related to guidance and methods ofvapour assessment. It is intended to be used with otherdocumentation to inform the variation of the AustralianNational Environment Protection (Assessment of SiteContamination) Measure (NEPM) currently underway.
In this report:
• the processes underlying vapour behaviour are described
• available guidance is reviewed
• a framework for vapour assessment and screening is suggested
• design issues for field assessment of vapours are described
• investigation and sampling techniques are compared, and
• observations from the work are summarised.
It is found that a well-described conceptual site model(CSM) of vapour risk embodies understanding of siteconditions, potential vapour behaviour, and priorities forinvestigation. It serves as the basis for vapour riskassessment along with data quality objectives (DQOs).
Extensive vapour intrusion and assessment guidancedocumentation has been developed within the UnitedStates of America and by industry, but limited guidance is available for other countries. A staged approach (Tier1, 2, 3 or 4) for vapour assessment is generally adoptedacross nearly all guidance, however, the breadth ofinvestigation required in each stage is not consistentacross the available guidance. The stages of investigationfor vapour assessment do not always align with acceptedstages of a more general site investigation (Phase I orPhase II environmental site assessments – ESAs, orpreliminary/detailed site investigations – PSIs/DSIs).
There is substantial information that would support anexclusion distance approach applicable at a Tier 1screening level, whereby if a property or building is beyonda set distance to the edge of a vapour source, then it couldbe excluded from further investigation. Consideration ofthe use of soil gas vapour concentrations (representativeof the direct pathway of exposure), rather than soilconcentrations alone, for comparison to health-basedinvestigation level (HIL) screening values seems warranted.In Australia, this may require the development of soil gas HILs for volatile compounds. Where soil vapourassessment techniques are not used at Tier 1, then soiland/or groundwater investigations will be required toassist in the definition of the exclusion distance or toprovide data for comparison to HIL screening values.
A variety of vapour assessment techniques are available. Advantages and disadvantages of many aretabulated. Choices of vapour investigation approachesshould target improvement and modification of the CSM. Guidance documents recommend a number ofapproaches. Common elements are, where required and practical, (i) subsurface soil gas samples should betaken no shallower than 1 m, unless adequately justified,(ii) to determine maximum vapour concentrations in thesubsurface, samples should be recovered as close aspossible to the source (it is acknowledged that this maybe particularly difficult for groundwater sources and may not be warranted for very deep sources), and (iii) depth profiles can be useful. Seasonal and short-termatmospheric changes (barometric, etc.) can influencevapour concentrations but this effect decreases rapidlywith depth depending on the period of the transientdisturbance and the re-equilibration time of the vapourconcentrations through the soil profile. Vapour behaviourmay need to be assessed over time where shallowsampling is undertaken and where transient behaviourmight be expected to occur.
Most experience and investigations have been carriedout for petroleum hydrocarbons and chlorinated solventvapours. Whilst the techniques and approaches may be valid for use for other volatile compounds, for somecompounds (e.g. mercury, butadiene) there is limitedexperience, and hence careful adoption of field approacheswould be required.
Executive summary

CRC CARE Technical Report no. 13 Field assessment of vapoursviii

CRC CARE Technical Report no. 13 Field assessment of vapours 1
1.1 BackgroundThe risks posed by volatile contaminants in soil andgroundwater remain uncertain but a large number of investigations over the last decade have providedgreater surety around the behaviour of vapours. Volatilecompounds, as vapours, can migrate into buildings andpose a risk to residents or workers. Because of previouslyhigh uncertainty in quantifying vapour exposures,conservative assumptions have been adopted. Becauseof this, the potential for vapours to accumulate in indoorair often became the dominant driver of health risk for animpacted site and thus affected the extent of remediationrequired (API 1998; Sanders & Stern 1994).
The difficulties associated with assessing such risksacross a number of sites in a consistent and uniformmanner led to the adoption of risk-based decisionmaking (RBDM) and risk-based corrective action (RBCA)methodologies (US EPA 1995). These methodologieshave since been adopted by many nations, and a rangeof assessment tools have become available to supportenvironmental management and remediation activitieswithin the RBDM and RBCA frameworks.
Understanding of vapour behaviour, techniques forvapour measurement, and design principles for fieldassessment of vapours at potentially impacted sites areevolving continuously. Internationally (e.g. ASTM 2008;ITRC 2007a; US EPA 2002) and in Australia (NEPC-ASC2006; NSW DECC 2009) jurisdictions are recognisingthis and are issuing or planning to issue guidance onvapour assessment.
Currently no national guidance is available in Australia,and a variety of methods and approaches are adoptedand used. Review and compilation of approaches andtechniques used for vapour assessment seems warranted.Beyond the initial Australian review compiled by Davis,Trefry and Patterson (2004) and guidance from the US EPA (2002), there is a large body of additional research and issued guidance to draw upon (e.g. API 2005; ASTM2008; ITRC 2007a, 2007b; Golder Associates 2007;GWMR 2009; McHugh & Nickels 2008; NEPC-ASC2006; NSW DECC 2009; US DoD 2009).
1.2 Australian context and scope of report
Recommendation 16 from the National EnvironmentProtection (Assessment of Site Contamination) Measure(NEPM-ASC) variation team states (NEPC-ASC 2006):
‘Update the Western Australian Department ofEnvironment and Conservation review of models and field methods on the assessment of volatiles.Select and adopt as interim guidance in the NEPM a model(s) and field methods most suited to Australian conditions’.
The Western Australian Department of Environment and Conservation (WA DEC) review (Davis, Trefry &Patterson 2004) provided a status report on vapourbehaviours, vapour data observed under Australianconditions, some discussion of vapour assessmenttechniques, and an overview of available models. Toaddress the ‘modelling element’ of Recommendation 16, Davis, Trefry and Patterson (2009) reported on acomparative review of two vapour modelling approaches.Based on a variety of criteria, they recommended theJohnson and Ettinger (1991) modelling approach, asapplicable to Australian conditions for development ofTier 1 health-based screening levels (HSLs). HSLs usingthis approach were subsequently reported in Friebel andNadebaum (2009).
This report does not address vapour modelling per se,although some references deal with modelling. In thisreport we address the other element of Recommendation16 – field methods for assessment of vapours specificallyfor Australia. Primarily the methods discussed are targetingchronic low levels of vapour concentrations, but somemention is made of methane which can sometimes be at percent by volume levels in soils.
This report does not explicitly distinguish, but does referto two types of vapour compounds:
1. those that biodegrade under oxygenated (aerobic)soil conditions, such as petroleum hydrocarbons like benzene, ethylbenzene, toluene and the xyleneisomers (BTEX), or some other halogenated organicvapours such as vinyl chloride, and
2. those that do not readily biodegrade under aerobicconditions, such as tetrachloroethene (PCE) ortrichloroethene (TCE).
1. Introduction

1. Introduction
CRC CARE Technical Report no. 13 Field assessment of vapours2
The distinction is made to allow consideration ofbiodegradation as an amelioration process whenconsidering vapour risks. As such, the measurement of oxygen (and perhaps other major gases) may berequired. Risk reduction due to biodegradation has notbeen generally adopted in the past, but increasingly thisis occurring – as reported across a number of jurisdictionsin the United States of America and in Canada (GolderAssociates 2008). They have mostly adopted a tenfoldreduction in risk due to biodegradation of petroleumhydrocarbons. Davis, Trefry and Patterson (2009)suggested that aerobic biodegradation be considered as part of a screening (Tier 1) assessment for petroleumhydrocarbon vapours, and recently Davis, Patterson and Trefry (2009a) recommended how this might beimplemented. Additionally, ASTM (2008) specificallyprovides guidance that distinguishes degradable fromnon-degradable vapours.
Here we largely focus on hydrocarbon and halogenated(e.g. chlorinated) hydrocarbon vapours. The majority of the discussion pertains to organic vapours. It is notedhowever, that many of the issues for organic vapours are common to those observed for radon (apart frombiodegradation phenomena and the typical distribution of vapour sources), and perhaps mercury vapour. Thereis a large body of literature related to radon behaviourand exposures that can be used to assess aspects oforganic vapour exposures. Some of the radon literatureis referenced in Davis, Trefry and Patterson (2004).Further discussion of radon is excluded from this report.
This document provides information on vapour fateprocesses and behaviour, available vapour assessmentguidance, a vapour assessment framework, guidingprinciples for assessment, and assessment techniquesfor vapours to help define exposures and risk. Gaps inunderstanding of vapour-related processes are mentioned.

CRC CARE Technical Report no. 13 Field assessment of vapours 3
Fundamental understanding of the potential behaviour of vapours in the subsurface and in close proximity tobuildings, and the development of a sound conceptualsite model (CSM), are important in framing the approachto assessing vapour issues and where required, whatand where to measure during a vapour field assessment.
Overall, it is important to identify what is to be evaluatedor protected. Is it (i) inhalation exposure targeting chronic(long-term) low levels of vapour concentrations, (ii)potentially higher concentration acute (short-term)exposures, (iii) potential accumulation of explosive/flammable levels of vapours in enclosed spaces, or someother aspect? Here the issue of chronic (long-term) lowlevels of vapour concentrations is the main focus, but themethods presented may be applicable to alternate foci.In addition, the approach taken may differ if a site is to be assessed where buildings are present and will remain on a site compared to the case whereredevelopment is planned and land use and buildingconfigurations change.
2.1 Conceptual site modelTo frame a CSM, historical information about a site useand landform and basic hydrogeological/soil conditionsare required, along with climatic conditions, the regionalsetting, water table levels, potential chemical storage anduse, and surface features. Many of these aspects shouldbe determined as part of a preliminary (site) investigation(PSI) or Phase I environmental site assessment (Phase I
ESA). For vapour intrusion assessment, additional detailsabout buildings or planned buildings may be important –including building plans that may define subsurfaceutilities, the foundation construction, and the ventilationand heating capacity. These should also be consideredas part of a Phase I ESA where vapours are to beassessed at a screening level.
CSMs can be expressed in writing or as a diagram, bothof which commonly contain:
• assumptions about a source and nature of the vapours
• a pathway through the soil profile (usually driven bydiffusion at deeper depths and possibly convection at shallower depth)
• the types and number of buildings or plannedbuildings on a site
• various exchanges with a building or planned buildingfrom sub-foundation to air exchange above ground, and
• in some cases the receptor.
Figures 1–6 are all schematics that have been developedto represent vapour intrusion scenarios and CSMs.Some depict the source-pathway-receptor approachexplicitly (see Figures 2 and 5).
Figure 1 emphasises the multiple residential dwellingconstruction types (slab-on-ground, crawl-space,basement) above vapour sources that might be mobile or residual non-aqueous phase liquid (NAPL), orgroundwater. Note that all dwellings depicted are single storey houses.
2. Conceptual site model and vapour behaviour
Figure 1. Conceptualisation – modified after US EPA(2002) schematic of vapour intrusion.

Figure 2 depicts two storey dwellings and a building,includes receptors (but not children), and the depictionseems to imply that the source is mostly below the water table.
Figure 3 incorporates many more processes, and alertsthe viewer to the possibilities when dense NAPLs (DNAPLs)are present leading to deeper groundwater impacts, torecharge processes that may influence vapour fluxesfrom groundwater, and to lateral vapour movement. Thedepiction more directly implies an influence of buildings
on vapour behaviour, and suggests that commercial and multi-story buildings should also be considered. It also depicts a buried drum scenario whereby vapoursand/or leachate may migrate and subsequently impactgroundwater or a soil gas phase. Additionally, it indicatesthe potential for the attenuation of vapour impact onnearby buildings due to lateral separation of a propertysome distance from the original vapour source. Thisaspect is gaining increasing attention (see e.g. ASTM2008 and later discussion).
CRC CARE Technical Report no. 13 Field assessment of vapours4
2. Conceptual site model and vapour behaviour
Figure 2. Conceptualisation – modified from ITRC (2007a), andused as logo for the US EPA National Forum on Vapor Intrusionheld in Philadelphia, PA on 12–13 January 2009.
Figure 3. Conceptualisation – from Abreu and Ettinger (‘Understanding theConceptual Site Model for Vapour Intrusion into Buildings’, US EPA National Forumon Vapor Intrusion, 12–13 January 2009, Philadelphia, PA).

Figure 4 is a focused depiction of processes and zonesor pathways of vapour migration, with some added detailaround processes. This figure will be discussed in somedetail in Section 2.2.
Figure 5 shows highly sensitive receptors such as a child and baby, but also in this depiction the receptorsdominate the graphic, along with the leaking drums –both features that might evoke a greater perception of a threat to receptors.
CRC CARE Technical Report no. 13 Field assessment of vapours 5
2. Conceptual site model and vapour behaviour
Figure 4. Conceptualisation – modified after a graphic producedby Professor Paul Johnson.
Figure 5. Conceptualisation – from ITRC (2007a).

Figure 6 provides even greater detail of physicalprocesses – focusing on vapours emanating fromgroundwater through a capillary fringe, and movementthrough foundation structures such as cracks andfoundation gaps, and possibly diffusion through thefoundation, with circulation occurring between areasinternal to the house.
For a CSM all aspects depicted here could be importantat a site. Note that Figures 1–6 are all depicted as two-dimensional depth sections. Consideration should begiven to the proximity of the site to other features, suchas other buildings, vacant land, vegetated areas, pathways,industrial activities, parking areas, or other topographicalfeatures such as roads, wetlands or topographic highpoints. These could be depicted in a complementaryplan sketch or plot. Transient effects may also play a role,so some sense of the scale of such influences may beimportant to consider in a CSM word or graphical sketch.
Note too that no depiction presented in Figures 1–6considers utilities and services to the buildings, such as sewer lines, electricity, plumbing, etc. These can playa critical role as conduits for vapours, especially wherevolatile chemicals have been discharged to sewer lines,
and where such lines leak and where sewer lines andconduits connect to adjoining or multiple buildings. Thepotential for such aspects should be incorporated intoCSM depictions.
Once a CSM is developed, additional data collection andinterpretation should be targeted at validation and/orrefinement of the CSM.
2.2 Vapour behaviourIn establishing a CSM for vapours, and in devising anysampling plan for vapours, it is useful to understand keyvapour behaviours and regions or zones of the soil/buildingcontinuum in which vapours may behave differently.Roggemans et al. (2001) and Davis, Patterson and Trefry(2006) describe typical depth profiles of vapours thatthey observed. Figure 4 shows some of the zones ofinterest (source zone, soil zone and building zone) thatmay need to be considered for assessment of vapourrisks. Here we summarise the primary active processesthat transport vapours from a subsurface source towardsthe ground surface, and ultimately lead to concentrationestimates in buildings. A number of models of vapourbehaviour embody these main processes. Note thatvapour model estimates have typically been shown to be quite conservative, in that models largely overestimatethe concentration of vapours, particularly petroleumvapours in buildings. This suggests the need to betterunderstand the underlying processes governing vapourbehaviour and the soil/building/atmosphere parametersthat may be applicable in models.
We provide example data to illustrate potential vapourbehaviour. Greater detail can be found in Davis, Trefryand Patterson (2004) and other references.
2.2.1 Source zone
Vapours emanate from source zones at some depthbelow ground surface in groundwater or the soil profile(see Figure 4). This zone can extend from the groundsurface, may have multiple layers if the soil profile islayered, and may contain multiple compounds. Theremay also be multiple source zones present within theprofile, in groundwater or spread across a site.
Vapours partition from sources into an air phase either:
• by desorption from soil organic matter, based on thesorption coefficient and the fraction of organic carbonin the soil
CRC CARE Technical Report no. 13 Field assessment of vapours6
2. Conceptual site model and vapour behaviour
Figure 6. Conceptualisation – from ITRC (2007a).

CRC CARE Technical Report no. 13 Field assessment of vapours 7
2. Conceptual site model and vapour behaviour
• from groundwater plumes, based on the Henry’s Lawpartitioning coefficient between water and air (andother factors, like the depth of the plume below thecapillary fringe – see e.g. Barber et al. 1990), and/or
• from non-aqueous phase liquids (NAPL), based on the vapour pressure of the volatile compounds in theNAPL and the mole fraction of the compound ofinterest (and other factors).
The partitioning processes can all occur concurrently. In addition, further sorption and desorption of vapours to soil organic matter can occur as vapours migratewithin a soil profile. Details on these processes can be obtained elsewhere, some of which are described in Davis, Trefry and Patterson (2004).
The source type (e.g. fuels like gasoline, crude oil, diesel;or solvents like tetrachloroethene (PCE), trichloroethene(TCE)) and the partitioning processes govern the finalvapour concentration (and composition) observed in theair phase near the source zone. This source vapourconcentration can be estimated based on knowing theparameters that relate to the partitioning process and the source conditions, or can be measured more directlyvia soil gas sampling. Either approach to determining the source vapour concentration has advantages anddisadvantages. Equations and example calculations aregiven in Appendix A.
For vapours emanating from a groundwater source,vapour fluxes through an overlying soil profile may be much reduced. Diffusion through a water phase is 1000 – 10,000 times less than in an air phase. Davis andBarber (1989) and Barber et al. (1990) document suchtransitions for methane and other compounds as theymove from a dissolved plume below the water table,through the capillary fringe and through the overlying soil profile towards ground surface. Recently, the muchreduced vapour fluxes from groundwater sources havebeen emphasised when considering distances to vapoursources as screening criteria (e.g. ASTM 2008, and seeSection 3). Consequently, dissolved groundwatersources may be at much closer distances to a propertyor building and not pose an unacceptable human healthrisk, compared to soil or NAPL sources of vapours. Thisis particularly true for petroleum hydrocarbons thatbiodegrade aerobically.
To distinguish between groundwater and other vapoursources in applying screening criteria, additionalinvestigations may be required to have enough certaintyof subsurface conditions, and the source distribution.
2.2.2 Deep soil profile zone
Primarily, transport of vapours from the source zone (seeFigure 4) vertically upwards through the bulk of the soilprofile is dominated by diffusion processes. Duringtransport the vapours will continue to partition betweenwater, air and soil organic matter phases and will tendtowards the establishment of equilibrium concentrationsin all phases. Concurrently, atmospheric gases andgases produced from biological processes (e.g. nitrogen,oxygen, carbon dioxide, methane) will also move viadiffusion in this zone. Figure 7 shows an example depthprofile for petroleum hydrocarbon vapours and majorgases through a sandy soil where the only vapour sourceis deeper than 2.25 m below ground.
2.2.3 Shallow near-surface soil zone
In the shallow near-surface zone advection, diffusion and aerobic biodegradation are all probable transportand attenuation mechanisms for vapours (see Figure 4).Advection occurs due to (usually small) pressuredifferences between that found in the soil and that aboveground surface either in the dwelling, or in open groundconditions. The pressure difference may be due to activitieswithin the building (e.g. heating/cooling, opening andclosing of doors/windows, air conditioning), or climatic
Figure 7. Example depth profiles of total petroleumhydrocarbon (TPH) vapours and major gases (oxygenand carbon dioxide) with a vapour source zone at2.25–3.25 m below ground.

2. Conceptual site model and vapour behaviour
CRC CARE Technical Report no. 13 Field assessment of vapours8
and other conditions external to the building (e.g. wind,barometric pressure changes, temperature changes). In this zone, advection can accelerate movement ofpersistent vapours into the building, and positive pressuredifferences may impede movement of vapours intobuildings. Diffusion also continues to act as a transportmechanism in this zone.
Aerobic biodegradation of petroleum hydrocarbons ismost active in this zone because oxygen moves into thesoil through the ground surface from the atmosphereabove. Figure 7 shows oxygen ingress over a shallowdepth of 1.25–1.50 m, and petroleum vapours decreasingto non-detectable concentrations at this same depth inthe soil profile. These observations and carbon dioxideaccumulation in the soil profile are all indicators ofpetroleum vapour biodegradation.
Chlorinated hydrocarbon vapours will not necessarilybehave in the same way, however some, like vinyl chloride,may biodegrade aerobically (e.g. Davis & Carpenter1990). Figure 8 shows tetrachloroethene (PCE) vapourconcentrations penetrating to ground surface, whilepetroleum hydrocarbons (TPH) in the same profiledecrease to below detectable concentrations at depthsof 1.5–2 m below ground surface due to aerobicbiodegradation – even though source concentrations forthe TPH are 30 times greater than those for PCE. PCE at this site could be inferred to have a greater potentialfor accumulation in buildings and posing risk at groundsurface despite the source concentration contrast.
Additionally, in this shallow near-surface zone the buildingitself may influence the distribution of vapours. If theground surface is well sealed from the atmosphere it mayincrease the potential for vapour accumulation at shallowdepths in the soil profile. Hydrocarbon vapour data frombeneath a slab-on-ground building shows this effect(Figure 9). At the edge of the structure oxygen penetratesand/or vapours escape through the ground surface. Nearthe centre of the building vapours accumulate beneaththe underside of the slab where vapours can potentiallymove into and out of the building (due to transient pressurechanges) through cracks in the building’s foundations.Details can be found in Patterson and Davis (2009) andalso some discussion of the effects of buildings onpetroleum hydrocarbon biodegradation can be found in Davis, Trefry and Patterson (2009).
2.2.4 In the building
Vapours that migrate into the building (see Figure 4) mix with air that is in the building. Air in the building mayeither be trapped or may be part of a gaseous exchangebetween the building volume and the external atmosphere(usually of lower chemical concentration). Mostly, buildingsare assumed to be well mixed environments, and assuch concentrations throughout a building may beassumed uniform. In multi-storey buildings this may notbe the case, or where the building is compartmentalised.
Figure 8. Example PCE and TPH vapour, and oxygendepth profiles.
Figure 9. Petroleum hydrocarbon vapour depthcross-section section beneath a slab-on-groundbuilding. The vapour data are contoured based onconcentrations determined at each of the monitoringlocations. Overlain are a depiction of potentialoxygen ingress and the potential zone of aerobicbiodegradation.

2. Conceptual site model and vapour behaviour
CRC CARE Technical Report no. 13 Field assessment of vapours 9
Figure 10. Temporal variations in oxygen and total petroleumhydrocarbon vapour (Hc) concentrations determined usingoxygen and VOC probes buried 0.5 m below ground.
2.2.5 Additional zones
In some models, additional zones might be included. For example, an additional crawl-space may be specifiedbeneath the floor of the house and above the groundsurface. In this case, the exchange of vapours is controlledby conditions at the ground surface, the air exchangerate in the crawl-space, and the flux of vapours from thecrawl-space to the interior of the house above the crawl-space. Another example of an additional zone is thetransition zone in the soil profile within which biodegradationmay vary from high to low. This sometimes correspondswith the zone over which oxygen concentrations transitionfrom atmospheric at ground surface to low concentrationsat deeper depths (0–1.5 m in Figure 7), and through ananaerobic zone nearer the source of vapours (1.5–3.25 min Figure 7).
2.2.6 Other considerations
Transient issues may be prominent at shallow depths.Vapour and gas profiles can be influenced by daily anddiurnal changes in barometric pressures, temperatureetc. and seasonal effects – an example is given in Figure 10. When sampling in the subsurface, mostguidance (see Section 3) advises sampling below 1 mand sometimes 5 feet (~1.5 m) to avoid biasing samplesdue to such transients. Shallower sampling points (< 1 m deep) may be warranted to determine if thevapour intrusion pathway is complete, but sampling over time may be required to confirm data.
API (2005, p. 6) also discusses the characteristic time ittakes for a soil gas profile to reach steady state (equilibrium)from a step change in the source concentration. Thetime scale is proportional to the square of the depth tothe source of the vapours and linearly proportional to theinverse of the diffusion coefficient (see Appendix A forexample calculations). Times may range from days for a high (0.4) air-filled porosity soil with a shallow depth tothe source (1 m), up to ~3.5 years for a low (0.1) air-filledporosity soil with a deeper depth to the source (say, 4 m).Higher retardation coefficients will increase these timesproportionally. Such characteristic times are useful toestimate the time to equilibration from an initial release of a vapour source, but overestimation may occur due to seasonal effects. Distinct seasons may lead to wettingand drying of the soil profile, inhibiting vapour movementwhen wet and allowing shallower penetration of vapourswhen drier (see, for example, Davis et al. 2005), but are unlikely to create a step change in vapour sourceconcentrations – a gradual change may be expected. As such, times estimated using the approach inAppendix A could be overestimates of the time forgradual transition to a new steady state (equilibrium).

CRC CARE Technical Report no. 13 Field assessment of vapours10

There are several guidance documents available forevaluating the vapour exposure pathway and related tovapour assessment, however most have been developedoverseas and in particular in the United States of America.The documents discussed here are only representative ofa wide range of similar documents now used by regulators,industry and consultants around the world. They reflectthe present scientific understanding of subsurface vapourbehaviour, assessment and risk processes. Some arealso summarised in Table 2.
3.1 Australian guidanceThere is limited Australian guidance on the fieldassessment of vapours.
3.1.1 National Environment Protection (Assessment of SiteContamination) Measure
The National Environment Protection (Assessment of Site Contamination) Measure (NEPM-ASC) was formedin December 1999 (NEPC-ASC 1999). This is currentlybeing varied (revised). It has no specific sections devotedto the investigation of vapours, but the overlying principlesof staged site investigation apply.
The NEPM includes two Schedules – Schedule A whichgives a general strategy for site investigation, andSchedule B which provides particular sub-schedulescontaining detailed guidance for site assessment.Schedule A indicates that site assessment shouldprogress in a staged way, from a preliminary (site)investigation (PSI) involving data quality objectives (DQOs),site history, review of local geology and hydrogeology,and establishing a sampling strategy and samplingpattern for soil and groundwater contamination. The PSIalso may commonly involve some preliminary intrusivesampling of a site, since such site data are compared toinvestigation levels (IL) defined in the NEPM-ASC. If soilor groundwater concentrations determined from the siteexceed the health, groundwater or ecological investigationlevels (HILs, GILs, EILs), then a next stage of detailed site investigation (DSI) is required.
Schedule B includes guidance on investigation levels,data collection and sampling, laboratory analysis,ecological and health risk assessments, communityconsultation and more. Schedule B (2) documentsguidelines for data collection and in particular sampledesign and reporting for soil and groundwater, but notsoil gas. A weighting towards shallow soil sampling isadvised where ecological and health risk assessmentsare required. Deeper soil sampling to determine thenature and potential longevity of a source of vapoursmoving through the soil profile is noted.
As indicated earlier, the current variation of the NEPM will consider in greater detail vapour risk and assessment(NEPC-ASC 2006).
3.1.2 NSW DECC
In February 2009, the New South Wales Department of Environment and Climate Change issued a ‘Draft forconsultation only’ Guidance Note on Vapour Intrusion(NSW DECC 2009). This was drafted to address the gapseen in advice to consultants around field assessment of vapours. It is currently being updated and finalised.
It points to the US EPA (2002) and ITRC (2007a, 2007b)guidance, notes the importance of a conceptual sitemodel, provides descriptions of sampling methods, andprovides indications of the scope of sampling (number,locations, depths, timing) that may be warranted in avapour assessment. It suggests that attention be paid to subsurface barriers and conduits, hot spots, sub-slabsampling and multi-slab conditions, internal housestructures and seasonal sampling. It promotes a weight-of-evidence approach – suggesting the recovery of arange of samples from multiple locations.
This Guidance Note was only issued as draft and forconsultation purposes. It is cited and summarised herewith permission from the NSW DECC, and as notedabove, it is currently being updated and finalised.
CRC CARE Technical Report no. 13 Field assessment of vapours 11
3. Guidance documents

3.1.3 Standards Australia
AS (1999) provides some detail on the precautions andmethods for reliable sampling of volatile compounds insoils, including an overview of soil gas sampling protocols.It emphasises that soil type may play a significant role indesign and practice of soil gas sampling – it raises issuessuch as recoverable soil gas volumes during sampling in tight soils, sealing of permanent boreholes to avoidshort-circuiting and leakage and the use of inert sampling materials.
3.2 Overseas guidance,standards and information
3.2.1 US EPA
The US EPA (US EPA 2002) developed Draft Guidancefor Evaluating the Vapor Intrusion to Indoor Air Pathwayfrom Groundwater and Soils (Subsurface Vapor IntrusionGuidance). This contains screening level assessmentsand was not initially recommended for assessment ofunderground storage tank sites, because it containedconservative assumptions not necessarily applicable to petroleum hydrocarbons, e.g. no biodegradation.
It explicitly outlines a three Tier (Tier 1, 2 and 3) structurefor investigation and assessment of potential vapourintrusion at a site – Tier 1 being an initial screening stage,where little or no quantitative site information is required.
It proceeds to lead the user through a series of questionsrelated to the assessment process and leads through thethree Tier approach based on answers to the questions.Sampling and measurement techniques are included inappendices to the draft guidance.
For Tier 1, three questions in the draft guidance focusedon identifying (US EPA 2002, p. 14):
• if chemicals of sufficient volatility and toxicity arepresent or reasonably suspected to be present
• if inhabited buildings are located or are planned to be located above or in close proximity to subsurfacecontamination, and
• if current conditions warrant immediate action.
Interestingly, US EPA (2002, p. 8) recommends:
‘you consider the possibility of exposure by thispathway if you have or suspect the presence in soil or groundwater, of volatile chemicals (Henry’s LawConstant > 10-5 atm m3/mol) at your site as follows:
• located 100 feet or less in depth; or
• located in close proximity to existing buildings or future buildings; or
• to the expected footprint of potential future buildings.’
Close proximity (related to the statements on pages 8 or 14) was stated to be within 100 feet (~30 m) in thevertical or laterally.
This page 8 statement implies a pre-Tier 1 step wherebya site or building can be excluded from further investigationwhen it is beyond a specified distance from a vapoursource. ASTM (2008), described in this Section, formalisesthis approach.
US EPA (2008) outlined vapour intrusion considerationsfor redevelopment of brownfield sites. It describes theimportance of a conceptual site model, and itemisessome sampling strategies for soil gas largely pointing to ITRC (2007a), US EPA (2002) and other guidance forgeneral approaches and methods. It provides a tabulationof state regulatory guidance.
3.2.2 ASTM International
Note that ASTM was formerly the American Society forTesting and Materials (ASTM). It is now ASTM International.ASTM (1992) provides guidance on soil gas monitoring in the vadose zone. This was re-approved in 2001. Thisprovides guidance on ‘sample recovery and handling,sample analysis, data interpretation and reporting’.Previous general guidance was published by ASTM, such as ASTM (1995 and re-approved in 2002) which isthe US standard guide for risk-based corrective actionapplied at petroleum release sites (RBCA). It wasdeveloped by ASTM in response to the need to prioritiseaction at petroleum release sites. The guidance soughtto establish a tiered approach to site characterisationand possible remediation based on the use of thresholdvalues that may dictate additional or no further action at an impacted site.
The approach sought to account for all potentialexposures and risks, and so eliminate some sites fromfurther investigation while focusing efforts where thresholdvalues and risks were exceeded and unacceptable. Thiswas termed risk-based corrective action since the riskbecame the driver of the decision for further action andpossibly remediation rather than default values for soilsand groundwater. In essence the approach required thedevelopment of alternate and more specific (although not
3. Guidance documents
CRC CARE Technical Report no. 13 Field assessment of vapours12

necessarily site-specific) threshold values for action basedon modelled exposure pathways, default parameters,aquifer/soil type, land use and other assumptions.
More recently ASTM (2008) was developed whichprovides guidance on vapour assessment at sites of realestate transfer. It defines a procedure rather than technicalmethods that should be adopted. It points to ASTM(2005) which describes phased investigations at sites for more detail on methodologies.
ASTM (2008) defines a vapour intrusion condition (VIC),and the standard provides guidance on defining if a VICoccurs on a parcel of real estate through vapour intrusionassessment procedures. The standard also defines apotential VIC (pVIC), where there is:
‘the potential for the presence or likely presence ofany chemical of concern in the indoor air environmentof existing or planned structures on a property causedby the release of vapor from contaminated soil orgroundwater either on the property or within closeproximity to the property, at a concentration thatpresents or may present an unacceptable health riskto occupants.’
This definition would seem to equate with commonunderstanding of a potential vapour risk.
ASTM (2008) discusses the information stream requiredto assess if a site has a VIC or pVIC at a Tier 1, Tier 2,Tier 3 and Tier 4 (mitigation) level. At Tier 1, it describes a ‘critical distance’ assessment, and states:
‘If the lineal distance in any direction from the nearestedge of a contaminated plume to the nearest existing or planned structure on the target property, or to thenearest target property boundary if there are noplanned structures on the target property, is less than100 feet, except for dissolved petroleum hydrocarbonchemicals of concern in which case if the linealdistance is less then 30 feet, then it is presumed that a pVIC exists.’
Based on the level of confidence in site conditions andinformation available on chemical distributions in thesubsurface, this provides a Tier 1 exclusion/screeningcriterion for sites that are beyond these distances. Thestandard prescribes screening or exclusion distancesthat are different for dissolved or light NAPL (LNAPL)vapour sources, and are different for aerobicallybiodegradable (e.g. petroleum hydrocarbons) and non-degradable vapour sources. A summary is given in Table 1.
CRC CARE Technical Report no. 13 Field assessment of vapours 13
3. Guidance documents
Table 1. Summary of ‘critical distances’ beyond which a site may be excluded from further assessment underASTM (2008).
Vapour source Critical distance Comments
Dissolved plume – 100 feet (or ~30 m)non-degradable
Dissolved plume – petroleum 30 feet (or ~9 m) Aerobic biodegradation is assumed to occur hydrocarbon (biodegradable) in the vadose zone above the source
NAPL – petroleum 100 feet (or ~30 m) Aerobic biodegradation is assumed to occur hydrocarbon (biodegradable) in the vadose zone above the source
NAPL – non-degradable Not specified at Tier 1

3. Guidance documents
CRC CARE Technical Report no. 13 Field assessment of vapours14
If a property is within the critical distance and a pVIC isdeemed, then a Tier 2 Risk-Based Concentration Test isrecommended – whereby concentrations at the site arecompared to regulatory RBC levels which are like HILs inAustralia. If the site concentrations are below the RBCAlevels then a pVIC is presumed not to occur at the site,and no further action is warranted. Tier 3 and 4assessments are also described in ASTM (2008).
Throughout, the ASTM standard provides caveats andwarnings related to situations that may warrant exceptionsto these rules, but in all cases the standard requires cleardocumentation of decisions in assigning or not assigninga pVIC or VIC to a site. It also defines the minimalinformation requirements for each Tier assessment.
3.2.3 ITRC
ITRC is the Interstate Technology and Regulatory Council,made up of member states of the United States ofAmerica. The reports they produced in 2007 (ITRC 2007a,2007b) provide a practical approach to assessment ofthe vapour intrusion pathway. They present a 13-stepapproach that progresses from ‘Is there an acuteexposure?’ to ‘Is mitigation warranted?’.
It describes a screening process to define if the vapourpathway is incomplete, and for comparison to screeninglevel criteria (such as Australian HILs). This allows screeningof sites that do not pose a risk. Beyond that ITRC(2007a, 2007b) provide guidance on subsequent stagesof assessment including vapour intrusion investigativetechniques, and if required, mitigation options.
Comprehensive documentation is provided of samplingmethods and techniques for soil gas, groundwater plumedelineation and indoor air. In addition, analytical approachesare discussed, along with quality assurance/qualitycontrol (QA/QC) and data reporting suggestions.
For soil gas, they suggest sampling at 5 feet (~1.5 m) or deeper, and if shallower, that repeat samples aretaken. A minimum of one sample per building on a site is suggested. If a basement is present, measuring avapour depth profile adjacent to the basement wall isrecommended. Depth profiles are noted as requiring aminimum of three sampling depths (fewer for shalloweraquifers), and that depth profiles are useful fordetermining source (maximum) vapour concentrationsand for determining attenuation potential. They note thatsample density is a site-specific issue – ‘sufficient soilgas samples … to make appropriate decisions’. The
guidance suggests sampling beneath (and/or within) a structure if the vapour source is beneath the structure, if feasible to do so, but sampling beside and away from the structure if the vapour source is located somedistance laterally. It suggests not sampling soil gasimmediately after precipitation.
For indoor air sampling in a standard house, one sampleper storey of the house is recommended to be taken at breathing height about 3–5 feet (~1–1.5 m) above thefloor. They recommend that additional samples be takenin basements or crawl-spaces.
The ‘preliminary screening phase’ (Tier 1) in the ITRCguidance suggests that some sites will be removed fromfurther assessment if it is demonstrated that:
• the exposure pathway is and will remain incomplete
• the chemicals of concern are not deemed sufficientlyvolatile (as defined by the regulatory agency) to pose a hazard, or
• the concentrations of the volatile chemicals fall belowgeneric screening levels.
These are variants of the screening criteria described in US EPA (2002).
3.2.4 Canada
Golder Associates Ltd (2007) developed draft guidancefor Health Canada to assist with environmental sitecharacterisation for human health risk assessment. Thiscontains significant material devoted to vapour assessmentprocedures and methods, both subsurface sampling andindoor sampling advice.
The report outlines the need for a CSM and studyobjectives that drive a sampling approach and design. Itoutlines soil gas probe construction and sampling/analysisprocedures, quality assurance and quality controlguidelines, and data validation and interpretation.
On sampling, the guidance suggests samples should betaken on at least two sides of a building and within 10 mof the building, that samples should be collected ≥ to 1 mbelow ground and the mid-point from the foundation tothe vapour source, but 0.5–1 m above a water table (toavoid inundation and to maximise vapour concentrationdata), and that sampling should be repeated. It alsoindicated that soil depth profiles may be obtained atselected locations for increased confidence and if thevapour source is laterally removed some distance fromthe site.

CRC CARE Technical Report no. 13 Field assessment of vapours 15
3.2.5 United Kingdom
There appears to be limited guidance on vapourassessment in the United Kingdom, although there is aVOCs handbook that was released in July 2009 (CIRIA2009). There has been a strong emphasis on ground gas hazards (CIRIA 2007) in the United Kingdom – whichrelate primarily to methane in soil gas that may be anexplosive hazard, but also carbon dioxide, hydrogensulphide and carbon monoxide risks. CIRIA (2007) refers to vapours, but directs further investigations to the US EPA (2002) draft and UK EA (2005). The UK has welldeveloped guidance on vapour intrusion modelling(Evans et al. 2002).
In CIRIA (2009) a three-tiered risk assessment approachis described. It includes: (i) a preliminary risk assessmenteffectively based on a Phase I ESA, (ii) a genericquantitative risk assessment based on site investigationdata and possible use of generic screening criteria, and(iii) a detailed quantitative risk assessment based onfurther intrusive site investigations and data. It outlines a vapour investigation strategy, and a broad range ofexploratory and analytical techniques. CIRIA (2009)stresses the need to consider site-specific issues, and to be guided by the CSM and DQO developed for thesite. For soil gas sampling, they recommend targetingpotential hot spot locations, points of potential exposure,and uncontaminated areas to obtain soil gas background.API (2005) is referenced for guidance on locations andsampling systematics.
3.2.6 Other jurisdictions of the UnitedStates of America
US EPA (2008) tabulates state regulatory guidance – 21states are listed as having vapour intrusion guidance asat the publication date of March 2008. These are collatedin Appendix B.
Eklund et al. (2007) summarised vapour intrusionapproaches across many states of the United States of America. They included 23 states – 17 of which hadindividual guidance documentation, and six of whichlargely deferred to the US EPA (2002) draft guidance.Since that time, additional guidance has appeared forKansas (and others – see e.g. US EPA 2008), whichwere not included in the 23 states reviewed. Eklund et al.(2007) notes that a number of states (California, Colorado,New Hampshire, New Jersey, Pennsylvania) use thedistance from a source to potentially exclude sites from further assessment (as per the later ASTM 2008standard). Kansas and Minnesota have recently adoptedthis exclusion distance approach (Kansas DHE 2007;Minnesota PCA 2008). Soil, soil gas or groundwaterconcentration screening criteria developed across theseStates are also summarised by Eklund et al. (2007), withstates having screening concentrations for between 5 and >130 volatile organic compounds.
At a regional governmental scale, a number of otherjurisdictions in the United States of America developedvapour guidance. For example, the County of San DiegoDepartment of Environmental Health (2004) developed a Site Assessment and Mitigation (SAM) Manual, whichoutlines soil vapour sampling guidelines. DTSC (2005,2009) also describes vapour guidance developed forCalifornia, most recently related to vapour risk mitigation.
3. Guidance documents

3. Guidance documents
CRC CARE Technical Report no. 13 Field assessment of vapours16
Ref
eren
ceS
trat
egy
(S)
CS
MD
QO
Sam
plin
g g
uid
ance
Tech
niq
ues
and
/or
Tech
niq
ues
(T)
US
EPA
(200
2)
S m
ost
lyY
Y•
Take
so
il g
as o
r g
roun
dw
ater
sam
ple
s ≥
5 fe
et (1
.5 m
) bel
ow
foun
dat
ion
AS
TM
(2008)
SY
YR
efer
ence
s o
ther
gui
dan
ce
Gold
er
S a
nd T
YY
•Ta
ke s
amp
les
on ≥
tw
o si
des
of a
bui
ldin
g an
d w
ithin
10
m o
f the
bui
ldin
g
Ass
oci
ates
•
Sam
ple
≥ 1
m b
elo
w g
roun
d a
nd ≥
the
mid
po
int
fro
m t
he fo
und
atio
n Lt
d (2
007)
to t
he v
apo
ur s
our
ce, b
ut 0
.5–1
m a
bo
ve a
wat
er t
able
•S
amp
ling
sho
uld
be
rep
eate
d
•S
oil
dep
th p
rofil
es s
houl
d b
e o
bta
ined
•P
oss
ibly
tw
o s
ub-s
lab
sam
ple
s if
req
uire
d
•In
do
or
air
stra
teg
ies
ITR
C (2
007a,
S
and
TY
Y•
Sam
plin
g a
t 5
feet
(~1
.5 m
) or
dee
per
. If
shal
low
er r
epea
t sa
mp
ling
2007b
)•
≥ o
ne s
amp
le p
er b
uild
ing
on
a si
te is
sug
ges
ted
•M
easu
re a
vap
our
dep
th p
rofil
e ad
jace
nt t
o t
he b
asem
ent
wal
l if p
rese
nt
•If
req
uire
d, d
epth
pro
files
req
uire
≥ t
hree
sam
plin
g d
epth
s (fe
wer
for
shal
low
er a
qui
fers
)
•D
epth
pro
files
use
ful t
o fi
nd m
axim
um v
apo
ur c
onc
entr
atio
ns a
nd t
o
asse
ss a
tten
uatio
n p
ote
ntia
l
•If
feas
ible
sam
ple
ben
eath
a s
truc
ture
if t
he v
apo
ur s
our
ce is
ben
eath
it
•S
amp
le b
esid
e/aw
ay fr
om
a s
truc
ture
if t
he v
apo
ur s
our
ce is
oth
erw
ise
•S
amp
le in
do
ors
fro
m e
ach
sto
rey,
and
at
3–5
feet
hei
ght
AP
I (2005)
TY
Y•
Co
nsid
er s
ite-s
pec
ific
issu
es
•S
amp
le a
t tw
o o
r m
ore
dep
ths
•Tr
anse
cts
and
ver
tical
pro
files
can
be
usef
ul
•S
amp
le im
med
iate
ly a
bo
ve t
he v
apo
ur s
our
ce
•S
amp
le a
dja
cent
to
the
bui
ldin
g fo
und
atio
n
•S
amp
le ≥
3 fe
et (a
bo
ut 1
m) b
elo
w g
roun
d
CIR
IA (2
009)
S a
nd T
YY
•C
ons
ider
site
-sp
ecifi
c is
sues
•B
e g
uid
ed b
y C
SM
and
DQ
O
•H
ot
spo
ts, p
oin
ts o
f exp
osu
re, an
d b
ackg
roun
d
•‘A
deq
uate
’ sp
atia
l co
vera
ge
•R
efer
s to
AP
I (2
00
5) f
or
loca
tion
and
sys
tem
atic
sam
plin
g
Tab
le 2
. Co
mp
ilatio
n o
f as
pec
ts f
rom
gui
dan
ce d
ocu
men
ts.
Larg
ely
refe
renc
es o
ther
gui
dan
ce
Ref
eren
ces
oth
er g
uid
ance
•S
oil
gas
pro
bes
•S
amp
le c
ont
aine
rs a
nd d
evic
es
•S
amp
ling p
roce
dur
es
•A
naly
sis
tech
niq
ues
•B
ackg
roun
d fo
r in
door
air
•Lo
w d
etec
tion
leve
ls
•S
oil
gas
pro
bes
•S
amp
le c
ont
aine
rs a
nd d
evic
es
•S
amp
ling p
roce
dur
es
•A
naly
sis
tech
niq
ues
•B
ackg
roun
d fo
r in
door
air
•D
etec
tion
leve
ls
•A
dva
ntag
es a
nd d
isad
vant
ages
of m
easu
rem
ents
•S
oil
gas
pro
bes
•S
amp
ling p
roce
dur
es
•A
naly
sis
tech
niq
ues
•S
om
e al
tern
ates
– p
assi
ve
sam
ple
rs
•S
oil
gas
pro
bes
•S
amp
le c
ont
aine
rs a
nd d
evic
es
•S
amp
ling p
roce
dur
es
•A
naly
sis
tech
niq
ues
•B
ackg
roun
d fo
r in
door
air
•Lo
w d
etec
tion
leve
ls

3. Guidance documents
CRC CARE Technical Report no. 13 Field assessment of vapours 17
3.3 Industry guidance andprocedures
3.3.1 American Petroleum Institute
The American Petroleum Institute (API) developed an initialguidance document in 1998 (API 1998), on Assessing thesignificance of subsurface contaminant vapor migrationto enclosed spaces – site-specific alternative to genericestimates. Subsequently, API published API (2005) whichspecifically looks at soil gas sampling from the vadosezone in relation to assessing the vapour intrusionpathway. The documents specifically focus on petroleumhydrocarbon vapours.
API (2005) discusses petroleum vapour behaviour,transport and typical subsurface depth profiles; conceptualunderstanding based on this; sampling locations, depthsand frequency; sample installations and sampling methodsalong with analytical methods and data interpretation.
In terms of sampling strategies, API (2005) emphasisesthe need to consider site-specific issues. It suggestssampling at two or more depths will increase dataconfidence, transects and vertical profiles can be usefulespecially if the vapour source is distant from the site,that a soil gas sample should be collected immediatelyabove the vapour source to obtain the highest concentrationof the chemical of concern, and that a sample beobtained adjacent to the building foundation.
Some more specific recommendations presented in theAPI (2005) document include:
• the shallowest sampling depth is recommended to beno less than 3 feet (about 1 m)
• a lateral separation distance of 100 feet (~30 m) is likelyto be sufficient for petroleum hydrocarbon impactedsites provided the vapour source edge is well defined
• soil gas data collected immediately above the sourcecan be useful in screening sites including those opensites where future buildings may be constructed, and
• sufficient time must be allowed to pass following a spillto enable vapour concentrations to establish anequilibrium prior to sampling.
3.3.2 Petroleum industry in Australia
The sampling and assessment of vapours derived frompetroleum hydrocarbon sources is undertaken by arange of consultants on behalf of major petroleumcompanies in Australia.
The petroleum industry in Australia adopts approachesand methods available in guidance, predominantly fromthe US (as summarised in Sections 3.2 and 3.3.1). Some companies provide information and guidance on approaches to the assessment of petroleum vapourissues such as the Technical Position Paper availablefrom Shell Global Solutions (2005, 2009) and AtlanticRichfield (2006). The level of detail provided varies widely,however there are many key areas that are consistent in the guidance provided. These include the following:
• a tiered approach to the assessment of petroleumhydrocarbon vapours is recommended
• acute issues should be identified and addressed first.Sampling is typically focused on high vapourconcentrations, acute exposures and hazardous(flammable/explosive) issues
• other sites where acute issues are not present, areassociated with long-term (chronic) issues and henceany sampling approaches focus on low level vapourconcentrations
• the design of a sampling program for petroleumhydrocarbons is complex. The design should addresssite-specific issues identified in a conceptual model
• sampling of vapour on petroleum hydrocarbon sitesshould be (and generally is within the industry)undertaken using a tiered approach. A number ofsampling techniques are available and recommendedfor the sampling and assessment of petroleumhydrocarbon vapours (initial sampling stages) withoutentering an existing building
• collection of indoor air data is not routinely undertaken,or recommended, due to the large range of indoorsources resulting in false positives and difficulty ininterpretation. Sub-slab data can also be affected by the movement of indoor air beneath the slab
• the use of field screening methodologies such asphoto ionisation detector (PID) or flame ionisationdetector (FID) instruments or passive samplers may be beneficial in providing a qualitative evaluation,identifying hot spots for the collection of soil gas(using quantitative methods) or screening utilitycorridors/preferential pathways

CRC CARE Technical Report no. 13 Field assessment of vapours18
3. Guidance documents
• where soil gas data is collected, the collection of datafrom close to the source and (where possible) verticallythrough the profile is recommended, particularly wherethe data is being used to assess future buildings on anexisting vacant site. Vertical profiles are recognised asuseful in characterising attenuation through the profile
• soil gas data from shallower depths (typically 1–1.5 mdepth or close to basement foundations) is suggestedfor the assessment of existing buildings
• assessment of shallow sources should be undertakenwith care (particularly where there is ingress ofgroundwater into a basement), and where representativevapour data cannot be obtained, the assessment ofvapour issues may need to rely on source (soil and/orgroundwater) concentrations
• biodegradation is an important aspect of the assessmentof petroleum hydrocarbon vapours. Data relevant tothe assessment of biodegradation potential (O
2, CO
2
and CH4) is recommended to be collected during
sampling
• the number of samples collected from a site is notfixed, however sample collection in the vicinity ofsource zones and existing buildings is typicallysuggested and undertaken
• consideration of exclusion factors, such as lateralseparation distances are suggested.
3.3.3 Consulting industry
The approach adopted by the consulting industry to the sampling and assessment of vapours is generallyconsistent with and follows guidance available from the US. Approaches to the assessment of petroleumhydrocarbon sites are addressed above. For theassessment of other sites where petroleum hydrocarbonsare not present a similar approach is adopted, howeverthe potential for degradation is generally of lessimportance (depending on the compounds of interest).Often, a wider range of sampling techniques and otherconsiderations with respect to sampling depths isrelevant for sites where degradation is not of importance.Sampling methods commonly adopted include soil gassampling, sub-slab sampling, flux emissions samplingand indoor air sampling. These methods are commonlyutilised with either active or passive sampling techniques.The commonly used methods are outlined in Section 6.

US EPA (2002), ITRC (2007a, 2007b), ASTM (2008) anda number of other guidance documents suggest a stagedor Tier approach to vapour assessment at a site. This is generally accepted for any site investigation (see, for example, NEPC-ASC 1999 or Davis, Merrick &McLaughlan 2006), although sometimes an acceleratedsite characterisation approach is adopted (e.g. ITRC 2003).
Generally, Tiers or stages of assessment may bedescribed as:
• Tier 1: A screening level assessment, whereby viasome criteria, sites or properties would be screenedout as not having undue risks posed by vapours
• Tier 2: Usually involves an initial site investigative stagewhere additional site data are obtained to assess if a potential vapour risk is posed
• Tier 3: Additional detailed site-specific investigation,sampling and/or modelling might be carried out todetermine site-specific risks
• Tier 4: Mitigation/remediation may occur.
Unfortunately, there are different understandings of whatlevel of detail and investigation constitutes each Tier, andthere are many guidance documents, especially for eachof the states of the United States of America, and federallyin the United States of America (e.g. US EPA, ASTM,ITRC, DoD). This then can lead to confusion when timelyaction may be required at a site.
Some of the confusion arises because a Tier 1 screeningof vapour risk may only be possible after a site-specificPhase II ESA (or DSI – as per NEPC-ASC 1999) isconducted. Of course, in practice it may be easier tocarry out vapour investigation at a site at the same timeas a Phase II ESA site assessment rather than haveseparate cycles of activity.
In this section we provide a brief description of some of the Tiers/stages in a vapour assessment and how they link with Phase I (PSI) and Phase II (DSI) ESAs. Wehighlight common and differential aspects from prominentguidance documentation, and suggest an approach that may be applicable.
Typically for a Tier 1 screening assessment, ‘measured or reasonably estimated’ (US EPA 2002) soil, soil vapouror groundwater concentrations for a site are comparedto risk-based criteria (RBC) (ASTM 2008) or HIL screening
levels (NEPC-ASC 1999). However, US EPA (2002) andASTM (2008) introduce an earlier stage of screening.Here we describe both approaches as part of a Tier 1assessment, and the information required for carrying out such screening assessments.
Note that if vapour intrusion is suspected to pose anexisting or imminent threat to human health, then immediatemitigation strategies might be implemented, or bypassingof the staged (Tier) approach may be warranted.
4.1 Screening assessment (Tier 1): ‘Exclusion distance’ – little or no site vapour data
4.1.1 ‘Exclusion distance’ understanding
The conditions under which the US EPA recommendsyou consider the vapour pathway/guidance are that (US EPA 2002, p. 8):
‘you consider the possibility of exposure by thispathway if you have or suspect the presence, in soil or groundwater, of volatile chemicals (Henry’s LawConstant > 10-5 atm m3/mol) at your site as follows:
• located 100 feet or less in depth or
• located in close proximity to existing buildings or future buildings or
• to the expected footprint of potential future buildings.’
Close proximity was stated to be within 100 feet (~30 m)in the vertical or laterally. The draft guidance then goeson to consider Tier 1 screening. As such, the exclusioncriterion stated above is a pre-Tier 1 assessment comparedto the terminology of the US EPA (2002) document.
ASTM (2008) codifies this approach. Tier 1 in ASTM(2008) is a screening assessment based on the ‘criticaldistance’ of a property or structure from a source ofvapours – effectively equivalent to the ‘close proximity’concept in the US EPA (2002) draft guidance.
In essence both the US EPA (2002) and ASTM (2008)guidance documents say that if the property or structureis beyond a prescribed distance from the source (andother criteria are satisfied), then effectively an unacceptablevapour intrusion risk (vapour intrusion condition) is
CRC CARE Technical Report no. 13 Field assessment of vapours 19
4. Framework for vapour assessment

4. Framework for vapour assessment
CRC CARE Technical Report no. 13 Field assessment of vapours20
unlikely to occur on a site. As indicated earlier, ASTM(2008) prescribes screening or exclusion distances thatare different for dissolved or LNAPL vapour sources, andare different for aerobically biodegradable (e.g. petroleumhydrocarbons) and non-degradable vapour sources.
4.1.2 Information requirements
ASTM (2008) lists the required information and caveatsto this (additional) exclusion distance Tier 1 screening –which is largely based on a Phase I ESA – such as givenin ASTM (2005).
ASTM (2005) states that a Phase I ESA will have fourcomponents:
• Records review – review of records
• Site reconnaissance – a visit to the property
• Interviews – including interviews with past or presentowners, operators and occupants of the property, and local government officials
• Report – evaluation and report.
ASTM (2008) broadens this to require specificinformation on:
• existing/planned use of the target property
• types of structures existing or planned on the target property
• surrounding area description
• federal, state, local, and tribal government recordsthat relate
• historical records of use
• physical setting – e.g. soil type, hydrogeology
• significant natural or man-made conduits – e.g. sewers,utility corridors, Karst terrain
• user (of the standard) specialised knowledge,experience and commonly known information.
This required information is largely equivalent to thatsuggested in a Phase I ESA or PSI (NEPC-ASC 1999),but excludes any invasive site investigation for vapours.
Critical to the use of such exclusion distance screening is the location of the vapour source and its possiblemovement over time relative to the property or building(s)under consideration. Based on a Phase 1 ESA (or PSI)and professional judgement it may be obvious that nofurther investigation is able to be recommended basedon an exclusion distance approach.
However, uncertainties associated with the location anddistribution of source mass in the soil or groundwater
may remain – so further definition of the distance from thevapour source to the building/property may be warranted.Such uncertainties need to be reduced to acceptablelevels for the exclusion distance to apply. To achieve this,preliminary vapour or other site measurements may becarried out, or a Phase II ESA whole of site investigationmay provide the required information on the subsurfacedistribution of the vapour source – with or without vapour-phase investigations. ASTM (2008) also mentions thepossible use of Phase II ESA whole of site investigationsto achieve this.
An issue here is what might be considered enough or adequate information to establish that an ‘exclusiondistance’ screen can be employed. ‘Adequate’ may bedeemed different if you are the owner of the site, thedeveloper, the consultant to the owner, the auditor on a site, the regulator, the future inhabitants of buildings on the site, or the community nearby.
Regardless, it seems possible to apply such a screeningdepending on the level of confidence in the basis for theexclusion distance. Information pertaining to theexclusion distance is described below.
4.1.3 Basis for the exclusion distanceestimates
US EPA (2002) draft guidance suggested a 100 feet (~30 m) exclusion distance. This was based on data from Colorado sites (including chlorinated hydrocarbons)where the vapour intrusion pathway had been evaluated.It was stated that ‘at these sites, no significant indoor air concentrations have been found in residences at a distance greater than one house lot (approximately 100 feet) from the interpolated edge of ground water plumes’.
Lowell and Eklund (2004) derived a depth-section, twodimensional analytical model to assess reductions invapour fluxes and concentrations at ground surface withincreasing lateral distances between a building and asource of vapours in the subsurface. They accounted fordiffusive transport of vapours and assumed the buildinghad little impact on vapour behaviour. They reported that if the depth to the vapour source was 5 m then theemission flux of vapours at ground surface at a lateraldistance of 25 m would be 7x10⁻⁴ as a fraction of theemission flux located directly over the vapour source. At a lateral distance of 50 m the emission flux of vapoursat ground surface would be 2x10⁻⁷ as a fraction of theemission flux located directly over the vapour source.

Similar fractional reductions in concentrations were reported.
Abreu and Johnson (2005) developed a three dimensionalnumerical model of vapour movement from subsurfacesources to the interior of slab-on-ground buildings orbuildings with basements. They assessed the effects oflateral separation of the vapour source from the locationof the building with and without biodegradation. Theyaccounted for advective movement of vapours from sub-foundation to the interior to the buildings by applyinga pressure differential across the foundation. They alsoaccounted for the dimensions of the building (footprint of10 m x 10 m) and assumed a vapour source with lateraldimensions of 30 m x 30 m. Without biodegradation,they found that for a vapour source at a depth 3 m belowground and at a 20 m lateral separation distance fromthe nearest edge of a building, concentrations in thebuildings were reduced by a factor of ~2x10⁻⁵ comparedto the vapour source being located directly under thebuilding. Interestingly, they reported that if the vapoursource was at a depth of 8 m below ground but at thesame 20 m lateral separation from the building, thereduction factor was much less, being 1x10⁻². Theshallower source appears to have a greater potential tomove into the atmosphere above ground over the short 3 m depth interval of soil compared to the travel distance
and time it takes for vapours to move the lateral distanceof 20 m to the building. In comparison, the source at 8 m depth has a much greater potential to move laterallybefore it is transported into the atmosphere through 8 mof overlying soil. Extrapolating the results in Abreu andJohnson (2005) to a separation distance of 30 m yields a fractional reduction in concentration of approximately1x10-3 for a vapour source at 8 m below ground and2x10-7 for a vapour source at 3 m below ground. Withbiodegradation, the fractional reductions in concentrationswere a number of orders of magnitude lower.
DeVaull (2007) considered lateral distances of vapourimpact, but for biodegrading (petroleum hydrocarbon)vapours. He reported that a lateral separation distance(or exclusion distance) was a more reliable measure of the assessment of petroleum hydrocarbon vapourintrusion than an attenuation coefficient (i.e. the ratio ofthe concentration in indoor air to that found at the source).
Prior to publication of ASTM (2008), Eklund et al. (2007)reported which US states had adopted exclusiondistance criteria based on the distance to the receptorfrom the source of vapours. The information is summarisedin Table 3 along with some additional information forother states published afterwards.
4. Framework for vapour assessment
CRC CARE Technical Report no. 13 Field assessment of vapours 21
Table 3. Summary of ‘exclusion distances’ adopted by some US states.
USA state Vapour source Petroleum vapour source (biodegradable) Reference
California 100 feet (or ~30 m) Eklund et al. (2007)
Colorado 100 feet (or ~30 m) Eklund et al. (2007)
New Hampshire 100 feet (or ~30 m) 30 feet (or ~9 m) Eklund et al. (2007)
New Jersey 100 feet (or ~30 m) 30 feet (or ~9 m) Eklund et al. (2007)
Pennsylvania 100 feet (or ~30 m) Eklund et al. (2007)
Alaska 100 feet (or ~30 m) Eklund et al. (2007)
Ohio 100 feet (or ~30 m) Eklund et al. (2007)
Indiana 100 feet (or ~30 m) 50 feet (or ~15 m) for BTEX Eklund et al. (2007)
Connecticut 30 feet (or ~9 m) Eklund et al. (2007)
Massachusetts 30 feet (or ~9 m) Eklund et al. (2007)
Kansas 100 feet (or ~30 m) 40 feet (or ~12 m) Kansas DHE (2007)
Minnesota 100 feet (or ~30 m) Minnesota PCA (2008)

4. Framework for vapour assessment
CRC CARE Technical Report no. 13 Field assessment of vapours22
The contention seems well founded that beyond a setdistance from a source vapours attenuate significantly.The supporting evidence is substantial, and a range ofjurisdictions have assessed the evidence and adoptedsuch a criterion into guidance. The attenuation isstrongest for petroleum hydrocarbons where aerobicbiodegradation occurs. Attenuation can be so large thatvapour concentrations near or in buildings on propertiescan be well below detection limits. Such distances couldbe considered for use in Australia (where relevant) asthey span a range of climatic conditions and soil types.
The critical issue appears to be the certainty of investigationor knowledge required to determine the subsurfaceextent of the vapour source (and potential for migration)so the lateral distance between the exposure point orbuilding and the edge of the source or plume can beaccurately determined. It may be in applying such anapproach that the edge of the vapour source is definedby soil or groundwater investigations, or by soil gassampling or even modelling. Alternately, to apply such an approach, it may be acceptable to measure ‘low’ or non-detectable concentrations at a prescribed lateralexclusion distance away from the boundary of a propertyor building rather than by defining the vapour sourcedimensions more precisely.
4.2 Screening assessment (Tier 1):Comparison to health-basedinvestigation levels (HILs) –little or no site vapour data
The ‘preliminary screening phase’ (Tier 1) in the ITRC(2007a, 2007b) guidance, suggests that some sites will be removed from further assessment if it isdemonstrated that:
1. the exposure pathway is and will remain incomplete
2. the chemicals of concern are not deemed sufficientlyvolatile (as defined by the regulatory agency) to posea hazard, or
3. the concentrations of the volatile chemicals fall belowgeneric screening levels.
These are variants of the screening criteria described inUS EPA (2002) – see Section 3. ASTM (2008) also itemisesthese issues for screening, but deems comparison togeneric screening levels (Item 3 above) as Tier 2, afterthe ‘critical distance’ screening is carried out.
Regardless, all (and NEPC-ASC 1999) have an approachthat compares concentrations in soil, groundwater or soilgas phases against generic screening levels – and ifbelow these screening levels then no further investigationis required.
In Australia, criteria commonly used for the purpose ofscreening include soil concentration criteria (from varioussources) and drinking water criteria. Where soil gas (orambient/indoor air) data are available these are commonlyscreened (sometimes considering relevant attenuationfrom soil gas to indoor air) against available air guidelinesfrom NEPC-AT (2004) and other international sources.
In NEPC-ASC (1999), no volatile compounds hadscreening (HIL) concentrations developed. However thecurrent variation process for the NEPM (NEPC-ASC 2006)seeks to develop more screening concentrations forvolatile compounds. For Australia, initial values for benzenewere described by Turczynowicz (2003), and more recentlya draft range of health-based screening levels (HSLs)were developed through Friebel and Nadebaum (2009).These consist of look-up tables of soil concentrationscreening levels for human health and other pathway risks.
To use the screening levels (HILs for Australia) a site-specific soil concentration is required. NEPC-ASC (1999– Section B7A) states that there are two prerequisites.They are the use of:
1. uniform soil sampling methodology which provides an appropriate amount of information about thedistribution and level of contaminants on a piece of land
2. uniform approach to data analysis to enable a meaningful interpretation of sampling results.
Clearly, this is beyond a PSI, but not as extensive arequirement as a DSI. The level of site investigationrequired remains ill-defined, except to be ‘uniform’ – indelivering an ‘appropriate amount of information’. This is similar to the requirement for the exclusion distance, in that enough information is required to be comfortablethat the source dimensions and distance from theproperty/building are defined.
Both the exclusion distance and HIL screening criteriarequire active site investigation – but may not requirevapour investigations at a site. Soil (and/or groundwater)investigations may suffice. In Australia, this wouldtypically proceed based on the NEPC-ASC (1999)guidance or the updated variation. For current HILscreening, acceptable soil data are those that addressstatistical and other (e.g. ‘hot spot’) criteria. Similarly,

targeted groundwater investigations can define groundwatervapour sources. In the US, screening criteria based oncomparison to soil gas data are often preferred, as this isthe phase that poses the risk to human health. In Australia,no soil gas screening criteria are currently available.
Where direct vapour measurements are required, orpreferred, guidance on vapour investigation design andmethods are given in Sections 5 and 6.
4.3 Tier 2 and Tier 3 – requiressite vapour data
Where the site under investigation fails to be screenedout via the assessments indicated above, Tier 2 and Tier 3 assessments may be required. Such assessmentsmay include a greater level of site-specific data collection,probably involving specific soil gas/vapour measurement.This may become part of a Phase II ESA or be a specificvapour investigation. Design issues for such investigationsare considered in Section 5 and methods that may beused are considered in Section 6.
4.4 Tier 4 – mitigationThis Tier is not considered further here. Details can be found in ASTM (2008) or other vapour mitigationdocumentation such as DTSC (2009).
4. Framework for vapour assessment
CRC CARE Technical Report no. 13 Field assessment of vapours 23

CRC CARE Technical Report no. 13 Field assessment of vapours24

CRC CARE Technical Report no. 13 Field assessment of vapours 25
As indicated above, what follows in this Section andSection 6 may only be required if Tier 1 screening doesnot exclude a site from further investigation, or if vapourassessment is deemed necessary at Tier 1 to be able to apply the available Tier 1 screening options.
The field assessment of vapours requires design of anappropriate sampling program to meet the projectobjectives and CSM. It is expected that a sampling planwould be prepared to ensure that the program undertakenmeets the desired primary objectives – e.g. to assesspotential human health exposures. In designing a samplingprogram, some additional issues that need to beconsidered are:
• knowledge and understanding of appropriateguidance documentation
• improvement of the conceptual site model (CSM)
• development and implementation of data qualityobjectives (DQOs)
• variability issues – spatial and temporal variability andindoor versus subsurface factors
• degradable and non-biodegradable vapours
• measurement options – reliability, representativeness,precision and accuracy
• use of data – e.g. in the context of the Australian auditprocess (level of conservatism).
Guidance documentation was largely summarised inSection 3, and the importance of the CSM was highlightedin Section 2 – neither are revisited in this section. Notehowever, that guidance may change on an ongoing basis,and although little Australian state government guidancewas available at the time of preparing this report, it islikely that it will become available in the near future eitherbecause of variations to the NEPC-ASC (1999), orseparately. In principle, design and planning for assessmentof vapours should target improvement and/or validationof the CSM, and accommodate guidance that is available.
5.1 Data quality objectivesData quality objectives (DQOs) establish arguments forcollection of data, and hence guide investigations andplanning of individual tasks that make up a sitecharacterisation effort. DQOs appear in a number ofguidelines (see e.g. AS 2005; US EPA 2006). It is arguedby some (e.g. Crumbling 2002) that the emphasis has
been too much on ‘data quality’ and not enough on the‘objectives’ when utilising the DQO approach. A challengeis defining the purpose (or objectives). A primary DQOwould be one that evaluates what has been identified tobe protected at the site – e.g. chronic (long-term) humanhealth inhalation exposures to low vapour concentrations.This will help to identity exposure points, time periods ofinterest and concentrations of relevance at exposure points.
A soil vapour investigation needs to be adequate in extentand quality to meet the purpose of the investigation. Howmany samples and at what locations to provide adequatecoverage needs to be defined by the CSM and DQO.The investigation also needs to be representative – thatis, sampling strategies and techniques must provide datathat are representative of the subsurface environmentand site conditions. Crumbling (2002) asserts that datarepresentativeness is fundamental to data quality. Thedata quality model for contaminant data can sometimesremain focused on analytical data quality methods to theneglect of strategies to accommodate sampling from a heterogeneous environment. Crumbling (2002) arguesthat for the same overall cost a greater spread of samplesacross a site with (even greatly) reduced analytical certaintyfrom laboratory or field screening will have a loweruncertainty, and therefore be more representative thanfewer samples analysed to a high degree of accuracy.Note though, that this was determined on soil samplesprimarily, and where concentrations were not close todetection limits. It may not apply as readily to soil vapourinvestigations.
The DQO adopted for a sampling program should berelevant for the sampling techniques and methods adoptedto ensure that the target compounds can be adequatelyreported to a level required for the assessment ofexposure and risk.
5.2 Variability issuesThe variability of any vapour measurement is a functionof how the sampling was collected, the analytical methodused as well as the potential for temporal and spatialvariability. These differ for the collection of different dataand should be considered in any sampling design plan.Eklund (2007) provided a summary of the expecteddistribution of variabilities for different sample types.These are presented in Table 4.
5. Design issues for field assessment of vapours

5. Design issues for field assessment of vapours
CRC CARE Technical Report no. 13 Field assessment of vapours26
Spatial variability encompasses a multitude of issues.Interior to a building spatial and temporal variability maybe closely linked, especially if short-term vapourconcentration changes occur due to pressure differentials.The spatial density and frequency of sampling should be matched to the understanding of such variability. Inthe subsurface, spatial variability in soil gas and vapourconcentrations may occur due to layering of fine andcoarse soil horizons, high moisture content zones, orindeed gross features such as utility conduits, plumbingor sewer lines. These features can lead to enhancedlateral migration and unforeseen variability in vapourconcentration measurements if not accommodated in planning a site investigation.
ITRC (2007a) discusses the variability in soil gasconcentrations that may be associated with temporaleffects. Based on studies undertaken short-termvariations in soil gas at depths of 4 feet (~1.3 m) ordeeper are less than a factor of 2. Seasonal differencesin colder climates are less than a factor of 5. Other effectsthat may affect variability include rainfall and barometricpumping. The document suggests that if soil gasconcentrations are less than a factor of 5–10 belowadopted (screening) guidelines, additional sampling is not required to address temporal variation. ITRC (2007a)also note that temporal variability in indoor air qualityshows concentrations within a range of 2–5 fold. Thisvariability can be considered when screening limited datasets for the purpose of identifying if vapour risks existand if additional sampling is required. It is noted that
additional sampling may be required if other key siteconditions changed such as groundwater elevation orsource concentration.
5.3 Biodegradable vapoursThe biodegradation of vapours changes their distributionin the subsurface. As such determining maximumconcentrations near sources of vapours would typicallyrequire sampling at deeper depths of the soil profile.Oxygen may inhibit the movement of degradable vapoursto shallower depths. Aerobically biodegradable vapoursinclude most volatile petroleum hydrocarbons, some lightchlorinated hydrocarbons such as vinyl chloride (Davis & Carpenter 1990), and some ketone compounds suchas diisobutylketone (DIBK) (Davis, Woodbury & Bastow2004). In addition methane will readily biodegrade whereoxygen is present (e.g. Lundegard et al. 2008).
Davis, Patterson and Trefry (2009a) recentlyrecommended sampling for oxygen at a depth noshallower than 1 m (based on Davis, Patterson & Trefry2009b), to avoid surface effects and transients. If thedetermined oxygen concentration was above 5% byvolume (and other criteria were satisfied) then theyargued that a 10–100 fold reduction in risk could beapplied if the depth of the vapour source was 2–4 mbelow ground. This was recommended to be applied at the Tier 1 screening level to health-based screeninglevels derived by assuming vapours were not biodegrading.
Table 4. Qualitative indication of the variability caused by the sampling process, chemical analysis, andtemporal and spatial variations – for a range of sample types – from Eklund (2007).
Sample type Relative significance by type of variability
Sample recovery* Chemical analysis Short-term temporal Spatial
Soil gas Medium Very low Very low High
Sub-slab Medium Very low Medium High
Emission flux Medium Very low Medium High
Indoor air Low Very low High Medium
Ambient air Low Very low High Low
* Variability associated with the use of a selected sampling technique for collection of data, particularly when assessed using duplicates as part of a QA/QC assessment. It is noted that the potential variability of data collected using different sampling techniques (refer to Section 6 for discussion)may differ (e.g. different limits of reporting for different sampling media) and should be considered further where required. It is also noted that the types of variability are not necessarily independent of each other.
5. Design issues for field assessment of vapours
CRC CARE Technical Report no. 13 Field assessment of vapours 27
5.4 Measurement optionsThe ITRC (2007a) developed a tabulation of possiblevapour assessment methods and their applicability for a range of source conditions and building types. Thematrix categorised some of the methods and strategiesas primary, secondary, optional or ‘not usuallyappropriate’ as vapour assessment options. API (2005)provides a revised matrix that focuses on petroleumvapour methods. The matrix provided by ITRC has beenreviewed to reflect approaches and methods commonlyused and accepted in Australia for the purpose ofassessing vapour issues. The revised matrix is providedin Table 5 and can be considered in the identification ofsuitable methods and options that may be considered foruse in a field program. Refer to Section 6 for discussionon the sampling methods.
It is noted that the ITRC (2007a) matrix identifies a numberof other measurement techniques such as tracer testingfor alpha (attenuation) factors, tracer testing for ventilationrate and pressure differential monitoring. In addition thecollection of methodological data and potential use ofreal-time analysers during the sampling methodologieslisted may be relevant. These methods are not commonlyused in Australia and are not discussed further. However,guidance from documents such as ITRC (2007a) isavailable, should these methods be required as part of a sampling program.
5.5 Data interpretationThe design of any sampling program needs to considerthe suitability of the data for interpretation and quantificationof exposure and risks to human health. Some issues thatmay need to be considered in the design of the samplingprogram include:
• methods adopted can meet required limits of reportingsuch that if analytes are not detected, no risk can be demonstrated
• adequate understanding of the uncertainties andvariabilities that are associated with the samplingmethods adopted
• samples collected can be appropriately used in the CSMto support the quantification of exposure and risk. Thisincludes the consideration of how data collected fromdepth will be used (if necessary) to quantify exposuresat ground level
• data collected is not affected by other sources thatcannot be quantified (common problem in samplingindoor air where multiple indoor sources may be present)
• selection of sample collection methods/media thatadequately address the range of target compounds.More than one sample collection method may need to be used to address the range of compoundsrequired at some sites.

5. Design issues for field assessment of vapours
CRC CARE Technical Report no. 13 Field assessment of vapours28
Tab
le 5
. Mat
rix
of
vari
ous
ass
essm
ent
op
tions
to
eva
luat
e va
po
ur in
trus
ion
(rev
ised
fro
m IT
RC
200
7a).
Undeveloped site
Building with basement or slab-on-ground floor
Building with dirt floor or crawl-space
Undeveloped site
Building with basement or slab-on-ground floor
Building with dirt floor or crawl-space
Undeveloped site
Building with basement or slab-on-ground floor
Building with dirt floor or crawl-space
Petroleum hydrocarbons
Vapour migration routes
Wet basement****
Very low permeable soils
Mea
sure
men
t ap
pro
ach
So
urce
at
dep
th (>
1.5
m)
Sha
llow
sou
rce
(<1.
5 m
feet
) S
our
ce in
vad
ose
zo
ne
Sp
ecia
l co
nditi
ons
und
er s
ite/b
uild
ing
#un
der
site
/bui
ldin
g#
adja
cent
to
site
/bui
ldin
g#
Dee
p (>
1.5
m) s
oil
gas
PP
PN
NN
OO
OP
ON
O*
Sha
llow
(1–1
.5 m
) soil
gas
PP
PP
PP
PP
PP
PN
O*
Sub
-sla
b s
oil
gas
NO
/SN
NO
/SN
NO
/SN
O/S
ON
P/O
*
Vert
ical
pro
file
of s
oil
gas
OO
ON
NN
OO
OO
ON
O*
Ind
oor
air
NS
SN
SS
NS
SS
**P
**S
S
Am
bie
nt (o
utd
oor) a
irO
OO
OO
OO
OO
OO
OO
Pas
sive
soil
gas
sam
plin
gS
SS
SS
SS
SS
SS
NS
Em
issi
on
flux
cham
ber
sO
OS
OO
SO
OS
N**
*N
NO
No
tes:
The
rat
ings
pre
sent
ed in
the
tab
le a
re a
ssoci
ated
with
the
ran
ge
of o
ptio
ns t
hat
coul
d b
e us
ed fo
r th
e as
sess
men
t o
f vap
our
intr
usio
n. W
hile
som
e m
etho
ds
may
be
note
d a
s m
ore
pre
ferr
ed t
han
oth
ers,
oth
er m
etho
ds
(note
d a
s se
cond
ary
or
op
tiona
l) ca
n b
e us
ed a
s p
rimar
y o
ptio
ns p
rovi
ded
the
y ca
n ad
dre
ss t
he C
SM
and
DQ
Os.
The
rat
ing p
rese
nted
incl
udes
:
P
= P
rimar
y in
vest
igat
ive
op
tion
– ca
n p
ote
ntia
lly b
e us
ed a
s a
prin
cip
al o
ptio
n fo
r as
sess
ing
vap
our
intr
usio
n.
S
= S
econd
ary
inve
stig
ativ
e op
tion
– ca
n b
e us
ed a
s a
line
of e
vid
ence
in s
upp
ort
of a
noth
er li
ne o
f evi
den
ce, o
r as
a p
rimar
y o
ptio
n w
here
rel
evan
t.
O
= O
ptio
nal i
nves
tigat
ive
op
tion
– ca
n b
e us
ed a
s an
ad
diti
ona
l lin
e o
f evi
den
ce, as
mea
ns t
o fo
cus
a p
rimar
y in
vest
igat
ion
or
as a
prim
ary/
seco
ndar
y op
tion
dep
end
ing o
n th
e re
leva
nce
in a
dd
ress
ing t
he
CS
M a
nd D
QO
s.
N
= N
ot
usua
lly a
pp
rop
riate
as
an in
vest
igat
ive
op
tion.
*
May
be
cons
ider
ed a
n op
tion
if th
e sa
mp
ling is
und
erta
ken
with
ap
pro
pria
te m
etho
ds
to e
nsur
e re
pre
sent
ativ
e sa
mp
le is
co
llect
ed (r
efer
to S
ectio
n 6).
**
May
not
be
an a
pp
rop
riate
op
tion
if ta
rget
com
poun
ds
are
com
mo
n ur
ban
air
cont
amin
ants
or
have
a s
igni
fican
t in
do
or/
loca
l so
urce
.
***
N
ot
reco
mm
end
ed a
s an
op
tion
for
asse
ssin
g a
erob
ical
ly b
iod
egra
dab
le v
apo
urs
(e.g
. p
etro
leum
hyd
roca
rbo
ns) d
ue t
o t
he in
fluen
ce o
f oxy
gen
nea
r th
e su
rfac
e, h
ow
ever
ap
plic
ability
of m
etho
d w
oul
d
dep
end
on
CS
M a
nd s
amp
le lo
catio
n.
****
Ass
essm
ent
of a
wet
bas
emen
t re
qui
res
cons
ider
atio
n o
f rel
evan
t g
roun
dw
ater
co
ncen
trat
ions
and
po
tent
ial f
or
vola
tilis
atio
n (d
epen
den
t on
bui
ldin
g d
esig
n) in
ad
diti
on
to a
ny v
apour
dat
a th
at m
ay
be
colle
cted
.
# ’S
ite/b
uild
ing
’ inc
lud
es:
Undeveloped site
: A
site
with
no e
xist
ing b
uild
ings
or
stru
ctur
es p
rese
nt.
Building:
Ref
ers
to t
he t
ype
of b
uild
ing c
ons
truc
tions
tha
t m
ay b
e as
sess
ed fo
r re
sid
entia
l and
/or
com
mer
cial
/ind
ustr
ial u
se.

CRC CARE Technical Report no. 13 Field assessment of vapours 29
This section provides a summary of the commonly usedmethods for the sampling and characterisation of vapourconcentrations at a site. The methods presented providea range of options that may be considered in the designof a sampling program. The methods used in any programshould address the design issues identified in Section 5as well as the CSM developed for the site.
6.1 Soil gas sampling methods
6.1.1 Temporary spear probing
Spear probing, or driven soil gas probes, of soil involvesdriving a spear/rod into the ground to a shallow depth(e.g. 1.5–2.0 m below ground surface), extracting a soilgas sample for analysis of the vapours of concern and/ormajor gases (e.g. oxygen), and withdrawal of the spearprobe. The probe can be decontaminated and reused for the sampling of soil gas at the next location (if required).Decontamination would need to be appropriate for thecompounds expected; alternatively disposable implantscan be used where cross-contamination is expected tobe of concern. Spear probing can provide vapour andmajor gas concentration data at a series of locations andselected depths, but is not a survey technique designedto determine changes over time.
Spear probing is typically used in one of two ways: as a screening level assessment technique or for thequantitative sampling of soil gas.
As a screening level technique, spear probes are usedwith a field sampling method to identify the presence ofvapours in the subsurface, and can assist with locating‘hot spots’. Recovery of the samples from the spearprobe can be collected in a glass syringe (or container)
for vapours (to minimise loss of vapours due to sorption)or collected in a plastic syringe (or container) if collectinga gas sample for analysis of major or fixed gases such asoxygen. Analysis of the sample directly from the syringe(or container) is preferable to minimise air contact andvapour/gas loss and exchange with the atmosphere. A photo ionisation detector (PID) may be used in the field to analyse or screen the sample. Detailed analysiscould be done on a portable or laboratory-based gaschromatograph (GC), or by GC- mass spectrometry (MS).The use of spear probes for a screening level assessmentenables a large number of locations to be sampled in acost-effective manner. This provides guidance for anyadditional more intensive investigations that may need to be conducted. To be effective as a survey technique,samples should be taken below the zone influenced bytransients, which is likely to be at depths of 1.0–2.0 m or greater below surface. The sampling depth may alsodepend on the location of the vapour source. The methodcan also be used to collect samples from a vertical profile(from as shallow as 0.3 m) to assist in the identification ofvarious vapour zones and to define the potential aerobicreaction zone.
As a quantitative technique the spear probe can beinstalled and sampled in the same manner as permanentprobes/samplers. Sometimes it is more difficult to achievean adequate seal on a temporary installation or spear rod –hence tracer methods are suggested by some (NYSDOH2006). Additional considerations associated with thesampling of soil gas are noted in Section 6.1.6.
Based on industry experience and after Hartman (2002)and API (2005), Table 6 outlines a number of advantagesand disadvantages of the temporary probe methods.
6. Vapour and gas sampling and monitoring techniques

6. Vapour and gas sampling and monitoring techniques
CRC CARE Technical Report no. 13 Field assessment of vapours30
6.1.2 Permanent multi-levelprobes/samplers
Permanent subsurface soil gas/soil vapour monitoringlocations can be installed to allow (i) depth profiling ofvapour concentrations through the soil profile from nearsource to near the ground surface, and (ii) repeatsampling and monitoring over time at fixed locations.Guidance is available from API (2005), NYSDOH (2006),ITRC (2007a) and others that outline key aspects ofinstalling soil gas probes/implants/samplers so that theycan be used to collect a representative soil gas sample.
Single depth permanent probes can be installed, either atdepth (close to the source) or shallow (particularly wherethe source is shallow). Multiple depth (or multi-level) gassampling installations may be undertaken by installingmultiple sample ports at different depths (separated by a bentonite seal) within the one sampling well (API 2005;Hartman 2002), or installing separate soil gas probes atdifferent depths (separated by at least 2 ft or 0.6 m) (API2005; NYSDOH 2006). Options are illustrated in Figure 11.
Table 6. Advantages and disadvantages of the temporary probe methods.
Advantages
• Probes can be installed, sampled and removed with minimal surface disruption
• Useful for the sampling of shallow soil gas (where the source is shallow)
• Useful for screening where field monitoring or analytical techniques are incorporated to direct decisions on further sampling
• Can direct installation of permanent probes
• Can be used to assess vertical profiles (but depth limited due to practical depth of installations)
Disadvantages
• Additional costs associated with remobilisation if further sampling is required and permanent installations using spear probes are not possible
• Lower level of reproducibility (between events) as there is a higher degree of variability with the installationmethod
• Potential for cross-contamination between locations
• Harder to get good seal to minimise ambient air ingress
• Not usually used to collect samples from low permeability soil
Figure 11. Schematic of multiple depth soil gas sampling installations (after API 2005).

6. Vapour and gas sampling and monitoring techniques
CRC CARE Technical Report no. 13 Field assessment of vapours 31
There are a range of methods for installing permanentprobes. DiGiulio et al. (2006) reported good agreementbetween installation/drilling methods. Essentially, theyfound that the variation in results was not significant byusing different installation methods as long as installationwas done correctly. Hence the probe installation methodused should be determined based on site-specific factorsincluding access and environmental conditions (e.g. soiltexture or moisture conditions that may limit the usefulnessof very narrow tubing and other effects). Correct sealingof the installations was seen as essential, especially intighter fine-textured soils. Separate installations ratherthan multiple sampling points in one drilled hole aresometimes recommended for finer soils, to ensure a goodseal is able to be achieved or where the upper sample isless than 1 m below the surface.
Care should be taken to construct installations from inert,non-sorbing and well flushed or ‘tested’ materials.
Sampling of the permanent probes and multi-levelsamplers can be carried out using a range of samplingmethods. Typically, permanent probes would need to be left for a minimum of 24–48 hours prior to sampling
(DTSC 2009; NYSDOH 2006) depending on the installationmethod and the site conditions. Additional considerationsassociated with the sampling of soil gas are given inSection 6.1.6.
Additionally, during drilling to install the permanentprobes and multi-level samplers, a log of soil typesshould be documented. Sometimes a soil core may alsobe recovered and be sub-sampled to determine organiccarbon and soil parameters (e.g. bulk density, porosity),at the depths of the sampling ports, and for analysis of the soil for the chemicals of concern.
Data from depth profiling using multi-level samples canbe used to calculate vapour fluxes to the ground surfaceand possibly infer degradation rates, where it occurs.
Hartman (2002), API (2005) and Atlantic Richfield (2006)outline a number of advantages and disadvantages of the permanent probe methods. Some of these aresummarised in Table 7.
Table 7. Advantages and disadvantages of the permanent probe methods.
Advantages
• Probes can be sampled over time allowing temporal variability to be assessed
• A number of methods are available for installation (augured or direct push) enabling flexibility for a range of sites where access may or may not be limited or where a range of lithologies are present
• Installation provides the opportunity to carefully seal each probe and sampling interval
• Deep probes, located just above the source, can be used to measure the maximum vapour source concentration – that can be used for screening purposes or for assessment of buildings on a vacant site
• Multilevel probes enable an assessment of attenuation through the vadose zone
• Can be used to collect samples in low permeable soil
Disadvantages
• If only deep probes are installed, the data may not berepresentative of soil gas at shallower depths due tooverlying soil layers or degradation (particularlyrelevant for petroleum hydrocarbons)
• Depending on the lithology and installation thepermanent probes may be affected by wet conditions(moisture in the vadose zone) or clogging over timepreventing their re-sampling (requiring re-installation)

6. Vapour and gas sampling and monitoring techniques
CRC CARE Technical Report no. 13 Field assessment of vapours32
6.1.3 On-line VOC and oxygen probe
Near-continuous measurement of total vapour (or volatileorganic compounds – VOCs) and oxygen concentrationsis possible using on-line VOC and oxygen probes(Patterson & Davis 2008; Patterson et al. 1999, 2000).These can be buried at multiple depths to give near-continuous measurements of total vapour and oxygenconcentrations for extended periods (over months toyears) – and indeed can be used for vapours or dissolvedphase concentrations. Apart from providing vapour andoxygen depth profiles, the detailed information derivedfrom these probes allows seasonal trends in vapour fluxesand other parameters such as degradation rates to beassessed. The probes can also provide an assessmentof remediation progress where the adopted remediationimpacts vapour concentrations.
Probes such as these have been used at a number ofsites across Australia to measure total hydrocarbon andsolvent compounds in soils and aquifers. In particular theprobes have been used to measure vapours in soilsbeneath and in the vicinity of built structures (e.g. houses,Patterson & Davis 2009), and in sandy and heavier claysoil environments (Davis, Patterson & Trefry 2009b). Theprobes do not directly monitor individual compounds,such as benzene, but can be sub-sampled to obtain agas sample, which can then be analysed by conventionalmeans for component VOC and major gas concentrations.
6.1.4 Sub-slab sampling
This involves the collection of soil gas samples fromdirectly under a building slab or foundation. The samplingrequires drilling a hole through the building slab, includingwithin the driveway or garage, or beneath a foundation.The rationale for this technique (as opposed to collectingsoil gas data adjacent to a building, Atlantic Richfield 2006)is that the sub-slab region is in closest proximity to thepotential access points to the built structure.
Sub-slab installations may be permanent, semi-permanent or temporary depending on access and theneed to resample. Sampling of a sub-slab installation can be carried out using a range of sampling methodsconsistent with those used to sample soil gas from eithertemporary or permanent locations. Additional considerationsassociated with the sampling of soil gas are noted inSection 6.1.6.
API (2005) and Atlantic Richfield (2006) outline a numberof advantages and disadvantages of the sub-slab methods.These are summarised in Table 8.
Table 8. Advantages and disadvantages of the sub-slab methods.
Advantages
• Provides a measure of soil gas directly beneath the slab which is closer to the point of exposure
Disadvantages
• No validated sampling method is available and hence the affect of environmental variables is less well understood
• Large spatial variability at some sites
• Highly intrusive method and as such is not a preferred method
• Requires damage to building floors (and higher risk of damaging subfloor services)
• If not installed correctly, can act as short-circuit forvapour intrusion
• Data can be more difficult to evaluate asconcentrations can be affected by indoor sources(vapour may move inward or outward throughconcrete depending on pressure differences)

6. Vapour and gas sampling and monitoring techniques
CRC CARE Technical Report no. 13 Field assessment of vapours 33
6.1.5 Across the capillary fringe
It may not be commonly required, but if source conditionsin groundwater near to the capillary fringe are critical to a vapour assessment, then measurement across thiszone may be required. The near-capillary fringe zone is a region of rapid transition in soil moisture content, fromwater saturated conditions in groundwater to (usually)increasing air-filled porosity through a soil profile. Theincreased air-filled porosity allows vapour transport.Traditional sampling methods suggested in this zoneinclude (i) recovery of gas samples as close to the top of the capillary fringe as possible (API (2005) recommend0.5–1 m above the capillary fringe), and (ii) investigationof the distribution of the volatile compounds in thegroundwater (the groundwater plume). Close to thecapillary fringe determination of gas or groundwaterconcentrations becomes increasingly difficult.
Barber and Briegel (1987) reported on a diffusion celltechnique that allowed fine-scale measurement of volatilecompounds and gases across this zone. It entaileddeployment of a bundle of coiled gas-permeable polymertubing at defined depth intervals below ground. Samplingwas carried out by passing a carrier gas through thecoiled tubing. The gas sample was collected at groundsurface, and the recovered sample would be sent foranalysis or analysed on-site. Whether in a water-saturatedor gas-filled environment, the recovered gas stream fromthe diffusion cells would be representative of conditionsin the soil/water media adjacent to the diffusion cell, andbe representative of the concentration that would partitionto a gas phase, as per a vapour source. The probesreported in Patterson et al. (2000) used a similar techniqueto provide near-continuous total VOC measurements.
6.1.6 Factors that may be consideredwhen sampling soil gas
The following factors may need to be considered in thedesign of a soil gas sampling program:
• Location: The number of locations sampled dependson the conceptual model developed, access and cost.There are a range of suggestions as to the location ofsoil gas samplers, however Hartman (2002) suggestedthat samples should be collected at the site of maximumsource concentration near or under a building and ateach corner or along each side (if practical).
• Depths: The depth of samples should be based onthe conceptual model developed, in particular thedepth of subsurface sources and the nature of the
contamination. Where shallow sources are present or where deeper samples cannot be obtained thecollection of soil gas from shallow depths (<1.0 m)may be appropriate. However, sampling from thesedepths may require justification. The installation anduse of data from shallow wells should consider thepotential for aerobic degradation of petroleumhydrocarbons, and potential transient influences.
• Frequency: A single sampling event may be sufficient;however, additional sampling events may be requiredin the event that (i) the first round of data shows highconcentrations, (ii) if samples were collected fromshallow depths (<1.0 m), or (iii) if sampling occurred in winter and large seasonal variations in temperatureor soil moisture occur.
• Probe integrity/seal: Soil gas probes (temporary orpermanent) should be installed to ensure that ambientair is not drawn into the sampling system and that anysoil gas sample collected is representative. This mayrequire an additional seal around the probe, even fortemporary probes. An adequate seal may be particularlyimportant for shallow probes or sub-slab probes. Anumber of tracer methods are outlined in guidance(API 2005; ITRC 2007a) that can be used to test theseal integrity. Hartman (2002) notes that tracer testingmay only be necessary for shallow depths (<1 m depth),when large sample volumes (>0.5 L) are collected orthere is a visibly poor seal at the surface. It may alsobe important where samples are collected from lowpermeable soils (McAlary, Nicholson et al. 2009).
• Tubing type: Tubing type is important as vapours mayemanate from polymer tubing, especially flexible tubing,and can also adsorb to tubing providing false positivesor negatives when samples are analysed (Hartman2006). For more rigid tubing the tubing type is of lessimportance. When using more rigid tubing, handlingand storage of samples becomes more critical.Improper handling and storage can also result incross-contamination and false positives.
• Sample volume: The recovered size of the samplevolume may be an important aspect. Hartman (2002)indicated that the larger the sampling volume thegreater the uncertainty about the exact location wherethe soil gas came from. Near ground surface, recoveringlarge sample volumes may result in the draw-in ofambient air from outside the annulus of the shaft of the probe. Large sample volumes increase thelikelihood that the sample may be from differentdepths and locations. A review of available studies on sample volumes by Hartman (2006) suggested

6. Vapour and gas sampling and monitoring techniques
CRC CARE Technical Report no. 13 Field assessment of vapours34
that the sample volume is less important for coarse-grained soil, but in finer-grained soils large volumesmay be difficult to collect due to the creation ofvacuum conditions during sampling. The samplevolume should be appropriate for the soil types andsampling/analytical method.
• Purge volumes: The sample probe, tubing andequipment have an internal volume that must bepurged prior to sampling. This is undertaken to ensure that only soil gas is sampled and the data is representative. The volume of gas that is purged is subject to a range of opinions. Hartman (2002) and ITRC (2007a) suggested between one and fivevolumes should be purged prior to sampling. A studyby Zimmerman and Schumacher (2004), McHugh(2008) and McHugh and Nickels (2008) showed thatthe soil gas concentration determined (using a numberof methods) after a range of purge volumes did notvary significantly. Whatever calculation is used toestimate the volume purged, this should remainconsistent for all locations sampled. It is noted thatlarge purge volumes can result in low pressure/vacuumconditions that can result in contaminant partitioningfrom the soil to soil gas resulting in the sample notbeing representative (Hartman 2002). A recent study(Schumacher et al. 2009) recommended for temporaryprobe installations, that the purge volume be minimisedto ensure the sample collected is representative.
• Sample flow rates: To minimise the potential fordesorption of contaminants from soil to soil vapour in the sampling zone the sample flow rate should be appropriate for the soil type. In the US, guidancetypically suggests a limit on the sample flow rate of <0.2 L/min. However, a study by McAlary andCreamer (2006) considered flow rates from 0.1 L/minto 100 L/min in coarse-grained soils and showed littledifference in estimates of soil vapour concentrations.This is consistent with guidance provided by ITRC(2007a). A low sample flow rate is important where soil gas is collected from low permeable soil (McAlary,Nicholson et al. 2009). Low permeable or high-moisture content soils can induce greater suctionpressures when sampling. This sometimes makessamples difficult to recover.
• Environmental: Temperature variations within a soilprofile are generally low and decrease with depth.Temperature variations in Australia are typically notlarge (as occur in some parts of the US and Europe)and hence temperature variations are not expected to have a large influence on soil gas concentrations.
Changes in barometric pressure can result in apressure gradient between the soil gas and ambientair increasing the flow of vapours in the subsurface.This effect is only of importance where sampling isshallow. Rainfall can affect the measurement of soilgas by changing the moisture content in the soil profileand creating a cap above the source area (Davis et al.2005). Sampling of soil gas (particularly from depthsshallower than 1–1.5 m) directly after significant rainfallevents (>25 mm) should generally be avoided, unlessthe rainfall is representative of normal conditions. Soilgas samples collected from depth >1.5 m are unlikelyto be significantly affected by rainfall events (Hartman2002). There are no specific guidelines available onhow long to wait before sampling shallow soil gasafter a rainfall event as it is dependent on the soil typeand other climatic conditions. If uncertainty remains as to the potential for a rainfall event to change thedistribution of vapours in the subsurface, then repeatsampling may be warranted or measurements of soilmoisture may be taken at the time of vapour sampling.
6.2 Flux chamber methodsA flux chamber (or a flux hood) is a device that is placedon a surface which enables a measurement of vapour/gasflux (or emission rate) discharging through that surface.The surface may be open ground or be part of a buildingfoundation such as a concrete slab. There are twoprimary types of flux chamber methods: a static (closed)chamber method and a dynamic chamber method.
6.2.1 Static chamber
The static chamber method requires the placement ofthe flux chamber on the surface of the ground or buildingfoundation, without any passage of air through thechamber. This allows vapours to be trapped and thestagnant chamber vapour concentration to build up overtime. The method is described by Eklund and Schmidt(1990), Hartman (2003) and Heggie and Stavropoulos(2008). Active samples can be collected at discrete intervalsthrough a time period, and at the end of a time period.Passive sampling methods are also being developedwhereby a sorbent is left within a static chamber for aperiod of time (Heggie & Stavropoulos 2008). Table 9outlines a number of advantages and disadvantages of this method.

6. Vapour and gas sampling and monitoring techniques
CRC CARE Technical Report no. 13 Field assessment of vapours 35
6.2.2 Dynamic chamber
The dynamic chamber method (see e.g. Figure 12) isdescribed in guidance developed for the US EPA (Eklund& Schmidt 1990; Kienbusch 1986; Reinhart et al. 1992).This method involves the use of an inert sweep gas whichis continually introduced into the chamber with an
equivalent amount of gas allowed to escape. The systemis allowed to reach steady-state, assumed to be four of five chamber volumes. Then the chamber is sampled.The sample can be a discrete sample or monitoredcontinuously. Table 10 outlines a number of advantagesand disadvantages of this method (Hartman 2003).
Table 9. Advantages and disadvantages of the static chamber method.
Advantages
• Equipment and procedures are simpler and less expensive than the dynamic flux chamber method enabling more locations to be sampled
• Can be used to provide a time integrated sample over long periods reflecting flux variations with temporal variability
• Minimises disturbance of natural flux conditions
• Method can be more sensitive than the dynamic flux chamber method (depending on the static flux method adopted) enabling the use of less expensive analytical techniques with a higher detection limit limiting false positives
Disadvantages
• If concentration in the chamber builds up to asignificant fraction of the subsurface concentration the flux will be impeded and the data collected will be underestimated. This is expected to be of issuewhere emissions are known to be high. For manyapplications the build-up is not expected to be significant
• Small footprint of the chamber compared toheterogeneity of the ground/foundation
Figure 12. Schematic of the dynamic chamber method (after URS 2008).

6.2.3 Factors that may be consideredwhen using flux methods
The advantage of this technique is that it enables thedirect measurement of a vapour flux from the surface ofthe ground or building foundation. This is somewhat of a direct estimate of the parameter of interest often closeto the point of potential exposure (rather than calculatingit from subsurface vapour distributions). It also does notrequire additional subsurface investigations. It effectively‘integrates’ all subsurface processes (e.g. phasepartitioning, bioattenuation, preferential pathways, advectiveand diffusive transport). The major disadvantages of thistechnique are the potential changes in fluxes that areinduced by the device itself, and the small footprint of the chambers.
When designing a sampling program the following shouldbe considered:
• Coverage of the area of concern: Hartman (2003)suggested targeting areas of possible vapour conduits,areas of maximum source concentrations andconsideration of other site-specific building features.
• Deployment period: This refers to the period of timethe chamber is deployed and sampled. This should beadequate to address the issues of concern and wherepossible enable temporal variability to be assessed.
• Environmental conditions: Emission rates from soilmay be reduced immediately after rainfall. Kienbusch(1986) recommended waiting seven days after a rainevent of greater than 7 mm. Barometric pressure mayalso have an effect with higher emissions duringperiods of low atmospheric pressure. Hartman (2003)
suggested avoiding deployment during extremepressure conditions. Temperature effects have beenfound to be relatively minor except where the flux isfrom a source at (or very close to) the surface. If samplesare collected in a building, heating and cooling mayalter emissions. If sampling is undertaken to assess a landfill, these effects may be more significant andshould be considered when deciding when to collectrepresentative samples.
• Petroleum hydrocarbons: These compounds activelybiodegrade in the presence of oxygen, particularly in the near-surface soil. If samples are collected fromopen ground the emissions may be reduced bybiodegradation. The use of the data needs to beconsidered in the context of the site conceptual model.
• Chlorinated solvents: These compounds do notbiodegrade readily in the vadose zone, potentiallyyielding higher mass fluxes at ground surface. As such,flux methods may be more usable for chlorinatedhydrocarbons in open ground conditions than atpetroleum hydrocarbon-impacted sites.
• Basements: Flux chambers may not be suitable fordwellings with basements because of additionalpotential fluxes from the basement walls to the interiorof the dwelling.
• Changed land form: Flux chambers used on a baresoil surface may not reflect measurements obtainedwhen a structure is in place.
• Subsurface conditions: This technique provides littleinformation about the processes that may be occurringwithin the vadose zone such as oxygen penetrationand hydrocarbon degradation. Longer-term controls
CRC CARE Technical Report no. 13 Field assessment of vapours36
6. Vapour and gas sampling and monitoring techniques
Table 10. Advantages and disadvantages of dynamic chamber method.
Advantages
• Little chance of chamber concentration build-up and hence very little chance that the measured flux will be impeded
• Validated method for sampling of emissions from landfill sites (or where active gas generation is expected)
Disadvantages
• More complex and expensive method requires moreexperience and greater potential for QA issues
• Dilution in the chamber results in loss of sensitivity andrequirement for more expensive analytical techniquesthat have a low detection limit
• Inflow and outflow of sweep gas has potential fordisturbance of natural flux (e.g. creation of advectiveflow in chamber)
• Temporal variations not easily captured due to theshorter duration of sampling events

CRC CARE Technical Report no. 13 Field assessment of vapours 37
on emissions and hence potential changes in subsurfaceconditions may not be detected with such a device,unless long-term near-continuous emission monitoringis undertaken.
• Buildings: Because of the usually limited surface areaof coverage, flux chambers may not measure theactual flux into a built structure especially if there ispreferential access to the structure. Also, air-movementconditions within the chamber may not reflect ‘natural’room conditions in a structure – leading to over- orunder-estimation of fluxes depending on relativepressure differentials inside and outside a chamber.
6.3 Crawl-space andindoor/outdoor air sampling
Air samples can be collected from a crawl-space beneatha building to provide a more realistic measurement of avapour concentration beneath the floor space of such a structure. Assumptions (or modelling) are required toestimate a concentration within the home; however thecollection of data from a crawl-space provides a measurethat is closer to the point of exposure (when comparedwith soil gas flux methods). Samples can be collectedusing simple methods (consistent with those used tosample indoor/ambient air). Atlantic Richfield (2006)suggests that samples be collected near the mid-pointbetween the top and bottom of the crawl-space, nearthe centre of the building.
The sampling of indoor air provides a more directmeasurement of potential exposure. Methods often use time-integrated sampling (e.g. over 24 hours). Thecollection of such data is intrusive and can be difficult tointerpret; hence it is typically only undertaken after othermethods of assessing vapour issues have been explored.Table 11 summarises some advantages and disadvantagesof collecting air data from crawl-spaces and indoor air(some noted from Atlantic Richfield 2006 and ITRC 2007a).
Indoor air data are subject to large temporal variability.Meteorological and other conditions during samplingmay be important. In addition the collection of indoor airdata can be affected by significant ambient (outdoor) andindoor sources. This is particularly relevant to the samplingof petroleum hydrocarbons and some chlorinated solvents(commonly used in household products). A number ofdocuments (Atlantic Richfield 2006; ITRC 2007a; NYSDOH2006) provide detailed guidance protocols for thecollection of indoor air data to assist in the identification(and removal prior to sampling) of indoor sources andinterpretation of data collected.
Ambient (outdoor) air samples may also be collected to supplement other data collected from indoors or from a crawl-space. The data is collected to characterisebackground air conditions relevant to a specific site or area.
Table 11. Advantages and disadvantages of collecting crawl-space and indoor air samples.
Advantages
Crawl-space air:
• Simple to measure
• Does not require access into a building
• Limited interference from indoor
Indoor air:
• Simple to measure
• May provide data that residents can better understand
• Provides measurement of potential exposure concentration
Disadvantages
• Background/ambient sources may affect datainterpretation
• Not a direct measure of exposure concentrationindoors and further estimation (or modelling) of a concentration indoors is required
• Background/ambient and indoor sources complicatedata interpretation and communication to the public
• Requires access inside a building/home
• Temporal variability large
• Low reporting limits are often required
• Sample control can be more difficult to manage
6. Vapour and gas sampling and monitoring techniques

6.4 Passive implant sampling‘Passive’ implant sampling refers to the burial orplacement of an adsorbent or other material in theground, which would be recovered for analysis after an appropriate period of time (hours, days). It is termedpassive because no gas sample is actively recoveredfrom the soil profile. This technique generates a time-integrated total mass or a time-integrated equilibratedconcentration (e.g. Laor et al. 2003), so uncertaintiesassociated with temporal changes are reduced. Thetime-integrated mass cannot be equated to a concentrationbecause the volume of air associated with the adsorbedmass is largely unknown. Also, passive samplers maydesorb soil vapours from fine grained layers that areotherwise not mobile, thus overestimating the amount of soil vapours that are capable of being transported intooverlying zones. The method however enables a screeninglevel assessment of the presence of vapours in the vadosezone to identify if the vapour pathway is complete and toidentify hot spot areas for further sampling using morequantitative methods.
Passive samplers may be of benefit in areas where soilgas probes cannot be installed, in areas where preferentialpathways are suspected (or need to be assessed) orwhere very fine-grained soils limit the practicality andintegrity of sampling from soil gas probes (API 2005).
6.5 Sample collection andanalysis
The sampling methods discussed in Sections 6.1–6.4can be used in conjunction with a range of active andpassive sample collection methods and analytical methods.A range of methods/media are available to enable theanalysis of a range of volatile organic compounds (VOCs),semi-volatile organic compounds (SVOCs), non-methaneorganic compounds (NMOC) and polycyclic aromatichydrocarbons (PAHs).
Samples can be drawn through on-line detectors such as photo ionisation detectors (PIDs) and/or flameionisation detectors (FIDs) to provide a screening levelassessment of the vapour. In addition, other hand-heldmeters such as landfill gas detectors can be used toobtain field readings of key parameters such as O
2, CO
2
and methane. Other real-time monitors (e.g. mercuryvapour) can also be used depending on the compoundof concern and required reporting limit.
Samples that need to be collected and sent to alaboratory (or field GC/MS) for analysis may be collectedusing a range of media that include tubes (charcoal ormultisorbent), canisters, Tedlar bags, glass vials, andsyringes. A number of analytical methods are available,particularly in the US, with a number listed in API (2005)and ITRC (2007a) guidance. The number of methodsthat are available in Australia is more limited and anymethod selected should be considered with respect to the sampling design objectives, conceptual model,availability of analysis, and the advantages/disadvantagesof each method.
It is important to note that the specific method, list ofanalytes, QA/QC protocols vary among laboratories, sothese should be reviewed and specified in the work planprior to data collection.
The sample collection and analysis methods can begrouped into two categories: active and passive samplingmethods. The commonly used methods are discussedfurther in the following sections.
6.5.1 Active methods
Sorbents
Sorbent materials, packed into tubes, typically compriseof activated carbon and/or a range of multi-sorbentmaterials (that can include one or more different sorbentmedia in each sample tube). Vapour samples are collectedby drawing air (using pumps) at a calibrated rate throughthe tube over a specified period of time. The flow rate andsampling volume are dependent on the sorbent mediaused, the range of target chemicals and the required limit of reporting. The reporting limit is determined by the volume of air drawn through the sample tube, theadsorbent and analytical method used, and the potentialfor high concentrations (requiring dilution of the sampleduring analysis).
Figure 13 illustrates sorbent tubes that may be used forthe purpose of sampling a range of compounds (includessome passive badges discussed further in Section 6.5.2).
6. Vapour and gas sampling and monitoring techniques
CRC CARE Technical Report no. 13 Field assessment of vapours38

6. Vapour and gas sampling and monitoring techniques
CRC CARE Technical Report no. 13 Field assessment of vapours 39
Once a sample is collected, the tubes are sent to alaboratory for analysis. Common methods used includethe following:
• Solvent extraction method: A modified NIOSH method(1500 & 1501) is commonly used for the analysis of samples collected onto carbon adsorbent media.Other sorbent media can also be used for differentranges of compounds as required. This method iscommonly used in occupational monitoring and isdetailed in Australian Standard AS 2986.1-2003 (AS 2003a). Note that good quality control proceduresshould always be adopted including blanks etc. Themethod can be used to assess over 70 compoundsthat include alcohols, aliphatic and aromatichydrocarbons, chlorinated hydrocarbons, esters,ketones and complex solvents with a limit of reportingranging from 0.1 to 50 µg/tube (depending on targetanalytes).
• Thermal desorption method: US EPA TO-17 method(US EPA 1999) is used for the analysis of samplescollected onto multi-sorbent media. The methoddescribes sorbent tube/thermal desorption/gaschromatographic-based monitoring for VOCs in airwith a limit of reporting ranging from 5 to10 ng/tube or 0.4 to 20 µg/m3 depending on the volume of gasdrawn through the tube. The range of compoundsreported with this method is the same as for the TO-15 method (canisters – see below).
Key aspects of the method relevant to use of sorbents infield sampling procedures are (i) the selection of sorbentmaterials to address the target compounds, (ii) screeningexpected concentrations (using a screening methodsuch as carbon tube or data from previous work) to
assist in selecting the sampling duration and approach(to avoid saturation), (iii) sampling a range of volumeswhere expected concentrations are unknown, and (iv)collection of adequate QA samples. Table 12 summarisessome advantages and disadvantages of the use of carbonand multi-sorbent media for the collection and analysis of gas (some noted from ITRC 2007a; US EPA 1999).
Other sorbents commonly used include:
• Amberlite XAD-2 Resin Trap: This polymeric resin (and glass fibre filter) is used to collect semi-volatilecompounds from a variety of sources. Targetcompounds are removed using soxhlet extractionfollowed by a solvent exchange and concentrationstep. XAD-2 is specified in many testing methods as well as TO-13A.
• PUF Cartridge: Polyurethane foam (PUF) in conjunctionwith a glass fibre filter is used to collect organochlorinepesticides and polychlorinated biphenyls. Sampling is most often undertaken using a high volume sampler.Semi-volatile compounds are adsorbed on the surfaceof the foam; they are removed using soxhlet extraction.Often a filter is used to collect the particulates for TO-4A. Excessive exposure to organic solventsdegrades the foam. PUF is specified in TO-4A, TO-10Aand TO-13A. This method provides a limit of reportingranging from 0.5 to 1.0 µg/sample for pesticides and 1 to 2 µg/sample for PCBs.
• XAD-2/PUF Cartridge: This combination is often usedto collect ambient air semi-volatiles. Sampling is mostoften undertaken using a high volume sampler. Theresin is placed between PUF plugs in a glass cartridge.The organic compounds are adsorbed onto thesurface of either the PUF (if halogenated) or the XAD.
Figure 13. Example sorbent tubes (source: Air Toxics Ltd and SKC).

CRC CARE Technical Report no. 13 Field assessment of vapours40
Often a filter is used to collect the particulates. Thefilter is extracted along with the PUF and XAD. Thiscombination trap is specified in TO-13A. This method provides a limit of reporting that ranges from 5 to 10 µg/sample. A selective ion monitoring (SIM)method is also available that enables analysis of some
semi-volatile organic compounds (including polynucleararomatic hydrocarbons – PAHs) to a lower limit ofreporting (0.5–1.0 µg/sample). Note the limit of reportingrelevant to the air concentration is dependent on thevolume of air sampled.
Table 12. Advantages and disadvantages of the use of carbon and multi-sorbent media.
Advantages
Carbon (solvent extraction):
• Can be used to sample for longer periods of time (e.g. 8–12 hours) as method typically used in occupational environments
• Occupational monitoring pumps can be used – easy to set up and use
• Can be used to sample high concentrations
• Front and back portions of tube can be analysed to determine potential for breakthrough
• Lower cost
Multi-sorbent (TO-17):
• Low limit of reporting makes the method suitable for a wide range of sampling methods
• Lightweight and easy to handle
• A range of adsorbent materials can be packed into the tubes to address different target chemicals (e.g. petroleum versus chlorinated hydrocarbons). This may also include the inclusion of hydrophobic sorbents to assist in managing moisture in air samples
• Widely used method, evaluated for a range of conditions and compounds
Disadvantages
• High limit of reporting makes it unsuitable for somesampling methods and where public health issuesneed to be addressed (must be considered inconceptual model and sampling plan)
• Potential for saturation of media and breakthrough(resulting in loss of sample)
• Possible cross contamination due to nature of solventused in analysis (needs to be reviewed prior to sampling)
• Requires use of calibrated pumps that can adequatelydraw air through the packed tube. The flow rate at thestart, during and at the end of the sampling periodmust be monitored and recorded
• Potential for saturation of media and breakthrough(resulting in loss of sample). Sampling in series can be used to assess potential issues
• Tubes easily affected by moisture in air sampledresulting in loss of sample or highly elevated limit of reporting
• Photodegradation of samples may occur if exposed to light during transport and storage prior to analysis
• Short sampling time, typically 1–2 hours based onmedia used, how tight the tube is packed andlimitations of pumps
• Cost can be an issue where multiple samples required(different time periods as well as samples collected in series)
• Thermal desorption of sample results in one chancefor analysis. Elevated concentrations without dilutioncan damage analytical equipment and result in loss of sample
6. Vapour and gas sampling and monitoring techniques
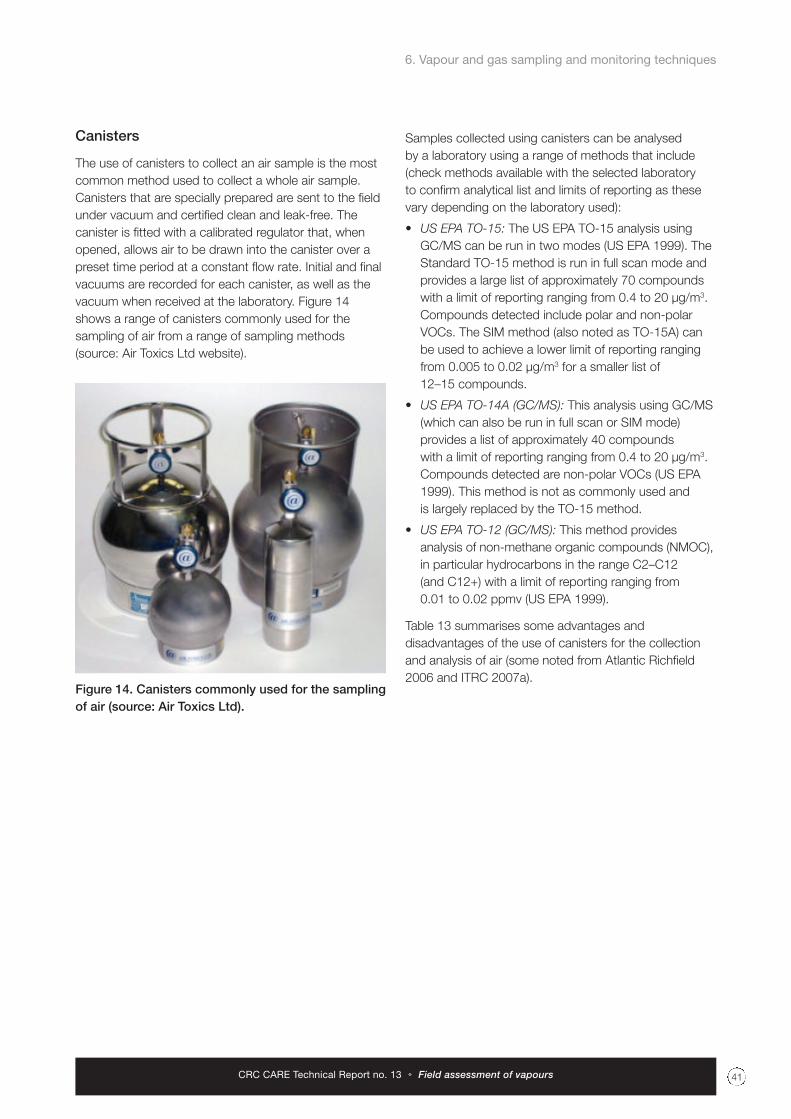
Canisters
The use of canisters to collect an air sample is the mostcommon method used to collect a whole air sample.Canisters that are specially prepared are sent to the fieldunder vacuum and certified clean and leak-free. Thecanister is fitted with a calibrated regulator that, whenopened, allows air to be drawn into the canister over apreset time period at a constant flow rate. Initial and finalvacuums are recorded for each canister, as well as thevacuum when received at the laboratory. Figure 14shows a range of canisters commonly used for thesampling of air from a range of sampling methods(source: Air Toxics Ltd website).
Samples collected using canisters can be analysed by a laboratory using a range of methods that include(check methods available with the selected laboratory to confirm analytical list and limits of reporting as thesevary depending on the laboratory used):
• US EPA TO-15: The US EPA TO-15 analysis usingGC/MS can be run in two modes (US EPA 1999). TheStandard TO-15 method is run in full scan mode andprovides a large list of approximately 70 compoundswith a limit of reporting ranging from 0.4 to 20 µg/m3.Compounds detected include polar and non-polarVOCs. The SIM method (also noted as TO-15A) canbe used to achieve a lower limit of reporting rangingfrom 0.005 to 0.02 µg/m3 for a smaller list of 12–15 compounds.
• US EPA TO-14A (GC/MS): This analysis using GC/MS(which can also be run in full scan or SIM mode)provides a list of approximately 40 compounds with a limit of reporting ranging from 0.4 to 20 µg/m3.Compounds detected are non-polar VOCs (US EPA1999). This method is not as commonly used and is largely replaced by the TO-15 method.
• US EPA TO-12 (GC/MS): This method providesanalysis of non-methane organic compounds (NMOC),in particular hydrocarbons in the range C2–C12 (and C12+) with a limit of reporting ranging from 0.01 to 0.02 ppmv (US EPA 1999).
Table 13 summarises some advantages anddisadvantages of the use of canisters for the collectionand analysis of air (some noted from Atlantic Richfield2006 and ITRC 2007a).
CRC CARE Technical Report no. 13 Field assessment of vapours 41
6. Vapour and gas sampling and monitoring techniques
Figure 14. Canisters commonly used for the samplingof air (source: Air Toxics Ltd).

6. Vapour and gas sampling and monitoring techniques
CRC CARE Technical Report no. 13 Field assessment of vapours42
Other methods
Whole air samples can also be collected using Tedlar®bags, with smaller samples also collected using syringesand glass vials. The following methods are also availablefor the analysis of these samples (ITRC 2007a):
• VOCs can be sampled using Tedlar® bags, syringesand glass vials and analysed using method 8021B or8260B (US EPA 1994). These methods can be usedfor on-site analysis (where available) and provide alimit of reporting that ranges from 10 to 100 µg/m3.
• Fixed gases (oxygen, carbon dioxide, nitrogen, carbonmonoxide and methane) can be sampled using Tedlar®bags or canisters with analysis using US EPA 3C,ASTM D-1946 or ASTM D-1945 (depending on thegases required).
• TPH can also (in addition to the TO-12 method notedabove) be sampled using Tedlar® bags or canisterswith analysis using 8015 modified method (C4-C24)and 8260 (C4-C12) method (see US EPA 1994 fordetails of methods).
• Note that Tedlar® bags should not be stored for longperiods, filled beyond half full or transported significantdistances. As such, field sites may need to be in closeproximity to analytical laboratories to allow extensive use.
6.5.2 Passive methods
Passive methods can involve the use of a wide range of sorbent materials. These materials are available in arange of forms (badges, canisters, tubes, strips) wherethe collection of compounds is based on the diffusion of the compound to the surface of the sorbent material.Common passive samplers used in Australia includebadges provided by 3M and SKC (commonly used foroccupational monitoring), Radiello samplers and Goresoil gas modules. Figure 15 shows examples of SKC andRadiello passive samplers. Other samplers/systems arealso available and can be used depending on the targetanalytes, required use and reporting limits.
Common methods for the analysis of passive samplesare the same as for the analysis of actively-sampledadsorbent media, namely solvent extraction and thermaldesorption (depending on the passive sampler used), asoutlined in Section 6.5.1. Passive sampling methods andmedia are commonly used in occupational monitoringand are detailed in Australian Standard AS 2986.2-2003(AS 2003b).
The range of compounds that are commonly analysedwith passive sorbents include petroleum hydrocarbons,chlorinated hydrocarbons, ammonia, aldehydes, phenolsand creosols, hydrogen chloride, hydrogen fluoride,
Table 13. Advantages and disadvantages of the use of canisters.
Advantages
• Low limit of reporting (0.4–20 µg/m3 for TO-15 and TO-14A, and 0.005–0.02 µg/m3 for TO-15A) makes the method suitable for a wide range of sampling methods
• No pumps required and hence sampling procedure is straightforward
• Sample can be collected over extended periods, up to 24 or 48 hours
• Not subject to interference from moisture issues, saturation or breakthrough
• Analysis only uses part of the air sample collected enabling re-analysis in the laboratory without the requirement to resample
• Where chlorinated VOCs, particularly vinyl chloride is present the method is more reliable (achieving low limit of reporting) than tubes (Hayes et al. 2009)
Disadvantages
• Can be expensive and bulky to ship to laboratory(however cost can be comparable to multi-sorbenttubes)
• Recovery of analytes of higher molecular weight thannaphthalene can be poor (McAlary, Groenevelt et al.2009), hence the suitability of the method for theseanalytes (if required) needs to be checked with thelaboratory
• Care must be taken when using canisters to sample in low permeability soil to ensure sample flow rates are sufficiently low
• Must be certified clean by laboratory

hydrogen sulphide, ozone, nitrogen dioxide and sulphurdioxide. Other compounds can be targeted usingpassive methods depending on the sorbent materials/housings used, the ability to assess uptake (diffusion)rates, and analysis methods. The limit of reporting variesdepending on the sampler (sorbent material) used, theanalysis method and the sample time.
The use of a passive sampling system, selection ofappropriate sampler (to adequately address the range ofcompounds required), sampling time and analysis methodshould be considered in the design of the sampling plan.Table 14 summarises some advantages and disadvantagesof the use of passive sampling media for the collectionand analysis of air (some noted from Hodny et al. 2007;ITRC 2007a).
6. Vapour and gas sampling and monitoring techniques
CRC CARE Technical Report no. 13 Field assessment of vapours 43
Figure 15. Examples of passive sampling devices (source: SKC and Radiello* ).
Table 14. Advantages and disadvantages of the use of passive sampling media.
Advantages
• Can be used to sample over a long period of time such as days and even weeks. This lowers the potential for sample variability
• Can achieve low limit of reporting (dependant on sample time and sampling method used)
• Simple to install, lightweight and easy to use
• Can be used to sample soil gas in a wide range of conditions, including high soil moisture (provided appropriate media is selected)
• No mechanical parts required such as pumps or calibrated flow controllers
• Inexpensive to deploy and analyse making the method suitable for use in screening level assessments to identify hot spots
Disadvantages
• Considered a qualitative method
• In some circumstances, passive data can be used as a quantitative measure of concentration. However,this is dependent on concentration in air sampled,time sampled and for some samplers the movementof air past the sampler. The concentration based ondiffusion principles (uptake rates) and reliability ofquantifying should be assessed as part of the QA/QCfor each sample
• Potential for saturation of sorbent
• Potential for desorbing gases off fine-grained materials
* Fondazione Salvatore Maugeri, Centro di Ricerche Ambientali, Padova, Italy: www.radiello.it

6. Vapour and gas sampling and monitoring techniques
CRC CARE Technical Report no. 13 Field assessment of vapours44
6.5.3 Summary of common methods
Table 15 presents a summary of the common active andpassive sample collection and analysis methods used as part of a vapour sampling program. It provides, inrelative terms, a comparison between methods based on Australian experience and information presented by Hodny et al. (2007) and Hayes et al. (2009). The use of any sample collection and analysis method should be considered within the scope and objectives of thesampling plan and site-specific requirements. There are a wide range of methods available. Target compoundsand reporting limits should be considered in the processof selecting the most appropriate method(s) to be usedon any particular site.
Table 15. Overview of common sample collection and analysis methods.
Active methods Passive methods
Sampling media Activated carbon Multi-sorbent Canisters Range of sorbentstubes tubes
Analytical method(s) Modified NIOSH TO-17 TO-15, TO-14A, Wide range including solvent extraction TO-12 modified NIOSH and method TO-17
Detection level High Low Low Low to high
CostAnalytical Low High High ModerateShipping Low Low High LowEquipment Moderate High Low NA
LabourField Moderate to high High Low LowEvaluation Moderate to high Moderate to high Low to moderate High
ComplexitySampling Low to moderate High Low to moderate Low

CRC CARE Technical Report no. 13 Field assessment of vapours 45
1. Conceptual site model (CSM): A conceptual sitemodel (CSM) of vapour risk embodies a clearstatement of what is to be evaluated or protected,and an understanding of site conditions, potentialvapour behaviour and priorities for investigation.Along with data quality objectives (DQOs), it serves as the basis for vapour risk assessment (includingidentification of compounds of interest).
2. Guidance documentation: Extensive vapour intrusionand assessment guidance documentation have beendeveloped within the United States of America, bothfederally and through individual states. Industry alsohas developed thorough guidance. This is in contrastto the limited vapour assessment guidance availablefor other countries, although some have been recentlydeveloped or are in preparation (e.g. Canada, UK).
3. Staged approach: A staged approach (Tier 1, 2, 3 or 4)for vapour assessment is generally adopted acrossnearly all guidance documentation. The breadth ofwork and/or investigation required in each stage isnot uniform across the available guidance. The stagesof investigation for vapour assessment do not alwaysalign with accepted stages of a more general siteinvestigation (Phase I or Phase II ESAs, or PSIs andDSIs). For Australia, greater definition of the informationrequired for a vapour assessment (such as buildingfeatures, local utilities etc.) in a preliminary siteinvestigation (Phase I ESA) would be an advantage.
4. Screening, Tier 1 assessment: There is substantiatinginformation and adoption across some jurisdictions ofan exclusion distance approach, whereby if a propertyor building is beyond a set distance to the edge of the vapour source, then it can be excluded fromfurther investigation. An exclusion distance approachseems applicable at a Tier 1 screening level in Australia,provided the distance to the edge of the source canbe adequately characterised. The approach could beapplied as an initial screening option prior to comparisonof site data to screening level HILs.
5. Non-vapour investigation: Where soil vapourassessment techniques are not used at Tier 1, thensoil and/or groundwater investigations will be requiredto assist in the definition of the exclusion distance orto provide data for comparison to HIL screening values.Presently, in Australia, the definition of the level of siteinvestigation required to apply Tier 1 screening (byexclusion distance or by comparison to HILs) is unclear.The NEPM-ASC requires the site investigation to be ‘uniform’ and delivering an ‘appropriate amount of information’.
6. Basis for HILs: In the United States of America soilgas data are often preferred to soil data for Tier 1screening criteria, since the soil gas (vapour phase)poses the direct inhalation risk to human health.Currently in Australia only soil concentrations are usedto compare to HILs. Presuming sampling methodsare reliable, soil gas concentration data would seemapplicable in Australia for screening sites for vapourrisk by comparison to soil gas HILs (as an alternate to soil concentrations).
7. Vapour assessment techniques: A variety of vapourassessment techniques are available. Advantagesand disadvantages of many are tabulated. Choices of vapour investigation approaches should addressthe CSM and DQOs identified for the site, compoundsof interest and target improvement and modificationof the CSM.
8. Locations and depths: Guidance documentsrecommend a number of approaches. Commonelements are, where required, (i) subsurface soil gassamples should be taken no shallower than 1 m unlessadequately justified as appropriate, (ii) to determinethe maximum vapour concentrations in the subsurface,samples should be recovered as close as possible to the source be it groundwater, NAPL or soil sources (it is acknowledged that this may be particularly difficultfor groundwater or deep sources), and (iii) depthprofiles can be useful. It is also acknowledged thatsubsurface utilities such as pipe and sewer lines canact as conduits for lateral and vertical transport ofvapours, and in the case of sewer lines can act as a potential source of volatile compounds. Samplingplans should accommodate such site features, or be flexible enough to allow for them.
7. Summary observations

7. Summary observations
CRC CARE Technical Report no. 13 Field assessment of vapours46
9. Transients: Seasonal and short-term atmosphericchanges (barometric, etc.) can influence vapourconcentrations but this effect decreases sharply with depth depending on the period of the transientdisturbance and the re-equilibration time of the vapourconcentrations through the soil profile. Vapour behaviourmay need to be assessed over time where shallowsampling occurs.
10.Vapour compounds: Most experience andinvestigations have been carried out for petroleumhydrocarbons and chlorinated solvent vapours. Whilstthe techniques and approaches may be valid for usefor other volatile compounds, for some compounds(e.g. mercury, butadiene) there is limited experienceand careful adoption of approaches would be required.

8.1 All documents referencedAbreu, LDV & Johnson, PC 2005, ‘Effect of vaporsource-building separation and building construction onsoil vapor intrusion as studied with a three-dimensionalnumerical model’, Environmental Science andTechnology 39(12), 4550-4561.
API (American Petroleum Institute) 1998, Assessing thesignificance of subsurface contaminant vapor migrationto enclosed spaces: site-specific alternatives to genericestimates, API Publication No. 4674.
API (American Petroleum Institute) 2005, Collecting andinterpreting soil gas samples from the vadose zone. Apractical strategy for assessing the subsurface vapour-to-indoor air migration pathway at petroleum hydrocarbonsites, Regulatory Analysis and Scientific Affairs, APIPublication No. 4741.
AS (Australian Standard) 1999, Guide to the samplingand investigation of potentially contaminated soil. Part 2:Volatile substances, Standards Australia, AS 4482.2-1999.
AS (Australian Standard) 2003a, Workplace air quality –Sampling and analysis of volatile organic compounds bysolvent desorption/gas chromatography. Part 1: Pumpedsampling method, AS 2986.1-2003, Standards AustraliaDecember 2003.
AS (Australian Standard) 2003b, Workplace air quality –Sampling and analysis of volatile organic compounds bysolvent desorption/gas chromatography, Part 2: Diffusivesampling method, AS 2986.2-2003, Standards AustraliaDecember 2003.
AS (Australian Standard) 2005, Guide to the investigationand sampling of sites with potentially contaminated soil.Part 1: Non-volatile and semi-volatile compounds,Standards Australia, AS 4482.1-2005.
ASTM 1992, Standard guide for soil gas monitoring in thevadose zone, D5314-92 (reapproved 2001), pp. 1161-1196, American Society for Testing and Materials.
ASTM 1995, Standard guide for risk based correctiveaction applied at petroleum release sites, Public No.E1739-95, (reapproved 2002), American Society forTesting and Materials.
ASTM 2005, Standard practice for environmental siteassessments: Phase I environmental site assessmentprocess, E1527 – 05, American Society for Testing and Materials.
ASTM 2008, Standard practice for assessment of vaporintrusion into structures on property involved in real estatetransactions, E2600 – 08, ASTM International.
Atlantic Richfield 2006, Recommended practices manualfor making decisions about vapor intrusion, prepared byB Eklund & VJ Kremesec for Atlantic Richfield Company(BP affiliated company), September 2006 (Commercial in Confidence).
Barber C & Briegel D 1987, ‘A method for the in situdetermination of dissolved methane in groundwater inshallow aquifers’, Journal of Contaminant Hydrology 12,51-60.
Barber, C, Davis, GB, Briegel, D & Ward, JK 1990,‘Factors controlling the concentration of methane andother volatiles in groundwater and soil-gas around a wastesite’, Journal of Contaminant Hydrology 5, 155-169.
CIRIA 2007, Assessing risks posed by hazardous groundgases to buildings, Report C665.
CIRIA 2009, The VOCs handbook: investigating, assessingand managing risks from inhalation of VOCs at landaffected by contamination, Report C766, London.
Corapcioglu, MY & Baehr, AL 1987, ‘A compositionalmultiphase model for groundwater contamination bypetroleum products: 1. Theoretical considerations’,Water Resources Research 23(1), 191-200.
County of San Diego Department of Environmental Health2004, Site Assessment and Mitigation (SAM) Manual.
Crumbling, DM 2002, ‘In search of representativeness:evolving the environmental data quality model’, QualityAssurance 9, 179-190.
Davis, GB & Barber, C 1989, ‘Methane volatilisation fromcontaminated groundwater; the effects of recharge’,Contaminant Transport in Groundwater, Int. IAHR Symp,Stuttgart, April 1989, pp. 445-450.
CRC CARE Technical Report no. 13 Field assessment of vapours 47
8. References

CRC CARE Technical Report no. 13 Field assessment of vapours48
Davis, GB, Trefry, MG, Öhman, J & Rayner, JL 2001,‘Nitrogen flushing field experiments to determine thenatural biodegradation of gasoline vapours in a sandyvadose zone’, Proc. First European BioremediationConference, Chania-Crete, Greece, 2-5 July 2001, pp. 9-12.
Davis, GB, Trefry, MG & Patterson, BM 2004, Petroleumand solvent vapours: quantifying their behaviour,assessment and exposure, CSIRO Land and Water Reportto the Western Australian Department of Environment.
Davis, GB, Woodbury, RJ, & Bastow, TP 2004,Investigation of the presence and distribution of subsurfacehydrocarbon vapours at the Bellevue Waste Control Site,CSIRO Land and Water Report to the Western AustralianDepartment of Environment.
Davis, GB, Rayner, JL, Trefry, MG, Fisher, SJ & Patterson,BM 2005, ‘Measurement and modelling of temporalvariations in hydrocarbon vapor behavior in a layered soilprofile’, Vadose Zone Journal 4(2), 225-239.
Davis, GB, Patterson, BM & Trefry, MG 2006, ‘Typicalbehaviour of petroleum and solvent vapours: updatingour understanding from Australian field investigations’,Enviro06: Managing Contaminated Land and Groundwater,Melbourne, Australia, 9-11 May 2006, 8 pp.
Davis, GB, Merrick, NP & McLaughlan, RG 2006,Protocols and techniques for characterising sites withsubsurface petroleum hydrocarbons – a review, TechnicalReport no. 2, CRC for Contamination Assessment andRemediation of the Environment, Adelaide, Australia.
Davis, GB, Patterson, BM & Trefry, MG 2009a,Biodegradation of petroleum hydrocarbon vapours,Technical Report no. 12, CRC for ContaminationAssessment and Remediation of the Environment,Adelaide, Australia.
Davis, GB, Patterson, BM & Trefry, MG 2009b, ‘Evidencefor instantaneous oxygen-limited biodegradation ofpetroleum hydrocarbon vapours in the subsurface’,Ground Water Monitoring & Remediation 29(1), 126-137.
Davis, GB, Trefry, MG and Patterson, BM 2009,Petroleum vapour model comparison, Technical Reportno. 9, CRC for Contamination Assessment and Remediationof the Environment, Adelaide, Australia.
Davis, JW & Carpenter, CL 1990, ‘Aerobic biodegradationof vinyl chloride in ground-water samples’, AppliedEnvironmental Microbiology 56(12), 3878-3880.
DeVaull, GE 2007, ‘Indoor vapor intrusion with oxygen-limited biodegradation for a subsurface gasoline source’,Environmental Science and Technology 41(9), 3241-3248.
DiGuilio, DC, Paul, CJ, Cody, R, Willey, R, Clifford, S,Kahn, P, Mosley, R, Lee, A & Christensen, K 2006,Assessment of vapor intrusion in homes near the RaymarkSuperfund site using basement and sub-slab air samples,prepared for the US EPA, March 2006, EPA/600/R-05/147.
DTSC 2005, Guidance for the evaluation and mitigationof subsurface vapour Intrusion to indoor air, Departmentof Toxic Substances Control, California EnvironmentalProtection Agency, interim final, revised February 2005,105 pp.
DTSC 2009, Vapour intrusion mitigation advisory,Department of Toxic Substances Control, CaliforniaEnvironmental Protection Agency, April 2009.
Eklund, B 2007, ‘What you can learn from an airhead:application of air quality principles to vapor intrusionstudies’, presented at A&WMA Specialty Conference,Vapor Intrusion: Learning from the Challenges, ProvidenceRhode Island, September 2007.
Eklund, BM & Schmidt, C 1990, ‘Estimation of baselineair emissions at superfund sites’, Air/Superfund NationalTechnical Guidance Study Series, Vol II, EPA-450/1-89-002a.
Eklund, BM, Folkes, DJ, Kabel, J & Farnum, R 2007, ‘Anoverview of state approaches to vapour intrusion’, EMMagazine of the Air and Waste Management Association,February 2007, 10-14.
Evans, D, Hers, I, Wolters, RM, Boddington, RTB & Hall,DH 2002, Vapour transfer of soil contaminants, R&DTechnical Report P5-018/TR, Environment Agency, RioHouse, Waterside Drive, Aztec West, Almondsbury,Bristol BS32 4UD, UK.
Friebel, E & Nadebaum, P 2009, HSLs for petroleumhydrocarbons in soil and groundwater – technicaldevelopment document, Technical Report no. 10: Part 1(DRAFT), CRC for Contamination and Remediation of theEnvironment, Adelaide, Australia.
Gliński J & Stępniewski, W 1985, Soil Aeration and ItsRole for Plants, CRC Press Inc Boca Raton, Florida.
Golder Associates Ltd 2007, Guidance manual forenvironmental site characterisation in support of humanhealth risk assessment, final draft report. Volume ITechnical guidance; Volume II Checklists; Volume IIISuggested operating procedures. Report for HealthCanada, December 2007.
8. References

CRC CARE Technical Report no. 13 Field assessment of vapours 49
Golder Associates Ltd 2008, Evaluation of vadose zonebiodegradation of petroleum hydrocarbons: implicationsfor vapour intrusion guidance, final draft report, researchstudy for Health Canada and Canadian PetroleumProducts Institute, June 2008.
Grathwohl, P 1998, Diffusion in Natural Porous Media:Contaminant Transport, Sorption/Desorption andDissolution Kinetics, Kluwer Academic Publishers, Boston.
GWMR 2009, ‘Focus issue on vapours’, Ground WaterMonitoring & Remediation vol. 29, issue 1.
Hartman, B 2002, ‘How to collect reliable soil-gas datafor upward risk assessments, Part 1: active soil-gasmethod’, LUSTLine Bulletin 42, October 2002, pp. 17-22.
Hartman, B 2003, ‘How to collect reliable soil-gas datafor upward risk assessments, Part 2: surface flux-chambermethod’, LUSTLine Bulletin 44, August 2003, pp. 14-18and 34.
Hartman, B 2006, ‘How to collect reliable soil-gas datafor risk-based applications – specifically vapor intrusion,Part 4: updates on soil-gas collection and analyticalprocedures’, LUSTLine Bulletin 53, September 2006, pp. 14-19.
Hayes, H, Desrosiers, J, Valle, P & Anderson, E 2009,‘Comparison of TO-15, TO-17 and a modified NIOSHsampling method for investigating indoor air outside theUnited States’, presented at A&WMA Vapor IntrusionConference, San Diego, January 2009.
Heggie, A & Stavropoulos, B 2008, A comparative studyof passive and active soil gas Measurement techniquesat a TCE site, 18th Annual AEHS Meeting and WestCoast Conference on Soils, Sediments, and Water,March 10-13, 2008, San Diego.
Hodny, JW, Whetzel, JE & Anderson, HS 2007, Vaporintrusion investigations and passive sampling, presentedat A&WMA Specialty Conference, Vapor Intrusion:Learning from the Challenges, Providence Rhode Island,September 2007.
ITRC 2003, The Triad approach: a new paradigm forenvironmental project management, Interstate Technology& Regulatory Council, December 2003, 64 pp. plusappendices.
ITRC 2007a, Vapor intrusion pathway: a practicalguideline, Technical and Regulatory Guidance preparedby the Interstate Technology & Regulatory Council VaporIntrusion Team, January 2007.
ITRC 2007b, Vapor intrusion pathway: investigativeapproaches for typical scenarios, (a supplement to ‘Vaporintrusion pathway: a practical guideline’), Technical andRegulatory Guidance Supplement prepared by theInterstate Technology & Regulatory Council Vapor IntrusionTeam, January 2007.
Jin, Y & Jury, WA 1996, ‘Characterizing the dependenceof gas diffusion coefficient on soil properties’, Soil ScienceSociety of America Journal 60(1), 66-71.
Johnson, PC & Ettinger, RA 1991, ‘Heuristic model forpredicting the intrusion rate of contaminant vapors intobuildings’, Environmental Science and Technology 25(8),1445-1452.
Kansas DHE 2007, Kansas vapour intrusion guidance.Chemical vapour intrusion and residential indoor air,Kansas Department of Health and Environment.
Kienbusch, MR 1986, Measurement of gaseous emissionrates from land surfaces using an emission isolation fluxchamber, users guide, EPA/600/8-86/0008, prepared forthe US EPA (United States Environmental ProtectionAgency) Environmental Monitoring Systems Laboratory.
Laor Y, Ronen D & Graber ER 2003, ‘Using a passivemultilayer sampler for measuring detailed profiles of gas-phase VOCs in the unsaturated zone’, EnvironmentalScience and Technology 37 (2), 352-360.
Lowell, PS & Eklund, B 2004, ‘VOC emission fluxes as afunction of lateral distances from the source’, EnvironmentalProgress 23(1), 52-58.
Lundegard, PD, Johnson, PC & Dahlen, P 2008, ‘Oxygentransport from the atmosphere to soil gas beneath aslab-on-grade foundation overlying petroleum-impactedsoil’, Environmental Science and Technology 42(15),5534-5540.
McAlary, TA & Creamer, T 2006, ‘The effects of purge rateand volume on sub-slab soil gas samples’, presented atRemediation of Chlorinated and Recalcitrant Compounds,Monterey, CA, May 2006.
McAlary, T, Groenevelt, H, Gorecki, T, Seethapathy, S & Hayes, H 2009, ‘PDMS membrane samplers forquantitative passive monitoring of soil vapor intrusion to indoor air’, presented at A&WMA Vapor IntrusionConference, San Diego, January 2009.
McAlary, TA, Nicholson, P, Groenevelt, H & Bertrand, D2009, ‘A case study of soil-gas sampling in silt and clay-rich (low-permeability) soils’, Ground Water Monitoring& Remediation 29(1), 144-152.
8. References

McHugh, TE 2008, Recommendations for the investigationof vapor intrusion. ESTCP Project ER-0423, prepared forthe Environmental Security Technology CertificationProgram, April 2008.
McHugh, TE & Nickels, TN 2008, Detailed field investigationof vapor intrusion processes, final report, ESTCP ProjectER-0423, prepared for the Environmental SecurityTechnology Certification Program, September 2008.
Millington, RJ & Quirk, JP 1961, ‘Permeability of poroussolids’, Transactions of the Faraday Society 57, 1200-1207.
Minnesota PCA 2008, Risk-based guidance for the vapourintrusion pathway: Superfund RCRA and voluntarycleanup section, Minnesota Pollution Control Agency,September 2008.
NEPC-ASC 1999, National Environment Protection(Assessment of Site Contamination) Measure (NEPM),National Environmental Protection Council (NEPC), Australia.
NEPC-ASC 2006, National Environment Protection(Assessment of Site Contamination) Measure review:review report, National Environmental Protection Council(NEPC) Service Corporation, Australia.
NEPC-AT 2004, National Environment Protection (AirToxics) Measure, National Environmental ProtectionCouncil (NEPC), Australia.
NSW DECC 2009, ‘Guidance note on vapour intrusion’(draft for consultation only – currently being finalised),NSW Department of Environment and Climate Change.
NYSDOH 2006, Guidance for evaluating soil vaporintrusion in the State of New York, New York StateDepartment of Health, October 2006.
Patterson, BM & Davis, GB 2008, ‘An in situ device tomeasure oxygen in the vadose zone and in groundwater:laboratory testing and field evaluation’, Ground WaterMonitoring & Remediation 28(2), 68-74.
Patterson, BM & Davis, GB 2009, ‘Quantification ofvapour intrusion pathways into a slab-on-ground buildingunder varying environmental conditions’, EnvironmentalScience and Technology 43(3), 650-656.
Patterson, BM, Davis, GB & Johnston, CD 1999,‘Automated in situ devices for monitoring of VOCs andoxygen in water and soil environments’, in CD Johnston(ed.), Contaminated Site Remediation: Challenges Posedby Urban and Industrial Contaminants, Proc. 1999Contaminated Site Remediation Conference, Fremantle,Western Australia, 21-25 March 1999, 227-234.
Patterson, BM, Davis, GB & McKinley, AJ 2000, ‘Volatileorganic compounds in groundwater, probes for theanalysis of’, in RA Meyers (ed.), Encyclopedia of AnalyticalChemistry: Instrumentation and Application, John Wileyand Sons Ltd, 3515-3526.
Reinhart, DR, Cooper, DC & Walker, BL 1992, ‘Fluxchamber design and operation for the measurement of municipal solid waste landfill gas emission rates’,Journal of the Air and Waste Management Association42, 1067-1070.
Roggemans, S, Bruce, CL, Johnson, PC & Johnson, RL2001, ‘Vadose zone natural attenuation of hydrocarbonvapors: an empirical assessment of soil gas vertical profiledata’, American Petroleum Institute Bulletin No. 15, 12 pp.
Rose, CW 1966, Agricultural Physics, Pergamon Press,New York.
Sanders, PF & Stern, AH 1994, ‘Calculation of soil cleanupcriteria for carcinogenic volatile organic compounds ascontrolled by the soil-to-indoor air exposure pathway’,Environmental Toxicology and Chemistry 13, 1367-1373.
Schumacher, BA, Zimmerman, JH, Sibert, CR, Varner,KE & Riddick, LA 2009, ‘Macro- and micro-purge soil-gas sampling methods for the collection of contaminantvapors’, Groundwater Monitoring & Remediation 29(1),138-143.
Shell Global Solutions 2005, Soil vapor sampling at Shellretail gasoline release sites: assessing the potential forsubsurface vapor to indoor air migration, prepared byGeorge DeVaull and Denis Brown, March 2005. Documentreferenced with permission from Shell Global Solutions(Commercial in Confidence).
Shell Global Solutions 2009, Vapour intrusion – petroleumhydrocarbons: Technical Position Paper, January 2009,Version 1.1. Document referenced with permission fromShell Australia Pty Ltd (Commercial in Confidence).
Turczynowicz, L 2003, ‘Establishing health-basedinvestigation levels for benzene, toluene, ethyl benzene,xylenes, naphthalene, and aromatic and aliphatic ≤EC16TPH fractions’, in A Langley, M Gilbey & B Kennedy(eds), Health and Environmental Assessment of SiteContamination, Proceedings of the Fifth NationalWorkshop on the Assessment of Site Contamination,Adelaide 13-15 May 2002. Published by the AustralianEnvironmental Protection and Heritage Council (EPHC)incorporating the National Environmental ProtectionCouncil (NEPC), pp.73-100.
CRC CARE Technical Report no. 13 Field assessment of vapours50
8. References

8. References
CRC CARE Technical Report no. 13 Field assessment of vapours 51
UK EA (Environment Agency) 2005, Review of buildingparameters for the development of a soil vapour intrusionmodel, Report P5-079/PR.
URS 2008, Flux emission sampling fieldwork procedure,July 2008.
US DoD 2009, DoD vapor intrusion handbook, The Tri-Service Environmental Risk Assessment Workgroup,United States of America Department of Defense, 164 pp.
US EPA 1994, Test methods for evaluating solid waste,physical/chemical methods (SW-846), (first approved1994, with subsequent updates to methods), U.S.Environmental Protection Agency, Washington, D.C.
US EPA 1995, Use of risk-based decision-making in USTcorrective action programs, OSWER Directive 9610.17,U.S. Environmental Protection Agency, Office of SolidWaste and Emergency Response, Ariel Rios Building,5202G, 1200 Pennsylvania Ave, NW, Washington, D.C.20460, March 1995.
US EPA 1999, Compendium of methods for thedetermination of toxic organic compounds in ambient air,second edition, EPA/625/R-96/010b, January 1999, U.S.Environmental Protection Agency.
US EPA 2002, Draft guidance for evaluating the vaporintrusion to indoor air pathway from groundwater andsoils (subsurface vapor intrusion guidance), U.S.Environmental Protection Agency, Office of Solid Wasteand Emergency Response, Ariel Rios Building, 5202G,1200 Pennsylvania Ave, NW, Washington, D.C. 20460.
US EPA 2006, Guidance on systematic planning usingthe Data Quality Objectives process (QA/G-4),EPA/240/B-06/001, February 2006, U.S. EnvironmentalProtection Agency.
US EPA 2008, Brownfields technology primer: vaporintrusion considerations for redevelopment, EPA 542-R-08-001, March 2008, U.S. Environmental ProtectionAgency, Office of Solid Waste and Emergency Response,Washington, D.C. 20460.
Zimmerman, JH & Schumacher, BA 2004, ‘To purge or not to purge? VOC concentration changes during linevolume purging’, presentation at National EnvironmentalMonitoring Conference, Washington D.C., July 19-22,2004.
8.2 Guidance documentsAPI (American Petroleum Institute) 1998, Assessing thesignificance of subsurface contaminant vapor migrationto enclosed spaces: site-specific alternatives to genericestimates, API Publication No. 4674.
API (American Petroleum Institute) 2005, Collecting andinterpreting soil gas samples from the vadose zone. Apractical strategy for assessing the subsurface vapour-to-indoor air migration pathway at petroleum hydrocarbonsites, Regulatory Analysis and Scientific Affairs, APIPublication No. 4741.
AS (Australian Standard) 1999, Guide to the samplingand investigation of potentially contaminated soil. Part 2:Volatile substances, Standards Australia, AS 4482.2-1999.
AS (Australian Standard) 2003a, Workplace air quality –Sampling and analysis of volatile organic compounds bysolvent desorption/gas chromatography, Part 1: Pumpedsampling method, AS 2986.1-2003, Standards AustraliaDecember 2003.
AS (Australian Standard) 2003b, Workplace air quality –Sampling and analysis of volatile organic compounds bysolvent desorption/gas chromatography, Part 2: Diffusivesampling method, AS 2986.2-2003, Standards AustraliaDecember 2003.
AS (Australian Standard) 2005, Guide to the investigationand sampling of sites with potentially contaminated soil.Part 1: Non-volatile and semi-volatile compounds,Standards Australia, AS 4482.1-2005.
ASTM 1992, Standard guide for soil gas monitoring in the vadose zone, D5314-92 (reapproved 2001), pp. 1161-1196, American Society for Testing and Materials.
ASTM 1995, Standard guide for risk based correctiveaction applied at petroleum release sites, Public no.E1739-95, (reapproved 2002), American Society forTesting and Materials.
ASTM 2005, Standard practice for environmental siteassessments: Phase I environmental site assessmentprocess, E1527 – 05, American Society for Testing and Materials.
ASTM 2008, Standard practice for assessment of vaporintrusion into structures on property involved in realestate transactions, E2600 – 08, ASTM International.
CIRIA 2007, Assessing risks posed by hazardous groundgases to buildings, Report C665.

CIRIA 2009, The VOCs handbook: investigating,assessing and managing risks from inhalation of VOCs atland affected by contamination, Report C766, London.
County of San Diego Department of EnvironmentalHealth 2004, Site Assessment and Mitigation (SAM)Manual.
DTSC 2005, Guidance for the evaluation and mitigationof subsurface vapour Intrusion to indoor air, Departmentof Toxic Substances Control, California EnvironmentalProtection Agency, Interim Final, revised February 2005,105 pp.
DTSC 2009, Guide to the sampling and investigation ofpotentially contaminated soil. Part 2: Volatile substances,Department of Toxic Substances Control, CaliforniaEnvironmental Protection Agency, April 2009.
Evans, D, Hers, I, Wolters, RM, Boddington, RTB & Hall,DH 2002, Vapour transfer of soil contaminants, R&DTechnical Report P5-018/TR, Environment Agency, RioHouse, Waterside Drive, Aztec West, Almondsbury,Bristol BS32 4UD, UK.
Golder Associates Ltd 2007, Guidance manual forenvironmental site characterisation in support of humanhealth risk assessment, final draft report. Volume ITechnical guidance; Volume II Checklists; Volume IIISuggested operating procedures. Report for HealthCanada, December 2007.
Golder Associates Ltd 2008, Evaluation of vadose zonebiodegradation of petroleum hydrocarbons: implicationsfor vapour intrusion guidance, final draft report, researchstudy for Health Canada and Canadian PetroleumProducts Institute, June 2008.
ITRC 2003, The Triad approach: a new paradigm forenvironmental project management, Interstate Technology& Regulatory Council, December 2003, 64 pp. plusappendices.
ITRC 2007a, Vapour intrusion pathway: a practicalguideline, Technical and Regulatory Guidance preparedby the Interstate Technology & Regulatory Council VaporIntrusion Team, January 2007.
ITRC 2007b, Vapour intrusion pathway: investigativeapproaches for typical scenarios, (a supplement to‘Vapour intrusion pathway: a practical guideline’), Technicaland Regulatory Guidance Supplement prepared by theInterstate Technology & Regulatory Council VaporIntrusion Team, January 2007.
Kansas DHE 2007, Kansas vapour intrusion guidance.Chemical vapour intrusion and residential indoor air,Kansas Department of Health and Environment.
Minnesota PCA 2008, Risk-based guidance for the vapourintrusion pathway: Superfund RCRA and voluntarycleanup section, Minnesota Pollution Control Agency,September 2008.
NEPC-ASC 1999, National Environment Protection(Assessment of Site Contamination) Measure (NEPM),National Environmental Protection Council (NEPC),Australia.
NEPC-ASC 2006, National Environment Protection(Assessment of Site Contamination) Measure review:review report, National Environmental Protection Council(NEPC) Service Corporation, Australia.
NEPC-AT 2004, National Environment Protection (AirToxics) Measure, National Environmental ProtectionCouncil (NEPC), Australia.
NSW DECC 2009, ‘Guidance note on vapour intrusion’(draft for consultation only – currently being finalised),NSW Department of Environment and Climate Change.
NYSDOH 2006, Guidance for evaluating soil vaporintrusion in the State of New York, New York StateDepartment of Health, October 2006.
UK EA (Environment Agency) 2005, Review of buildingparameters for the development of a soil vapour intrusionmodel, Report P5-079/PR.
US DoD 2009, DoD vapor intrusion handbook, The Tri-Service Environmental Risk Assessment Workgroup,United States of America Department of Defense, 164 pp.
US EPA 1994, Test methods for evaluating solid waste,physical/chemical methods (SW-846), (first approved1994, with subsequent updates to methods), U.S.Environmental Protection Agency, Washington, D.C.
US EPA 1995, Use of risk-based decision-making in USTcorrective action programs, OSWER Directive 9610.17,U.S. Environmental Protection Agency, Office of SolidWaste and Emergency Response, Ariel Rios Building,5202G, 1200 Pennsylvania Ave, NW, Washington, D.C.20460, March 1995.
US EPA 1999, Compendium of methods for thedetermination of toxic organic compounds in ambient air,second edition, EPA/625/R-96/010b, January 1999, U.S.Environmental Protection Agency.
CRC CARE Technical Report no. 13 Field assessment of vapours52
8. References

US EPA 2002, Draft guidance for evaluating the vaporintrusion to indoor air pathway from groundwater andsoils (subsurface vapor intrusion guidance), U.S.Environmental Protection Agency, Office of Solid Wasteand Emergency Response, Ariel Rios Building, 5202G,1200 Pennsylvania Ave, NW, Washington, D.C. 20460.
US EPA 2006, Guidance on systematic planning usingthe Data Quality Objectives process (QA/G-4),EPA/240/B-06/001, February 2006, U.S. EnvironmentalProtection Agency.
US EPA 2008, Brownfields technology primer: vaporintrusion considerations for redevelopment, EPA 542-R-08-001, March 2008, U.S. Environmental ProtectionAgency, Office of Solid Waste and Emergency Response,Washington, D.C. 20460.
CRC CARE Technical Report no. 13 Field assessment of vapours 53
8. References

CRC CARE Technical Report no. 13 Field assessment of vapours54

Volatilisation and partitioningfrom vapour sourcesVapours can emanate (partition) from (i) a NAPL phase,(ii) groundwater, or (iii) the soil profile itself if sorbedorganic compounds are present.
NAPL-air partitioning
Partitioning from a NAPL phase into an air phase can bedescribed by Raoult’s Law (Corapcioglu & Baehr 1987),which gives the concentration (Ci,g in mg L-1) of the i-thcompound in a gas phase in equilibrium with a NAPLphase as:
Ci,g = (1)
where Mi (mg mole-1) is the molecular weight of thecompound, pi (Pa) is the vapour pressure of the pure i-thcompound (as a single component), χi is the mole fractionof the i-th component in the NAPL, γi is the activitycoefficient of the i-th component, R is the universal gasconstant (8314 litres Pa K-1 mole-1) and T is temperature(degrees Kelvin).
Equation (1) allows calculation of likely (equilibrated) gasconcentrations that may exist in the subsurface whereNAPL is present and in direct contact with an air phase.
Example calculations
For example if gasoline NAPL is present in thesubsurface at a temperature of 20°C (293 K), benzenemakes up 1% of the gasoline as a mole fraction (χ = 0.01),and the activity coefficient is assumed to be one, andgiven that M
benzene= 78,000 mg mole-1 and that
pbenzene
= 11,700 Pa, then Cbenzene,g
= 3.75 mg L-1 or3,750 µg L-1. Where the gasoline NAPL has been agedthrough water washing, volatilisation and biodegradationprocesses over some period of time, the benzeneconcentration may be much reduced.
Under the same conditions, for a single phasechlorinated solvent DNAPL source, such as TCE, C
TCE,g= 532 mg L-1 or 532,000 µg L-1. In this case the
mole fraction is one, and MTCE
= 131,400 mg mole-1 andp
TCE= 9,870 Pa. As a further example, vinyl chloride has
a vapour pressure approximately 30–40 times higherthan TCE, and hence the vapour concentration of vinylchloride would be 30–40 times higher under similarcircumstances to those described here.
Water-air partitioning
Partitioning from a water (groundwater) phase into air canbe described at equilibrium by Henry’s Law given by:
Pi = KH,i Ci,w (2)
where Pi is the partial pressure of a chemical in the airphase, Ci,w is the concentration in the water phase andKH,i is the Henry’s Law coefficient.
Since Pi = pi χi γi, then Equations (1) and (2) can becombined to give:
Ci,g = = Hi Ci,w (3)
where Hi = is referred to as the dimensionless
Henry’s Law coefficient.
Example calculation
For example, if benzene is present in groundwater atconcentrations of 10,000 µg L-1 (C
benzene,w) theconcentration in a gas phase in equilibrium with thegroundwater (C
benzene,g) would be 2,250 µg L-1, whereH
benzene= 0.225.
Estimating a gas-phase concentrationfrom groundwater data
Where a groundwater plume lies well below the watertable, vapour migration may be altered and slowed.Barber et al. (1990) and Davis and Barber (1989)considered the movement of methane from groundwaterplumes, across the capillary fringe and water table region,and then movement through the soil profile towards theground surface. They found that the concentration ofgas/vapours in the soil profile immediately above the watertable for volatile chemicals with Henry’s Law coefficientsgreater than 0.025 kPa m3 mol-1 was given by:
Cg = C0
+ (4)
APPENDIX A. Parameter estimation techniques(Parts are modified from Davis, Trefry & Patterson 2004)
CRC CARE Technical Report no. 13 Field assessment of vapours 55
( )
Mip
iχi γi
RT
Mi KH,i Ci,w
RT
MiKH,i
RT
L D2C*
X D1

APPENDIX A. Parameter estimation techniques
CRC CARE Technical Report no. 13 Field assessment of vapours56
where Cg is the gas/vapour concentration in the soilprofile immediately above the water table, C
0is the
concentration in gas near the ground surface, C* is thedissolved concentration in groundwater at a distance Xbelow the water table, L is the depth of the vadose zone,and D
1and D
2are the diffusion coefficients in the soil gas
and groundwater phases respectively.
This equation can be used to estimate the likelyconcentration of vapours in soil gas near the water tablewhere chemicals in groundwater pose a risk. Careful sitecharacterisation would usually be required to carry out thisstyle of assessment, especially in terms of measurementof C* at a depth X below the water table. If C* wasunderestimated due to dilution of concentrations bysampling from a long-screen borehole, for example, thenCg would be underestimated by a similar amount. Likewise,if the depth X below the water table were 1, 2 or 4 m theconcentration Cg would change by a factor of 1, 2 or 4.
Soil diffusion coefficientDiffusion processes in the soil gas phase are typicallyslower than in gas-filled volumes. This is rationalised by a tortuosity model, essentially saying that the arrangementof microscopic pore spaces is so complicated in the soilthat the effective path length of diffusing gas speciesmoving between two locations is much longer that a directline would give. Mathematically, this is incorporated byexpressing the effective diffusion coefficient for a speciesin the soil gas, Deff, as that species’ free air diffusioncoefficient, Dmol, multiplied by a tortuosity factor t (whichis less than unity).
The Millington-Quirk (1961) empirical model (Equation (5))uses measured data for the total porosity (θT), the air-filled fraction (θa), and the free-air diffusion coefficientfor oxygen (Dmol ):
Deff = Dmol (5)
Here the tortuosity factor t = . The Millington-
Quirk formulation is widely used, but is not necessarilyregarded as the most accurate equation over the fullrange of variation of θa (e.g. see Davis et al. 2005; Jin & Jury 1996).
Air-filled porosity estimationThe air-filled porosity is a critical parameter in estimating(oxygen and vapour) diffusion coefficients in soil.
Air-filled porosity can be determined from soil cores. A typical methodology to recover a soil core for suchmeasurements might be to auger to just above (say 10 cmabove) the depth of interest and push a thin-walled rigidtube another 20 cm into the soil. The drilling and coringcould be carried out with a variety of drilling rigs, a conepenetrometer or via hand augering and manual insertionof the coring tube. The last 10 cm section of the tube/corecan then be analysed to determine the bulk density andsoil moisture content.
From this data, air-filled porosities can be estimatedusing Equation (6):
θa = 1-[ + ρb ] (6)
where θa is the effective air-filled porosity (m3 m-3), ρb
is the bulk density (kg m-3), ρm is the free solid density(assumed equal to 2650 kg m-3; Rose 1966), θg is thegravimetric moisture content (kg kg-1) and ρw is thedensity of water (kg m-3).
Vapour and oxygen flux estimates
Equilibrium measurements of vapour and oxygenconcentrations permit the inference of vertical fluxes, q (in units of µg L-1 m s-1) using the standard Fickian law:
q = Deff (7)
Deff for the vapours and oxygen in the local porousmedium can be estimated via the Millington-Quirk (1961)model of Equation (5). The estimated molecular diffusioncoefficients for BTEX vapours is Dmol = 8 x 10⁻⁶ m2 s-1
(Grathwohl 1998) and for oxygen is Dmol = 2.01 x 10⁻⁵ m2 s-1 (Gliński & Stępniewski 1985).
Characteristic time to equilibrium The characteristic time for a vapour depth profile to reachequilibration (te) over the depth of a soil profile (L) can beestimated from Equation (8) (e.g. API 2005):
te = (8)θa β L2
Deff
θa10/3
θT2
ρb θg
ρm ρw
θa10/3
θT2
∂C
∂z

where θa is the effective air-filled porosity (m3 m-3), L isthe depth of the soil profile to the vapour source (m), D
eff
is the effective diffusion coefficient in the soil profile (m2 s-1),and β is the retardation coefficient of the vapour/gasbased on the fraction of soil organic matter and thevapour/organic matter partitioning coefficient. Equation(8) assumes a step change concentration in sourcevapour concentrations and its propagation to a steadystate depth profile throughout a soil profile. This occursafter an initial release into the subsurface, but may rarelyoccur at a later time.
Table A1 contains some estimates of such equilibrationtimes, calculated based on Equations (5) and (8) andassuming Dmol = 8 x 10⁻⁶ m2 s-1 (Grathwohl 1998). Basedon these estimates the equilibration time for a ~2 m soilprofile with an air filled porosity of 0.2–0.3 and a totalporosity of 0.5 (as in Davis et al. 2005) would be 24–62days. This is consistent with the time to re-equilibrationreported in Davis et al. (2001) whereby in the same soilprofile they flushed the vadose zone with nitrogen gas,and monitored vapour concentration increases over thedepth profile. Note that for organic-rich soils the retardationcoefficient may be greater than 1, and as such the timeneeds to be scaled linearly with the value of β.
APPENDIX A. Parameter estimation techniques
CRC CARE Technical Report no. 13 Field assessment of vapours 57
Table A1. Estimates of characteristic equilibration times (days) for a retardation coefficient, β=1.
Equilibration times (days): Total porosity = 0.5
Air-filled porosities (0.1 to 0.4)
Depth (m) 0.1 0.2 0.3 0.4
1 78 15 6 3
2 312 62 24 12
3 701 139 54 28
4 1247 247 96 49
5 1948 387 150 77
10 7792 1546 600 307
Equilibration times (days): Total porosity = 0.3
Air-filled porosities (0.1 to 0.3)
Depth (m) 0.1 0.2 0.3
1 28 6 2
2 112 22 9
3 252 50 19
4 449 89 35
5 701 139 54
10 2805 557 216
Converting soil gas concentrations The ideal gas equation is written as:
PV = nRT (9)
where
P = ambient pressure (atm)
V = gas volume (L)
n = moles of gas
R = universal gas constant (0.08206 L atm K-1 mol-1)
T = temperature (°K)
Converting soil gas concentrations from mg/m3 to ppmv
Assuming a soil gas pressure of 1 atm, the ideal gas equation (Equation (9)) can be modified to convert soil gasconcentrations from mg/m3 to ppmv according to:
Concentration in ppmv = (Concentration in mg/m3) x (10)(273.15 + °C) x 0.08206
MW

APPENDIX A. Parameter estimation techniques
CRC CARE Technical Report no. 13 Field assessment of vapours58
where
ppmv = ppm by volume (i.e. volume of gaseous concentration per 106 volumes of soil gas)
mg/m3 = milligrams of gaseous concentration per cubic metre of soil gas
MW = molecular weight of the chemical (g/mol)
°C = soil gas temperature in degrees Celsius
Example calculation
For a gas sample containing benzene (MW = 78.1 g/mol), convert 20 mg/m3 to ppmv at 25°C.
Concentration of benzene in ppmv = = 6.27 (11)
Converting soil gas concentrations from ppmv to mg/m3
Assuming a soil gas pressure of 1 atm, the ideal gas equation (Equation (9)), can be modified to convert soil gasconcentrations from ppmv to mg/m3.
Concentration in mg/m3 = (12)
where
ppmv = ppm by volume (i.e. volume of gaseous concentration per 106 volumes of soil gas)
mg/m3 = milligrams of gaseous concentration per cubic metre of soil gas
MW = molecular weight of the chemical (g/mol)
°C = soil gas temperature in degrees Celsius
Example calculation
For a gas sample containing benzene (MW = 78.1 g/mol), convert 20 ppmv to mg/m3 at 25°C.
Concentration of benzene in mg/m3 = = 63.8 (13)
20 x (273.15 + 25) x 0.08206 78.1
Concentration in ppmv x MW0.08206 x (273.15 + °C)
20 x 78.10.08206 x (273.15 + 25)

APPENDIX B. Available US state guidance (Primarily sourced from US EPA 2008. List current as at April 2007)
CRC CARE Technical Report no. 13 Field assessment of vapours 59
State Available guidance
Alaska Evaluation of Vapor Intrusion Pathway at Contaminated Sites (draft), 16 pp., 2006.http://www.dec.state.ak.us/spar/csp/guidance/draft_vap_intr_tm_6_28.pdf
California Guidance for Assessing Exposures and Health Risks at Existing and Proposed School Sites, excel spreadsheet for calculating risk updated July 12, 2006.http://www.oehha.ca.gov/public_info/public/kids/schools2604.html
Use of California Human Health Screening Levels (CHHSLs) in Evaluation of Contaminated Properties, 67 pp., 2005.http://www.calepa.ca.gov/Brownfields/documents/2005/CHHSLsGuide.pdf
Guidance for the Evaluation and Mitigation of Subsurface Vapor Intrusion to Indoor Air, 105 pp., 2004 (revised 7 February 2005).http://www.dtsc.ca.gov/AssessingRisk/upload/HERD_POL_Eval_Subsurface_Vapor_Intrusion_interim_final.pdf
Advisory – Active Soil Gas Investigations, 25 pp., 2003.http://www.dtsc.ca.gov/loader.cfm?url=/commonspot/security/getfile.cfm&pageid=94677
CalTOX: A Total Exposure Model for Hazardous Waste Siteshttp://www.dtsc.ca.gov/AssessingRisk/ctox_dwn.cfm
Colorado Policy on an Interim Risk Evaluation and Management Approach for PCE, 3 pp., 2006.http://www.cdphe.state.co.us/hm/pcepolicy.pdf
Policy on an Interim Risk Evaluation and Management Approach for TCE, 2 pp., 2006.http://www.cdphe.state.co.us/hm/tcepolicy.pdf
Draft Indoor Air Guidance, 58 pp., 2004.http://www.cdphe.state.co.us/hm/indoorair.pdf
Guidance for Analysis of Indoor Air Samples, 9 pp., 2000. http://www.cdphe.state.co.us/hm/airsmpl.pdf
Petroleum Storage Tank Owner/Operator Guidance Document, 45 pp., 1999.http://oil.cdle.state.co.us/OIL/Technical/Guidance%20Documents/guidancedoc.asp
Connecticut Significant Environmental Hazard Condition Notification Threshold Concentrations, Reference Table A: A Volatile Organic Substances, 2005.http://ct.gov/dep/cwp/view.asp?a=2715&q=324964&depNav_GID=1626
Connecticut’s Remediation Standard Regulations Volatilization Criteria: Proposed Revisions, 50 pp., 2003.http://ct.gov/dep/cwp/view.asp?a=2715&q=325012 http://ct.gov/dep/lib/dep/site_clean_up/remediation_regulations/RvVolCri.pdf
Delaware Policy Concerning the Investigation, Risk Determination and Remediation for the Vapor Intrusion Pathway, 32 pp., March 2007.http://www.dnrec.state.de.us/dnrec2000/Divisions/AWM/sirb/policy%20concern07008.pdf
Idaho Risk Evaluation Manual, Appendix C: Evaluation of the Indoor Air Inhalation Pathway, woo4.http://www.deq.idaho.gov/Applications/Brownfields/download/appx_all.pdf

APPENDIX B. Available US state guidance
CRC CARE Technical Report no. 13 Field assessment of vapours60
State Available guidance
Indiana Indiana’s pilot program guidance is intended to provide interim guidance, not requirements, for site investigation.Indiana Department of Environmental Management Draft Vapor Intrusion Pilot Program Guidance, 90 pp., April 26, 2006.http://www.in.gov/idem/files/la-073-gg.pdf
Louisiana Risk Evaluation/Corrective Action Program (RECAP), 119 pp., October 20, 2003http://www.deq.louisiana.gov/portal/tabid/2929/Default.aspx
Maine Edited/Adapted Field Guidelines for Protecting Residents from Inhalation Exposure to Petroleum Vapors, 34 pp., 2000.http://www.maine.gov/dep/rwm/sops/
Guidelines for Protecting Residents from Inhalation Exposure to Petroleum Vapors, 271 pp., 1998.http://www.maine.gov/dep/rwm/sops/
Massachusetts Indoor Air Sampling and Evaluation Guide, WSC Policy #02-430, 157 pp., 2002.http://www.mass.gov/dep/cleanup/laws/02-430.pdf
Guidelines for the Design, Installation, and Operation of Sub-Slab Depressurization Systems, 15 pp., December 1995.http://www.mass.gov/dep/cleanup/laws/ssd1e.pdf
Massachusetts Contingency Plan Numerical Standards: GW-2http://www.mass.gov/dep/cleanup/laws/gw2.htm
Michigan RRD Operational Memorandum No. 1: Part 201 Generic Cleanup Criteria/Part 213 Risk Based Cleanup Levels, 2004.http://www.michigan.gov/deq/0,1607,7-135-3311_4109_9846_30022-101581--,00.html
RRD Operational Memorandum No. 2: Sampling and Analysis, Attachment 3: Indoor Air Designated Methods and Target Detection Limits, 7 pp., 2004.http://www.michigan.gov/deq/0,1607,7-135-3311_4109_9846_30022-101581--,00.html
Technical Memorandum: Residential Soil Volatilization to Indoor Air, Inhalation Criteria for Trichloroethylene (CAS# 79-01-65), 33 pp., 2004.http://www.michigan.gov/documents/mshda_mf_tce_volatilization_114937_7.pdf
Evaluation of the Michigan Department of Environmental Quality’s Generic Groundwater and Soil Volatilization [sic] to Indoor Air Inhalation Criteria, 67 pp., 2001.http://www.michigan.gov/documents/iirept_3693_7.pdf
Part 201: Generic Groundwater and Soil Volatilization to Indoor Air Inhalation Criteria: Technical Support Document, 39 pp., 1998.
Part 213, Risk-based Screening Levels (RBSLs) for Groundwater and Soil Volatilization to Indoor Air, Operational Memorandum No. 4, Attachment 8, 38 pp., 1998.http://www.michigan.gov/documents/deq/deq-std-op4ATT8_250008_7.DOC
Minnesota Indoor Air Sampling at VOC Contaminated Sites: Introduction, Methods, and Interpretation of Results, 17 pp., 2004.http://www.health.state.mn.us/divs/eh/hazardous/topics/iasampling.pdf
Vapor Intrusion Assessments Performed During Site Investigations, Guidance Documents 4-01a, 13 pp., 2005.http://www.pca.state.mn.us/publications/c-prp4-01a.pdf

APPENDIX B. Available US state guidance
CRC CARE Technical Report no. 13 Field assessment of vapours 61
State Available guidance
Missouri Missouri Risk-based Corrective Action (MRBCA) Technical Guidance, Appendix H: Measurement of Soil Vapor Levels, 16 pp., 2006.http://www.dnr.mo.gov/env/hwp/mrbca/mrbca.htm
Missouri Risk-based Corrective Action (MRBCA) Process for Petroleum Storage Tank Sites, Appendix C: Evaluation of Indoor Inhalation Pathway, 9 pp., 2004.http://www.dnr.mo.gov/env/hwp/tanks/mrbca-pet/docs/mrbca-pet-appendix-c.pdf
Nebraska Nebraska has no individual guidance. However, the topic of vapour intrusion is discussed in Riskbased Corrective Action (RBCA) at Petroleum Release Sites: Tier 1/Tier 2 Assessments & Reports, 2004 (now revised to May 2009 new PDF).http://www.deq.state.ne.us/
New Hampshire Vapor Intrusion Guidance, 44 pp., July 2006 (revised Feb 2007).http://des.nh.gov/organization/commissioner/pip/publications/wmd/documents/wmd-06-1.pdf
GW-2 Methodology, 2 pp., 2006.http://des.nh.gov/organization/divisions/waste/hwrb/documents/revised_gw-2_methodology.pdf
New Jersey New Jersey Johnson & Ettinger Spreadsheets, 2006.http://www.nj.gov/dep/srp/guidance/vaporintrusion/njje.htm
Several reports at http://nj.gov/dep/srp/guidance/vaporintrusion/ including:Vapor Intrusion Guidance, 282 pp., 2005.http://www.nj.gov/dep/srp/guidance/vaporintrusion/vig.htm
Indoor Air VOC Sampling and Analysis Requirements, 2 pp., 2003.http://www.nj.gov/dep/srp/guidance/vaporintrusion/ia_sampling_req.pdf
New York Several reports at http://www.health.state.ny.us/environmental/indoors/vapor_intrusion/ including:Guidance for Evaluating Soil Vapor Intrusion in the State of New York, 2006.http://www.health.state.ny.us/environmental/investigations/soil_gas/svi_guidance/
Strategy for Evaluating Soil Vapor Intrusion at Remedial Sites in New York (DER-13),16 pp., 2006.
Indoor Air Sampling and Analysis Guidance, 4 pp., 2005.http://www.health.state.ny.us/environmental/indoors/air/guidance.htm
Ohio Methodology for Vapor Intrusion Assessment, 4 pp., 2005.http://www.epa.state.oh.us/derr/rules/vapor.pdf
Oregon Screening Model for Volatilization from Soil to Indoor Air at Heating Oil Tank Sites (excel spreadsheet to be used with Risk-based decision Making for the Remediation of Petroleum-Contaminated Sites) at:http://www.deq.state.or.us/lq/rbdm.htmhttp://www.deq.state.or.us/lq/tanks/hot/screeningmodel.htm
Pennsylvania Section IV.A.4, ‘Vapor Intrusion into Buildings from Groundwater and Soil under the Act 2 Statewide Health Standard’, (26 pp., 2002) in the Recycling Program Technical Guidance Manual.http://www.dep.state.pa.us/dep/subject/advcoun/cleanup/2002/BoldedVaporGuidance_100702.pdf
Wisconsin Chemical Vapor Intrusion and Residential Indoor Air: Guidance for Environmental Consultants and Contractors, 16 pp., 2003. [Provided background on vapour intrusion but basically refers readers to EPA guidance and the Johnson and Ettinger (1991) model.]http://www.dhfs.wisconsin.gov/eh/Air/fs/VI_prof.htm

Petroleum Vapour Model Comparison: Interim Report for CRC CARE
Established and supported under the Australian Government’s Cooperative Research Centres Programme
Tel: +61 (0) 8 8302 5038Fax: +61 (0) 8 8302 3124Email: [email protected]: www.crccare.com
CRC CARE Pty LtdACN 113 908 044University of South AustraliaMawson LakesSouth Australia 5095
P.O. Box 486Salisbury SouthSA 5106Australia