technical guide may 2014 - microrate l.a. · loan!officer!productivityratio!..... ... technical...
TRANSCRIPT

Technical Guide
Performance and Social Indicators for Microfinance Institutions
2
MicroRate appreciates ADA’s technical and financial contribution in producing the Technical Guide: Performance and Social Indicators for Microfinance Institutions.
About ADA Over the past 20 years, ADA has been dedicated to building and catalysing the financial inclusion of popula-tions excluded from conventional banking channels in developing countries. We empower microfinance insti-tutions and networks. Through the Luxembourg Microfinance and Development Fund, we also help them obtain the funding necessary for their sustainable growth. We focus on the development of innovative inclu-sive financial services, on capacity building and on action research. We put our expertise to use in areas in-cluding youth financial inclusion, access to green energy through microfinance, microinsurance, and reinvest-ed savings through remittances for migrants. We also put our know-how forward to individual States and collaborate with them to support their inclusive finance expansion strategies. ADA has been dedicated to the issue of transparency and the promotion of financial and social performance management practices and standards for more than 10 years. We bring first-hand support to initiatives such as Microfact 3.6, a tool which enables the direct implementation of such standards. www.ada-microfinance.org www.microfact.org
About MicroRate MicroRate is the first microfinance rating agency dedicated to evaluating performance and risk in micro-finance institutions (MFIs) and microfinance funds, also known as microfinance investment vehicles (MIVs). As the oldest and most well-respected organization of its kind, MicroRate has conducted over 750 ratings of MFIs throughout Latin America, Africa, Europe, and Central Asia. MicroRate is a leading social rater and has also become the largest MIV evaluator in the industry. This publication was prepared by MicroRate using MIX Market data. This publication can be downloaded electronically from the MicroRate website (www.microrate.com). Any comments regarding the Technical Guide may be sent to MicroRate ([email protected]). MicroRate would like to thank all the contributors who made this industry research report possible:
Sebastian von Stauffenberg, Damian von Stauffenberg, Maritza Rodriguez, Rebecca Spradlin, and Antonio Bryant

Technical Guide: Performance and Social Indicators for Microfinance Institutions
3
Copyright © 2014 MicroRate Incorporated (“MicroRate”). All rights reserved. This report may be reproduced provided that credit is given to “MicroRate Incorporated.” Disclaimer: Please note this report was compiled primarily on the basis of self-reported data. This research is provided for in-formational purposes only and without any obligation, whether contractual or otherwise. No warranty or representation is made as to the correctness, completeness and accuracy of the information given. The views and interpretations expressed in this report are those of MicroRate, and do not necessarily represent the views of any of those involved with this report.

4
Table of Contents
Foreword ......................................................................................................................... 6
The Methodology: Putting the Indicators into Context .............................................. 7
Portfolio Quality ............................................................................................................. 8 Portfolio at Risk Ratio .................................................................................................................................................. 10 Write-‐Off Ratio ............................................................................................................................................................... 14 Impairment Expense Ratio ........................................................................................................................................ 16 Risk Coverage Ratio ...................................................................................................................................................... 18
Efficiency & Productivity ............................................................................................. 20 Operating Expense Ratio ............................................................................................................................................ 22 Cost per Borrower Ratio ............................................................................................................................................ 24 Personnel Productivity Ratio ................................................................................................................................... 26 Loan Officer Productivity Ratio ............................................................................................................................... 28
Financial Management .............................................................................................. 30 Financial Expense Ratio .............................................................................................................................................. 32 Cost of Funds Ratio ....................................................................................................................................................... 34 Debt to Equity Ratio ..................................................................................................................................................... 36
Profitability .................................................................................................................... 38 Return on Equity ............................................................................................................................................................ 40 Return on Assets ............................................................................................................................................................ 42 Portfolio Yield ................................................................................................................................................................. 44
Social Performance ..................................................................................................... 46 National Loan Size Ratio ............................................................................................................................................. 48 Borrower Retention Ratio ......................................................................................................................................... 50 Staff Retention Ratio .................................................................................................................................................... 52 Social Efficiency Index ................................................................................................................................................. 54
Appendix I: Peer Group and Data Sources .............................................................. 56
Appendix II: Calculating the Ratios ........................................................................... 57
Appendix III: Median Ratios ....................................................................................... 63
Technical Guide: Performance and Social Indicators for Microfinance Institutions
5
Acronyms and Definitions APR Annual percentage rate
EIR Effective interest rate
GDP Gross domestic product
GYEA Gross yield on earning assets
MFI Microfinance institution
MIR Microfinance Institutional Rating
MIS Management information system
MIV Microfinance investment vehicle
MIX Microfinance Information eXchange (also referred to as the MixMarket)
NGO Non-governmental organization
NIM Net interest margin
NLR National loan size ratio
NPL Non-performing loan ratio
PAR Portfolio at risk (typical over 30 days, if given as a dollar amount this is the loan balance of the portion of the portfolio that is over 30 days in arrear, if given as a percentage it represents the loan balance of the portfolio that is over 30 days in arrears divided by the total loan portfolio)
RFP Rate paid on funds
ROA Return on assets
ROE Return on equity
SPTF Social Performance Task Force
USSPM Universal Standards of Social Performance Management, published by the SPTF

6
Foreword Investors looking to put their money into microfinance face the daunting task of determining which institu-tions are most suitable for their investment objectives. Unlike traditional investments, there are few bench-marks and little commentary on the best-performing microfinance institutions (MFIs). A lack of transparency on the risk, financial and social performance, and management of MFIs presents a significant barrier for in-vestors. Since MicroRate published its first edition of the Technical Guide in 2000, transparency in microfinance has increased dramatically. There are now over 2,000 MFIs reporting their data to the MixMarket and third party evaluations, such as microfinance institutional ratings (MIRs) and social ratings are far more common. How-ever, in order for the industry to advance and mature, and for transparency efforts to be meaningful, there must be standardization and harmonization of key indicators. Consensus on the calculation and interpretation of indicators used to measure an institution’s performance is critical. This was important in 2000 when Mi-croRate produced the first guide and it continues to be important today. The purpose of the Technical Guide is to highlight recent trends related to the 14 most commonly used per-formance indicators and to introduce 4 new indicators focusing on social performance. For each indicator, the Guide provides the definition, interprets its meaning, identifies potential pitfalls in its use, and provides benchmark values. Additionally, MicroRate added a section for each indicator, “How this relates to the tradi-tional banking sector” to make the guide more useful to readers who are new to microfinance. The indicators are organized into five sections: portfolio quality, efficiency and productivity, financial management, profita-bility, and social performance. While many other indicators could be considered, the 18 included are im-portant indicators that, when taken together, provide a reasonable overview of the performance, risk and financial condition of an MFI as well as insight into its social performance. Since this Technical Guide was first introduced in 2000, it has been adopted as a training manual and source of information for the microfinance industry. In collaboration with the MixMarket, MicroRate has updated this edition with the most complete year-end data (Dec 2012) to serve as a useful tool for understanding recent trends and benchmarking MFI performance (see Appendix I for a discussion of the data and peer groups). In order to help readers understand how to calculate these ratios, Appendix II provides sample financial state-ments and MFI data with corresponding calculations for each indicator. Readers should take special note of the Guide’s limitations. This document is not intended to be a complete “how-to” manual for appraising microfinance institutions nor does it claim to be a comprehensive list of MFI indicators. Certain aspects of an MFI that are difficult to evaluate through quantitative metrics are excluded. For example, management and governance- including organizational structure, performance measurement, enforcement practices, information flows, microfinance know-how, and ownership structure- while essential for understand overall risk and performance, lack meaningful, generally accepted, quantifiable indicators that could be included here. Further, the Technical Guide does not discuss financial adjustments, which are needed when comparing institutions with very distinct accounting practices. Within its carefully defined purpose, we believe this guide will make an important contribution to the field of microfinance. Damian von Stauffenberg MicroRate

Technical Guide: Performance and Social Indicators for Microfinance Institutions
7
The Methodology: Putting the Indicators into Context The indicators presented in this Technical Guide fall into one of five main categories: portfolio quality, efficien-cy and productivity, financial management, profitability and social performance. While many other perfor-mance indicators could be listed in the Technical Guide, the 18 that were chosen are important indicators that, taken together, provide a reasonable overview of the performance, risk and financial condition of a micro-finance institution. A general description of the categories is provided at the beginning of each chapter (see Results Framework in Appendix II). Our approach in crafting the Technical Guide is to use unadjusted numbers; that is, the financial data are taken straight from each MFI’s own financial statements. The obvious problem with this approach is that compari-sons among MFIs can prove to be tricky due to vast differences in accounting practices. Provisioning poli-cies, for instance, illustrate this. Among the MicroRate 50, provision reserves to cover possible loan losses range from the extremely conservative to the inadequate. This means that comparing MFIs at both ends of this spectrum would be like comparing apples with oranges. Accounting policies do matter. Throughout the document a reference peer group is used for comparison and analysis purposes. The peer group that was chosen included MFIs that are potentially mature enough for external investment. It excluded start-up MFIs or small NGOs that are immature and unsustainable. MFIs were grouped into three tiers (Tier 1, Tier II and Tier III), according to the Microfinance Institution Tier Definitions document1 published by Micro-Rate (see Appendix I). Appendix II shows a sample financial statement as a concrete help to applying the indi-cators as well as the formula for each indicator. Appendix III shows the medians for each indicator and re-gion.
1 www.microrate.com/media/downloads/2013/04/MicroRate-White-paper-Microfinance-Institution-Tier-Definitions.pdf

8
Portfolio Quality
Portfolio at Risk Write-Off Ratio Impairment Expense Ratio Risk Coverage Ratio
Highlights for Portfolio Quality: • Only evaluating payments in arrears will
seriously underestimate portfolio risk • Evaluating the Write-Off Ratio with PAR
provides a more accurate perspective of portfolio quality
• Impairment (loan loss) reserves should cover at least 100% of PAR30

Technical Guide: Performance and Social Indicators for Microfinance Institutions
9
Portfolio Quality A microfinance institution’s largest asset is its loan portfolio. Therefore, the loan portfolio is also its largest source of risk. For MFIs whose loans are typically not backed by collateral, the quality of the portfolio is ab-solutely crucial. However, the quality of that asset, and conversely the risk, can be quite difficult to measure. Fortunately, many MFIs are well experienced in maintaining loan portfolios of very high quality. In fact, lead-ing microfinance institutions typically outperform their commercial bank peers in many countries. The most widely used measure of portfolio quality in the microfinance industry is Portfolio at Risk (PAR), which measures the portion of the loan portfolio affected by delinquency as a percentage of the total portfo-lio. Although various other measures are regularly used, PAR has emerged as the leading indicator because it is easily understandable, does not understate risk, and is comparable across institutions. A microenterprise loan is typically considered to be at risk if a payment on the loan is more than 30 days late. This rule is much stricter than what is practiced among commercial banks, but it is justified given the lack of bankable collateral and the short-term tenure of most loans. In addition to the Portfolio at Risk indicator, three other indicators related to portfolio quality are frequently used to compliment PAR and give a better picture of overall portfolio quality. These include the Write-Off Ratio, Provision Expense Ratio and Risk Coverage Ratio.2 The four portfolio quality indicators, when viewed in conjunction with one another, provide a robust view of an MFI’s portfolio quality and related risks.
2 See CGAP, Occasional Paper No. 3 June 1999, “Measuring Microcredit Delinquency: Ratios Can Be Harmful to Your Health” for an excellent discussion of the various portfolio quality measures.

10
Portfolio at Risk Ratio
How to Calculate It Portfolio at Risk (PAR) Ratio is calculated by dividing the outstanding balance of all loans with arrears over 30 days, plus all renegotiated (or restructured) loans,3 by the outstanding gross loan portfolio. The data used for this indicator is calculated at a certain date in time. PAR can be stated for different increments of time, such as PAR30, PAR60, PAR90, or PAR180, representing the balance of the loans with arrears over 30, 60, 90, or 180 days, respectively. PAR30 is used as the standard measurement in microfinance. Restructured (or refinanced) loans are loans where the borrower faces difficulties in payment and agree to revise the payment schedule with the goal of alleviating the financial burden on the borrower and allowing the MFI to recover a loan that would otherwise go unpaid. When an MFI restructures a loan, it takes the out-standing balance and distributes it over a longer term, resulting in more manageable payments for the bor-rower. An MFI refinances a loan by creating a new loan, which pays the balance of the previous loan. This can be a technique for hiding loans at risk or to legitimately increase the loan amount to clients with a good payment history. Understanding the nature of these loans and the policies related to restructuring or refinanc-ing loans is important to understanding the institution’s true portfolio quality. The specific name given to these operations is not important, but these risky types of lending procedures should be included in the calcu-lation of PAR for the best evaluation of credit risk. What It Means This ratio is the most widely accepted measure of portfolio quality. It shows the portion of the portfolio that is “contaminated” by arrears (the amount of late or missing payments) and therefore at risk of not being re-paid. The longer a client goes without making loan payments, the less likely it is that the loan will be repaid. MFIs with strong lending methodologies follow-up with clients immediately after a loan payment is late. PAR is free from much of the subjective interpretation that plagues other portfolio quality indicators, such as the repayment rate or arrears (which typically only includes unpaid capital and not the full unpaid balance including interest). Furthermore, PAR is a more conservative measure of institutional risk than repayment rates or arrears because both the numerator and the denominator include the outstanding balance of the de-
3 Renegotiated or restructured loans are loans where the borrower has repayment difficulties and a revised payment schedule is made so that the MFI is able to recover a loan that would otherwise go unpaid. These loans therefore present a risk to the lending institu-tion. When an MFI restructures a loan, it takes the remaining balance and spreads it out over a longer term, resulting in more managea-ble payments for the borrower. Refinanced loans may also be included in this calculation if these loans are connected with a poor repayment history. An MFI refinances a loan by creating a new loan, which pays the balance of the previous one. This can be a tech-nique for hiding risky loans or it can be used legitimately to increase a client’s loan amount if they have a good repayment history. Understanding the nature of these loans and the policies related to restructuring or refinancing loans is important to understanding the MFI’s true portfolio quality.
Outstanding Balance on
Arrears over 30 days
Renegotiated Loans
Total Outstanding
Loan Portfolio
PAR 30

Technical Guide: Performance and Social Indicators for Microfinance Institutions
11
linquent loans (instead of the balance of the late payments only in the numerator)- therefore, it measures the total risk of the remaining balance of the loan not being repaid and not only the immediate threat of the miss-ing payment(s). What to Watch Out For Some institutions will only report arrears as opposed to the entire outstanding balance of the delinquent loan. This practice will seriously underestimate portfolio quality as it will only reflect a marginal view of the total portfolio risk at hand. Loan repayment frequency is another relevant factor in assessing portfolio risk. Generally speaking, a higher repayment frequency increases the seriousness of the PAR figure. For example, if repayments are weekly, a loan with late payments over 30 days has missed at least four payments. This is more serious than a loan with monthly repayments where only one installment would be late after 30 days. At the other extreme, one has to watch out for loans with a single balloon repayment at the end of the loan period, as is the case in many agri-cultural loans when repayments are tied to the crop cycle. In this case, conventional measures of PAR (30, 60, or 90) are less meaningful. Additionally, the lending methodology can have a significant impact on the PAR value. With village banking loans, a group of borrowers collectively borrows and guarantees each loan in an act of solidarity. Should any group member default on a portion of their loan payment, the rest of the group is expected to make up the balance.4 When this occurs and the MFI receives payment, the loan is considered paid in full, even though an individual borrower may have defaulted on their portion of the loan, increasing the potential risk for the group. In contrast, when a borrower with an individual loan misses a payment, the loan is automatically placed in arrears. Because of this, it is easy to understand why village-banking loans would naturally have lower PAR levels. In regions where group lending is more common, such as South Asia, PAR is very low (PAR 0.7%) compared to Eastern Europe and Central Asia where individual lending is most common, PAR is significantly higher (PAR 4.5%). The analysis of PAR should not only consider the PAR number, but also the strength of the credit methodol-ogy, that ensures healthy growth in times of crisis. For example, in growing economies like Peru, many MFIs try to maintain their market position by loosening credit policies and therefore risk potential deterioration of portfolio credit quality. Furthermore, MFIs with seemingly similar PAR values can actually operate with very different underlying risk profiles. While their PAR30 measures may be the same, a loan portfolio with a large concentration of serious-ly delinquent loans (loans affected by arrears of more than 90 or 180 days) will be much riskier than a delin-quent portfolio where arrears are mostly in the 30 or 60 day range. Concentration of economic activity in a portfolio is another factor to consider when gauging the level of risk. For example, there are cases where an MFI is located in a region that is specialized in fishing, industry or agriculture. A good PAR level can become a bad PAR level when the economic activity that sustains the insti-tutional portfolio suffers. For example, in the case of Nicaragua, typical portfolios were concentrated in loans for raising cattle, which had a different risk profile than MFIs where the portfolio was more diversified. When there are portfolio concentrations that are vulnerable, additional provisions may be necessary to anticipate potential crisis. In spite of the fact that the majority of microcredit is not collateralized with real guarantees, some MFIs de-mand some form of informal collateral that can mitigate the level of credit risk. In this context, it is necessary to know if the country’s judicial system is slow and inefficient in delivering on these guarantees. That is to say,
4 These internal payments to cover group members in arrears are commonly called internal arrears and tracking of this indicator can be a useful to complement to the PAR with village banking loans.

12
although guarantees exist, they cannot be collected and PAR will be equally as risky as an MFI that does not have such guarantees. In the same way, political and corruption considerations need to be made. In some countries for example, in spite of being legally constituted, agricultural guarantees are difficult to collect be-cause of political influence. Analysis of PAR by product is important, given the differing product risk characteristics. For example, there is a significant difference between the PAR of a microcredit (usually no formal collateral) and a consumer loan (usually has a salary-based guarantee). The annual variation in PAR of each product best indicates if there are reasons to deepen the analysis. Analysis of PAR by tenor is a good indicator in competitive markets where the MFIs extend tenor to increase the credit limits of borrowers. Microcredits by nature are used to finance working capital are generally given with short tenors. If the tenor exceeds two years there is more risk. Generally, in competitive markets, when a MFIs loosens loan requirements too much for small credits we begin to see a deterioration of portfolio quality. In other cases, we observe that large loan amounts begin to deteriorate as MFIs begin to apply the same methodology as those used for small loans. PAR is a useful measure, but it does not tell the whole story of portfolio quality. Like all performance meas-urements, PAR can be manipulated. The most common way an MFI could do this is to write-off delinquent loans. To account for this practice, it is critical to consider any MFI’s PAR in conjunction with the Write-Off Ratio. The combination of PAR30 and the Write-Off Ratio results in the Total Risk Ratio. Another distortion occurs when there are high growth levels. High growth can dilute the PAR. Loans take time to fall in arrears and there is an additional lag time to record defaults on the books. These delays can be masked by portfolio growth artificially deflating the PAR. In cases of high portfolio growth, an analysis of the increase in PAR in nominal terms can complete an evaluation of portfolio quality. An opinion about the trustworthiness of the information system is another factor of analysis of the PAR and portfolio quality. Many cases are observed, where portfolio figures do not match the financial statements. In cases of glaring inconsistency, the PAR figures need to be treated with caution. How this Relates to the Traditional Banking Sector In the traditional banking sector, the most comparable indicator to PAR is non-performing loan ratio (NPL). Banks calculate this by dividing the total balance on all non-performing loans (not just arrears) excluding interest (the “carrying value” of the loan) by the gross loan portfolio. Non-performing loans occur when payments on the interest expense and/or the principal are past due for 90 days or more and the sum of these two amounts is taken as the balance of the non-performing loan. Banks that operate using the International Accounting and Banking Standards use NPL. A measure akin to this is the “impaired loan ratio” under the US-GAAP accounting system. Most banking regulators consider loans to be non-performing after 90 days. Unlike PAR, if the debtor starts making payments again on a non-performing loan, it becomes a “re-performing loan,” even if the debtor has not caught up on all the missed payments. Using PAR, however, is a more conservative measure because a loan is not in good standing until all missed payments are paid. Similar to PAR 30, a bank may also calculate a “delinquent loan ratio” for loans that have been in arrears for at least 30 days.

Technical Guide: Performance and Social Indicators for Microfinance Institutions
13
In 2006, the NPL ratio in the United States was 1%. In 2008 the ratio spiked to 5.7% following the financial crisis and has settled to close to 3% in 2013.5 Where the Industry Is On average, PAR increased globally from 2007-2009 and then flattened out in 2012. For many markets the increase in PAR was due to increasing over-indebtedness where borrowers sought loans from multiple lend-ers and had difficulty repaying. Notably, many markets saw an increase in 2009, immediately after the global financial crisis. As a result of the international financial crisis, many MFIs’ adopted more conservative lending policies resulting in improving PAR levels in 2010. In the past it was thought that the microfinance sector was not as vulnerable to large economic crises. The last international crisis showed that although microfinance has a certain level of resilience, it is still vulnerable to macroeconomic fluctuations. It should be pointed out that although MIX Market includes restructured loans in its calculation of PAR, there are countries where regulation does not require their inclusion, which could distort the true average PAR for the industry. There are even countries with sophisticated microfinance practices that continue to exclude the risk of restructured loans in their PAR calculations. This is the case in Bolivia where PAR is gen-erally understated. Upon adding restructured loans the PAR levels can rise dramatically. MicroRate’s experience indicates that although the PAR varies from region to region, a PAR ratio that goes above 8% (or a Total Risk Ratio beyond 10%) should be a cause for worry. In more mature markets, high PAR ratios are common. Latin America, where there is a mix of methodologies, for example, reported a PAR of 4.5% (2012) while South Asia, where group lending is prevalent, reported a PAR of 0.7% (2012). Government subsidized funds that demand strict levels of quality control can lead MFIs to manipulate their PAR. For example, the Mexican government requires a PAR 90 of 5% to access certain types of government funds. This has led to large distortions of the PAR on the part of the MFIs who hope to secure these funds. The microfinance sector is becoming more sophisticated in its analysis of credit risk. Regulators have more and more specialized regulations for microfinance, but practice evolves at a more rapid pace and finds ways to circumvent regulatory policy. The over indebtedness of clients is the greatest risk in many markets. As markets mature, MFIs often loosen their credit policies and abandon good practices. Generally, the causes of over indebtedness are attributed to external factors but experience shows that internal factors such as good credit policies are usually the main culprit. Countless examples of MFIs from countries that found themselves in an over-indebtedness crisis demonstrated that MFIs with good microfinance practices survived and even flourished.
Portfolio at Risk Ratio
5 Source: NYFED, “Quarterly Trends for Consolidated U.S. Banking Organizations Second Quarter 2013” http://www.newyorkfed.org/research/banking_research/QuarterlyTrends2013Q2.pdf, 2013.
0.0%$
1.0%$
2.0%$
3.0%$
4.0%$
5.0%$
6.0%$
7.0%$
2009$ 2010$ 2011$ 2012$
Africa$Middle$East$&$North$Africa$La?n$America$&$the$Carribean$Eastern$Europe$&$Central$Asia$South$Asia$East$Asia$&$the$Pacfic$

14
Write-Off Ratio
How to Calculate It The Write-Off Ratio is calculated by dividing total write-offs for the period by the period’s average gross loan portfolio. What It Means This indicator simply represents the loans that the institution has removed from its accounting records be-cause of a substantial doubt that they will be recovered. Writing-off a loan is an accounting operation used to prevent the institution’s assets from being unrealistically inflated by loans that are unlikely to be recovered. The process affects the gross loan portfolio and loan loss reserves equally. Therefore, unless provision re-serves are inadequate, the transaction will not affect total assets, net loan portfolio, expenses or net income. Write-offs have no bearing whatsoever on collection efforts or on the client’s obligation to repay. What to Watch Out For Some institutions will make aggressive write-offs in an effort to sanitize their portfolios. These MFIs will report a lower PAR, the write-off ratio will illustrate that the improvement in PAR is not necessarily an im-provement in portfolio quality. Other MFIs, particularly unregulated banks, resist writing off their seriously delinquent loans because they argue that collections efforts continue and that writing loans off will negatively affect collections. Write-offs should be viewed in conjunction with PAR to get an accurate assessment of portfolio quality. It is important to take care that the numerator shows the principal balance of write offs for the year. This ensures that there are no distortions affected by the frequency with which MFIs make write-offs, as some make write-offs on a monthly, quarterly, semi-annual or annual basis. In addition, some MFIs write-off the principal balance, as well as interest owed by the lender. Write-off policies vary greatly between MFIs and countries for regulatory and tax reasons. Typically, loans in arrears for more than 90 days are seriously delinquent and have a high probability of not being collected. After 180 days, these loans are typically written-off; however, it remains up to the MFI’s discretion to deter-mine when loans should be written off. It is generally good practice the write loans off at least once per year. It is necessary to analyze the PAR to understand why the MFI has not written off very old balances. One of the most common reasons for not writing off loans is that the MFI has not provisioned enough. A deeper analysis of write-offs by product, branch and origination date of the credit can reveal important issues in portfolio quality. Origination date can reveal issues around recent changes in management or meth-odology. Carrying old loans in arrears can negatively distort recent changes made in methodology or man-agement.
Write-Offs Average Gross Loan Portfolio

Technical Guide: Performance and Social Indicators for Microfinance Institutions
15
How this Relates to the Traditional Banking Sector The Write-Off Ratio is commonly known as the Charge-Off Ratio in the traditional banking sector. It is used the same way as it is within microfinance, where the charge-off is the value of bad debt deemed to be uncol-lectable that is taken off of the accounting records. Typically, the ratio captures the amount of charge-offs as a proportion of gross loans. The average charge-off rate for U.S. commercial banks was 1.8% from 2007 to 2010 following the financial crisis.6 The rate was clos-er to 1% in 20137. Where the Industry Is In evaluating the Write-off Ratio, the Portfolio at Risk Ratio has also been included below to capture the complete picture of portfolio quality trends. From 2008 to 2009, both the Write-off Ratio and PAR Ratio notably jump, reflecting the industry decline surrounding the global financial crisis. By 2010, most regions show a decline in both PAR and Write-offs, indicating an overall improvement in portfolio quality. The ratio remained higher in Latin America (1.3% in December 2012) where individual lending dominates, but was much lower in South Asia (0.1% in December 2012) where group lending dominates. In general, the experience of MFIs rated by MicroRate suggests that an average of 1.5% is acceptable in the sector. It should be noted that regulatory authorities do not generally publish Write-off ratio data.
Write-off Ratio
PAR Ratio
6 Seasonally adjusted; Source: http://www.federalreserve.gov/datadownload/Preview.aspx?pi=400&rel=CHGDEL&preview=CHGDEL/CHGDEL/STFBQC%STFBAIL_MA.Q 7 NYFED
0.0%$
0.5%$
1.0%$
1.5%$
2.0%$
2.5%$
3.0%$
2009$ 2010$ 2011$ 2012$
Africa$Middle$East$&$North$Africa$La<n$America$&$the$Carribean$Eastern$Europe$&$Central$Asia$South$Asia$East$Asia$&$the$Pacfic$
0.0%$
1.0%$
2.0%$
3.0%$
4.0%$
5.0%$
6.0%$
7.0%$
2009$ 2010$ 2011$ 2012$
Africa$Middle$East$&$North$Africa$La?n$America$&$the$Carribean$Eastern$Europe$&$Central$Asia$South$Asia$East$Asia$&$the$Pacfic$

16
Impairment Expense Ratio
How to Calculate It The Impairment Expense Ratio (or the Provision Expense Ratio) is calculated by dividing the impairment expense (also referred to as the loan loss provisioning expense) for the period by the period’s average gross portfolio. The impairment expense is not to be confused with the impairment reserve or loan loss reserve, which is found on the balance sheet.
What It Means This measure gives an indication of the expense incurred by the institution from anticipated loan losses for the period proportional with the size of the loan portfolio. An improvement in overall portfolio quality can reflect a decrease in the Impairment Expense Ratio. For regulated MFIs, local banking and tax laws will pre-scribe the minimum rate at which they must maintain their loan loss reserves. Unregulated MFIs, on the other hand, follow a wide variety of provision expense practices, including making no provisions at all (this is rare), provisioning a certain percentage of new loans, or linking provisions to portfolio quality. What to Watch Out For MFIs require stricter provisioning practices than banks or finance companies because their loans are not typi-cally backed by collateral. Frequently, banking laws do not take this into account and require provisioning policies and reserve levels that are inadequate for a microcredit portfolio. Regulated MFIs may therefore comply with the law and still be under-provisioned. In some cases, there may also exist incentives to over-provision, particularly among unregulated MFIs, in order to hide profits that could undermine access to donor funding. On the other hand, by simply scaling back on its provision expenses, an MFI can turn a looming loss into a profit for a year or two. In general, provisioning practices need to be closely watched since unregulated MFIs may be tempted to (mis)use impairment expenses to manipulate the bottom line (banking laws limit this pos-sibility for regulated MFIs). The level of impairment (provision) expenses must be analyzed together with the Risk Coverage Ratio (see the following indicator, Risk Coverage Ratio) to determine the MFI’s estimate for loan losses and what they actually incurred. If loan loss reserves on the balance sheet fall relative to the Portfolio at Risk, then impair-ment expenses are probably too low. Impairment expense is proportional to the risk profile of borrowers. Best practices suggest calculating provi-sions based on the number of days in arrears of each loan. MicroRate applies the following scale that reflects these conditions:
• Loans that are in arrears from 1-30 days, provision 10% of the loan balance
Impairment Expenses
Average Gross Loan Portfolio

Technical Guide: Performance and Social Indicators for Microfinance Institutions
17
• Loans that are in arrears from 31-60 days, provision 30% of the loan balance • Loans that are in arrears from 61-90 days, provision 60% of the loan balance • Loans that are in arrears for more than 90 days, provision 100% of the loan balance • 50% of the loan balance should be provisioned for all refinanced loans • 100% of the loan balance should be provisioned for all refinanced loans that are >1 day in arrears
It is important to note that MFIs with substantial portions of their portfolio that are backed by formalized collateral will not need to apply such strict provisioning rules. Moreover, loans with gold guarantees are gen-erally not provisioned. How this Relates to the Traditional Banking Sector The Impairment Expense Ratio is commonly referred to as the Provision Expense Ratio or Provision for Credit Losses within the traditional banking sector. This ratio is important as it affects working capital and is monitored closely by regulators. The loan loss provision allocated to each period increases as the risk increas-es. Therefore a bank with a smaller number of risky loans will have a lower provision expense compared to a bank with a greater amount of high-risk loans.8 Where the Industry Is In 2012, Impairment Expense Ratios varied between 0.5% and 2.7% depending on geographic location. In the case of Latin America and the Caribbean, a well-developed microfinance market, with increasing com-petition and a higher risk profile, MFIs were more willing to make risky loans, causing a relative high PAR and subsequent Impairment Expense Ratio. In the case of South Asia, however, loan recipients have a high repayment rate. Due to higher portfolio quality in the region, impairment expenses are subsequently lower. Following the upward trend in PAR between 2009 and 2012, there was a notable drop in most regions. This could also be attributed to rebounding portfolios whose growth was impacted in 2009 due to the global fi-nancial crisis. In more advanced countries where regulators have begun implementing capital adequacy requirements ac-cording to the Basel Accord, banks are required to make procyclical provisions. That is, financial institutions must make additional provisions when the economy is growing. These provisions can be used to cover the financial institutions needs during down times. Countries that want to discourage an oversupply of consumer loans that can lead to over indebtedness have begun to require higher provisions for this type of loan as an effective tool to protect the financial system.
Impairment Expense Ratio
8 Source: http://www.investopedia.com/terms/p/provision-for-credit-losses.asp
0.0%$
0.5%$
1.0%$
1.5%$
2.0%$
2.5%$
3.0%$
2009$ 2010$ 2011$ 2012$
Africa$Middle$East$&$North$Africa$La<n$America$&$the$Carribean$Eastern$Europe$&$Central$Asia$South$Asia$East$Asia$&$the$Pacfic$
18
Risk Coverage Ratio
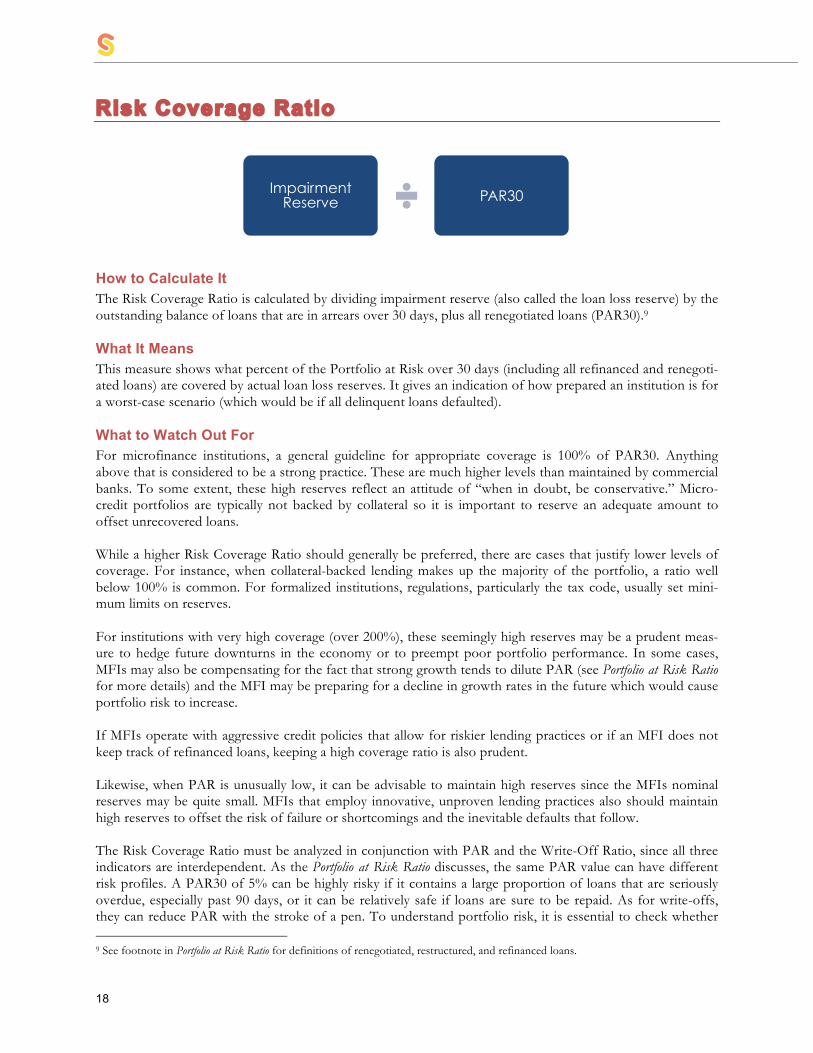
How to Calculate It The Risk Coverage Ratio is calculated by dividing impairment reserve (also called the loan loss reserve) by the outstanding balance of loans that are in arrears over 30 days, plus all renegotiated loans (PAR30).9 What It Means This measure shows what percent of the Portfolio at Risk over 30 days (including all refinanced and renegoti-ated loans) are covered by actual loan loss reserves. It gives an indication of how prepared an institution is for a worst-case scenario (which would be if all delinquent loans defaulted). What to Watch Out For For microfinance institutions, a general guideline for appropriate coverage is 100% of PAR30. Anything above that is considered to be a strong practice. These are much higher levels than maintained by commercial banks. To some extent, these high reserves reflect an attitude of “when in doubt, be conservative.” Micro-credit portfolios are typically not backed by collateral so it is important to reserve an adequate amount to offset unrecovered loans. While a higher Risk Coverage Ratio should generally be preferred, there are cases that justify lower levels of coverage. For instance, when collateral-backed lending makes up the majority of the portfolio, a ratio well below 100% is common. For formalized institutions, regulations, particularly the tax code, usually set mini-mum limits on reserves. For institutions with very high coverage (over 200%), these seemingly high reserves may be a prudent meas-ure to hedge future downturns in the economy or to preempt poor portfolio performance. In some cases, MFIs may also be compensating for the fact that strong growth tends to dilute PAR (see Portfolio at Risk Ratio for more details) and the MFI may be preparing for a decline in growth rates in the future which would cause portfolio risk to increase. If MFIs operate with aggressive credit policies that allow for riskier lending practices or if an MFI does not keep track of refinanced loans, keeping a high coverage ratio is also prudent. Likewise, when PAR is unusually low, it can be advisable to maintain high reserves since the MFIs nominal reserves may be quite small. MFIs that employ innovative, unproven lending practices also should maintain high reserves to offset the risk of failure or shortcomings and the inevitable defaults that follow. The Risk Coverage Ratio must be analyzed in conjunction with PAR and the Write-Off Ratio, since all three indicators are interdependent. As the Portfolio at Risk Ratio discusses, the same PAR value can have different risk profiles. A PAR30 of 5% can be highly risky if it contains a large proportion of loans that are seriously overdue, especially past 90 days, or it can be relatively safe if loans are sure to be repaid. As for write-offs, they can reduce PAR with the stroke of a pen. To understand portfolio risk, it is essential to check whether 9 See footnote in Portfolio at Risk Ratio for definitions of renegotiated, restructured, and refinanced loans.
Impairment Reserve PAR30

Technical Guide: Performance and Social Indicators for Microfinance Institutions
19
good PAR numbers–and therefore a favorable Risk Coverage Ratio–is the result of good client screening or massive write-offs. How this Relates to the Traditional Banking Sector Risk Coverage Ratio, as defined here, is equivalent to the Provision Coverage Ratio in the traditional banking sector. The Provision Coverage Ratio is calculated by taking the total cumulative provisions for the period over the gross non-performing assets as to anticipate the risk for the portfolio. Like the Risk Coverage Ratio, this provides a percentage of the portfolio that is covered by the given provi-sion allowance. The reason this ratio is used in analyzing performance of commercial banks is to test the li-quidity of a bank’s loan portfolio in the case of potential losses from non-performing assets on loans. Due to the product and service variety that the traditional banking sector offers, there are other forms of the cover-age ratio to test institutions’ ability to absorb losses and the ability to make payments on assets, debt servicing, leverage, and more. Unlike the MFI sector, a ratio for the traditional banking sector will tend to be lower depending on the type of loan issued. If, for example, the loan issued is collateral-based, then the need for the bank to cover the risk associated with that loan is diminished. The collateral acts as a provision that can be collected in case of de-fault with the value being added to the balance sheet. Where the Industry Is It has generally been assumed that Risk Coverage Ratios would gradually decline as the microfinance industry matures. However, the data between 2007 and 2012 show fairly constant coverage each year. The averages for those years were 78%-98%. All regions, except Latin America and East Asia, show strong increases possibly due to the improvement in portfolio quality.
Risk Coverage Ratio
40.0%%
60.0%%
80.0%%
100.0%%
120.0%%
140.0%%
160.0%%
180.0%%
2009% 2010% 2011% 2012%
Africa%Middle%East%&%North%Africa%La=n%America%&%the%Carribean%Eastern%Europe%&%Central%Asia%South%Asia%East%Asia%&%the%Pacfic%

20
Efficiency & Productivity
Operating Expense Ratio Cost Per Borrower Personnel Productivity Loan Officer Productivity
Highlights for Efficiency & Productivity: • MFIs have much lower efficiency rates
than commercial banks • Small and rural MFIs show lower effi-
ciency

Technical Guide: Performance and Social Indicators for Microfinance Institutions
21
Efficiency and Productivity Four key indicators have been selected to measure efficiency and productivity: Operating Expense Ratio, Cost per Borrower Ratio, Personnel Productivity and Loan Officer Productivity. Efficiency and productivity indicators give an indication of how well an institution performs operationally. Productivity indicators reflect the amount of output per unit of input, while efficiency indicators also take into account the cost of the inputs and/or the price of outputs. Since these indicators are not easily manipu-lated, they are more readily comparable across institutions than profitability indicators such as Return on Equity and Return on Assets, for example. On the other hand, productivity and efficiency measures are less comprehensive indicators of performance than those of profitability. Microfinance institutions have much lower rates of efficiency than commercial banks because on a dollar per dollar basis, microcredit is highly labor intensive: a hundred-dollar loan in a microfinance institution requires about as much administrative effort as a loan that is a thousand times larger in a commercial bank. In an MFI, administrative costs may be $10, $20, or even $30 for each $100 in the loan portfolio, so the efficiency ratio is 10%, 20% or 30%, whereas a commercial bank might have efficiency ratios of 1.5%, 2% or 3% because of larger loan amounts.

22
Operating Expense Ratio
How to Calculate It The Operating Expense Ratio is calculated by dividing all expenses related to the operation of the institution (including all the administrative and salary expenses, depreciation and board fees) by the annual average gross loan portfolio. Interest and provision expenses, as well as extraordinary expenses, expenses from previous periods and other expenses are not included. What It Means This ratio provides the best indicator of the overall efficiency of a lending institution. For this reason, the ratio is also referred to as the Efficiency Ratio, measuring the institutional cost of delivering loan services compared to the average loan size of its portfolio. Therefore, a general rule is the lower the Operating Ex-pense Ratio, the higher the efficiency. What to Watch Out For This is an important ratio because it can be internally managed and is critical for the banks survival in com-petitive markets. If the MFI has high operating costs, margins will be affected making it increasingly difficult to compete on price. Portfolio size, loan size, credit methodology and market prices can help put efficiency levels into context. Portfolio size matters, but the benefit of economies of scale from portfolio size rapidly diminishes in im-portance once the portfolio size of an institution exceeds US$ 5 million. Small MFIs can therefore become more efficient simply by growing, while larger institutions must resort to other measures. In MicroRate’s ex-perience, loan size has the largest impact on the Operating Expense Ratio. Methodology can also significantly influence operational costs. In village banking, where average loan sizes are very small and training is high, operating expenses are typically substantially higher than their individual loan counterparts. In these cases, it is useful to also compare the Cost per Borrower (again making certain to compare MFIs within the same country), which divides operating expenses into the number of borrowers, regardless of loan size (see Cost per Borrower). Another factor to consider is the difference between largely rural operations and urban microcredit programs. The operating expenses of rural microlenders tend to be much higher since their clientele is more widely dis-persed and therefore more expensive to reach. Operating costs are also strongly correlated to salary levels, as is to be expected in a highly labor-intensive industry. It is important to distinguish between cases where an MFI underpays its staff and where it simply operates in a low-cost environment. An operating expense ratio achieved by underpaying staff does not always indicate long-term efficiency: as a market becomes more com-petitive, employees may move to a competitor who pays more. MicroRate’s experience suggests that person-nel costs typically make up 50% of operating expenses. If operating expenses fall far below this level, a deeper analysis of salaries should occur. MFIs preparing to accept client savings hope to benefit from ready access to capital in the long run. Howev-er, establishing savings capabilities can be very costly for an MFI because of the high, upfront IT and admin-
Operating Expenses
Average Gross Loan Portfolio

Technical Guide: Performance and Social Indicators for Microfinance Institutions
23
istrative expenses, all of which negatively affect efficiency levels. Yet, after deposits surpass a minimum threshold, operational costs drop significantly as scale is achieved. Loan officer and administrative personnel ratios can also shed light when analyzing of operating expenses. MFIs incur high costs usually from having more administrative personnel rather than loan officers. For MFIs that handle deposits, a good Loan Officer / Total Personnel ratio can be 50%. Yet, for MFIs that do not have deposits, typically the ratio is above 50% and as high as 70%-80%. There are various ways in which MFIs attempt to hide operating expenses. Organizations providing micro-credit as well as other services can allocate costs in such a way that their credit operations look more efficient than they really are. One way of hiding expenses is to allocate them to subsidiaries or to not carry them on the books at all, for instance when donors meet certain costs, such as paying for consultants. Another way of distorting efficiencies is by deferring costs using accounts such as “deferred assets”. MFI can manipulate their profit using deferred assets at the end of each period. MicroRate has seen that even in Au-dited Financial Statements, some MFIs do not offer reliable accounting information, principally to hide costs. In various cases, it identified that deferred costs were used to show higher profits than what was earned. How this Relates to the Traditional Banking Sector The Operating Expense Ratio for MFIs is similar to the Efficiency Ratio or Cost/Income ratio used by the traditional banking sector to determine how efficiently the bank uses its assets and liabilities within internal operations related to the loan portfolio. More specifically, this ratio measures the amount of non-interest expenses (operating expenses, excluding provisions of loan losses) needed to support operating revenues. Using this calculation, the bank’s performance can be benchmarked relative to the industry and improvement of the ratio usually translates to higher profitability. When comparing banks against each other it is important to consider their business model, size, and other operations. The goal of utilizing this indicator is to seek operating efficiency ratios lower than 10%. Where the Industry Is Developing markets, such as those in Sub-Saharan Africa, tend to have higher Operating Expense Ratios, but showed an improving trend in 2012. MFIs on the whole are becoming more sophisticated organizations, and as a result are experiencing efficiency gains. Mature markets with high levels of competition, like many countries in Latin America tend to have better Operating Expense Ratios than less competitive markets like Africa. Only a few years ago, an Operating Ex-pense Ratios of 35% was considered acceptable for an urban MFI. Today, leading MFIs have efficiency ratios below 10%. In general, graphs of operational efficiency at a global level show only small improvements. However, it is true that microfinance institutions, in general, are reaching more remote customers and are becoming more sophisticated. The world average of this ratio in 2012 was 16.2%
Operating Expense Ratio

24
Cost per Borrower Ratio
How to Calculate It The Cost per Borrower Ratio is calculated by dividing all expenses related to the operation of the institution (including all the administrative and personnel expenses, depreciation and board fees) by the average number of active borrowers for the period. Interest and provision expenses, as well as extraordinary expenses, ex-penses from previous periods and other costs are not included. What It Means This ratio provides a meaningful measure of efficiency by showing the average cost of maintaining an active microcredit borrower. Since the size of the loans is not part of the denominator, institutions with larger loans do not automatically appear more efficient, as is commonly the case with the Operating Expense Ratio. The Cost per Borrower ratio is, in this sense, a “fairer” indicator than the Operating Expense Ratio. What to Watch Out For When enough information exists on the number of borrowers by product, pawn loans, loans guaranteed by gold and other consumer loans can be excluded from the denominator to give you a truer cost per borrower ratio. This ratio complements the Operating Expense Ratio. It is tempting to simply conclude that high operating expenses are a sign of inefficiency, just as it is tempting to believe that low PAR is analogous to excellent portfolio quality. Both could be wrong. MicroRate has observed cases where strong MFIs with relatively high operating expenses compared to their regional competitors because their average loan sizes are extremely small, yet have a Cost per Borrower Ratio that is only a fraction of their most efficient competitors. Compar-ing both and even combining them (see Social Efficiency Index in Social Chapter) gives a more complete picture. There is a correlation between lending methodologies and efficiency. MicroRate has observed that in mature markets, the average Cost per Borrower for village banks is significantly lower than the Cost per Borrower for MFIs using an individual lending methodology. This is because the clients bear the effort of selecting the individuals that form the group (as opposed to a loan officer) and also because these groups require lower operating costs. Village bank loan officers can collect repayments in one meeting, whereas officers adminis-tering individual loans must visit every borrower. Indeed, the Operating Expense Ratio and the Cost per Borrower Ratio move in opposite directions. As loan increases, Operating Expense Ratio decreases, while the Cost per Borrow increases. How this Relates to the Traditional Banking Sector The banking sector does not use the Cost per Borrower Ratio, possibly, due to the focus on the amount of portfolio that generates profits, more than a focus on the number and cost per borrower.
Operating Expenses
Average Number of
Active Borrowers

Technical Guide: Performance and Social Indicators for Microfinance Institutions
25
Where the Industry Is This ratio has deteriorated significantly in each region of the world and ratios spreads have widened. For ex-ample, while for East Asia, the average Cost per Borrower is US$ 17, Eastern Europe and Central Asia has a high level of US$ 273 attributable to the relatively high average loan sizes and high personnel costs in the region. In general, the Cost per Borrower, at the global level, has deteriorated from US$ 123 in December 2009 to US$ 156 in December 2012.
Cost per Borrower Ratio
!$#!!!$40!!!$80!!!$120!!!$160!!!$200!!!$240!!!$280!!!$320!!
2009! 2010! 2011! 2012!
Africa!Middle!East!&!North!Africa!La>n!America!&!the!Carribean!Eastern!Europe!&!Central!Asia!South!Asia!East!Asia!&!the!Pacfic!

26
Personnel Productivity Ratio
How to Calculate It The Personnel Productivity Ratio is calculated by dividing the number of active borrowers of an institution by the total number of staff. The number of active borrowers is defined as individually identifiable borrowers who have at least one cur-rent, outstanding loan with the institution. Thus, a solidarity loan with four members is considered as four borrowers. If a client has multiple loans they are still considered to be one borrower. Borrowers are used in the numerator instead of loans because the number of people served determines the workload more than the number of loans. Two simultaneous loans to the same borrower does not require twice the effort. Pawn loans and consumer loans can be excluded from this calculation, as they require far less analysis. Total number of personnel is defined as the total number of full-time staff working at an MFI. It includes contract staff, such as consultants, as long as they work full time. If there are a significant number of part-time employees, then their number is adjusted to the full-time equivalent (two part-time employees would equal one full-time employee). What It Means This ratio captures the productivity of the institution’s staff - the higher the ratio, the more productive the institution’s staff. Indirectly, the ratio says a fair amount about how well the MFI has adapted its processes and procedures to the administration of its products and services. Low staff productivity does not necessarily mean that personnel are not working hard. It may show that they are tied up in excessive paperwork and procedures. What to Watch Out For Including consumer and pawn loans can easily distort the efficiency of the institution, as they require much less screening and pre-approval analysis compared to typical microloans. For this reason, it is preferable for these types of loans to be excluded from this calculation. However, not all MFIs clearly separate these loans from uncollateralized microloans, which makes it difficult to make this distinction. Traditionally, the microfinance community used the ratio of clients per loan officer (or loans per loan officer, see Loan Officer Productivity Ratio) to measure productivity. While this is a useful indicator, the Personnel Productivity Ratio includes all staff instead of only loan officers in the denominator and thus captures an institution-wide perspective on staff productivity. This is particularly relevant when an MFI has efficient loan officers but cumbersome and bureaucratic back-office procedures (or vice versa). In order for MFIs to suc-ceed they must learn to maximize productivity by using the least amount of resources to process the greatest volume of loans in a way that does not sacrifice portfolio quality or customer service. This critical equilibrium of efficiency and productivity must be paramount at every level of the MFI and a key measure of operational management.
Total Number of Active
Borrowers
Total Number of Personnel

Technical Guide: Performance and Social Indicators for Microfinance Institutions
27
In regions of high growth MFIs were forced to proportionally increase their resources to maintain their oper-ations to keep up with the demand for personnel. Unfortunately, in many regions there simply were not enough trained microfinance professionals. This can be observed by analyzing the ratio of inexperienced staff (those with less than 12 months prior experience). While adding staff allows the MFI to increase its lending capabilities, it comes at the expense of having to hire and train new staff, and in the short-term (or growth period), this can make Personnel Productivity appear inefficient. How this Relates to the Traditional Banking Sector Unlike the MFI sector where the Personnel Productivity Ratio compares the number of borrowers to full-time employees, the traditional banking sector typically measures productivity in terms of employees to reve-nue. This calculation is called Revenues per Employee or Sales per Employee.10 Banks do not measure staff by number of clients because of differences in clientele, business strategies, and the diversity of revenue streams. The Personnel Productivity Ratio is more useful and more accurate for smaller financial institutions that have a focus on growing their client base while Revenues per Employee is more suited to larger, more commercialized banking that seek to grow portfolio size. Where the Industry Is Personnel Productivity is the ratio that most uniquely defines microfinance institutions. In order to become financially viable, MFIs must be able to handle very large numbers of customers with minimal administrative effort and without adversely affecting portfolio quality. Young, maturing MFIs may focus more on this indi-cator than larger, established MFIs because of their need for efficiency to gain economies of scale. The Personnel Productivity Ratios were relatively constant during 2009-2012. Notable trends include South Asia’s consistently high productivity (192 per employee), attributable to the strong presence of village banking and the low productivity in Eastern Europe and Central Asia from relatively large average loan sizes for indi-vidual loans. In Latin America, MicroRate has observed that NGOs consistently have better levels of productivity than their counterparts. A village bank can have 50% higher productivity compared to an MFI that focuses on individual lending. This is to be expected given the differences in the average loan amount between the two products and the increased time required to analyze an individual loan. MicroRate believes that a healthy system of incentives can contribute to maintaining high productivity along with excellent asset quality. Policies typically reward increasing the number of borrowers, rather than growing the portfolio.
Personnel Productivity Ratio
10 http://www.massmac.org/newsline/0707/McKinsey.pdf
!"!!!!
!50!!
!100!!
!150!!
!200!!
!250!!
!300!!
2009! 2010! 2011! 2012!
Africa!Middle!East!&!North!Africa!La;n!America!&!the!Carribean!Eastern!Europe!&!Central!Asia!South!Asia!East!Asia!&!the!Pacfic!

28
Loan Officer Productivity Ratio
How to Calculate It The Loan Officer Productivity Ratio is calculated by dividing the number of active borrowers of an institu-tion by the total number of loan officers. Consistent with the Personnel Productivity Ratio, active borrowers are defined as the number of individually identifiable borrowers who have at least one current, outstanding loan with the institution. Loan officers are defined as personnel who primarily manage a portion of the loan portfolio. It includes field personnel and other staff that interacts directly with the client, but not administrative staff or analysts who may help process loans but do not have direct client contact. The total number of loan officers also includes contract employees who may not be part of the permanent staff, but that are regularly hired to serve as loan officers. What It Means This ratio captures the productivity of the institution’s loan officers – the higher the ratio, the more produc-tive the institution. It is one of the most recognized performance ratios in the microfinance industry. Like the Personnel Productivity Ratio, the Loan Officer Productivity Ratio says a fair amount about how well the MFI has adapted its processes and procedures to its business mission of extending microcredits. What to Watch Out For The Loan Officer Productivity indicator, like the Personnel Productivity Ratio, is easily distorted by including consumer credit or pawn loans, which are vastly different than microcredits. Both consumer and pawn lend-ing rely heavily on collateral and less on repayment capacity. This makes it possible to process a high volume of loans with few staff members. As such, consumer and pawn loans should be excluded in the calculation of this ratio. Much like the Personnel Productivity Ratio, Loan Officer Productivity is also affected by the microfinance context as well as portfolio and loan-size growth. Hiring and training new loan officers not only takes time but also takes the attention of experienced loan officers away from the field so that they can administer the training. Loan officer productivity must also be analyzed with the portfolio quality of the loan officer’s portion of the portfolio. Loan officer incentives for increasing their number of borrowers must be balanced against incen-tives to maintain portfolio quality, or officers will be encouraged to make risker loans. For MFIs with a variety of product offerings such as savings or non-financial services, loan officer produc-tivity will also be lower if the officers are responsible for administering these services. If an MFI has special-ized staff to handle the services not related to loans than these additional services should not negatively affect loan officer productivity.
Total Number of Active Borrowers
Total Loan Officers

Technical Guide: Performance and Social Indicators for Microfinance Institutions
29
How this Relates to the Traditional Banking Sector The banking sector does not use ratios that are similar to the Loan Officer Productivity Ratio. In the tradi-tional banking sector Loan Officer Productivity is primarily focused on the amount loaned and the quality of that loan.11 Where the Industry Is Very high productivity was applauded as positive before the financial crisis, especially if portfolio quality could be maintained. The crisis strongly affected portfolio quality in some countries. This led to more careful measures of analysis and repayment capacity thus reducing productivity targets. I was not uncommon to see Loan Officer Productivity levels that exceeded 500. Currently, MFIs try to limit the number of loans to roughly 300 borrowers per loan officer and 400 for group lending. In addition, given greater competition, a focus on better customer service translates into customer loyalty that in the long term brings greater efficien-cy to the MFI. In this context, Loan Officer Productivity has been decreasing in mature markets where is it becoming more difficult to find good borrowers and where the analysis should be more extensive given the higher risk of over indebtedness. To provide a representative sample of Latin American MFIs from the MicroRate5012, the average Loan Officer Productivity ratio for individual and group-lending MFIs was 200 and 350, respectively in 2012. Likewise, compared to urban areas, MFIs focused on serving rural clients with a dispersed population gener-ally have lower productivity levels. Given the close relationship between Personnel Productivity and Loan Officer Productivity, it is not surpris-ing that the same MFIs are strong in both productivity measures. For example, loan officer productivity was highest in South Asia, which averaged 444 borrowers per loan officer in 2012. Consistently, South Asia also maintained the highest Personnel Productivity Ratio in 2012. Both trends are attributed to the predominance of group lending in the region. On the other hand, MFIs that employ both methodologies (individual and group) train their loan officers to specialize in one methodology, which allows for greater productivity. The incentive policies for Loan Officers have more force in competitive markets where the MFIs fight to maintain or improve their market share. However, many MFIs push portfolio growth more than the number of borrowers, leading to lower productivity and higher PAR.
Loan Officer Productivity Ratio
11 Jaideep G. Motwani, Victor E. Sower, Benchmarking in Services, (Emerald Group Publishing, 2006), 273-275. 12 A sample of 50 Latin American MFIs rated by MicroRate. MicroRate50, see Appendix I.
!100!!!150!!!200!!!250!!!300!!!350!!!400!!!450!!!500!!
2009! 2010! 2011! 2012!
Africa!Middle!East!&!North!Africa!La;n!America!&!the!Carribean!Eastern!Europe!&!Central!Asia!South!Asia!East!Asia!&!the!Pacfic!

30
Financial Management
Financial Expense Ratio Cost of Funds Ratio Debt to Equity Ratio
Highlights for Financial Management: • Regulated MFIs tend to have higher cost of
funds than unregulated MFIs because they have more access to commercial funding.
• As MFIs grow and mature, Debt/Equity will continue to increase. MFIs must balance the corresponding increase in funding expenses with improved profitability and efficiency.

Technical Guide: Performance and Social Indicators for Microfinance Institutions
31
Financial Management Financial management assures that there is enough liquidity to meet an MFI’s obligations to disburse loans to its borrowers and to repay loans to its lenders. Even though financial management is a back office function, decisions in this area can directly affect the bottom line of the institution. Errors in liquidity or foreign ex-change management, for example, can easily compromise an institution with efficient credit operations and otherwise sound management. The importance of adequate liquidity, and consequently of financial management, grows further if the MFI is mobilizing savings from depositors. Financial management can also have a decisive impact on profitability through the skill with which liquid funds are invested. Managing foreign exchange risk and matching the ma-turities of assets and liabilities are a part of financial management. Both are areas of great potential risk for an MFI and underline the importance of competent financial management. The three key indicators for evaluating the financial management of a microfinance institution include the Funding Expense Ratio, Cost of Funds Ratio and the Debt to Equity Ratio.

32
Financial Expense Ratio
How to Calculate It The Financial Expense Ratio is calculated by dividing interest and fee expenses on funding liabilities by the average gross loan portfolio. What It Means This ratio measures the total interest expense incurred by the institution to fund its loan portfolio. The Finan-cial Expense Ratio is not the institution’s credit spread, nor is it the average interest rate at which it borrows (for that, see the Cost of Funds Ratio below). Rather, this measure is one of the three components used to help determine the minimum lending rate an MFI must charge in order to cover its funding expenses. The minimum lending rate is determined by adding the Impairment Expense Ratio, the Operating Expense Ratio and the Financial Expense Ratio. Portfolio Yield (the income generated by the portfolio) less the Funding Expense Ratio (the financial cost incurred to fund the institution itself) is the net interest margin. The Cost of Funds ratio is related to the interest paid to the funder, which is different from the financing expense that is related to the level of debt (with or without interest payments) of the portfolio. That is, how many cents for every dollar collected is spent on interest payments for borrowed funds. What to Watch Out For The Financial Expense Ratio is determined more by whether an MFI finances itself primarily through debt, equity, or deposits than by anything else. It says little about the financial condition of an MFI. Should an MFI receive a majority of its working capital through donations then its interest expense would obviously be quite low. The same is true for new, less mature MFIs that are typically funded by capital from shareholders and from donations (in the case of NGOs). This keeps funding expenses low and manageable, and hopefully fosters growth for the MFI. Once larger, the MFI can increasingly solicit commercial capital and increase its borrowing capacity, which inherently raises its interest and fee expenses. How this Relates to the Traditional Banking Sector The Financial Expense Ratio is equivalent to the traditional banking sector’s Bank Expense Ratio. In practice, the Bank Expense ratio is not widely utilized. To determine a similar set of information, a bank would use the Net Interest Margin (NIM). This ratio, like the one for microfinance, calculates the interest margin between what the bank pays on its liabilities and the amount the bank charges for its loans. The Net Interest Margin is calculated as the net interest income (interest paid minus interest received) as a proportion of the average interest earning assets. This provides the bank the calculation of its spread on its invested funds, and taken in combination with the efficiency ratio and impairment expense, enables the bank to understand its cost structure to arrive a minimum lending rate to achieve a positive return.
Financial Expenses on
Funding Liabilities
Average Gross Loan Portfolio

Technical Guide: Performance and Social Indicators for Microfinance Institutions
33
Where the Industry Is In general, there has been an improvement of this indicator in all regions. Africa, East Asia and the Pacific emerge as the regions with the lowest financial expenses. In the case of Africa (4%), many MFIs receive do-nations, grants and subsidized capital, reducing their financial expense ratio. Because of the subsidized capital and the scarcity of creditworthy MFIs there is little access to commercial funds, which has distorted much of the African market. In Latin America, the financial expense ratio improved slightly in recent years with an average of 7%. NGOs in Latin America have been self complying with regulation and taking on greater debt.
Financial Expense Ratio
2.0%%
4.0%%
6.0%%
8.0%%
10.0%%
12.0%%
14.0%%
2009% 2010% 2011% 2012%
Africa%Middle%East%&%North%Africa%La=n%America%&%the%Carribean%Eastern%Europe%&%Central%Asia%South%Asia%East%Asia%&%the%Pacfic%

34
Cost of Funds Ratio
How to Calculate It The Cost of Funds Ratio is calculated by dividing the financial expenses on funding liabilities (interest and fees) by the period’s average funding liabilities. The denominator contains all funding liabilities of the institu-tion, including deposits, commercial funds, subsidized funds and quasi-capital. It does not include liabilities that are unrelated to financing the portfolio, for example, accounts payable or a mortgage loan obtained to finance office space. What It Means As its name indicates, this ratio measures the average cost of the company’s borrowed funds that are used to finance its loan portfolio. In comparing MFIs Cost of Funds Ratio it is important to distinguish the between MFIs have the ability to draw on savings as a low cost funding source. MFIs that can mobilize savings tend to have a relatively low cost of funds. However, this advantage is offset to some extent by administrative cost of providing savings products. What to Watch Out For In many cases, the funding liabilities of MFIs include subsidized funds/grants. Such subsidies will drive the cost of funds down, when in fact the real cost of commercial borrowing for the institution is far higher. As subsidized MFIs grow, they are forced to increasingly resort to commercial borrowing to sustain their growth. These MFIs will subsequently see a sharp rise in the cost of funds, placing severe pressure on margins. Man-agement must then counteract the decrease in margins by cutting other costs or raising lending rates. The country environment plays a large role in the cost of funds. Factors such as inflation or macro country risks can play a significant role. In countries with high inflation for example, the cost of financing is generally the sum of the commercial financing rate plus the rate of inflation. In countries with a low sovereign rating or with high country risk or with a volatile microfinance sector, the interest rates are usually higher, reflecting perceived risk. Another important factor is the creditworthiness and perceived risk of a MFI. A better credit history and performance reflected by higher ratings could lead to lower interest rates. When making adjustments to ROE and ROA (see Appendix II) MicroRate adjusts interest rates that it consid-ers subsidized to allow a fair comparison across MFIs. How this Relates to the Traditional Banking Sector The Cost of Funds is used in the same fashion as in the traditional banking sector and may be referred as the Rate Paid on Funds (RFP). This is determined by taking total interest expense over total earning assets. Earn-ing assets are classified as interest-bearing financial instruments ranging from loans to trading account securi-ties.
Financial Expenses on
Funding Liabilities
Average Funding Liabilities

Technical Guide: Performance and Social Indicators for Microfinance Institutions
35
This calculation looks at the average cost of the funds that were borrowed to run operations and meet capital requirements. The traditional banking sector has a variety of sources of funding such as deposits, interbank lending, money markets, and borrowing from central banks. The spread between the cost of funds borrowed and the interest rate charged to borrowers is one of the main sources of profit for banks.13 Where the Industry Is In recent years the MFIs have been converting their dollar denominated debt (or Euro) into the local curren-cy. This increases financing costs for the MFI but at the same time reduces the exchange rate risk for the MFI by linking their liabilities to their collections and the currency of the income of their borrowers. This also reduces the credit risk. Other factors that increase the costs of funds are inflation and political risk. Countries where there is high inflation, like Argentina, Kenya and Nicaragua (in addition to the political risk) interest rates tend to be high.
13 http://www.fdic.gov/

36
Debt to Equity Ratio
How to Calculate It The Debt/Equity Ratio is calculated by dividing total liabilities by total equity. Total liabilities include every-thing the MFI owes to others, including deposits, borrowings, accounts payable and other liabilities. Total equity equals total assets less total liabilities. Subordinated debt is considered equity if its term is more than five years, thus reducing the numerator and increasing the denominator. The portions that are due in less than five years are considered a liability. What It Means The Debt/Equity Ratio is the simplest and best-known measure of capital adequacy because it measures the overall leverage of the institution. The Debt/Equity Ratio is of particular interest to lenders because it indi-cates how much of a safety cushion (in the form of equity) there is in the institution to absorb losses. What to Watch Out For Traditionally, microfinance institutions have had low Debt/Equity Ratios, because as unregulated banks, their ability to borrow from commercial lenders has typically been limited. As MFIs transform into regulated in-termediaries, however, Debt/Equity Ratios rise rapidly. Risk and volatility of the MFI (exposure to shifts in the business environment, for instance) determine how much debt can be carried for a given amount of equi-ty. Even the most highly leveraged MFIs still carry less debt than conventional banks because microloan port-folios are backed by less collateral and their risk profiles are not as well understood as conventional bank portfolios. Changes in the Debt/Equity Ratio are often more important than the absolute level of that indicator. If the Debt/Equity Ratio increases rapidly, the MFI may be approaching its borrowing limits, which in turn will force it to curtail loan growth. Also, rapid increases in debt funding are bound to put pressure on profit mar-gins. The terms on which the MFI borrows also influence how much debt it can safely assume. If a significant amount of the liabilities consist of long-term donor funding, a high Debt/Equity Ratio will represent less of a risk than when the MFI relies on short-term lines of credit. One of the strongest incentives for unregulated MFIs to leave their sheltered, tax-free existence and subject themselves to the discipline of banking laws is access to funding. With regulation and transparency comes the possibility of accessing capital markets. Regulation typically allows MFIs to achieve much higher Debt/Equity Ratios than their NGO peers. In fact, once licensed and supervised, MFIs discover that commercial lenders who previously balked at a 1:1 Debt/Equity Ratio will now gladly lend three to five times the MFI’s equity. However, an MFI must be mindful to put the extra capital to good use through investments that increase margins, profitability and efficiency. Also, the MFI must make sure it can efficiently utilize the capital and should guard against the cost of funds outpacing the increase in debt funding and PAR growing out of hand. The object is to use the new debt financing for constructive operations building, while ensuring risk and vola-tility measures decrease.
Total Liabilities Total Equity

Technical Guide: Performance and Social Indicators for Microfinance Institutions
37
How this Relates to the Traditional Banking Sector The Debt/Equity Ratio used to evaluate MFIs is the same as in the traditional banking sector. This ratio re-veals the extent to which the bank funds operations with debt rather than equity. This allows banks to moni-tor solvency and analyze their capital structure. Debt/Equity ratios vary considerably depending on the type of institution. NGOs typically have lower Debt/Equity (1:1 to 3:1) levels than regulated MFIs and even lower levels than commercial banks. NGOs do not have owners. The only way to strengthen an NGO’s equity is by reinvesting profits or through grants and donations. Where the Industry Is With the exception of South Asia, that greatly improved its Debt to Equity ratio (from 7:1 in December 2009 to 5:1 in 2012), other regions did not show significant changes. The world average held at 4:1, despite higher financing for the microfinance sector. In Latin America, the ratio stayed stable without sharp changes. However, the MicroRate 50, showed a signif-icant increase for unregulated MFIs moving from 2:1 to 3:1 from 2009 to 2012. MicroRate notes that NGOs, mainly in Latin America, are complying more and more with regulation, increasing their ability to take on more debt. Regulated MFIs stayed stable at an average of 5:1. Public funders support the sector in some countries and often make it difficult for commercial funding to compete. In many cases, they offer low interest rates and advantageous conditions. Yet a high concentration of government funding increases diversification and political risks. On the other hand, more and more countries are creating deposit insurance that include MFIs. This can re-duces the risk for savers who put their money in heavily levered MFIs. Finally, there have been large advances in some countries in implementing the Basel II and III rules related to the minimum capital requirements. These requirements are adjusted to specific risks of each MFI taking into account its credit, operating, and financial (profitability, liquidity, solvency, interest rate and currency) risk. However, MicroRate considers the Debt/Equity ratio as an important tool for comparing the level of risk of MFIs in different countries where the Basel rules have not been applied or have not be adjusted to the reality of the country.
Debt/Equity Ratio
!0.5!!
!1.5!!
!2.5!!
!3.5!!
!4.5!!
!5.5!!
!6.5!!
2009! 2010! 2011! 2012!
Africa!Middle!East!&!North!Africa!La=n!America!&!the!Carribean!Eastern!Europe!&!Central!Asia!South!Asia!East!Asia!&!the!Pacfic!

38
Profitability Return on Equity Return on Assets Portfolio Yield
Highlights for Profitability: • High PAR ratios and write-offs reduce the
portfolio yield • Donations, extraordinary accounts, and
accounts from previous transactions can distort these ratios

Technical Guide: Performance and Social Indicators for Microfinance Institutions
39
Profitability Profitability measures such as Return on Equity (ROE) and Return on Assets (ROA) summarize performance in all areas of the company. If portfolio quality is poor or efficiency is low, this will be reflected in profitabil-ity. Profitability indicators can be difficult to interpret since they are an aggregate of so many factors. The fact that an MFI has a high ROE says little about why that is so. All performance indicators tend to be of limited use (in fact, they can be outright misleading) if looked at in isolation and this is particularly the case for profit-ability indicators. To understand how an institution achieves its profits (or losses) the analysis also has to take into account other indicators that throw light on the operational performance of the institution, such as operational efficiency and portfolio quality. The profitability analysis is further complicated by the fact that a significant number of microfinance institutions still receive grants and subsidized loans. Comparing “apples to apples” is a perennial problem in microfinance, because subsidies are still widespread and accounting practices vary widely. Everyday MFIs are becoming more regulated and information is becoming more dependable and standard-ized. However, there are unregulated financial institutions that are able to achieve dramatic changes in their profitability with the simple resource of adjusting provision levels. Analysts who focus exclusively on the profitability are often unable to detect this. Finally, this guide has grouped Portfolio Yield among the profitability indicators, not because the cost of credit to the clients measures profitability per se, but because profitability is often a function of how much MFIs charge their clients. Other financial institutions are limited by competition as to how much they can charge, but microfinance is still such a new activity that many MFIs operate in a seller’s market. In the ab-sence of competition, even highly inefficient MFIs can remain profitable by simply raising their rates. On the other hand, in a fiercely competitive market like Bolivia, or in one where the government has placed a ceiling on effective interest rates, as is the case in Ecuador, even very efficient MFIs find it difficult to achieve high Portfolio Yields. The three indicators used to measure profitability are Return on Equity, Return on Assets and Portfolio Yield. As mentioned earlier, Return on Equity and Return on Assets have been adjusted for subsidies and varying accounting practices in order to make the results comparable across institutions.

40
Return on Equity
How to Calculate It Return on Equity (ROE) 14 is calculated by dividing net income (after taxes and excluding any grants or dona-tions) by average equity for the given period. Only paid-in capital is considered. That is, subscribed capital (that is promised but has still not been paid) should not be taken into account. What It Means Return on Equity indicates the profitability of the institution. For privately owned entities, ROE is a measure of paramount importance since it measures the return on the owner’s investment in the institution. However, given that many MFIs are not-for-profit-organizations that do not distribute profits, the ROE indicator is most often used as a proxy for commercial viability and the strength of equity. What to Watch Out For The level of leverage – the proportion of equity to debt - is a critical factor to consider. That is, if an MFI can generate a profit of 20 cents for every dollar of its assets, the ROE would be 20% if there is no debt, 40% if debt equals equity, 60% if debt is twice the amount of equity, and so on. An MFI that wants to achieve a high ROE has a strong incentive to finance most of its assets through debt. On the other hand, a high degree of leverage also leads to higher levels of risk. Just as a profitable MFI can become highly profitable if its leverage is high, a loss-making MFI will incur crippling losses if it relies heavily on debt financing. Lenders will typically impose limits on leverage, whereas shareholders will often push for higher levels of debt. When comparing the ROE of different MFIs, it is important to take these differences in leverage and risk levels into account. Another important factor is the stability of income and expenses. A high ROE in one period does not neces-sarily indicate a very profitable MFI. For example, the MFI could have sold an asset leading to a one-time spike in profitability. Or it could have reduced its provisions for loan losses. To measure financial strength, it is therefore necessary to look at profitability during a number of successive years. Rising profits that are sus-tained year after year are usually a good indicator that a company is financially strong. It should be noted that to calculate this ratio, the MIX does not simply take net profit as it appears in the income statement. Rather, it looks at operating income after deducting income tax. It then also backs out extraordinary expenses and extraordinary income. When comparing the ROE of MFIs, it is important to adjust for different accounting practices. Here, the greatest concern is provision expense. The Return on Equity of MFIs maintaining provisions at 200% of PAR is hardly comparable with that of an MFI where provisions cover only 25% of PAR. To eliminate these distortions, the ROE should be recalculated applying a standard provisioning policy (See Provision Expense Ratio for a level of provisions recommended). 14 The term “Return on Equity” is used whenever return on average equity is measured. If return as of a certain date is measured, that date should be specifically stated, for instance: “Return on Equity as of December 2012.” The same applies to Return on Assets.
Net Income Average Equity

Technical Guide: Performance and Social Indicators for Microfinance Institutions
41
Inflation can be another distorting factor. If inflation is high it is possible that the MFI is actually losing mon-ey even though they show profits. Dividend payments do not affect the calculation of ROE. Dividends distribute profits, they do not reduce them. Injections of additional equity will reduce ROE. Such a dip in profitability is not necessarily a bad sign as long as the MFI uses these additional resources well. In that case, ROE will recover quickly. How this Relates to the Traditional Banking Sector The Return on Equity calculation is the same for both MFIs and traditional banks. However commercial banks typically carry higher levels of debt – their leverage is higher – than is the case for MFIs. This led to high volatility of earnings during the financial crisis. The average ROE for US banks was -20% in 2008 – down from +15% in 2006. By 2013, the ROE of these banks had recovered somewhat to 8.8%. Where the Industry Is Return on Equity is perhaps the most surprising story that has emerged from the MFI industry in recent years. Yields easily exceed those obtained by the traditional banking sector. The international crisis did not leave MFIs entirely unscathed. In 2009 their average ROE had dropped to 6.7%, mainly because provision expenses to cover deteriorating portfolios had grown. By 2012, ROE was back up at 13.4%. A few years ago, an ROE of 40-50 % was not unusual for MFIs. As the industry matures, such levels of prof-itability have become rare. Now, an ROE exceeding 20% would be considered high in most regions.
Return on Equity
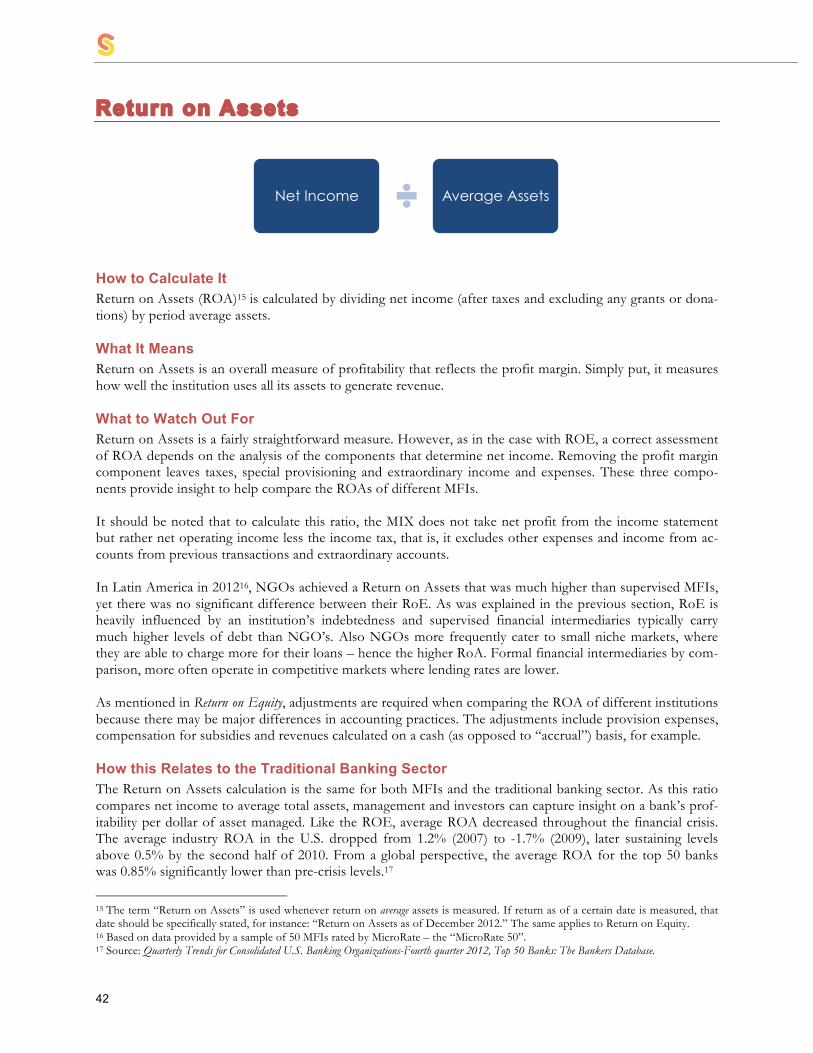
42
Return on Assets
How to Calculate It Return on Assets (ROA)15 is calculated by dividing net income (after taxes and excluding any grants or dona-tions) by period average assets. What It Means Return on Assets is an overall measure of profitability that reflects the profit margin. Simply put, it measures how well the institution uses all its assets to generate revenue. What to Watch Out For Return on Assets is a fairly straightforward measure. However, as in the case with ROE, a correct assessment of ROA depends on the analysis of the components that determine net income. Removing the profit margin component leaves taxes, special provisioning and extraordinary income and expenses. These three compo-nents provide insight to help compare the ROAs of different MFIs. It should be noted that to calculate this ratio, the MIX does not take net profit from the income statement but rather net operating income less the income tax, that is, it excludes other expenses and income from ac-counts from previous transactions and extraordinary accounts. In Latin America in 201216, NGOs achieved a Return on Assets that was much higher than supervised MFIs, yet there was no significant difference between their RoE. As was explained in the previous section, RoE is heavily influenced by an institution’s indebtedness and supervised financial intermediaries typically carry much higher levels of debt than NGO’s. Also NGOs more frequently cater to small niche markets, where they are able to charge more for their loans – hence the higher RoA. Formal financial intermediaries by com-parison, more often operate in competitive markets where lending rates are lower. As mentioned in Return on Equity, adjustments are required when comparing the ROA of different institutions because there may be major differences in accounting practices. The adjustments include provision expenses, compensation for subsidies and revenues calculated on a cash (as opposed to “accrual”) basis, for example. How this Relates to the Traditional Banking Sector The Return on Assets calculation is the same for both MFIs and the traditional banking sector. As this ratio compares net income to average total assets, management and investors can capture insight on a bank’s prof-itability per dollar of asset managed. Like the ROE, average ROA decreased throughout the financial crisis. The average industry ROA in the U.S. dropped from 1.2% (2007) to -1.7% (2009), later sustaining levels above 0.5% by the second half of 2010. From a global perspective, the average ROA for the top 50 banks was 0.85% significantly lower than pre-crisis levels.17
15 The term “Return on Assets” is used whenever return on average assets is measured. If return as of a certain date is measured, that date should be specifically stated, for instance: “Return on Assets as of December 2012.” The same applies to Return on Equity. 16 Based on data provided by a sample of 50 MFIs rated by MicroRate – the “MicroRate 50”. 17 Source: Quarterly Trends for Consolidated U.S. Banking Organizations-Fourth quarter 2012, Top 50 Banks: The Bankers Database.
Net Income Average Assets

Technical Guide: Performance and Social Indicators for Microfinance Institutions
43
Where the Industry Is Globally, MFIs achieved an average RoA of 3%. That is well above the RoA of typical commercial banks. After the 2008-09 financial crisis, average RoA bounced back, but as markets mature and competition in-crease RoA remained steady in the most recent years. In 2012, East Asia and the Pacific obtained the highest ratio at 3.9% and South Asia achieved the lowest at 2%.
Return on Assets

44
Portfolio Yield
How to Calculate It Portfolio Yield is calculated by dividing financial revenue from loan portfolio by the period average gross portfolio. Income from recovered write-offs is recorded as "other income" because the portfolio no longer exists in the assets of the company. What It Means Portfolio Yield measures how much the MFI actually received in interest and other payments from its clients during the period. A comparison between the Portfolio Yield and the average effective lending rate gives an indication of the institution’s efficiency in collecting loan repayments from its clients. It also provides insight into portfolio quality since most MFIs use cash accounting and Portfolio Yield does not include the accrued income that delinquent loans should have generated but did not. Portfolio yield is widely used in microfinance, where the true cost of loans is often much higher than the nominal interest charged. Since portfolio yield takes into account all fees, discounts and special charges it is a more reliable measure of that true cost. On the other hand, portfolio yield understates the true cost to the extent that loans are in arrears. An effective way to determine the profit margin from operations of an MFI is subtracting the three expense ratios (Operating Expense Ratio, Impairment Expense Ratio and Financial Expense Ratio) from the Portfo-lio Yield. What to Watch Out For For Portfolio Yield to be meaningful, it must be understood in the context of the MFI’s environment, specif-ically the interest rate environment. Generally speaking, Portfolio Yield is the initial indicator of an institu-tion’s ability to generate the revenue to cover its financial and operating expenses. MFIs tend to disguise their lending rates by adding things such as commissions, forced savings and other fees. Portfolio Yield is an easy way to conservatively calculate the actual rate an institution charges. It shows how much, on average, the MFI ultimately receives in interest and other payments on its loans. Why do insti-tutions hide their effective interest rates? Clients may be less likely to borrow, or government interest rate ceilings may prohibit the high interest rates needed for MFIs to survive. However, since arrears reduce an MFI’s portfolio yield an analysis of Portfolio Yield should also consider the PAR and Write-off ratios. Portfolio Yield is strongly affected by competition and loan size. In markets where competition among MFIs is still low, Portfolio Yield tends to be high. MFIs can then charge what the market will bear, without having to worry about losing their clients to competitors. As competition develops, it can happen that Portfolio Yield drops from very high levels – 60%, 80% or more - to half those amounts or less within a few years.
Financial Revenue from Loan Portfolio
Average Gross Loan Portfolio

Technical Guide: Performance and Social Indicators for Microfinance Institutions
45
Loan size also strongly affects lending rates. That makes intuitive sense, because dollar for dollar lent, it is much more expensive to process a small loan than a large one. MFIs that use an individual lending method-ology nearly always have lower Portfolio Yields than their Village Banking competitors. The reason is typically that individual loans tend to be larger than group loans. This leads to lower Operating Expense Ratios (see Efficiency & Productivity chapter) for MFIs making individual loans, which in turn enable them to lower their lending rates. When judging whether a MFI’s loans are expensive or cheap, it is therefore necessary to first look at the average size of those loans. The frequency of loan payments also influences the effective cost of loans. Small loans are typically repaid faster and in more frequent installments than large loans. Village banking MFIs generally make shorter term loans and require weekly payments. This drives up Portfolio Yield compared to individual loans lent for long-er terms and with monthly repayments. Inflation is another key issue in determining whether portfolio yield is high. If inflation is high, MFIs must build this into the rate they charge or they will end up charging negative rates (in inflation adjusted “real” terms). How this Relates to the Traditional Banking Sector In the traditional banking sector, Gross Yield on Earning Assets (GYEA)18 is similar to Portfolio Yield. This is calculated by taking total interest income over total average earning assets. Earning assets are considered to be interest bearing financial instruments ranging from loans to trading account securities. However, the Port-folio Yield calculation is slightly different because it specifically focuses on the earning assets within the loan portfolio itself and ignores assets that are not part of the portfolio. Where the Industry Is Global portfolio yield continued to decrease (from 28.5 % in 2009 to 27.6% in 2012). This trend should con-tinue as the industry matures. It seems to be mainly driven by competition, but declining interest rates inter-nationally, have also had an impact. In 2012, regionally, Africa stands out with a portfolio yield of 33%. South Asia shows the lowest ratio at 23%. In Latin America there are large differences in rates depending on the maturity of the market. Among the larger Latin American microfinance markets in 2012 Bolivia had the lowest average portfolio yield (20%) and Mexico the highest (67%).
Portfolio Yield
18 http://www.usbrn.com/datadict.asp?txtSrchWord=Banking
20.0%%22.0%%24.0%%26.0%%28.0%%30.0%%32.0%%34.0%%
2009% 2010% 2011% 2012%
Africa%Middle%East%&%North%Africa%La>n%America%&%the%Carribean%Eastern%Europe%&%Central%Asia%South%Asia%East%Asia%&%the%Pacfic%

46
Social Performance
National Loan Size Ratio Borrower Retention Ratio Staff Turnover Ratio Social Efficiency Index
Highlights for Social Performance: • Average loan size should be contextual-
ized according to the country’s income level
• Low borrower retention rates could indi-cate client dissatisfaction
• High staff turnover is one of the main problems in mature markets

Technical Guide: Performance and Social Indicators for Microfinance Institutions
47
Social Performance There has been a growing demand for transparency on the social performance of MFIs. However, indicators that measure social results have not been universally accepted despite microfinance’s double bottom line ob-jectives - financial and social returns. Recently, controversies ranging from excessive profitability and usurious interest rates, to increasing client over-indebtedness and cases of client abuse have plagued the sector and called into question its social reputation. Claims that the social and development impact of microfinance may be overstated, or that it may actually be harming those it set out to help, have come to surface, forcing the industry to reevaluate itself and its social responsibility towards various stakeholders. Initiatives such as the Social Performance Task Force (SPTF), MFTransparency, the Center for Financial Inclusion’s Smart Campaign on Client Protection Principles, along with social ratings of MFIs, have all con-tributed to increasing transparency and awareness of best practices. There are many challenges in evaluating an MFI’s social performance. Not only do MFIs have a wide range of social missions and strategic objectives, but perspectives on what is “social” also vary considerably. Some MFIs focus on serving women, the rural poor, or youth, while others want to increase access to finan-cial services or offer non-financial services. There are situations where MFIs without an overtly social mission statement may achieve stronger social outcomes than those with very strong social missions. Understanding the contextual nuances is critical given the highly subjective nature of this aspect of microfinance. Measuring social performance is still in its infancy with few widely accepted quantitative indicators to capture the social results of an MFI’s operations. This chapter on Social Performance presents three of the most universal, quantitative metrics to begin to meas-ure the social dimension. The fourth indicator is not as widely used, but is a good way of measuring efficient use of resources. Although there is great attention in the interest rates charged by MFIs, an analysis of annual percentage rates (APR) or effective interest rates (EIR), is not possible because of data limitations (MFI-, country- and regional-level statistics are not widely available). Because of the qualitative nature of social performance analysis, along with the limited data, the following indicators represent proxies for social performance. These indicators must be evaluated with other social metrics and qualitative attributes of the institution in order to provide a complete understanding of the MFI’s overall social performance.

48
National Loan Size Ratio
How to Calculate It The National Loan Size Ratio (NLR) is calculated by dividing the average loan size for an MFI by the gross domestic product (GDP) per capita of the country in which the MFI operates. What It Means This ratio provides a basic metric for comparing an MFI’s loan size across different geographies. The lower the percentage, the smaller the loan size is compared to the average wealth of a given country. It is not enough to simply compare average loan sizes for MFIs in India, Bosnia, and Peru and make an as-sumption on the MFI’s outreach. Contextualizing average loan size by GDP per capita is essential to adjust for varying levels of income between countries. Loan sizes have been a proxy for gauging the MFI’s microcredit niche. Although this proxy has many limita-tions it continues to be widely used. The smaller the loan size, the further “down market” and poorer the demographic niche. Generally speaking, an NLR less than one indicates a focus on a lower microfinance niche. As the NLR approaches two, it is closer to a small business niche. What to Watch Out For Since GDP does not fluctuate dramatically year-over-year, a significant change in the ratio would imply a change in the average loan size, which should merit further investigation. Often changes in average loan size are affected by changes in the distribution of product within the portfolio. For example, a shift in focus from micro to SME lending. In evaluating the average loan size of an MFI, it is more accurate to consider only the portion of the portfolio that is focused on microcredit, while excluding small consumer and/or pawn loans. These largely collateral-ized loans can easily distort an MFI’s social demographic target. For example, when an MFI first decides to offer consumer loans, it reduces the ratio because consumer loans tend to be small, but may not necessarily indicate a lower demographic niche – not necessarily “down market”. Revaluation and devaluation of the local currency should also be considered. In countries where there has been a revaluation of the currency, the average loan size will appear to either rise or fall rapidly. How this Relates to the Traditional Banking Sector The National Loan Size Ratio has no equivalent calculation in the traditional banking sector because unlike microfinance, social performance is typically not a business objective among commercial banks. Where the Industry Is Markets are typically divided into lower, medium and upper market niches. The upper market niche is above 150% NLR while the lower market niche usually is found below 50% NLR. In 2012, South Asia had the low-est ratio while Africa had the highest. In Africa, the average GDP tends to be comparatively low, distorting
Average loan size GDP per capita

Technical Guide: Performance and Social Indicators for Microfinance Institutions
49
the ratio upwards. In countries where income disparity is highest and GPD per capita is high - such as Mexi-co - the NLR gets pushed down. Likewise in Eastern Europe and Central Asia, the relatively large average loan sizes are countered by the relatively high GDP per capita. Microfinance Investment Vehicles have shown that when choosing between two MFIs with similar risk pro-files, they are more likely to choose the MFI that has a lower NLR. Many feel that serving a poorer market segment is more socially beneficial, diversifies risk, and implies better strategic positioning because of the difficulties in serving this market.
National Loan Size Ratio
0.00%$
20.00%$
40.00%$
60.00%$
80.00%$
100.00%$
120.00%$
140.00%$
2009$ 2010$ 2011$ 2012$
Africa$Middle$East$&$North$Africa$La=n$America$&$the$Carribean$Eastern$Europe$&$Central$Asia$South$Asia$East$Asia$&$the$Pacfic$

50
Borrower Retention Ratio
How to Calculate It The Borrower Retention Ratio is the number of active borrowers at the end of the period divided by the number of borrowers at the beginning of the period plus the number of new borrowers during the period. Another formula for this ratio that is widely used – including by the Mix Market - but may not be as strict is borrowers a t the end o f the per iod / (borrowers a t the beg inn ing o f the per iod + new borrowers a t the end o f the per iod) . What It Means As clients should be the center of all microfinance activity it is important to get a sense of client satisfaction and evaluate an MFI’s Corporate Social Responsibility19 to the client. Institutions should adequately serve clients by considering their needs, designing appropriate products and delivering in a client-centric manner. A popular proxy to gauge client satisfaction is measuring Borrower Retention. A higher retention ratio generally represents a higher level of client satisfaction. What to Watch Out For A distinction needs to be made between clients and borrowers. This measures the retention rates of recipients of credit products (borrowers) and not all of the clients of an institution (including savings clients). Including all clients would distort the ratio and using it as a proxy for satisfaction because of the difficulty in measuring active clients benefiting from non loan products. In markets with low levels of competition the Borrower Retention Ratio may remain high even if client needs are not adequately met. Borrowers may not have a choice of organizations and may be forced to remain with an MFI in spite of low satisfaction. This may distort the effectiveness of the indicator’s ability to gauge client satisfaction, which is why other indicators and metrics may also need to be considered. Low Borrower Retention Ratios are common in highly competitive markets as MFI seek to attract new clients with more competitive loan products and terms. Aggressive tactics can cause borrowers to switch institutions. Borrower Retention affects both operating expenses as well as portfolio quality. Attracting new customers costs more than retaining existing clients over time and keeping good clients exposes the MFI to fewer risks. Even in those cases where the operating expense ratio is high, in village banking for example, new customers require additional training, while old clients are familiar with the institution and therefore cost less to main-tain.
19 Corporate initiative to assess and take responsibility for the company's effects on the environment and impact on social welfare - www.investopedia.com. Often seen as responsibility toward stakeholders such as clients, staff, community and environment.
Number of borrowers at the
end of the period
Number of new borrowers during
the period
Number of borrowers at the
start of the period

Technical Guide: Performance and Social Indicators for Microfinance Institutions
51
This ratio can become distorted when an MFI has high write-offs. That is, when an MFI writes-off borrowers who have fallen in arrears, this does not necessarily reflect client dissatisfaction, but simply an inability to make payments on time. How this Relates to the Traditional Banking Sector The traditional banking sector uses a similar calculation to measure customer service. Where the Industry Is The Borrower Retention Ratio globally rose from 75% in 2010 to 77% in 2012. Incredibly, almost all regions showed improvements, despite stronger competition. It is possible that the recovery by MFIs after the finan-cial crisis led to better practices and client protection resulting in higher retention rates. In mature markets such as Latin America and East Asia an increase in competition has lowered this ratio. In some countries the levels have come down significantly as clients have more choices. According to the MicroRate 50, Unregulated MFIs (average ratio of 63 %) showed a lower retention than regulated MFIs (average 71 % ratio); this is possibly due to the greater involvement of village banking loans in the former. Under that methodology, when borrowers “rest” for a loan cycle they are no longer considered a borrower.
Borrower Retention Ratio

52
1
Number of staff who left during the period
Number of staff at the end of the
period
Number of staff @ MFI for more
than 1 year
2
Staff Retention Ratio How to Calculate It The Staff Retention Ratio is the inverse of the Staff Turnover Ratio. 1 - (staff that left during the period in the numerator divided by the average of staff at the end of the period plus the staff at the end of the period that have been with the institution for more than one year). If there are part-time employees, they should be treated as the equivalent number of employees. For example, two part-time employees should be counted as one full-time staff for this purpose. Staff paid by donors should also be considered if they perform similar roles to permanent employees or are responsible for permanent job. Another simple and popular formula is 1- ( ( s ta f f a t the beg inn ing o f the per iod + new s ta f f dur ing the per iod – s ta f f a t the end o f the per iod) / s ta f f a t the beg inn ing o f the per iod) . Note that this indicator does not differentiate between new staff and staff that have been with the institution more than one year. What It Means An institution’s responsibility towards its staff is another key area of social performance and Corporate Social Responsibility. Short of interviewing or surveying clients, the Staff Retention Ratio provides a quantitative measure of staff satisfaction with the MFI. The lower the ratio, the more the personnel are satisfied with their jobs. What to Watch Out For Staff turnover on its own will not provide a complete picture of how satisfied personnel are with their jobs. In cases where the MFI has had a crisis and must let go of staff, this ratio is not applicable. The Staff Turnover Ratio will be higher in competitive markets where MFIs seek to hire trained staff from other MFIs. It should be noted that most MFIs experience the greatest turnover during the first year of employment – this is especially valid for loan officers. During the staff induction training period, which generally takes between one and three months, loan officers often realize that the job is not for them. A more sophisticated analysis of this ratio removes the training period and begins the employment once induction is complete. Staff that has been promoted within the organization should not be included in turnover, only staff that have left the MFI.

Technical Guide: Performance and Social Indicators for Microfinance Institutions
53
Low turnover does not always indicate staff satisfaction and good HR policies. The analysis should take into account the employment rate in the region. In areas of high unemployment, staff often retain their positions for fear of not finding a new job. However, with increasing job opportunities, MFI turnover increases if sala-ries and HR management is not adequate and has not built staff loyalty. In addition to competitive salaries, MFIs often offer other benefits such as initial and on-going training, strong incentive systems, variable com-pensation, health benefits or other benefits beyond what is locally mandated, and a clear career path, among other things. Non-monetary incentives play an important role in the compensation package. In general, MFIs use variable pay to encourage loan collections and good asset quality. However, the experi-ence of leading MFIs suggests that incentives should play an important role but should not be excessive. Maintaining reasonable fixed salaries provides security and when variable pay is extremely high (in some cas-es, up to 100% is variable) there can be aggressive practices that can lead to abuse and higher turnover. How this Relates to the Traditional Banking Sector In the traditional banking sector the equivalent ratio is called the Employee Turnover ratio. It provides a simi-lar measurement of employees leaving the bank and is an important ratio for the Human Resources depart-ment because high turnover is costly and can influence an unstable work environment. Where the Industry Is The most developed microfinance markets in Latin America had an increasing staff turnover ratio where the average rose from 31% in 2009 to 35% in 2012. Problems with staff turnover have not been solved success-fully in these markets. The microfinance sector in Latin America is witnessing the highest level of loan officer turnover ever seen. In response, MFIs are making major efforts to improve their human resource policies through monetary and non-monetary incentives. Besides this, MFIs are paying special attention to the recruitment process to better align the day-to-day activities of the loan officer with the MFI’s social mission. Beyond the efforts mentioned above, MFIs have improved staff retention by analyzing their daily load. Previ-ously, MFIs increased salaries, training and non-monetary incentives. However, they had not fully recognized the long hours and hard work required, especially in rural areas, and how this was a determining factor in the retention of staff. After analyzing the workload and limiting the hours in the field, staff turnover was signifi-cantly decreased.
Staff Retention Ratio

54
Social Efficiency Index
How to Calculate It The Social Efficiency Index is calculated by multiplying the Operating Expense Ratio by Cost per Borrower. The Operating Expense Ratio is calculated by dividing all expenses related to the operation of the institution by the annual average gross loan portfolio (see page 22). The Cost per Borrower Ratio is calculated by dividing all expenses related to the operation of the institution by the average number of active borrowers for the period (see page 25). Note that this metric is an index - it is a number not a percentage, rate or ratio. What It Means This index is a proxy for how efficiently the institution is providing loans while neutralizing the effects of average loan size on efficiency (both operating expense ratio and cost per borrower are each heavily influ-enced by the loan size). The Operating Expense Ratio favors MFIs with larger loans, while the Cost per Bor-rower favors MFIs with smaller loans. The Social Efficiency Index allows for a more direct comparison of different types of MFIs with different credit methodologies. What to Watch Out For MFIs should be careful with factors that affect cost of borrowing, but are not directly related to the money that is lent. For example, MFIs that provide complementary services such as health or training will increase the operating expenses but are not directly related to the cost of providing the loan. These costs should be separated out in order to be able to compare MFIs that do not provide these services. Also, MFIs provide other financial services such as deposits or insurance, which may increase operating ex-penses but are not directly related to the lending services. The costs of these other financial services may place the MFI at a relative disadvantaged with other MFIs that do not offer these services. How this Relates to the Traditional Banking Sector This index is not used in the traditional banking sector. Where the Industry Is The MicroRate 50 for Latin American MFIs shows a wide range in terms of the Social Efficiency Index in 2012 ranging from 10 at the high end and 360 on the low end. Typically the performance could be divided into four categories ranging from Poor social efficiency to Excel-lent. In 2012 the MicroRate 50 could be divided as follows:
Operating expense ratio
Cost per borrower

Technical Guide: Performance and Social Indicators for Microfinance Institutions
55
Social Efficiency Index scores (MicroRate 50):
Performance Index Score Excellent Social Efficiency Less than 30
Good Social Efficiency 30 to 50 Moderate Social Efficiency 50 to 100
Poor Social Efficiency Over 100 As mentioned above, the disparity from MFI to MFI can be very large. This is the case for all regions. None-theless, South Asia and East Asia & the Pacific tended to have extremely low average loan sizes coupled with low operating expense ratios which resulted in overall high performance. In many regions such as Africa and Latin America, the ratio has worsened because an increase in competition has driven many MFIs to increase loan size to gain operating efficiency. This has resulted in a slowdown in the growth rates of borrowers and dramatically raised the Cost per Borrower, thus raising the index. The results show MFIs that provide village-banking services are generally more socially efficient. Although they tend to have higher operating expenses ratios (due to low average loan size), they achieve high social efficiency by managing a large number of borrowers.
Social Efficiency Index
0.0#
10.0#
20.0#
30.0#
40.0#
50.0#
2009# 2010# 2011# 2012#
Africa#Middle#East#&#North#Africa#La<n#America#&#the#Carribean#Eastern#Europe#&#Central#Asia#South#Asia#East#Asia#&#the#Pacfic#
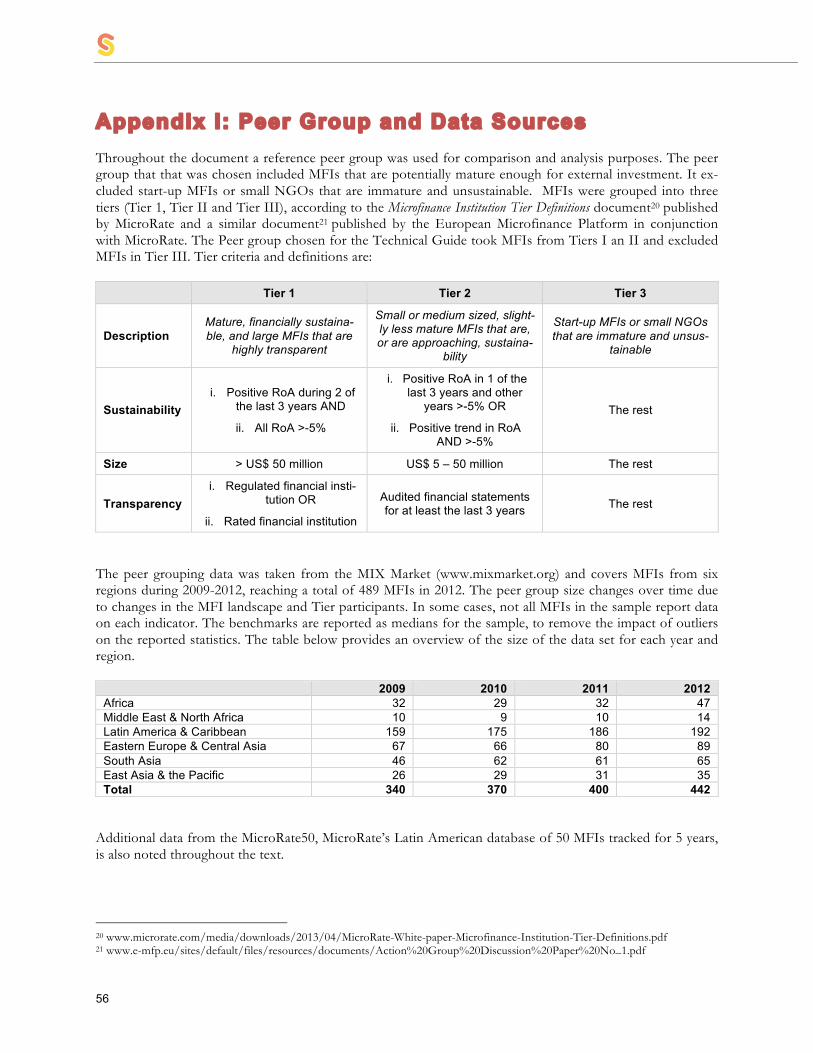
56
Appendix I: Peer Group and Data Sources Throughout the document a reference peer group was used for comparison and analysis purposes. The peer group that that was chosen included MFIs that are potentially mature enough for external investment. It ex-cluded start-up MFIs or small NGOs that are immature and unsustainable. MFIs were grouped into three tiers (Tier 1, Tier II and Tier III), according to the Microfinance Institution Tier Definitions document20 published by MicroRate and a similar document21 published by the European Microfinance Platform in conjunction with MicroRate. The Peer group chosen for the Technical Guide took MFIs from Tiers I an II and excluded MFIs in Tier III. Tier criteria and definitions are:
Tier 1 Tier 2 Tier 3
Description Mature, financially sustaina-ble, and large MFIs that are
highly transparent
Small or medium sized, slight-ly less mature MFIs that are, or are approaching, sustaina-
bility
Start-up MFIs or small NGOs that are immature and unsus-
tainable
Sustainability i. Positive RoA during 2 of
the last 3 years AND
ii. All RoA >-5%
i. Positive RoA in 1 of the last 3 years and other
years >-5% OR
ii. Positive trend in RoA AND >-5%
The rest
Size > US$ 50 million US$ 5 – 50 million The rest
Transparency i. Regulated financial insti-
tution OR
ii. Rated financial institution
Audited financial statements for at least the last 3 years The rest
The peer grouping data was taken from the MIX Market (www.mixmarket.org) and covers MFIs from six regions during 2009-2012, reaching a total of 489 MFIs in 2012. The peer group size changes over time due to changes in the MFI landscape and Tier participants. In some cases, not all MFIs in the sample report data on each indicator. The benchmarks are reported as medians for the sample, to remove the impact of outliers on the reported statistics. The table below provides an overview of the size of the data set for each year and region.
2009 2010 2011 2012 Africa 32 29 32 47 Middle East & North Africa 10 9 10 14 Latin America & Caribbean 159 175 186 192 Eastern Europe & Central Asia 67 66 80 89 South Asia 46 62 61 65 East Asia & the Pacific 26 29 31 35 Total 340 370 400 442
Additional data from the MicroRate50, MicroRate’s Latin American database of 50 MFIs tracked for 5 years, is also noted throughout the text.
20 www.microrate.com/media/downloads/2013/04/MicroRate-White-paper-Microfinance-Institution-Tier-Definitions.pdf 21 www.e-mfp.eu/sites/default/files/resources/documents/Action%20Group%20Discussion%20Paper%20No_1.pdf

Technical Guide: Performance and Social Indicators for Microfinance Institutions
57
Appendix II: Calculating the Ratios Reference Financial Statements Balance Sheet (US$ '000)
SAMPLE MFI Dec 31, 2011 Dec 31, 2012 ASSETS Cash and Banks 434 1,439 Temporary Investments 2,068 2,072 Net Loans 25,068 31,735
Gross Portfolio 27,443 34,604 Performing Loans 24,886 32,046 Portfolio at Risk 2,557 2,557
Loan Loss Reserve 2,374 2,868 Interest Receivable 336 437 Other Current Assets 356 343 Current Assets 28,262 36,027 Long Term Investments 37 143 Property and Equipment 918 835 Other Long Term Assets - - Total Assets 29,217 37,005 Liabilities Demand Deposits 233 1,780 Short Term Time Deposits 4,640 6,099 Short Term Funding Liabilities 1,433 1,852 Other Short Term Liabilities 1,420 1,823 Current Liabilities 7,726 11,554 Long Term Time Deposits 6,152 8,735 Long Term Time Liabilities 10,924 11,538 Quasi-Capital Accounts - - Other Long Term Liabilities - - Total Liabilities 24,802 31,827 Equity Capital 2,933 2,924 Earnings (losses) Period 410 1,125 Retained Earnings 195 - Other Capital Accounts 877 1,130 Total Equity 4,415 5,179 Total Liabilities and Equity 29,217 37,005

58
Income Statement (US$ '000)
SAMPLE MFI Dec 31, 2011 Dec 31, 2012 Interest and Fee Income 6,318 7,428
Cash Interest and Fee Income 5,982 6,990 Accruals (Interest Receivables) 336 437
Interest and Fee Income 2,009 1,913 Net Interest Income 4,309 5,514 Provision for Loan Loss 1,276 838 Net Interest Income, After Provisions 3,033 4,676 Operating Expense 2,815 3,109
Personnel 1,730 1,875 Other Administrative Expense 1,085 1,234
Net Operating Income 218 1,567 Other Income 477 287
Investment Income 134 90 Other Non Extraordinary Income 343 196
Other Expenses 116 371
MFI’s Inflation Adjustment (if any) 56 123 Other Non-Extraordinary Expenses 60 248
Net Income Before Extraordinary Items 579 1,482 Extraordinary items (1) -
Extraordinary Income - - Extraordinary Expenses 1 -
Net Income Before Taxes 577 1,482 Taxes 167 358 Net Income 410 1,125

Technical Guide: Performance and Social Indicators for Microfinance Institutions
59
Additional Information to Calculate the Ratios (US$ '000)
Items 2012 Cash and Banks and Short Term Investments $3,511 Porfolio At Risk $2,557 Interest and Fee Income $7,428 Interest and Fee Expense $1,913 Provision for Loan Loss $838 Loan Loss Reserve $2,868 Net Income (Adjusted for Provisions, Inflation and Subsidized Funds, if applicable) $1,023 Number of Borrowers in 2012 21,781 Number of Borrowers in 2011 20,239 Number of New Borrowers during the period 5,000 Operating Expenses $3,109 Total Assets $37,005 Total Equity $5,179 Total Liabilities $31,827 Gross Portfolio $34,604 Number of Staff at the end of the period 210 Number of Staff who left during the period 50 Number of Staff at the MFI for more than one year 130 Number of Loan Officers 88 Write-Offs during the period $247 Average Assets $33,111 Average Equity $4,797 Average Funding Liabilities $26,693 Average Gross Portfolio $31,024 Average Loan Balance (per Borrower) S1,710 GDP per capita $5,456

60
Results Framework
Indicators (using financial data above) Portfolio Quality
PORTFOLO AT RISK
Outstanding Balance on arrears over 30 days plus Restructured Loans /
Total Outstanding Loan Portfolio
Example: $2,557 / $34,604 = 7.4%
WRITE-OFF RATIO
Write-Offs / Average Gross loan Portfolio
Example: $247 / 31,024 = 0.8%
IMPAIRMENT EXPENSE RATIO
Impairment Expenses / Average Gross Loan Portfolio
Example: $838 / 31,024 = 2.7%
RISK COVERAGE RATIO
Impairment Reserve / Portfolio at Risk 30
Example: $2,868 / $2,557 = 112.2%
Efficiency and Productivity
OPERATING EXPENSE RATIO
Operating Expenses / Average Gross Loan Portfolio
Example: $3,109/$31,024 = 10%
COST PER BORROWER RATIO
Operating Expenses / Average Number of Active Borrowers
Example: $3,109 / (20,239 + 21,781 / 2) = $148
Portfolio Quality Efficiency and Productivity Financial Management Profitability SocialPortfolio at Risk Operating Expense Ratio Financial Expense Return on Equity National Loan Size Ratio
Write-Off Ratio Cost Per Borrower Ratio Cost of Funds Ratio Return on Assets Borrower Retention Ratio
Impairment Expense Ratio Personnel Productivity Ratio Debt / Equity Portfolio Yield Staff Turn Over Ratio
Risk Coverage Ratio Loan Officer Productivity Ratio Social Efficiency Index
Performance Indicators

Technical Guide: Performance and Social Indicators for Microfinance Institutions
61
PERSONNEL PRODUCTIVITY
RATIO
Total Number of Active Borrowers / Total Number of Personnel
Example: 21,781 / 210 = 104
LOAN OFFICER PRODUCTIVITY
RATIO
Total Number of Active Borrowers / Total Loan Officers
Example: 21,781 / 88 = 248
Financial Management
FINANCIAL EXPENSE
Financial Expenses on Funding Liabilities / Average Gross Loan Portfolio
Example: $1,913/31,024 = 6.2%
COST OF FUNDS RATIO
Financial Expenses on Funding Liabilities / Average Funding Liabilities
Example: $1,913 / 26,693 = 7.2%
DEBT TO EQUITY
Total Liabilities / Total Equity
Example: $31,827 / 5,179 = 6.2
Profitability
RETURN ON EQUITY
Net Income / Average Equity
Example: 1,023 / 4,797 = 21%
RETURN ON ASSETS
Net Income / Average Assets
Example: $1,023 / 33,111 = 3.1%
PORTFOLIO YIELD
Financial Revenue from Loan Portfolio / Average Gross Loan Portfolio
Example: $7,428 / 31,024 = 23.9%

62
Social Performace
NATIONAL LOAN SIZE RATIO
Average Loan Size / GDP per Capita
Example: $1,710/5,456 = 31%
BORROWER RETENTION RATIO
Number of Borrowers at the end of the period - Number of New Borrowers during
the period) / (Number of Borrowers at the start of the period
Example: (21,781 – 5,000) / 20,239= 82.9%
STAFF RETENTION RATIO
1 – (Number of Staff who left during the period / ((Number of Staff at the end of the
period + Number of Staff at the MFI for more than one year)/2))
Example: 1 - (50 / ((210+130)/2)) = 70.6%
SOCIAL EFFICIENCY INDEX
Operating Expense Ratio * Cost Per Borrower
Example: 10% * $ 148 = 14.8

Technical Guide: Performance and Social Indicators for Microfinance Institutions
63
Appendix III: Median Ratios The following table shows the median ratios for each region in 2012. As indicated in Annex I, only Tier I and II MFIs were included based on the criteria published by MicroRate in "Microfinance Institution Tier Definitions”.
Indicator Africa Middle East & North Africa
Latin America & Caribbean
Eastern Europe &
Central Asia
South Asia East Asia & the
Pacific
PORTFOLIO QUALITY
Portfolio at Risk 5.3% 2.3% 4.5% 2.6% 0.7% 0.5% Write-off Ratio 1.2% 1.2% 1.3% 0.5% 0.1% 0.3% Impairment Expense Ratio 1.0% 2.7% 2.5% 0.8% 0.5% 0.5% Risk-Coverage Ratio 59.1% 103.6% 102.2% 87.4% 144.2% 100.0% EFFICIENCY & PRODUCTIVITY
Operating Expense Ratio 23.5% 19.5% 15.1% 14.7% 11.1% 13.6% Cost per Borrower $189.00 $124.00 $251.00 $273.00 $17.50 $85.00 Personnel Productivity 62 117 113 73 192 124 Loan Officer Productivity 239 242 295 185 444 283 FINANCIAL MANAGEMENT
Financial Expense Ratio 3.9% 7.2% 6.6% 6.7% 10.7% 5.0% Debt to Equity Ratio 4.1 1.8 3.7 3.8 4.6 3.5 Return on Equity 13.3% 10.7% 10.9% 15.7% 11.4% 18.7% Return on Assets 2.5% 3.8% 2.1% 3.3% 2.0% 3.9% Portfolio Yield 33.1% 30.7% 25.3% 27.8% 22.8% 30.4% SOCIAL
National Loan Size Ratio 85.8% 11.1% 43.1% 53.5% 13.2% 21.9% Client Retention 77.1% 81.0% 80.5% 74.6% 74.6% 75.4% Staff Turnover 10.8% 11.2% 19.3% 16.4% 28.9% 13.4% Social Efficiency Index 44.4 24.1 37.9 40.1 1.9 11.6

64
MicroRate appreciates ADA’s technical and financial contribution in producing The Technical Guide: Performance and Social Indicators for Microfinance Institutions.
To download this study visit: www.microrate.com or email: [email protected].