tbr 2q11 ibm global services report
DESCRIPTION
Technology Business Research is a different kind of research company. Our bottoms-up approach provides a look at the technology industry unlike anything you’ve seen before. We analyze company performance in professional services, networking and mobility, computing and hardware, and software on a quarterly basis, leveraging our data to create industry benchmarks and landscapes that provide a business perspective on leaders and laggards and their business plans. We are experts in the business of technology. IBM Global Services (IGS) is returning to pre-recession growth rates as global IT services demand stabilizes. IGS’ broad portfolio of high-value, high-growth offerings and its ability to work closely with other IBM business segments have played a key role in the organization’s business expansion. IGS is optimistic about the emerging growth geographies, where it is winning new clients and growing its emerging markets backlog to 20% of total services backlog. Emerging markets offer top-line expansion and bottom-line growth opportunities, and IGS’ globally integrated business model allows it to quickly deploy expertise and capabilities. IGS’ gross margin in emerging markets was 200 basis points higher than in major markets in 2Q11.TRANSCRIPT

TBR
TECHNOLOGY BUSINESS RESEARCH, INC.
Technology Business ResearchAccelerating Customer Success Through Business Research

TBR
TECHNOLOGY BUSINESS RESEARCH, INC.
IBM Global Services
PROFESSIONAL SERVICES BUSINESS QUARTERLYSM
Publish Date: August 8, 2011Author: Elitsa Bakalova ([email protected]), Professional Services Practice AnalystContent Editor: Lindy Hanson, Professional Services Practice Director
Second Calendar Quarter 2011Second Fiscal Quarter 2011 Ended June 30, 2011
TBR OUTLOOK – POSITIVE TBR SCORE (0-10 SCALE)
6.25

TBR
IGS 2Q11 | Professional Services Business Quarterly ©2011 Technology Business Research, Inc.3
Company Analysis3 TBR Position4 Executive Summary7 Strategy Overview9 Corporate SWOT Analysis10 Scenario Discussion13 Financial Model Strategy16 Go-to-Market & Services Strategies21 Alliance & Acquisition Strategies23 Geographic Analysis24 Resource Management Strategy
Company Data Models26 Income Statements28 Balance Sheet29 Service Line Model30 Geographic Model31 Vertical Revenue Model32 Operating Expense Model33 Headcount Model34 Financial Strategy Graphs36 Go-to-Market Graphs37 Resource Management Graphs39 Acquisitions Tables42 Portfolio of Services43 Recent Service Announcements45 Vertical Offerings47 Quarterly Signings Tables56 Strategic Alliance Tables59 Organization Chart60 Worldwide Locations Table62 About TBR
Contents

TBR
IGS 2Q11 | Professional Services Business Quarterly ©2011 Technology Business Research, Inc.4
IGS will continue to invest in emerging markets and innovative solutions to support its core business growth through 2015TBR Assessment Corporate Strategic ObjectivesIBM Global Services (IGS) is returning to pre-recession growth rates as global IT services demand stabilizes. IGS’ broad portfolio of high-value, high-growth offerings and its ability to work closely with other IBM business segments have played a key role in the organization’s business expansion. IGS is optimistic about the emerging growth geographies, where it is winning new clients and growing its emerging markets backlog to 20% of total services backlog. Emerging markets offer top-line expansion and bottom-line growth opportunities, and IGS’ globally integrated business model allows it to quickly deploy expertise and capabilities. IGS’ gross margin in emerging markets was 200 basis points higher than in major markets in 2Q11.
Grow services business at/above market and expand operating margin by 8% to 10% CAGR through 2015
IBM has a strong services business model and offerings that will help the company expand its client base and gain market share in both the major and growth markets. IBM’s multi-lever approach to margin progression, coupled with benefits from recent workforce rebalancing, will help services profitability reach target levels during 2011.
Continue to expand in higher-value, rapid growth areas (Smarter Planet, business analytics and optimization, and cloud computing)
IBM’s key differentiator lies in its ability to provide cross-IBM solutions (services, software, hardware and research) that create value for the client. Its ability to combine the three rapid-growth areas, coupled with increasing demand, will contribute to IBM’s goal of growing services at/above market through 2015.
Expand in emerging geographies to diversify revenue base (goal is to account for ~30% of total IBM revenue by 2015, contributing 50% of IBM's growth)
IGS’ well-established global delivery network with a strong near/offshore presence (~55% of total headcount in 2Q11) will help it serve local clients in emerging geographies. Together with IBM hardware and software, IGS will play a core role in IBM’s strategy to drive IT infrastructure development across 20 high-growth countries (based GDP growth and IT spending).
TBR Position
(in $ millions) Consensus Guidance Range ActualIBM Revenue $25,110 $24,640 - $26,130 $26,666IBM Services Revenue (external) N/A $14,000 - $15,000 $15,107IBM Services Operating Income N/A N/A $2,170IBM Non-GAAP EPS $3.00 $2.93-$3.09 $3.00
(in $ millions) TBR Estimate Consensus Guidance RangeIBM Revenue $27,900 $25,500 $24,920 - $26,130IBM Services Revenue (external) $15,193 N/A $14,000 - $15,500IBM Services Operating Income $2,279 N/A N/AIBM Non-GAAP EPS N/A $3.11 $2.99-$3.22
IBM AND IGS 2Q11 PERFORMANCE VS. EXPECTATIONS
IBM AND IGS 3Q11 GUIDANCE AND EXPECTATIONS

TBR
IGS 2Q11 | Professional Services Business Quarterly ©2011 Technology Business Research, Inc.5
IGS’ worldwide brand recognition and large pipeline lay the foundation for growth in coming quarters
IGS continues to post above-average scores relative to industry peers due to strong revenue, backlog and increased customer wins in 2Q11. TBR believes IGS will report accelerated growth through 2H11 as the company expands its geographic footprint and services capabilities.
Executive Summary
Key Represents an area where IGS is currently challenged versus peersRepresents an area where IGS is outperforming its peersRepresents an area where IGS is neither significantly outperforming nor underperforming its peers
2Q10 3Q10 4Q10 1Q11 2Q11
Financial Model Strategy: 6.25 6.22 6.32 6.23 6.04 Go-to-Market & Services Strategies: 7.15 7.00 6.98 6.92 6.96 Resource Management Strategy: 5.66 5.70 5.75 5.69 5.76 TOTAL AVERAGE TBR SCORE: 6.35 6.31 6.35 6.28 6.25
TBR SCORING SUMMARY:CALENDAR QUARTER RESULTS
FINANCIAL METRICSTBR
ScoreCompany
FigureAverage in Class
Standard Deviation
Operating Margin 5.67 13.9% 9.4% 6.6%Current Ratio 3.90 1.18 1.80 57.1%Debt-to-Asset Ratio 3.11 0.80 0.56 12.6%Return on Assets (TTM) 6.63 14.0% 8.1% 3.6%Return on Equity (TTM) 8.35 68.2% 15.6% 15.7%
TOTAL AVERAGE TBR SCORE
GO-TO-MARKET & SERVICES METRICSTBR
ScoreCompany
FigureAverage in Class
Standard Deviation
Revenue (in $ Mill ions) 10.00 $15,107 $2,384 $1,441Revenue Growth YTY 4.64 10.1% 17.2% 19.4%Backlog/Revenue 6.25 2.45 2.01 0.36 Day Sales Outstanding 7.24 39.37 65.25 11.54
TOTAL AVERAGE TBR SCORE
RESOURCE MANAGEMENT METRICSTBR
ScoreCompany
FigureAverage in Class
Standard Deviation
Gross Margin 5.15 32.4% 31.5% 5.9%Operating Expenses as a % of Revenue 5.47 18.0% 20.3% 4.9%Revenue per Employee (TTM) 5.84 $237,294 $175,136 $73,846Operating Income per Employee (TTM) 5.77 $35,066 $17,498 $22,889Utilization Rate 8.04 86.0% 77.2% 2.9%Turnover 5.16 15.3% 15.8% 3.0%
TOTAL AVERAGE TBR SCORE 5.76
6.04
6.96

TBR
IGS 2Q11 | Professional Services Business Quarterly ©2011 Technology Business Research, Inc.6
TBR assessment of IBM Global Services’ two-year strategic outlookKey TakeawaysFinancial: IGS’ efforts to grow profitably will allow the organization to expand its revenue and profitability during the rest of 2011. Go to Market: IGS will focus on growing in outsourcing (46.9% of revenue in 2Q11), which will see stable growth. Emerging geographies will be a strong contributor to IGS’ growth through 2015.Resource: Expansion of service delivery capabilities, especially in lower-cost locations, coupled with adoption of common delivery methods and automation, will remain a key focus for IGS.
Strategic Outlook• TBR expects IGS to see revenue grow about 7.5% year-to-
year in 2011, slightly above global IT services market growth, which TBR estimates at ~5% year-to-year, and in line with IGS’ growth targets.
• While the major markets will remain IGS’ core geography, the organization will continue to expand its business in the growth markets as clients build out infrastructures to support growth. Continued success in growth markets, along with global adoption of cloud computing and analytics, which grew 25% year-to-year in 1H11 for IBM Global Business Services, will drive positive results for IGS.
• Outsourcing will remain a lead revenue and growth contributor (46.9% of total services revenue). Improving demand in consulting & SI will drive opportunities for IGS across the globe. While there may be pockets of uncertainty in the public sector, TBR believes they will not have a major overall impact on IGS’ revenue performance in the near term.
• The operational improvement levers being implemented across the GTS and GBS businesses – the Global Delivery Framework at GTS and assets that drive productivity and globally optimized service delivery at GBS – will positively affect IBM Global Services’ long-term profitability.
IGS will slightly outpace market growth in 2011, in line with its targetsExecutive Summary
$13.7 $14.1 $14.9 $14.6 $15.1 $15.2
$55.0 $56.4 $60.7 $64.6
$2.1 $2.2 $2.4 $1.9 $2.2 $2.3$8.1 $8.1 $8.8 $9.7
-15%
-5%
5%
15%
25%
$0
$10
$20
$30
$40
$50
$60
$70
2Q10 3Q10 4Q10 1Q11 2Q11 3Q11Est.
CY09 CY10 CY11Est.
CY12Est.
In $
Bill
ions
IGS' EXTERNAL REVENUE, GROWTH AND PROFITABILITY
IGS' External Revenue Pre-tax IncomeRevenue Growth Year-to-Year Operating Margin
SOURCE: TBR AND IBM
TBR

TBR
IGS 2Q11 | Professional Services Business Quarterly ©2011 Technology Business Research, Inc.7
Executive Summary
IBM will continue driving growth across business units by delivering analytics and workload-optimized systems
Segment Performance and Strategies
IBM Global Services
Increased traction in growth geographies will contribute to overall services revenue growth through 2015. Outsourcing will see stable near-term growth, while the transactional business (largely for GBS consulting and SI) may see a slowdown due to tight public sector spending; however, TBR does not anticipate this slowdown will have a major overall impact on IGS’ growth.
IBM Software Group
IBM SW will continue to invest in high-growth areas, including BI/analytics, cloud and Smarter Planet, to drive revenue growth beyond 2011.
Systems & Technology Group (STG)
Demand for analytics, cloud and workload-optimized systems will continue to drive revenue and profit growth across the IBM STG solution set in 2H11.
Global Financing
TBR believes IBM will wrap hardware and software together with financing as a value-add to drive solutions sales.
$13,717 $15,107
$5,277 $6,169
$3,985 $4,681
$544 $519
$201 $190
$0
$5,000
$10,000
$15,000
$20,000
$25,000
$30,000
2Q10 2Q11
Reve
nue
in $
Mill
ions
Calendar Quarter
IBM SEGMENT REVENUE
Investments/Eliminations
Financing
STG
Software
Services
TBR
SOURCE: TBR AND IBM
-30.0%
-20.0%
-10.0%
0.0%
10.0%
20.0%
30.0%
2Q09 3Q09 4Q09 1Q10 2Q10 3Q10 4Q10 1Q11 2Q11 3Q11Est.
Year
-to-
Year
Gro
wth
IBM SEGMENT GROWTH
IGS IBM SW STG Global Financing
SOURCE: TBR AND IBM
TBR

TBR
IGS 2Q11 | Professional Services Business Quarterly ©2011 Technology Business Research, Inc.8
Following IBM’s overall growth agenda will be a core focus for IGSStrategy Overview
Function Key Strategies TBR Assessment
OverallBuild a resilient, global business model that generates revenue and profit improvement opportunities.
►
IGS is returning to pre-recession growth rates as global IT services demand stabilizes. A focus on higher-value services, growth investments that are closely aligned with IBM’s four growth areas (cloud computing, analytics, Smarter Planet, emerging markets), and margin improvement activities support the organization’s financial performance.
FinancialGrow services business at/above market and expand operating margin by 8% to 10% CAGR through 2015.
►
TBR believes IGS will achieve its growth and operating margin targets as it works on its 2015 Roadmap. IGS continues to gain traction in its four growth areas, notably in 2Q11 in business analytics, cloud computing and growth markets.
Go to Market
Gain traction in outsourcing; benefit from improving consulting & SI demand.
Invest in the same four growth areas as parent IBM: business analytics, Smarter Planet, cloud computing and growth geographies.
►
►
IGS is seeing increased traction in the emerging growth geographies and expects to see growth through 2015. Outsourcing will see stable growth in the near term, while the transactional business (i.e., consulting, SI and integrated technology services) will benefit from a return to discretionary spending. There may be a slight slowdown in the public sector for GBS consulting & SI, but TBR does not expect that to have a major overall impact on IGS. Following IBM’s overall growth agenda will help IGS develop its offerings portfolio and provide cross-IBM solutions that combine services with software, hardware and research.
Key: Working: Short-term impact expected on bottom / top line Not working: No major impact or differentiation expected

TBR
IGS 2Q11 | Professional Services Business Quarterly ©2011 Technology Business Research, Inc.9
IBM is leveraging alliances, acquisitions and integrated global service delivery to support growth in major and emerging markets
Strategy Overview
Function Key Strategies TBR Assessment
Alliances & Acquisitions
Partner with IT companies as well as educational and government institutions.
Support investments with inorganic growth to expand capabilities.
►
►
IBM will continue to enter strategic alliances to provide a full range of services and to strengthen its Smarter Planet, analytics and cloud computing offerings.
IBM will continue to acquire companies with intellectual property that provide high-growth and margin opportunities to help shift its overall business mix and position the company for growth. TBR expects IBM to continue to invest profit dollars in software and services acquisitions to support its business analytics and Smarter Planet offerings.
Resource & Investments
Leverage integrated global delivery capabilities to improve productivity and efficiency.
Invest in skills and capabilities in emerging markets to diversify revenue and service delivery network.
► IBM has a strong nearshore/offshore presence and a
well-integrated global service delivery model, which is a strong differentiator for the company. Lower-cost resources remain largely located in India (60%+ of nearshore/offshore headcount) but are growing in other APAC countries, LATAM and Eastern Europe.
While the major markets will remain IBM’s leading service revenue contributor, the company will continue to win clients in emerging markets.►
Key: Working: Short-term impact expected on bottom / top line Not working: No major impact or differentiation expected

TBR
IGS 2Q11 | Professional Services Business Quarterly ©2011 Technology Business Research, Inc.10
1
1
1
Corporate SWOT AnalysisStrengths• Able to successfully integrate acquisitions• Strong relationships with alliance partners• Strong IBM brand associated with reliability; backing
from IBM as a whole• IBM’s strong industry expertise allows it to gain a
leading position with its Smarter Planet concept • Integrated global delivery network and presence in
low-cost locations• Ability to adjust its offerings to demand and create
value for the client
Opportunities• Demand for analytics brings investments in IBM’s
business analytics and optimization• Growth potential of cloud computing can help IBM
gain traction• European markets are now more open to outsourcing
functions to outside vendors• Gain traction in emerging markets due to demand and
IBM’s growth investments• Stabilizing consulting/SI demand can help IBM Global
Business Services grow in the long run
Weaknesses• Partnership network is difficult to manage• Perceived as biased toward “Big Blue” solutions• IBM/IGS’ size can sometimes slow decision-making
and implementation processes• Disjointed go-to-market approach in smaller
geographies may decrease win rate
Threats• Uneven economic performance across European
countries and tight public sector spending may challenge IGS’ near-term performance
• Indian vendors are becoming more active in business consulting and remote management ITO
• Competition from other MNCs and European and Indian firms for top clients
• Attrition and intensifying competition in the labor market, especially in lower-cost locations and in service areas with increased demand
Corporate SWOT Analysis
IBM’s strength in services lies in its well-developed resources, industryand research expertise, and ability to adjust its offerings to demand

TBR
IGS 2Q11 | Professional Services Business Quarterly ©2011 Technology Business Research, Inc.11
Scenario Discussion: IBM is developing its business analytics capabilities and the company is in a strong position to capture growth opportunities through 2015Scenario SWOT AssessmentStrength: Ability to grow through a combination of services, software and hardwareWeakness: May not be perceived as an agnostic analytics services vendorOpportunity: Strong demand in an emerging and fast-growth market segmentThreat: Increasing competition for market share and talent from other MNCs, European and Indian vendors
• Analytics is a core growth driver for IBM as a whole. Not only is analytics considered one of IBM’s four growth engines through 2015, but it is also embedded into IBM’s other three growth initiatives (Smarter Planet, cloud computing and emerging markets), allowing a multi-level expansion.
• Analytics is a cross-IBM business that covers services, software, hardware and research. On the services side, the Business Analytics and Optimization practice that is part of IBM Global Business Services is a true differentiator. IBM is able to go in with a consulting-led proposition and design/ implement industry-specific solutions, often pulling software and hardware (e.g., TBR estimates nearly half of analytics consulting involves software). IBM builds a case for change and often takes a phased adoption approach to drive success for the client. IBM Global Technology Services is also part of the services mix, supporting the delivery/management of analytics environments as well as providing hosting, analytics as a service and cloud. With this wide range of offerings, IBM has a competitive edge at providing an enterprise-wide approach, capable of transforming all of a client’s functions.
• Given strong demand growth and IBM’s investment, TBR believes the company will reach its ambition to have analytics account for $16 billion in revenue (services, software, hardware) by the end of 2015, up from ~$11 billion in 2010, and contribute ~20% of IBM's growth through 2015.
Scenario Discussion
IBM is already generating returns from its aggressive investment in analytics and will see growth in the segment through 2015
Key client buying agendas• Enhance understanding to drive profitable growth• Drive real-time decision optimization• Foster informed and collaborative decision making• Enable enterprise and operational visibility• Build a strategic information management foundation
Industry solutions & assets (go-to-market by industry)
BAO Service Offerings• BAO strategy• Business intelligence & performance management• Advanced analytics and optimization• Enterprise information management• Enterprise content management
Analytics Solutions TeamBAO Center of Competence and Global Delivery
SOU
RCE:
IBM
AN
D T
BR

TBR
IGS 2Q11 | Professional Services Business Quarterly ©2011 Technology Business Research, Inc.12
Scenario Discussion: IBM will see traction in IT strategy and design consulting (part of GTS) as clients invest in business growthScenario SWOT AssessmentStrength: Defined link between IT consulting and management consulting, enabling an end-to-end approach that addresses business and IT needsWeakness: Fewer IT consulting services are delivered from low-cost regions than from the major markets (e.g. North America, Europe)Opportunity: Increased demand for high-value services like cloud computing Threat: Intense competition from other MNCs, European and Indian IT service providers
• IBM’s scale, industry expertise and history of providing high-value transformation to clients create a formidable competitor in the IT consulting space. IBM combines its technology consulting capabilities (offered by Global Technology Services) with management consulting (offered by Global Business Services) to provide a holistic transformation aligned with business priorities and support growth and innovation.
• A key strength for IBM is its focus on using common methods, tools, asset base and cross-training consultants across the three IT strategy and design domains. This creates efficiencies for IBM as the same set of consultants can work on any of the areas.
• IBM also utilizes its strong research capabilities to create differentiated IT consulting solutions. For example, the Cloud Workload Analysis tool, developed by IBM Research, is used for deployment of cloud environments.
• IBM has adopted a practice model as part of its go-to-market, which helps link the practice and Sales/Delivery in each geography and drives communication and opportunity.
• Demand is increasing alongside changes in IT infrastructure and the delivery of IT, and IBM has been building its portfolio and pipeline around the high end for its IT consulting business. While the major markets are IBM’s core region for IT consulting, IBM is increasing its capabilities to serve clients in emerging markets – a key focus area for the company as a whole. IBM will see more traction going forward as IBM has invested in integrating and unifying its consulting portfolio and is looking to expand its consulting capabilities globally.
Scenario Discussion
IBM will see growth in IT consulting as demand improves
IT strategy and design consulting domainsDatacenter• IT transformation strategy & design• Infrastructure strategy & design for cloud
computing• Middleware strategy & designWorkplace• Workplace optimization consultingEnterprise• Service management strategy & design• Networking strategy & optimization (also for cloud)• Converged communications services – cloud• Resiliency consulting services• Security consulting services
SOU
RCE:
IBM
AN
D T
BR

TBR
IGS 2Q11 | Professional Services Business Quarterly ©2011 Technology Business Research, Inc.13
Scenario Discussion: Application Assembly Optimization, IBM’s innovative and industrialized approach to application development and management will help it grow profitably in application outsourcingScenario SWOT AssessmentStrength: Globally integrated service delivery and differentiated assetsWeakness: AAO is not yet utilized onshore, which can add on to productivity improvement Opportunity: Stabilized demand is creating growth in applications outsourcingThreat: Other IT service vendors attracting clients through process automation in ADM
• Application Assembly Optimization (AAO) is a process automation method for application development, enhancement, testing and maintenance (ADM) that is used in IBM GBS’ global delivery model. The modular set of services is attractive to clients as it helps them achieve greater business value (e.g. faster response to business needs and visibility of delivery, faster time to market and 10%-15% improved quality and productivity).
• In addition, AAO allows IBM GBS to drive efficiency and productivity, creating positive results on the profitability side. Technology Assembly Centers (TACs) are the foundation for AAO delivery. TACs form a virtual, global team that uses factory floor concepts and automated processes for ADM. AAO’s component-based workflow, AAO communities that drive productivity in the development and maintenance phase, asset reuse, metrics for outcome-based results, management dashboards and Lean processes make up the list of positive profitability contributors.
• AAO is deployed across GBS’ eight global delivery centers (India, Philippines, Vietnam, China, Romania, Egypt, Argentina and Brazil) and Mexico (regional center). GBS is seeing 15%-20% productivity improvement in service delivery and is now working on extending the AAO model to its local/on-site delivery, which will help improve productivity.
• Assets like AAO will help GBS drive operational excellence and grow its operating income from $2.5 billion to $4.0 billion in 2015 (Source: IBM Investor Meeting, 2011).
Scenario Discussion
Industrialized delivery and improving demand will drive profitable growth for IBM in applications outsourcing
Application Assembly
Optimization
Outcome-based service
levelsContinuous
Improvement (Lean)
Measured and
systematic reuse
Component-based
workflow management
Pervasive transparency
New collaboration
practices
SOURCE: IBM AND TBR

TBR
IGS 2Q11 | Professional Services Business Quarterly ©2011 Technology Business Research, Inc.14
IGS’ top line will continue to grow due to aggressive investments in its core business and high-growth segments and geographies
Revenue Performance and Strategies2Q11 Revenue: $15.19 billion, 8.0% YTY (as reported)
• Outsourcing remained the largest revenue contributor (46.9% of IGS’ external revenue) and growth driver for IGS, mainly driven by revenue from backlog (up 3% in constant currency) and expansion in existing accounts.
• Return of discretionary spending is positively affecting the transactional business (consulting & SI and ITS) and this trend will remain in the near term.
Revenue and Growth Outlook
• IGS will see more wins in business analytics, cloud computing and Smarter Planet during 2H11.
• Services backlog in emerging growth markets – up about 50% over the previous two years and now nearly 20% of total services backlog – will support services revenue growth in 2H11.
• Public sector revenue, down again in 2Q11 due to Government spending declines, may continue to drag down the GBS growth rate.
• Overall, TBR believes IGS’ revenue growth will continue in tandem with the overall IT services market through 2011.
• While the major markets will remain the larger contributor to IGS’ revenue, the emerging growth markets will increase their contribution in the long term.
Financial Model Strategy: Revenue
13.7 14.1 14.9 14.6 15.2 15.8
56.4 60.7 64.6
2.0% 2.1% 2.0%6.2%
8.0% 6.0%2.6%
7.6% 6.5%
-10%
0%
10%
20%
30%
$0.0
$20.0
$40.0
$60.0
2Q10 3Q10 4Q10 1Q11 2Q11 3Q11Est.
CY10 CY11Est.
CY12Est.
Reve
nue
Gro
wth
In $
Bill
ions
IGS' EXTERNAL REVENUE, GROWTH AND PROJECTIONS
IGS' External Revenue Revenue Growth Year-to-year
NOTE: Annual revenue and projections are for calendar 2010, 2011 and 2012, respectively.SOURCE: TBR AND IBM
TBR
$55.69 $54.70 $55.00$55.57 $55.84 $56.13 $56.42 $57.28 $58.67 $59.80
$-
$25
$50
$75
2Q09 3Q09 4Q09 1Q10 2Q10 3Q10 4Q10 1Q11 2Q11 3Q11Est.
In $
Bill
ions
IGS' TWO-YEAR TRAILING 12-MONTH REVENUE
SOURCE: TBR AND IBM
TBR
CY09 CY10

TBR
IGS 2Q11 | Professional Services Business Quarterly ©2011 Technology Business Research, Inc.15
Financial Model Strategy
Positive momentum in outsourcing and transactional services will continue due to increased worldwide demandService Line Revenue Performance and Strategies
GTS Outsourcing$6.0 billion, up 12.2% year-to-year
GTS outsourcing revenue benefited from sales in emerging geographies, driving revenue up 10% year-to-year in constant currency. TBR believes growth markets will continue to drive outsourcing revenue in 2H11.
Integrated Technology Services (ITS)$2.3 billion, up 11.0% year-to-year
Demand from growth markets, which is up 14% in constant currency for ITS, and demand for cloud computing, with cloud-related services up 200%+, were key drivers for ITS’ double-digit growth.
Maintenance$1.9 billion, up 7.0% year-to-year
Maintenance will maintain its steady performance and support GTS’ long-term growth as clients invest in IT globally.
Global Business Services (GBS)$4.9 billion, up 8.5% year-to-year
Stabilizing demand is supporting growth, both in C&SI (78.1% of GBS’ external revenue) and application outsourcing (21.9% of GBS external revenue). Business analytics revenue grew over 25% year-to-year in constant currency.
$5,364 $5,532 $5,887 $5,794 $6,016 $6,032
$2,098 $2,162 $2,381 $2,224 $2,329 $2,325
$1,772 $1,802 $1,897 $1,845 $1,896 $1,899
$3,537 $3,587 $3,713 $3,655 $3,802 $3,859
$946 $985 $1,045 $1,055 $1,064 $1,079
0%
25%
50%
75%
100%
2Q10 3Q10 4Q10 1Q11 2Q11 3Q11 Est.
% o
f Ext
erna
l Rev
enue
IGS' SERVICE LINE REVENUE (IN $ BILLIONS)
GBS Outsourcing (AO) GBS Consulting & SIGTS Maintenance GTS ITSGTS OutsourcingSOURCE: TBR AND IBM
TBR
8%
10%
12%
14%
16%
2Q10 3Q10 4Q10 1Q11 2Q11 3Q11 Est.
% o
f Ext
erna
l Rev
enue
IGS' SERVICE LINE REVENUE AND PROFITABLITY
GTS Pre-tax Margin* GBS Pre-tax Margin*
SOURCE: TBR AND IBM* GTS Pre-tax Income as a % of total GTS and GBS Pre-tax Income as a % of total GBS
TBR

TBR
IGS 2Q11 | Professional Services Business Quarterly ©2011 Technology Business Research, Inc.16
Expense Performance and Strategies2Q11 Operating Expenses: $2.72 billion
Cost of Revenue$10.2 billion, up 10.1% year-to-year
IGS’ cost of services as a percentage of revenue fell 10 basis points year-to-year to 67.6%, driven by IBM’s integrated global delivery, higher leverage of lower-cost resources, and a focus on efficient delivery, including delivery frameworks in GTS, optimized delivery at GBS, standardization and automation.
Margins and Outlook
• GTS’ operating margin was dragged down by workforce rebalancing charges in 1Q11 and 2Q11. The operational improvement levers being implemented across the GTS business will positively affect long-term profitability. For example, the workforce rebalancing charges in 2Q11 will start to yield results in 2H11, positively affecting GTS’ profitability.
• GBS’ operating margin continues to see the positive effects from its focus on optimized delivery, operational excellence and differentiated solutions.
Financial Model Strategy: Expenses
IGS’ operational improvement initiatives will help expand its bottom line
32.3% 33.2% 32.7% 31.7% 32.4% 32.7% 32.5% 32.4% 33.1%
14.8% 15.2% 15.6%12.5% 13.9% 14.5% 13.9% 14.0% 14.4%
0%
10%
20%
30%
40%
2Q10 3Q10 4Q10 1Q11 2Q11 3Q11Est.
CY10 CY11Est.
CY12Est.
IGS' GROSS AND OPERATING PROFITAND PROJECTIONS
Gross MarginPre-tax Margin (Operating Margin)
NOTE: Annual gross and operating profit and projections are for calendar 2010, 2011 and 2012, respectively. Profit calculated as a percentage of IGS' external revenue. SOURCE: TBR AND IBM
TBR
14.3% 14.8% 14.0% 14.5% 14.5% 14.3%
2.7% 2.6% 2.6% 4.3% 4.3% 3.7%
0.0%
5.0%
10.0%
15.0%
20.0%
25.0%
2Q10 3Q10 4Q10 1Q11 2Q11 3Q11 Est.
IGS' OPERATING EXPENSES AS A PERCENTAGE OF EXTERNAL REVENUE
G&A Expense Sales and Marketing Expense
SOURCE: IBM AND TBR ESTIMATES
TBR

TBR
IGS 2Q11 | Professional Services Business Quarterly ©2011 Technology Business Research, Inc.17
IBM utilizes a three-tiered direct sales approach to manage its accounts and generate new business
Go-to-Market & Services Strategies: Sales Strategy
Tier 1Top ~100Accounts
Tier 2~1,400 Accounts
Aligned by Industry
Tier 340k Direct + 120k+ IndirectAligned by Geo/Territory
SOURCE: IBM AND TBR ESTIMATES
Sales Strategy & Customer Segmentation
TBR AssessmentIBM’s tiered sales structure enables the company to establish relationships with a breadth of clients through multiple sales channels as well as cross-sell opportunities, regardless of the client’s business size and industry focus.
Tier 1: Integrated Accounts; Top 100 Accounts• IBM’s largest accounts, for which it ensures a highly
integrated experience with dedicated IBM resources.• Vertical-specific global sales team works with managing
account director. The brand category leader assists managing account director with proposals.
• Includes the top +/-100 multinational accounts (more than $20 million in IBM revenue)
Tier 2: Industry-Aligned Accounts • Industry-specific and likely to have shared IBM resources• Includes the next +/-1,400 accounts, clustering together
one to 10 clients from the same industryTier 3: Medium Accounts; Territory Specific• Territory-specific accounts that leverage business partners
and regional ISVs• Large regional players with annual revenue up to
$200 million• Includes 15,000 (growth) focus accounts, 25,000
prospects, and 120,000+ SMB targets; served by IBM partners
• Web-enabled sales orders and support play a key role when assisting clients in this category.

TBR
IGS 2Q11 | Professional Services Business Quarterly ©2011 Technology Business Research, Inc.18
IGS’ Service Line Deep DiveTBR Assessment: While outsourcing dominates in revenue contribution (46.8% in 2Q11), IGS maintains a well-balanced business mix. IBM’s hardware and software capabilities, particularly around analytics, cloud computing and Smarter Planet, augment IGS’ service offerings as well as provide cross-selling and bundling opportunities to drive revenue growth. Service Lines Deep Dive Strategies:• C&SI: Shift to higher-value offerings and grow asset-
based offerings to complement portfolio and support growth. Gain traction in high-growth areas, such as cloud C&SI and analytics consulting.
• ITO: Extend asset-based offerings to complement portfolio and support growth. Benefit from new models, such as cloud computing.
• BPO: Grow Global Process Services business (i.e., BPO) faster than the market through horizontal offerings and industry-specific offerings and platforms coupled with forward-looking insights generated through analytics.
• AO: Integrate AO services with C&SI, GTS (outsourcing and maintenance) and IBM software. Provide industry-specific offerings and emphasize innovation of solutions and delivery through use of IBM assets.
Go-to-Market & Services Strategies: Service Line Deep Dive
SERVICE LINE DEEP DIVE
Hardware and software capabilities enable IGS to reach into markets and regions that pure-play competitors cannot
IGS REPORTED 2Q11
SOURCE: IBM AND TBR ESTIMATES
AO, 7.0%
C&SI, 34.3%
BPO, 4.1%Maintenance, 12.6%
ITO, 42.0%
GBS Revenue, 32.5%
GTS Revenue, 67.5%

TBR
IGS 2Q11 | Professional Services Business Quarterly ©2011 Technology Business Research, Inc.19
Go-to-Market & Services Strategies
Services Contract Signings• Demand in the IT services market continues to grow,
benefiting IGS’ outsourcing and transactional businesses. Notably, previously challenged areas, such as consulting and SI, are seeing a stable deal intake. These areas will continue to grow in the near term as clients invest in projects to drive business growth, innovation and cost savings.
• Outsourcing/long-term signings (GTS outsourcing, GBS app. outsourcing) remain uneven, as evidenced by the outsourcing deal spike in 4Q10, which could not be repeated in 1Q11 and 2Q11. As outsourcing deals are not a direct indicator of revenue performance, IBM continues to use backlog to predict outsourcing revenue, as backlog makes up ~85% of it. Outsourcing backlog increased 9.1% year-to-year in 2Q11 and will likely grow in a similar fashion in the near term.
• Services backlog was $144 billion in 2Q11, up 11.6% year-to-year. It has increased in growth markets by 50% over the past two years, approaching 20% of services backlog. This is closely related to IBM’s focus on expanding revenue in emerging markets as it works with clients to build out IT infrastructure and adopt new technologies, such as cloud computing and business analytics. IBM will continue to gain traction with clients in emerging regions due to its attractive offerings.
IBM’s growing backlog will support revenue growth, especially in emerging markets
Key 2Q11 Customer WinsCompany TBR Assessment
Bharti Airtel India10 years
IBM will offer comprehensive IT solutions (help desk, desk-side support) in 16 African countries. TBR believes this strengthens IBM’s position across Africa’s emerging market.
Sonic Biochem Extractions India10 years
IBM will provide managed hosting and monitoring services from India. This is another example of IBM’s emphasis on growing its revenue in emerging growth markets around the world.
$5.8 $5.4 $8.0 $5.8 $6.7
$6.5 $5.6
$14.1
$4.7 $7.5
$0
$5
$10
$15
$20
$25
2Q10 3Q10 4Q10 1Q11 2Q11
(In
$ Bi
llion
s)
IGS' CONTRACT SIGNINGS
Outsourcing/Long-term (GTS outsourcing, GBS outsourcing (AO))Transactional/Short-term (GTS ITS, GBS Consulting & SI)
SOURCE: TBR AND IBM
TBR

TBR
IGS 2Q11 | Professional Services Business Quarterly ©2011 Technology Business Research, Inc.20
Pricing Environment & Strategies
• IGS’ market and pricing environment remains competitive. TBR believes prices are now more stable across a broader share of geographies, allowing the organization to sustain its growth trajectory. Specifically, TBR believes there were, and will continue to be, decreased headwinds in terms of pricing in the Americas, some parts of Europe (e.g., Germany and the Nordics), and APAC.
• TBR believes IGS will slightly increase prices with clients in geographies with stabilizing economies, such as the U.S., as demand increases and these companies seek to improve their IT infrastructures.
• We believe IGS will continue to face pricing headwinds in European countries that continue to teeter with economic uncertainty, such as the U.K. and the Netherlands, as public sector spending remains soft.
• TBR expects IGS to experience moderate pricing traction through 2H11, albeit at an uneven pace among its primary markets.
Go-to-Market & Services Strategies: Pricing
LABOR CATEGORY 10/09 - 09/10 10/10 - 09/11 % GROWTH
Project Executive $338 $348 3.0%Functional Specialist/Subject Matter Expert $292 $301 3.1%
Director $239 $246 2.9%
Senior Manager $193 $199 3.1%
Manager $159 $164 3.1%
Program Support $156 $161 3.2%
Consultant III $126 $130 3.2%
Consultant II $102 $105 2.9%
Consultant I $79 $81 2.5%
Project Assistant $71 $73 2.8%
Administrative Support $53 $55 3.8%
Interviewer $37 $38 2.7%
NOTE: RATES INCLUDE INDUSTRIAL FUNDING FEE (IFF)
SOURCE: TBR AND GENERAL SERVICES ADMINISTRATION
U.S. GOVERNMENT HOURLY RATES TBR
TBR
The table above provides hourly pricing rates for IGS from a Mission Oriented Business Integrated Services contract with the U.S. government’s General Services Administration. The contract period is from October 1997 through September 2017 and covers such services as consulting, facilitation, survey and privatization support and documentation.
Pricing is slightly on the rise in the U.S and APAC as demand increases, but pricing challenges remain in some parts of Europe

TBR
IGS 2Q11 | Professional Services Business Quarterly ©2011 Technology Business Research, Inc.21
Increased demand for finance and banking services will overshadow any softness in spending from the public sector
Go-to-Market & Services Strategies: Verticals
$4.05 $4.22 $4.52 $4.53 $4.71 $4.79
$2.35 $2.42 $2.58 $2.55 $2.60 $2.61$2.19 $2.22 $2.34 $2.17 $2.24 $2.32$2.12 $1.97 $2.09 $2.06 $2.22 $2.17$1.44 $1.55
$1.63 $1.44 $1.56 $1.55$1.37 $1.41 $1.51 $1.46 $1.57 $1.53$0.20 $0.28 $0.25 $0.36 $0.21 $0.21
$0.0
$2.0
$4.0
$6.0
$8.0
$10.0
$12.0
$14.0
$16.0
2Q10 3Q10 4Q10 1Q11 2Q11 3Q11 Est.
Exte
rnal
Rev
enue
in $
Tho
usan
ds
IGS' VERTICAL REVENUE
Other Communications DistributionIndustrial Public Sector General Business (SMB)Financial Services
SOURCE: TBR AND IBM
TBR
Vertical Performance and Strategies
Financial Services
• TBR believes financial services is benefiting from increased demand for finance and banking services from the major markets, particularly the U.S., as economies stabilize.
• TBR believes IBM Global Services is seeing growth in financial services in the major and emerging economies in both outsourcing and transactional services as well as hardware sales, driving services opportunities.
Public SectorTight spending in the public sector remains, creating a slowdown in GBS growth (i.e., consulting & SI and application outsourcing).
Communications,Distribution, General business (or SMB)
Growth at IBM GBS remains driven by verticals such as distribution, general business (SMB) and communications as global demand stabilizes.

TBR
IGS 2Q11 | Professional Services Business Quarterly ©2011 Technology Business Research, Inc.22
Acquisition Assessment• TBR believes IBM is focusing on the quality of an
acquisition and the opportunities it can provide rather than the quantity of companies it can acquire.
• Increasing demand for cost efficiency and sustainability within organizational facilities has driven IBM’s Smarter Planet projects.
IBM/IGS Acquisition Strategy• IBM has not been as aggressive in pursuing new
acquisitions as it was in 2010. Instead, IBM has focused on leveraging and expanding previously made acquisitions to enable increased market share.
• IBM plans to spend $20 billion on acquisitions through 2015, or $4 billion per year, focusing on the software and services segment.
• A key driving force behind each of the company’s acquisitions is improving EPS in the long run; IBM’s goal is to nearly double EPS in the next four years from $11.67 in 2010 to at least $20 in 2015.
Recent AcquisitionsTririga Inc.• IBM acquired Tririga Inc., a privately held real estate
and facilities management software company. The acquisition will help IBM speed up its smarter buildings initiative. Tririga will also help IBM gain traction with hospitals, public sector and life sciences organizations as well as insurance providers, aiding them in improving real estate performance and cost.
• Through this acquisition, IBM will be able expand its customer base and grow into the smarter buildings market by building on Tririga’s formidable customer base. About 200 Tririga employees will be added to IBM.
• TBR believes this acquisition will contribute to growth acceleration in the smarter buildings market, stemming from IBM’s Smarter Planet projects. Smarter Planet is expected to be a $10 billion business for IBM in 2015 (includes services, software and hardware).
Alliance & Acquisition Strategies
IBM will continue to acquire companies with complementary skill sets and client bases to drive companywide growth

TBR
IGS 2Q11 | Professional Services Business Quarterly ©2011 Technology Business Research, Inc.23
Alliance AssessmentTBR believes IGS leverages strategic alliances to support global outreach; it is investing heavily in partnerships to endorse innovative technologies and expand brand awareness worldwide, particularly in growth markets.
IGS Alliance Strategy• IBM leverages alliances in hardware, software and
services to offer a full spectrum of solutions for clients and to enhance the company’s market competitiveness.
• IGS utilizes its partner programs to strengthen its global position by partnering with companies that complement its own strategies and/or are located in strategic geographic areas, such as Ghana, Australia, Switzerland and India.
• IGS works in tandem with leading research institutes, university programs and international governments to develop innovative service and solution offerings. Research and development and thought leadership initiatives help the company develop and shape its go-to-market strategies according to evolving market trends and client demand.
Recent AlliancesSmartGrid Alliances:• The Bureau of Energy Efficiency (BEE) and IBM will
partner to determine India’s SmartGrid potential as well as to create tool kits that assess SmartGrid investment decisions.
• IBM and Brazil-based CPFL Energia Holdings have partnered to augment CPFL’s energy grid with SmartGrid technologies to increase efficiency and ultimately lower costs.
USAID and CDC: IBM is partnering with the two entities to provide governments and businesses within growth markets worldwide with healthcare, education, IT infrastructure and planning and development services and solutions.Maclean: New Zealand-based Maclean and IGS are working together to provide small business customers with virtual server services, hosted out of IBM’s recently opened cloud datacenter in Auckland.
Alliance & Acquisition Strategies
IGS leverages partners to capitalize on growing customer demand for cloud and SmartGrid technology services

TBR
IGS 2Q11 | Professional Services Business Quarterly ©2011 Technology Business Research, Inc.24
IGS’ past investments in growth markets continue to drive double-digit revenue, increasing its presence and brand awareness
Geographic Revenue Strategies
Major Markets
While outsourcing is in demand, TBR believes the return of discretionary spending will drive consulting and SI growth in the major markets. The recent natural disasters in Japan had a negative effect on GBS, which declined 1% year-to-year (in constant currency) in the major markets.
Growth Markets
• IGS’ revenue attributable to growth markets was up 22% year-to-year in 2Q11 and up 13% in constant currency.
• IGS reported expansion across all of IBM’s services areas; GBS’ outsourcing and C&SI revenues were up 10% year-to-year in constant currency, and GTS’ outsourcing revenue was driven by a 10% increase in growth markets.
• For IBM as a whole, the combined BRIC revenue was up 21% from the year-ago quarter, indicating increased demand and traction in these countries. However, growth markets go beyond the BRIC nations. IBM reported double-digit growth in nearly 40 growth market countries.
Geographic Analysis
-20.0%
-10.0%
0.0%
10.0%
20.0%
$0.0$2.0$4.0$6.0$8.0
$10.0$12.0$14.0$16.0
2Q10 3Q10 4Q10 1Q11 2Q11 3Q11Est.
Reve
nue
Gro
wth
Yea
r-to
-Yea
r
Exte
rnal
Rev
enue
in $
Bill
ions
IGS' REVENUE AND YtY GROWTH BY GEOGRAPHY
Asia Pacific EMEAAmericas Americas YtY GrowthEMEA YtY Growth APAC YtY Growth
SOURCE: TBR ESTIMATES
TBR
-10%
-5%
0%
5%
10%
3Q09 4Q09 1Q10 2Q10 3Q10 4Q10 1Q11 2Q11 3Q11Est.
Exte
rnal
Rev
enue
G
row
th S
eque
ntial
ly
IGS' SEQUENTIAL GROWTH BY GEOGRAPHY
Americas EMEA APAC
SOURCE: TBR ESTIMATES
TBR

TBR
IGS 2Q11 | Professional Services Business Quarterly ©2011 Technology Business Research, Inc.25
While IBM has a strong offshore presence, its key to success is the global integration of capabilities and high use of standardization and assets
Resource Management Strategy: Headcount
Headcount Strategies & Investments• IBM remains a globally integrated enterprise. A high grade of
standardization and use of assets/tools that aid/automate service delivery will continue to benefit IGS’ bottom line.
• As part of its Growth Markets initiative, IBM opened additional offices in India (Coimbatore, Tamil Nadu), Tanzania (Dar es Salaam) and Senegal (Dakar), expanding its global presence. IBM has 230 branches in 55 growth market countries, which will propel its growth strategy.
• IBM plans to invest in the Philippines to increase its BPO staff from 1,000 employees to 3,000 employees. TBR expects IBM to focus on hiring freshers to fill these 2,000 spots, further reducing costs.
• As demand for cloud computing continues to grow, IBM is investing in datacenters, particularly in emerging regionso IBM announced plans for a cloud datacenter in Makuhari,
Japan and a LotusLive-dedicated datacenter also in Japan, adding to its seven established datacenters in APAC.
o IBM opened an $80 million datacenter in South Auckland, New Zealand in late May to meet customer demand for cloud computing services in Australia and New Zealand.
Total headcount 253,000 in 2Q11
~12% of people are in EMEA
~44% of people are in APAC
~8% of people are in South America
~36% of people are in North
America
120,000 138,500
117,000 114,500
0
50,000
100,000
150,000
200,000
250,000
300,000
2Q10 2Q11
Tota
l Hea
dcou
nt
Calendar Quarter
IGS' SERVICES HEADCOUNT
Onshore
Offshore
Total headcount: 253000 (+6.8% YTY)
TBR
SOURCE: TBR ESTIMATES

TBR
IGS 2Q11 | Professional Services Business Quarterly ©2011 Technology Business Research, Inc.26
IGS’ per employee revenue and operating income are on the rise as the company improves operating efficiencies and invests in automation
Efficiency Performance• IBM GTS is implementing a Global Delivery Framework
and standardizing and automating delivery processes to improve efficiency and productivity. IBM GBS uses a globally optimized service delivery and assets to drive productivity and operational excellence. As a result, IGS’ operating income per employee continues to increase and will see positive development.
• Revenue per employee increased year-to-year due to IGS’ focus on using assets and automation for its service delivery model.
• Attrition levels in the IT services industry remain on the rise due to the active hiring efforts of vendors that are adding talent to address growing demand for IT services. TBR believes IGS’ attrition levels increased in 2Q11, largely driven by lower-cost locations.
Organizational Changes• TBR believes IGS is gradually hiring across key regions
and lower-cost locations as global demand for IT services improves. IGS continues to drive productivity initiatives, limiting hiring onshore and rebalancing high-cost headcount (reported workforce rebalancing charges at GTS in 2Q11, largely in Europe).
• While IGS’ lower-cost resources remain largely located in India (60%+ of nearshore/offshore headcount), it is progressively rising in other APAC countries, LATAM and Eastern Europe, providing IGS a strong and attractive delivery network with diversified global sourcing options.
Resource Management Strategy: Efficiency & Org. Changes
2Q10 2Q11
Revenue per Employee 237,600$ 354,581$ ↑Operating Income per Employee 33,869$ 52,850$ ↑Utilization 85.0% 86.0% ↑Turnover 14.6% 15.3% ↑
IGS' Efficiency Metrics (In $) TBR

TBR
IGS 2Q11 | Professional Services Business Quarterly ©2011 Technology Business Research, Inc.27
Income Statement
CALENDAR QUARTER 1Q10 2Q10 3Q10 4Q10 1Q11 2Q11 3Q11 Est.Global Technology Services Internal Revenue 320$ 332$ 362$ 299$ 307$ 320$ 330$
Global Technology Services External Revenue 9,306$ 9,234$ 9,496$ 10,165$ 9,863$ 10,241$ 10,256$
Global Business Services Internal Revenue 203$ 197$ 199$ 199$ 200$ 205$ 210$
Global Business Services External Revenue 4,410$ 4,483$ 4,572$ 4,758$ 4,710$ 4,866$ 4,938$
Total IGS Internal Revenue 523$ 529$ 561$ 498$ 507$ 525$ 540$
Total IGS External Revenue 13,716$ 13,717$ 14,068$ 14,923$ 14,573$ 15,107$ 15,193$ Total IGS Revenue (Internal + External) 14,239$ 14,246$ 14,629$ 15,421$ 15,080$ 15,632$ 15,733$
Cost of Services 9,334$ 9,286$ 9,397$ 10,049$ 9,949$ 10,219$ 10,233$ Gross Profit 4,382$ 4,431$ 4,671$ 4,874$ 4,624$ 4,888$ 4,961$
Global Technology Services 3,183$ 3,167$ 3,349$ 3,527$ 3,334$ 3,482$ 3,518$
Global Business Services 1,200$ 1,264$ 1,322$ 1,347$ 1,291$ 1,406$ 1,443$
Operating Expenses 2,980$ 2,326$ 2,452$ 2,471$ 2,746$ 2,718$ 2,682$ Total IGS Operating Income (Pre-tax Income) 1,402$ 2,105$ 2,219$ 2,403$ 1,878$ 2,170$ 2,279$
Global Technology Services Pre-tax Income 957$ 1,422$ 1,524$ 1,657$ 1,238$ 1,420$ 1,474$
Global Business Services Pre-tax Income 445$ 683$ 695$ 746$ 640$ 750$ 805$ AS A PERCENTAGE OF TOTAL EXTERNAL IGS REVENUEGlobal Technology Services External Revenue 67.8% 67.3% 67.5% 68.1% 67.7% 67.8% 67.5%
Global Business Services External Revenue 32.2% 32.7% 32.5% 31.9% 32.3% 32.2% 32.5%
Total IGS External Revenue 100.0% 100.0% 100.0% 100.0% 100.0% 100.0% 100.0%
Cost of Sales 68.1% 67.7% 66.8% 67.3% 68.3% 67.6% 67.4%
Gross Margin 31.9% 32.3% 33.2% 32.7% 31.7% 32.4% 32.7%
Global Technology Services 34.2% 34.3% 35.3% 34.7% 33.8% 34.0% 34.3%
Global Business Services 27.2% 28.2% 28.9% 28.3% 27.4% 28.9% 29.2%
Operating Expenses 21.7% 17.0% 17.4% 16.6% 18.8% 18.0% 17.7%
Total IGS Operating Income (as % of IGS External Revenue) 10.2% 15.3% 15.8% 16.1% 12.9% 14.4% 15.0%
Global Technology Services Pre-tax Income 7.0% 10.4% 10.8% 11.1% 8.5% 9.4% 9.7%
Global Business Services Pre-tax Income 3.2% 5.0% 4.9% 5.0% 4.4% 5.0% 5.3%Total IGS Operating Income (as % of IGS Revenue (Internal + External) 9.8% 14.8% 15.2% 15.6% 12.5% 13.9% 14.5%
GTS Pre-tax Income as a % of total GTS* 9.9% 14.9% 15.5% 15.8% 12.2% 13.4% 13.9%
GBS Pre-tax Income as a % of total GBS* 9.7% 14.6% 14.6% 15.0% 13.0% 14.8% 15.6%YEAR-TO-YEAR CHANGEGlobal Technology Services External Revenue 6.3% 1.4% 0.7% 1.1% 6.0% 10.9% 8.0%
Global Business Services External Revenue 0.3% 3.3% 5.4% 3.9% 6.8% 8.5% 8.0%
Total IGS External Revenue 4.3% 2.0% 2.1% 2.0% 6.2% 10.1% 8.0%
Cost of Services 3.5% 2.0% 2.4% 4.2% 6.6% 10.1% 8.9%
Gross Profit 6.0% 2.0% 1.7% -2.3% 5.5% 10.3% 6.2%
Global Technology Services 7.2% 0.0% 0.0% -2.0% 4.7% 9.9% 5.0%
Global Business Services 2.9% 7.3% 6.2% -3.0% 7.6% 11.2% 9.2%
Operating Expenses 18.8% -0.2% -0.5% -7.3% -7.8% 16.8% 9.4%
Total IGS Operating Income (Pre-tax Income) -13.7% 4.6% 4.2% 3.5% 33.9% 3.1% 2.7%
Global Technology Services Pre-tax Income -13.3% 1.2% 3.6% 6.5% 29.4% -0.1% -3.3%
Global Business Services Pre-tax Income -14.6% 12.3% 5.5% -2.6% 43.8% 9.8% 15.9%* GTS and GBS pre-tax margins are calculated based on their respective internal and external revenue as reported by IBM.SOURCE: IBM AND TBR
IGS' PRO FORMA INCOME STATEMENT (IN $ MILLIONS) TBR

TBR
IGS 2Q11 | Professional Services Business Quarterly ©2011 Technology Business Research, Inc.28
Income StatementIBM CORP.Consolidated Statement of Income(in $ Thousands Except per Share Data)
Jun. '10 Sept. '10 Dec. '10 Mar. '11 Jun. '11 Sept. '11 CALENDAR QUARTER 2Q10 3Q10 4Q10 1Q11 2Q11 3Q11 Est.FISCAL QUARTER 2Q10 3Q10 4Q10 1Q11 2Q11 3Q11 Est.Net Sales 23,724,000$ 24,271,000$ 29,019,000$ 24,607,000$ 26,666,000$ 27,900,000$
Cost of Sales 12,915,000 13,270,000 14,792,000 13,749,000 14,281,000 15,066,000
Gross Profit 10,809,000 11,001,000 14,227,000 10,858,000 12,385,000 12,834,000
SG&A 5,061,000 5,149,000 5,951,000 5,826,000 6,030,000 6,529,000
R&D 1,475,000 1,464,000 1,578,000 1,587,000 1,569,000 1,500,000
IP and Custom Development Income (297,000) (278,000) (318,000) (262,000) (295,000) (288,000)
Operating Income 4,570,000 4,666,000 7,016,000 3,707,000 5,081,000 5,093,000
Other (Income) and Expenses* (95,000) (106,000) (42,000) (202,000) 97,000 (63,000)
Interest Expense* 90,000 95,000 102,000 93,000 97,000 96,750
EBIT 4,575,000 4,677,000 6,956,000 3,816,000 4,887,000 5,059,250
Income Taxes 1,190,000 1,088,000 1,698,000 954,000 1,221,000 1,095,000
Net Income 3,385,000$ 3,589,000$ 5,258,000$ 2,862,000$ 3,666,000$ 3,964,250$
Net Income Applicable to Common Stock 3,385,000$ 3,589,000$ 5,258,000$ 2,862,000$ 3,666,000$ 3,964,250$
Net Income Per Share of Common Stock 2.61$ 2.82$ 4.18$ 2.34$ 3.00$
Common Shares Outstanding 1,296,700,000 1,272,800,000 1,258,400,000 1,222,200,000 1,221,400,000
AS A PERCENTAGE OF REVENUENet Sales 100.0% 100.0% 100.0% 100.0% 100.0% 100.0%
Cost of Sales 54.4% 54.7% 51.0% 55.9% 53.6% 54.0%
Gross Margin 45.6% 45.3% 49.0% 44.1% 46.4% 46.0%
SG&A 21.3% 21.2% 20.5% 23.7% 22.6% 23.4%
R&D 6.2% 6.0% 5.4% 6.4% 5.9% 5.4%
Operating Margin 19.3% 19.2% 24.2% 15.1% 19.1% 18.3%
Other, Net -0.4% -0.4% -0.1% -0.8% 0.4% -0.2%
EBIT 19.3% 19.3% 24.0% 15.5% 18.3% 18.1%
Income Taxes 5.0% 4.5% 5.9% 3.9% 4.6% 3.9%
Net Margin 14.3% 14.8% 18.1% 11.6% 13.7% 14.2%
YEAR-TO-YEAR CHANGENet Sales 2.0% 3.0% 6.6% 7.7% 12.4% 15.0%
Cost of Sales 1.9% 2.6% 5.0% 6.7% 10.6% 13.5%
Gross Profit 2.2% 3.5% 8.2% 8.8% 14.6% 16.7%
SG&A -1.1% 2.7% 7.0% 2.6% 19.1% 26.8%
R&D 2.9% 1.2% 8.0% 5.2% 6.4% 2.5%
Operating Income 5.4% 4.6% 9.0% 21.5% 11.2% 9.2%
Other, Net -106.8% -112.4% 5.3% 76.5% 3980.0% 406.8%
EBIT 7.3% 6.9% 9.0% 8.6% 6.8% 8.2%
Income Taxes 2.7% -6.1% 8.3% 4.4% 2.6% 0.6%
Net Income 9.1% 11.7% 9.3% 10.1% 8.3% 10.5%
*Restated with equity options expensed.
SOURCE: TBR AND IBM
TBR

TBR
IGS 2Q11 | Professional Services Business Quarterly ©2011 Technology Business Research, Inc.29
Balance SheetIBM CORP.Consolidated Balance Sheets(in $ Thousands)
June'10 Sept. '10 Dec. '10 March '11 June '11FISCAL/CALENDAR QUARTER 2Q10 3Q10 4Q10 1Q11 2Q11ASSETSCurrent Assets
Cash & Equivalents 10,325,000$ 9,859,000$ 10,661,000$ 12,763,000$ 11,714,100$
Marketable Securities 1,916,000 1,227,000 990,000 482,000 50,000
Accounts Receivable 10,191,000 10,904,000 11,968,000 11,293,000 11,666,100
Inventory 2,595,000 2,629,000 2,450,000 2,549,000 2,573,100
Short-term Financing Receivables 13,301,000 13,592,000 16,257,000 14,365,000 14,715,100
Deferred Taxes 1,444,000 1,596,000 1,564,000 1,695,000 1,557,100
Prepaid Expenses and Other 5,124,000 4,661,000 4,226,000 4,376,000 4,662,100
Total Current Assets 44,896,000 44,468,000 48,116,000 47,523,000 46,937,600
Property, Plant, Equip. (Net of Dep.) 13,534,000 14,009,000 14,096,000 14,208,000 14,239,100
Long-term Financing Receivables 9,185,000 9,448,000 10,548,000 10,254,000 10,422,100
Prepaid Pension Assets 3,575,000 4,379,000 3,068,000 3,788,000 4,855,100
Intangible Assets 2,526,000 3,048,000 3,488,000 3,324,000 3,205,000
Goodwill 20,544,000 22,703,000 25,136,000 25,408,000 25,609,100
Other, Net 9,160,000 9,119,000 8,998,000 8,456,000 8,206,000
Total Assets 103,420,000$ 107,174,000$ 113,450,000$ 112,961,000$ 113,474,000$ LIABILITIES & EQUITYCurrent Liabilities
Accounts Payable 26,465,000$ 26,979,000$ 29,568,000$ 29,349,000$ 29,621,850$
Short-term Debt 5,633,000 5,556,000 6,778,000 8,508,000 7,857,850
Income Taxes Payable 2,895,000 2,908,000 4,216,000 2,531,000 2,362,850
Total Current Liabilities 34,993,000 35,443,000 40,562,000 40,388,000 39,842,550
LT Debt, Net of Current 21,017,000 21,899,000 21,846,000 21,749,000 21,914,850
Retirement Obligations 14,598,000 15,145,000 15,978,000 15,995,000 16,013,850
Other Non-current Liabilities 11,636,000 12,329,000 11,892,000 12,054,000 12,492,000
Total Liabilities 82,244,000$ 84,816,000$ 90,278,000$ 90,186,000$ 90,263,250$
Common Stock & PIC 43,522,000 44,328,000 45,418,000 46,278,000 46,974,850
Retained Earnings 85,323,000 88,095,000 92,532,000 94,590,000 97,333,900
Translation and Other Adj. (107,669,000) (110,065,000) (114,778,000) (118,093,000) (121,098,000) Total Stockholders' Equity 21,176,000 22,358,000 23,172,000 22,775,000 23,210,750
Total Liabilities & Equity 103,420,000$ 107,174,000$ 113,450,000$ 112,961,000$ 113,474,000$ FINANCIAL RATIOSDays Sales Outstanding 38.66 40.43 37.12 41.30 39.37
Turns on Inventory 37.08 37.17 45.71 39.38 41.65
Days Inventory Outstanding 9.84 9.82 7.99 9.27 8.76
Fixed Asset Turnover 7.11 7.12 7.11 7.18 7.35
Days Cash Outstanding 85.30 75.19 70.89 86.70 74.14
Total Asset Turnover 0.91 0.92 1.05 0.87 0.94
Debt/Asset Ratio 0.80 0.79 0.80 0.80 0.80
Current Ratio 1.28 1.25 1.19 1.18 1.18
Return on Assets 13.3% 13.6% 13.8% 13.9% 14.0%
Return on Equity 70.0% 67.3% 66.4% 67.6% 68.2%
Revenue/Employee ($ Thousands) 243,776$ 244,242$ 246,923$ 248,470$ 252,728$
Number of Employees 402,000 405,500 410,950 417,500 421,000
SOURCE: IBM
TBR

TBR
IGS 2Q11 | Professional Services Business Quarterly ©2011 Technology Business Research, Inc.30
Appendix – Financial Models
CALENDAR QUARTER 2Q10 3Q10 4Q10 1Q11 2Q11 3Q11 Est.Global Technology Services External Revenue 9,234$ 9,496$ 10,165$ 9,863$ 10,241$ 10,256$
Outsourcing 5,364$ 5,532$ 5,887$ 5,794$ 6,016$ 6,032$
Integrated Technology Services 2,098$ 2,162$ 2,381$ 2,224$ 2,329$ 2,325$
Maintenance 1,772$ 1,802$ 1,897$ 1,845$ 1,896$ 1,899$ Global Business Services External Revenue 4,483$ 4,572$ 4,758$ 4,710$ 4,866$ 4,938$
Outsourcing (app. outsourcing) 946$ 985$ 1,045$ 1,055$ 1,064$ 1,079$
Consulting & SI 3,537$ 3,587$ 3,713$ 3,655$ 3,802$ 3,859$
Total IGS External Revenue 13,717$ 14,068$ 14,923$ 14,573$ 15,107$ 15,193$
AS A PERCENTAGE OF EXTERNAL IGS REVENUEGlobal Technology Services External Revenue 67.3% 67.5% 68.1% 67.7% 67.8% 67.5%
Outsourcing 39.1% 39.3% 39.5% 39.8% 39.8% 39.7%
Integrated Technology Services 15.3% 15.4% 16.0% 15.3% 15.4% 15.3%
Maintenance 12.9% 12.8% 12.7% 12.7% 12.6% 12.5%
Global Business Services External Revenue 32.7% 32.5% 31.9% 32.3% 32.2% 32.5%
Outsourcing (app. outsourcing) 6.9% 7.0% 7.0% 7.2% 7.0% 7.1%
Consulting & SI 25.8% 25.5% 24.9% 25.1% 25.2% 25.4%
YEAR-TO-YEAR CHANGEGlobal Technology Services External Revenue 1.4% 0.7% 1.1% 6.0% 10.9% 11.1%
Outsourcing 1.6% 1.2% 1.2% 6.2% 12.2% 12.4%
Integrated Technology Services -1.8% -1.9% -0.6% 7.3% 11.0% 10.8%
Maintenance 4.6% 2.1% 3.0% 3.7% 7.0% 7.2%
Global Business Services External Revenue 3.3% 5.4% 3.9% 6.8% 8.5% 10.1%
Outsourcing (app. outsourcing) N/A N/A N/A 10.1% 12.4% 14.0%
Consulting & SI N/A N/A N/A 5.9% 7.5% 9.1%
IGS External Revenue 2.0% 2.1% 2.0% 6.2% 10.1% 10.8%
SOURCE: IBM AND TBR ESTIMATES
IGS' REVENUE BREAKDOWN BY BUSINESS UNIT (IN $ MILLIONS) TBR

TBR
IGS 2Q11 | Professional Services Business Quarterly ©2011 Technology Business Research, Inc.31
Appendix – Financial Models
CALENDAR QUARTER 1Q10 2Q10 3Q10 4Q10 1Q11 2Q11 3Q11 Est.FISCAL QUARTER 1Q10 2Q10 3Q10 4Q10 1Q11 2Q11 3Q11 Est.Total Revenue 13,716$ 13,717$ 14,068$ 14,923$ 14,573$ 15,107$ 15,193$ AMERICASRevenue 6,059$ 6,216$ 6,241$ 6,710$ 6,543$ 6,836$ 6,913$
% of Total Revenue 44.2% 45.3% 44.4% 45.0% 44.9% 45.3% 45.5%EMEARevenue 4,710$ 4,384$ 4,519$ 4,967$ 4,809$ 4,774$ 4,756$
% of Total Revenue 34.3% 32.0% 32.1% 33.3% 33.0% 31.6% 31.3%ASIA PACIFICRevenue 2,947$ 3,117$ 3,308$ 3,246$ 3,221$ 3,497$ 3,525$
% of Total Revenue 21.5% 22.7% 23.5% 21.8% 22.1% 23.2% 23.2%YEAR-TO-YEAR CHANGEAmericas 1.8% 3.5% 3.0% 4.2% 8.0% 10.0% 10.8%
EMEA 4.9% -5.0% -6.0% -3.0% 2.1% 8.9% 5.2%
Asia Pacific 8.9% 10.3% 13.9% 5.6% 9.3% 12.2% 6.5%SEQUENTIAL CHANGEAmericas -5.9% 2.6% 0.4% 7.5% -2.5% 4.5% 1.1%
EMEA -8.0% -6.9% 3.1% 9.9% -3.2% -0.7% -0.4%
Asia Pacific -4.1% 5.8% 6.1% -1.9% -0.8% 8.6% 0.8%
SOURCE: TBR ESTIMATES
IGS GEO REVENUE BREAKDOWN (IN $ MILLIONS) TBR

TBR
IGS 2Q11 | Professional Services Business Quarterly ©2011 Technology Business Research, Inc.32
Appendix – Financial Models
CALENDAR QUARTER 2Q10 3Q10 4Q10 1Q11 2Q11 3Q11 Est.Financial Services $ 4.05 $ 4.22 $ 4.52 $ 4.53 $ 4.71 $ 4.79
Public Sector $ 2.19 $ 2.22 $ 2.34 $ 2.17 $ 2.24 $ 2.32
Industrial $ 2.12 $ 1.97 $ 2.09 $ 2.06 $ 2.22 $ 2.17
Distribution $ 1.44 $ 1.55 $ 1.63 $ 1.44 $ 1.56 $ 1.55
Communications $ 1.37 $ 1.41 $ 1.51 $ 1.46 $ 1.57 $ 1.53
General Business (SMB) $ 2.35 $ 2.42 $ 2.58 $ 2.55 $ 2.60 $ 2.61
Other $ 0.20 $ 0.28 $ 0.25 $ 0.36 $ 0.21 $ 0.21
All Sectors $ 13.72 $ 14.07 $ 14.92 $ 14.57 $ 15.11 $ 15.19
AS A PERCENTAGE OF REVENUEFinancial Services 29.5% 30.0% 30.3% 31.1% 31.2% 31.5%
Public Sector 16.0% 15.8% 15.7% 14.9% 14.8% 15.3%
Industrial 15.4% 14.0% 14.0% 14.2% 14.7% 14.3%
Distribution 10.5% 11.0% 10.9% 9.9% 10.3% 10.2%
Communications 10.0% 10.0% 10.1% 10.0% 10.4% 10.1%
General Business (SMB) 17.1% 17.2% 17.3% 17.5% 17.2% 17.2%
Other 1.5% 2.0% 1.7% 2.5% 1.4% 1.4%
YEAR-TO-YEAR GROWTHFinancial Services 0.3% 5.7% 5.8% 12.8% 16.5% 13.4%
Public Sector 14.9% 7.6% 6.8% 2.1% 1.9% 4.6%
Industrial 31.1% 7.5% 2.0% -1.1% 5.0% 10.3%
Distribution 2.0% 6.0% 7.9% 3.1% 8.0% 0.1%
Communications 0.0% -0.8% 2.0% 7.3% 14.5% 9.1%
General Business (SMB) -10.7% -8.5% -11.3% 9.4% 10.8% 8.0%
Other -57.6% -21.4% 15.6% -10.2% 4.2% -24.4%
All Sectors 2.0% 2.1% 2.0% 6.2% 10.1% 8.0%
SOURCE: TBR ESTIMATES
IGS REVENUE BREAKDOWN - BY INDUSTRY (IN $ BILLIONS) TBR

TBR
IGS 2Q11 | Professional Services Business Quarterly ©2011 Technology Business Research, Inc.33
Appendix – Financial Models
CALENDAR QUARTER 1Q10 2Q10 3Q10 4Q10 1Q11 2Q11 3Q11 Est.FISCAL QUARTER 1Q10 2Q10 3Q10 4Q10 1Q11 2Q11 3Q11 Est.IGS External Revenue 13,716,000$ 13,717,000$ 14,068,000$ 14,923,000$ 14,573,000$ 15,107,000$ 15,193,440$
Operating Expenses 2,980,018$ 2,326,468$ 2,452,000$ 2,470,769$ 2,746,234$ 2,718,214$ 2,681,642$
Sales & Marketing 2,221,992$ 1,961,531$ 2,082,064$ 2,089,220$ 2,113,085$ 2,160,301$ 2,142,275$
General & Administrative 758,026$ 364,937$ 369,936$ 381,549$ 633,149$ 557,913$ 539,367$
SALES & MARKETING EXPENSE BREAKOUT Sales Expense 1,755,374$ 1,553,533$ 1,644,831$ 1,650,484$ 1,669,337$ 1,706,638$ 1,692,397$
Marketing Spending 466,618$ 407,998$ 437,233$ 438,736$ 443,748$ 453,663$ 449,878$
Advertising 150,000$ 157,920$ 168,500$ 185,500$ 185,000$ 183,000$ 185,500$
Total Sales & Marketing Expense 2,221,992$ 1,961,531$ 2,082,064$ 2,089,220$ 2,113,085$ 2,160,301$ 2,142,275$
SPENDING AS A PERCENTAGE OF REVENUE Operating Expenses 21.7% 17.0% 17.4% 16.6% 18.8% 18.0% 17.7%
Sales & Marketing 16.2% 14.3% 14.8% 14.0% 14.5% 14.3% 14.1%
Sales Expense 12.8% 11.3% 11.7% 11.1% 11.5% 11.3% 11.1%
Marketing Spending 3.4% 3.0% 3.1% 2.9% 3.0% 3.0% 3.0%
Advertising 1.1% 1.2% 1.2% 1.2% 1.3% 1.2% 1.2%
General & Administrative 5.5% 2.7% 2.6% 2.6% 4.3% 3.7% 3.6%
SOURCE: TBR ESTIMATES AND IBM
IBM GLOBAL SERVICES OPERATING EXPENSE MODEL (IN $ THOUSANDS) TBR

TBR
IGS 2Q11 | Professional Services Business Quarterly ©2011 Technology Business Research, Inc.34
Appendix – Financial Models
CALENDAR QUARTER 1Q10 2Q10 3Q10 4Q10 1Q11 2Q11EMPLOYEESIndia 72,700 75,000 80,000 83,000 85,000 87,000
Total Near/Offshore Headcount 115,000 120,000 127,500 130,000 134,500 138,500
Total Headcount 235,000 237,000 242,000 245,000 249,000 253,000
Total Headcount YtY Growth -1.7% 0.9% 3.4% 4.7% 6.0% 6.8%
SOURCE: TBR ESTIMATES
IBM GLOBAL SERVICES OFFSHORE HEADCOUNT TBR

TBR
IGS 2Q11 | Professional Services Business Quarterly ©2011 Technology Business Research, Inc.35
Financial Strategy GraphsAppendix – Graphs
1.28 1.25 1.19 1.18 1.18
0.00
0.50
1.00
1.50
2.00
2Q10 3Q10 4Q10 1Q11 2Q11
IBM CURRENT RATIO
IBM PSBQ AVERAGE
SOURCE: TBR AND IBM
TBR
TBR
0.80 0.79 0.80 0.80 0.80
0.00
0.20
0.40
0.60
0.80
1.00
2Q10 3Q10 4Q10 1Q11 2Q11
IBM DEBT/ASSET RATIO
IBM PSBQ AVERAGE
SOURCE: TBR AND IBM
TBR
14.8% 15.2% 15.6%12.5%
13.9%
0.0%
4.0%
8.0%
12.0%
16.0%
20.0%
2Q10 3Q10 4Q10 1Q11 2Q11
IGS OPERATING MARGIN
IGS PSBQ AVERAGE
SOURCE: TBR AND IBM
TBR

TBR
IGS 2Q11 | Professional Services Business Quarterly ©2011 Technology Business Research, Inc.36
Financial Strategy GraphsAppendix – Graphs
13.3% 13.6% 13.8% 13.9% 14.0%
0.0%
4.0%
8.0%
12.0%
16.0%
2Q10 3Q10 4Q10 1Q11 2Q11
IBM RETURN ON ASSETS
IBM PSBQ AVERAGE
SOURCE: TBR AND IBM
TBR
70.0% 67.3% 66.4% 67.6% 68.2%
0.0%
25.0%
50.0%
75.0%
100.0%
2Q10 3Q10 4Q10 1Q11 2Q11
IBM RETURN ON EQUITY
IBM PSBQ AVERAGE
SOURCE: TBR AND IBM
TBR

TBR
IGS 2Q11 | Professional Services Business Quarterly ©2011 Technology Business Research, Inc.37
Go-to-Market GraphsAppendix – Graphs
$13.7 $14.1 $14.9 $14.6 $15.1
$0.0
$5.0
$10.0
$15.0
$20.0
2Q10 3Q10 4Q10 1Q11 2Q11
IGS REVENUE (IN $ BILLIONS)
IGS PSBQ AVERAGE
SOURCE: TBR AND IBM
TBR
2.0% 2.1% 2.0%
6.2%
10.1%
0.0%
4.0%
8.0%
12.0%
16.0%
20.0%
2Q10 3Q10 4Q10 1Q11 2Q11
IGS REVENUE GROWTH
IGS PSBQ AVERAGE
SOURCE: TBR AND IBM
TBR
38.66 40.43 37.12 41.30 39.37
0.00
20.00
40.00
60.00
80.00
2Q10 3Q10 4Q10 1Q11 2Q11
Num
ber o
f Day
s
IBM DAYS SALES OUTSTANDING
IBM PSBQ AVERAGE
SOURCE: TBR AND IBM
TBR
2.31 2.39 2.52 2.48 2.45
0.000.501.001.502.002.503.003.50
2Q10 3Q10 4Q10 1Q11 2Q11
IGS BACKLOG/REVENUE RATIO
IGS PSBQ AVERAGE
SOURCE: TBR AND IBM
TBR

TBR
IGS 2Q11 | Professional Services Business Quarterly ©2011 Technology Business Research, Inc.38
Resource Management GraphsAppendix – Graphs
$237.6 $236.8 $235.3 $235.5 $237.3
$100.0
$160.0
$220.0
$280.0
2Q10 3Q10 4Q10 1Q11 2Q11
IGS REVENUE PER EMPLOYEE(IN $ THOUSANDS AND TTM)
IGS PSBQ AVERAGE
SOURCE: TBR AND IBM
TBR
32.3% 33.2% 32.7% 31.7% 32.4%
0.0%
10.0%
20.0%
30.0%
40.0%
2Q10 3Q10 4Q10 1Q11 2Q11
IGS GROSS MARGIN
IGS PSBQ AVERAGE
SOURCE: TBR AND IBM
TBR
17.0% 17.4% 16.6% 18.8% 18.0%
0.0%
5.0%
10.0%
15.0%
20.0%
25.0%
2Q10 3Q10 4Q10 1Q11 2Q11
IGS OPERATING EXPENSES AS A PERCENTAGE OF REVENUE
IGS PSBQ AVERAGE
SOURCE: TBR AND IBM
TBR
TBR

TBR
IGS 2Q11 | Professional Services Business Quarterly ©2011 Technology Business Research, Inc.39
Resource Management GraphsAppendix – Graphs
$33.9 $34.0 $33.9 $35.4 $35.1
$0.0
$10.0
$20.0
$30.0
$40.0
2Q10 3Q10 4Q10 1Q11 2Q11
IGS OPERATING INCOME PER EMPLOYEE (IN $ THOUSANDS AND TTM)
IGS PSBQ AVERAGE
SOURCE: TBR AND IBM
TBR
14.6% 15.0% 15.4% 15.2% 15.3%
0.0%
5.0%
10.0%
15.0%
20.0%
2Q10 3Q10 4Q10 1Q11 2Q11
IGS TURNOVER RATE
IGS PSBQ AVERAGE
SOURCE: TBR AND IBM
TBR
85.0% 86.0% 86.0% 86.2% 86.0%
0.0%
20.0%
40.0%
60.0%
80.0%
100.0%
2Q10 3Q10 4Q10 1Q11 2Q11
IGS UTILIZATION RATE
IGS PSBQ AVERAGE
SOURCE: TBR AND IBM
TBR

TBR
IGS 2Q11 | Professional Services Business Quarterly ©2011 Technology Business Research, Inc.40
IBM/IGS’ Recent Acquisitions
COMPANY
ACQUISITION DATE ACQUISITION SYNERGIES
ESTIMATED NO. OF EMPLOYEES
Tririga, Inc. April 2011Tririga is a leader in providing facility and real estate management software solutions, enhancing IBM’s ability to offer stronger solutions to drive revenue, expand its customer base, and grow in the smarter buildings market.
200
BLADE Network Technologies October 2010
Software and devices that route data and transactions to and from servers, helping IBM better integrate networks with its systems.
N/A
OpenPages October 2010Extends IBM’s business analytics capabilities through OpenPages software that helps identify and manage risk and compliance.
140
Clarity Systems October 2010Extends IBM’s business analytics initiatives through Clarity Systems’ financial governance software that helps organizations automate processes for financial statement management.
N/A
PSS Systems October 2010
PSS Systems provides software for analyzing, automation and implementation of information governance policies. The acquisition expands IBM’s Information Lifecycle Governance solutions, IBM’s storage management, and Smart Archive strategy.
100
Appendix – Tables

TBR
IGS 2Q11 | Professional Services Business Quarterly ©2011 Technology Business Research, Inc.41
IBM/IGS’ Recent Acquisitions
COMPANY
ACQUISITION DATE ACQUISITION SYNERGIES
ESTIMATED NO. OF EMPLOYEES
Netezza Corporation September 2010 Extends IBM’s business analytics initiatives through Netezza’s
analytics and data warehousing appliance. 500
Storwize August 2010Storwize’s data compression technology reduces storage requirements and augments IBM’s storage and analytics capabilities.
N/A
Datacap August 2010Strengthens IBM’s capabilities to digitize, manage and automate information assets in paper-intensive verticals (e.g., healthcare, insurance, public sector and finance).
40
Sterling Commerce August 2010 Software for cross-channel commerce and integration of
customers, partners and suppliers across a range of industries. 2,500
Unica Corporation August 2010(announced)
The acquisition of Unica allows IBM to increase its ability to aid organizations when predicting and analyzing customer tendencies.
500
Storwize July 2010 (announced)
Data compression technology that improves storage efficiency and data analytic capabilities. N/A
BigFix July 2010 Security and compliance management and automation for desktops across the enterprise. N/A
Appendix – Tables

TBR
IGS 2Q11 | Professional Services Business Quarterly ©2011 Technology Business Research, Inc.42
IBM/IGS’ Recent Acquisitions
COMPANY
ACQUISITION DATE ACQUISITION SYNERGIES
ESTIMATED NO. OF EMPLOYEES
Cast Iron Systems May 2010Strengthens IBM’s cloud computing capabilities (cloud integration software, appliances and services), business process and integration software portfolio
75
Wilshire Credit Corporation March 2010
By acquiring the core operating assets of Wilshire Credit Corporation, including the Wilshire mortgage servicing platform, IBM strengthens its mortgage BPO capabilities.
900
Intelliden February 2010 A provider of intelligent network automation software that extends IBM’s network management offerings N/A
Initiate Systems January 2010 Data integrity software for information sharing among healthcare and government organizations 120
National Interest Security Company
January 2010 Advanced analytics and IT solutions for the public sector 1,000
Lombardi January 2010Lombardi provides BPM software and services, complements IBM's enterprise-wide process management software, and adds integrated solutions that automate human tasks and workflows.
180
Appendix – Tables

TBR
IGS 2Q11 | Professional Services Business Quarterly ©2011 Technology Business Research, Inc.43
IGS’ Portfolio of Services Appendix – Tables
BUSINESS CONSULTING IT SERVICES OTHER SERVICES SERVICES FOR SMALL AND MEDIUM BUSINESS
• Business Analytics and Optimization
• Financial Management• Human Capital
Management• Marketing, Sales and
Service Management• Strategy and
Transformation• Supply Chain
Management
• Business Continuity and Resiliency Services
• Data center Services• Integrated
Communications Services
• Maintenance and Technical Support Services
• Security Services• IT Strategy and
Architecture Design Services
• Workplace Services
• Outsourcing Services • Oracle Consulting
Services • SAP Consulting Services• Software Services
• Application Services• Business analytics• Business consulting• Business continuity and
resiliency• Cloud computing• Collaboration• Green business• Information
management• IT operational
efficiency• Network and systems
management• Security and privacy• Technical Support• Training

TBR
IGS 2Q11 | Professional Services Business Quarterly ©2011 Technology Business Research, Inc.44
IBM/IGS’ Recent Services AnnouncementsAppendix – Tables
SERVICE/SOLUTION DATE DESCRIPTION
2Q11
IBM SmartCloud Resilience Service June 2011
New suite of server recovery, data protection, and backup services enables clients to protect, store and retrieve their most critical data in a short period of time following unforeseen events through IBM’s SmartCloud Virtualized Server and SmartCloud Archive.
IBM SmartCloud for Education June 2011
New cloud service offers advanced software, computer lab resources and services to students and researchers at educational institutions without the need for advanced IT expertise on-site. It offers real-time insights on student and institutional performance, lightens demand on physical lab resources, and allows schools to analyze their own data using new SPSS models.
Consulting Services for Business Process Management
April 2011The new global consulting practice will help companies improve their core business processes in marketing, human resources and finance in addition to their industry-specific processes. Services will be provided from the U.S. and other locations around the world.
IBM SmartCloud Enterprise for Business April 2011
The SmartCloud Enterprise offers technologies and services for private, public and hybrid cloud-based systems and is a secure platform designed to allow businesses to benefit from shared cloud services to drive efficiencies, control costs, and improve time to market. The IBM SmartCloud Enterprise will be delivered through IBM’s recently launched Asia-Pacific Cloud Computing Data Centre in Singapore.

TBR
IGS 2Q11 | Professional Services Business Quarterly ©2011 Technology Business Research, Inc.45
IBM/IGS’ Recent Services AnnouncementsAppendix – Tables
SERVICE/SOLUTION DATE DESCRIPTION
1Q11
IBM Smarter Commerce Consulting Services and Software
March 2011This new service will strengthen IBM’s leadership and investments in business analytics and optimization. The new offerings will address a multitude of enterprise commerce activities, improving IBM’s position in the market.
City Forward March 2011A free website by IBM that will improve the quality of life in cities around the world by showing policy makers how their city is doing as compared to others. It also provides information on how to improve the qualities in which the city may be lagging.
Communication Service Provider Network Infrastructure Services
February 2011
IBM provides professional services that enable companies to develop new revenue generating services while controlling costs as they build advanced networks. IBM services include solutions planning, migration, architecture, design, project planning, deployment and end-to-end multivendor infrastructures.

TBR
IGS 2Q11 | Professional Services Business Quarterly ©2011 Technology Business Research, Inc.46
IBM/IGS’ Vertical Industries
Communications Solutions
Communications• Assurance/fulfillment• Business intelligence• Billing/CRM• Infrastructure• Service innovation
Media & Entertainment• Workflow transformation• Dynamic infrastructure• Outsourcing
Energy & Utilities• Power generation optimization• Work and asset management• Intelligent utility network• Customer ops transformation
Distribution Solutions
Retail• Marketing and customer
management• Store and channels• Merchandising and product
management• Supply networks• Business and finance admin• IT systems and ops
Consumer Products• Consumer behavior analytics• Front end optimization• Consumer driven supply chain• Enterprise information
management
Travel & Transport• Multichannel sales & service• Reservation system
modernization• Asset optimization• Operations control systems• Safety, security and surveillance
Financial Services Solutions
Banking• Core banking transformation• Customer care and insight• Integrated risk management• Payments and securities
Financial Markets• Front office• Middle and back office• Integrated risk management• Market & depositories
Insurance• Core insurance transformation• Customer care and insight• Integrated risk management• Distribution
Appendix – Tables
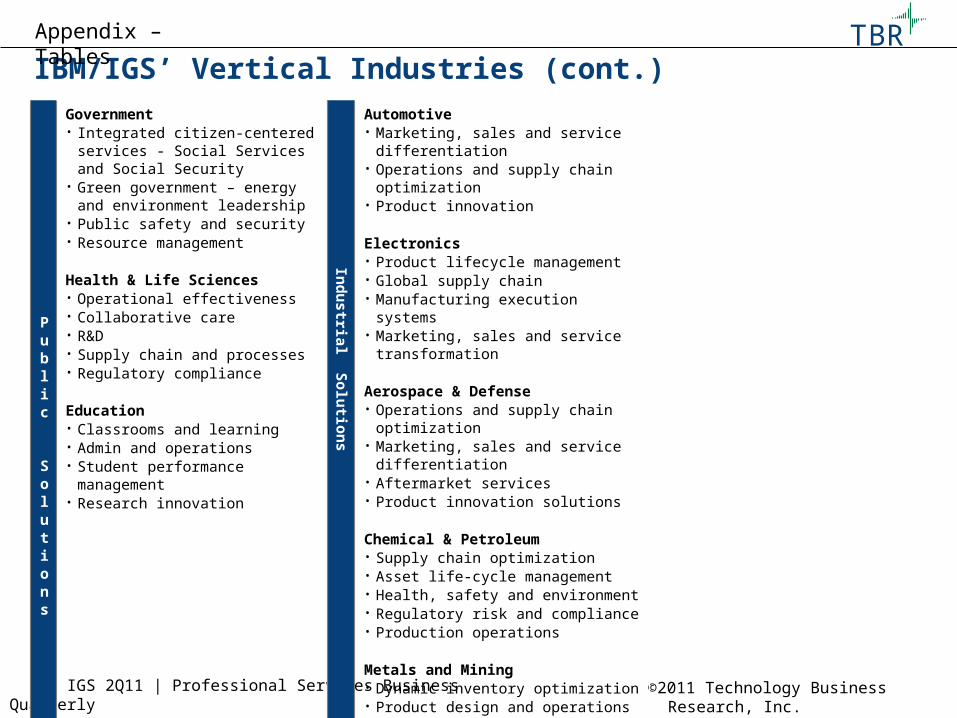
TBR
IGS 2Q11 | Professional Services Business Quarterly ©2011 Technology Business Research, Inc.47
IBM/IGS’ Vertical Industries (cont.)
Public Solutions
Government• Integrated citizen-centered services -
Social Services and Social Security• Green government – energy and
environment leadership• Public safety and security • Resource management
Health & Life Sciences• Operational effectiveness• Collaborative care• R&D• Supply chain and processes• Regulatory compliance
Education• Classrooms and learning• Admin and operations• Student performance management• Research innovation
Automotive• Marketing, sales and service differentiation• Operations and supply chain optimization• Product innovation
Electronics• Product lifecycle management• Global supply chain • Manufacturing execution systems• Marketing, sales and service transformation
Aerospace & Defense• Operations and supply chain optimization• Marketing, sales and service differentiation• Aftermarket services• Product innovation solutions
Chemical & Petroleum• Supply chain optimization• Asset life-cycle management• Health, safety and environment• Regulatory risk and compliance• Production operations
Metals and Mining• Dynamic inventory optimization• Product design and operations scheduling• Integrated mill planning and tracking
Forest and PaperGlobal integration
Appendix – Tables
Industrial Solutions

TBR
IGS 2Q11 | Professional Services Business Quarterly ©2011 Technology Business Research, Inc.48
IBM/IGS’ Quarterly Services SigningsAppendix – Tables
CLIENT DATE DESCRIPTION YEARS CONTRACT VALUE
3Q11
UIL Holdings CorporationUnited States
July 2011
IBM is establishing a secure platform to provide cyber security controls during United Illuminating Company’s (a subsidiary of UIL) upcoming advanced meter deployment. IBM secures UI’s 50,000 advanced meters and is expected to support a total of 80,000 by the end of 2011.
N/A N/A
2Q11
Bharti Airtel India July 2011
IBM will provide comprehensive IT solutions (help desk, desk side support) across 16 African countries. This builds on a deal signed in 2010 for computing technology and services for Bharti Airtel’s mobile network.
10 N/A
Commercial Bank of Ethiopia (CBE)Ethiopia
June 2011 IBM will modernize core banking systems (hardware, software and services) as well as provide training for the bank staff. This contract allows IBM to strengthen its global position in Africa.
N/A $3 million

TBR
IGS 2Q11 | Professional Services Business Quarterly ©2011 Technology Business Research, Inc.49
CLIENT DATE DESCRIPTION YEARS CONTRACT VALUE
Korea Electric Power Company Korea
June 2011IBM provided consulting services and software to develop an integrated energy management system for KEPCO, contributing to the construction of the Total Operations Center.
N/A N/A
PRAVEX-BANKUkraine June 2011
IBM’s partner, De Novo, will provide PRAVEX-BANK with a datacenter that includes IBM servers, storage, software and services. IBM will provide IT support and maintenance services to help achieve an automated banking system while strategically placing itself around a large customer base in the Ukraine.
5 N/A
New Zealand CustomsNew Zealand
June 2011 IBM will develop and integrate a border management system to streamline border processing.
4(2 stages)
$75 million (stage 1)
RoyalFriesland CampinaNetherlands
May 2011 IBM will provide BPO services to assist with the management of global procurement operations. 5 N/A
IBM/IGS’ Quarterly Services SigningsAppendix – Tables

TBR
IGS 2Q11 | Professional Services Business Quarterly ©2011 Technology Business Research, Inc.50
CLIENT DATE DESCRIPTION YEARS CONTRACT VALUE
MT HojgaardDenmark May 2011
IBM will provide a global service model to MT Hojgaard, including international help desk support, server operations and maintenance services. Using IBM’s support centers, a network solution that links HT Hojgaard with all international construction sites with headquarters will be installed.
6 N/A
Sonic Biochem Extractions India
May 2011 Sonic will outsource its complete IT infrastructure, including storage and security solutions, to IBM. 10 N/A
ICMPoland May 2011
IBM will integrate and deliver maintenance services for the Interdisciplinary Center for Mathematical and Computational Modeling University of Warsaw’s (ICM’s) supercomputer. This supercomputer, called the Blue Gene/P system, was established by IBM. This closer collaboration could open up opportunities in areas such as sciences and industry.
N/A N/A
Camelot Information Systems Inc. China
May 2011
IBM will continue to manage the delivery center for the provider of enterprise application services and financial industry IT through this contract renewal that extends the previous contract terms with the exception that the right for IBM to purchase the delivery center has been removed.
4 N/A
IBM/IGS’ Quarterly Services SigningsAppendix – Tables

TBR
IGS 2Q11 | Professional Services Business Quarterly ©2011 Technology Business Research, Inc.51
IBM/IGS’ Quarterly Services SigningsAppendix – Tables
CLIENT DATE DESCRIPTION YEARS CONTRACT VALUE
Tulip May 2011IBM will manage design consultancy services for the overall datacenter as well as utilize its Enterprise Modular Data Center (EMDC) design to lead the execution of the first phase of the datacenter.
N/A N/A
LeasePlan India Pvt. Ltd.India
May 2011IBM will provide maintenance services, support and management for LeasePlan’s multivendor IT environment.
N/A N/A
Hartford Financial ServicesUnited States
April 2011IBM will manage and transform the client’s IT infrastructure by transitioning to IBM’s Smart Business Desktop Cloud and by virtualizing its server network at the Colorado and Connecticut locations.
5 N/A
1Q11
National Broadband Network (NBN) Australia
March 2011IBM will provide consulting services, integration, application support and software solutions related to NBN’s core business and operational support systems.
3 Multimillion- dollar

TBR
IGS 2Q11 | Professional Services Business Quarterly ©2011 Technology Business Research, Inc.52
IBM/IGS’ Quarterly Services SigningsAppendix – Tables
CLIENT DATE DESCRIPTION YEARS CONTRACT VALUE
City of New YorkUnited States January 2011
IBM will consolidate and update outdated and incompatible IT to improve the technology platform for CITIServ.
N/A N/A
Air IndiaIndia January 2011
Provide IT infrastructure and application support services while implementing SAP enterprise software to automate numerous processes at Air India
7 $50 million
4Q10
Bharti AirtelIndia
December 2010
Deploy and manage IT infrastructure and applications in 16 African countries; consolidate and transform IT environments into an integrated IT system, oversee management of all applications, datacenter operations, servers, storage and desktop services; applications support (CRM, billing, self-service)
10 N/A
Federal Health Department Australia
December 2010
Contract extension to provide communications and technology support services as well as oversee the health department’s technology renovation
4 $110 million

TBR
IGS 2Q11 | Professional Services Business Quarterly ©2011 Technology Business Research, Inc.53
IBM/IGS’ Quarterly Services SigningsAppendix – Tables
CLIENT DATE DESCRIPTION YEARS CONTRACT VALUE
Allied Command TransformationNATO
December 2010
Implement a new cloud computing model to consolidate and integrate technology capabilities for Command and Control programs; IBM will develop the computing environment to share a common operating environment.
N/A N/A
American WellUnited States December 2010
Embed security into online care system to safeguard patient information; integrate security services and skills into application development processes.
N/A N/A
Barnstable County, Mass.United States
December 2010
As part of the Smarter Cape Cod initiative, IBM will deploy technology for more efficient management of physical infrastructure, protection of natural resources, and opportunities for economic growth. Phase 1 will design a Strategic Information Office and a Center of Excellence for Water Resources.
Spring 2011 (Phase 1) N/A
Government of Puerto Rico November 2010
Smarter Healthcare initiative throughout the country; IBM, ActiveHealth Management and Medens Corporation will deliver cloud services to help physicians share and exchange health information.
N/A N/A
FinnairFinland November 2010
Working with Finnair to deliver personalized customer service and analyze passenger expertise; IBM is providing consulting expertise, methodology and software to capture, mine and analyze information.
N/A N/A

TBR
IGS 2Q11 | Professional Services Business Quarterly ©2011 Technology Business Research, Inc.54
IBM/IGS’ Quarterly Services SigningsAppendix – Tables
CLIENT DATE DESCRIPTION YEARS CONTRACT VALUE
Samlink Finland November 2010 IBM will manage the IT operations for over 400 bank
branches and develop a desktop cloud offering. 5 $37 million
Cabinet Office United Kingdom November 2010 IBM signed a Memorandum of Understanding to
provide efficiency strategies. N/A N/A
Westpac Australia November 2010
IBM will manage Westpac’s main infrastructure services in addition to providing critical risk mitigation services.
5 N/A
StarBevCzech Republic November 2010 IT infrastructure services (datacenter, help desk,
end-user support) and overall service management 5 Multimillion €
Samlink Finland November 2010 IBM will manage IT operations for over 400 bank
branches and develop a desktop cloud offering. 5 $37 million
Bank of Ireland Ireland November 2010
Manage the bank’s IT infrastructure (desktop, servers, mainframes, local area networks and service desk)
5 N/A

TBR
IGS 2Q11 | Professional Services Business Quarterly ©2011 Technology Business Research, Inc.55
IBM/IGS’ Quarterly Services SigningsAppendix – Tables
CLIENT DATE DESCRIPTION YEARS CONTRACT VALUE
Central Norway Regional Health Authority Norway
November 2010
Create Smarter Healthcare infrastructure; provide IT support to all of the hospitals in Norway to improve coordination and reporting of health information; develop a SAP-based solution to be used for upgrading finance and logistic systems throughout Norway
4 $120 million
Nevada Clark County Family ServicesUnited States
October 2010IBM has been signed to integrate its business analytics software into the department’s process for efficient delivery of social services.
N/A N/A
PyroIndia October 2010 IBM will develop, test and manage Pyro’s products
and solutions. 5 $19 million
ABN AMRONetherlands October 2010
ABN AMRO extended its services agreement with IBM whereby IBM will build and provide an integrated IT infrastructure platform.
N/A N/A
PetromRomania October 2010
IBM will take over the operation of Petrom’s datacenter services, including cloud computing, hosting, installation, business continuity, on-site backup, and disaster recovery.
10 N/A

TBR
IGS 2Q11 | Professional Services Business Quarterly ©2011 Technology Business Research, Inc.56
IBM/IGS’ Quarterly Services SigningsAppendix – Tables
CLIENT DATE DESCRIPTION YEARS CONTRACT VALUE
Danish DefenseDenmark October 2010
IBM will provide management services and technology infrastructure to the Ministry’s resource management system.
7 N/A
Air New ZealandNew Zealand October 2010 IBM will provide business and technology services
through mainframe and virtual hosting services. 5 N/A
3Q10
Jet AirwaysIndia September 2010 Business transformation and IT services
(infrastructure and application support) 10 $62 million
Bharti Airtel LimitedIndia
September 2010IT infrastructure and application services to support client’s mobile communications network in 16 African countries; deal will be finalized in 4Q10.
N/A N/A
SunocoUnited States August 2010
IBM will provide managed business process services along with application support services to Sunoco.
N/A N/A
OrbitzUnited States August 2010
Orbitz will utilize IBM’s Global Expense Reporting Solution to provide corporate travel customers more options and flexibility in its management and documentation of travel expenses.
N/A N/A

TBR
IGS 2Q11 | Professional Services Business Quarterly ©2011 Technology Business Research, Inc.57
Recent IBM/IGS’ AlliancesCOMPANY SCOPE OF PARTNERSHIP
University of Ghana
The University of Ghana and IBM have signed an agreement to strengthen skills in information technology and to improve access to education by supporting R&D and adoption of new technologies. Innovations from this educational environment will contribute to Ghana’s competitiveness in a global economy.
(USAID)/CDC Development Solutions
IBM and CDC together will offer guidance, international knowledge, and operational advice to USAID volunteers. This alliance will serve as a powerful resource for the United States Agency for International Development (USAID) missions by linking corporate volunteer programs.
MacleanMaclean will offer IBM Virtual Server Services (VSS) and Enfusion (a managed IT support service) to provide hosted computing environments for midsized companies to take advantage of cloud computing. IBM will provide Maclean with presales and marketing support.
Jetstar AirwaysExpanding on the Jetstar Airways self-service offering for passengers (SMS boarding), this self-service platform is built on IBM WebSphere technologies. IBM managed the integration of the Universal Scanner and retrofitting of camera hardware in the kiosks.
BEE IBM will determine Smart Grid potential for The Bureau of Energy Efficiency (BEE) in India and will create tool kits for regulators and utilities for assessing Smart Grid investment decisions.
ETH ZurichETH Zurich and IBM open the Binnig and Rohrer Nanotechnology Center located on the campus of IBM Research – Zurich. The facility is the cornerstone of a 10-year strategic partnership in nanoscience between IBM and ETH Zurich, in which R&D will be carried out to advance both energy and information technologies.
CPFL Energia Holdings
IBM is teaming up with CPFL to develop a global Smart Grid strategy that drives operational efficiency and optimizes the communication network by providing consulting and assessment services. Involvement with the Smart Grid projects will strengthen IBM’s position in the Brazilian region.
Appendix – Tables

TBR
IGS 2Q11 | Professional Services Business Quarterly ©2011 Technology Business Research, Inc.58
IBM/IGS’ Application Vendors Partnership Highlights
COMPANY SCOPE OF PARTNERSHIP
SAP
IBM and SAP have helped customers build end-to-end CRM solutions, including mySAP CRM, IBM DB2, WebSphere MQ, IBM eServer iSeries and IBM eServer xSeries. The two also have joint solutions for business intelligence, ERP, PLM and SCM. The latest development of the IBM/SAP relationship is the expansion of the partnership through the introduction of an optimized DB2 Database that improves performance and availability of SAP solutions running on DB2.
Oracle
IGS was one of Oracle’s first global strategic alliance partners and is recognized as an Oracle Global Certified Advantage Partner, a title reserved for partners that have consistently demonstrated the highest level of competency and commitment to Oracle. IBM BCS has teamed with Oracle for more than 16 years. IBM delivers industry and process expertise, along with implementation methods, tools and accelerators.
Siebel Systems (part of Oracle)
Since 1999, IBM and Siebel Systems have worked together to deliver a broad range of open, scalable and carefully integrated solutions. The latest development in the IBM/Siebel relationship is an extension of the partnership to offer hosted CRM solutions.
Cisco Systems
IBM and Cisco leverage their strengths in Internet infrastructure, e-business systems (applications, middleware, servers) and services (systems integration, support, outsourcing etc.), delivering end to end internet business solutions for e-business transformation. The alliance offers customers ‑ ‑e business security, availability and applications performance as well as speech-enabled self-service ‑solutions to contact centers. In the alliance’s latest development, Cisco will sell IBM’s Lotus Sametime directly through its 1,200 channel partners spread throughout the world.
Appendix – Tables

TBR
IGS 2Q11 | Professional Services Business Quarterly ©2011 Technology Business Research, Inc.59
IBM/IGS’ Application Vendors Partnership Highlights
COMPANY SCOPE OF PARTNERSHIP
Dassault Systemes
IBM BCS and Dassault Systemes provide customers with product lifecycle management services, which optimize product development processes. The partnership provides business transformation consulting, implementation, integration and managed services for the CATIA, ENOVIA and SMARTEAM families of products as well as introduces, integrates and implements Dassault Systemes’ software solutions.
i2 TechnologiesIBM BCS and i2 manage other companies’ value chains by providing comprehensive solutions for supply and demand chains. The services accelerate optimization and collaboration across the entire value chain and allow supply and demand management and timely response to unpredictable events.
Red Hat
IBM and Red Hat have joined to help customers accelerate Linux adoption on the IBM eServer zSeries mainframe. The solutions include IBM’s Integrated Facility for Linux engine and subscription of Red Hat Linux Enterprise v.4 for zSeries systems. The two companies also are working together with educators on Linux skills-building and curriculum development. The alliance will help institutions educate students and develop their skills on Linux and IBM software and servers.
Avaya
IBM and Avaya formed an alliance to integrate Avaya’s VoIP technology with IBM’s enterprise e mail, web conferencing and instant messaging offerings (Lotus Notes and Domino). The alliance ‑will enable “click-to-call” capabilities in email and instant messaging products across Lotus Notes, Domino and IBM Lotus Sametime. IBM will use audio conferencing provided by Avaya Meeting Exchange with Lotus’ web conferencing solutions.
Appendix – Tables

TBR
IGS 2Q11 | Professional Services Business Quarterly ©2011 Technology Business Research, Inc.60
Samuel J. PalmisanoChairman of the Board
President & CEO
Steven A. MillsSVP,
Group ExecutiveSoftware and Systems
Michael E. Daniels
SVP and Group Executive, Services
Rodney C. AdkinsSVP,
Systems & Technology Group
Frank KernSVP, IBM Global Business Services
text
Mark LoughridgeSVP, Chief Financial Officer, Finance and
Enterprise Transformation
Virginia Rometty
SVP, Global Sales, Marketing and Strategy
Linda Sanford
SVP, Enterprise on Demand
Transformation & IT
Robert C. Weber
SVP, Legal & Regulatory Affairs & General
Counsel
Jon C. Iwata
SVP, Marketing/ Communications
Dr. John E. Kelly III
SVP & Director of IBM Research
J. Randall MacDonald
SVP, Human Resources
Corporate Functions
Hardware Group
Software Group
Services Group
KEY:
TBR
Appendix – Tables
IGS Organization Chart

TBR
IGS 2Q11 | Professional Services Business Quarterly ©2011 Technology Business Research, Inc.61
Physical Infrastructure and Worldwide LocationsIGS’ Global Delivery Center Network
IBM’s Technology and Business CapabilitiesAmericas EMEA APAC
Global Delivery Centers
• Brazil• Argentina• Canada
• Slovakia• Poland• Romania• Hungary• Egypt• South Africa
• China• India• Vietnam• Philippines• Australia• Singapore
Research Labs• San Jose, Calif.• Maryland• New York• Austin, Texas
• Israel (Haifa)• Switzerland (Zurich)
• India (New Delhi, Bangalore)
• China (Beijing)• Japan (Tokyo)• Taiwan (Taipei City)
Software & Hardware Labs
• Mexico• Brazil• Argentina
• Poland• Israel• Egypt• Russia
• China• India• South Korea• Vietnam• Malaysia• Singapore• Australia
Cloud Computing Centers Brazil
• South Africa• Poland• Germany
• China• India• South Korea• Vietnam• Japan• New Zealand
Appendix – Tables
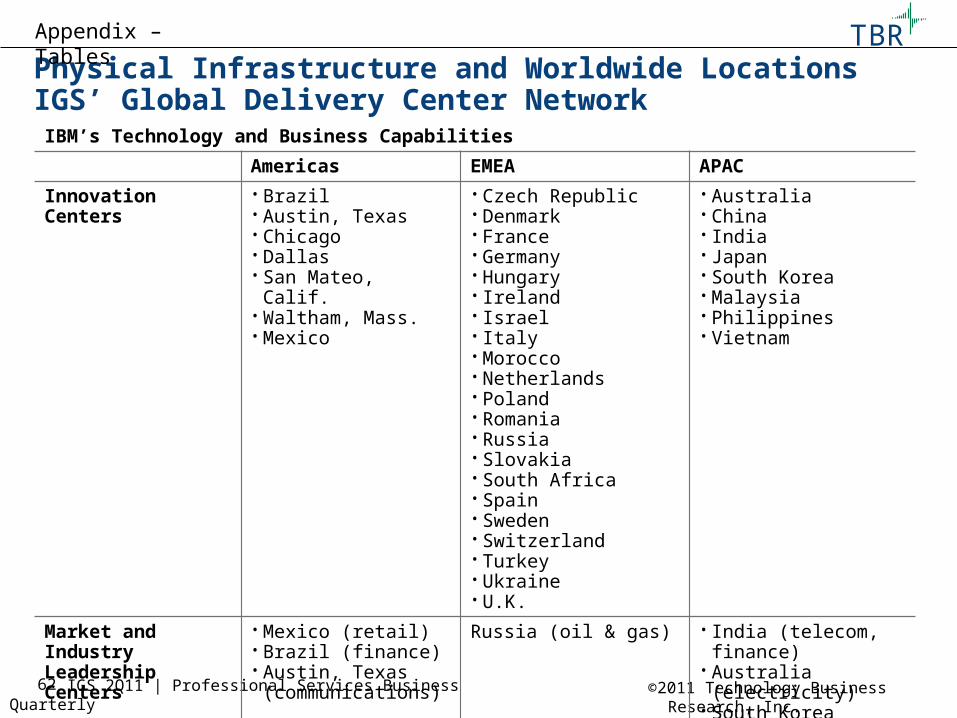
TBR
IGS 2Q11 | Professional Services Business Quarterly ©2011 Technology Business Research, Inc.62
Physical Infrastructure and Worldwide LocationsIGS’ Global Delivery Center Network
IBM’s Technology and Business Capabilities
Americas EMEA APACInnovation Centers • Brazil
• Austin, Texas• Chicago• Dallas• San Mateo, Calif.• Waltham, Mass.• Mexico
• Czech Republic• Denmark• France• Germany• Hungary • Ireland• Israel• Italy• Morocco• Netherlands• Poland• Romania• Russia• Slovakia• South Africa• Spain• Sweden• Switzerland• Turkey • Ukraine• U.K.
• Australia• China• India• Japan• South Korea• Malaysia• Philippines• Vietnam
Market and Industry Leadership Centers
• Mexico (retail)• Brazil (finance)• Austin, Texas
(communications)
Russia (oil & gas) • India (telecom, finance)• Australia (electricity)• South Korea (finance)• China (rail, telecom,
health, electricity)
Appendix – Tables

TBR
TECHNOLOGY BUSINESS RESEARCH, INC.
About Us
Technology Business Research is a leading independent technology market research and consulting firm specializing in the business and financial analyses of hardware, software, networking equipment, wireless, portal and professional services vendors.
Serving a global clientele, TBR provides timely and accurate market research and business intelligence in formats that are tailored to clients’ needs. Our analysts are available to further address client-specific issues or information needs on an inquiry or proprietary consulting basis.
TBR has been empowering corporate decision makers since 1996.
To learn how our analysts can address your unique business needs, please visit our website or contact us today.
Contact Us
[email protected] Merrill DriveHampton, NH 03842USA
This report is based on information made available to the public by the vendor and other public sources. No representation is made that this information is accurate or complete. Technology Business Research will not be held liable or responsible for any decisions that are made based on this information. The information contained in this report and all other TBR products is not and should not be construed to be investment advice. TBR does not make any recommendations or provide any advice regarding the value, purchase, sale or retention of securities. This report is copyright-protected and supplied for the sole use of the recipient. Contact Technology Business Research, Inc. for permission to reproduce.

TBR
©2012 Technology Business Research Inc.
Technology Business ResearchTechnology Business Research is a different kind of research company. Our bottoms-up approach provides a look at the technology industry unlike anything you’ve seen before. We analyze company performance in professional services, networking and mobility, computing and hardware, and software on a quarterly basis, leveraging our data to create industry benchmarks and landscapes that provide a business perspective on leaders and laggards and their business plans. We are experts in the business of technology.
“I never go into a negotiation with a vendor until I have reviewed TBR’s quarterly reports. Understanding a vendor’s profit margin by business unit gives me an information edge in formulating my negotiation strategy and has saved my organization countless dollars!” – Telecom End User
“We are using Technology Business Research’s operational metrics and management consulting taxonomy to drive our growth strategy and resources for our management consulting business…”
- Top 5 Global Technology Company

TBR
©2012 Technology Business Research Inc.
For more information on accessing new TBR reports please contact James McIlroy at [email protected] or at 603-758-1813
Follow our analysts on @TBRincRead out analysts’ commentaries at @TBRincNewsroom
Watch our recorded webinars at http://www.youtube.com/user/TBRIChannel?feature=mhee