2q11 disclosure and results
TRANSCRIPT

1
Earnings Release | Conference Call – 2Q11 August 09th, 2011
2
Agenda
Ricardo Ribeiro
COO
Roberto Senna
CEO
Carlos Wollenweber
CFO | IR
2Q11 Highlights
Operating Highlights
Financial Highlights

Highlights
3
1. Adjusted by non-cash expenses (Stock-Options Program).
2Q11 1H11
Launched PSV% Direcional
R$ million 288 511
Contracted PSV% Direcional
R$ million 169 344
VSO (Sales Over Total Supply) % PSV 18.5% 31.5%
Net Revenues R$ million 245 479
Adjusted Net Income¹ R$ million 41 91
Adjusted Net Margin¹ 17% 19%

4
June
R$ 56.4 million
R$ 75,000
R$ 1,770
752
Launch
Total PSV
Price (R$/unit)
Price (R$/sq.m)
# Units
Manaus - AM Location
Total Ville Vida Nova – 3rd phase
June
R$ 48.0 million
R$ 75,000
R$ 1,769
640
Launch
Total PSV
Price (R$/unit)
Price (R$/sq.m)
# Units
Marituba - PA Location
Bella Città Algodoal – 3rd phase
Highlights: RET1 Launches
Direcional launched 3 projects within the Special Taxation Regime (RET1); comprising units under R$ 75.0 thousand,
focused in the low income segment (between 3 and 4 minimum wages).
Industrialized construction technology using aluminum molds
* Considering 320 units of RET1 (94% of total project).
April
R$ 27.3 million
R$ 1,728
340
Launch
Total PSV
Price (R$/unit)
Price (R$/sq.m)
# Units
Macaé - RJ Location
Total Ville Macaé – 2nd phase
R$ 75,000*
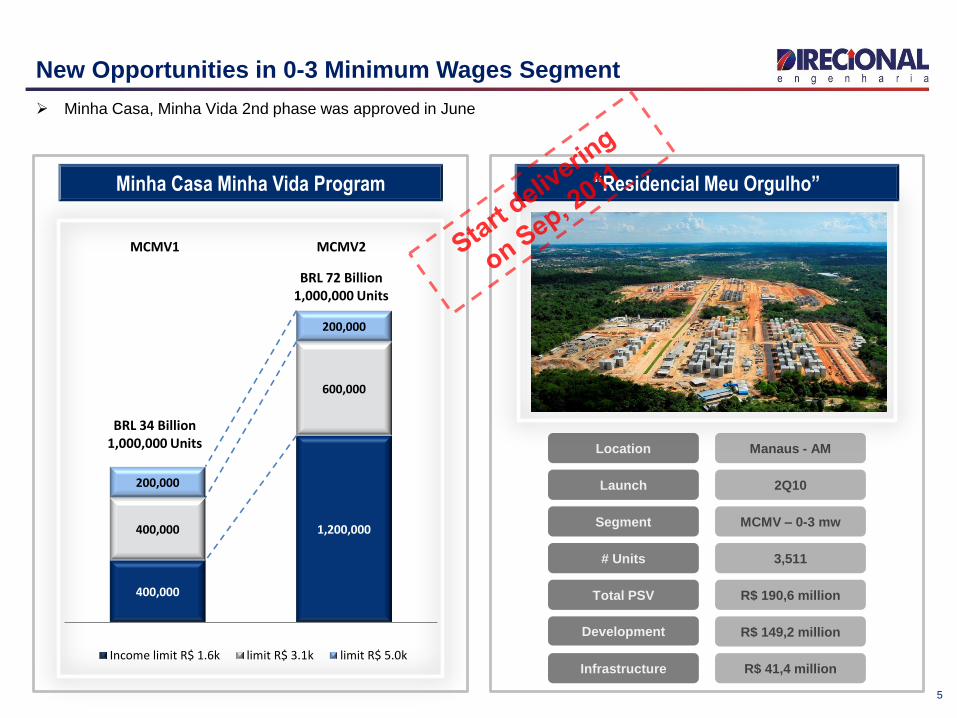
New Opportunities in 0-3 Minimum Wages Segment
5
# Units
Segment
Development
Infrastructure
3,511
MCMV – 0-3 mw
R$ 149,2 million
R$ 41,4 million
Total PSV R$ 190,6 million
Location Manaus - AM
“Residencial Meu Orgulho” Minha Casa Minha Vida Program
Minha Casa, Minha Vida 2nd phase was approved in June
Launch 2Q10
400,000
1,200,000400,000
600,000
200,000
200,000
Income limit R$ 1.6k limit R$ 3.1k limit R$ 5.0k
MCMV1
BRL 34 Billion1,000,000 Units
MCMV2
BRL 72 Billion1,000,000 Units
6
Operating Highlights
Launches
Sales
Land Bank
Inventory
Ricardo Ribeiro
Operating Highlights
Total
(R$'000)
% Direcional
(R$'000)
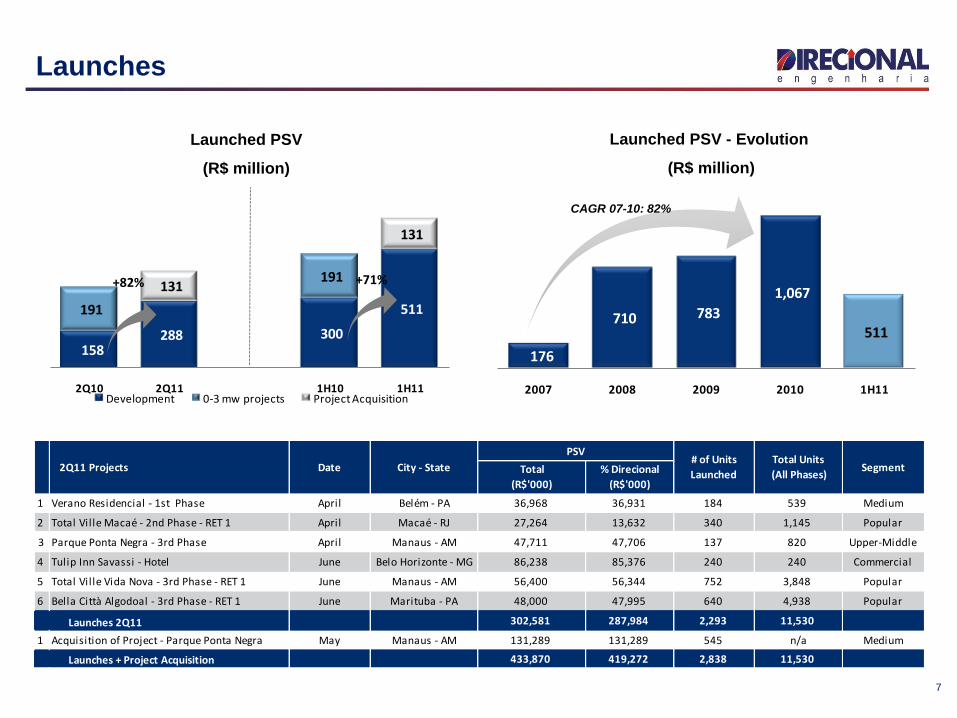
1 Verano Residencial - 1st Phase April Belém - PA 36,968 36,931 184 539 Medium
2 Total Ville Macaé - 2nd Phase - RET 1 April Macaé - RJ 27,264 13,632 340 1,145 Popular
3 Parque Ponta Negra - 3rd Phase April Manaus - AM 47,711 47,706 137 820 Upper-Middle
4 Tulip Inn Savassi - Hotel June Belo Horizonte - MG 86,238 85,376 240 240 Commercial
5 Total Ville Vida Nova - 3rd Phase - RET 1 June Manaus - AM 56,400 56,344 752 3,848 Popular
6 Bella Città Algodoal - 3rd Phase - RET 1 June Marituba - PA 48,000 47,995 640 4,938 Popular
302,581 287,984 2,293 11,530
1 Acquisition of Project - Parque Ponta Negra May Manaus - AM 131,289 131,289 545 n/a Medium
433,870 419,272 2,838 11,530
# of Units
Launched
Total Units
(All Phases)Segment
Launches 2Q11
Launches + Project Acquisition
2Q11 Projects Date City - State
PSV
158 288 300
511 191
191 131
131
2Q10 2Q11 1H10 1H11
Launched PSV (R$million)
Development 0-3 mw projects Project Acquisition
176
710 783
1,067
511
2007 2008 2009 2010 1H11
Evolution Launched PSV (R$million)
7
Launches
+82%
CAGR 07-10: 82%
+71%
Launched PSV
(R$ million)
Launched PSV - Evolution
(R$ million)

54.6%65.6%
58.1% 56.2%
45.4% 37.7%
9.7%
34.4%
4.2%
34.0%
2Q10 2Q11 1H10 1H11North Midwest Southeast
Tulip Inn Savassi - Hotel – PSV R$ 85.4 MM Total Ville Vida Nova 3rd phase – PSV R$ 56.4 MM Verano Residencial – PSV R$ 36.9 MM
Launches Breakdown
8
Launches
(Segment Breakdown – PSV)
Launches
(Geographic Breakdown - PSV)
Parque Ponta Negra – PSV R$ 47.7 MM Total Ville Macaé 2nd phase – PSV R$ 13.6 MM Bella Cittá Algodoal – PSV R$ 47.9 MM
58.9%
39.1%
24.2%
24.3%
36.5%
30.4%
9.2%
47.2%
13.7%
49.4%
7.8%
11.8%
10.8%
10.4%16.7% 9.7%
2Q10 2Q11 1H10 1H11
0 - 3 MW Popular Medium Upper Middle Commercial
# Units
Segment
Price (R$/unit)
Price (R$/sq.m)
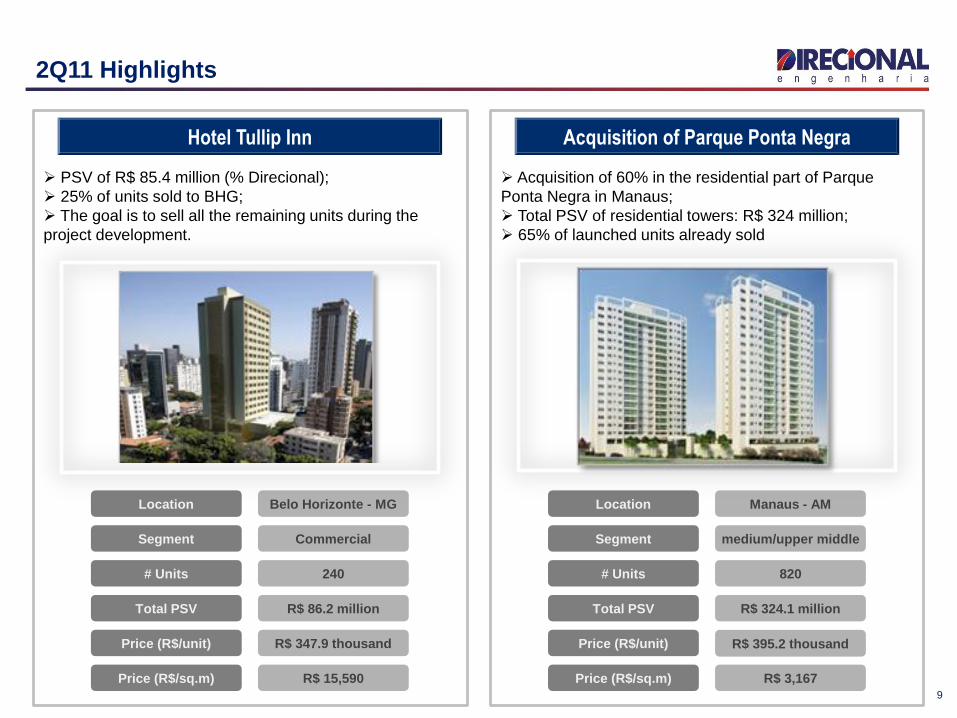
240
Commercial
R$ 347.9 thousand
R$ 15,590
Total PSV R$ 86.2 million
Location Belo Horizonte - MG
Hotel Tullip Inn
2Q11 Highlights
9
# Units
Segment
Price (R$/unit)
Price (R$/sq.m)
820
medium/upper middle
R$ 395.2 thousand
R$ 3,167
Total PSV R$ 324.1 million
Location Manaus - AM
Acquisition of Parque Ponta Negra
PSV of R$ 85.4 million (% Direcional);
25% of units sold to BHG;
The goal is to sell all the remaining units during the
project development.
Acquisition of 60% in the residential part of Parque
Ponta Negra in Manaus;
Total PSV of residential towers: R$ 324 million;
65% of launched units already sold
58.9%
39.1%
24.2%
24.3%
36.5%
30.4%
9.2%
47.2%
13.7%
49.4%
7.8%
11.8%
10.8%
10.4%
18.1% 10.4%
2Q10 2Q11 1H10 1H11
0 - 3 MW Popular Medium Upper Middle Commercial
77.9%
48.1%
72.8%
40.1%
13.2%
19.8%
17.0%
21.7%
8.9%
32.1%
10.2%
38.2%
2Q10 2Q11 1H10 1H11
North Midwest Southeast
127
441 661
1,037
344
2007 2008 2009 2010 1H11
133 169 297 344
191
191
89
89
2Q10 2Q11 1H10 1H11Development 0-3 mw projects Project Acquisition
10
Sales
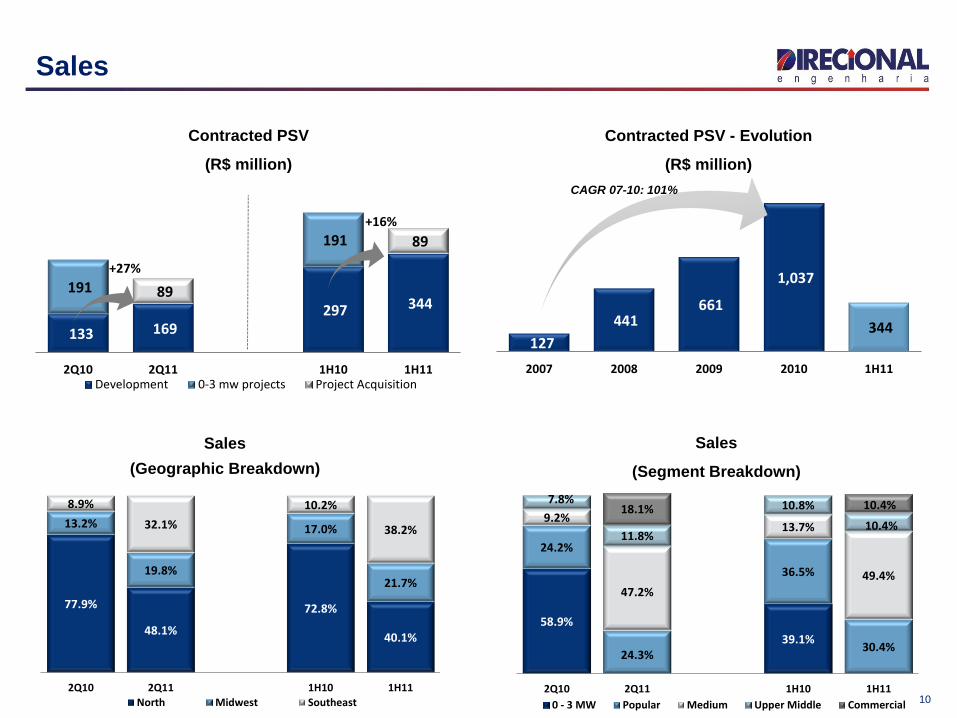
CAGR 07-10: 101%
+27%
+16%
Contracted PSV
(R$ million)
Contracted PSV - Evolution
(R$ million)
Sales
(Geographic Breakdown)
Sales
(Segment Breakdown)
33.8%
38.3%
20.6%
23.7%
19.4% 20.8%
27.6%
22.1%18.5%
1Q10 2Q10 3Q10 4Q10 1Q11 2Q11
With 0.3. MW project Without 0.3. mw project
89%
17%
87%
48%
20%
4%
27%
4%
31%
3%
14%
1%2Q10
3Q10
4Q10
1Q11
2Q11
3M 6M 9M 12M 15M
69%
92%
67%
97%
51%*
11
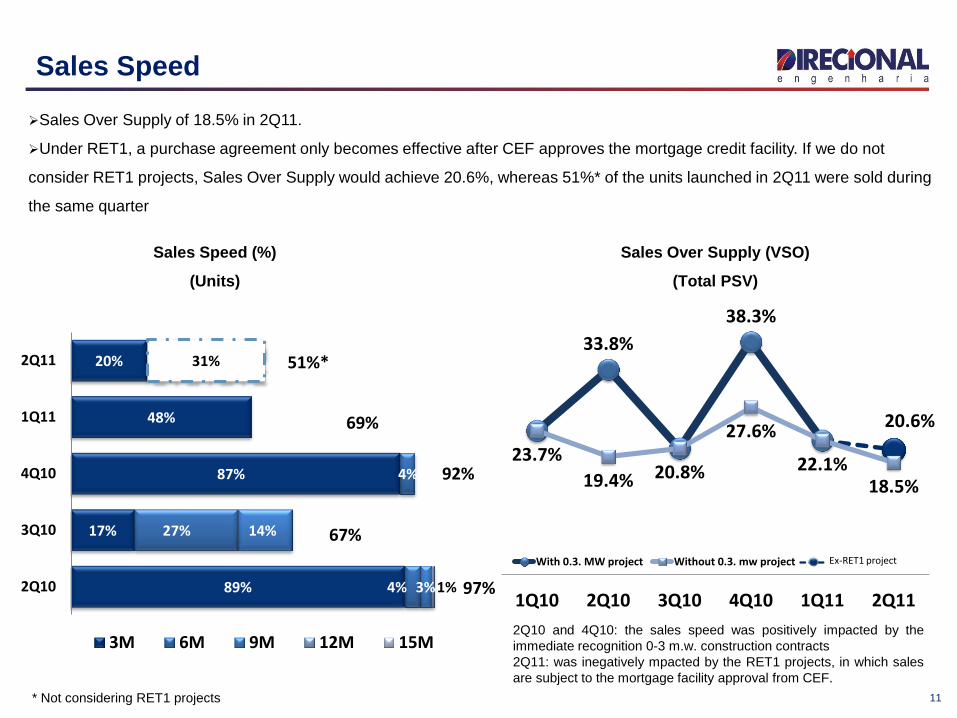
Sales Speed
Sales Over Supply of 18.5% in 2Q11.
Under RET1, a purchase agreement only becomes effective after CEF approves the mortgage credit facility. If we do not
consider RET1 projects, Sales Over Supply would achieve 20.6%, whereas 51%* of the units launched in 2Q11 were sold during
the same quarter
Sales Over Supply (VSO)
(Total PSV)
Sales Speed (%)
(Units)
2Q10 and 4Q10: the sales speed was positively impacted by the
immediate recognition 0-3 m.w. construction contracts
2Q11: was inegatively mpacted by the RET1 projects, in which sales
are subject to the mortgage facility approval from CEF.
33,8% 38,3%
21,1%
23,7% 19,4% 20,8% 27,6% 22,1% 18,9%
1
1Q10 2Q10* 3Q10 4Q10* 1Q11 2Q11*
Com Projetos 0-3 SM Ex projetos 0-3 SM Ex Projetos RET1
* Not considering RET1 projects
Ex-RET1 project
12
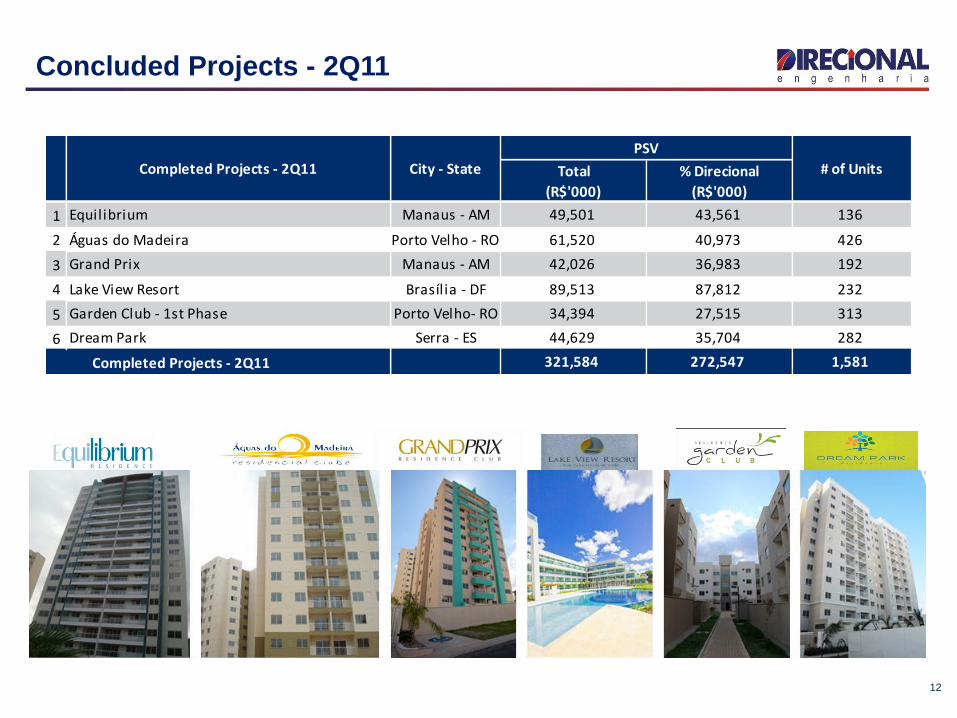
Concluded Projects - 2Q11
Total
(R$'000)
% Direcional
(R$'000)
1 Equilibrium Manaus - AM 49,501 43,561 136
2 Águas do Madeira Porto Velho - RO 61,520 40,973 426
3 Grand Prix Manaus - AM 42,026 36,983 192
4 Lake View Resort Brasília - DF 89,513 87,812 232
5 Garden Club - 1st Phase Porto Velho- RO 34,394 27,515 313
6 Dream Park Serra - ES 44,629 35,704 282
Completed Projects - 2Q11 321,584 272,547 1,581
Completed Projects - 2Q11 City - State
PSV
# of Units
7,004 6,986 152 118
288
1Q11 ACQUIRED LANDSON 2Q11
REVIEW OFPROJECTS
LAUNCHES IN 2Q11 2Q11
6,757 6,986 580 160
511
4Q10 ACQUIRED LANDSON 1H11
REVIEW OFPROJECTS
LAUNCHES IN 1H11 1H11
13
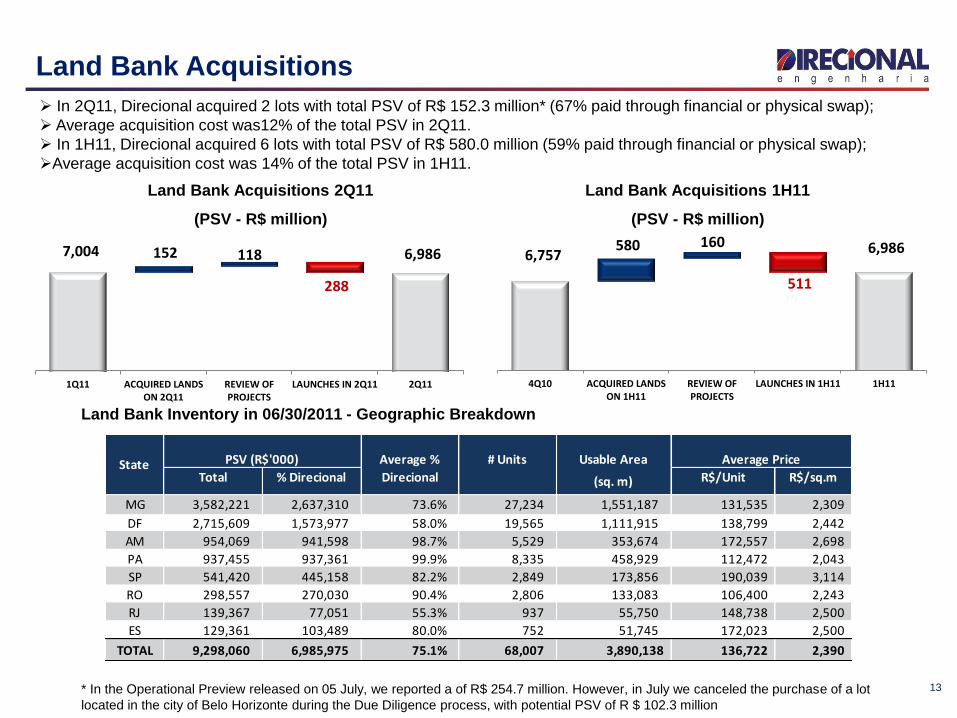
Land Bank Acquisitions
In 2Q11, Direcional acquired 2 lots with total PSV of R$ 152.3 million* (67% paid through financial or physical swap);
Average acquisition cost was12% of the total PSV in 2Q11.
In 1H11, Direcional acquired 6 lots with total PSV of R$ 580.0 million (59% paid through financial or physical swap);
Average acquisition cost was 14% of the total PSV in 1H11.
Land Bank Inventory in 06/30/2011 - Geographic Breakdown
* In the Operational Preview released on 05 July, we reported a of R$ 254.7 million. However, in July we canceled the purchase of a lot
located in the city of Belo Horizonte during the Due Diligence process, with potential PSV of R $ 102.3 million
Land Bank Acquisitions 2Q11
(PSV - R$ million)
Land Bank Acquisitions 1H11
(PSV - R$ million)
Average % # Units Usable Area
Total % Direcional Direcional (sq. m) R$/Unit R$/sq.m
MG 3,582,221 2,637,310 73.6% 27,234 1,551,187 131,535 2,309
DF 2,715,609 1,573,977 58.0% 19,565 1,111,915 138,799 2,442
AM 954,069 941,598 98.7% 5,529 353,674 172,557 2,698
PA 937,455 937,361 99.9% 8,335 458,929 112,472 2,043
SP 541,420 445,158 82.2% 2,849 173,856 190,039 3,114
RO 298,557 270,030 90.4% 2,806 133,083 106,400 2,243
RJ 139,367 77,051 55.3% 937 55,750 148,738 2,500
ES 129,361 103,489 80.0% 752 51,745 172,023 2,500
TOTAL 9,298,060 6,985,975 75.1% 68,007 3,890,138 136,722 2,390
State PSV (R$'000) Average Price
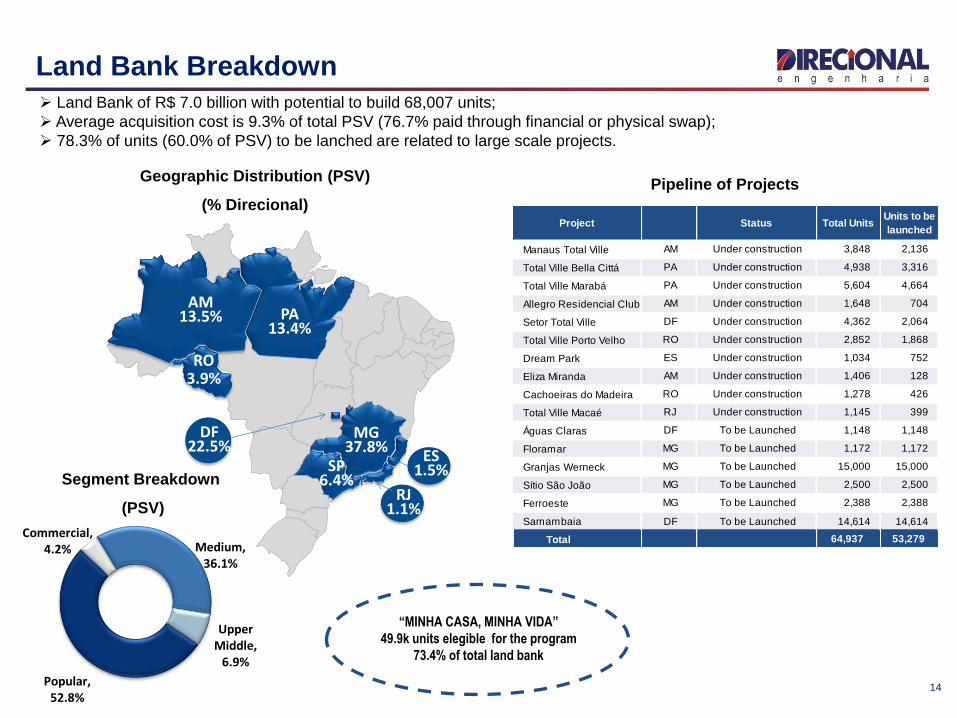
ES1.5%
AM13.5%
MG37.8%
RO3.9%
SP6.4%
PA13.4%
DF22.5%
RJ1.1%
Manaus Total Ville AM Under construction 3,848 2,136
Total Ville Bella Cittá PA Under construction 4,938 3,316
Total Ville Marabá PA Under construction 5,604 4,664
Allegro Residencial Club AM Under construction 1,648 704
Setor Total Ville DF Under construction 4,362 2,064
Total Ville Porto Velho RO Under construction 2,852 1,868
Dream Park ES Under construction 1,034 752
Eliza Miranda AM Under construction 1,406 128
Cachoeiras do Madeira RO Under construction 1,278 426
Total Ville Macaé RJ Under construction 1,145 399
Águas Claras DF To be Launched 1,148 1,148
Floramar MG To be Launched 1,172 1,172
Granjas Werneck MG To be Launched 15,000 15,000
Sítio São João MG To be Launched 2,500 2,500
Ferroeste MG To be Launched 2,388 2,388
Samambaia DF To be Launched 14,614 14,614
Total 64,937 53,279
Project Status Total UnitsUnits to be
launched
14
Land Bank Breakdown Land Bank of R$ 7.0 billion with potential to build 68,007 units;
Average acquisition cost is 9.3% of total PSV (76.7% paid through financial or physical swap);
78.3% of units (60.0% of PSV) to be lanched are related to large scale projects.
Geographic Distribution (PSV)
(% Direcional)
“MINHA CASA, MINHA VIDA”
49.9k units elegible for the program
73.4% of total land bank
Segment Breakdown
(PSV)
Pipeline of Projects
Popular, 52.8%
Commercial, 4.2% Medium,
36.1%
Upper Middle,
6.9%

Total % Direcional
Launches 2011 306,844 300,931 2,289 2,183 63.6%
Launches 2010 250,270 234,384 1,272 1,131 9.3%
Launches 2009 124,009 112,580 1,049 695 7.7%
Launches 2008 84,523 63,920 433 296 13.6%
Previous Launches 2,818 1,409 23 6 6.7%
Under Construction 768,464 713,224 5,066 4,311 16.0%
Finished Units 67,453 41,375 419 272 5.9%
Total Inventory 835,918 754,600 5,485 4,583 N/A
Inventory
PSV in Inventory (R$'000)Units in
Inventory
Units in
Inventory
(without swap)
% Units in Inventory
15
Inventory
R$ 754.6 million or 4,583 units
Inventory of completed units: R$ 41.4 million or 272 units;
Projects under construction have, on average, 84.0% of units already sold.
Inventory at market value in 06/30/2011:
Only 5.9% of the units in our inventory
are located in concluded projects

16
Financial Highlights
Financial Performance
Liquidity Indicators
Results to be Recognized
Performance Shares
Carlos Wollenweber
Financial Highlights
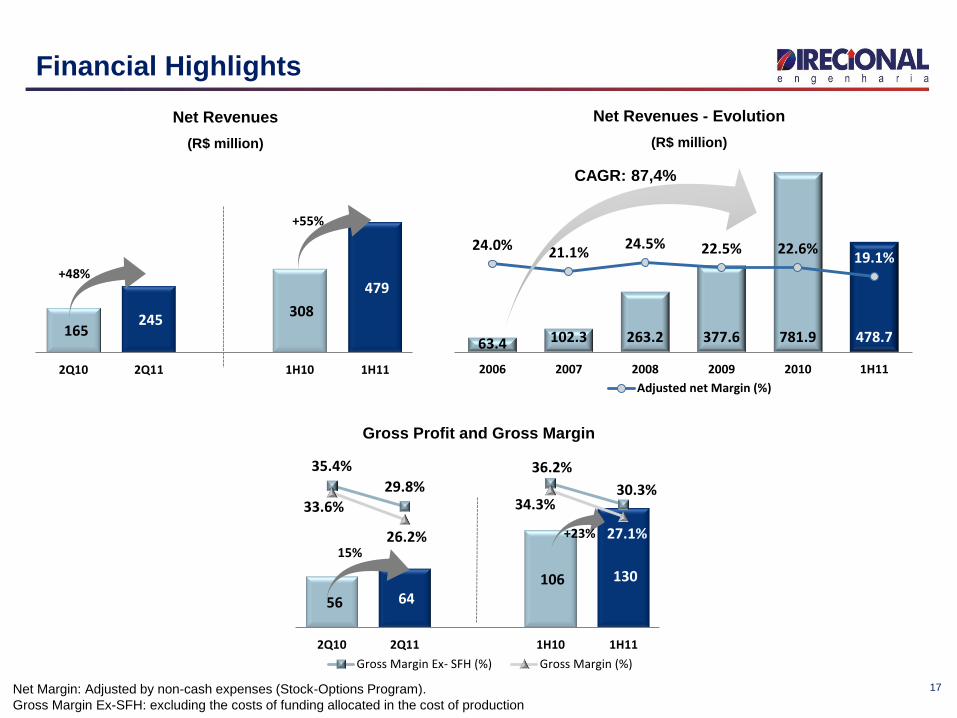
56 64 106 130
35.4%
29.8%36.2%
30.3%33.6%
26.2%
34.3%
27.1%
2Q10 2Q11 1H10 1H11
Gross Margin Ex- SFH (%) Gross Margin (%)
63.4 102.3 263.2 377.6 781.9 478.7
24.0% 21.1%24.5% 22.5% 22.6%
19.1%
2006 2007 2008 2009 2010 1H11
Adjusted net Margin (%)
165 245
308
479
2Q10 2Q11 1H10 1H11
+48%
+55%
17
Financial Highlights
Net Margin: Adjusted by non-cash expenses (Stock-Options Program).
Gross Margin Ex-SFH: excluding the costs of funding allocated in the cost of production
Net Revenues
(R$ million)
CAGR: 87,4%
Net Revenues - Evolution
(R$ million)
15%
+23%
Gross Profit and Gross Margin
41 41
78 91
24.8%16.6%
25.5%
19.1%
2Q10 2Q11 1H10 1H11
Adjusted net Margin (%)
21 58
36
114
12.2%23.0%
11.2%
23.4%
2Q10 2Q11 1H10 1H11
% Gross Revenue
18
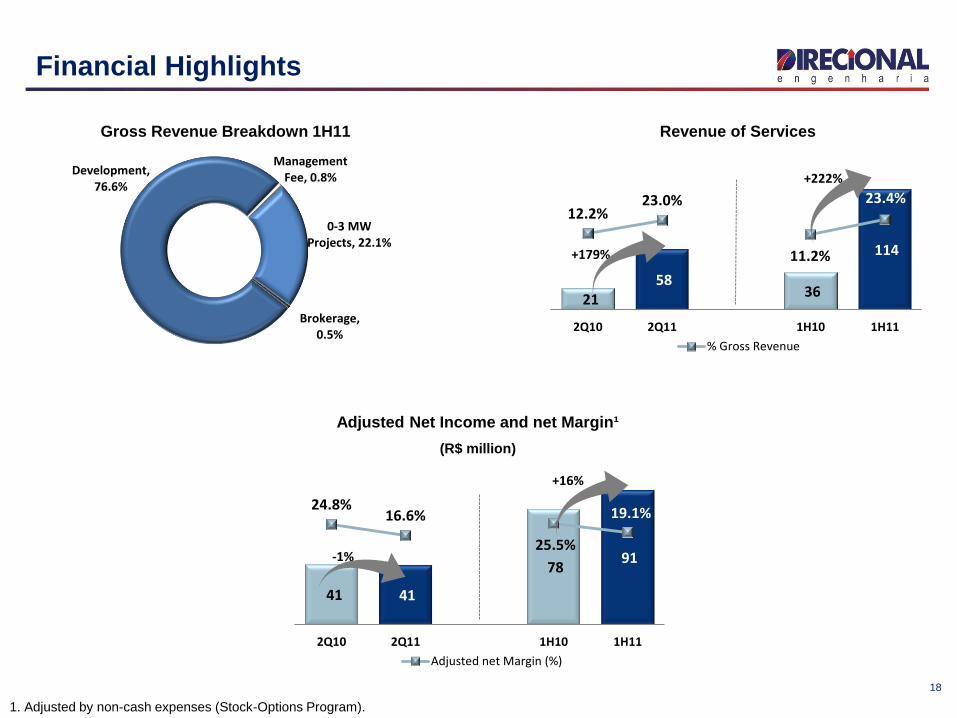
Financial Highlights
Gross Revenue Breakdown 1H11
Adjusted Net Income and net Margin¹
(R$ million)
-1%
+16%
Revenue of Services
+179%
+222%
1. Adjusted by non-cash expenses (Stock-Options Program).
Development, 76.6%
Management Fee, 0.8%
0-3 MW Projects, 22.1%
Brokerage, 0.5%

45 48
87 106
27.1%19.7%
28.3%
22.1%
2Q10 2Q11 1H10 1H11
Adjusted EBITDA Margin (%)
4 7 8 12
1.2%
3.9%
1.5%
3.0%2.6% 2.3%
2Q10 2Q11 1H10 1H11
% Sales % Sales without 0-3 m.w. projects
11 17 19
34
6.7% 7.1% 6.3% 7.0%
2Q10 2Q11 1H10 1H11
% Net revenue
19
Financial Highlights
Adjusted Ebitda and Ebitda Margin¹
Adjusted G&A¹ (R$ million) Commercial Expenses (R$ million)
+57%
+73%
+67%
+48%
+8%
+22%
1. Adjusted by non-cash expenses (Stock-Options Program).
14,52225,312 22,468
32,65741,236
73,695
86,301
100,873
64,967
33,965
1Q09 2Q09 3Q09 4Q09 1Q10 2Q10 3Q10 4Q10 1Q11* 2Q11
Moving Average of Last 4 Quarters
20
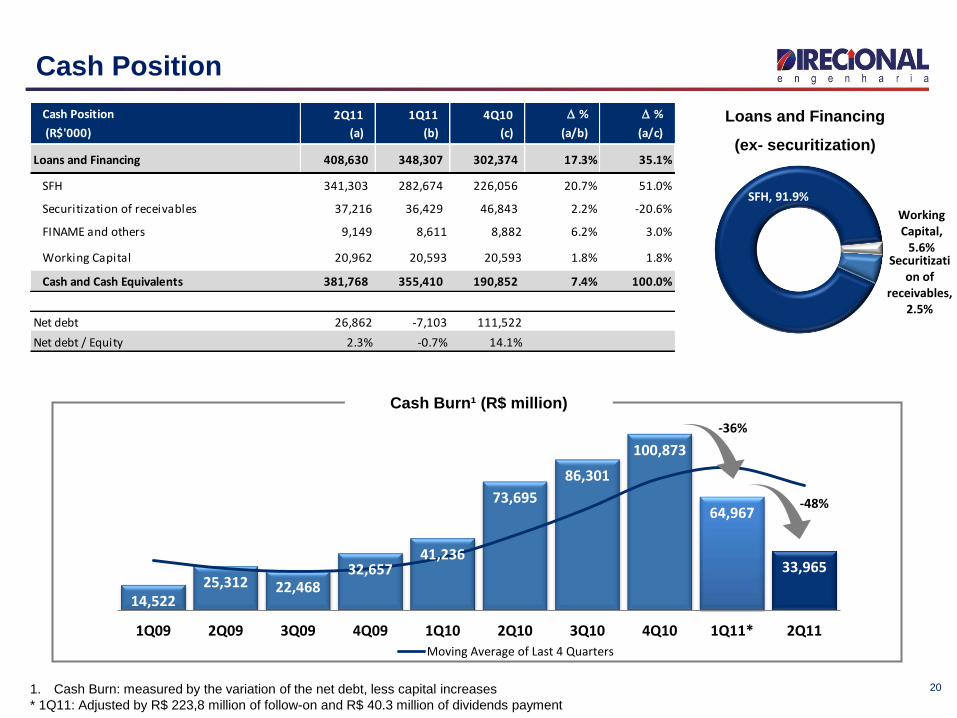
Cash Position
Cash Burn¹ (R$ million)
Loans and Financing
(ex- securitization)
-36%
-48%
1. Cash Burn: measured by the variation of the net debt, less capital increases
* 1Q11: Adjusted by R$ 223,8 million of follow-on and R$ 40.3 million of dividends payment
Cash Position 2Q11 1Q11 4Q10 D % D %
(R$'000) (a) (b) (c) (a/b) (a/c)
Loans and Financing 408,630 348,307 302,374 17.3% 35.1%
SFH 341,303 282,674 226,056 20.7% 51.0%
Securitization of receivables 37,216 36,429 46,843 2.2% -20.6%
FINAME and others 9,149 8,611 8,882 6.2% 3.0%
Working Capital 20,962 20,593 20,593 1.8% 1.8%
Cash and Cash Equivalents 381,768 355,410 190,852 7.4% 100.0%
Net debt 26,862 -7,103 111,522
Net debt / Equity 2.3% -0.7% 14.1%
SFH, 91.9%
Securitization of
receivables, 2.5%
Working Capital,
5.6%

Book Value 2Q11 1.107
(+) Results to be Recognized 413
Adjusted Book Value 1.520
Market Cap (08/05/2011) 1.529
Market Cap/Adjusted BV 1,01
Adjusted Book Value (R$ million)
40,0%52,3%
7,6%
2011 2012 2013+
21
Deferred Results
REF Recognition Schedule
Results to be Recognized (R$'000) 2Q11 1Q11 4Q10 D % D %
(a) (b) (c) (a/b) (a/c)
Deferred revenues Consolidated (1+2) 413.476 382.339 404.563 8,1% 2,2%
Deferred costs 1.076.829 967.047 1.011.455 11,4% 6,5%
Deferred results 663.353 584.708 606.892 13,5% 9,3%
Deferred results - Margin 38,4% 39,5% 40,0% -2,9% -4,0%
Deferred revenues Development (1) 312.496 325.687 315.467 -4,0% -0,9%
Deferred costs 723.042 762.873 740.269 -5,2% -2,3%
Deferred results 410.545 437.186 424.802 -6,1% -3,4%
Deferred results - Margin 43,2% 42,7% 42,6% 1,4%
Deferred revenues 0-3 mw projects (2) 100.979 56.652 89.096 78,2% 13,3%
Deferred costs 353.787 204.174 271.186 73,3% 30,5%
Deferred results 252.808 147.522 182.090 71,4% 38,8%
Deferred results - Margin 28,5% 27,7% 32,9%
22
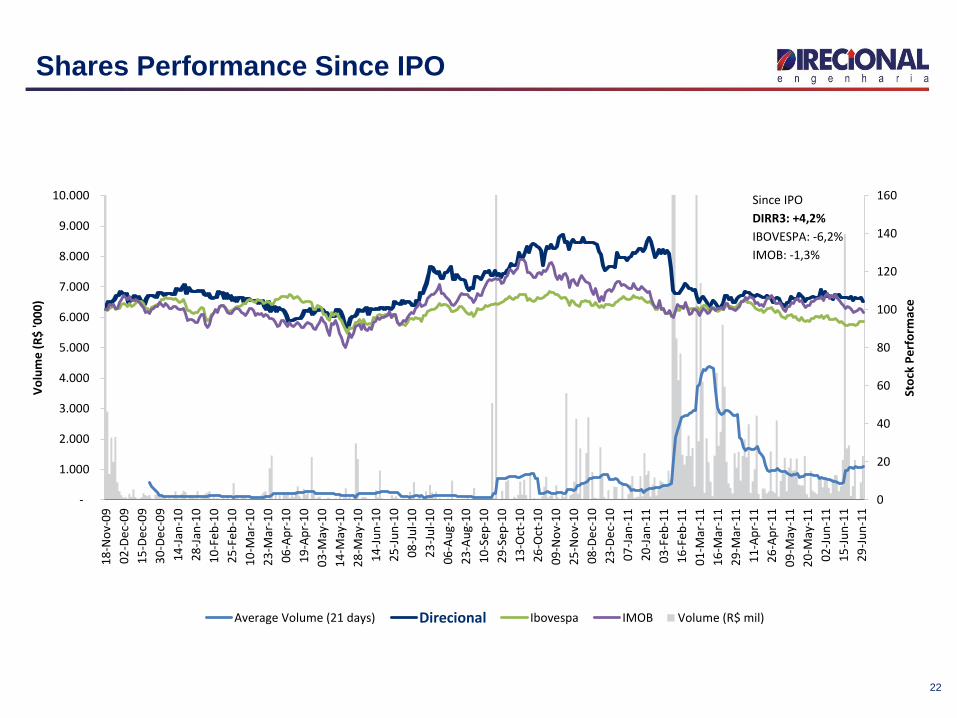
Shares Performance Since IPO
Since IPO
DIRR3: +4,2%
IBOVESPA: -6,2%
IMOB: -1,3%
0
20
40
60
80
100
120
140
160
-
1.000
2.000
3.000
4.000
5.000
6.000
7.000
8.000
9.000
10.000
19
-no
v-0
9
3-d
ez-0
9
16
-dez
-09
4-j
an-1
0
15
-jan
-10
29
-jan
-10
11
-fe
v-1
0
26
-fe
v-1
0
11
-mar
-10
24
-mar
-10
7-a
br-
10
20
-ab
r-1
0
4-m
ai-1
0
17
-mai
-10
31
-mai
-10
15
-ju
n-1
0
28
-ju
n-1
0
12
-ju
l-1
0
26
-ju
l-1
0
10
-ago
-10
24
-ago
-10
13
-set
-10
30
-set
-10
14
-ou
t-1
0
27
-ou
t-1
0
10
-no
v-1
0
26
-no
v-1
0
9-d
ez-1
0
27
-dez
-10
10
-jan
-11
21
-jan
-11
4-f
ev-
11
17
-fe
v-1
1
2-m
ar-1
1
17
-mar
-11
30
-mar
-11
12
-ab
r-1
1
27
-ab
r-1
1
10
-mai
-11
23
-mai
-11
3-j
un
-11
16
-ju
n-1
1
30
-ju
n-1
1
Pre
ço d
a A
ção
Vo
lum
e (
R$
mil)
Volume (R$ mil)
0
20
40
60
80
100
120
140
160
-
1.000
2.000
3.000
4.000
5.000
6.000
7.000
8.000
9.000
10.000
18
-No
v-0
9
02
-De
c-0
9
15
-De
c-0
9
30
-De
c-0
9
14
-Jan
-10
28
-Jan
-10
10
-Fe
b-1
0
25
-Fe
b-1
0
10
-Mar
-10
23
-Mar
-10
06
-Ap
r-1
0
19
-Ap
r-1
0
03
-May
-10
14
-May
-10
28
-May
-10
14
-Ju
n-1
0
25
-Ju
n-1
0
08
-Ju
l-1
0
23
-Ju
l-1
0
06
-Au
g-1
0
23
-Au
g-1
0
10
-Se
p-1
0
29
-Se
p-1
0
13
-Oct
-10
26
-Oct
-10
09
-No
v-1
0
25
-No
v-1
0
08
-De
c-1
0
23
-De
c-1
0
07
-Jan
-11
20
-Jan
-11
03
-Fe
b-1
1
16
-Fe
b-1
1
01
-Mar
-11
16
-Mar
-11
29
-Mar
-11
11
-Ap
r-1
1
26
-Ap
r-1
1
09
-May
-11
20
-May
-11
02
-Ju
n-1
1
15
-Ju
n-1
1
29
-Ju
n-1
1
Sto
ck P
erf
orm
ace
Vo
lum
e (
R$
'00
0)
Average Volume (21 days) Direcional Ibovespa IMOB

23
Disclosure
This presentation contains certain forward-looking statements concerning the business prospects,
projections of operating and financial results and growth potential of the Company, which are based on
management’s current expectations and estimates of the future performance of the Company. Although the
Company believes such forward-looking statements are based on reasonable assumptions, it can give no
assurance that its expectations will be achieved. Expectations and estimates that are based on the future
prospects of the Company are highly dependent upon market behavior, Brazil’s political and economic
situation, existing and future regulations of the industry and international markets and, therefore, are
subject to changes outside the Company’s and management’s control. The Company undertakes no
obligation to update any information contained herein or to revise any forward-looking statement as a result
of new information, future events or other information.
24
Contacts
Carlos Wollenweber CFO | IR Officer
Lucas Bousas IR Analyst
Paulo Sousa IR Assistant
www.direcional.com.br
+55 (31) 3214-6200
+55 (31) 3214-6450