tank containers: a sustainable solution for bulk liquid ... · range of cargoes in intermodal iso...
TRANSCRIPT

October 2011
Tank Containers:
A Sustainable Solution for
Bulk Liquid Transport
Prepared by Atlantic Consulting for the
International Tank Container Organisation

2 October 2011
CONTENTS
1 FOREWORD FROM ITCO 4
2 SUMMARY: TANK CONTAINERS PROVIDE A SUSTAINABLE SOLUTION FOR BULK LIQUID TRANSPORT5
3 TANK CONTAINERS: REUSABLE, RECYCLABLE, RE-MANUFACTURABLE 6
3.1 Reusable ............................................................................................................. 6
3.2 Recyclable .......................................................................................................... 7
3.3 Re-manufacture ................................................................................................. 7
4 SUSTAINABILITY IN PRACTICE: THE CASE OF TANK CONTAINERS 8
4.1 Manufacture ...................................................................................................... 8
4.2 Operations ......................................................................................................... 9
4.3 Leasing ............................................................................................................. 10
4.4 Tank Service Providers ..................................................................................... 11
4.5 Inspection ......................................................................................................... 11
5 ECO-IMPACT OF TANK CONTAINERS 12
5.1 Carbon footprint: tank container shipment from China to Europe ................. 12
5.2 All environmental impacts: tank container shipment from China to Europe . 14
5.3 Variations in transport footprints .................................................................... 15
6 HOW ISO TANK CONTAINERS MAKE TRANSPORT MORE SUSTAINABLE 18
6.1 Reduction of deadhead trips ........................................................................... 18
6.2 Ease of multi-modal transport ......................................................................... 18
7 AREAS FOR POSSIBLE IMPROVEMENT 19
7.1 ITCO-internal actions ....................................................................................... 19
7.2 ITCO-external actions ....................................................................................... 21
8 REFERENCES 22

3 October 2011
TABLES
Table 1: Carbon footprint by life-cycle phase, ISO tank shipment from China-Europe .......... 14
Table 2: Emission factors for freight transport (g CO2e/tkm) ................................................. 16
Table 3: Load factors for cargo shipping, by type .................................................................... 18
FIGURES
Figure 1: Workhorse of the transport sector – a typical tank container ................................... 6
Figure 2: Absolute carbon footprint by function, ISO tank container shipment from China to
Europe .............................................................................................................................. 12
Figure 3: Percentage carbon footprint by function, ISO tank container shipment from China
to Europe.......................................................................................................................... 13
Figure 4: Carbon footprint by life-cycle phase, ISO tank shipment from China to Europe ..... 13
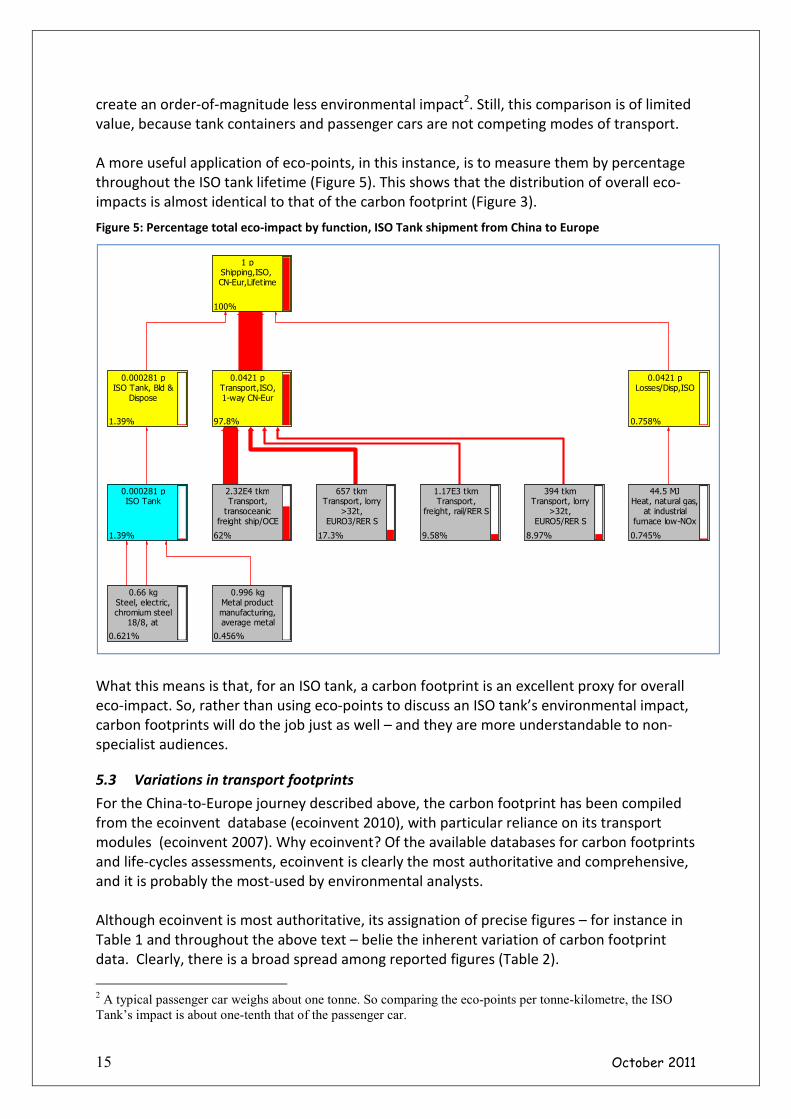
Figure 5: Percentage total eco-impact by function, ISO tank shipment from China to Europe
.......................................................................................................................................... 15
ITCO
International Tank Container Organisation
Suite 3 – Charter House, 26 Claremont Road,
GB-Surbiton KT6 4QZ, www.itco.be
Atlantic Consulting Obstgartentstrasse 14
8136 Gattikon (Zürich)
+41 44 772 1079

4 October 2011
1 Foreword from ITCO
Over the last 30 years there has been a continuing trend to transport an increasingly wide
range of cargoes in intermodal ISO shipping containers. Tank containers have been part of
this shift – they have provided safe, reliable and cost-effective transport for liquids, powders
and gases, both hazardous and non hazardous, foods and chemicals. Although the shift to
containers was aimed primarily at improving efficiency and cutting costs, containerisation
has also helped to protect the environment by lowering the carbon footprint and reducing
waste.
The International Tank Container Organisation
(ITCO), formed in 1998, is a voluntary, non-
profit trade association that represents the
industry and advances its interests. ITCO’s
main function is to be a platform on which the
industry coordinates its efforts in quality,
safety and environmental protection.
Members represent much of the global tank
container industry, including companies that
manufacture tank containers, operators,
lessors, and service providers such as depots
and inspectors.
Sustainability is a key issue for ITCO and it supports chemical industry initiatives such as
Responsible Care, developed by the European Chemical Industry Council (CEFIC).
Responsible Care Members work to:
• Improve continuously environmental, health, safety and security knowledge and
performance so as to avoid harm to people and the environment.
• Use resources efficiently and minimise waste.
• Report openly on performance, achievements and shortcomings.
• Listen, engage and work with the public to understand and address their concerns
and expectations.
• Cooperate with governments, international institutions and organisations in the
development and implementation of effective regulations and standards. Provide
help and advice to foster the responsible management of chemicals by all those who
manage and use them along the product chain.
• Appoint a Responsible Care Coordinator and develop an annual Responsible Care
plan.
Moreover, tank containers provide sustainable transport. Tank containers are re-usable.
They reduce the handling of cargo in transit by use of a multi-modal international standard
ISO transport module. Highly sophisticated logistics techniques are used to transport the
tank container from points of loading to discharge. At the end of life, a tank’s materials are
readily recycled.
This report documents the sustainability status of Tank containers, and it identifies areas
where further progress might be made. We welcome your comments and feedback.
Patrick Hicks, ITCO General Secretary
5 October 2011
2 Summary: Tank containers provide a sustainable solution for bulk liquid
transport.
As a freight transport option, how sustainable are tank containers?
Some of this report’s answers should not surprise. Tank containers offer obvious
sustainability benefits: they are reusable, recyclable and resistant to product wastage.
Safety, quality and efficiency are watchwords throughout the industry.
And then there are less-obvious findings. Nearly all of an ISO tank’s environmental impact
happens not during its manufacture, cleaning or disposal, but during its actual usage; i.e. it
is not just economically efficient, but environmentally efficient as well. This efficiency –
which reduces deadhead journeys and maximises use of water and rail connections – pays
its benefits in the form of a lower
carbon footprint.
Nonetheless, the ongoing struggle
against global warming means that
Tank containers will, like other
industries, need to find ways to de-
carbonise even further. These might
include ITCO-led initiatives to work
with Statutory Authorities to enable
efficient regulatory controls, cut tare
weight, boost capacity and perhaps to
improve aerodynamics. ITCO
members also might lead the way in
establishing performance
benchmarks by improving the quality
and quantity of emission factors. In
addition, members will want to keep
abreast of de-carbonisation moves
across the freight-transport sector. One might be a reduction in marine travel velocity – a
‘speed limit of the sea’.
The body of this report is aimed at readers with working, but non-expert, knowledge of
sustainability issues. It is divided into three general parts.
First, Chapters 3 and 4 give an overview of how tank containers are inherently sustainable
and how sustainability is practised by their manufacturers, operators and service providers.
Second, Chapters 5 and 6 discuss the environmental impact of tank containers: where does
their carbon footprint happen, and how this is lower than some alternative transport
methods?
Finally, Chapter 7 points out some ways in which tank containers might become even more
sustainable.

6 October 2011
3 Tank containers: reusable, recyclable, re-manufacturable
Containers are a prime choice of shippers, moving more than 90% of non-bulk cargo. Since
their introduction in the 1950s and 1960s, the world fleet of all container types has grown
to some 25 million units. Tank containers belong to this fleet: an estimated 290,000 of them
are in operation, and more than 10,000 new tank containers are manufactured each year.
What are tank containers? They consist of a pressure vessel (the tank) supported and
protected within an ISO frame (Figure 1). The International Standards Organisation (ISO)
frame is identical in dimension to an ISO dry freight container, and it uses the same type of
corner castings to enable lifting and stacking. The tank design is governed by international
regulations ensuring the safe transport of a wide range of bulk liquids and powders. Tank
containers are also commonly referred to as “portable tanks” or “ISO tanks”.
Tank containers are manufactured in a range of capacities, with various configurations of
valves and fittings. Typically, a standard tank carries 25,000 litres and has a maximum gross
weight of 36 metric tonnes. A discharge valve is mounted at the rear end; access for loading,
cleaning and maintenance is at the top. Accessories can include steam heating, ladders and
walkway access to the top.
Figure 1: Workhorse of the transport sector – a typical Tank container
Tank containers are reusable, recyclable and can be re-manufactured.
3.1 Reusable
Tank containers are designed for an economic life of typically 20 years. During this life the
tank is used over and over again. After discharge of cargo the tank is cleaned, inspected and
prepared for the next cargo load.

7 October 2011
A tank container engaged on long-haul trades, for instance China to Europe, where the
door-to-door voyage lasts about 6-7 weeks, might ship up to eight loads annually. Over 20
years, that amounts to 160 loads or 4,000 metric tonnes of cargo. Short-haul trades will
result in considerably more loads.
The tank operates door-to-door. It is loaded with cargo in plant A and transported by truck,
rail and ship to the destination plant B where the tank is unloaded and the cargo directed
into the production process.
3.2 Recyclable
Tank containers are
manufactured of materials that
are very suitable for re-cycling.
The total weight is typically
3,700 kg, of which the majority
is metal, namely the stainless
steel tank and the carbon steel
frame. These are easily cut into
manageable dimensions that
can be melted and made into
new materials.
3.3 Re-manufacture
To extend the life beyond 20
years, tank containers often
undergo re-manufacture. This
starts with the removal of the
entire tank frame and
insulation, retaining only the
stainless steel tank vessel,
valves and fittings. Stainless steel is a long lasting metal; it is highly suitable for re-use.
The re-manufacture process re-cycles the retained tank into a new frame. The tank is re-
insulated and tested and continues its service life as new. It is expected that this process will
extend the life of the tank a further fifteen years.

8 October 2011
4 Sustainability in practice: the case of Tank containers
Sustainability is part of an ISO tank’s entire life cycle, from manufacturing to operation. And
it includes not just manufacturers and operators, but also players such as lessors, service
providers and inspectors.
4.1 Manufacture
Tank containers are manufactured in specialist plants located within regions where there is
a demand for at least the initial bulk liquid cargo transport to economically position the
container to the buyers place of need. The majority of standard fleet tank manufacture is
concentrated in China and South Africa ensuring manufacturing economy of scale and
access to export cargo. In addition, regional plants exist world-wide, primarily for the
manufacture of specialist tanks to meet local requirements.
Manufacturing plants are concentrated to take advantage of locally based construction
materials (e.g. stainless steel suppliers), thus reducing the effects of transportation.
Designs of tank container are primarily required to ensure the maximum safety. The tank
shell is manufactured of ductile stainless steel and encased in a high tensile carbon steel
frame.
The vessel is designed to ASME pressure
vessel code, manufactured to the highest
standards and able to withstand test
pressures of 6 bar or more. The ISO
modular frame enables the tank
container to be safely lifted, stacked and
transported on standard intermodal
transport systems and utilising standard
and existing infrastructure.
Tank containers are insulated both to
maintain cargo temperatures and as an
added safety feature. Insulation improves
efficiency by maintaining cargo temperature. By developing improved insulation materials
and systems the cargo is better protected against temperature rise that might in turn
increase pressure. Temperature fall might also affect the cargo. By maintaining temperature
throughout the voyage, energy costs to re-heat the cargo at destination are eliminated.
Insulation and its outer protective cladding further provide a sandwich construction around
the tank, which creates a shield against accidental impact.
Tank containers are manufactured of sustainable materials. Typically weighing 3700kg, the
tank consists of a stainless steel tank barrel within a protective carbon steel modular frame,
materials that may be recycled at the end of life. Protective paint to the frame is applied in
vapour filtering paint booths. Insulation materials are less sustainable but research
continues to develop improved products.

9 October 2011
Tank containers are manufactured on production lines designed to reduce workload, energy
and emissions. Components and sub-assemblies are made ready “just in time” and materials
are increasingly sourced locally. Material off-cuts from the manufacture process are re-
cycled.
Tank container designs continually improve to make the optimum use of modern locally
available materials. Designs have developed to ensure efficient low energy production
utilising the latest technology e.g. pressed vessel ends, auto-welder machines, rotating jigs,
and recycled surface cleaning passivation process. Increased plate dimensions reduce the
number of plates and therefore welded joints and electronically controlled material
thickness control the material used to a fine tolerance. Computer controlled plasma profile
cutters ensure the maximum components from each steel plate. Waste material is collected
and recycled.
The tank tare weight has been reduced by use of computer aided designs, enabling a higher
strength but lighter structure that maximises cargo payload. Finite element analysis
software programmes determine the optimum material requirements and ensure safety of
design by simulating the potential stresses sustained during tank working life. The design is
further proven by mechanical prototype tests undertaken in accordance with the
regulations and witnessed by the Competent Authority.
Component parts such as valves and fittings, sourced locally from specialist manufacturers,
are largely universal. This facilitates efficient production and ensures interchange and in due
course efficient spare parts for repairs and maintenance.
The latest designs and material have enabled the tank tare weight to be reduced by some
10%, resulting in lower transport weight or more cargo for each tank. Designs have also
enabled increased tank capacity within the same ISO frame, the standard 25,000 litre tank
being 20% greater cargo capacity than tanks commonly manufactured in the 1970s.
4.2 Operations
Operators are specialist third party logistics suppliers providing bulk liquid transportation
services to shippers. ITCO member operators account for a total fleet of more than 200,000
tanks.
Shippers load their cargo into an operator’s tank container. Operators undertake the entire
logistic move, transporting the cargo door-to-door. At the required destination, the cargo is
discharged and the tank re-used on another trade. By re-using the packaging (the tank
container) for a return cargo and ensuring the benefits of multi-modal logistics, the
operation is highly efficient. To achieve efficiency the operator’s business requires:
• Expert management and computer management systems
• Client base with balanced trade lanes
• Network of locally based contracted third party transport modes and depots
Operators frequently achieve fleet utilisation greater than 80%, downtime largely consisting
of the time needed to undertake safety maintenance and cleaning between loads. Cargo is

10 October 2011
delivered to meet just-in-time requirements thus minimising shippers’ stock inventories.
However, operators also supply tank containers for the strategic stock of cargo. This enables
shippers and receivers to obtain temporary storage space and meet the requirements of
peak demand.
Multi-modal transport permits the ISO module tank container to be transported by road, rail
and sea, eliminating the need for wasteful and potentially hazardous transhipment of cargo
from one tank to another e.g. from ships tank to rail tank to tank truck or the need for
handling and disposal of steel drums
(125 200 litre steel drums required
for the equivalent ISO Tank load).
Investment in sophisticated
computer systems provides for
optimum performance. A myriad of
data is processed to ensure the most
suitable tank is available and in safe
condition for the next load. Safety
and quality are critical to operating
tank containers, and management
systems are designed to meet the
requirements of quality and safety systems such as ISO 9001, SQAS (Safety and Quality
Assessment System) and Responsible Care (International Council Chemical Industries)
4.3 Leasing
The tank container industry is supported by a number of established leasing companies
(“lessors”) - companies that own stocks of strategically positioned tanks and lease (rent) to
users for short or long term durations.
Leasing companies contribute to the sustainability of the tank container industry by
balancing peaks and troughs of operators’ and shippers’ business cycles. This means
customers are not required to hold idle inventories of tanks for potential strategic needs.
In addition to the required fleet of standard tank types that an operator or shipper might
manage, there is often a requirement for a specialist tank to be procured at short notice.
Lessors are able to fulfil this need by leasing the optimum and most efficient tank for the
scheduled business.
Lessors additionally enable operators to grow their business without expending capital,
enabling the operator to invest in efficient management systems and remain competitive
with other less environmentally efficient forms of transportation. The bulk procurement of
tank containers by lessors enables manufacturers to gear their production to maximum
efficiency, reducing boom and bust cycles.
Like operators, lessors manage their tank inventories by investing in expert management
and computer systems and engaging tank service providers in the region of need.

11 October 2011
4.4 Tank Service Providers
Tank service providers (TSPs) provide the facilities and expertise to store and maintain tanks
in safe working condition. A worldwide network of depots ensures that a facility is available
within the region of demand.
TSPs have invested heavily in new technology to clean tanks with high pressure automated
jets that conserve water. Effluents are managed in automated treatment plants using
biodegradable flocculants to accelerate the separation of suspended solids, enabling waste
water to be recycled with only the minimal loss. With remaining treated waste at a
minimum, it is being disposed through highly regulated facilities.
An inventory of replacement parts are held on site to ensure the minimum downtime. Tank
containers are increasingly designed to standardize parts required. Replacement seals and
gaskets are almost all standard dimensions.
Tanks, being a modular dimension, are stored in depots in stacks up to seven high. This
considerably reduces the area required for storage. At times of high activity, e.g. when a
ship has berthed, depots manage incoming and outgoing traffic to reduce truck waiting
times and thereby reduce fuel use.
Health and safety are paramount. TSPs invest in training of their personnel and ensure work
is undertaken in accordance with the
regulations. A skilled workforce is
continuously developed to maintain the
necessary high standards. Many depots are
have been accredited to ISO 9001 quality
systems.
4.5 Inspection
Safety is paramount and the tank container is
highly regulated with exacting international
and regional regulatory standards including
UN, IMDG, ADR, RID, CFR49.
Compliance entails independent assessment from design approval and prototype testing,
inspection and testing at manufacture and retesting at 30 month periods throughout the
tanks working life. Furthermore, operators, manufacturers, lessors and TSPs are required to
meet international standards such as SQAS, Responsible Care and ISO 9001 and inspection
companies are engaged to undertake independent audits.
The regulations ensure that tank containers are operated to the highest standards of safety
protecting personnel and the public. Safe operation is the most efficient operation. The
highly regulated industry requires that Inspection Companies locate their personnel in
strategic locations. This ensures minimal travel costs and reduces the environmental effect
of travel. Local inspectors can promptly respond to the tank operators significantly reducing
tank container downtime.
12 October 2011
5 Eco-impact of tank containers
Where and how do Tank containers affect the environment? This chapter explores answers
to that question, looking at carbon footprints and all environmental impacts of a shipment
from China to Europe. Then it considers general variations in transport footprints. The next
chapter explores how tank containers help minimise this environmental impact.
5.1 Carbon footprint: tank container shipment from China to Europe
Carbon footprints are surely the best-known measure of environmental impact. A carbon
footprint represents the sum of all ‘carbon’ – short for greenhouse gases, the primary one
being carbon dioxide – emitted over the lifetime of a product. Lifetime includes extraction
of raw materials, manufacturing, distribution, use and disposal, often expressed as ‘cradle-
to-grave’ coverage. The common unit of a footprint is CO2e, meaning carbon-dioxide-
equivalents, usually expressed in g, kg or tonnes. Footprints have been estimated for many
products and services, from average European passenger-car transport (current footprint
around 180 g CO2e/km) to production of potato crisps (around 75g CO2e for a 33.5g packet
of potato crisps, including the packaging).
What is a tank container’s footprint? For a typical 24-tonne shipment, originating in China
and terminating in Western Europe, the carbon footprint is 422 g CO2e per kg of product
shipped (or about 19.5 g CO2e per tonne-kilometre). This is smaller than the footprint of
manufacturing, say, a chemical – where production footprints generally fall in the range of
1-4 kg CO2e per kg of product. This footprint can be disaggregated in three ways: by
function, by life-cycle phase and by greenhouse-gas.
5.1.1 By function
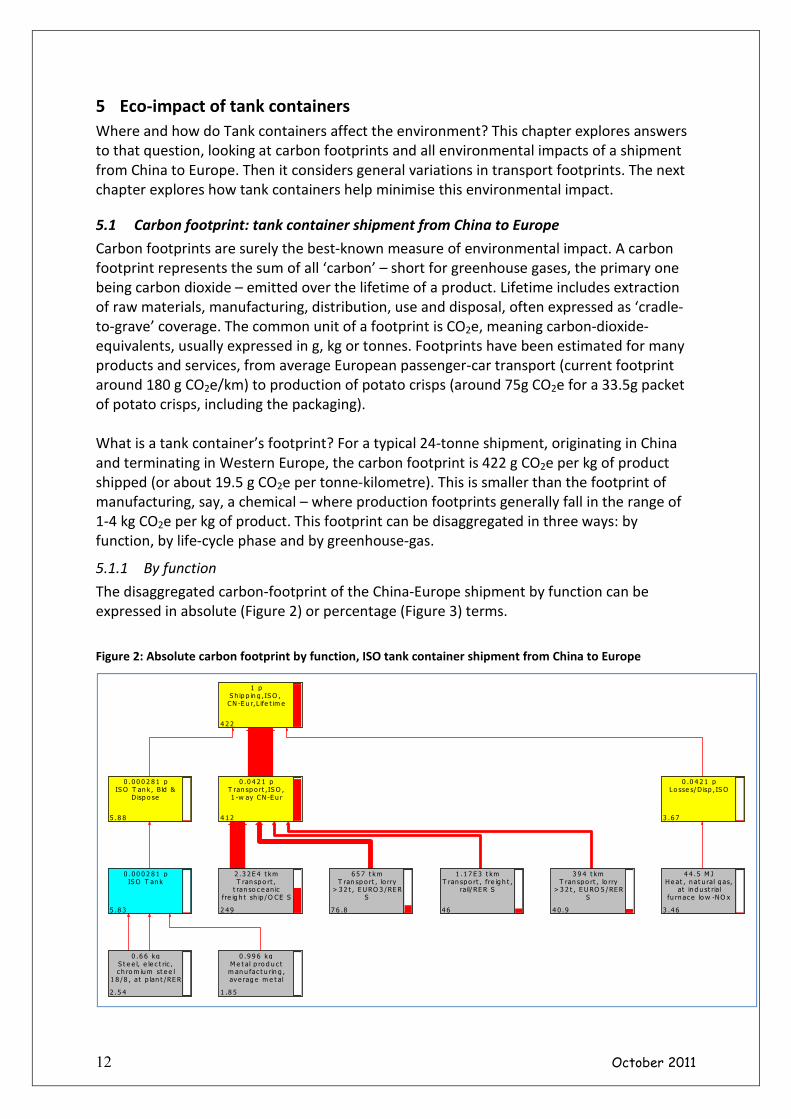
The disaggregated carbon-footprint of the China-Europe shipment by function can be
expressed in absolute (Figure 2) or percentage (Figure 3) terms.
Figure 2: Absolute carbon footprint by function, ISO tank container shipment from China to Europe
0 .6 6 kgS t e e l, e le c t ric ,c h ro m ium st e e l
1 8 /8 , a t p lan t /RE R
2 .5 4
4 4 .5 M JHe at , n at u ral g as,
at in d u st ria lfu rn ac e lo w -NO x
3 .4 6
2 .3 2 E 4 t kmT ran sp o rt ,
t ran so c e an icfre ig h t sh ip /O CE S
2 4 9
1 .1 7 E 3 t kmT ran sp o rt , fre ig h t ,
ra il/ RE R S
4 6
6 5 7 t kmT ran sp o rt , lo rry
> 3 2 t , E U RO 3 /RE RS
7 6 .8
3 9 4 t kmT ran sp o rt , lo rry
> 3 2 t , E U RO 5 /RE RS
4 0 .9
0 .9 9 6 kgM e t al p ro d u c tm an u fac t u rin g ,ave rag e m e t al
1 .8 5
1 pS h ip p in g ,IS O , CN -E u r,L ife t im e
4 2 2
0 .0 0 0 2 8 1 pIS O T an k , B ld &
D isp o se
5 .8 8
0 .0 4 2 1 pT ran sp o rt ,IS O ,1 -w ay CN -Eu r
4 1 2
0 .0 4 2 1 pLo sse s/D isp , IS O
3 .6 7
0 .0 0 0 2 8 1 pIS O T an k
5 .8 3
13 October 2011
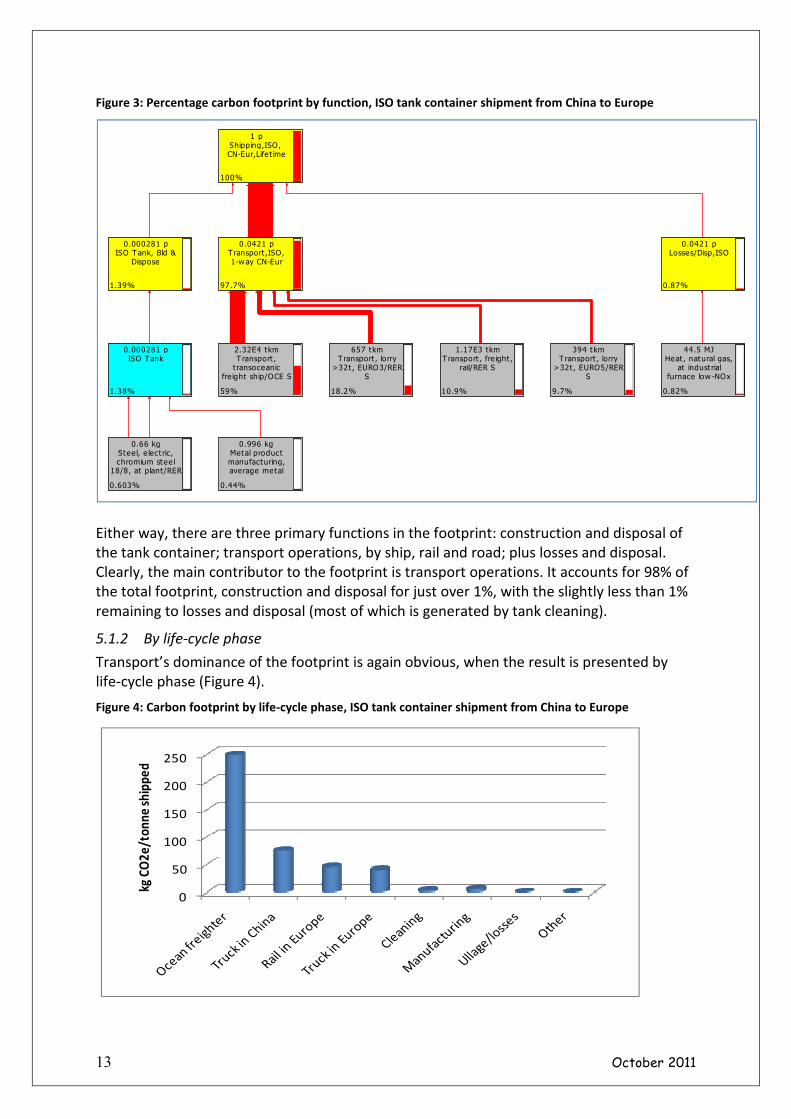
Figure 3: Percentage carbon footprint by function, ISO tank container shipment from China to Europe
Either way, there are three primary functions in the footprint: construction and disposal of
the tank container; transport operations, by ship, rail and road; plus losses and disposal.
Clearly, the main contributor to the footprint is transport operations. It accounts for 98% of
the total footprint, construction and disposal for just over 1%, with the slightly less than 1%
remaining to losses and disposal (most of which is generated by tank cleaning).
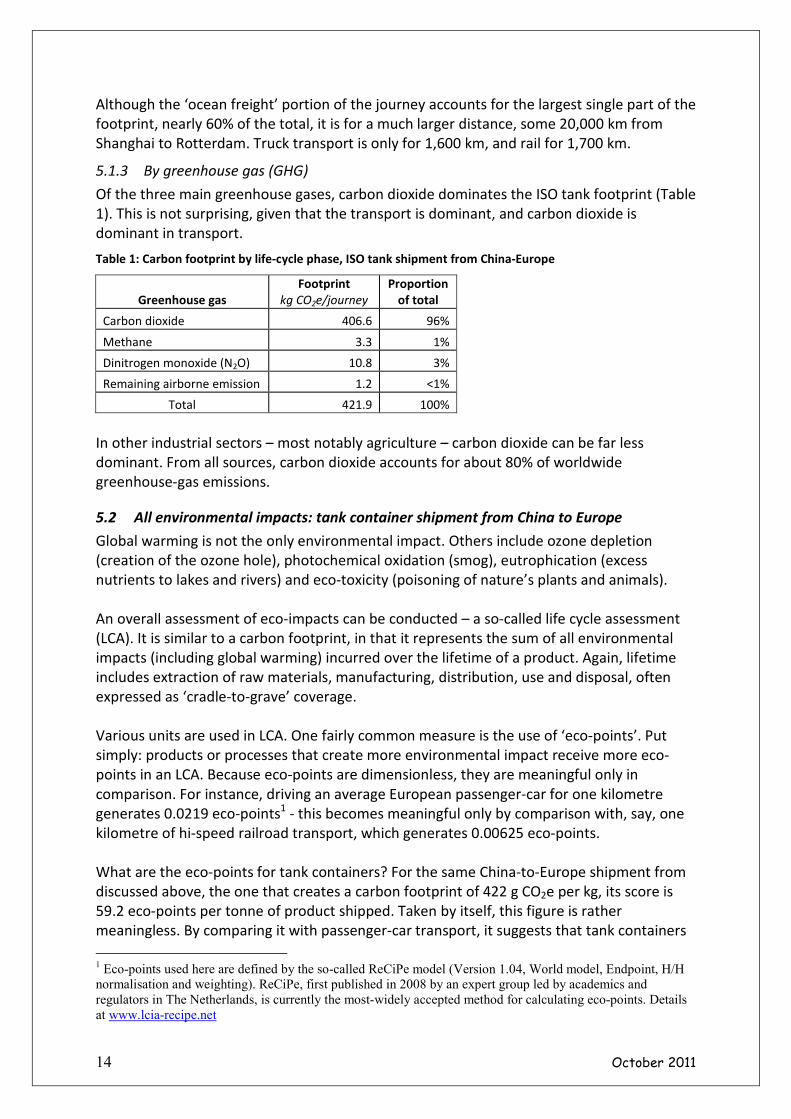
5.1.2 By life-cycle phase
Transport’s dominance of the footprint is again obvious, when the result is presented by
life-cycle phase (Figure 4).
Figure 4: Carbon footprint by life-cycle phase, ISO tank container shipment from China to Europe
0
50
100
150
200
250
kg C
O2
e/t
on
ne
sh
ipp
ed
0.66 kgSteel, e lect ric,chromium stee l
18/8, at plant/RER
0.603%
44.5 MJHeat , natural gas,
at indust rialfurnace low -NOx
0.82%
2.32E4 tkmT ransport ,
t ransoceanicfreight ship/OCE S
59%
1.17E3 tkmT ransport , fre ight ,
rail/RER S
10.9%
657 tkmT ransport , lorry
>32t , EURO3/RERS
18.2%
394 tkmT ransport , lorry
>32t , EURO5/RERS
9.7%
0.996 kgMetal productmanufacturing,average metal
0.44%
1 pShipping,ISO, CN-Eur,Life t ime
100%
0.000281 pISO Tank, Bld &
Dispose
1.39%
0.0421 pT ransport ,ISO,1-w ay CN-Eur
97.7%
0.0421 pLosses/Disp,ISO
0.87%
0.000281 pISO Tank
1.38%
14 October 2011
Although the ‘ocean freight’ portion of the journey accounts for the largest single part of the
footprint, nearly 60% of the total, it is for a much larger distance, some 20,000 km from
Shanghai to Rotterdam. Truck transport is only for 1,600 km, and rail for 1,700 km.
5.1.3 By greenhouse gas (GHG)
Of the three main greenhouse gases, carbon dioxide dominates the ISO tank footprint (Table
1). This is not surprising, given that the transport is dominant, and carbon dioxide is
dominant in transport.
Table 1: Carbon footprint by life-cycle phase, ISO tank shipment from China-Europe
Greenhouse gas
Footprint
kg CO2e/journey
Proportion
of total
Carbon dioxide 406.6 96%
Methane 3.3 1%
Dinitrogen monoxide (N2O) 10.8 3%
Remaining airborne emission 1.2 <1%
Total 421.9 100%
In other industrial sectors – most notably agriculture – carbon dioxide can be far less
dominant. From all sources, carbon dioxide accounts for about 80% of worldwide
greenhouse-gas emissions.
5.2 All environmental impacts: tank container shipment from China to Europe
Global warming is not the only environmental impact. Others include ozone depletion
(creation of the ozone hole), photochemical oxidation (smog), eutrophication (excess
nutrients to lakes and rivers) and eco-toxicity (poisoning of nature’s plants and animals).
An overall assessment of eco-impacts can be conducted – a so-called life cycle assessment
(LCA). It is similar to a carbon footprint, in that it represents the sum of all environmental
impacts (including global warming) incurred over the lifetime of a product. Again, lifetime
includes extraction of raw materials, manufacturing, distribution, use and disposal, often
expressed as ‘cradle-to-grave’ coverage.
Various units are used in LCA. One fairly common measure is the use of ‘eco-points’. Put
simply: products or processes that create more environmental impact receive more eco-
points in an LCA. Because eco-points are dimensionless, they are meaningful only in
comparison. For instance, driving an average European passenger-car for one kilometre
generates 0.0219 eco-points1 - this becomes meaningful only by comparison with, say, one
kilometre of hi-speed railroad transport, which generates 0.00625 eco-points.
What are the eco-points for tank containers? For the same China-to-Europe shipment from
discussed above, the one that creates a carbon footprint of 422 g CO2e per kg, its score is
59.2 eco-points per tonne of product shipped. Taken by itself, this figure is rather
meaningless. By comparing it with passenger-car transport, it suggests that tank containers
1 Eco-points used here are defined by the so-called ReCiPe model (Version 1.04, World model, Endpoint, H/H
normalisation and weighting). ReCiPe, first published in 2008 by an expert group led by academics and
regulators in The Netherlands, is currently the most-widely accepted method for calculating eco-points. Details
at www.lcia-recipe.net
15 October 2011
create an order-of-magnitude less environmental impact2. Still, this comparison is of limited
value, because tank containers and passenger cars are not competing modes of transport.
A more useful application of eco-points, in this instance, is to measure them by percentage
throughout the ISO tank lifetime (Figure 5). This shows that the distribution of overall eco-
impacts is almost identical to that of the carbon footprint (Figure 3).
Figure 5: Percentage total eco-impact by function, ISO Tank shipment from China to Europe
What this means is that, for an ISO tank, a carbon footprint is an excellent proxy for overall
eco-impact. So, rather than using eco-points to discuss an ISO tank’s environmental impact,
carbon footprints will do the job just as well – and they are more understandable to non-
specialist audiences.
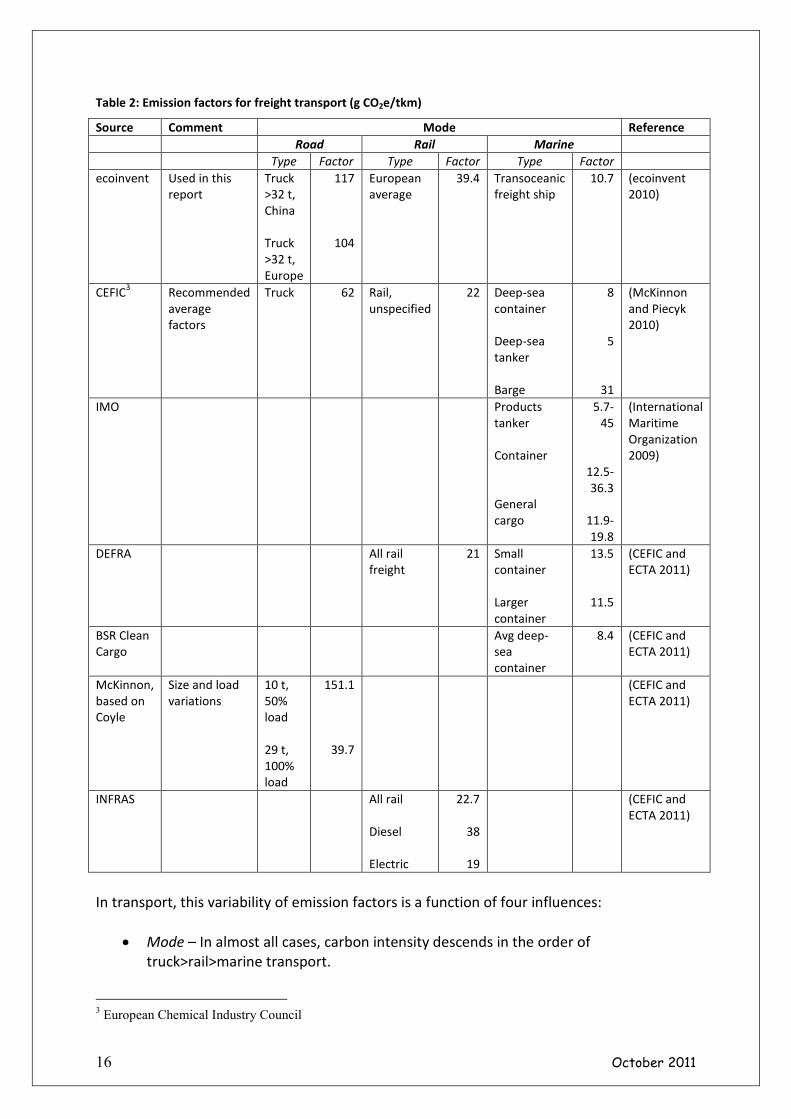
5.3 Variations in transport footprints
For the China-to-Europe journey described above, the carbon footprint has been compiled
from the ecoinvent database (ecoinvent 2010), with particular reliance on its transport
modules (ecoinvent 2007). Why ecoinvent? Of the available databases for carbon footprints
and life-cycles assessments, ecoinvent is clearly the most authoritative and comprehensive,
and it is probably the most-used by environmental analysts.
Although ecoinvent is most authoritative, its assignation of precise figures – for instance in
Table 1 and throughout the above text – belie the inherent variation of carbon footprint
data. Clearly, there is a broad spread among reported figures (Table 2).
2 A typical passenger car weighs about one tonne. So comparing the eco-points per tonne-kilometre, the ISO
Tank’s impact is about one-tenth that of the passenger car.
0.66 kgSteel, electric,chromium steel
18/8, at
0.621%
44.5 MJHeat, natural gas,
at industrialfurnace low-NOx
0.745%
2.32E4 tkmTransport,
transoceanicfreight ship/OCE
62%
1.17E3 tkmTransport,
freight, rail/RER S
9.58%
657 tkmTransport, lorry
>32t,EURO3/RER S
17.3%
394 tkmTransport, lorry
>32t,EURO5/RER S
8.97%
0.996 kgMetal productmanufacturing,average metal
0.456%
1 pShipping,ISO, CN-Eur,Lifetime
100%
0.000281 pISO Tank, Bld &
Dispose
1.39%
0.0421 pTransport,ISO,1-way CN-Eur
97.8%
0.0421 pLosses/Disp,ISO
0.758%
0.000281 pISO Tank
1.39%
16 October 2011
Table 2: Emission factors for freight transport (g CO2e/tkm)
Source Comment Mode Reference
Road Rail Marine
Type Factor Type Factor Type Factor
ecoinvent Used in this
report
Truck
>32 t,
China
Truck
>32 t,
Europe
117
104
European
average
39.4 Transoceanic
freight ship
10.7 (ecoinvent
2010)
CEFIC3 Recommended
average
factors
Truck 62 Rail,
unspecified
22 Deep-sea
container
Deep-sea
tanker
Barge
8
5
31
(McKinnon
and Piecyk
2010)
IMO Products
tanker
Container
General
cargo
5.7-
45
12.5-
36.3
11.9-
19.8
(International
Maritime
Organization
2009)
DEFRA All rail
freight
21 Small
container
Larger
container
13.5
11.5
(CEFIC and
ECTA 2011)
BSR Clean
Cargo
Avg deep-
sea
container
8.4 (CEFIC and
ECTA 2011)
McKinnon,
based on
Coyle
Size and load
variations
10 t,
50%
load
29 t,
100%
load
151.1
39.7
(CEFIC and
ECTA 2011)
INFRAS All rail
Diesel
Electric
22.7
38
19
(CEFIC and
ECTA 2011)
In transport, this variability of emission factors is a function of four influences:
• Mode – In almost all cases, carbon intensity descends in the order of
truck>rail>marine transport.
3 European Chemical Industry Council

17 October 2011
• Definition of the transport – is it an average or a more-specific measure, is it global
or regional, is it an average of several types (say, all ocean-going ships)? What load-
factors and repositioning movements are assumed?
• Performance – fuel efficiency, hence emissions intensity, can vary significantly by
vehicle type and technology. Operating conditions and maintenance regimes often
influence performance as well.
• Measurement – actual versus imputed values can differ. These differences,
however, are usually smaller than those caused by definitions and performance.
18 October 2011
6 How ISO tank containers make transport more sustainable
Two aspects of tank containers make them most sustainable than some competing
transport options. One, using an ISO tank operator rather than dedicated transport can
reduce deadhead journeys significantly. Two, tank containers are inherently multi-modal,
which can be far-less carbon intensive than mono-modal trucking, steel drums and even rail
transport. These aspects, and their benefits, are detailed in the following subsections.
6.1 Reduction of deadhead trips
Tank operators (see section 4.1) typically manage a fleet of containers that serve a variety of
customers. Because the containers are readily cleaned and are uniform, it is easy for them
to go from one cargo to another completely-different one. This flexibility is critical to
operators, who want to minimise empty journeys out of their own and their customers’
economic interest. Avoiding deadheads is also in everyone’s environmental interest.
For marine tankers shipping liquid cargoes, deadheading or partial-load journeys are
common. According to (International Maritime Organization 2009, Table 9.1, page 131), load
factors4 for tankers are around 50%, while those for tank operators are 85% (Table 3).
Table 3: Load factors for cargo shipping, by type
Type of shipping Average load factor
Crude oil tanker 48%
Products tanker 45-55%
Chemical tanker 64%
LPG tanker 48%
LNG tanker 48%
Container 70%
ISO tank operators 85%
How does this work in practice? Take, for example, a Glasgow-Melbourne route travelled by
a Scottish exporter of whisky to Australia. If whisky is shipped one-way and the tank
container is returned empty to Scotland, the resulting footprint is 318 kg CO2e per tonne of
whisky. If, instead of returning empty, a cargo of wine is picked up in Australia and returned
to the UK, the resulting footprint per tonne of whisky/wine shipped is about 15% lower.
6.2 Ease of multi-modal transport
Tank containers are inherently multi-modal, transferring easily and quickly from ships to
barges to rail to road. Being able to travel on the water can significantly reduce a journey’s
footprint. For example, the footprint of a cargo shipped by sea from Le Havre (France) to St
Petersburg (Russia) is nine times lower than by road. If it goes by rail, the footprint is about
five times lower than by road. This order-of-magnitude difference applies to most any
journey where either water, rail or road transport are viable options.
Multi-modal transport’s advantage is its flexibility. For instance, tank containers recently
have been shipped from Antwerp to central Asia by rail, rather than by ship and truck. It is
possible that this first option generates a lower footprint, and in any case, these sorts of
multi-modal shipments are less accessible when shipping in bulk.
4 IMO calls them capacity utilization

19 October 2011
7 Areas for possible improvement
As the world’s population and temperature continue to rise, so too will popular pressure for
more sustainability. While details of “what-should-be-done” and “how-to-do-it” are still very
debatable, one trend is fairly clear: de-carbonisation. Industries, institutions and individuals
will be expected to cut their carbon footprints. Freight transport generates some 10% of all
greenhouse-gas emissions, so along with other sectors, it will be pushed – formally and
informally – to decarbonise. One researcher (Lindstad, Asbjornslett et al. 2011, p 3456)
estimates that carbon emissions (per ton-kilometre) for sea transport will need to fall by
2050 to 20% of their current level.
Tank containers are already part of this trend. Owners and operators are steadily working to
improve economic efficiency, which as a side effect also lowers carbon emissions.
So, what can the tank container industry do above what it is doing already? There is no
‘single solution’, no secret formula that will deliver major reductions. However, there are
several actions that might be explored, three of them internal to ITCO members and two of
them affecting the freight industry as a whole.
7.1 ITCO-internal actions
There are three areas that might be explored. One of these relates to tank container design,
one to modal optimisation and one to emissions measurement.
7.1.1 Reduction in tare weight, increase in capacity
In any transport mode, more weight equals more carbon. For example in road transport,
weight reduction has been a leading factor in carbon-efficiency improvements of the past
several decades. As noted earlier (see
section 4.1), tank container tare
weight has been reduced commonly
by 10%, and capacities have increased
within the same ISO frame. The
standard 25,000 litre capacity is 20%
larger and built to a higher standard
of safety than those common in the
1970s.
It would be useful for ITCO to:
quantify the tare weight and capacity
trends in tank containers; and explore
the potential for future reductions.
7.1.2 Improved aerodynamics
In freight transport by road, aerodynamic drag accounts for about one-third of a vehicle’s
energy consumption. According to a study for the UK Department for Transport (Baker,
Cornwell et al. 2010), a ‘typical’ aerodynamic improvement package costing some $5,000
per new trailer could cut carbon emissions by about 10%. For existing cabs and trailers,
aftermarket packages costing $500-2500 can cut carbon by 0.1-6.5%.

20 October 2011
It would be useful for ITCO to investigate the technical feasibility, economics and carbon
benefits of improving tank container aerodynamics.
7.1.3 Modal optimisation
As noted previously, carbon intensity of transport generally descends in the order of
truck>rail>marine modes. In other words, the carbon footprint of shipping X tonne-
kilometres by sea will be less than by rail, and both will be less than by road.
Where this gets tricky is in (potentially) multi-modal transport. For instance, should a
shipment from Western Europe to central Asia go via rail or via a combination of sea and
road?
The economics of such movements are regularly analysed by tank container operators, with
an eye to optimising the costs and
benefits. It would be useful for
ITCO to investigate the feasibility
of including ‘carbon optimisation’
in such analyses.
7.1.4 Improved emission-factor
datasets
Carbon footprints are estimated
via input-output models (see
Section 5.1) that rely heavily on
emission factors for various
processes. A carbon emission
factor is typically expressed as X
units of CO2e (carbon dioxide
equivalent) per unit of function.
For instance, the emission factor
of a new European automobile’s is
around 150 g CO2e per kilometre driven.
Emission factors for various processes are published by researchers and government
agencies, and they are compiled in databases such as ecoinvent. Although in many cases the
available emission factors are sufficient to drive decisions, researchers readily admit that
they could and should be improved (see Section 5). Three main deficiencies are evident:
• Data-gaps – emission factors for many processes are unavailable. Carbon
footprinting is a relatively new discipline, dating back probably about 20 years. For
many processes – say, transport via tank container – no standard factors are
available. For others, published factors sometimes are out-of-date.
• Inappropriate scope – published factors sometimes are over-aggregated or under-
aggregated for particular analyses. For instance, general ‘road freight’ factors of 127-
156 g CO2e/tonne-kilometre are cited by (International Maritime Organization 2009,
Table 9.2), while work commissioned by CEFIC (McKinnon and Piecyk 2010, Table 8)
recommends an average factor of 62 g CO2e/tonne-kilometre. Reasons for the
difference are not entirely clear, but probably due to relative over-aggregation by
IMO and under-aggregation by CEFIC. An example of under-aggregation is in power-

21 October 2011
generation emission factors. Factors of g CO2e per kWh vary dramatically by country
and by fuel type, yet finding a European average for them can be challenging.
• Lack of transparency – many, if not most, published factors are unclear about vehicle
type, fuel type and load factors (both percentage loads and repositioning distances).
To address these deficiencies, ITCO or its members might consider publishing its own factors
for transport via tank containers. This would not contribute directly to de-carbonisation, but
it would help actual de-carbonisation to be measured properly and not be confused with
mis-measurement.
7.2 ITCO-external actions
There are two areas that might be explored. One is a general ‘watching brief’ on industry
trends; the other relates specifically to operations.
7.2.1 Watching brief: efforts to measure and reduce shipping emissions
To be competitive, transport operators and vehicle suppliers are naturally inclined to de-
carbonise, mainly by improving efficiency. ITCO members already do this (see above),
through research and development sponsored individually, through governments and trade
associations. It might make sense to formalise ITCO’s role in this by assigning to a specific
person or group a watching brief:
a periodic survey of trends and
policies in this area. This probably
would entail a periodic review of
reports from governments and
trade associations.
7.2.2 Reductions in marine travel
speed
One option for cutting marine-
shipping carbon emissions not
mentioned by the IMO
(International Maritime
Organization 2009) is that of
reducing average speeds. A recent
study by the Norwegian Institute
of Marine Technology (Lindstad,
Asbjornslett et al. 2011) estimates that cost-neutral speed reductions5 would reduce marine
carbon emissions by 28%. At the same time, to maintain capacity, this reduction would
require a 19% increase in the shipping fleet.
Clearly, this sort of step change would require far more support than that of ITCO.
Nonetheless, its promise of de-carbonisation coupled with industry growth is surely worth
further investigation.
5 Cost-neutral meaning that shipping times would be increased only as much as could be saved by increases in
fuel economy.

22 October 2011
8 References
Baker, H., R. Cornwell, et al. (2010). Review of low carbon technologies for heavy goods
vehicles, Sponsored by UK Dept Transport.
CEFIC and ECTA (2011). Guidelines for Measuring and Managing CO2 Emission from
Freight Transport Operations Sponsored by CEFIC, ECTA.
ecoinvent (2007). Transport services.
ecoinvent (2010). LCI Database. St Gallen, Switzerland. Current database is V 2.2.
International Maritime Organization (2009). Second IMO GHG Study 2009. London,
International Maritime Organization.
Lindstad, H., B. E. Asbjornslett, et al. (2011). "Reductions in greenhouse gas emissions and
cost by shipping at lower speeds." Energy Policy 39: 3456-3464.
McKinnon, A. and M. Piecyk (2010). Measuring and managing CO2 emissions of european
chemical transport, Sponsored by CEFIC.