tank cleaning in the baltic sea - merikotka · tank cleaning in the baltic sea – assessment of...
TRANSCRIPT
TANK CLEANING IN THE BALTIC SEA –
ASSESSMENT OF THE ECOTOXICITY OF TANK
CLEANING EFFLUENTS
Milja Honkanen
Jani Häkkinen
Antti Posti
TURUN YLIOPISTON
MERENKULKUALAN KOULUTUS- JA TUTKIMUSKESKUKSEN JULKAISUJA
PUBLICATIONS FROM THE CENTRE FOR MARITIME STUDIES
UNIVERSITY OF TURKU
A 63
2012

TURUN YLIOPISTON
MERENKULKUALAN KOULUTUS- JA TUTKIMUSKESKUKSEN JULKAISUJA
PUBLIKATIONER AV SJÖFARTSBRANSCHENS UTBILDNINGS- OCH
FORSKNINGSCENTRAL VID ÅBO UNIVERSITET
PUBLICATIONS FROM THE CENTRE FOR MARITIME STUDIES
UNIVERSITY OF TURKU
A 63
2012
TANK CLEANING IN THE BALTIC SEA –
ASSESSMENT OF THE ECOTOXICITY OF
TANK CLEANING EFFLUENTS
Milja Honkanen
Jani Häkkinen
Antti Posti
Turku 2012
JULKAISIJA / PUBLISHER:
Turun yliopisto / University of Turku
MERENKULKUALAN KOULUTUS- JA TUTKIMUSKESKUS
CENTRE FOR MARITIME STUDIES
Käyntiosoite / Visiting address:
ICT-talo, Joukahaisenkatu 3-5 B, 4.krs, Turku
Postiosoite / Postal address:
FI-20014 TURUN YLIOPISTO
Puh. / Tel. +358 (0)2 333 51
http://mkk.utu.fi
Kopijyvä Oy
Kouvola 2012
ISBN 978-951-29-5173-4 (paperback)
ISBN 978-951-29-5174-1 (PDF)
ISSN 1456–1816
FOREWORD
Far more studies have been conducted on the risks of marine transport of oil than on the
risks arising from chemical transportation. Furthermore, most of the studies dealing
with either oil or chemical shipping are focused on large spills resulting from shipping
accidents. Studies on the impacts of chronic pollution from routine shipping operations,
such as tank cleaning and bilge water handling are relatively scarce – particularly
regarding chemicals. This is partly due to the “invisible” nature of operational
discharges. The amounts of hazardous substances that are released at a time are
relatively small and the consequences cannot be seen instantly. In contrast, a spill from
a disastrous shipping accident may be over a thousand tonnes at worst, and the
consequences can typically be seen immediately (e.g. surfacing of dead fish). All in all,
due to its invisibility, the issue of chronic pollution resulting from operational
discharges has been, at least to some degree, overlooked by both researchers and the
shipping industry. This report reviews the environmental impacts of operational
discharges resulting from tank cleaning.
This study was conducted as a part of the Chembaltic (Risks of Maritime Transportation
of Chemicals in Baltic Sea) project which gathers information on chemicals transported
in the Baltic Sea. The Chembaltic project is implemented in co-operation with the
University of Turku Centre for Maritime Studies, Aalto University and Kotka Maritime
Research Centre. The project is funded by the European Regional Development Fund
(ERDF) and the Finnish Funding Agency for Technology and Innovation (Tekes) as
well as the following companies and agencies: Neste Oil Oyj, Vopak Chemicals
Logistics Finland Oy, Port of HaminaKotka Ltd, Crystal Pool Ltd, and the Finnish
Transport Safety Agency (Trafi). The project has also been supported by the Finnish
Port Association and the Finnish Shipowners Association.
The authors of the report would like to thank Jyrki Vähätalo from the Finnish Transport
Safety Agency (Trafi), Crystal Pool Ltd and MARPOL surveyors Pentti Keskitalo and
Laila Carlson for informative discussions on different aspects of tank cleaning. Further,
the authors would like to thank the project partners and the steering group of the
Chembaltic project. Lastly, M.Sc. Irina Wahlström and M.Sc. (Tech.) Olli-Pekka
Brunila are acknowledged for reviewing the report.
Kotka, 8 October 2012
The Authors
The Centre for Maritime Studies, University of Turku
FUNDING PROVIDERS AND PARTNERS OF THE CHEMBALTIC PROJECT
ABSTRACT
This study was conducted as a part of the Chembaltic project which gathers information
on chemicals transported in the Baltic Sea and the risks they present to the environment.
In this study, the environmental risks of tank cleaning waters were evaluated by
conducting a literature survey and a small-scale risk assessment of five target chemicals
following EU methodology laid down in the Technical Guidance Document on Risk
Assessment where applicable. The target chemicals were chosen based on existing
studies and projects where chemicals were ranked by their hazardousness in the aquatic
environment and their shipping volumes in the Baltic Sea. The selected chemicals were
nonylphenol ethoxylate (nonylphenol), phenol, sulphuric acid, styrene and xylenes.
In the risk assessment carried out for this study, the Predicted Environmental
Concentrations (PECs) of all five target chemicals were determined. The PECs were
calculated based on the residual cargo quantity that was estimated to remain in a tank
after unloading (=strip) and the water quantity that is used in the cleaning process. The
cargo residue that remains in a tank after unloading depends not only on the cargo
characteristics but also on the size of the tank and the stripping technique used in a
particular ship. Therefore, the PECs were calculated for a hypothetical 1,000 m3 tank
using three different strip sizes: 15 litres, 50 litres and 300 litres. The 15-litre and 50-
litre strips are more or less typical for modern tankers. The PECs were calculated with
and without the dilution effect caused by prewashing to evaluate the importance of these
mandatory in-port prewashes. The PECs obtained for the target chemicals were
compared to their corresponding Predicted No Effect Concentrations (PNECs), which
were derived from toxicity data in the available literature. Whenever the calculated
PEC/PNEC ratio exceeds 1, a risk is indicated.
The results of the risk assessment clearly demonstrated the importance of prewashing
cargo tanks ashore before the main washing. Without prewashing the cargo tanks and
discharging the generated prewashing effluents into reception facilities ashore, the
PEC/PNEC ratios obtained for further washings exceed 1 regardless of the chemical and
the quantity of chemical residue (15/50/300 litres). In contrast, if the cargo tanks are
prewashed and the remaining prewash residues in the tanks are small (≤ 15 l), the risk
arising from tank cleaning effluents stays at accepted levels, and no significant harm
seems to be caused to aquatic organisms. When the prewash residue is around 50 litres,
the risk arising from further washings mostly remains at accepted levels as well.
Whenever the prewashing is carried out properly, the tank washings only represent a
very minor and local risk for water biota. The results of the study showed that
prewashing requirements for the most hazardous category of X cargoes and high-
viscosity and solidifying Y cargoes are without a doubt necessary to keep the hazards
arising from these substances at accepted levels. Further, MARPOL Y class also
includes persistent and toxic chemicals whose release in the sea without prewashing is
not recommended, even if the regulations might not necessarily require prewashing.
Since this study was conducted by modelling, more research is needed e.g. to measure
the actual chemical concentrations in the sea after release of tank washings.
TIIVISTELMÄ
Tutkimus on tehty osana Chembaltic-hanketta, jonka tavoitteena on kerätä tietoa
Itämerellä kuljetettavien kemikaalien riskeistä. Tässä tutkimuksessa
kemikaalisäiliöalusten pesuvesien ympäristölle aiheuttama riski arvioitiin viiden
tutkitun kemikaalin osalta noudattamalla ja soveltamalla EU:n teknisiä
ympäristöriskinarviointiohjeita. Arvioidut kemikaalit valittiin huomioiden aiemmin
tehdyt tutkimukset, joissa kemikaalit on laitettu järjestykseen ympäristövaarallisuutensa
ja Itämerta koskevien kuljetusmäärätietojensa perusteella. Tutkimuksessa arvioiduiksi
kemikaaleiksi valikoituivat nonyylifenolietoksylaatti (nonyylifenoli), fenoli, rikkihappo,
styreeni ja ksyleenit.
Riskinarvioinnin alkuvaiheessa tutkituille viidelle kemikaalille määritettiin ennustettu
pitoisuus ympäristössä (PEC). PEC-arvo laskettiin lastin tyhjennyksestä jäljelle jäävän
kemikaalin määrän (strip eli jäännös) ja tankkien puhdistukseen käytettävän pesuveden
määrän perusteella. Kemikaalijäännöksen määrään vaikuttavat paitsi lastin
ominaisuudet, myös säiliön koko ja käytettävä aluskohtainen strippaustekniikka. Tämän
vuoksi PEC laskettiin hypoteettiselle 1 000 m3 säiliölle sekä kolmelle eri
kemikaalijäännökselle: 15 litraa, 50 litraa ja 300 litraa. Moderneissa aluksissa 15 l ja 50
l jäännökset ovat tyypillisiä. PEC-arvo laskettiin tutkituille kemikaaleilla sekä ilman
esipesua että esipesu huomioiden, mikä mahdollisti satamien suorittamien esipesujen
merkityksen arvioimisen ympäristölle aiheutuvien riskien kannalta.
Tutkituille kemikaaleille laskettua PEC-arvoa verrattiin EU-menetelmällä laskettuun
ennustettuun vaikutuksettomaan pitoisuuteen (PNEC), joka perustuu kirjallisuudesta
kerättyihin arvoihin eri kemikaalien ekotoksisuudesta. EU-ohjeistuksen mukaan aina,
kun laskettu PEC / PNEC-suhde on suurempi kuin 1 on olemassa riski ympäristölle. Nyt
toteutetun riskinarvioinnin tulokset korostavat selvästi satamassa suoritettavan esipesun
ja siinä syntyvien jätteiden maihin jättämisen merkitystä ennen pääasiallista pesua ja
tästä syntyvien pesuvesien laskemista meriveteen. Ilman esipesua, saadut PEC/PNEC-
suhteet ylittävät arvon 1 – riippumatta kemikaalista tai näiden jäännösmääristä
(15/50/300 l). Sen sijaan, jos esipesu suoritetaan ja säiliön esipesujäännökset ovat hyvin
pieniä (≤ 15 l), pesuvesistä aiheutuvat päästöt pysyvät alle hyväksyttävän tason ja eikä
niistä näyttäisi aiheutuvan merkittävää haittaa vesieliöille. Myös silloin, kun
kemikaalijäännös on esipesun jälkeen noin 50 litraa, pesuvesistä aiheutuva riski pysyy
hyväksyttävällä tasolla.
Jos esipesu tehdään sääntöjen mukaisesti, kemikaalialusten pesuvedet muodostavat vain
hyvin vähäisiä ja paikallisia haittoja vesieliöille. Tutkimuksen tulokset osoittavat, että
esipesuvaatimukset vaarallisimman eli MARPOL X -luokan kemikaaleille sekä
kiinteytyville ja korkean viskositeetin kemikaaleille ovat perusteltuja. Lisäksi myös Y-
luokan kemikaaleissa esiintyy pysyviä ja myrkyllisiä yhdisteitä, joiden päästäminen
mereen ilman esipesua ei ole suositeltava, vaikka säännöt eivät tätä edellyttäisi.
Tutkimuksessa tulokset saatiin mallintamalla. Tulevaisuudessa tarvitaan lisää
tutkimusta esimerkiksi todellisista kemikaalipitoisuuksista meressä pesuvesien
purkamisen jälkeen.
TABLE OF CONTENTS
1 INTRODUCTION ................................................................................................... 9
2 GENERAL BACKGROUND ............................................................................... 12 2.1 The Baltic Sea – a particularly sensitive sea area .......................................... 12
2.2 Transportation of chemicals in the Baltic Sea ............................................... 13 2.3 MARPOL categorization of noxious liquid substances carried in bulk......... 15 2.4 Effects and behaviour of chemicals in the environment ................................ 16
2.4.1 Toxicity of a chemical ........................................................................ 18 2.4.2 Movements and distribution of a chemical in the (marine)
environment ........................................................................................ 19
3 TANK CLEANING IN PRACTICE .................................................................... 24 3.1 Cleaning and stripping ................................................................................... 24
3.2 Prewashing ..................................................................................................... 28 3.2.1 Solidifying and high-viscosity substances – definitions and prewash
requirements ....................................................................................... 29
3.3 Ventilation ...................................................................................................... 30
4 TANK CLEANING AND THE ENVIRONMENT ............................................ 32 4.1 Oil .................................................................................................................. 32
4.2 Chemicals ....................................................................................................... 35
5 EVALUATING THE ECOTOXICOLOGICAL EFFECTS OF TANK
CLEANING ........................................................................................................... 41 5.1 Target substances ........................................................................................... 42
5.1.1 Nonylphenol and nonylphenol ethoxylates ........................................ 45
5.1.2 Phenol ................................................................................................. 46 5.1.3 Sulphuric acid ..................................................................................... 47 5.1.4 Styrene ................................................................................................ 48 5.1.5 Xylenes ............................................................................................... 50
5.2 EU risk assessment ........................................................................................ 51
5.2.1 Predicted Environmental Concentration (PEC) ................................. 52 5.2.2 Predicted No Effect Concentration (PNEC) ...................................... 60
6 RESULTS ............................................................................................................... 63 6.1 PEC/PNEC ratios ........................................................................................... 63 6.2 Nonylphenol ................................................................................................... 64
6.2.1 Exposure (local PEC) ......................................................................... 64 6.2.2 Effects (PNEC for aquatic environment) ........................................... 65
6.2.3 Bioaccumulation ................................................................................ 65 6.2.4 Environmental fate and persistence ................................................... 65 6.2.5 PEC/PNEC ratio ................................................................................. 67
6.3 Phenol ............................................................................................................ 68 6.3.1 Exposure (local PEC) ......................................................................... 68 6.3.2 Effects (PNEC for aquatic environment) ........................................... 68 6.3.3 Bioaccumulation ................................................................................ 68
6.3.4 Environmental fate and persistence ................................................... 69 6.3.5 PEC/PNEC ratio ................................................................................. 69
6.4 Sulphuric acid ................................................................................................ 70 6.4.1 Exposure (local PEC) ......................................................................... 70 6.4.2 Effects (PNEC for aquatic environment) ........................................... 70
6.4.3 Bioaccumulation ................................................................................ 71 6.4.4 Environmental fate and persistence ................................................... 71 6.4.5 PEC/PNEC ratio ................................................................................. 72
6.5 Styrene ........................................................................................................... 72
6.5.1 Exposure (local PEC) ......................................................................... 72 6.5.2 Effects (PNEC for the aquatic environment) ..................................... 73 6.5.3 Bioaccumulation ................................................................................ 73
6.5.4 Environmental fate and persistence ................................................... 73 6.5.5 PEC/PNEC ratio ................................................................................. 74
6.6 Xylenes .......................................................................................................... 74 6.6.1 Exposure (local PEC) ......................................................................... 74
6.6.2 Effects (PNEC for aquatic environment) ........................................... 75 6.6.3 Bioaccumulation ................................................................................ 75 6.6.4 Environmental fate and persistence ................................................... 75
6.6.5 PEC/PNEC ratio ................................................................................. 76
7 SUMMARY AND CONCLUSIONS .................................................................... 78
REFERENCES ............................................................................................................. 84
Tank cleaning in the Baltic Sea – Assessment of the ecotoxicity of tank cleaning effluents 9
1 INTRODUCTION
The volume of marine shipping has increased significantly in the Baltic Sea in recent
years, and it is predicted to increase even further in the future. The Baltic Sea is, in fact,
one of the busiest seas in the world, and at any given time, approximately 2,000 sizeable
ships are estimated to sail on its routes. The ships sailing the Baltic Sea include large
passenger ferries, cargo vessels, and tankers carrying oil and other hazardous
substances. In 2009, 51% of these ships were cargo vessels, 17% tankers and 11%
passenger ferries (HELCOM 2010a). The traffic is busiest on major routes from ports in
the Gulf of Finland to the Danish straits, through which all ships entering and leaving
the Baltic Sea must travel (HELCOM 2009). The transport of hazardous substances
presents a great diversity of risks. First of all, because of the busy traffic, shallow depth,
narrow navigation routes, numerous islands, and ice cover during the winter period, the
risk of an accident in the Baltic Sea area while transporting chemicals is ever present.
Luckily, major chemical transportation accidents are very rare. In the Gulf of Finland,
for example, a collision involving a chemical tanker can only be expected to happen on
average once every 45 years (Sormunen 2012). In addition to unintended accidental
spills, chemicals may also be introduced in the marine environment deliberately within
the limits of the law. Releasing tank cleaning waters containing a chemical into the sea
is an example of an activity that falls within this category of “legal discharges”.
Chemical tankers can carry various kinds of hazardous substances including highly
toxic, flammable and/or corrosive chemicals, such as phenol, benzene and ammonia, but
they can also carry lighter products, such as ethanol and edible vegetable oils (Posti &
Häkkinen 2012). Consequently, cargo tanks need to be efficiently cleaned every time
after cargo unloading to avoid contamination of the following cargo and also to keep the
tanks and their associated pipelines in good condition (McGeorge 1995).
The cleaning of chemical tanks and the discharge of the resulting washings are
controlled by Annex II of the international convention MARPOL 73/781 – to which all
the Baltic Sea coastal countries (i.e. the HELCOM2
countries) are parties. Regulation 13
of the Annex states that any tank cleaning waters, or ballast waters, containing chemical
residues must be predominantly discharged into a reception facility at the port of
unloading – in other words, releasing these cleaning waters (or ballast waters containing
a chemical) in the sea is predominantly prohibited. The discharge of tank cleaning
effluents in the sea is only allowed if it is done strictly by the guidelines and criteria set
out in Annex II. For example, chemical concentrations in the washings must be within
the MARPOL limits, and washings can only be discharged in deep waters (MARPOL
Annex II reg. 13). In addition, for tanks having contained highly hazardous cargo or
certain solidifying or high-viscosity cargoes, the Annex requires mandatory in-port pre-
washes – where the slops generated during these prewashes must always be discharged
into reception facilities ashore (Kunichkin 2006, MARPOL Annex II reg. 13.6 and
13.7). In practice, only the prewash effluents are discharged to the shore reception
facilities, and the main washings are practically always discharged directly into the sea,
1 The International Convention for the Prevention of Pollution from Ships, 1973, as modified by the
Protocol of 1978 relating thereto (MARPOL 73/78). 2 HELCOM countries: Denmark, Estonia, Finland, Germany, Latvia, Lithuania, Poland, Russian
Federation and Sweden.
10 Honkanen, Häkkinen and Posti
as it is legal when accomplished as required in the Annex II. If the main slops were to
be discharged ashore as well, the costs would skyrocket, as the appropriate disposal and
handling of tank cleaning effluents is extremely expensive and time-consuming
(HELCOM 1993).
The amount of a chemical that may legally be released into the sea per cargo tank is 75–
300 litres depending on the ship’s construction year (Appendix 4 to MARPOL Annex
II). When chemical remnants are washed away with water, the total quantity of slop
generated per tank in the main washing procedure may vary from 10 m3 to hundreds of
cubic meters per tank (HELCOM 1993). This gives us a rough estimate of the amounts
of effluents that are released in the sea from a ship that typically has a capacity of 10–60
cargo tanks (Hänninen & Rytkönen 2006). In the Gulf of Finland, particularly in the
busy Hamina-Porvoo district, the shallow waters and the nearness of land rather limits
the possibilities of discharging tank cleaning effluents (HELCOM 1993). In the main
basin of the Baltic Sea where the waters become deeper, however, the releasing of tank
washings is not as restricted.
Even though MARPOL Annex II regulates tank cleaning and the disposal of cleaning
effluents to some extent, there are still gaps in our knowledge of how the discharged
substances behave once they are introduced in the sensitive marine environment and
what adverse effects they might have once there. In addition, when solvents or
detergents are used in tank cleaning, the resulting washings act as chemical mixtures
leading to the possibility of joint toxicity. With the continuously growing volumes of
chemical transportation in the Baltic Sea, it is important to evaluate all risk factors
relating to chemical shipping, including tank cleaning. Therefore, in this report, the
possible environmental effects of releasing tank cleaning waters into the Baltic Sea
ecosystem are evaluated based on a literature survey and a small-scale risk assessment
conducted for five target substances (nonylphenol ethoxylates, phenol, sulphuric acid,
styrene and xylenes) following the methodology set out in the Technical Guidance
Document of the EU on Risk Assessment (EC 2003) where applicable.
This report was written as part of the Chembaltic project (Risks of Maritime
Transportation of Chemicals in the Baltic Sea). The project gathers information on
chemicals transported in the Baltic Sea. The risk of chemical accidents in open water
and ice conditions is being modelled in the project. The risks caused by port operations
with chemicals are being studied as well. In addition, the impact of other special
environmental risk factors that chemical transportation involves is being evaluated.
Tank cleaning is one of these special risk factors, and its environmental impact is
examined in this report. The Chembaltic project is scheduled to take place between
February 2011 and December 2013, and it is being carried out in co-operation with the
University of Turku Centre for Maritime Studies, Aalto University and Kotka Maritime
Research Centre. The project is funded by the European Regional Development Fund
(ERDF) and the Finnish Funding Agency for Technology and Innovation (Tekes) as
well as the following companies and agencies: Neste Oil Oyj, Vopak Chemicals
Logistics Finland Oy, Port of HaminaKotka Ltd, Crystal Pool Ltd, and the Finnish
Transport Safety Agency (Trafi). The Finnish Port Association and the Finnish
Shipowners Association have also supported the project. The report was mainly written

Tank cleaning in the Baltic Sea – Assessment of the ecotoxicity of tank cleaning effluents 11
by Milja Honkanen, co-authored with and supervised by Jani Häkkinen (Ph.D.) and
Antti Posti (M.Sc. Tech.). The publication reflects the views of the authors. The
Managing Authority of the project cannot be held liable for the information published in
this report.
12 Honkanen, Häkkinen and Posti
2 GENERAL BACKGROUND
2.1 The Baltic Sea – a particularly sensitive sea area
The Baltic Sea is an exceptionally sensitive sea area for many different reasons. It is a
large but shallow semi-enclosed inland sea with brackish water – meaning that its water
is neither saline nor fresh water, but instead has a salinity between the two
(approximately 3–15‰) (HELCOM 2010b). In comparison, the salinity in oceans is
approximately 35‰ (Hallanaro 2010). The unusual salinity conditions in the Baltic Sea
are challenging for the aquatic organisms, as the salinity is too low for most marine
species while it is, especially in the main basin, too high for freshwater species.
Consequently, only relatively few species have adapted to living in the Baltic Sea. In
addition to salinity, the cold winters of the Baltic Sea area strain the biota and thus
contribute to the low species richness (Håkanson et al. 2003). Its poor biodiversity
makes the Baltic Sea an unstable ecosystem and thus highly susceptible to
environmental impacts: if one species is lost, for example due to chemical exposure,
there may be no other species to take its place in the ecosystem. The brackish water and
cold climate not only affect the abundance of species but also cause physiological stress
to them (HELCOM 2010c). Since the Baltic Sea biota is under constant natural stress, it
is understandably more susceptible to the effects of hazardous substances.
The Baltic Sea also differs from most of the world's seas in that it is a continental sea
(instead of a sea that lies between continents). This feature accounts for the shallowness
of the Baltic Sea: its mean depth is only about 54 metres and its maximum depth 459
metres (Landsort deep), which is still relatively shallow (Hallanaro 2010). The mean
depth of the Gulf of Finland is only 38 metres. In comparison, the mean depth of the
Atlantic Ocean is approximately 4,000 meters, and that of the Mediterranean Sea is
about 2,000 metres (Hallanaro 2010, Furman et al. 1998). Consequently, the water
volume of the Baltic Sea is relatively small, making the dilution of hazardous
substances less efficient compared to deep oceans. In addition, owing to the restricted
passage of water via the Danish straits which connect the Baltic Sea to the North Sea,
the water exchange time in the Baltic Sea is very slow (half-life of water ca. 30 years;
HELCOM 2010c). Therefore, hazardous substances stay in the Baltic Sea for a very
long time. The cold climate also contributes to the long turnover rate of hazardous
substances, as the degradation processes slow down at low temperatures (Håkanson et
al. 2003).
Despite the high vulnerability of the Baltic Sea, it is under a lot of different pressures.
The catchment area of the Baltic Sea is heavily populated (about 85 million people live
across the catchment area and its shorelines) and it has a lot of industry, busy traffic and
intense agriculture. Heavy loads of hazardous substances and nutrients causing
eutrophication are emitted or discharged from households, traffic and industrial and
agricultural sources, and they enter the Baltic Sea via surface waters or the air.
Nevertheless, one of the biggest threats to the Baltic Sea environment is the ever
increasing marine transport of oil and chemicals (HELCOM 2010c). Regardless of their
source, once released into the Baltic Sea, hazardous substances may remain there for
decades, accumulating in the food webs to reach toxic levels and causing harmful
Tank cleaning in the Baltic Sea – Assessment of the ecotoxicity of tank cleaning effluents 13
effects on the sensitive ecosystem. Consequently, identifying and mitigating the risks
arising from chemical transportation is essential to achieve better protection of the
Baltic Sea.
In 2005, the Baltic Sea, with the exception of the Russian waters and the Russian
economic zone, was declared a Particularly Sensitive Sea Area (PSSA) by the
International Maritime Organization (IMO). A PSSA status is given to sea areas that are
especially vulnerable to risks caused by marine transport and other harms. The
recognition as a PSSA area allows for specific protective measures to be taken to
control maritime activities in the Baltic Sea, such as routeing measures and installation
of Vessel Traffic Services (VTS) (IMO 2011a). The Baltic Sea has also been defined as
a “special area” according to several annexes to MARPOL 73/78, meaning that it is
provided with a higher level of protection than other sea areas (FEA 2012). The
MARPOL discharge and equipment requirements for ships, for example, are more
stringent in special areas.
MARPOL Annexes under which the Baltic Sea is defined as a special area are (Date of
Entry into Force):
Annex I: Oil (2 Oct 1983)
Annex IV: Sewage (1 Jan 2013)
Annex V: Garbage (31 Dec 1988)
Annex VI: Prevention of air pollution by ships - Emission control area; SOx (19
May 2005) (MEPC 2008).
Originally, the Baltic Sea, the Black Sea and the Antarctic were all designated as special
areas under MARPOL Annex II (Noxious liquid substances). The annex was, however,
revised in 2007, and the revision set significantly stricter discharge limits for new ships
(constructed or converted after 1 Jan 2007) compared to the previous limits.
Consequently, there was no longer any need for special requirements for the Baltic and
the Black Sea areas (IMO 2008). Only the Antarctica's status as a special area remained
after the revision: the discharge of noxious liquid substances in the Antarctic area is
strictly prohibited.
2.2 Transportation of chemicals in the Baltic Sea
Chemicals can be transported by ships either in packages or as bulk cargo. Bulk
chemical cargoes can be further dived into solids, liquids and gases, and they can be
transported either in chemical carriers or in specialized gas carriers. The carriers
transporting liquid bulk chemicals in the Baltic Sea are typically parcel tankers, which
can carry from 10 to 60 cargo tanks (“parcels”) at a time (Hänninen & Rytkönen 2006).
This consequently means that a parcel tanker can carry up to 60 different chemicals
simultaneously – although the number of different cargoes on a tanker seldom exceeds
10 (Posti & Häkkinen 2012). The total cargo capacity of chemical tankers varies from
400 to over 40,000 m3
and that of individual tanks from 70 m³ to 2,000 m³ (Hänninen &
Rytkönen 2006).
14 Honkanen, Häkkinen and Posti
Different cargoes cannot be placed randomly in chemical tankers, and there are several
factors that must be taken into account when planning the cargo placement (Kunichkin
2006). Cargo compatibility is one of these factors: cargoes that react dangerously with
each other must be separated (e.g. by a cofferdam, a void space or a tank containing
compatible cargo). Further, some tank coatings are not compatible with all cargoes.
Lastly, the FOSFA (The Federation of Oils, Seeds and Fats Associations) and the NIOP
(the National Institute of Oilseed Products) have placed restrictions on what can be
carried as previous immediate cargoes before edible animal and vegetable oils and fats
(Verwey 2007). These prior cargo restrictions are in place because previous cargo
carried in a tank is a potential source of contamination, despite efficient cleaning
methods (Kunichkin 2006). Some residues may, for example, be adsorbed into the tank
coating or find their way into areas the cleaning machines have trouble reaching and be
consequently released into oil or fat even after adequate cleaning. Lastly, the IBC Code
grades chemical tankers into type 1, type 2 and type 3 tankers based on their design and
construction standards, and defines which substances can be transported in each type of
ship (IMO 2008). The most hazardous substances can only be carried in type 1 carriers,
whereas type 2 and type 3 tankers are suited for carrying progressively less hazardous
substances (IMO 2011b).
The liquid cargo transported in the Baltic Sea consists of various kinds of compounds,
some of which are highly toxic, corrosive, and/or flammable and are therefore
dangerous to both human health and the environment, and some of which pose no
hazard even if released in the environment in large quantities. Of all the hazardous
liquid substances transported in the Baltic Sea area, oil is by far transported the most.
For example in 2010, approximately 290 million tonnes of the international liquid cargo
handled in the Baltic Sea ports were oil and oil products (Holma et al. 2011). The
amount of liquid chemicals handled annually in the Baltic Sea ports is over 11 million
tonnes – and about one half of that (roughly estimated 5.0–6.3 million tonnes) is
handled in Finnish ports (Posti & Häkkinen 2012). Even though the volume of chemical
transportation may seem small in relation to oil and oil products, the potential risks
relating to chemicals may actually be greater. Firstly, chemicals may be far more toxic
than oil, and secondly, the high cargo diversity in chemical carriers poses a special risk
in accident conditions, as different chemical cargoes with different reactive properties
may be mixed together, forming a chemical mixture significantly more reactive and/or
more toxic than its parent compounds (Hänninen & Rytkönen 2006). On the other hand,
in reality a spill resulting from a chemical tanker accident is typically significantly
smaller than a spill from an oil tanker accident (due to smaller transport volumes per
ship and compartmentalisation of the cargo). Either way, it is clear that the risks relating
to chemical shipping are more difficult to identify than the risks arising from oil
transportation. This stems from the fact that thousands of chemicals with different
properties are transported by sea each year, and the environmental risk profiles and
potentials of these chemicals, compounds and other substances are very complex and
highly variable (Malmsten 2001).
The chemicals handled in greatest quantities in the Baltic Sea ports are methanol,
sodium hydroxide solution, methyl tert-butyl ether (MTBE), xylenes, pentanes,
ammonia, phosphoric acid, sulphuric acid, and ethanol and ethanol solutions (Posti &
Tank cleaning in the Baltic Sea – Assessment of the ecotoxicity of tank cleaning effluents 15
Häkkinen 2012). At least hundreds of thousands of tonnes of all these substances are
handled annually – some of the volumes even amounting to over 1 million tonnes per
year. The majority of the most frequently handled substances belong to MARPOL's
pollution category Y, meaning that they are of a moderate hazard if released in the
marine environment. Only MTBE, ethanol and ethanol solutions are category Z
substances, i.e. the hazard arising from them, according to MARPOL, is only minor (for
a more detailed discussion of MARPOL pollution categories, see the following section).
2.3 MARPOL categorization of noxious liquid substances carried in bulk
The regulations on the transport of liquid bulk chemicals are laid down in SOLAS3
chapter VII (Carriage of dangerous goods) and in the revised MARPOL Annex II (IMO
2011b). SOLAS is an international treaty which concerns the safety of commercial ships
(IMO 2011c), whereas MARPOL is primarily concerned with aspects of maritime
environmental protection. Both treaties require chemical tankers built after 1 July 1986
to comply with the International Code for the Construction and Equipment of Ships
carrying Dangerous Chemicals in Bulk (IBC Code) (IMO 2011b). The IBC code lays
down the construction standards for chemical tankers and identifies and categorises the
substances that may be carried in them. MARPOL Annex II originally entered into
force in 1983 but has since been revised, and the revision entered into force in 2007.
Annex II contains regulations and guidelines on the cleaning and discharge of liquid
bulk chemicals carried in ships. The precise requirements for cleaning and discharge
depend on the pollution category to which the substance at hand has been categorised in
the IBC code. In Finland, MARPOL Annex II is implemented through the Act and
Decree on Maritime Environmental Protection (1672/2009 and 76/2010).
The revised Annex II introduced a new four-category classification system for noxious
liquid substances carried in bulk (previously, there were five categories: A, B, C, D and
Appendix III; Luhtala, 2010). In Regulation 6 of the revised Annex II, noxious liquid
substances are now divided into four categories: X, Y, Z and OS according to their
potential for harm. Another significant change in the revision is that vegetable oils,
which were previously unrestricted, must now be transported in chemical carriers
(Kunichkin 2006). All the example substances in the following are from MEPC (2007)
– the latest list of substances that can be carried in bulk by ships (Chapter 17 of the
IBC-code).
Category X includes liquid chemicals which, if discharged into the sea from tank
cleaning or deballasting operations, would present a major hazard to either marine
resources or human health. Therefore, the prohibition on the discharge of these
substances into the marine environment is justified. Examples of category X substances
are coal tar, pine oil, all isomers of octane, triethylbenzene, and diphenylether.
Category Y chemicals are liquid substances which, if discharged into the sea, would
present a hazard to either marine resources or human health or cause harm to amenities
3 The International Convention for the Safety of Life at Sea (SOLAS).
16 Honkanen, Häkkinen and Posti
or other legitimate uses of the sea. Therefore a limitation on the quality and quantity of
the discharge of category Y substances into the marine environment is justified. For
example, methanol, phenol, sodium hydroxide, sulphuric acid, vegetable oils, and
xylenes are category Y substances.
Category Z chemicals are not as harmful as the X and Y chemicals: they, if discharged
into the sea, would present a minor hazard to either marine resources or human health
or cause minor harm to amenities or other legitimate uses of the sea and therefore
justify less stringent restrictions on the quality and quantity of the discharge. Examples
of Z category chemicals are diethyl ether, ethyl acetate, methyl tert-butyl ether (MTBE),
isobutyl alcohol and urea solution.
The OS category (Other Substances) contains liquid substances which cannot be divided
into any of the above-mentioned categories (X, Y or Z). They are, at present, considered
to present no harm to marine resources, human health, amenities or other legitimate uses
of the sea. Consequently, there is no compelling need to restrict the discharge of these
substances into the marine environment. Substances such as molasses, apple juice, and
coal and clay slurries are examples of “other substances”. None of the Annex II
requirements apply to OS substances.
The categorisation criteria for liquid chemicals mentioned above are rather broad. More
precise guidelines for the categorization of hazardous liquid substances and mixtures
are, in fact, given in Appendix 1 to Annex II. The actual hazard assessment procedure
for liquid substances on which the categorization is based was carried out by the EHS4
working group of the Joint Group of Experts on the Scientific Aspects of Marine
Pollution (GESAMP 2002). The working group evaluates new liquid substances to be
transported in bulk by ships based on their toxicity and behaviour in the environment,
both of which arise from the intrinsic properties of the chemical at hand. The GESAMP
rating scale begins with the value 0 (“non-hazardous” or a “negligible hazard”), and
continues through medium values of 1 and 2 to maximum values of 3–6, which indicate
a more severe hazard (GESAMP 2002). The GESAMP hazard evaluation procedure for
a given liquid substance results in a “hazard profile”, and based on these profiles, the
IMO assigns the substances to one of the four pollution categories (X, Y, Z and OS).
The hazard profiles for liquid substances are published regularly, and the composite list
of them is available from the IMO (IMO 2011d).
2.4 Effects and behaviour of chemicals in the environment
The release of chemicals in the environment may result in adverse effects on the
environment and its organisms – the flora and the fauna. The actual chemical-organism
interactions occur at molecular level (e.g. when a chemical binds to a protein or DNA in
a cell), but the effects are reflected on all the higher biological levels, including the
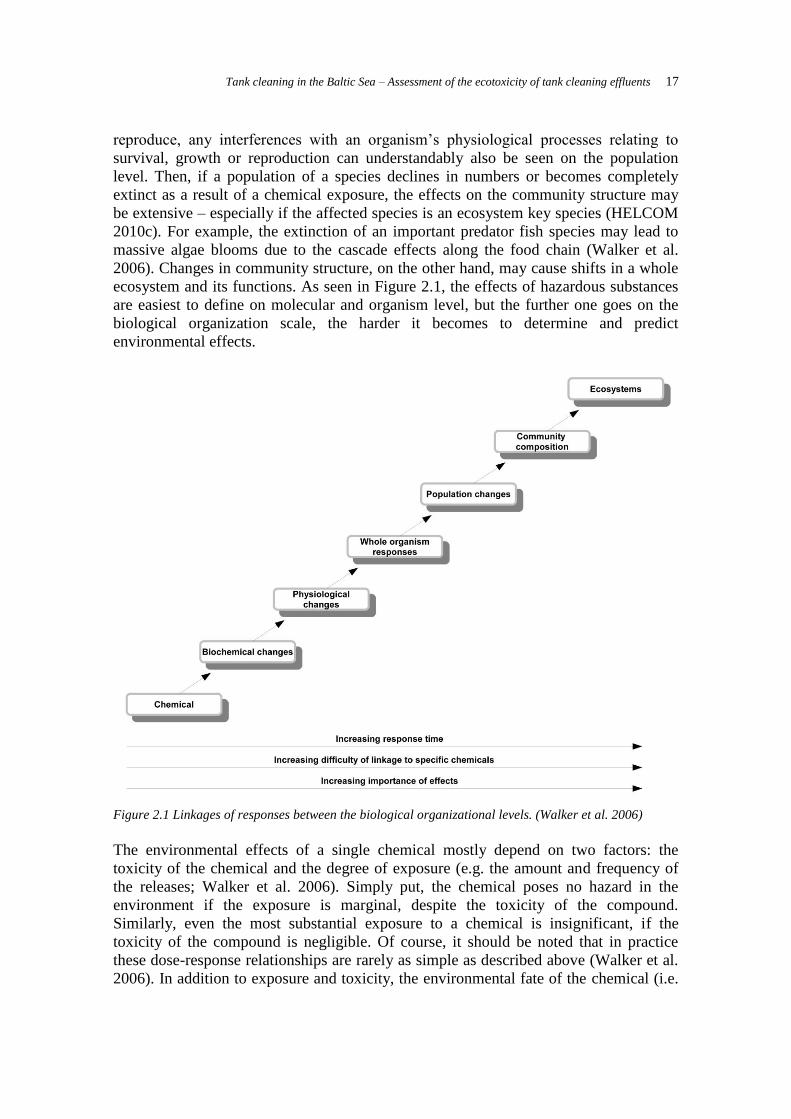
ecosystem level (Fent 2004) (Figure 2.1). Because a viable population needs its
individuals to survive until reproductive age and to grow mature enough to be able to
4 EHS Working Group on the Evaluation of the Hazards of Harmful Substances Carried by Ships.
Tank cleaning in the Baltic Sea – Assessment of the ecotoxicity of tank cleaning effluents 17
reproduce, any interferences with an organism’s physiological processes relating to
survival, growth or reproduction can understandably also be seen on the population
level. Then, if a population of a species declines in numbers or becomes completely
extinct as a result of a chemical exposure, the effects on the community structure may
be extensive – especially if the affected species is an ecosystem key species (HELCOM
2010c). For example, the extinction of an important predator fish species may lead to
massive algae blooms due to the cascade effects along the food chain (Walker et al.
2006). Changes in community structure, on the other hand, may cause shifts in a whole
ecosystem and its functions. As seen in Figure 2.1, the effects of hazardous substances
are easiest to define on molecular and organism level, but the further one goes on the
biological organization scale, the harder it becomes to determine and predict
environmental effects.
Figure 2.1 Linkages of responses between the biological organizational levels. (Walker et al. 2006)
The environmental effects of a single chemical mostly depend on two factors: the
toxicity of the chemical and the degree of exposure (e.g. the amount and frequency of
the releases; Walker et al. 2006). Simply put, the chemical poses no hazard in the
environment if the exposure is marginal, despite the toxicity of the compound.
Similarly, even the most substantial exposure to a chemical is insignificant, if the
toxicity of the compound is negligible. Of course, it should be noted that in practice
these dose-response relationships are rarely as simple as described above (Walker et al.
2006). In addition to exposure and toxicity, the environmental fate of the chemical (i.e.
18 Honkanen, Häkkinen and Posti
its persistency, mobility and tendency to accumulate) contributes notably to the
chemical’s harmfulness (Fent 2004). The environmental fate of a chemical is
determined by both environmental conditions and the properties of the chemical.
2.4.1 Toxicity of a chemical
Mere exposure to a chemical does not necessarily mean that toxic effects will actually
occur. To produce toxic effects, a chemical must, first of all, be taken up by an
organism, and secondly, find a target site inside it. In case of aquatic organisms,
exposure may occur either directly from water or indirectly via food. For example, if a
chemical is tightly bound to sediment, it is not easily taken up by organisms living in
the water phase (e.g. fish). However, worms living burrowed in the sediments could be
exposed to the chemical by consuming contaminated sediment particles. Consequently,
the same fish that was not affected before via water could now be affected by
consuming contaminated worms. Once a chemical is taken up by an organism, it will be
distributed within the organism through the circulatory system (blood or hemolymph),
and the toxic effect will manifest when the chemical binds to its specific target site (to a
molecule, such as receptor, protein, cell membrane or DNA). If an organism lacks the
specific target site for a particular chemical, it will obviously not be affected. Plants and
algae, for example, lack a central nervous system (or a corresponding target site) and are
therefore not affected by neurotoxins. This consequently means that a chemical may
either have a target species, or it may be uniformly toxic to all species, depending on
whether its target site is found in one or in all species (or group of organisms) (Walker
et al. 2006).
Once in an organism, the chemical will be gradually metabolised (either to a less toxic
and water soluble metabolite or to a more reactive and harmful metabolite) and finally,
the chemical or its metabolites will be excreted through urea, feces and/or gills.
Depending on its properties, parts of the chemical may also be stored within the
organism in specific vacuoles in cell membranes or in adipose tissue. When the
chemical is stored, it will not be able to cause toxic effects, i.e. it is not bioavailable.
However, the stored chemical may be released in time, for example when food is scarce
and the stored fat needs to be broken down for energy, and then reach its target site
causing delayed toxicity (Walker et al. 2006).
The most useful way to evaluate the toxicity of a substance is to perform dose
(concentration) – response (effect) tests on organisms of different trophic levels. In
toxicity testing, the relationship between concentration and effect for the test species is
studied, and the test results in a toxicity value LC/EC/IC505, which describes the
concentration where 50% of the test population is affected (Walker et al. 2006). The No
Observable Effect Concentration (NOEC), which is the highest concentration tested at
which no significantly different effects from the control population are observed, may
also be obtained from these same tests. In aquatic toxicity testing, the typical test
5 LC50; Lethal concentration, EC50; Effect concentration (previously defined end point; for example
immobilization), IC50; Inhibition concentration (end point may, for example, be growth or
reproduction).
Tank cleaning in the Baltic Sea – Assessment of the ecotoxicity of tank cleaning effluents 19
species are algae, planktonic crustacean Daphnia (water flea) and different species of
fish. The studied end points may be, for example, death, growth, development or
reproduction – an effect that is relevant on all organism, population, and community and
ecosystem levels (SYKE 2004). In acute testing, the test organisms are exposed to high
concentrations for a short period of time (typically 24/48/96hrs), whereas in chronic
testing, the test organisms are exposed to lower concentrations for a longer time period
– for the whole life cycle, or a part of it. In chronic tests, the sublethal responses
(growth, behaviour, reproduction etc.) are usually more important, as the concentrations
are not typically high enough to cause death in test organisms.
In field conditions, organisms are typically exposed to low concentrations of chemicals
more or less frequently. Between acute and chronic testing, the test circumstances in
chronic testing are far closer to field conditions. The acute toxicity values, on the other
hand, are characteristically so high that such concentrations very rarely occur in nature.
Typical situations where organisms are acutely exposed to high concentrations of
chemicals are disastrous accidents (e.g. tanker collisions) (Häkkinen et al. 2010).
Moreover, the high chemical concentrations after a large spill decrease rapidly in the
environment, reaching below acute toxicity levels. Therefore, it is most often preferable
to use chronic toxicity data in environmental monitoring and the risk assessment of
hazardous chemicals. However, chronic toxicity data for chemicals is hard to obtain
because the tests are rather expensive and difficult to perform. Therefore, chronic
toxicity data is only available for relatively few chemicals (Häkkinen et al. 2010).
Toxicity tests are typically based on national and international standards (SFS, ISO,
EN), and the testing of chemicals is performed by the technical OECD guidelines. The
testing guidelines of the United States (EPA, ASTM) and Canada (Environment
Canada) can also be applied, even though they differ in some parts from the EN and
ISO standards (SYKE 2004).
2.4.2 Movements and distribution of a chemical in the (marine) environment
Once a chemical is introduced in the marine environment, it will, first of all, be diluted
in the vast amount of water, and secondly, be degraded by both chemical processes (e.g.
hydrolysis, photodegradation) and by microorganisms (biodegradation) – at least to
some extent (Walker et al. 2006). Sometimes, in a process called bioactivation, the
biodegradation may lead to the formation of degradation products which are more
reactive and toxic than the original parent chemical. A good illustration of the effect of
dilution is comparing the total content of haloforms in river water (up to 13.4 μg/l) to
that in seawater (0.119 μg/l) (Crompton 2007). In addition to dilution and degradation,
the chemical may also exhibit other behaviours. Depending on its properties, the
chemical will move between different environmental compartments (water, air,
sediment and living biota) until it reaches a steady state. This environmental partitioning
and harmfulness of a chemical are linked together in a sense that a chemical is only
toxic when its concentration exceeds a certain threshold in a given compartment
(Walker et al. 2006). For example, if we consider a situation where a chemical is
released in water, the final steady state concentration to which the pelagic organisms
20 Honkanen, Häkkinen and Posti
will be exposed to will be more or less lower than the original concentration during the
release. This is partly due to the fact that parts of the original chemical will, for
example, evaporate into the air and parts of it will be bound to sediments. Of course,
dilution and degradation have a great influence on the chemical concentration as well.
The environmental partitioning, i.e. the environmental fate, of a chemical is a physical
process which is highly dependent on the physico-chemical properties of the chemical,
as well as on environmental conditions (Allen 2002). Based on the chemical’s physico-
chemical properties, it is possible to predict the likely movements and partitioning of a
pollutant in the environment (the fugacity approach) (MacKay 1979). The most
important physico-chemical properties affecting the environmental fate of a substance
are: water solubility, vapour pressure, density, and lipophility (described by the octanol-
water partitioning coefficient, Kow). Implications of the different physico-chemical
properties on the chemicals’ behaviour in the environment are briefly reviewed in the
following.
Water solubility S is a central factor determining the environmental fate of a chemical.
Water solubility greater than 1,000 mg/l makes a substance highly soluble in water
(Nikunen & Leinonen 2002) and thus easily available to pelagic organisms. In
comparison, poorly soluble (< 10 mg/l) and hydrophobic substances are typically tightly
bound to organic particles and the sediment, and are therefore less available for uptake
by pelagic organisms. On the other hand, highly water soluble substances are typically
readily biodegraded and do not, therefore, have the tendency to accumulate in
organisms and food webs (Häkkinen et al. 2010).
Vapour pressure Pvp (Pa) (at 20–25 °C) describes a chemical’s solubility in air. When a
substance has a vapour pressure greater than 0.1 kPa, it is considered highly volatile,
whereas substances with a vapour pressure lower than 10-5
kPa are not readily
volatilized (Nikunen & Leinonen 2002). When a chemical is highly volatile, its risks in
aquatic environments are greatly reduced, as it will volatize into the air and leave the
water system. In the air, substances are rapidly diluted and typically more readily
degraded than in water (Häkkinen et al. 2010). In relation to their environmental fate,
Henry’s law constant H (Pa m3/mol) is also a relevant property, as it characterises the
partitioning of a substance between air and the aquatic phase (“evaporation from
water”). A Henry's law constant greater than 100 Pa m3/mol means that the substance
evaporates extremely easily; values between 1 and 100 Pa m3/mol indicate that the
substance evaporates relatively easily, and values lower than 10-2
Pa m3/mol
indicate
that the substance does not evaporate well (Nikunen & Leinonen 2002).
Density (kg/l) is also an important factor determining the final fate of a substance in the
aquatic environment. When a substance has a density lower than that of sea water
(1.025 g/l at 20°C), it will float, whereas a substance with a greater density than that of
sea water will sink (presuming that the compound is neither highly volatile nor water
soluble) (GESAMP 2002). Viscosity (cSt) is a property of liquids. Viscosity determines
a substance’s resistance to flow, and floating substances with a viscosity greater than ca.
10 cSt (at 10–20 °C) have a tendency to form persistent slicks on the water surface
Tank cleaning in the Baltic Sea – Assessment of the ecotoxicity of tank cleaning effluents 21
(GESAMP 2002). Besides centistokes (cSt), other units, such as Pa.s (pascal-seconds)
and poises (P), can be used for viscosity as well.
The solids-water partitioning coefficient Koc describes the compound’s tendency to be
adsorbed into suspended matter (e.g. organic particles in the water phase and sediment).
When the Koc value is high, i.e. > 5,000, the compound will be tightly bound to organic
matter and will not move freely in water. A Koc value between 150–500 indicates that
the compound’s adsorption to solids is moderate, and Koc values lower than 50 indicate
that the compound is not readily adsorbed into particles, and consequently, moves freely
in the water phase (Nikunen & Leinonen 2002).
The octanol water partitioning coefficient Kow (typically presented on a logarithmic
scale; log Kow) is the ratio of a chemical’s solubility in n-octanol and water at a steady
state (Nikunen & Leinonen 2002). The log Kow is an indicator of a chemical's
lipophility/hydrophobicity, and as n-octanol has similar polarity to animal fats, the log
Kow can also be used as an indicator of a chemical's potential to bioaccumulate in
organisms. A compound’s lipophility and the tendency to bioaccumulate increase with
an increasing log Kow value. A log Kow value greater than 4 indicates high and a log Kow
value greater than 5 extremely high lipophility (Nikunen & Leinonen 2002). Owing to
its high lipophility, a substance that is not originally present in toxic concentrations in
the environment may still accumulate in organisms and produce toxic effects in time
(Walker et al. 2006). Additionally, some chemicals which accumulate readily in
organisms have a tendency to bioconcentrate along the food chain, as the predators
receive larger chemical concentrations via food than what the chemical concentration is
in the surrounding water (Grey 2002). Therefore, the concentrations of such lipophilic
chemicals are typically highest (possibly even up to toxic levels) in top predators, such
as fish-eating birds and seals. Even though high lipophility is most often associated with
negative consequences for the environment, lipophilic substances are, on the other hand,
readily adsorbed into sediment and into organic matter in the water phase. Therefore,
lipophilic substances are not necessarily as bioavailable to organisms as highly water
soluble substances are. On the other hand, sediment-ingesting and sediment-dwelling
organisms, such as oligochaeta worms, may be readily exposed to sediment bound
substances (Walker et al. 2006). And, as the oligochaeta worms and other benthos are
an important food source for example for fish, even sediment-bound chemicals may be
introduced to the pelagic food webs.
As mentioned above, the bioaccumulation tendency of a substance can be roughly
estimated from its log Kow value. However, typically more defined and reliable
partitioning coefficients are used to evaluate a chemical’s bioaccumulation tendency.
The bioconcentration factor (BCF) describes the distribution of a substance between the
tissues of a fish (or some other organism) and its surroundings (water) (Nikunen &
Leinonen 2002). The bioaccumulation factor, on the other hand, is the ratio of a
substance between an organism and its food (or ingested water) (Walker et al. 2006).
Factors affecting the BCF are: bioavailability, distribution and biotransformation in an
organism, and excretion (Nikunen & Leinonen 2002). These processes are typically
taking place simultaneously, and it takes some time until a steady state is reached. The
biota-sediment accumulation factor (BSAF) is somewhat similar to BCF, only it
22 Honkanen, Häkkinen and Posti
describes the distribution of a test substance between sediment-dwelling organisms and
their surrounding sediment (OECD 2008). When the test substance concentration in an
organism exceeds the concentration in the surrounding medium, i.e. when the BCF or
BSAF is greater than 100, this is an indication of bioconcentration (Nikunen &
Leinonen 2002). It is recommended that BCF is used in chemical risk assessment over
the octanol-water partitioning coefficient, as the former is derived experimentally from
fish, whereas the latter is merely a calculated estimation of bioaccumulation.
Unfortunately, BCFs are only available for relatively few chemicals and, in addition,
there is definitely room for improvement as regards the quality of the existing BCF
values (a great deal of uncertainties are associated with the test conditions, for example)
(Arnot & Gobas 2006).
Depending on the physico-chemical properties referred to above, a substance that is
released in the environment will be distributed between the different environmental
compartments. For example, the largest share of a highly water soluble chemical will
most likely be found in the water phase, whereas the major share of a highly volatile
pollutant will end up in the air phase. Chemicals with a high log Kow (between 4 and 7),
on the other hand, are highly lipophilic and will, for the most part, be distributed
between the biota and the sediments, as they have a tendency to bioaccumulate in
adipose tissue in organisms and be adsorbed into organic particles in the sediment.
Typically, water soluble chemicals which are both persistent and bioaccumulative are
considered to pose the greatest risk in the aquatic environment (Walker et al. 2006). In
addition, when a water soluble chemical has a density higher than that of sea water (i.e.
the chemical sinks rather than merely floats on the water surface), it becomes more
available to the pelagic biota, which makes the risk of that chemical more evident
(Häkkinen et al. 2012). It should, however, be noted that this only holds true in case of
“sinker “substances which simultaneously dissolve readily in water. Poorly water
soluble sinkers might actually sink all the way to the sea bed and be deposited in the
sediments, where they are not very bioavailable for pelagic organisms (GESAMP
2002). Furthermore, floating substances which dissolve readily in water may be as
bioavailable as the water soluble sinkers are.
As we have seen, chemicals can behave in a number of ways once they are spilled into
the sea. Understanding their behaviour is important; first of all, to recognise the
implications chemicals have on human health and the environment, but also to
determine the most effective response to chemical spills (ITOPF 2010). Categorizing
chemicals based on their behaviour in the sea is a useful tool for these purposes. The
European Categorization system classifies chemicals in four main categories based on
their theoretical behaviour in the sea. These classes are: gases (G), evaporators (E),
floaters (F), sinkers (S) and dissolvers (D) (Bonn Agreement 2007). The basic
categories are further divided into sub-categories, and as a result, there are a total of 12
different behaviour categories (Table 2.1). It is important to be aware of the fact that the
European classification system only considers the primary behaviour/behaviours
relevant to a chemical spill (ITOPF 2010). In reality, however, there are other
behaviours a chemical may exhibit in the marine environment due to its properties and
environmental conditions (e.g. wind, waves, currents) (CEDRE 2012). Benzene, for
example, is classified as an evaporator, but it is also soluble to a certain extent – which
Tank cleaning in the Baltic Sea – Assessment of the ecotoxicity of tank cleaning effluents 23
may also have to be considered when predicting its physical behaviour in the sea
(ITOPF 2010). Moreover, the European classification system is based on experiments
conducted in stable laboratory conditions with pure products, at a temperature of 20 °C
and in fresh water (CEDRE 2012). These conditions are far from the natural conditions
prevailing at the sea. Therefore, the actual behaviour of chemicals may differ greatly
from their theoretical behaviour.
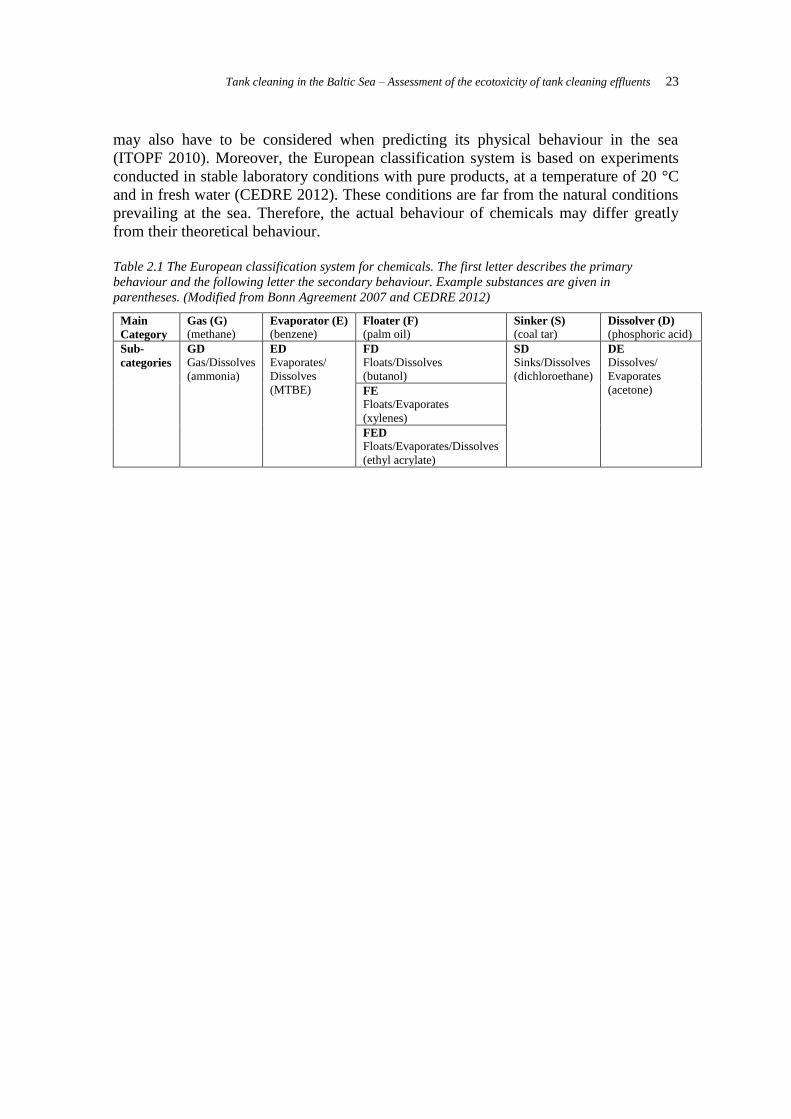
Table 2.1 The European classification system for chemicals. The first letter describes the primary
behaviour and the following letter the secondary behaviour. Example substances are given in
parentheses. (Modified from Bonn Agreement 2007 and CEDRE 2012)
Main
Category
Gas (G) (methane)
Evaporator (E) (benzene)
Floater (F) (palm oil)
Sinker (S) (coal tar)
Dissolver (D) (phosphoric acid)
Sub-
categories
GD Gas/Dissolves
(ammonia)
ED Evaporates/
Dissolves
(MTBE)
FD Floats/Dissolves
(butanol)
SD Sinks/Dissolves
(dichloroethane)
DE Dissolves/
Evaporates
(acetone) FE Floats/Evaporates
(xylenes)
FED Floats/Evaporates/Dissolves
(ethyl acrylate)
24 Honkanen, Häkkinen and Posti
3 TANK CLEANING IN PRACTICE
Tank cleaning is a routine tanker operation which is carefully controlled by MARPOL
Annex II (the Control of Pollution by Noxious Liquid Substances in Bulk). Chemical
tanks have to be cleaned whenever new cargo that is not compatible with the previous
cargo is to be loaded into the tanks, when tanks need to be gas-free before repairs or
maintenance, or when they have to be entered for inspection purposes (Olson 1994). If a
tank has not been emptied and cleaned properly, introducing new cargo might result, for
example, in an explosion or some other detrimental reaction. In addition, any remaining
chemical fumes in a tank would pose a serious safety risk for repair, maintenance or
other personnel needing to enter the tank, as the fumes may be both highly toxic and
flammable. And lastly, there is a need for efficient cleaning also from the commercial
point of view as cargo remnants in a tank might contaminate the following cargo
(McGeorge 1995).
Operational cleaning and discharge procedures are outlined in the Procedures and
Arrangement manual (P&A manual) which must, as required by MARPOL Annex II, be
found on every ship certified to carry noxious liquid substances in bulk (McGeorge
1995). The P&A manual is drawn up in accordance with Annex II and it contains all
technical information on the cleaning machinery used in a particular ship, and it outlines
the sequence of actions to be taken to ensure that the cleaning procedures and the
discharge of hazardous chemical residues is done without threatening the sensitive
marine environment (Kunichkin 2006). The tank cleaning process may contain up to
seven stages: (1) pre-cleaning, (2) cleaning, (3) rinsing, (4) flushing, (5) steaming, (6)
draining and (7) drying (Verwey 2007). Selecting a suitable cleaning practice (e.g. the
quantity, temperature, and identity of the washing agent) is highly dependent on both
the properties of the cargo that is being cleaned from the tank and the properties of the
next cargo that the tank is being cleaned for.
3.1 Cleaning and stripping
A tank can be cleaned from chemical residues by washing it either with fresh or sea
water (hot/cold), with a cleaning agent, such as mineral oils and chlorinated solvents, or
with a mixture of water and cleaning agent. When the cargo is water soluble, water
washing is very efficient, but in case of a hydrophobic cargo, adding detergent is
central. Choosing a suitable washing agent is imperative, not only for achieving the best
cleaning result, but also because a wrong choice may lead to serious errors and financial
losses (Kunichkin 2006). For example, water reactive substances, such as toluene-di-
isocyanate (TDI), cannot be cleaned using water, and a solvent must be used instead –
using water to clean TDI would lead to formation of insoluble sediments. Moreover,
some cargoes may react with certain cleaning agents and form toxic or flammable
vapours, or damage the equipment (e.g. pumps) (ICS 2002). The washing media should
therefore always be carefully chosen based on cargo properties. Other factors that ought
to be considered in choosing the washing media are the type of coating inside the cargo
tanks, the size and dimension of the tanks and the loading requirements of the next
cargo (Tanker Operator 2008a). A decision on the correct cleaning plan can be made by
Tank cleaning in the Baltic Sea – Assessment of the ecotoxicity of tank cleaning effluents 25
consulting the various tank cleaning guides that are available on the market (Kunichkin
2006). The leading independent publication on the subject is the “Tank Cleaning Guide”
published by Laboratory Dr. A. Verwey, Rotterdam (Kunichkin 2006), which was also
consulted for the purposes of the present study.
Even though it is sometimes necessary to use solvents or small amounts of additives or
detergents in the washing water to improve the cleaning effect, water is still the most
common washing agent (ICS 2002). It is an efficient cleaner and readily available in
large quantities, and it can also be heated in most of the chemical tankers if necessary.
As regards the washing media, it should also be noted that when detergents or additives
are used to wash cargo tanks, the resulting washings are governed by the provisions of
either MARPOL Annex I (oil products) or Annex II, which would apply to the cleaning
agent if it had been carried as cargo (Annex II reg. 13.5). Also, if a detergent is added to
washing water, additives containing category X components may not be used, except
those that are readily biodegradable and present in a total concentration of less than 10%
of the cleaning additive (Annex II reg. 13.5). Verwey’s Tank cleaning guide (Verwey
2007), for example, recommends that in most cases, 0.05% of detergent be used.
The washings resulting from tank cleaning are typically first transferred into slop tanks
on board, from which the residues are later discharged, either into the sea or to a
reception facility in a port (McGeorge 1995). Discharge into the sea is predominantly
prohibited, while MARPOL Annex II allows it to a certain extent (Annex II reg. 13).
First of all, to minimize the risk to the marine environment, the Annex gives a precise
description on how the discharge of tank cleaning waters (or ballast waters containing a
chemical6) into the sea must be performed – the discharge is only allowed if carried out
strictly by these guidelines. Moreover, the amount of chemical that is allowed to be
discharged per tank is defined in the Annex. For a summary of the discharge
requirements for the different MARPOL pollution categories, see Table 3.1.
6 Chemical tankers typically have segregated ballast tanks, and therefore seldom have ballast waters
contaminated with chemicals (HELCOM 1993).
26 Honkanen, Häkkinen and Posti
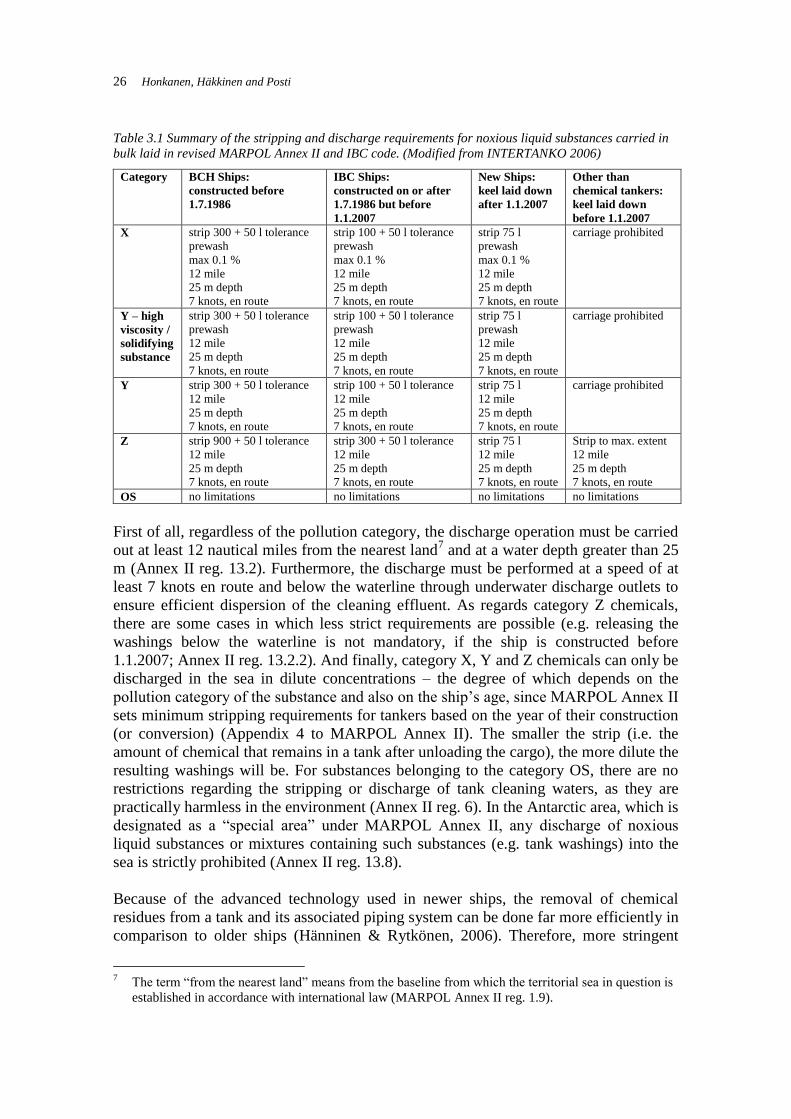
Table 3.1 Summary of the stripping and discharge requirements for noxious liquid substances carried in
bulk laid in revised MARPOL Annex II and IBC code. (Modified from INTERTANKO 2006)
Category BCH Ships:
constructed before
1.7.1986
IBC Ships:
constructed on or after
1.7.1986 but before
1.1.2007
New Ships:
keel laid down
after 1.1.2007
Other than
chemical tankers:
keel laid down
before 1.1.2007
X strip 300 + 50 l tolerance
prewash
max 0.1 %
12 mile
25 m depth
7 knots, en route
strip 100 + 50 l tolerance
prewash
max 0.1 %
12 mile
25 m depth
7 knots, en route
strip 75 l
prewash
max 0.1 %
12 mile
25 m depth
7 knots, en route
carriage prohibited
Y – high
viscosity /
solidifying
substance
strip 300 + 50 l tolerance
prewash
12 mile
25 m depth
7 knots, en route
strip 100 + 50 l tolerance
prewash
12 mile
25 m depth
7 knots, en route
strip 75 l
prewash
12 mile
25 m depth
7 knots, en route
carriage prohibited
Y strip 300 + 50 l tolerance
12 mile
25 m depth
7 knots, en route
strip 100 + 50 l tolerance
12 mile
25 m depth
7 knots, en route
strip 75 l
12 mile
25 m depth
7 knots, en route
carriage prohibited
Z strip 900 + 50 l tolerance
12 mile
25 m depth
7 knots, en route
strip 300 + 50 l tolerance
12 mile
25 m depth
7 knots, en route
strip 75 l
12 mile
25 m depth
7 knots, en route
Strip to max. extent
12 mile
25 m depth
7 knots, en route
OS no limitations no limitations no limitations no limitations
First of all, regardless of the pollution category, the discharge operation must be carried
out at least 12 nautical miles from the nearest land7 and at a water depth greater than 25
m (Annex II reg. 13.2). Furthermore, the discharge must be performed at a speed of at
least 7 knots en route and below the waterline through underwater discharge outlets to
ensure efficient dispersion of the cleaning effluent. As regards category Z chemicals,
there are some cases in which less strict requirements are possible (e.g. releasing the
washings below the waterline is not mandatory, if the ship is constructed before
1.1.2007; Annex II reg. 13.2.2). And finally, category X, Y and Z chemicals can only be
discharged in the sea in dilute concentrations – the degree of which depends on the
pollution category of the substance and also on the ship’s age, since MARPOL Annex II
sets minimum stripping requirements for tankers based on the year of their construction
(or conversion) (Appendix 4 to MARPOL Annex II). The smaller the strip (i.e. the
amount of chemical that remains in a tank after unloading the cargo), the more dilute the
resulting washings will be. For substances belonging to the category OS, there are no
restrictions regarding the stripping or discharge of tank cleaning waters, as they are
practically harmless in the environment (Annex II reg. 6). In the Antarctic area, which is
designated as a “special area” under MARPOL Annex II, any discharge of noxious
liquid substances or mixtures containing such substances (e.g. tank washings) into the
sea is strictly prohibited (Annex II reg. 13.8).
Because of the advanced technology used in newer ships, the removal of chemical
residues from a tank and its associated piping system can be done far more efficiently in
comparison to older ships (Hänninen & Rytkönen, 2006). Therefore, more stringent
7 The term “from the nearest land” means from the baseline from which the territorial sea in question is
established in accordance with international law (MARPOL Annex II reg. 1.9).
Tank cleaning in the Baltic Sea – Assessment of the ecotoxicity of tank cleaning effluents 27
stripping requirements are set for ships built/converted after 1.1.2007 as well (the
maximum strip in all pollution categories 75 l; in comparison, the maximum strip for
older IBC ships is 100–300 l) (Table 3.1). The +50 litres mentioned in the criteria
summarised in Table 3.1 is an allowable tolerance which should not, however, be
interpreted as a standard relaxation (ABS 2006). The tendency of some chemicals (e.g.
styrene and palm oil) to form a 0.5–2 mm thick coating on the tank floor and walls is
also accounted for in the maximum strip limits (Keskitalo 2012 pers. comm.). When the
strip limits are as stringent as they are, the total residual quantity will reach hazardous
levels after the possible cargo remnants from tank floor and walls are added to the cargo
remnants in the tank well during the washing operation.
The stripping limits given in Table 3.1 apply to an individual tank. A chemical tanker
may, however, carry several tankfuls of the same substance simultaneously – all of
which may have to be washed. The total amount of discharged chemical residue per
ship can be calculated rather simply: if we consider a chemical tanker built before 1 Jan
2007 that is carrying 14 tanks of category Y cargo, the total amount of discharged
chemical would be: 14 x 100 l = 1,400 l. This is, however, the maximum volume of
chemical that is allowed to be discharged within MARPOL’s limits. In practice, the
strip volume may be somewhat smaller than MARPOL requires. For example, during
the stripping test (with water) in one of the sister ships8 of the Bergen-based shipping
company Mowinckel, the remaining cargo residue per tank was found to be 24–50 litres
(Tanker Operator 2008b). Consequently, the total chemical residue for that particular
ship would be approximately 336-700 l (assuming a cargo capacity of 14 tanks).
Moreover, by utilizing the novel super stripping technique, it is possible to achieve
strips of only 0.5–1 litres in volume (Tanker Operator 2008b). However, as chemical
carriers can usually comply with the MARPOL requirements by using the normal
stripping technique, the somewhat time and effort consuming super stripping technique
is seldom used in normal unloading operations. It is generally utilized for a volatile
cargo, such as gasoline. In such cases, small cargo residues of 0.5–1 litre can be
removed by simple and fast inertion with gas (standard practice). Since any further
ventilation (which could take several hours) or mechanical removing of the residues is
not needed, time and money are saved.
We should keep in mind that efficient stripping is imperative, not only from the
environmental point of view but also because of the purely economic interests of both
the owners of the ship and the cargo (GESAMP 2002). For example, if we consider a
ship sailing under the BCH Code, under which the maximum strip per tank allowed is
300 l (categories X and Y; Table 3.1), the total chemical residue for the entire ship
could in theory be up to 4,060 l (once again assuming a cargo capacity of 14 tanks). The
owner of the cargo would probably not appreciate such a large amount of cargo going to
waste.
8 Oil and chemical carriers, keel laid down after 1.1.2007 (Tanker Operator 2008b).
28 Honkanen, Häkkinen and Posti
3.2 Prewashing
As seen in Table 3.1, for tanks having contained a highly hazardous cargo (MARPOL
category X substances) or high-viscosity or solidifying substances in category Y,
MARPOL Annex II requires a prewash procedure. For category X substances,
prewashing is required purely due to their hazardousness in the environment, but for the
high-viscosity and solidifying substances, prewashing is required mostly because ships
carrying these substances could not otherwise meet the stripping requirements
(HELCOM 1993). Due to their physico-chemical properties, solidifying and high-
viscosity cargoes cannot be pumped as easily from the tanks than other substances.
Consequently, the residual quantities of high-viscosity/solidifying substances that
remain in the cargo tanks after unloading are much greater than in the case of non-
solidifying and low-viscosity cargoes. Without prewashing, the amounts of these
chemicals discharged into the sea would be quite extensive.
Prewashing must always be carried out ashore, preferably immediately after unloading
(ICS 2002). Generally, the sooner the prewashing is carried out the better the cleaning
result. After the prewash is complete, the tank and related pipelines must be thoroughly
stripped, and the resulting washings must always be discharged into a reception facility
at a port (McGeorge 1995). Chemical residues that remain on tank bulkheads and walls
after prewashing can be removed by a subsequent washing operation (which is typically
necessary for commercial needs). These “main” washing slops are considered to be
dilute enough to be safely discharged into the sea as long as the requirements for the
discharge described above are met (McGeorge 1995). Chemical tanks having contained
“normal” category Y (other than high-viscosity/solidifying substances) or category Z
substances do not, in principal, require a prewash. Prewashing is, however, required if
the unloading of these cargoes has not been completed following the ship’s P&A
manual.
In the prewash procedure, tanks are washed with a suitable washing medium until the
chemical content decreases below 0.1 % by weight (Table 3.1). Once the prewash has
been completed, a MARPOL surveyor authorized by the Government inspects the
cleaning result and verifies that it is, in fact, satisfactory (confirmed by an entry in the
Cargo record book9) (MARPOL Annex II Reg. 13.6). Moreover, a ship cannot leave the
port of unloading until the prewash slops are discharged ashore. This is to ensure that
the most hazardous chemical residues will not end up in the sea with further washings.
There are no specific stripping requirements for prewash effluents other than that the
tank and lines need to be efficiently stripped. In case of high-viscosity and solidifying
substances, the tanks must be washed with hot water (temperature at least 60 °C) to
facilitate the cleaning process, unless the properties of the substance make washing less
effective. The amount of water required in a prewash depends on the quantity of the
chemical residue, tank volume, cargo properties, and the maximum concentration
required for subsequent washings (Kunichkin 2006). The required water quantity is the
greatest for solidifying / high-viscosity category X substances. For cleaning a low-
9 Every ship to which Annex II applies must have a Cargo Record Book. After completion of any
operations relating to loading, unloading, cleaning and discharging of slops etc., the operation shall
promptly be recorded in the Cargo Record Book (MARPOL Annex II reg. 15).
Tank cleaning in the Baltic Sea – Assessment of the ecotoxicity of tank cleaning effluents 29
viscosity or non-solidifying category X substance, the required water quantity is
somewhat smaller, and since category Y substances are considered less harmful than
category X substances, the water volume required in a prewash involving them is the
smallest. For example, the tank cleaning effluents generated during the prewashing of
phenol and styrene are typically 10–30 m3
per tank (HELCOM 1993).
It is important to be aware of the fact that MARPOL prewashing alone is not a
sufficient method for cleaning cargo tanks. The tanks practically always need additional
washing due to commercial needs (HELCOM 1993). The commercial (i.e. the main)
washing takes at least one hour, but for some cargoes the whole cleaning process may
take up to 4–6 hours (flushing, steaming etc. included). As a consequence, the time and
therefore also the water quantity required is markedly larger than in prewashing.
3.2.1 Solidifying and high-viscosity substances – definitions and prewash
requirements
A solidifying substance is defined in Regulation 1.15 of Annex II as a noxious liquid
substance which:
1. has a melting point of less than 15 °C, and which at the time of unloading is at a
temperature of less than 5 °C above its melting point; or
2. has a melting point of equal to or greater than 15 °C, and which at the time of
unloading is at a temperature of less than 10 °C above its melting point.
Phenol, for example, has a melting point of ca. 41 °C (Lide 2005) and, therefore, the
unloading of phenol should take place at a temperature greater than 51 °C (41 + 10 =
51). As this is never true in natural conditions, phenol is defined as a solidifying
substance. Other examples of solidifying substances are paraffin wax and slack wax
(Kunichkin 2006).
A high-viscosity substance is defined in Regulation 1.17 of Annex II as a noxious
liquid substance in category X or Y with a viscosity equal to or greater than 50
millipascal-seconds (mPa.s) at the unloading temperature. Examples of high viscosity
substances are sodium hydroxide (viscosity of a 50% solution: 78 mPa.s at 20 °C;
CEDRE 2005) and nonylphenol and nonylphenol ethoxylates (viscosity of nonylphenol:
563 mPa.s at 20 °C; HSDB 2012). The definition of viscosity given above means that
some vegetable oils may require a prewash procedure. Soft oils, such as rape, soya and
sun flower oils, are vegetable oils to which the prewash requirement primarily applies
(the BLG working group 2009).
High-viscosity and solidifying category Y substances may avoid MARPOL’s
requirements for prewash if the cargo is heated during unloading. For solidifying
substances, the following requirements must be met to avoid prewashing:
cargoes with a melting point of less than 15 °C must be unloaded at a
temperature of at least 5 °C above its melting point
cargoes with a melting point equal to or greater than 15°C are to be unloaded at
a temperature of at least 10 °C above their melting point (Kunichkin 2006).
30 Honkanen, Häkkinen and Posti
We should note that if the unloading temperature of high-viscosity / solidifying
substances is lower than required, the prewash becomes mandatory. In practice, high-
viscosity and solidifying category Y substances can seldom avoid the prewash
requirement even if they were heated during unloading (Keskitalo 2012 pers. comm.).
This is because the cargo does not typically stay heated during the entire unloading
process due to shortcomings in the available heating techniques. At present, there are
two prevailing cargo heating systems: in the first one, heating coils are installed inside a
tank, whereas the second system is based on recirculating the cargo through cargo
heaters on deck. Of the two systems, the latter is more efficient in keeping the cargo
heated. In the former, the heating coils are situated a few centimetres above the tank top.
Such placement leads to a forming of a cold space below the heating coils, which tends
to cool the cargo down. A ballast water tank situated under cargo tanks adds to the
cooling effect as well, even when empty. There also is a new heating system that offers
an alternative for heating coils and up-deck cargo heaters. In this new system, heating
ducts are installed under the tank top. This way there are no cold spaces, and the tank
top itself acts as a cargo heater. Heating ducts are an even more efficient heating system
than recirculating the cargo through the up-deck cargo heaters. With heating ducts, the
cargo can be kept liquid and problems with solidifying cargoes are nearly non-existent.
However, heating ducts are not only a new but also a fairly expensive system to install.
Consequently, they are yet to become more common in chemical tankers of today.
3.3 Ventilation
In case of highly volatile chemicals (whose vapour pressure exceeds 5 kPa at a
temperature of 20 °C), the residues from tanks can be removed by ventilation alone
(Appendix 7.1 to Annex II). For example, benzene and ammonia, with vapour pressures
of ca. 10 kPa (at 20 °C) and 880 kPa (at 21 °C) respectively (EnviChem 2012; CEPA
2001a), are chemicals whose residues can be ventilated. Biofuels and ethanol fuel
mixtures are other examples of substances whose residues can typically be removed by
ventilation (Vähätalo 2012 pers. comm.). The ventilation procedure is preferable than
water washing when possible, as unnecessary cleaning of tanks with water or with other
cleaning agents loads the environment. MARPOL Annex II contains no regulations on
where the ventilation of cargo residues must be performed, but port authorities may
have their own regulations that prohibit it in their docks (Kunichkin 2006). This is the
case in almost all Finnish ports (Vähätalo 2012 pers. comm.). This is mainly because
some gas vapours are extremely toxic and flammable and can be harmful to human
health (Kunichkin 2006). Benzene, for example, is a known human carcinogenic and
chronic exposure to its vapours can cause leukaemia even in very low concentrations
(few parts per million = ppm) (Majima et al. 2000). Furthermore, when considering the
whole transport chain of benzene (loading, navigation, unloading, cleaning), the
cleaning of the tanks is the very phase where the largest amounts of benzene gas are
emitted into the air (Majima et al. 2000). Considering the safety of port personnel and
the fact that ports are typically located near settlement, it is quite understandable that
ventilation is not allowed in the docks. When ventilation of chemical residues from
tanks cannot be accomplished ashore, it is executed at sea.
Tank cleaning in the Baltic Sea – Assessment of the ecotoxicity of tank cleaning effluents 31
In the ventilation procedure, tanks are ventilated until no visible remains of liquid can
be observed (Kunichkin 2006). On the completion of the ventilation process, an
inspection by a MARPOL surveyor is required before the ship can leave the port (to
ensure that the tank is in fact clear of hazardous cargo residues) (Vähätalo 2012 pers.
comm.). Any water introduced in the tank subsequent to ventilation is regarded clean,
and therefore, any washings subsequent to ventilation are not subject to the discharge
requirements of MARPOL Annex II (reg. 13.3). Additional water washing prior to
ventilation may be needed in some occasions – typically, when the cleaning result by
ventilation alone does not meet the commercial requirements for loading the next cargo
(ICS 1995).
32 Honkanen, Häkkinen and Posti
4 TANK CLEANING AND THE ENVIRONMENT
To examine the environmental impact of tank cleaning effluents, several reports and
scientific papers addressing the environmental impact of maritime transport of
chemicals were reviewed. It became clear that the number of studies focusing on the
risks of marine transport of oil is far greater than that of studies focusing on the risks
arising from chemical transportation. In addition, most of the studies, both on oil and
chemical shipping, are focused on large spills resulting from shipping accidents (the
size of which typically is on a scale of hundreds or even thousands of tonnes; HELCOM
2002). Studies on the impact of chronic pollution from routine shipping operations, such
as tank cleaning and bilge water handling, where smaller spills occur more or less
frequently, are relatively few – particularly in case of chemicals. This is partly due to
the “invisible” nature of operational discharges (Ng & Song 2010): the amounts of
hazardous substances that are released at a time are relatively small and the
consequences cannot be seen instantly. In contrast, a spill from a disastrous shipping
accident may exceed a thousand tonnes at worst, and the consequences can typically be
seen immediately (e.g. surfacing of dead fish10
). In addition, large tanker accidents are
typically well covered by the media, whereas minor discharges resulting from routine
shipping operations are rarely considered newsworthy. All in all, due to its invisibility,
the issue of chronic pollution resulting from operational discharges has been, at least to
some degree, overlooked by both researchers and the shipping industry (Ng & Song
2010). In this Chapter, the environmental impact of operational discharges resulting
from tank cleaning is reviewed. The impact of oil was included, as the literature on
operational chemical discharges was very limited.
4.1 Oil
Despite its invisible nature, chronic operational pollution from commercial ships may
still be a significant threat to the marine environment. It has been estimated that oil
discharges resulting from routine shipping operations (including illegal discharges)
greatly exceed the amounts of oil that are being released during large tanker accidents
(Hampton et al. 2003). In the EU alone, operational oil discharges have been estimated
to equal 8 Exxon Valdez sized spills every year (Camphuysen 2007). The worldwide
releases of oil have been estimated to be approximately 1 million tonnes per year, which
is as a substantial reduction from the ca. 6 million tonnes per year rate in the 1970s.
However, we should note that these numbers are rough estimations, as adequate
information on the current pollution status is scarce. Even though the amount of oil that
is released in the sea in a single incident of operational discharge is small, at least in
comparison to accidental oil spills, the overall environmental impact may be quite
significant. It is not only the size of the spill that determines the severity of the
environmental impact but also the type of oil, weather conditions (e.g. wind and waves)
and overall sensitivity of the area where the spill happens that matters. Even small
amounts of oil may kill large amounts of sea birds, as noted by Hampton et al. (2003).
10
In July 2000, 2 tonnes of nonylphenol ethoxylate leaked from an Italian tanker Crystal Rubino in the
Port of Hamina due to overloading. Dead fish surfaced almost immediately. Long-term effects,
e.g. those affecting birds, may also have occurred (Helsingin Sanomat 2003).
Tank cleaning in the Baltic Sea – Assessment of the ecotoxicity of tank cleaning effluents 33
Consequently, chronic oil pollution may actually be far greater a threat to aquatic biota
than large oil tanker accidents (Hassler 2011).
Operational discharges of oil have historically resulted mostly from two sources: cargo
tank cleaning and oil contaminated ballast waters (Hampton et al. 2003). Nowadays,
segregated ballast tanks (SBT) in ships have significantly reduced the problem of oil
contaminated ballast waters. Consequently, tank cleaning remains the main source of
operational discharges of oil. Moreover, methods such as “load on top” (LOT) and
crude oil washing (COW) have significantly reduced the amount of oil that is being
released into the environment because of tank cleaning (Hassler 2011). The former
refers to a method were oil-water mixtures generated during tank cleaning are not
discharged overboard but transferred into a designated slop tank instead. Since oil is
lighter than water, it will gradually separate from water during the voyage and settle on
top of it. The more or less clean water phase can then easily be pumped out of the tank
and discharged into the sea. The next oil cargo in the loading port may then be loaded
on top of the previous oil remnants. Crude oil washing, on the other hand, is a cleaning
technique where, instead of using sea water, the tanks are washed with crude oil itself.
Washing the cargo residues on the tank walls and bulkheads with oil dissolves the
residues into the oil, after which they can be pumped out and reunited with the rest of
the cargo. Crude oil washing generates practically no cleaning effluents, which makes
the COW method profitable from both the environmental and the commercial point of
view. Finally, a significant factor that has reduced the problem of chronic oiling is free
reception facilities in ports (“no special fee system”). In the Baltic Sea area, for
example, major ports are required to supply reception facilities for oily residues from
tankers and arrange for the proper disposal of the effluents. Most importantly, the ports
are not allowed to charge the vessels any extra fees for using their reception facilities.
The Baltic Sea is defined as a special area under MARPOL Annex I, which means that
any discharge of oil or oily mixtures is prohibited there11
(HELCOM 2010d).
Unfortunately, the MARPOL regulations are rather systematically violated. For
example, in 2011, there were 122 confirmed illegal oil discharges in the Baltic Sea area
(HELCOM 2011). However, the number of discharges detected has been constantly
decreasing over the last 20 years, despite the ever growing traffic, so there has definitely
been some improvement in terms of compliance with the MARPOL regulations. The
total estimated volume of oil spills observed in 2011 was on average 24 m3, and most of
the spills (93%) were smaller than 1 m3. However, as noted by Hassler (2011), oil spills
are detected by means of aerial surveillance, which is typically carried out during the
day. Since illegal discharges are more likely to occur during the night, a considerable
amount of deliberate discharges may go unnoticed. According to HELCOM (2011), of
all the aerial surveillance flight hours in 2011, only 15% were carried out at night (this
figure for 2010 being 12%). The scale of chronic oil pollution can, in addition to aerial
surveillance and other visual observation methods, be estimated indirectly by following
port statistics of, for example, the discharge of oily wastes into reception facilities, and
by systematically counting beached sea birds contaminated by oil (Camphuysen 2007).
11
Outside special areas, an oil tanker of 15,000 dwt could, within the limits of Annex I, release 500 and
a tanker of 100,000 dwt, 3,300 l of oil residues into the sea (Tanker Operator 2008b).
34 Honkanen, Häkkinen and Posti
Beached bird surveys have been proven to be an effective and sensitive way of
estimating the degree of chronic oiling in many case studies in the North Sea (Skov et
al. 2011). In the Baltic Sea, similar systematic surveys have been scarce.
Sea birds are the organism group that suffers the most from oil pollution. Birds are
affected by oil in many ways, but the most detrimental one is oil's ability to adsorb to
feathers and damage the insulating properties of the plumage (Camphuysen 2007).
Without insulation from the cold, birds cannot survive in the marine environment. In
addition to the acute effects of oil, oil may also affect birds and other organisms in the
long term (e.g. by affecting growth and weakening the immunity system; Helle &
Kuikka 2010). Bird species living offshore are the most susceptible to the impacts of
oil. When Hampton et al. (2003) evaluated the risks of tank cleaning effluents
containing oil to sea birds on the Californian coast, they hypothesized that constant
discharges of tank cleaning effluents could very well cause significant population-scale
effects on offshore birds. Some species of auks and storm-petrels, for example, spend
extensive periods of time breeding and foraging in waters which were assumed to be
frequently receiving oily tank cleaning waters (Hampton et al. 2003). The authors also
concluded that it was possible that bird populations could also be impacted on a
regional scale along the busiest shipping routes. Clear examples of this are the coasts of
Canada, which are riddled with busy shipping routes. Hundreds of thousands of sea
birds living there are killed each year from operational oil discharges from commercial
ships (Hampton et al. 2003, Environment Canada 2011).
Sea birds are affected by chronic discharges of oil in the offshore waters of the Baltic
Sea as well. In Southern Sweden, chronic oiling has been estimated to be a significant
cause of mortality in wintering offshore birds, particularly in long-tailed ducks
Clangula hyemalis and black guillemots Cepphus g. grylle (Skov et al. 2011). The
numbers of long-tailed ducks affected by oil have been surveyed in Southern Gotland
for 15 years (Larsson & Tydén 2011). In the study period between 1996/97 and
2003/04, it was estimated that in central Baltic Sea, tens of thousands of long-tailed
ducks were injured annually by oil (Larsson & Tydén 2005). Moreover, when long-
tailed ducks caught in fish nets near Hoburgs Bank (a shallow offshore area to the
southeast of Gotland) were analysed, it was found that 11.8% of the 998 birds analysed
had oil on their plumage. During the latest study period (from 2007/08 to 2010/11), the
number of long-tailed ducks contaminated by oil decreased from the previous years.
However, it was not clear whether the decrease stemmed from the decreasing number of
operational oil discharges or from an overall declining trend in long-tailed duck
populations in the Baltic Sea area. Moreover, since two of the winters during the study
period were particularly cold, parts of the study locations were covered by ice in the
wintertime. Because the ice prevented the affected birds from washing ashore, the
number of oiled birds was most likely underestimated (Larsson & Tydén 2011).
As discussed above, due to such factors as effective surveillance and free reception
facilities at ports, illegal operational discharges of oil have been decreasing in recent
years in the Baltic Sea waters. However, despite the positive trend, chronic oiling still
remains a significant hazard to the Baltic Sea environment, particularly to offshore sea
birds.

Tank cleaning in the Baltic Sea – Assessment of the ecotoxicity of tank cleaning effluents 35
4.2 Chemicals
Operational discharges of chemicals mainly consist of effluents generated during tank
cleaning. According to Maffii (2007), the volume of tank cleaning effluents containing a
chemical released into the sea worldwide is estimated to be 7 million tonnes every year.
The volumes have increased substantially from the 1970s, when the estimated annual
discharge rate of tank cleaning effluents containing a chemical was approximately
10,000 tonnes (Lakey 1975/76). Operational chemical discharges also exceed
operational oil discharges quite extensively. Of course, in contrast to oil, the discharge
of chemicals in tank cleaning waters is allowed in the Baltic Sea, and in fact, all over
the world (excluding the Antarctic) if certain conditions are met (see section 3.1). It is
therefore understandable that the volume of operational chemical discharges is larger
than the volume of operational oil discharges.
Factors reducing the risk arising from tank cleaning effluents
As regards tank cleaning, the degree of environmental exposure is largely dependent on
the quantity of chemicals that remains in a tank after unloading. Because of the special
stripping appliances used in chemical tankers today, these “strips” are in practice quite
small – typically less than 100 litres (GESAMP 2002). Moreover, with the latest
techniques, it is possible to drain the tanks almost completely dry (only a strip of a few
litres remaining after super stripping; Tanker Operator 2008a). Unfortunately, at
present, this super stripping system is very rarely utilised in unloading.
Cargo tanks are typically made of (or coated with) stainless steel, which makes their
inside surface smooth and therefore relatively easy to strip and clean (McGeorge 1995).
Easy and fast cleaning minimises the amount of water needed in tank cleaning, and
consequently, the amounts of slops generated during the entire cleaning process. Some
chemical tanks may also be coated with epoxy, polyurethane, zinc silicate or phenolic
resins depending on the cargo to achieve even more efficient cleaning results. The
efficient stripping and cleaning techniques have enabled the stringent stripping
requirements laid down in the revised MARPOL Annex II that entered into force in
2007.
In addition to setting the maximum limits for strip quantities, the Annex also governs
the discharge of effluents: how and where it must be carried out. By following the
MARPOL requirements for discharge, an effective immediate dilution of tank cleaning
slops can be achieved (Mercier et al. 1973). First of all, when the discharge of tank
cleaning slops is done below the waterline and at a speed greater than 7 knots, the flow
will carry the slops into the propeller, where they will be broken up and be well
dispersed and diluted in the propeller's wake (McGeorge 1995). In theory, the chemical
concentration will not exceed 1 ppm after this. If the discharge were not performed as
required by MARPOL, e.g. it were carried out from a dragging ship and over the side,
the initial dilution would be inefficient and the harmful substances would precipitate on
the same location making the environmental hazard considerably greater. However, as
regards the dilution of effluents, it must be noted that even though pollutants are
considered to disperse and dilute fairly well in the sea (especially when the discharge is
36 Honkanen, Häkkinen and Posti
carried out as required by MARPOL), hydrophobic substances which adsorb to
particulate matter are carried by water currents and are therefore typically precipitated
on the same location (Walker et al. 2006).
The reason behind the MARPOL requirement stating that tank cleaning effluents must
be discharged in waters at least 25 metres deep is to ensure that the water volume at the
discharge location is great enough to allow a high degree of dilution. In oceans, the
dilution and also the degradation of harmful substances is particularly efficient because
of their enormous size and water currents, but lakes and small inland seas are of a
completely different nature (Walker et al. 2006). The Baltic Sea, in particular, is of great
concern regarding chemical (and oil) discharges. The Baltic Sea, being a semi-enclosed
inland sea, has a very slow water exchange rate. This combined with the low
temperatures of the northern climate makes the Baltic Sea highly vulnerable to
hazardous substances, as these factors result in slow dilution and degradation of
substances (HELCOM 2010c).
Case studies
No previous assessments of chemical concentrations resulting from operational
discharges from chemical tankers in the Baltic Sea were found in this study. This may
partly be because evaluating the scale of chronic chemical pollution from ships is quite
challenging. First of all, many chemicals dilute and/or volatize very rapidly once they
are released into the sea and cannot therefore be detected as easily as, for example, oil
(Hurford et al. 1989). Moreover, due to the background pollution in the sea (e.g. from
land and atmospheric sources), measuring chemical concentrations in the sea is not the
most reliable indication of the scale of chronic pollution caused by shipping. Analysing
water samples for chemicals indicates whether the sample is contaminated or not, and
by which chemical(s), but it does not, however, specify the origin of the chemical(s).
Several general screening surveys have been conducted on chemical concentrations in
different parts of the Baltic Sea (e.g. Lilja et al. 2009, HELCOM 2010c, Andersson et
al. 2012). However, these screenings focused on chemicals and chemical groups that are
of high concern in the Baltic Sea area, many of which originate from atmospheric
sources and/or from land, rather than being transported in bulk by chemical tankers (e.g.
dioxins, furans and heavy metals). Some of the target chemicals could in theory
originate, at least partly, from tank cleaning (e.g. nonylphenol and nonylphenol
ethoxylates), but none of the projects have singled out operational discharges from
chemical tankers as a possible source of chemical contamination in the Baltic Sea.
In the North Sea, two case studies have been conducted where the risks of discharging
tank cleaning effluents into the sea were evaluated. These studies were conducted by
Hurford et al. (1989, 1990) who did a sampling survey on the concentrations of certain
chemicals in the North Sea that were known to be discharged with tank cleaning waters
into the sea. Isopropyl benzene, perchloroethylene, phenol and di (2-ethylhexyl)
phthalate were selected as target chemicals in their first study. The sampling survey was
accomplished twice – before and after the implementation of MARPOL Annex II – to
evaluate whether the MARPOL discharge requirements had a positive effect on
chemical concentrations in the North Sea. One objective of the sampling surveys was to
Tank cleaning in the Baltic Sea – Assessment of the ecotoxicity of tank cleaning effluents 37
discuss whether there was a need to declare the North Sea a special area (Hurford et al.
1989). At the time, only the Baltic Sea and the Black Sea had been designated special
areas under Annex II. In addition to measuring chemical concentrations in locations
where discharging of tank cleaning slops was considered to be most likely, the authors
produced estimates of discharge concentrations based on the import volumes of the
target chemicals to North Sea ports and the residue quantity estimated to remain in a
cargo tank after unloading (= the strip). The properties of the North Sea (water volume
and exchange time) were also considered in the calculations.
In the first study (conducted in April 1986), the measured chemical concentrations were
analysed from samples taken from 32 sampling stations along the Eastern coast of
England (near UK ports where target chemicals were typically unloaded) and in the
central North Sea. The measured concentrations were in most cases between 0.001 and
0.1 µg/l, and they were generally of a similar magnitude as the modelled concentrations.
According to Hurford et al. (1989), the 96h LC50 values of the target substances were in
the range of 1–100 mg/l. Since the measured concentrations were four or five orders of
magnitude lower than the corresponding toxicity values, the authors concluded that the
measured concentrations of the target chemicals would not be likely to cause significant
harm to the marine environment. However, as the authors noted, in assessing ecological
risks from short-term toxicity values determined in stable laboratory conditions in single
species tests, a measure of caution is definitely called for. The acute toxicity values are
rough estimates of toxicity at best. It is also important to be aware of the fact that the
measured concentrations account not only for pollution caused by operational
discharges from chemical tankers but for all pollution from various sources (e.g. from
land, air and offshore installations, such as oil platforms). The results of the first
sampling survey suggested that even before the implementation of MARPOL Annex II,
the discharge of tank cleaning effluents into the sea did not cause a significant pollution
problem in the North Sea area (Hurford et al. 1989).
The second sampling survey in the North Sea (Hurford et al. 1990) was conducted
approximately 18 months after the implementation of MARPOL Annex II (in October
1988). There were a total of 40 sampling stations, and the concentrations of
chlorobenzene, ethylbenzene, styrene and xylene were now measured from samples in
addition to the four chemicals whose concentrations were also measured in the first
survey (Hurford et al. 1989). The results of the second survey reinforced the conclusion
inferred in the first survey: the discharging of tank cleaning effluents in the North Sea
did not cause significant harm to the North Sea biota. The measured concentrations
were once again extremely low, most of the time even below the detection limits of the
available technique. The modelled concentrations were in the same range as the
measured values. The measured concentrations were three or four orders of magnitude
lower than the 96h LC50 values of the target chemicals. In other words, the chemical
concentrations were now even lower than they were in the first survey. The authors,
however, noted that the results of the two surveys could not be compared without
reservation, as weather conditions during the second survey were more severe. Wind
and waves, for example, may have increased the elimination rates of volatile chemicals
from water into the air and amplify the mixing of waters in the water column.
Moreover, the transportation volumes of a chemical may have changed between the
38 Honkanen, Häkkinen and Posti
surveys, and there may also have been changes in pollution from other sources.
However, despite these uncertainties, it could be concluded that the implementation of
MARPOL Annex II had decreased chemical concentrations in the North Sea.
Consequently, it seemed that tank cleaning effluents were not a significant
environmental threat in the North Sea.
Even though the results of Hurford et al (1989, 1990) indicated that tank cleaning did
not pose a significant threat to the aquatic organisms in the North Sea, this does not
guarantee that tank cleaning does not cause pollution in the Baltic Sea. As noted before
in section 2.1, the Baltic Sea is a shallow inland sea with a long water turnover time.
Consequently, dilution and dispersion are not as extensive, and degradation is not as
rapid in the Baltic Sea as it is in the North Sea. Moreover, as noted by the GESAMP
Working group (Portmann 1981), chemicals that have a tendency to bioaccumulate in
organisms pose a special risk in the environment, even when singular releases are small.
When small amounts of chemicals are released in the sea more or less frequently, the
chemical concentrations may bioaccumulate in organisms and eventually reach toxic
levels causing delayed toxicity. None of the chemicals targeted by Hurford et al (1989,
1990) were particularly persistent or bioaccumulative. Many of them were highly
volatile: only styrene, di (2-ethylhexyl) phthalate and phenol were non-volatile
substances. Moreover, phenol degrades rather rapidly in water (CEPA 2000). However,
the measured concentrations of styrene and di (2-ethylhexyl) phthalate in the water
samples were still very low in general (below 0.01 µg/l for styrene and below 0.05 µg/l
for DEHP; Hurford et al. 1990). Also measuring chemical concentrations from fish
samples could have told us more about environmental exposure to tank cleaning
effluents, especially in terms of the more hydrophobic chemicals. Oost et al. (2003)
reviewed the use of fish bioaccumulation biomarkers in environmental risk assessment
quite extensively, and according to them, screening chemical concentrations in fish
could be an effective way of gaining knowledge of site-specific pollution when used in
compliance with other monitoring methods.
Operational discharges of oily non-mineral oil substances
As demonstrated by the sampling surveys conducted by Hurford et al. (1989, 1990),
implementing MARPOL Annex II in 1983 lowered the chemical concentrations in the
North Sea. The revision of MARPOL Annex II (in 2007) has probably reduced the
pollution arising from tank cleaning washings even further, but this is not certain, as the
subject has not been studied. The revision contains some important improvements:
stricter stripping limits, re-classification of several substances from category D to the
scope of MARPOL, and consequently, enforcement of in-port prewashes, not only for
the most hazardous category X cargoes but also for many high-viscosity and solidifying
cargoes that were previously in category D (ABS 2006).
Prior to the revision, all animal and vegetable oils and fats (e.g. palm oil and paraffin
wax) were classified in category D, which meant that they were considered only a minor
hazard if released in the sea (Lloyd's Register 2006). In addition, they did not require a
prewash procedure. However, these substances behave very similarly to mineral oil in
the marine environment: they form floating slicks, they are toxic, and they damage the
Tank cleaning in the Baltic Sea – Assessment of the ecotoxicity of tank cleaning effluents 39
cold insulation of bird plumage (Dahlmann et al. 1994). There have, in fact, been
several cases where animal and vegetable oils and fatty products discharged into the sea
with tank washings have caused substantial bird kills (Camphuysen et al. 1999 and the
references therein). For example, when Dahlmann et al. (1994) surveyed beached birds
in the North Sea (the coasts of Germany, the Netherlands and Denmark) in 1990–1993,
they found that chronic oiling, mostly due to tank washing, was the main cause of bird
deaths in the North Sea. However, the surveyed birds were greatly affected by palm oil,
paraffin wax and other MARPOL Annex II (category C and D) substances as well. Even
highly toxic category A chemicals were detected in the birds’ plumage (e.g.
dodecylphenols and bisphenols). The phenolic compounds were found to originate from
lubricating oil additives. In general during the study period, the German and Dutch
coasts suffered constantly from palm oil and paraffin wax pollution. There were several
reported pollution incidents involving both substances – all due to legal discharges of
tank cleaning effluents (Dahlmann et al. 1994). Some of the reported incidents were
more severe than others, and there even was one case on the coast of Netherlands where
paraffin wax caused the death of approximately 2,000 seabirds and a significant overall
pollution of beaches. In addition, on one occasion, 8 tonnes of paraffin wax had to be
cleaned from the beaches. Based on these findings, it is obvious that chronic discharges
of animal and vegetable oils and fats can cause substantial damage to marine biota.
The extensive pollution described above was mainly a consequence of the current state
of law. At the time, MARPOL regulations did not demand in-port prewashes for tanks
that had contained category D substances, regardless of whether they were high-
viscosity or solidifying substances or not. However, as noted by the then MARPOL
surveyor of Kotka District, Mr. Hannu Lappalainen (HELCOM 1993), residues of high-
viscosity and solidifying cargoes may be quite extensive after unloading. There had
even been a case where after unloading phenol from two cargo tanks, the amount of
phenol remnants had amounted to over 35 tonnes – even though the cargo was heated
during unloading. This is a rather good demonstration of the importance of prewashing
in keeping pollution from high-viscosity and solidifying cargoes at accepted levels.
The hazards of vegetable oils were recognized in the revision of MARPOL Annex II. At
present, all animal and vegetable oils and fats belong to MARPOL category Y (Lloyd's
Register 2006), meaning that they are considered a moderate hazard in the marine
environment. Moreover, many of these oils and fats are either high-viscosity or
solidifying substances and therefore fall under the prewash requirement. Consequently,
the amounts of animal and vegetable oils released in the sea with tank washings can be
expected to be reduced from the pre-revision times. However, no clear scientific
evidence on the subject could be found.
In addition to animal and vegetable oils, many other substances were also re-classified
from category D to category Y in the revision. A good example is caustic soda (sodium
hydroxide) (Lloyd's Register 2006) – one of the most frequently handled chemicals in
Baltic Sea ports (Posti & Häkkinen 2012). Consequently, the amounts of caustic soda
and also other re-classified substances that are being discharged into the sea with tank
cleaning slops have probably decreased as well, although once again, this is a purely
hypothetical assumption. As caustic soda is a high-viscosity cargo, tanks having
40 Honkanen, Häkkinen and Posti
contained it must now be prewashed ashore, and the prewash slops must be discharged
to a reception facility.
In conclusion, oily non-mineral oil substances (e.g. vegetable oils) and fatty substances
seem to be, if not the greatest, at least the clearest hazard arising from discharging tank
cleaning effluents in the environment. The discharging of non-persistent (e.g. volatile
and/or readily biodegradable) substances with tank cleaning effluents, on the other
hand, does not seem to cause a significant hazard to the marine environment. In
addition, when considering the reasonably high degree of deliberate oil discharges in the
Baltic Sea, we cannot help but wonder how these two individual sources of chronic
pollution affect aquatic biota when combined. Further research may be needed to
evaluate whether the chronic discharge of tank cleaning slops containing chemical adds
to the hazards arising from chronic oiling, or vice versa.
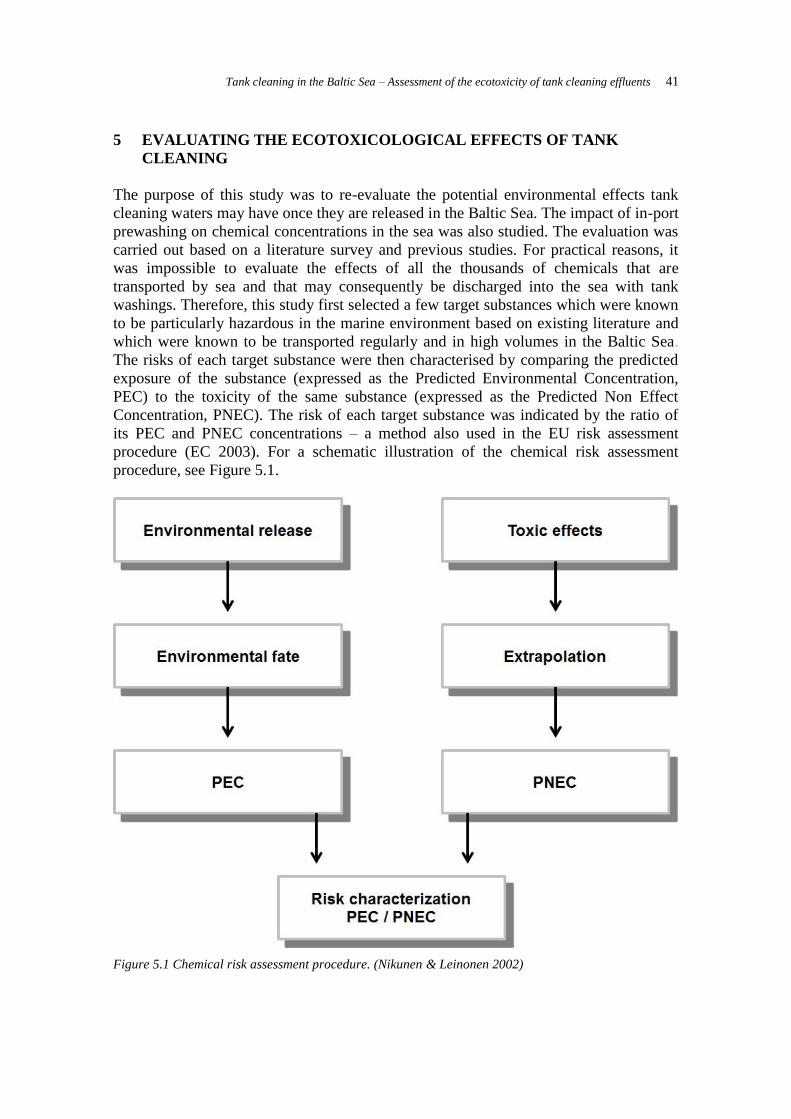
Tank cleaning in the Baltic Sea – Assessment of the ecotoxicity of tank cleaning effluents 41
5 EVALUATING THE ECOTOXICOLOGICAL EFFECTS OF TANK
CLEANING
The purpose of this study was to re-evaluate the potential environmental effects tank
cleaning waters may have once they are released in the Baltic Sea. The impact of in-port
prewashing on chemical concentrations in the sea was also studied. The evaluation was
carried out based on a literature survey and previous studies. For practical reasons, it
was impossible to evaluate the effects of all the thousands of chemicals that are
transported by sea and that may consequently be discharged into the sea with tank
washings. Therefore, this study first selected a few target substances which were known
to be particularly hazardous in the marine environment based on existing literature and
which were known to be transported regularly and in high volumes in the Baltic Sea.
The risks of each target substance were then characterised by comparing the predicted
exposure of the substance (expressed as the Predicted Environmental Concentration,
PEC) to the toxicity of the same substance (expressed as the Predicted Non Effect
Concentration, PNEC). The risk of each target substance was indicated by the ratio of
its PEC and PNEC concentrations – a method also used in the EU risk assessment
procedure (EC 2003). For a schematic illustration of the chemical risk assessment
procedure, see Figure 5.1.
Figure 5.1 Chemical risk assessment procedure. (Nikunen & Leinonen 2002)
42 Honkanen, Häkkinen and Posti
5.1 Target substances
The target substances for this study were chosen by utilizing the results of previous
studies. Since the scientific definition of a risk includes both the probability of the event
(e.g. chemical spill) and the severity of the impact resulting from that event (Helle &
Kuikka 2010), these factors were also taken into account when selecting the target
substances for the present study. First of all, as Hurford et al. (1989) noted regarding
evaluating the impact of tank washing, it is imperative to concentrate on substances
which are, in fact, being unloaded in the ports of the studied area. This is because tank
cleaning and subsequent discharges are most likely to occur after cargoes are unloaded
in ports. Consequently, assessing the environmental impact of hazardous substances that
are not unloaded in Baltic Sea ports would be entirely beside the point of this study.
However, gathering information on what substances are actually unloaded in Baltic Sea
ports, and thus involved in tank cleaning, turned out to be rather problematic. For
example, there is a nationwide vessel traffic system called PortNet in Finland which
gathers various data on ships that call at Finnish ports (the information that is collected
includes routes, cargo, hazardous cargo and maritime fees), but the system is, however,
best suited for gathering information on exports rather than imports (Posti & Häkkinen
2012). Therefore, the import data acquired from PortNet may have some deficiencies
and should be approached with caution. Moreover, separate import and export data on
liquid bulk chemicals was not available from the other Baltic Sea states. Therefore, the
next best thing was to concentrate on chemicals which were known to be transported
frequently and in high volumes in the Baltic Sea area. Even though the transport volume
of a particular chemical may not tell us much about the chemical’s role in tank cleaning,
at least it indicates that the chemical could in theory be washed into the Baltic Sea.
According to Posti & Häkkinen (2012) who, based on secondary literature sources,
conducted a survey of the volumes and identities of liquid bulk chemicals that are being
transported by ships in the Baltic Sea region, the most frequently handled chemicals in
the Baltic Sea ports are methanol, sodium hydroxide solution, methyl tert-butyl ether
(MTBE), xylenes, pentanes, ammonia, phenol, phosphoric acid, sulphuric acid and
ethanol and ethanol solutions. In addition to these substances, the authors identified
other high volume substances, such as ethylene, propane and butane. Furthermore, large
amounts of fertilizers and vegetable oils are shipped in the Baltic Sea area as well (Posti
& Häkkinen 2012).
As the magnitude of risk arising from chemical discharges depends greatly on the
hazardousness of the chemical, it was reasonable to select target substances which were
known to be more or less hazardous in the aquatic environment. As mentioned earlier in
section 2.4, the greatest risk to the aquatic environment arises from chemicals that are
toxic, highly soluble in water, persistent and with a tendency to bioaccumulate (Walker
et al. 2006). In regard to selecting the target substances, there were few chemical risk
assessments available in which chemicals shipped in bulk were scored and ranked
according to different parameters (e.g. transport volumes and environmental end-points,
such as toxicity to aquatic organisms and persistency). However, as the scientific
literature on chronic pollution resulting from maritime transport of hazardous
Tank cleaning in the Baltic Sea – Assessment of the ecotoxicity of tank cleaning effluents 43
substances is in general rather scarce, all the assessments were based on larger accident-
sized chemical spills. However, it was justified to also use these rankings in this study,
as the estimated environmental parameters are essentially the same regardless of the size
of the spill (which, compared to shipping disasters, is undeniably significantly smaller
in case of tank washings).
Regarding methodology, French McCay et al. (2006) estimated the potential ecological
consequences of chemical spills of difference sizes (0.5; 10 and 1,000 tonnes) using a
predictive spill model together with chemical hazard quotients. The model was run for a
selected range of chemicals typically shipped in bulk, and it estimated areas where the
predicted no effect concentration (PNEC) might be exceeded after the spill. The authors
concluded that of the 25 chemicals assessed, phenol and formaldehyde were the most
hazardous to aquatic biota, followed by ammonia, chlorobenzene, tetraethyl lead,
acetaldehyde, xylene, ethylbenzene, styrene and carbon tetrachloride. The HASREP
(2005) project, on the other hand, focused mainly on the transport volumes of
chemicals. The project identified 100 of the most transported harmful chemicals
between major EU ports (including trade through the English Channel). The project
assessed both the transport volumes and GESAMP hazard profiles, and as a result
identified the most hazardous chemicals to the marine environment. Based on their
assessment, the HASREP project highlighted substances such as styrene, benzene,
vegetable oil, methanol, xylene, molasses, phenol, vinyl acetate, toluene, sulphuric acid
and acrylonitrile. However, it was recognized that even though these substances have a
relatively high probability of spillage, all of them will not necessarily, if spilled, have a
significant impact on the marine environment (HASREP 2005). The priority list
composed by Häkkinen et al. (2012) was also helpful in selecting the target substances
for the present study. In their list, Häkkinen and his colleagues ranked 30 of the most
transported substances in the Baltic Sea region based on their transport volumes and
environmental hazardousness. The scoring system had similarities with the other
systems mentioned, but it had a clear advantage over the others in that it was devised
specifically for the Baltic Sea region. The chemicals that scored highest in the list were
nonylphenol, sulphuric acid, creosote, phenol and ammonia (positions in the priority list
1–5, respectively) (Häkkinen et al. 2012). All of these substances present a great hazard
if released into the marine environment, and all of them are also transported in relatively
high volumes (contributing to the probability of an accident). Besides these five
substances, benzene, styrene, xylenes and MTBE ranked relatively high on the list as
well.
There were also other valid risk assessments available as regards chemicals and aquatic
environments. Guerbet & Jouany (2002), for example, used a simplified risk assessment
method (SIRIS) and ranked 90 chemicals based on both exposure (water solubility,
lipophility, vapour pressure, persistence) and effect criteria (BCF, LC/EC/LD50) to
identify the substances that might present a risk to the aquatic environment. However,
the substances evaluated consisted of various kinds of pesticides and industrial
chemicals, and only a few of them appeared in the other rankings. Benzene, for
example, ranked 6th
, ethylbenzene 18th
and toluene 74th
. Interestingly enough, xylenes,
which were ranked reasonably high in other scoring systems, were at the bottom of the
list (88th place) composed using the SIRIS method (Guerbet & Jouany 2002).
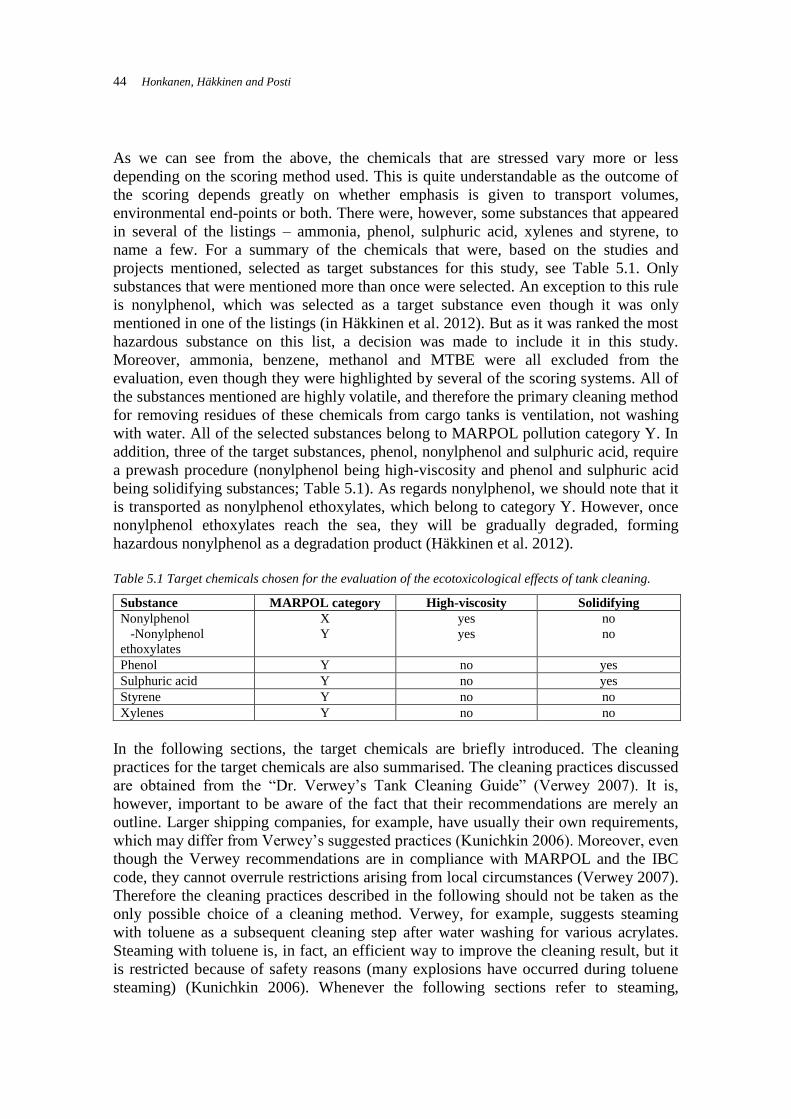
44 Honkanen, Häkkinen and Posti
As we can see from the above, the chemicals that are stressed vary more or less
depending on the scoring method used. This is quite understandable as the outcome of
the scoring depends greatly on whether emphasis is given to transport volumes,
environmental end-points or both. There were, however, some substances that appeared
in several of the listings – ammonia, phenol, sulphuric acid, xylenes and styrene, to
name a few. For a summary of the chemicals that were, based on the studies and
projects mentioned, selected as target substances for this study, see Table 5.1. Only
substances that were mentioned more than once were selected. An exception to this rule
is nonylphenol, which was selected as a target substance even though it was only
mentioned in one of the listings (in Häkkinen et al. 2012). But as it was ranked the most
hazardous substance on this list, a decision was made to include it in this study.
Moreover, ammonia, benzene, methanol and MTBE were all excluded from the
evaluation, even though they were highlighted by several of the scoring systems. All of
the substances mentioned are highly volatile, and therefore the primary cleaning method
for removing residues of these chemicals from cargo tanks is ventilation, not washing
with water. All of the selected substances belong to MARPOL pollution category Y. In
addition, three of the target substances, phenol, nonylphenol and sulphuric acid, require
a prewash procedure (nonylphenol being high-viscosity and phenol and sulphuric acid
being solidifying substances; Table 5.1). As regards nonylphenol, we should note that it
is transported as nonylphenol ethoxylates, which belong to category Y. However, once
nonylphenol ethoxylates reach the sea, they will be gradually degraded, forming
hazardous nonylphenol as a degradation product (Häkkinen et al. 2012).
Table 5.1 Target chemicals chosen for the evaluation of the ecotoxicological effects of tank cleaning.
Substance MARPOL category High-viscosity Solidifying
Nonylphenol
-Nonylphenol
ethoxylates
X
Y
yes
yes
no
no
Phenol Y no yes
Sulphuric acid Y no yes
Styrene Y no no
Xylenes Y no no
In the following sections, the target chemicals are briefly introduced. The cleaning
practices for the target chemicals are also summarised. The cleaning practices discussed
are obtained from the “Dr. Verwey’s Tank Cleaning Guide” (Verwey 2007). It is,
however, important to be aware of the fact that their recommendations are merely an
outline. Larger shipping companies, for example, have usually their own requirements,
which may differ from Verwey’s suggested practices (Kunichkin 2006). Moreover, even
though the Verwey recommendations are in compliance with MARPOL and the IBC
code, they cannot overrule restrictions arising from local circumstances (Verwey 2007).
Therefore the cleaning practices described in the following should not be taken as the
only possible choice of a cleaning method. Verwey, for example, suggests steaming
with toluene as a subsequent cleaning step after water washing for various acrylates.
Steaming with toluene is, in fact, an efficient way to improve the cleaning result, but it
is restricted because of safety reasons (many explosions have occurred during toluene
steaming) (Kunichkin 2006). Whenever the following sections refer to steaming,
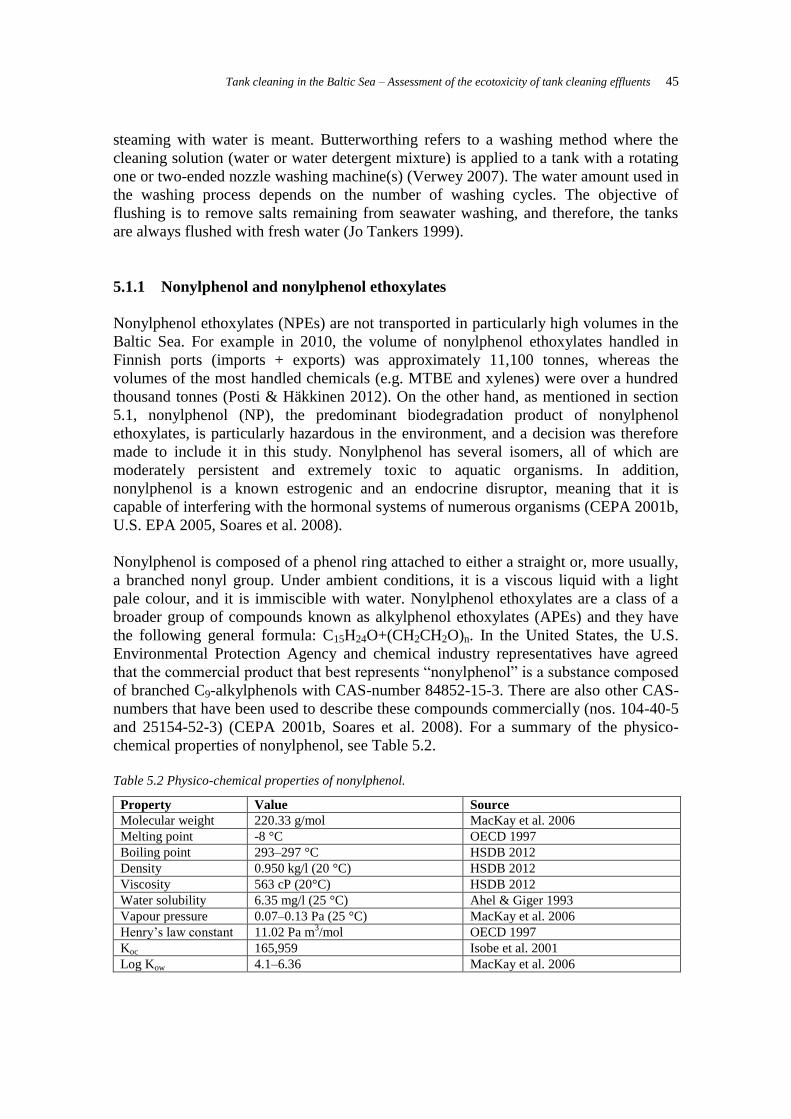
Tank cleaning in the Baltic Sea – Assessment of the ecotoxicity of tank cleaning effluents 45
steaming with water is meant. Butterworthing refers to a washing method where the
cleaning solution (water or water detergent mixture) is applied to a tank with a rotating
one or two-ended nozzle washing machine(s) (Verwey 2007). The water amount used in
the washing process depends on the number of washing cycles. The objective of
flushing is to remove salts remaining from seawater washing, and therefore, the tanks
are always flushed with fresh water (Jo Tankers 1999).
5.1.1 Nonylphenol and nonylphenol ethoxylates
Nonylphenol ethoxylates (NPEs) are not transported in particularly high volumes in the
Baltic Sea. For example in 2010, the volume of nonylphenol ethoxylates handled in
Finnish ports (imports + exports) was approximately 11,100 tonnes, whereas the
volumes of the most handled chemicals (e.g. MTBE and xylenes) were over a hundred
thousand tonnes (Posti & Häkkinen 2012). On the other hand, as mentioned in section
5.1, nonylphenol (NP), the predominant biodegradation product of nonylphenol
ethoxylates, is particularly hazardous in the environment, and a decision was therefore
made to include it in this study. Nonylphenol has several isomers, all of which are
moderately persistent and extremely toxic to aquatic organisms. In addition,
nonylphenol is a known estrogenic and an endocrine disruptor, meaning that it is
capable of interfering with the hormonal systems of numerous organisms (CEPA 2001b,
U.S. EPA 2005, Soares et al. 2008).
Nonylphenol is composed of a phenol ring attached to either a straight or, more usually,
a branched nonyl group. Under ambient conditions, it is a viscous liquid with a light
pale colour, and it is immiscible with water. Nonylphenol ethoxylates are a class of a
broader group of compounds known as alkylphenol ethoxylates (APEs) and they have
the following general formula: C15H24O+(CH2CH2O)n. In the United States, the U.S.
Environmental Protection Agency and chemical industry representatives have agreed
that the commercial product that best represents “nonylphenol” is a substance composed
of branched C9-alkylphenols with CAS-number 84852-15-3. There are also other CAS-
numbers that have been used to describe these compounds commercially (nos. 104-40-5
and 25154-52-3) (CEPA 2001b, Soares et al. 2008). For a summary of the physico-
chemical properties of nonylphenol, see Table 5.2.
Table 5.2 Physico-chemical properties of nonylphenol.
Property Value Source
Molecular weight 220.33 g/mol MacKay et al. 2006
Melting point -8 °C OECD 1997
Boiling point 293–297 °C HSDB 2012
Density 0.950 kg/l (20 °C) HSDB 2012
Viscosity 563 cP (20°C) HSDB 2012
Water solubility 6.35 mg/l (25 °C) Ahel & Giger 1993
Vapour pressure 0.07–0.13 Pa (25 °C) MacKay et al. 2006
Henry’s law constant 11.02 Pa m3/mol OECD 1997
Koc 165,959 Isobe et al. 2001
Log Kow 4.1–6.36 MacKay et al. 2006
46 Honkanen, Häkkinen and Posti
Nonylphenol ethoxylates and their degradation products are synthetic organic
chemicals. NPEs have been used for more than 50 years in detergents, emulsifiers,
wetting agents and dispersing agents. NPE-containing products have been used in many
sectors such as textile processing, pulp and paper processing, paints, resins and
protective coatings, steel manufacturing and pest control products (CEPA 2001).
According to Verwey’s Tank Cleaning Guide (Verwey 2007), cargo tanks having
contained nonylphenol (ethoxylates) are generally washed with hot sea water
(butterworthing, 6 cycles). Since nonylphenol ethoxylates are hydrophobic substances
(log Kow 4.1–6.36; Table 5.2), adding small amounts of detergent may in some cases be
necessary so that the cleaning result is satisfactory for loading the next cargo. For
example, when cleaning for ethanol, a detergent should be added. After the tanks have
been washed, they are flushed with fresh water, then steamed, drained, and finally dried.
It should be noted that nonylphenol ethoxylates are not accepted as a previous
immediate cargo to edible animal and vegetable oils and fats. Since nonylphenol
ethoxylates are a high-viscosity cargo, they are subjected to mandatory in-port prewash
as required by MARPOL Annex II.
5.1.2 Phenol
Phenol was highlighted in several of the surveyed scoring systems (by French McKay et
al. 2006, HASREP 2005 and Häkkinen et al. 2012), and it was therefore selected as a
target substance for the present study. Phenol was one of the most frequently handled
chemicals in Finnish ports in both 2008 and 2010 (73,040 t and 87,359 t respectively)
(Posti & Häkkinen 2012). Phenol is highly toxic to aquatic organisms, particularly to
fish, but it is not persistent in aquatic environments, nor is it likely to bioaccumulate in
organisms or food webs (HSDB 2012). In ambient conditions, phenol is a solidifying
substance, but it is used and transported in liquid form (FIOH 2011a). The transport
temperature of phenol is 50–55 °C.
Phenol is an aromatic alcohol with the chemical formula C6H6O. It is a white to light
pink crystalline solid and has a characteristic acrid smell and a sharp burning taste. For a
summary of the physico-chemical properties of phenol, see Table 5.3. Phenol is a
common industrial chemical used, for example, in the production of panels, insulation,
paints, lubricants, creams, adhesives, brakes, electrical components and electrodes. In
addition to these applications, phenol can also be used as a feedstock in the production
of other organic substances such as bisphenol A, alkylphenols, anilines, chlorophenols
and other chemicals. Phenol is also used as a general disinfectant, anaesthetic and
antiseptic, and it is present in a number of consumer products, including many dental
care products and antiseptic lotions. Phenol is also produced naturally in water and soil
as a decomposition product of vegetation and detritus. Increased natural environmental
concentrations of phenol may also result from forest fires (CEPA 2000).
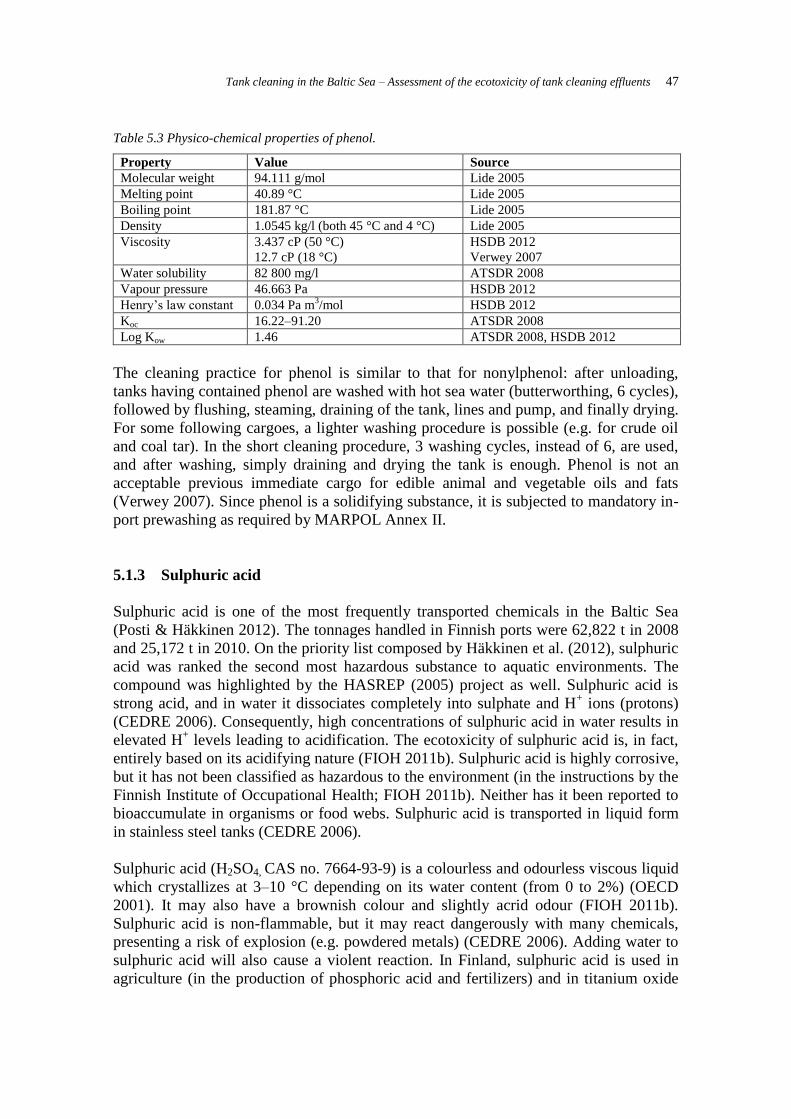
Tank cleaning in the Baltic Sea – Assessment of the ecotoxicity of tank cleaning effluents 47
Table 5.3 Physico-chemical properties of phenol.
Property Value Source
Molecular weight 94.111 g/mol Lide 2005
Melting point 40.89 °C Lide 2005
Boiling point 181.87 °C Lide 2005
Density 1.0545 kg/l (both 45 °C and 4 °C) Lide 2005
Viscosity 3.437 cP (50 °C)
12.7 cP (18 °C)
HSDB 2012
Verwey 2007
Water solubility 82 800 mg/l ATSDR 2008
Vapour pressure 46.663 Pa HSDB 2012
Henry’s law constant 0.034 Pa m3/mol HSDB 2012
Koc 16.22–91.20 ATSDR 2008
Log Kow 1.46 ATSDR 2008, HSDB 2012
The cleaning practice for phenol is similar to that for nonylphenol: after unloading,
tanks having contained phenol are washed with hot sea water (butterworthing, 6 cycles),
followed by flushing, steaming, draining of the tank, lines and pump, and finally drying.
For some following cargoes, a lighter washing procedure is possible (e.g. for crude oil
and coal tar). In the short cleaning procedure, 3 washing cycles, instead of 6, are used,
and after washing, simply draining and drying the tank is enough. Phenol is not an
acceptable previous immediate cargo for edible animal and vegetable oils and fats
(Verwey 2007). Since phenol is a solidifying substance, it is subjected to mandatory in-
port prewashing as required by MARPOL Annex II.
5.1.3 Sulphuric acid
Sulphuric acid is one of the most frequently transported chemicals in the Baltic Sea
(Posti & Häkkinen 2012). The tonnages handled in Finnish ports were 62,822 t in 2008
and 25,172 t in 2010. On the priority list composed by Häkkinen et al. (2012), sulphuric
acid was ranked the second most hazardous substance to aquatic environments. The
compound was highlighted by the HASREP (2005) project as well. Sulphuric acid is
strong acid, and in water it dissociates completely into sulphate and H+ ions (protons)
(CEDRE 2006). Consequently, high concentrations of sulphuric acid in water results in
elevated H+ levels leading to acidification. The ecotoxicity of sulphuric acid is, in fact,
entirely based on its acidifying nature (FIOH 2011b). Sulphuric acid is highly corrosive,
but it has not been classified as hazardous to the environment (in the instructions by the
Finnish Institute of Occupational Health; FIOH 2011b). Neither has it been reported to
bioaccumulate in organisms or food webs. Sulphuric acid is transported in liquid form
in stainless steel tanks (CEDRE 2006).
Sulphuric acid (H2SO4, CAS no. 7664-93-9) is a colourless and odourless viscous liquid
which crystallizes at 3–10 °C depending on its water content (from 0 to 2%) (OECD
2001). It may also have a brownish colour and slightly acrid odour (FIOH 2011b).
Sulphuric acid is non-flammable, but it may react dangerously with many chemicals,
presenting a risk of explosion (e.g. powdered metals) (CEDRE 2006). Adding water to
sulphuric acid will also cause a violent reaction. In Finland, sulphuric acid is used in
agriculture (in the production of phosphoric acid and fertilizers) and in titanium oxide
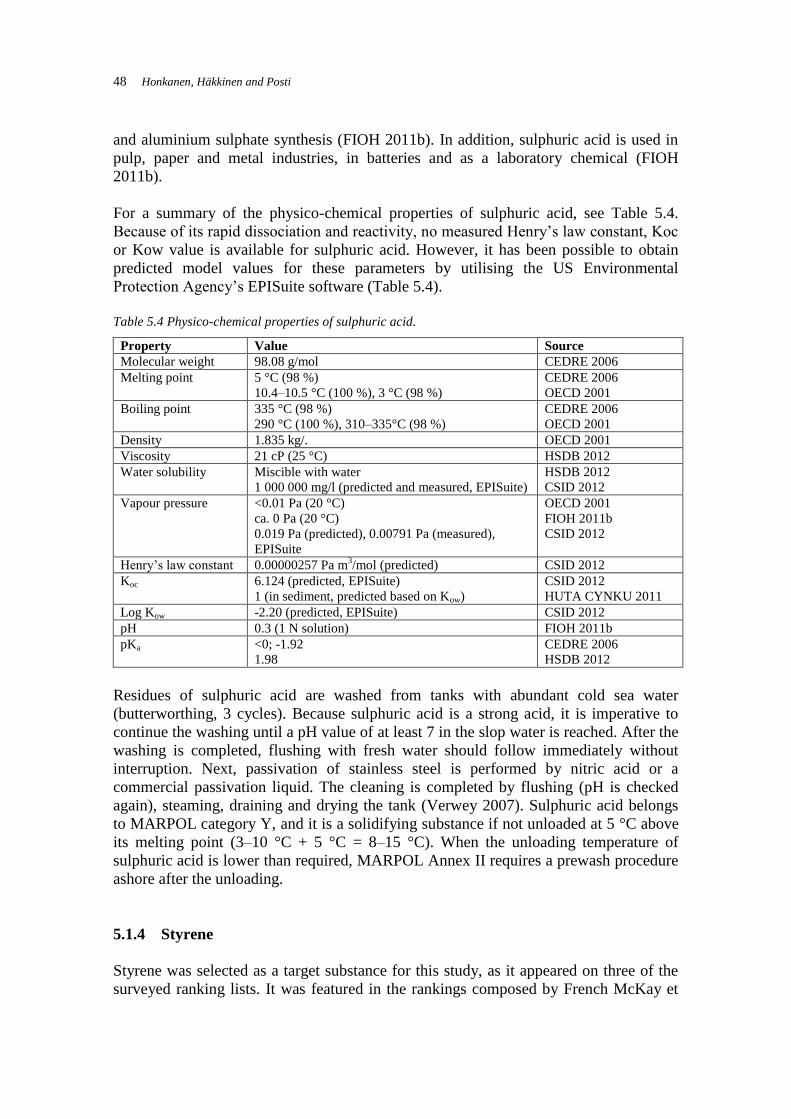
48 Honkanen, Häkkinen and Posti
and aluminium sulphate synthesis (FIOH 2011b). In addition, sulphuric acid is used in
pulp, paper and metal industries, in batteries and as a laboratory chemical (FIOH
2011b).
For a summary of the physico-chemical properties of sulphuric acid, see Table 5.4.
Because of its rapid dissociation and reactivity, no measured Henry’s law constant, Koc
or Kow value is available for sulphuric acid. However, it has been possible to obtain
predicted model values for these parameters by utilising the US Environmental
Protection Agency’s EPISuite software (Table 5.4).
Table 5.4 Physico-chemical properties of sulphuric acid.
Property Value Source
Molecular weight 98.08 g/mol CEDRE 2006
Melting point 5 °C (98 %)
10.4–10.5 °C (100 %), 3 °C (98 %)
CEDRE 2006
OECD 2001
Boiling point 335 °C (98 %)
290 °C (100 %), 310–335°C (98 %)
CEDRE 2006
OECD 2001
Density 1.835 kg/. OECD 2001
Viscosity 21 cP (25 °C) HSDB 2012
Water solubility Miscible with water
1 000 000 mg/l (predicted and measured, EPISuite)
HSDB 2012
CSID 2012
Vapour pressure <0.01 Pa (20 °C)
ca. 0 Pa (20 °C)
0.019 Pa (predicted), 0.00791 Pa (measured),
EPISuite
OECD 2001
FIOH 2011b
CSID 2012
Henry’s law constant 0.00000257 Pa m3/mol (predicted) CSID 2012
Koc 6.124 (predicted, EPISuite)
1 (in sediment, predicted based on Kow)
CSID 2012
HUTA CYNKU 2011
Log Kow -2.20 (predicted, EPISuite) CSID 2012
pH 0.3 (1 N solution) FIOH 2011b
pKa <0; -1.92
1.98
CEDRE 2006
HSDB 2012
Residues of sulphuric acid are washed from tanks with abundant cold sea water
(butterworthing, 3 cycles). Because sulphuric acid is a strong acid, it is imperative to
continue the washing until a pH value of at least 7 in the slop water is reached. After the
washing is completed, flushing with fresh water should follow immediately without
interruption. Next, passivation of stainless steel is performed by nitric acid or a
commercial passivation liquid. The cleaning is completed by flushing (pH is checked
again), steaming, draining and drying the tank (Verwey 2007). Sulphuric acid belongs
to MARPOL category Y, and it is a solidifying substance if not unloaded at 5 °C above
its melting point (3–10 °C + 5 °C = 8–15 °C). When the unloading temperature of
sulphuric acid is lower than required, MARPOL Annex II requires a prewash procedure
ashore after the unloading.
5.1.4 Styrene
Styrene was selected as a target substance for this study, as it appeared on three of the
surveyed ranking lists. It was featured in the rankings composed by French McKay et
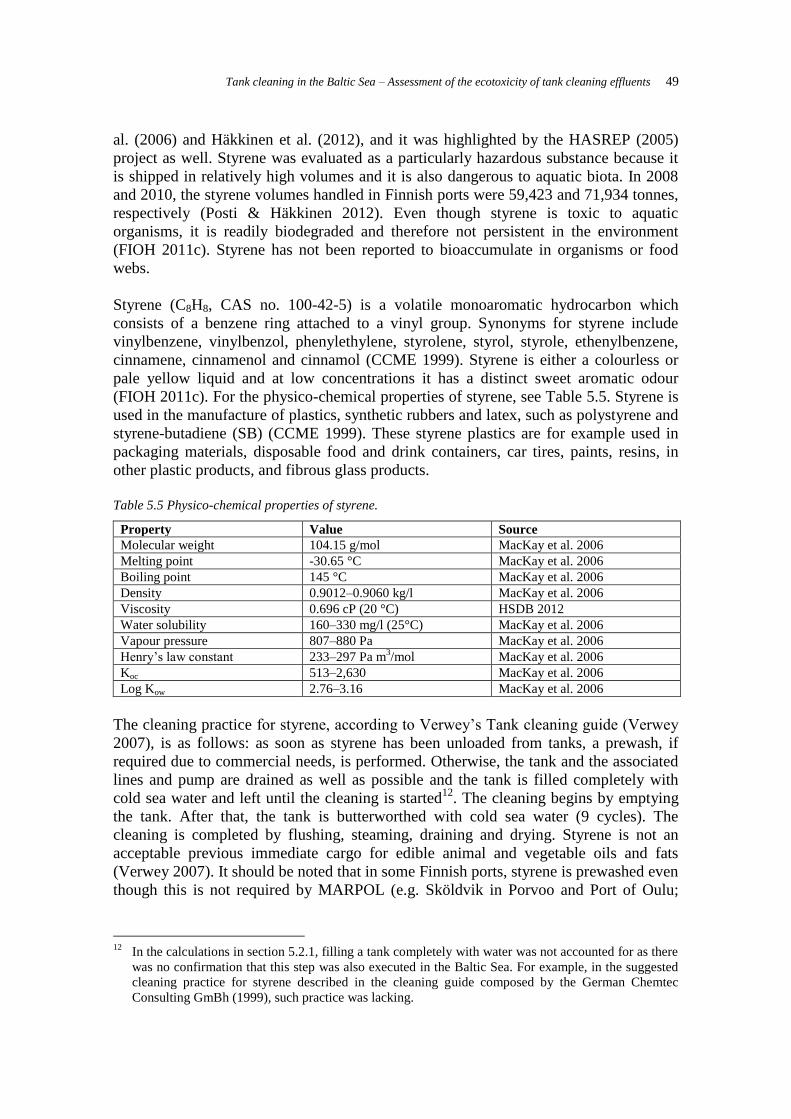
Tank cleaning in the Baltic Sea – Assessment of the ecotoxicity of tank cleaning effluents 49
al. (2006) and Häkkinen et al. (2012), and it was highlighted by the HASREP (2005)
project as well. Styrene was evaluated as a particularly hazardous substance because it
is shipped in relatively high volumes and it is also dangerous to aquatic biota. In 2008
and 2010, the styrene volumes handled in Finnish ports were 59,423 and 71,934 tonnes,
respectively (Posti & Häkkinen 2012). Even though styrene is toxic to aquatic
organisms, it is readily biodegraded and therefore not persistent in the environment
(FIOH 2011c). Styrene has not been reported to bioaccumulate in organisms or food
webs.
Styrene (C8H8, CAS no. 100-42-5) is a volatile monoaromatic hydrocarbon which
consists of a benzene ring attached to a vinyl group. Synonyms for styrene include
vinylbenzene, vinylbenzol, phenylethylene, styrolene, styrol, styrole, ethenylbenzene,
cinnamene, cinnamenol and cinnamol (CCME 1999). Styrene is either a colourless or
pale yellow liquid and at low concentrations it has a distinct sweet aromatic odour
(FIOH 2011c). For the physico-chemical properties of styrene, see Table 5.5. Styrene is
used in the manufacture of plastics, synthetic rubbers and latex, such as polystyrene and
styrene-butadiene (SB) (CCME 1999). These styrene plastics are for example used in
packaging materials, disposable food and drink containers, car tires, paints, resins, in
other plastic products, and fibrous glass products.
Table 5.5 Physico-chemical properties of styrene.
Property Value Source
Molecular weight 104.15 g/mol MacKay et al. 2006
Melting point -30.65 °C MacKay et al. 2006
Boiling point 145 °C MacKay et al. 2006
Density 0.9012–0.9060 kg/l MacKay et al. 2006
Viscosity 0.696 cP (20 °C) HSDB 2012
Water solubility 160–330 mg/l (25°C) MacKay et al. 2006
Vapour pressure 807–880 Pa MacKay et al. 2006
Henry’s law constant 233–297 Pa m3/mol MacKay et al. 2006
Koc 513–2,630 MacKay et al. 2006
Log Kow 2.76–3.16 MacKay et al. 2006
The cleaning practice for styrene, according to Verwey’s Tank cleaning guide (Verwey
2007), is as follows: as soon as styrene has been unloaded from tanks, a prewash, if
required due to commercial needs, is performed. Otherwise, the tank and the associated
lines and pump are drained as well as possible and the tank is filled completely with
cold sea water and left until the cleaning is started12
. The cleaning begins by emptying
the tank. After that, the tank is butterworthed with cold sea water (9 cycles). The
cleaning is completed by flushing, steaming, draining and drying. Styrene is not an
acceptable previous immediate cargo for edible animal and vegetable oils and fats
(Verwey 2007). It should be noted that in some Finnish ports, styrene is prewashed even
though this is not required by MARPOL (e.g. Sköldvik in Porvoo and Port of Oulu;
12
In the calculations in section 5.2.1, filling a tank completely with water was not accounted for as there
was no confirmation that this step was also executed in the Baltic Sea. For example, in the suggested
cleaning practice for styrene described in the cleaning guide composed by the German Chemtec
Consulting GmBh (1999), such practice was lacking.
50 Honkanen, Häkkinen and Posti
NesteOil 2006, Keskitalo 2012 pers. comm.). Cargo owners have requested it due to
environmental reasons.
5.1.5 Xylenes
Xylenes were ranked relatively high in three of the surveyed scoring systems (by French
McKay et al. (2006), Häkkinen et al. (2012) and HASREP (2005). In addition, xylenes
are among the most frequently transported liquid bulk chemicals in the Baltic Sea (Posti
& Häkkinen 2012). In Finnish ports, xylenes were the third most frequently handled
chemical in 2008 and the fourth most frequently handled chemical in 2010 (206,558 t
and 161,894 t, respectively). Consequently, xylene was selected as a target chemical for
the present study. Xylenes are volatile flammable liquids that are toxic to aquatic
organisms (FIOH 2011d). Xylenes have been reported to only bioaccumulate
moderately in organisms, they do not bioaccumulate along the food webs, and they are
not persistent in the environment (CEPA 1993).
Xylenes (mixture CAS no. 1330-20-7) are monoaromatic hydrocarbons consisting of
two methyl groups attached to a benzene ring (CEDRE 2008). The general molecular
formula of xylene is C6H4(CH3)2. There are three positional isomers of xylene: ortho-
(o-xylene CAS 95-47-6), meta- (m-xylene CAS 108-38-3) and para-xylene (CAS 106-
42-3). Xylenes are clear and colourless volatile liquids with a distinct aromatic odour
similar to benzene. For a summary of the physico-chemical properties of xylenes, see
Table 5.6. Xylenes are predominately manufactured from petrol or oil, but small
amounts of xylenes are also produced from coal tar (HSDB 2012). In a commercial
xylene mixture produced from oil, approximately 20% is o-xylene, 44% m-xylene, 20%
p-xylenes, and 15% ethylbenzene. In a commercial xylene mixture produced from coal
tar, on the other hand, approximately 45–70% is m-xylene, 23% p-xylene, 10–15% o-
xylene and 6–10% ethylbenzene. Commercial xylene may also be contaminated with
small amounts of, for example, toluene, phenol or benzene (HSDB 2012).
According to ATSDR (2007), 70% of the xylene mixture is used in the manufacture of
ethylbenzene and the o-, m- and p-isomers of xylene. The rest of the mixed xylene is
used as a solvent in the manufacture of products such as paint, varnish, glue, printing
ink, insecticides, and dyes (CEDRE 2008). Mixed xylene is also used in the rubber and
pharmaceutical product industries, in histology laboratories and in microscopy.
Individual xylene isomers are used, for example, in the synthesis of phthalic acid (o-
xylene), isophtalic acid and acide terephtalic acid (m-xylene and p-xylene).
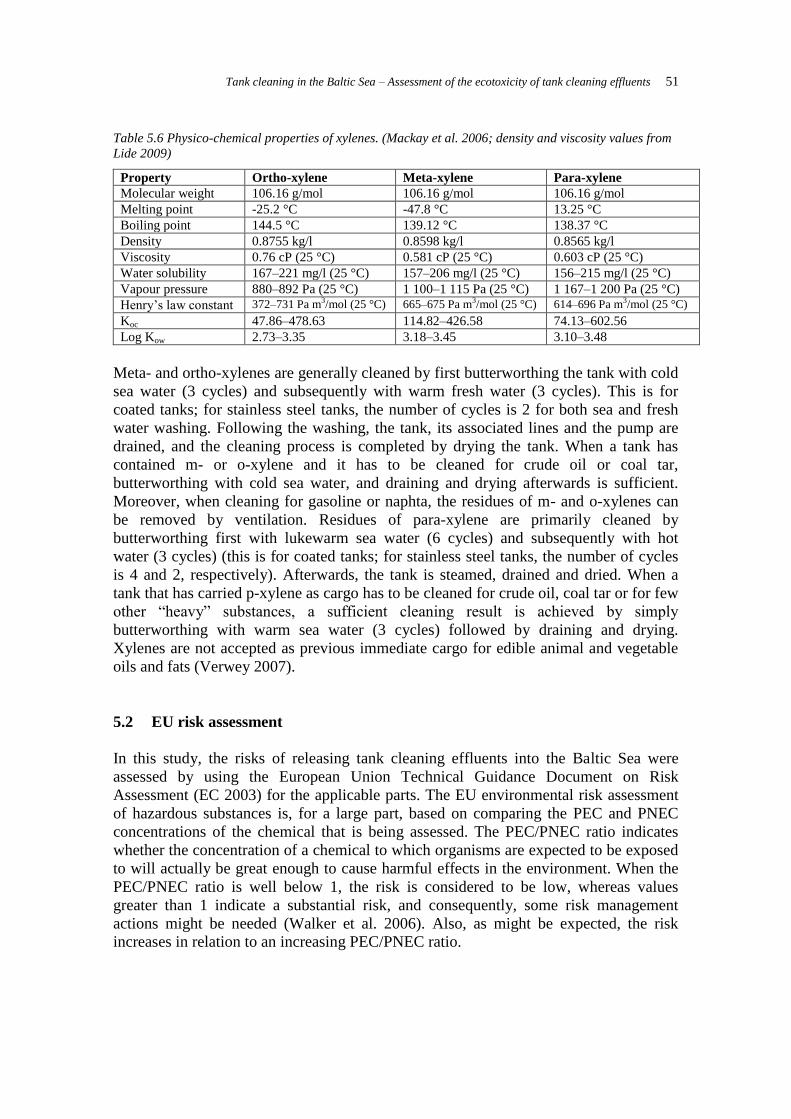
Tank cleaning in the Baltic Sea – Assessment of the ecotoxicity of tank cleaning effluents 51
Table 5.6 Physico-chemical properties of xylenes. (Mackay et al. 2006; density and viscosity values from
Lide 2009)
Property Ortho-xylene Meta-xylene Para-xylene
Molecular weight 106.16 g/mol 106.16 g/mol 106.16 g/mol
Melting point -25.2 °C -47.8 °C 13.25 °C
Boiling point 144.5 °C 139.12 °C 138.37 °C
Density 0.8755 kg/l 0.8598 kg/l 0.8565 kg/l
Viscosity 0.76 cP (25 °C) 0.581 cP (25 °C) 0.603 cP (25 °C)
Water solubility 167–221 mg/l (25 °C) 157–206 mg/l (25 °C) 156–215 mg/l (25 °C)
Vapour pressure 880–892 Pa (25 °C) 1 100–1 115 Pa (25 °C) 1 167–1 200 Pa (25 °C)
Henry’s law constant 372–731 Pa m3/mol (25 °C) 665–675 Pa m3/mol (25 °C) 614–696 Pa m3/mol (25 °C)
Koc 47.86–478.63 114.82–426.58 74.13–602.56
Log Kow 2.73–3.35 3.18–3.45 3.10–3.48
Meta- and ortho-xylenes are generally cleaned by first butterworthing the tank with cold
sea water (3 cycles) and subsequently with warm fresh water (3 cycles). This is for
coated tanks; for stainless steel tanks, the number of cycles is 2 for both sea and fresh
water washing. Following the washing, the tank, its associated lines and the pump are
drained, and the cleaning process is completed by drying the tank. When a tank has
contained m- or o-xylene and it has to be cleaned for crude oil or coal tar,
butterworthing with cold sea water, and draining and drying afterwards is sufficient.
Moreover, when cleaning for gasoline or naphta, the residues of m- and o-xylenes can
be removed by ventilation. Residues of para-xylene are primarily cleaned by
butterworthing first with lukewarm sea water (6 cycles) and subsequently with hot
water (3 cycles) (this is for coated tanks; for stainless steel tanks, the number of cycles
is 4 and 2, respectively). Afterwards, the tank is steamed, drained and dried. When a
tank that has carried p-xylene as cargo has to be cleaned for crude oil, coal tar or for few
other “heavy” substances, a sufficient cleaning result is achieved by simply
butterworthing with warm sea water (3 cycles) followed by draining and drying.
Xylenes are not accepted as previous immediate cargo for edible animal and vegetable
oils and fats (Verwey 2007).
5.2 EU risk assessment
In this study, the risks of releasing tank cleaning effluents into the Baltic Sea were
assessed by using the European Union Technical Guidance Document on Risk
Assessment (EC 2003) for the applicable parts. The EU environmental risk assessment
of hazardous substances is, for a large part, based on comparing the PEC and PNEC
concentrations of the chemical that is being assessed. The PEC/PNEC ratio indicates
whether the concentration of a chemical to which organisms are expected to be exposed
to will actually be great enough to cause harmful effects in the environment. When the
PEC/PNEC ratio is well below 1, the risk is considered to be low, whereas values
greater than 1 indicate a substantial risk, and consequently, some risk management
actions might be needed (Walker et al. 2006). Also, as might be expected, the risk
increases in relation to an increasing PEC/PNEC ratio.
52 Honkanen, Häkkinen and Posti
5.2.1 Predicted Environmental Concentration (PEC)
Predicted Environmental Concentration (PEC) is the concentration in which the
discharged or spilled chemical is anticipated to appear in the environment. According to
technical guidelines by the EU (EC 2003), both the discharge concentration and the
chemical’s properties relating to the environmental fate should be considered in
determining the PEC. Typically, in an exposure assessment, two separate PECs are
calculated – the local and the regional value. PEClocal is the concentration during the
chemical discharge, whereas PECregional is the steady state concentration in surface water
(or in sediment/soil/air). In the present study, only the local PECs for tank washings
were determined.
When calculating the PECs, the first step was to determine the initial chemical
concentration in the tank washings. The initial concentrations were obtained by dividing
the chemical quantity that remains in a tank after unloading (i.e. the strip) with the
volume of the added washing medium (water or other cleaning agent). Since the tank
capacity of chemical tankers varies between 70 and 2,000 m3
(Hänninen & Rytkönen
2006), all values were calculated for a medium-sized tank of 1,000 m3. To be able to
study the impact of prewashing on the expected chemical concentration in the sea, the
PECs were calculated both with and without the dilution effect caused by in-port
prewashing. Since the quantity of the strip varies greatly depending on the ship (see
section 3.1), three model PECs were calculated for each target chemical by using
different strip values. Based on literature and a consultation with the Finnish Transport
Safety Agency (Trafi) (Vähätalo 2012 pers. comm.), 15 litres was selected as the
minimum, 50 litres as the medium and 300 litres as the maximum strip value for the
hypothetical 1,000 m3 cargo tank. It seemed that strip values between 25 and 50 litres
were quite common among both old and new tankers, whereas 15 litres is at the lower
limits of the capability of the typical stripping technique (in larger, ca. 1,000 m3 tanks).
Since 300 litres is the largest amount of chemical which, within the limits of the law, is
allowed to remain in a tank after unloading, it was also a justified selection for the
maximum strip value for this study. In smaller tanks (e.g. 500 m3), the strip quantities
are in total somewhat smaller than in larger tanks, but as the water amount used in
washing smaller tanks is also proportionally smaller, there should not be significant
differences between the chemical concentrations in slops generated in cleaning of small
and large cargo tanks.
Water volume calculations
The volume of cleaning water in which we assume the chemical to be diluted was
somewhat challenging to determine, as water quantities vary greatly depending on the
cargo and the properties of the cleaning machine(s) used. In the cleaning process, the
cleaning solution (water or water-detergent mixture) is applied to a cargo tank via one
or more butterworth tank cleaning machines (Kunichkin 2006). When the double-ended
nozzle of the machine rotates a full cycle (360°), the tank walls have been sprayed
twice. Accordingly, half a cycle by a double-ended nozzle means that the tank has been
sprayed once. The total water quantity used in a tank cleaning process depends on the
number of cleaning cycles – which is further dependent on the properties of the cargo
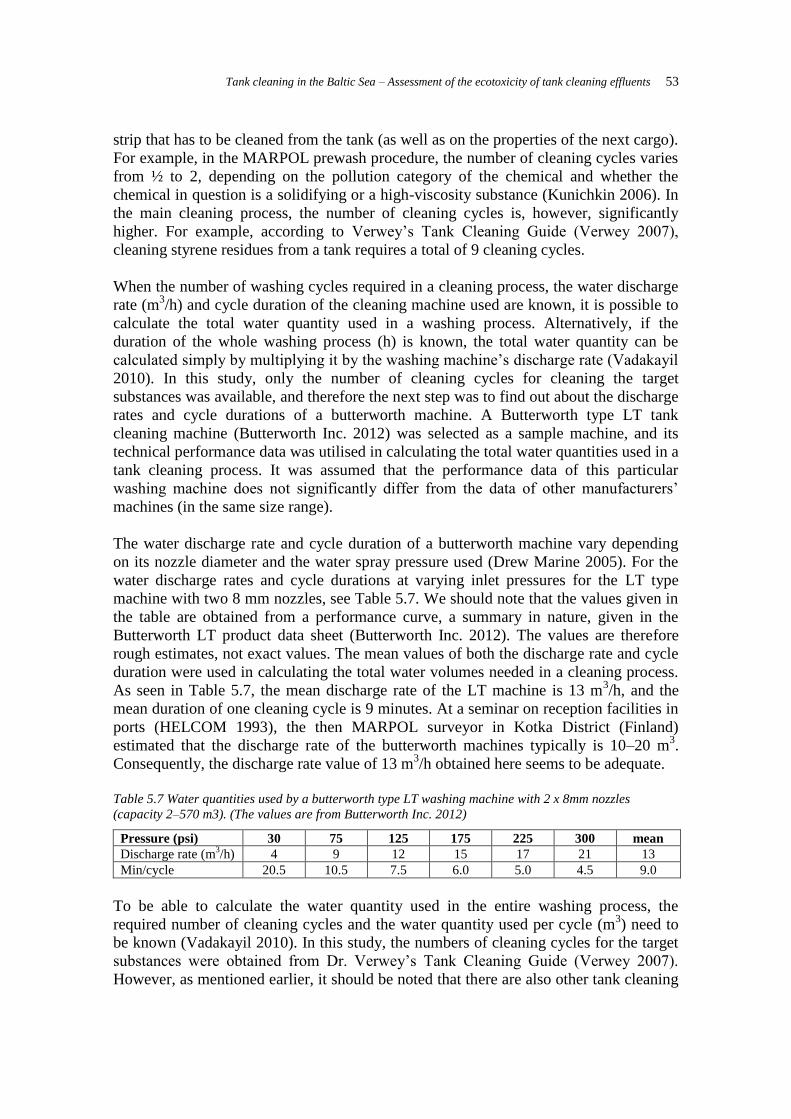
Tank cleaning in the Baltic Sea – Assessment of the ecotoxicity of tank cleaning effluents 53
strip that has to be cleaned from the tank (as well as on the properties of the next cargo).
For example, in the MARPOL prewash procedure, the number of cleaning cycles varies
from ½ to 2, depending on the pollution category of the chemical and whether the
chemical in question is a solidifying or a high-viscosity substance (Kunichkin 2006). In
the main cleaning process, the number of cleaning cycles is, however, significantly
higher. For example, according to Verwey’s Tank Cleaning Guide (Verwey 2007),
cleaning styrene residues from a tank requires a total of 9 cleaning cycles.
When the number of washing cycles required in a cleaning process, the water discharge
rate (m3/h) and cycle duration of the cleaning machine used are known, it is possible to
calculate the total water quantity used in a washing process. Alternatively, if the
duration of the whole washing process (h) is known, the total water quantity can be
calculated simply by multiplying it by the washing machine’s discharge rate (Vadakayil
2010). In this study, only the number of cleaning cycles for cleaning the target
substances was available, and therefore the next step was to find out about the discharge
rates and cycle durations of a butterworth machine. A Butterworth type LT tank
cleaning machine (Butterworth Inc. 2012) was selected as a sample machine, and its
technical performance data was utilised in calculating the total water quantities used in a
tank cleaning process. It was assumed that the performance data of this particular
washing machine does not significantly differ from the data of other manufacturers’
machines (in the same size range).
The water discharge rate and cycle duration of a butterworth machine vary depending
on its nozzle diameter and the water spray pressure used (Drew Marine 2005). For the
water discharge rates and cycle durations at varying inlet pressures for the LT type
machine with two 8 mm nozzles, see Table 5.7. We should note that the values given in
the table are obtained from a performance curve, a summary in nature, given in the
Butterworth LT product data sheet (Butterworth Inc. 2012). The values are therefore
rough estimates, not exact values. The mean values of both the discharge rate and cycle
duration were used in calculating the total water volumes needed in a cleaning process.
As seen in Table 5.7, the mean discharge rate of the LT machine is 13 m3/h, and the
mean duration of one cleaning cycle is 9 minutes. At a seminar on reception facilities in
ports (HELCOM 1993), the then MARPOL surveyor in Kotka District (Finland)
estimated that the discharge rate of the butterworth machines typically is 10–20 m3.
Consequently, the discharge rate value of 13 m3/h obtained here seems to be adequate.
Table 5.7 Water quantities used by a butterworth type LT washing machine with 2 x 8mm nozzles
(capacity 2–570 m3). (The values are from Butterworth Inc. 2012)
Pressure (psi) 30 75 125 175 225 300 mean
Discharge rate (m3/h) 4 9 12 15 17 21 13
Min/cycle 20.5 10.5 7.5 6.0 5.0 4.5 9.0
To be able to calculate the water quantity used in the entire washing process, the
required number of cleaning cycles and the water quantity used per cycle (m3) need to
be known (Vadakayil 2010). In this study, the numbers of cleaning cycles for the target
substances were obtained from Dr. Verwey’s Tank Cleaning Guide (Verwey 2007).
However, as mentioned earlier, it should be noted that there are also other tank cleaning
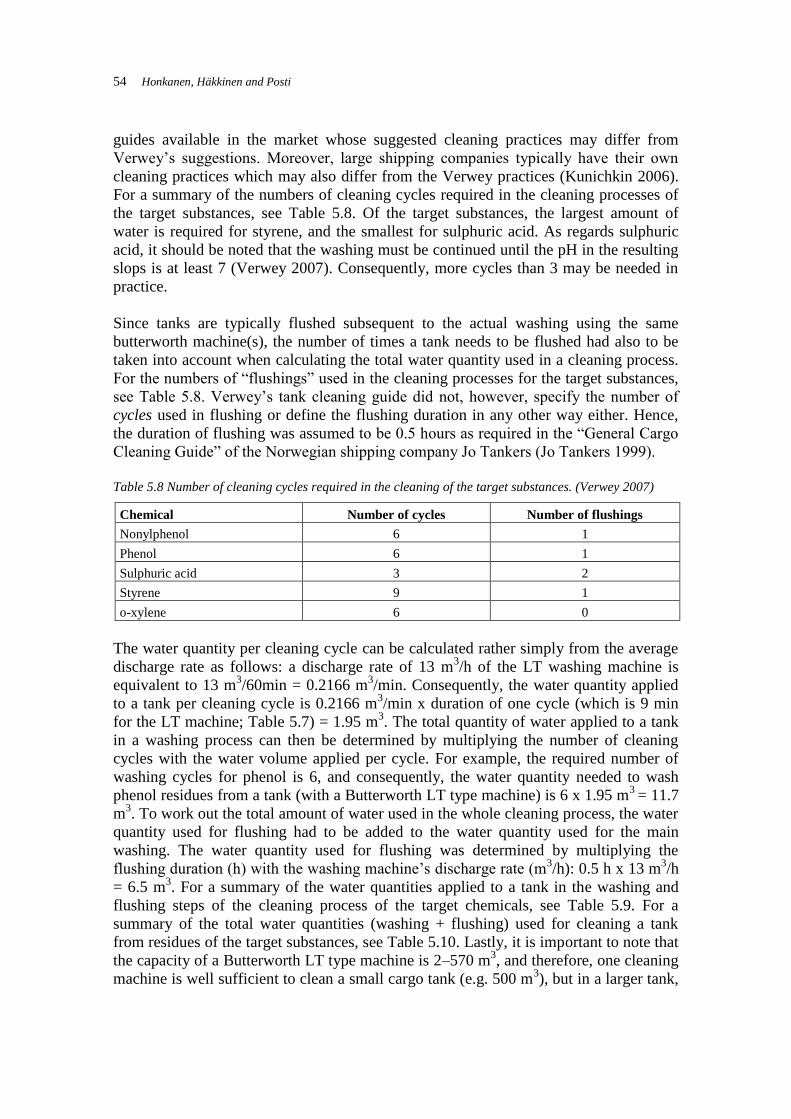
54 Honkanen, Häkkinen and Posti
guides available in the market whose suggested cleaning practices may differ from
Verwey’s suggestions. Moreover, large shipping companies typically have their own
cleaning practices which may also differ from the Verwey practices (Kunichkin 2006).
For a summary of the numbers of cleaning cycles required in the cleaning processes of
the target substances, see Table 5.8. Of the target substances, the largest amount of
water is required for styrene, and the smallest for sulphuric acid. As regards sulphuric
acid, it should be noted that the washing must be continued until the pH in the resulting
slops is at least 7 (Verwey 2007). Consequently, more cycles than 3 may be needed in
practice.
Since tanks are typically flushed subsequent to the actual washing using the same
butterworth machine(s), the number of times a tank needs to be flushed had also to be
taken into account when calculating the total water quantity used in a cleaning process.
For the numbers of “flushings” used in the cleaning processes for the target substances,
see Table 5.8. Verwey’s tank cleaning guide did not, however, specify the number of
cycles used in flushing or define the flushing duration in any other way either. Hence,
the duration of flushing was assumed to be 0.5 hours as required in the “General Cargo
Cleaning Guide” of the Norwegian shipping company Jo Tankers (Jo Tankers 1999).
Table 5.8 Number of cleaning cycles required in the cleaning of the target substances. (Verwey 2007)
Chemical Number of cycles Number of flushings
Nonylphenol 6 1
Phenol 6 1
Sulphuric acid 3 2
Styrene 9 1
o-xylene 6 0
The water quantity per cleaning cycle can be calculated rather simply from the average
discharge rate as follows: a discharge rate of 13 m3/h of the LT washing machine is
equivalent to 13 m3/60min = 0.2166 m
3/min. Consequently, the water quantity applied
to a tank per cleaning cycle is 0.2166 m3/min x duration of one cycle (which is 9 min
for the LT machine; Table 5.7) = 1.95 m3. The total quantity of water applied to a tank
in a washing process can then be determined by multiplying the number of cleaning
cycles with the water volume applied per cycle. For example, the required number of
washing cycles for phenol is 6, and consequently, the water quantity needed to wash
phenol residues from a tank (with a Butterworth LT type machine) is 6 x 1.95 m3
= 11.7
m3. To work out the total amount of water used in the whole cleaning process, the water
quantity used for flushing had to be added to the water quantity used for the main
washing. The water quantity used for flushing was determined by multiplying the
flushing duration (h) with the washing machine’s discharge rate (m3/h): 0.5 h x 13 m
3/h
= 6.5 m3. For a summary of the water quantities applied to a tank in the washing and
flushing steps of the cleaning process of the target chemicals, see Table 5.9. For a
summary of the total water quantities (washing + flushing) used for cleaning a tank
from residues of the target substances, see Table 5.10. Lastly, it is important to note that
the capacity of a Butterworth LT type machine is 2–570 m3, and therefore, one cleaning
machine is well sufficient to clean a small cargo tank (e.g. 500 m3), but in a larger tank,
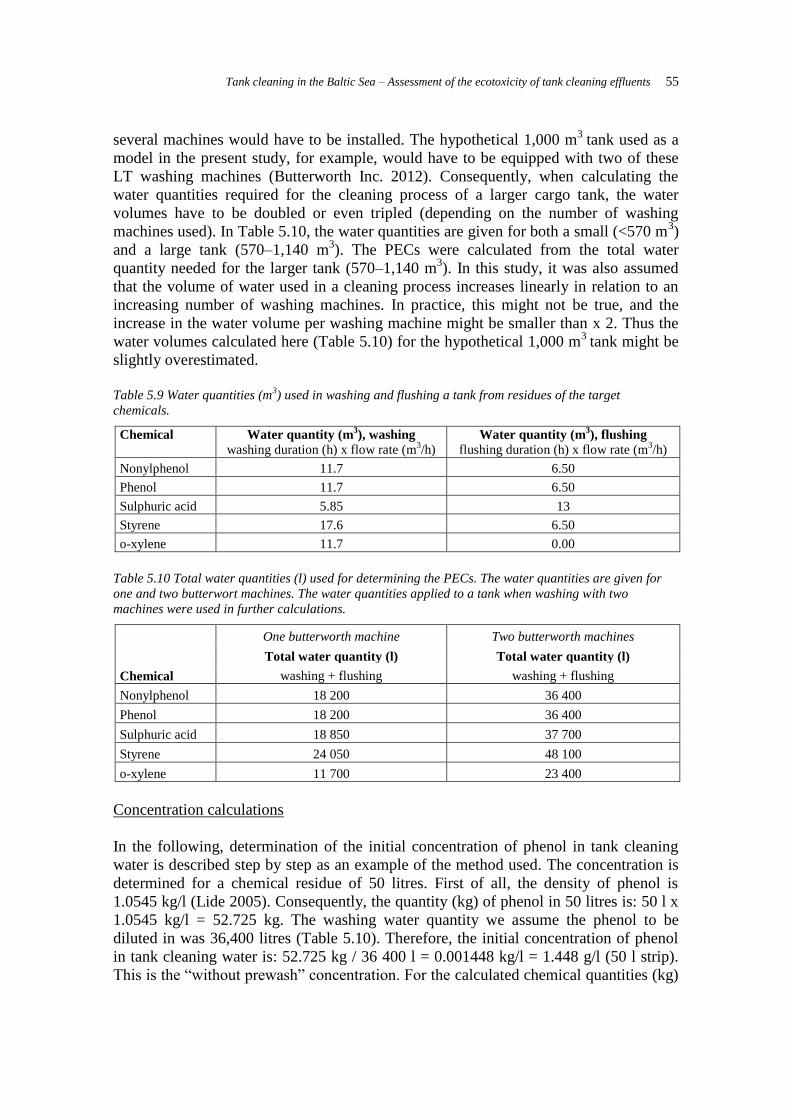
Tank cleaning in the Baltic Sea – Assessment of the ecotoxicity of tank cleaning effluents 55
several machines would have to be installed. The hypothetical 1,000 m3
tank used as a
model in the present study, for example, would have to be equipped with two of these
LT washing machines (Butterworth Inc. 2012). Consequently, when calculating the
water quantities required for the cleaning process of a larger cargo tank, the water
volumes have to be doubled or even tripled (depending on the number of washing
machines used). In Table 5.10, the water quantities are given for both a small (<570 m3)
and a large tank (570–1,140 m3). The PECs were calculated from the total water
quantity needed for the larger tank (570–1,140 m3). In this study, it was also assumed
that the volume of water used in a cleaning process increases linearly in relation to an
increasing number of washing machines. In practice, this might not be true, and the
increase in the water volume per washing machine might be smaller than x 2. Thus the
water volumes calculated here (Table 5.10) for the hypothetical 1,000 m3
tank might be
slightly overestimated.
Table 5.9 Water quantities (m
3) used in washing and flushing a tank from residues of the target
chemicals.
Chemical Water quantity (m3), washing
washing duration (h) x flow rate (m3/h)
Water quantity (m3), flushing
flushing duration (h) x flow rate (m3/h)
Nonylphenol 11.7 6.50
Phenol 11.7 6.50
Sulphuric acid 5.85 13
Styrene 17.6 6.50
o-xylene 11.7 0.00
Table 5.10 Total water quantities (l) used for determining the PECs. The water quantities are given for
one and two butterwort machines. The water quantities applied to a tank when washing with two
machines were used in further calculations.
Chemical
One butterworth machine Two butterworth machines
Total water quantity (l) Total water quantity (l)
washing + flushing washing + flushing
Nonylphenol 18 200 36 400
Phenol 18 200 36 400
Sulphuric acid 18 850 37 700
Styrene 24 050 48 100
o-xylene 11 700 23 400
Concentration calculations
In the following, determination of the initial concentration of phenol in tank cleaning
water is described step by step as an example of the method used. The concentration is
determined for a chemical residue of 50 litres. First of all, the density of phenol is
1.0545 kg/l (Lide 2005). Consequently, the quantity (kg) of phenol in 50 litres is: 50 l x
1.0545 kg/l = 52.725 kg. The washing water quantity we assume the phenol to be
diluted in was 36,400 litres (Table 5.10). Therefore, the initial concentration of phenol
in tank cleaning water is: 52.725 kg / 36 400 l = 0.001448 kg/l = 1.448 g/l (50 l strip).
This is the “without prewash” concentration. For the calculated chemical quantities (kg)
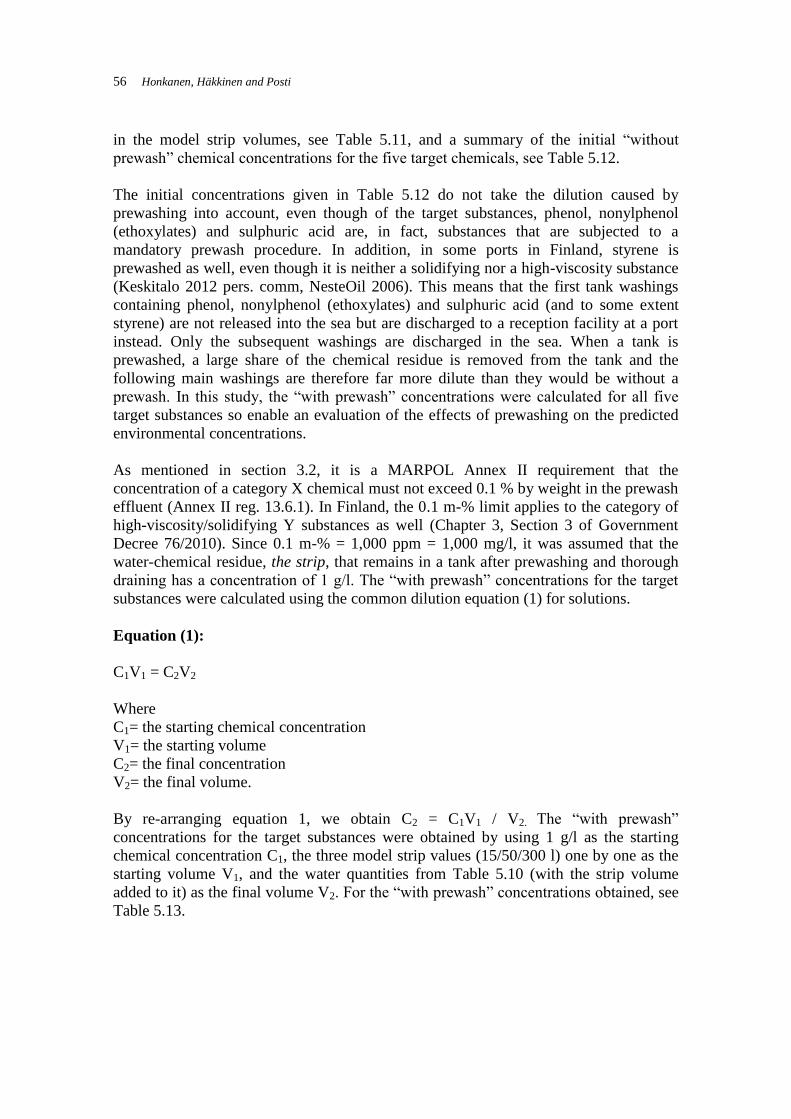
56 Honkanen, Häkkinen and Posti
in the model strip volumes, see Table 5.11, and a summary of the initial “without
prewash” chemical concentrations for the five target chemicals, see Table 5.12.
The initial concentrations given in Table 5.12 do not take the dilution caused by
prewashing into account, even though of the target substances, phenol, nonylphenol
(ethoxylates) and sulphuric acid are, in fact, substances that are subjected to a
mandatory prewash procedure. In addition, in some ports in Finland, styrene is
prewashed as well, even though it is neither a solidifying nor a high-viscosity substance
(Keskitalo 2012 pers. comm, NesteOil 2006). This means that the first tank washings
containing phenol, nonylphenol (ethoxylates) and sulphuric acid (and to some extent
styrene) are not released into the sea but are discharged to a reception facility at a port
instead. Only the subsequent washings are discharged in the sea. When a tank is
prewashed, a large share of the chemical residue is removed from the tank and the
following main washings are therefore far more dilute than they would be without a
prewash. In this study, the “with prewash” concentrations were calculated for all five
target substances so enable an evaluation of the effects of prewashing on the predicted
environmental concentrations.
As mentioned in section 3.2, it is a MARPOL Annex II requirement that the
concentration of a category X chemical must not exceed 0.1 % by weight in the prewash
effluent (Annex II reg. 13.6.1). In Finland, the 0.1 m-% limit applies to the category of
high-viscosity/solidifying Y substances as well (Chapter 3, Section 3 of Government
Decree 76/2010). Since 0.1 m-% = 1,000 ppm = 1,000 mg/l, it was assumed that the
water-chemical residue, the strip, that remains in a tank after prewashing and thorough
draining has a concentration of 1 g/l. The “with prewash” concentrations for the target
substances were calculated using the common dilution equation (1) for solutions.
Equation (1):
C1V1 = C2V2
Where
C1= the starting chemical concentration
V1= the starting volume
C2= the final concentration
V2= the final volume.
By re-arranging equation 1, we obtain C2 = C1V1 / V2. The “with prewash”
concentrations for the target substances were obtained by using 1 g/l as the starting
chemical concentration C1, the three model strip values (15/50/300 l) one by one as the
starting volume V1, and the water quantities from Table 5.10 (with the strip volume
added to it) as the final volume V2. For the “with prewash” concentrations obtained, see
Table 5.13.
Tank cleaning in the Baltic Sea – Assessment of the ecotoxicity of tank cleaning effluents 57
Table 5.11 Chemical quantities (kg) in the model strips.
Chemical
Density
(kg/l) Source
Chemical Quantity (kg) strip volume x density
Strip 15 l Strip 50 l Strip 300 l
Nonylphenol 0.950 HSDB 2012 14.25 47.50 285.0
Phenol 1.0545 Lide 2005 15.82 52.73 316.4
Sulphuric acid 1.835 OECD 2001 27.53 91.75 550.5
Styrene 0.906 MacKay et al. 2006 13.59 45.30 271.8
o-xylene 0.8755 Lide 2009 13.13 43.78 262.7
Table 5.12 Initial “without prewash“ chemical concentrations in tank washings. Three concentrations
were calculated for each chemical using different residual quantities (15, 50 and 300 litres). The water
volumes applied in the calculations are from Table 5.10.
Concentration (mg/l) without prewash
Chemical Strip 15 l Strip 50 l Strip 300 l
Nonylphenol 391.5 1 305 7 830
Phenol 434.5 1 448 8 691
Sulphuric acid 730.1 2 434 14 602
Styrene 282.5 941.8 5 651
o-xylene 561.2 1 871 11 224
Table 5.13 Chemical concentrations in tank washings after two washing sequences (prewash and main
wash).
Concentration (mg/l) with prewash
Chemical Strip 15 l Strip 50 l Strip 300 l
Nonylphenol 0.4119 1.372 8.174
Phenol 0.4119 1.372 8.174
Sulphuric acid 0.3977 1.325 7.895
Styrene 0.3118 1.038 6.198
o-xylene 0.6406 2.132 12.66
Once the initial chemical concentrations of the (main) washings were determined, the
next step, according to the EU methodology, was to consider the immediate dilution and
other factors affecting the chemical concentration in the environment. Since tank
washings disperse, dilute and degrade rapidly once they reach the sea, it would have
been ideal to use a detailed two- or three-dimensional distribution model, similar to that
used in French McCay et al. (2006), to predict how far the discharged tank washings
travel and how strong an effect dilution, degradation and other elimination processes
(e.g. evaporation) have on the initial chemical concentration. Such modelling would
have given a more precise indication of how far-reaching and harmful the effects of tank
cleaning waters actually are. However, as the present study is merely a preliminary
survey on the subject of tank washings, acquiring the required expensive computer
software would not have been practical. Therefore the regional distribution of the
washings was not modelled in this study. The effect of dilution was, however, estimated
by using an overly simplified dilution equation 2 given in the EU's Technical Guidance
Document on risk assessment (EC 2003).
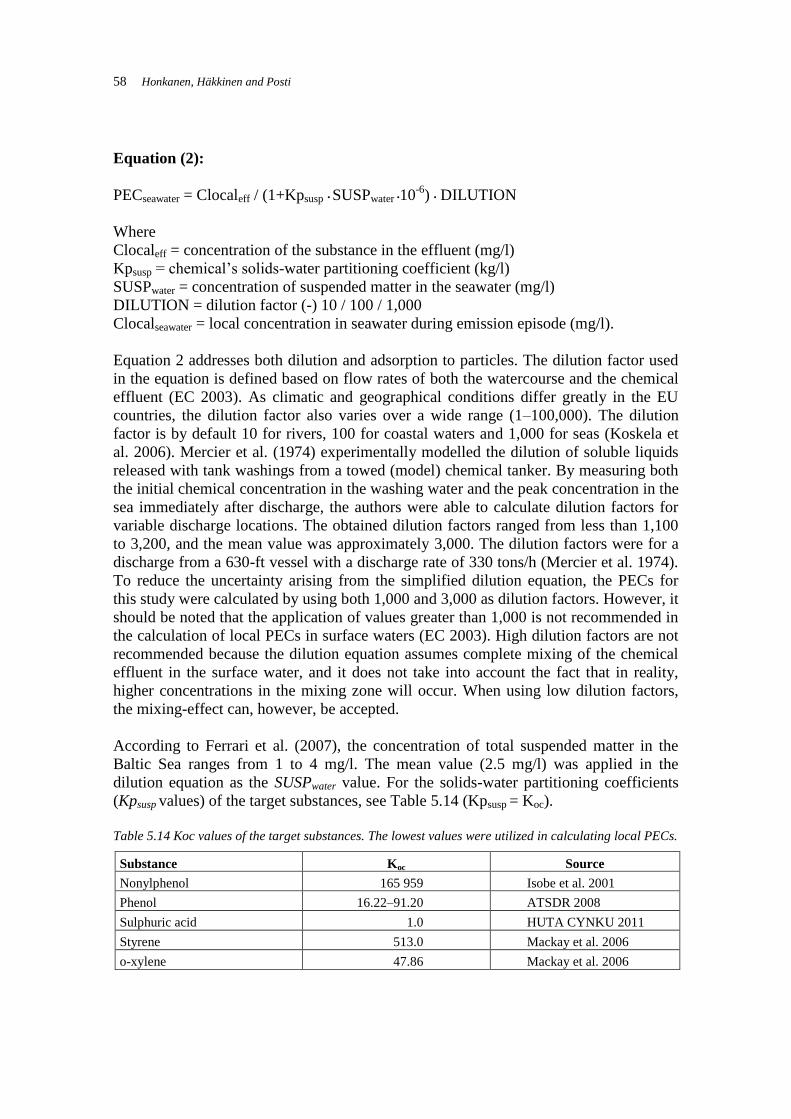
58 Honkanen, Häkkinen and Posti
Equation (2):
PECseawater = Clocaleff / (1+Kpsusp • SUSPwater •10-6
) • DILUTION
Where
Clocaleff = concentration of the substance in the effluent (mg/l)
Kpsusp = chemical’s solids-water partitioning coefficient (kg/l)
SUSPwater = concentration of suspended matter in the seawater (mg/l)
DILUTION = dilution factor (-) 10 / 100 / 1,000
Clocalseawater = local concentration in seawater during emission episode (mg/l).
Equation 2 addresses both dilution and adsorption to particles. The dilution factor used
in the equation is defined based on flow rates of both the watercourse and the chemical
effluent (EC 2003). As climatic and geographical conditions differ greatly in the EU
countries, the dilution factor also varies over a wide range (1–100,000). The dilution
factor is by default 10 for rivers, 100 for coastal waters and 1,000 for seas (Koskela et
al. 2006). Mercier et al. (1974) experimentally modelled the dilution of soluble liquids
released with tank washings from a towed (model) chemical tanker. By measuring both
the initial chemical concentration in the washing water and the peak concentration in the
sea immediately after discharge, the authors were able to calculate dilution factors for
variable discharge locations. The obtained dilution factors ranged from less than 1,100
to 3,200, and the mean value was approximately 3,000. The dilution factors were for a
discharge from a 630-ft vessel with a discharge rate of 330 tons/h (Mercier et al. 1974).
To reduce the uncertainty arising from the simplified dilution equation, the PECs for
this study were calculated by using both 1,000 and 3,000 as dilution factors. However, it
should be noted that the application of values greater than 1,000 is not recommended in
the calculation of local PECs in surface waters (EC 2003). High dilution factors are not
recommended because the dilution equation assumes complete mixing of the chemical
effluent in the surface water, and it does not take into account the fact that in reality,
higher concentrations in the mixing zone will occur. When using low dilution factors,
the mixing-effect can, however, be accepted.
According to Ferrari et al. (2007), the concentration of total suspended matter in the
Baltic Sea ranges from 1 to 4 mg/l. The mean value (2.5 mg/l) was applied in the
dilution equation as the SUSPwater value. For the solids-water partitioning coefficients
(Kpsusp values) of the target substances, see Table 5.14 (Kpsusp = Koc).
Table 5.14 Koc values of the target substances. The lowest values were utilized in calculating local PECs.
Substance Koc Source
Nonylphenol 165 959 Isobe et al. 2001
Phenol 16.22–91.20 ATSDR 2008
Sulphuric acid 1.0 HUTA CYNKU 2011
Styrene 513.0 Mackay et al. 2006
o-xylene 47.86 Mackay et al. 2006
Tank cleaning in the Baltic Sea – Assessment of the ecotoxicity of tank cleaning effluents 59
For phenol, the effects of dilution and adsorption can be calculated as follows: the initial
phenol concentration (without a prewash) in the washing was determined earlier, and
the value obtained was 1,448 mg/l. Consequently, Clocaleff = 1,448 mg/l. As seen in
Table 5.14, the Koc of phenol is 16.22–91.20. The lowest value 16.22 was applied as
the Kpsusp in the equation. Consequently, the resulting PEC represents the so-called
“worst-case scenario”. As mentioned above, SUSPBalticSea = 2.5 mg/l, and finally, the
dilution factor for seas is 1,000. When all these values are added in equation (2), the
resulting “without prewash” PECseawater for phenol (50 l strip) is 1.448 mg/l. Applying
3,000 as a dilution factor results in a “without prewash” PECseawater of 0.4828 mg/l.
When the “with prewash” concentration of phenol is applied in the dilution equation,
the resulting PECs are 1.372 µg/l (dilution factor 1,000) and 0.4572 µg/l (dilution factor
3,000). The local PECs for all five target chemicals are summarised in Tables 5.15 and
5.16.
The PECseawater represents concentration in seawater immediately after the discharge. In
reality, the discharged washings will, of course, continue to dilute even further (and
degrade, volatize etc.). Moreover, the dilution equation used assumes that the washings
are discharged into a specific location from an unmoving ship. In reality, this is not true,
as the washings must be discharged while the ship is sailing at a speed of at least 7
knots en route. When the ship is moving ahead while discharging, the flow will carry
the chemical residues into the ship’s propeller, where the chemical will be broken up
and well dispersed in the propeller wake (McGeorge 1995). Therefore, the washings are
actually distributed over a wider area than assumed by the simple dilution equation.
The behaviour and environmental fate of the target chemicals are discussed separately
below.
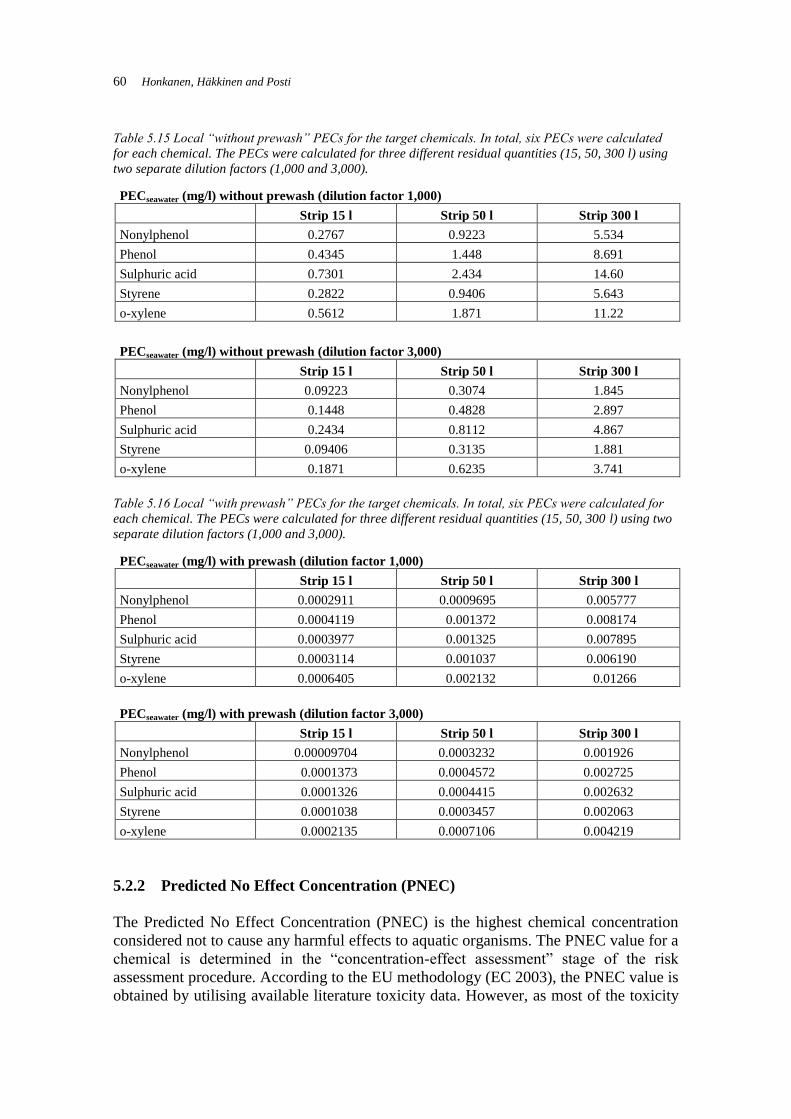
60 Honkanen, Häkkinen and Posti
Table 5.15 Local “without prewash” PECs for the target chemicals. In total, six PECs were calculated
for each chemical. The PECs were calculated for three different residual quantities (15, 50, 300 l) using
two separate dilution factors (1,000 and 3,000).
PECseawater (mg/l) without prewash (dilution factor 1,000)
Strip 15 l Strip 50 l Strip 300 l
Nonylphenol 0.2767 0.9223 5.534
Phenol 0.4345 1.448 8.691
Sulphuric acid 0.7301 2.434 14.60
Styrene 0.2822 0.9406 5.643
o-xylene 0.5612 1.871 11.22
PECseawater (mg/l) without prewash (dilution factor 3,000)
Strip 15 l Strip 50 l Strip 300 l
Nonylphenol 0.09223 0.3074 1.845
Phenol 0.1448 0.4828 2.897
Sulphuric acid 0.2434 0.8112 4.867
Styrene 0.09406 0.3135 1.881
o-xylene 0.1871 0.6235 3.741
Table 5.16 Local “with prewash” PECs for the target chemicals. In total, six PECs were calculated for
each chemical. The PECs were calculated for three different residual quantities (15, 50, 300 l) using two
separate dilution factors (1,000 and 3,000).
PECseawater (mg/l) with prewash (dilution factor 1,000)
Strip 15 l Strip 50 l Strip 300 l
Nonylphenol 0.0002911 0.0009695 0.005777
Phenol 0.0004119 0.001372 0.008174
Sulphuric acid 0.0003977 0.001325 0.007895
Styrene 0.0003114 0.001037 0.006190
o-xylene 0.0006405 0.002132 0.01266
PECseawater (mg/l) with prewash (dilution factor 3,000)
Strip 15 l Strip 50 l Strip 300 l
Nonylphenol 0.00009704 0.0003232 0.001926
Phenol 0.0001373 0.0004572 0.002725
Sulphuric acid 0.0001326 0.0004415 0.002632
Styrene 0.0001038 0.0003457 0.002063
o-xylene 0.0002135 0.0007106 0.004219
5.2.2 Predicted No Effect Concentration (PNEC)
The Predicted No Effect Concentration (PNEC) is the highest chemical concentration
considered not to cause any harmful effects to aquatic organisms. The PNEC value for a
chemical is determined in the “concentration-effect assessment” stage of the risk
assessment procedure. According to the EU methodology (EC 2003), the PNEC value is
obtained by utilising available literature toxicity data. However, as most of the toxicity
Tank cleaning in the Baltic Sea – Assessment of the ecotoxicity of tank cleaning effluents 61
values are from short-term toxicity tests performed in stable laboratory conditions, these
values cannot be directly applied to natural field conditions. To decrease the uncertainty
arising from using these somewhat “unrealistic” laboratory results, the acute/chronic
toxicity values must be first divided by a safety factor. Using a safety factor ensures that
the resulting PNEC value is low enough to cover even the most sensitive species in the
aquatic environment.
The magnitude of the safety factor depends on the number of tested trophic groups and
the quality of the available toxicity data. If only acute toxicity data for a chemical is
available, a safety factor of 1,000 must be used (EC 2003). This is to allow for the great
deal of uncertainty that relates to the extrapolating from short-term laboratory results for
a single species into field conditions, where several different species are exposed
(Walker et al. 2006). The safety factor also takes into account the possible mixture
effects (e.g. synergism and antagonism) as in the field, organisms are usually exposed
not only to one, but to a number of different chemicals simultaneously (Walker et al.
2006). Because the test conditions in chronic toxicity tests are much closer to natural
conditions in the field (compared to short-term toxicity tests), the safety factor for
chronic toxicity values does not need to be as conservative as it is for acute LC/EC50
values. In general, the safety factor decreases as the number of groups from which
chronic NOEC values are available increases. When a chronic NOEC value is available
for one species (either Daphnia or fish), a safety factor of 100 is used. A safety factor of
50 is used when chronic NOEC values are available for two species representing two
different trophic levels (fish and/or Daphnia and/or algae). When NOEC values are
available for three species representing three trophic levels (fish, Daphnia and algae), a
safety factor of 10 is used (EU 2003). For a summary of the safety factors for different
data sets, see Table 5.17.
In the ChemRisk project, Häkkinen et al. (2010) studied the risks of chemical
transportation accidents (by road and rail) in Kymenlaakso area. In this project, 30
chemicals were evaluated using the EUSES method (i.e. characterizing the risk by
comparing the PEC and PNEC concentrations). In addition, a novel scoring system
developed by the authors was used in the project as well. All target substances selected
for the present study were evaluated in the ChemRisk project, and the PNEC values
determined in the project were also utilised in the present study. In determining the
PNEC concentrations for the chemicals studied, toxicity values from three trophic levels
(algae, Daphnia and fish) were taken into account (Häkkinen et al. 2010). In selecting
the lowest short-term LC/EC/IC50- and chronic NOEC values, scientific discretion and
source criticism was applied. For algae, the 72-hr test results were considered as chronic
values. This is acceptable as the growth and cell division of algae is so rapid that the 72-
hr (or longer) values can be considered to represent both short-term and long-term
results. The PNECs were derived by dividing either the acute toxicity value
(LC/EC/IC50) or the chronic toxicity value (NOEC) for the most sensitive species (i.e.
the lowest toxicity value of the three tested trophic groups) by an arbitrary safety factor.
For nonylphenol, phenol and xylenes, three long-term NOECs were available.
Consequently, a safety factor of 10 was used in calculating PNECs for these chemicals.
For sulphuric acid and styrene, two chronic NOECs were available, and therefore, a
safety factor of 50 was used in calculating the PNECs for them. For a summary of the
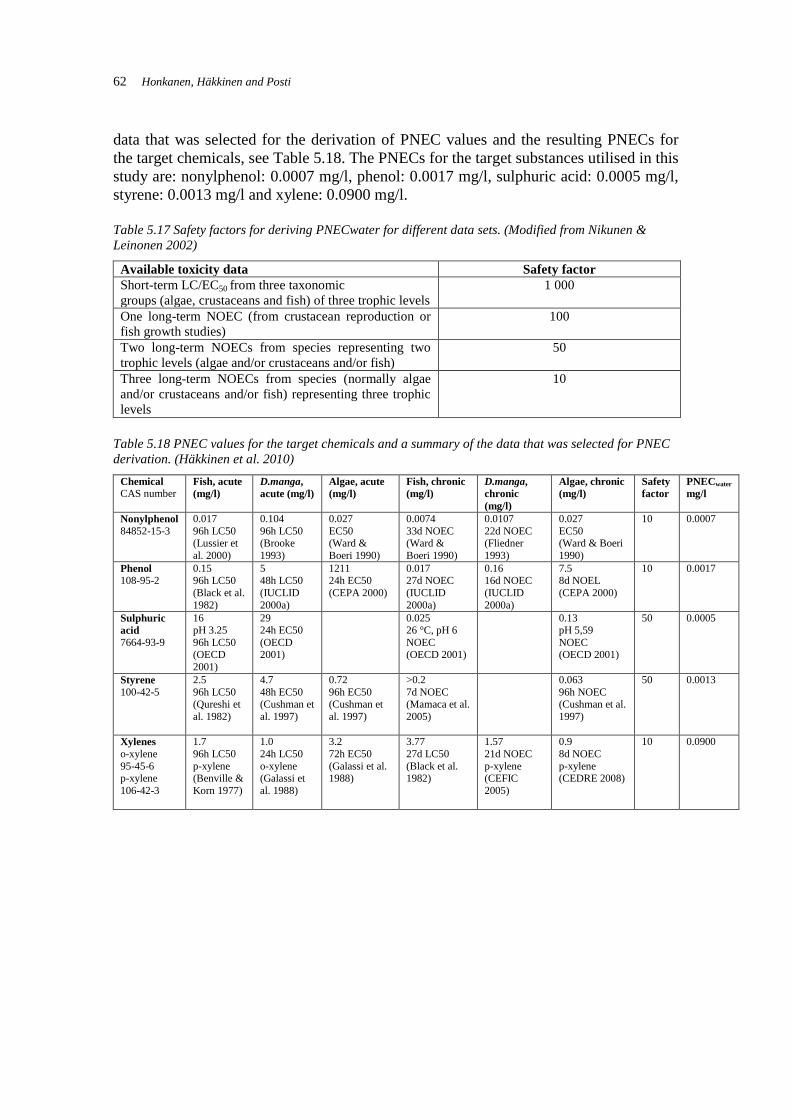
62 Honkanen, Häkkinen and Posti
data that was selected for the derivation of PNEC values and the resulting PNECs for
the target chemicals, see Table 5.18. The PNECs for the target substances utilised in this
study are: nonylphenol: 0.0007 mg/l, phenol: 0.0017 mg/l, sulphuric acid: 0.0005 mg/l,
styrene: 0.0013 mg/l and xylene: 0.0900 mg/l.
Table 5.17 Safety factors for deriving PNECwater for different data sets. (Modified from Nikunen &
Leinonen 2002)
Available toxicity data Safety factor
Short-term LC/EC50 from three taxonomic
groups (algae, crustaceans and fish) of three trophic levels
1 000
One long-term NOEC (from crustacean reproduction or
fish growth studies)
100
Two long-term NOECs from species representing two
trophic levels (algae and/or crustaceans and/or fish)
50
Three long-term NOECs from species (normally algae
and/or crustaceans and/or fish) representing three trophic
levels
10
Table 5.18 PNEC values for the target chemicals and a summary of the data that was selected for PNEC
derivation. (Häkkinen et al. 2010)
Chemical CAS number
Fish, acute
(mg/l)
D.manga,
acute (mg/l)
Algae, acute
(mg/l)
Fish, chronic
(mg/l)
D.manga,
chronic
(mg/l)
Algae, chronic
(mg/l)
Safety
factor
PNECwater
mg/l
Nonylphenol 84852-15-3
0.017
96h LC50 (Lussier et
al. 2000)
0.104
96h LC50 (Brooke
1993)
0.027
EC50 (Ward &
Boeri 1990)
0.0074
33d NOEC (Ward &
Boeri 1990)
0.0107
22d NOEC (Fliedner
1993)
0.027
EC50 (Ward & Boeri
1990)
10 0.0007
Phenol 108-95-2
0.15 96h LC50
(Black et al.
1982)
5 48h LC50
(IUCLID
2000a)
1211 24h EC50
(CEPA 2000)
0.017 27d NOEC
(IUCLID
2000a)
0.16 16d NOEC
(IUCLID
2000a)
7.5 8d NOEL
(CEPA 2000)
10 0.0017
Sulphuric
acid 7664-93-9
16
pH 3.25
96h LC50 (OECD
2001)
29
24h EC50
(OECD 2001)
0.025
26 °C, pH 6
NOEC (OECD 2001)
0.13
pH 5,59
NOEC (OECD 2001)
50 0.0005
Styrene 100-42-5
2.5
96h LC50 (Qureshi et
al. 1982)
4.7
48h EC50 (Cushman et
al. 1997)
0.72
96h EC50 (Cushman et
al. 1997)
>0.2
7d NOEC (Mamaca et al.
2005)
0.063
96h NOEC (Cushman et al.
1997)
50 0.0013
Xylenes o-xylene
95-45-6 p-xylene
106-42-3
1.7
96h LC50
p-xylene (Benville &
Korn 1977)
1.0
24h LC50
o-xylene (Galassi et
al. 1988)
3.2
72h EC50
(Galassi et al. 1988)
3.77
27d LC50
(Black et al. 1982)
1.57
21d NOEC
p-xylene (CEFIC
2005)
0.9
8d NOEC
p-xylene (CEDRE 2008)
10 0.0900
Tank cleaning in the Baltic Sea – Assessment of the ecotoxicity of tank cleaning effluents 63
6 RESULTS
6.1 PEC/PNEC ratios
The risk a chemical presents in the environment is characterised by comparing the
predicted environmental concentration to the predicted no effect concentration. If the
PEC/PNEC ratio is greater than 1, this is an indication of a risk. In this case, there are
two possible conclusions to be made: 1) further studies on the subject are needed or 2)
the existing risk management measures are not sufficient, and the risk needs to be
reduced by additional risk management actions (Nikunen & Leinonen 2002). Moreover,
the greater the ratio, the greater the risk. When the ratio is < 1, there is no significant
risk, and neither further studies nor risk management measures are needed.
For the PEC/PNEC ratios of the evaluated target substances, see Table 6.1. As we can
see in the Table, without a prewash the risk limits are exceeded for every target
chemical, regardless of the quantity of chemical residue or the dilution factor used in
PEC calculations. In contrast, if a tank is prewashed prior to main washing and the
remaining strip (chemical-water mixture) is 15 litres, the predicted environmental
concentration does not exceed the predicted no effect concentration for any of the target
substances (regardless of the dilution factor used). When using 50 litres as the strip
value, the risk ratios remain below 1 for most of the target chemicals as well. Only
when the smaller (1,000) dilution factor is used, the risk ratios of nonylphenol and
sulphuric acid are > 1 (ratios 1.40 and 2.65, respectively).
When the remaining strip in a tank after a prewash is assumed to be 300 litres, o-xylene
is the sole target chemical the PEC/PNEC ratio of which stays below the risk limits. All
the other target chemicals have PECs higher than their PNECs (regardless of the
dilution factor used). When using 1,000 as the dilution factor, the resulting ratios are:
nonylphenol 8.25, phenol 4.81, sulphuric acid 15.79, and styrene 4.76. If 3,000 is used
as the dilution factor, the ratios are: nonylphenol 2.75, phenol 1.60, sulphuric acid 5.26,
and styrene 1.59.
All in all, the PEC/PNEC ratios were clearly the highest for sulphuric acid and the
lowest for ortho-xylene (Table 6.1). When a dilution factor of 1,000 was used in the
PEC calculations, the “with prewash” PEC/PNEC ratios for sulphuric acid were: 0.80
(15 l), 2.65 (50 l) and 15.79 (300 l). The predicted seawater concentrations of sulphuric
acid greatly exceed its PNECs due to the compound’s high density and, on the other
hand, due to its low PNEC. If we consider 50 litres of sulphuric acid (density 1.835
kg/l), the mass (kg) of the compound in that given volume is nearly 92 kg. In
comparison, 50 litres of styrene (density 0.906 kg/l) contains approximately 45 kg of
styrene. Consequently, there is almost twice as much sulphuric acid in a given volume
than there is styrene. In addition, the predicted no effect concentration of sulphuric acid
is relatively low (0.5 µg/l; Table 5.18), indicating that sulphuric acid concentrations
higher than 0.5 µg/l are considered to be harmful in the environment. Of the target
substances, only nonylphenol has a lower PNEC concentration than sulphuric acid. The
“with prewash” PEC/PNEC ratios for o-xylene calculated with a dilution factor of 1,000
were: 0.0071 (15 l), 0.024 (50 l) and 0.14 (300 l). Compared to the other target
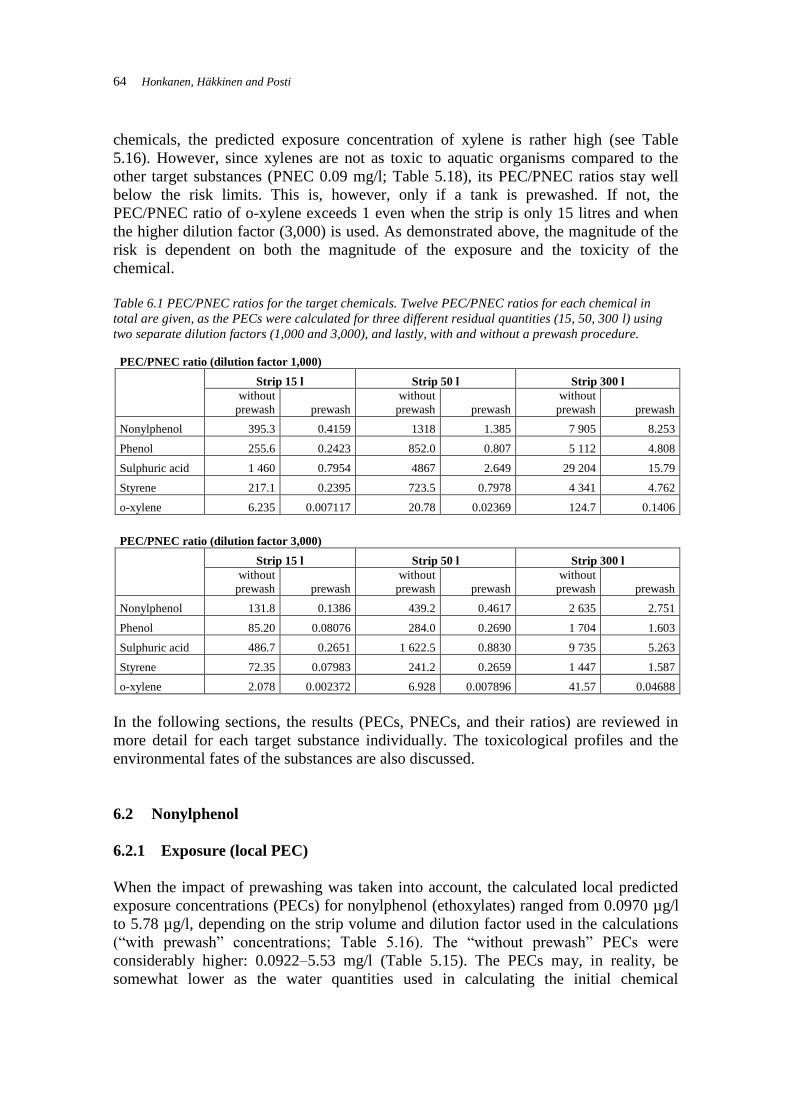
64 Honkanen, Häkkinen and Posti
chemicals, the predicted exposure concentration of xylene is rather high (see Table
5.16). However, since xylenes are not as toxic to aquatic organisms compared to the
other target substances (PNEC 0.09 mg/l; Table 5.18), its PEC/PNEC ratios stay well
below the risk limits. This is, however, only if a tank is prewashed. If not, the
PEC/PNEC ratio of o-xylene exceeds 1 even when the strip is only 15 litres and when
the higher dilution factor (3,000) is used. As demonstrated above, the magnitude of the
risk is dependent on both the magnitude of the exposure and the toxicity of the
chemical.
Table 6.1 PEC/PNEC ratios for the target chemicals. Twelve PEC/PNEC ratios for each chemical in
total are given, as the PECs were calculated for three different residual quantities (15, 50, 300 l) using
two separate dilution factors (1,000 and 3,000), and lastly, with and without a prewash procedure.
PEC/PNEC ratio (dilution factor 1,000)
Strip 15 l Strip 50 l Strip 300 l
without
prewash prewash
without
prewash prewash
without
prewash prewash
Nonylphenol 395.3 0.4159 1318 1.385 7 905 8.253
Phenol 255.6 0.2423 852.0 0.807 5 112 4.808
Sulphuric acid 1 460 0.7954 4867 2.649 29 204 15.79
Styrene 217.1 0.2395 723.5 0.7978 4 341 4.762
o-xylene 6.235 0.007117 20.78 0.02369 124.7 0.1406
PEC/PNEC ratio (dilution factor 3,000)
Strip 15 l Strip 50 l Strip 300 l
without
prewash prewash
without
prewash prewash
without
prewash prewash
Nonylphenol 131.8 0.1386 439.2 0.4617 2 635 2.751
Phenol 85.20 0.08076 284.0 0.2690 1 704 1.603
Sulphuric acid 486.7 0.2651 1 622.5 0.8830 9 735 5.263
Styrene 72.35 0.07983 241.2 0.2659 1 447 1.587
o-xylene 2.078 0.002372 6.928 0.007896 41.57 0.04688
In the following sections, the results (PECs, PNECs, and their ratios) are reviewed in
more detail for each target substance individually. The toxicological profiles and the
environmental fates of the substances are also discussed.
6.2 Nonylphenol
6.2.1 Exposure (local PEC)
When the impact of prewashing was taken into account, the calculated local predicted
exposure concentrations (PECs) for nonylphenol (ethoxylates) ranged from 0.0970 µg/l
to 5.78 µg/l, depending on the strip volume and dilution factor used in the calculations
(“with prewash” concentrations; Table 5.16). The “without prewash” PECs were
considerably higher: 0.0922–5.53 mg/l (Table 5.15). The PECs may, in reality, be
somewhat lower as the water quantities used in calculating the initial chemical
Tank cleaning in the Baltic Sea – Assessment of the ecotoxicity of tank cleaning effluents 65
concentration may differ from the estimates used in the present study. Moreover, the
dilution equation used in calculating the PECs does not, for example, account for
dispersion caused by the ship’s propeller or the continuous forward movement of the
ship. In addition, in practice, the PEC concentrations would obviously be rapidly
dispersed and diluted further in the vast sea, and therefore, the calculated local PECs are
only momentary concentrations.
6.2.2 Effects (PNEC for aquatic environment)
In selecting the PNEC value for nonylphenol, a total of 6 toxicity tests were taken into
account (one acute and one chronic test for each trophic group (algae, Daphnia and
fish). Since no NOEC value could be found for algae, the EC50 value of 27 µg/l (Ward
& Boeri 1990) was used as both the acute and the chronic value. By examining the
toxicity data that was selected for the derivation of PNECnonylphenol, it can be concluded
that nonylphenol is highly toxic to all three trophic groups, both acutely and chronically.
Fish seem to be the most sensitive species to nonylphenol. The lowest toxicity value
among the data was the NOEC value of 7.4 µg/l for fish (Ward & Boeri 1990). Since
long-term toxicity data was available for all three trophic groups, 10 could be used as a
safety factor. Consequently, the predicted no effect concentration (PNEC) obtained for
nonylphenol was 0.7 µg/l (Table 5.18). Lastly, nonylphenol acts as an endocrine
disruptor that can mimic oestrogen (Soares et al. 2008). As a result, when male fish are
exposed to nonylphenol, they may become feminized and suffer from reduced fertility.
6.2.3 Bioaccumulation
Bioaccumulation of nonylphenol in aquatic organisms varies from negligible to
significant. From algae, invertebrates and fish, BCF and BAFs between 0.9 and 10,000
have been reported (e.g. Servos 1999, CEPA 2001b, Vazquez-Duhalt et al. 2005).
Bioaccumulation is greatest in the lower trophic levels, particularly in algae.
Bioaccumulation in the lower trophic levels is particularly adverse as the higher
organisms will also be exposed by consuming contaminated food (Vazquez-Duhalt et
al. 2005). Bioaccumulation of short-chained nonylphenol ethoxylates in aquatic
organisms has been reported to be moderate (BCFs up to 740) (CEPA 2001b). For
longer-chained NPEs, bioaccumulation studies are scarce, but it is generally assumed
that the tendency to bioaccumulate decreases when the ethoxylate chain elongates.
However, according to Vazquez-Duhalt et al. (2005), in fish there are no significant
differences between the bioaccumulation tendencies of nonylphenol, nonylphenol
monoethoxylate and nonylphenol dioethoxylate.
6.2.4 Environmental fate and persistence
When tank washings containing nonylphenol ethoxylates are discharged into the sea,
nonylphenol will be gradually formed as the ethoxylates are degraded (Häkkinen et al.
2012). Nonylphenol will then partition between the different environmental
66 Honkanen, Häkkinen and Posti
compartments based on its physico-chemical properties. Since nonylphenol has a high
octanol-water partitioning coefficient (4.1–6.36; Table 5.2) and poor solubility in water
(6.35 mg/l), it partitions favourably to organic matter and sediments (John et al. 2000,
Soares et al. 2008).
According to fugacity modelling carried out by the Canadian Environment authorities
(CEPA 2001b), if nonylphenol is released in water, most of it will be present in water
phase (49–59%), slightly less of it will partition to sediment (41–50%), and only a
negligible proportion (<1%) of it will end up in air and soil compartments. Nonylphenol
will not volatise readily into air, as it has a low vapour pressure (Table 5.2). However,
the Henry’s law constant of nonylphenol indicates that it evaporates relatively well from
water. If nonylphenol evaporated into air once discharged into the sea, it would be
rapidly degraded by reactions with hydroxyl radicals (•OH). The measured half-life of
nonylphenol in the atmosphere is only 0.3 days (U.K Environment Agency 1997). Since
nonylphenol ethoxylates are far less volatile than nonylphenol, it is not predicted that
they would be partitioned to the atmosphere (CEPA 2001b). As regards predicting the
behaviour of nonylphenol in the environment, we should note that variations in the
physico-chemical properties of nonylphenol and nonylphenol ethoxylates, and their
rapid conversion to other metabolites, makes their environmental fate extremely
complex (CEPA 2001b). The percentages given above, for example, are predictions
only, and not based on exact measured values.
The biodegradation rate of nonylphenol is greatly dependent on ambient temperature.
When Manzano et al. (1998) studied the biodegradation of nonylphenol in river waters,
they noted that the percentages of primary biodegradation varied from 68% at 7 °C to
96% at 25 °C, and that at all the temperatures studied, some metabolites generated
during the biodegradation process remained at the end of the 30-day assay.
Consequently, nonylphenol is not readily biodegraded at low temperatures. Moreover,
the biodegradation rates of nonylphenol seem to be slower in sea water and sea water
sediments than in freshwater and freshwater sediments (U.S EPA 2005). According to
Ekelund et al. (1993), the half-life of nonylphenol in sea water was 58 days and that in
aerobic sea water in presence of sediment was 35 days. Since the Baltic Sea surface
waters are warm only shortly during the summer, the biodegradation rate of
nonylphenol in the Baltic Sea can be assumed to be very slow. The ultimate sink of
nonylphenol is the sediment. When Liber et al. (1999) studied the persistence and
partitioning of nonylphenol in an artificial littoral ecosystem, they found that the half-
life of nonylphenol was 1.2 days in water, 8–13 days in macrophytes and 28–104 days
in sediment. Moreover, according to Shang et al. (1994), when nonylphenol ends up in
the sediment it may stay there for as long as 60 years.
Photolysis (i.e. photodegradation) may have an important role in the elimination of
nonylphenol, particularly if the compound is released in the surface waters. Ahel et al.
(1994) noted that under summer sun conditions, the half-life of nonylphenol was from
10 to 15 hours in the surface layer of natural (filtered) lake water. The photolysis rates
at 20–25 cm below the surface were already about 1.5 times slower. The photolysis
rates of nonylphenol ethoxylates were shown to be significantly slower than they were
in the case of nonylphenol, and consequently, it was estimated that photolysis will only
Tank cleaning in the Baltic Sea – Assessment of the ecotoxicity of tank cleaning effluents 67
have a minor role in the overall removal of alkylphenol ethoxylates in aquatic
environments (Ahel et al. 1994). Since tank cleaning waters must be discharged below
the water line and nonylphenol ethoxylates have a density higher than that of sea water
(i.e. NP/NPEs are not likely to float on the surface waters), photolysis is probably not as
important an elimination route for nonylphenol and nonylphenol ethoxylates as
biodegradation.
6.2.5 PEC/PNEC ratio
In the risk characterization step of nonylphenol, its PEC concentration is compared to
its PNEC concentration. The “without prewash” PEC/PNEC ratios for nonylphenol
ranged from 132 to 7,905, depending on the quantity of the chemical residue (15/50/300
l) and the dilution factor used in the PEC calculations (1,000 or 3,000; Table 6.1). In
other words, the calculated risk ratios indicate that if a tank having contained
nonylphenol ethoxylates is not prewashed prior to main washing, the predicted no effect
concentration of nonylphenol (ethoxylate) in the sea during the discharge will most
likely be momentarily exceeded. However, nonylphenol ethoxylates are high-viscosity
cargoes, and therefore subjected to a MARPOL prewash. The “with prewash” PECs are
thus closer to the true values when characterizing the risk of tank cleaning waters
containing nonylphenol ethoxylate. The calculated “with prewash” PEC/PNEC ratios
for nonylphenol varied from 0.14 to 8.25. When a dilution factor of 1,000 was used, the
risk ratio stayed at accepted levels only when the volume of the water-chemical mixture
remaining in a tank after prewash was assumed to be 15 litres. The calculated
PEC/PNEC ratio then was 0.42. If the strip was assumed to be 50 or 300 litres in
volume, the risk ratios were 1.40 and 8.25, respectively. When the higher dilution factor
(3,000) was used in the calculations, the risk ratios were accordingly lower. In that case,
the PEC/PNEC ratio only exceeded 1 when the chemical-water-residue after prewash
was assumed to be 300 litres (risk ratio 2.75). For the 15-litre and 50-litre strips, the risk
ratios were 0.14 and 0.46, respectively – well below the risk limit.
In conclusion, the calculated risk ratios indicate that there might be a risk relating to the
discharge of tank cleaning waters containing nonylphenol into the sea, even though
nonylphenol ethoxylates are currently prewashed ashore. The risk is the most evident
when the NPE water mixture that remains in a tank after prewash is assumed to be 300
litres. Fortunately, while a strip volume of 300 litres is accepted within the limits of the
law, such high strip quantities are rare in practice (GESAMP 2002). Chemical residues
lower than 100 litres are far more typical in chemical tankers today. The results indicate
that when 50 litres of NPE water mixture (remaining from a prewash) is washed from a
tank and subsequently discharged into the sea in the resulting washings, the resulting
risk ratio is either 1.40 or 0.46, depending on the dilution factor used. Since there are a
lot of uncertainties relating to the used dilution equation and estimated washing water
quantities, further studies might be needed to verify whether the risk is relevant for
strips in this size range. Based on the PEC/PNEC ratios obtained, it could be argued that
if the NPE water effluent quantity in a tank after prewashing is less than 15 litres,
discharging the subsequent washings into the sea is not likely to pose a significant risk
to the aquatic environment. The results also revealed that prewashing of tanks from
68 Honkanen, Häkkinen and Posti
which nonylphenol ethoxylates have been unloaded is extremely important – without
prewashing and discharging the first washings to a reception facility at a port, the
nonylphenol ethoxylate concentrations in the main washings which may be discharged
into the sea would be alarmingly high (0.092–5.53 mg/l; Table 5.15). The persistent
nature of nonylphenol and its tendency to bioaccumulate in organisms and food webs
are factors that raise nonylphenol’s hazardousness in the aquatic environment. Because
of the these properties, chronic exposure to even the smallest concentrations of
nonylphenol may in time bioaccumulate in organisms, and eventually rise up to toxic
levels (Soares et al. 2008). Of course, it should be noted that nonylphenol is acutely
toxic even in low concentrations. Moreover, chronic exposure to nonylphenol can cause
reduced fertility in male fish.
6.3 Phenol
6.3.1 Exposure (local PEC)
When dilution by prewashing was taken into account, the calculated predicted exposure
concentrations for phenol were significantly lower than they were when the impact of
prewashing was left out of the calculations. The “without prewash” PECs calculated for
phenol ranged from 0.14 to 8.7 mg/l and the “with prewash” PECs from 0.14 to 8.2 µg/l
(Tables 5.15 and 5.16). The magnitude of the PECs depended on the assumed residue
volume and whether 1,000 or 3,000 was applied as the dilution factor in the
calculations.
6.3.2 Effects (PNEC for aquatic environment)
One acute and one chronic toxicity test for each trophic group (algae, Daphnia and fish)
was considered when determining the PNEC value for phenol. Based on the selected
toxicity data, phenol is toxic to all three trophic groups. Fish are the most sensitive
species to phenol (96h LC50: 0.15 mg/l; Black et al. 1982), whereas algae seem to
tolerate phenol rather well (24h EC50 1,211 mg/l; CEPA 2000a). The long-term NOEC
value of 17 µg for fish was the lowest value amongst the toxicity data. Since there were
chronic NOEC/NOEL values available for all three trophic groups, 10 was used as a
safety factor in deriving the PNECphenol. The obtained PNEC for phenol was 1.7 µg/l.
6.3.3 Bioaccumulation
The bioconcentration factors (BCFs) of phenol reported in fish range from 1.7 to 39.
The reported BCF values and the rapid elimination of phenol from organisms suggests
that bioaccumulation of phenol is unlikely (HSDB 2012).
Tank cleaning in the Baltic Sea – Assessment of the ecotoxicity of tank cleaning effluents 69
6.3.4 Environmental fate and persistence
Phenol is highly soluble in water (82,000 mg/l; see Table 5.3), it has a low organic
carbon-water partition coefficient (16.22–91.20) and a low octanol-water partition
coefficient (1.46). Therefore, phenol is not expected to significantly adsorb to sediment
or suspended matter in water. According to the fugacity modelling performed by the
Canadian Environment authorities (CEPA 2000), when phenol is released in water,
almost all of it, as predicted by the model, will also stay in the water compartment.
Biodegradation is the major elimination route of phenol in surface waters – assuming
that the degradation is not inhibited by the presence of high, toxic concentrations of
phenol or by other factors (such as a lack of nutrients or microorganisms capable of
degrading phenol) (CEPA 2000). If biodegradation is particularly slow, phenol will
typically react rapidly with hydroxyl and peroxyl radicals and singlet oxygen in sunlit
surface waters. For the hydroxyl radical reaction, a half-life of 100 hours, and for the
peroxyl reaction, a half-life 19.2 hours has been reported. The photooxidation reactions
require dissolved organic matter (DOM) that functions as photosensitizer. DOM is,
however, rather scarce in sea water. For example, in coastal waters of the Baltic Sea, the
DOC concentration is typically <5.5 mg/l (Schumann et al. 2003). This is rather low
compared to, for example, boreal lakes where the DOM concentration typically varies
between < 5 mg/l and 15 mg/l (Kronberg 1999). All in all, the suggested half-life of
phenol in water is 55 hours (CEPA 2000). The degradation of phenol is somewhat
slower in sea water than in fresh water, and a half-life of 9 days has been reported in an
estuarine river (ATSDR 2008). In sediment, a biodegradation half-life of 550 hours (ca.
23 days) has been suggested (CEPA 2000).
6.3.5 PEC/PNEC ratio
When the risk of phenol was characterised by comparing phenol’s PEC concentrations
to its PNEC concentration, it became clear that if cargo tanks that have contained
phenol were not prewashed prior to main washing, the predicted exposure concentration
in the sea would exceed phenol’s PNEC in every strip range (15/50/300l). The
calculated risk ratios were also significantly higher than 1, regardless whether the
dilution factor used in the calculations was 1,000 or 3,000 (Table 6.1).
In contrast, if cargo tanks that have contained phenol are prewashed prior to main
washing (as, in fact, required by MARPOL Annex II), the predicted exposure
concentrations will most likely stay at accepted levels – at least, if the chemical-water
effluent remaining in a tank after prewash is not significantly higher than 50 litres in
volume. When only strip quantities of 50 litres are considered, the calculated risk ratios
for phenol were 0.27 (dilution factor 3,000) and 0.81 (dilution factor 1,000). As seen in
Table 6.1, when the washing effluent that remains in a tank after prewash is assumed to
be 300 litres is volume, the risk ratios for phenol are 4.8 (dilution factor 1,000) and 1.60
(dilution factor 3,000). This consequently means that a strip residue of 300 litres of
phenol-water effluent might present a risk to aquatic organisms when released into the
sea with further washings.
70 Honkanen, Häkkinen and Posti
Based on the calculated PEC/PNEC ratios, we can conclude that prewashing of cargo
tanks from which phenol has been unloaded is essential before main washing and
releasing washing waters to the sea to ensure that phenol concentrations in the sea
resulting from these operational discharges stay at accepted levels and do not pose a risk
to the aquatic environment. The results also indicate that a prewash strip quantity of 300
litres will result in such high phenol concentrations in tank washings that the washings
may, at least momentarily, be hazardous to aquatic organisms. Of course, phenol is
quite readily biodegraded, and it does not bioaccumulate in organisms or food webs.
Therefore it is not as hazardous as, for example, nonylphenol. On the other hand, it has
been estimated that the degradation of phenol is somewhat slowed down in sea waters
compared to lakes and rivers (ATSDR 2008), and photodegradation may also be slowed
down as phenol has a density lower than that of sea water (density: 1.0545 kg/l; Table
5.3). In other words, it is expected to sink rather than float on the water surface and this,
consequently, could decrease the photodegradation rates of phenol. Finally, as noted
earlier, the PEC concentrations were calculated by using an overly-simplified dilution
equation, which does not account for the dispersion and dilution caused by the
conditions that prevail during the discharge (moving ship etc.). The calculated PECs
only describe a momentary concentration immediately after the discharge. In practice,
the dispersion and dilution of the effluents will continue even further.
6.4 Sulphuric acid
6.4.1 Exposure (local PEC)
The predicted exposure concentrations calculated for sulphuric acid were quite high
when the dilution effect resulting from prewashing was not taken into account. When
the lower dilution factor (1,000) was used in the calculations, the resulting PECs were
0.73–14.6 mg/l (Table 5.15). When the higher dilution factor (3,000) was used, the
calculated local PECs were 0.24–4.9 mg/l. When the effects of prewashing were
accounted for in the calculations, the local PECs for sulphuric acid were 0.40–8.2 µg/l
(dilution factor 1,000) and 0.13–2.6 µg/l (dilution factor 3,000) (Table 5.16).
6.4.2 Effects (PNEC for aquatic environment)
A total of four toxicity tests were selected for the derivation of predicted no effect
concentration for sulphuric acid (Table 5.18). For algae, no acute toxicity data were
available, and for Daphnia, no chronic toxicity data were available. From the available
toxicity data given in Table 5.18, we can conclude that the chronic toxicity of sulphuric
acid is pointedly higher than its acute toxicity. The acute toxicity of sulphuric acid to
fish, for example, is 16 mg/l (96h LC50, pH 3.5), whereas sulphuric acid’s chronic
toxicity to fish is 25 µg/l (NOEC 26 °C, pH 6) (OECD 2001). The chronic NOEC of 25
µg/l for fish was also the lowest toxicity value among the selected toxicity data. As
chronic toxicity values were only available for fish and algae, a safety factor of 50 was
Tank cleaning in the Baltic Sea – Assessment of the ecotoxicity of tank cleaning effluents 71
used in deriving the PNECsulphuric acid. The obtained PNEC for sulphuric acid was
therefore 0.5 µg/l.
According to a CEDRE (2006) report, when the concentration of sulphuric acid in fresh
water is below 0.01 g/l, the impact on pH is small. When sulphuric acid concentration is
0.01–0.1 g/l, the pH of naturally neutral fresh water will range from 5.5 to 7. A
concentration of 0.1–1 g/l corresponds to a pH value of 1.8–5.5, and finally, a
concentration greater than 1 g/l corresponds to pH below 1.8. However, it should be
noted that the effects of sulphuric acid are greatly dependent on the natural pH and
buffer capacity of the water system, both of which vary among aquatic systems. In
comparison to many lakes, the Baltic Sea has a much greater buffer system (alkalinity),
and it is not as prone to acidification caused by anthropogenic activities (e.g. acid rain)
(Kumblad & Rydin 2012). The mean total alkalinity of the surface water in the Baltic
Sea varies depending on the salinity (Hjalmarsson et al. 2008). Consequently, the
alkalinity and the buffering capacity are lowest in the Bothnian Bay and increase
towards the Baltic proper and Kattegat as the salinity increases.
6.4.3 Bioaccumulation
Due to its complete ionisation in water, sulphuric acid is not likely to bioaccumulate in
organisms or in food webs (OECD 2001). BCFs for sulphuric acid have not been
determined (CEDRE 2006).
6.4.4 Environmental fate and persistence
Sulphuric acid is perfectly water soluble: in water, it dissociates completely into
sulphate and hydrogen ions (OECD 2001). In the ionisation process, a large amount of
heat is released. Due to its complete ionisation, sulphuric acid is not likely to adsorb
into organic matter or sediments. Sulphate concentrations in the environment tend to
remain at natural levels, and the harmful effects of sulphuric acid are mainly due to
acidification caused by an increasing concentration of H+ ions.
Sulphuric acid is an inorganic chemical, and hence it will not undergo biological
degradation in aerobic conditions (CEDRE 2006). However, the compound may be
broken down by sulphate reducing bacteria (IUCLID 2000b). Through abiotic
degradation at 25 °C, following half-lives have been reported for sulphuric acid: pH 4:
even over 1 year and pH 7 or pH 9: less than 1 minute (IUCLID 2000b). In the Baltic
Sea surface waters, the pH value typically ranges between 8 and 8.5 (Omstedt et al.
2009).
In aquatic environments, sulphuric acid will also react with other ions (e.g. magnesium
and calcium ions) forming sulphate salts (HSDB 2012).
72 Honkanen, Häkkinen and Posti
6.4.5 PEC/PNEC ratio
The PEC/PNEC ratios calculated for sulphuric acid exceeded 1 by far when the effects
of prewashing were not accounted for in the calculations. Even with the higher dilution
factor of 3,000, the resulted risk ratios were at times over a thousand (487–9,735; Table
6.1). Using 1,000 as the dilution factor resulted in even higher risk ratios: 1,460–29,204.
When the impact of prewashing was taken into consideration, the risk ratios of
sulphuric acid still remained relatively high. When a dilution factor of 1,000 was used
in the PEC calculations, the PEC/PNEC ratio only went down to accepted levels in the
strip range of 15 litres. When the PECs were calculated for the 50 and 300 litres sized
sulphuric acid strip (consisting of H2SO4 water effluent), the ratios were 2.6 and 16,
respectively. When 3,000 was used as the dilution factor, the risk ratios for sulphuric
acid were, consequently, somewhat lower, only exceeding 1 in the strip range of 300
litres. The calculated risk ratios for sulphuric acid (when using 3,000 as the dilution
factor) were: 0.27 (15 l), 0.88 (50 l), and 5.3 (300 l).
As regards characterising the risk arising from tank cleaning waters containing
sulphuric acid, based on the calculated risk ratios, it may be concluded that a risk does
indeed exist. The risk is the greatest if cargo tanks are not prewashed subsequent to
unloading and if the first washings are discharged directly into the sea. It is, however,
important to be aware of the fact that the PNEC for sulphuric acid refers specifically to
sulphuric acid. As noted earlier, sulphuric acid dissociates completely into sulphate and
hydrogen ions in water, and therefore, sulphuric acid concentrations stay reasonably low
in aquatic environments (OECD 2001). Consequently, the negative effects of sulphuric
acid in aquatic systems mainly stem from the acidification effect caused by increasing
levels of H+ ions. However, once tank cleaning waters containing sulphuric acid are
released into the sea, the acid concentrations can be expected to rapidly dilute in the vast
amount of water (CEDRE 2006). Moreover, the overall buffering capacity (alkalinity)
of the Baltic Sea is quite good (Kumblad & Rydin 2012), and therefore, the change in
pH would probably be minor. The areas in the Baltic Sea that are most susceptible to
acidification (based on the total alkality in surface waters) are the sub-basins in which
the salinity is the lowest: the Gulf of Finland, the Gulf of Bothnia, and particularly the
Bothnian Bay. The total alkalinity in surface water in the Gulf of Finland is on average
1,200–1,400, in the Gulf of Bothnia 1,000–1,400 and in the Bothnian Bay 800
(Hjalmarsson et al. 2008).
6.5 Styrene
6.5.1 Exposure (local PEC)
The calculated predicted exposure concentrations for styrene varied between 0.10 and
6.2 µg/l when the dilution effect of prewashing was accounted for in the calculations.
When prewashing was not accounted for, the calculated PECs were accordingly higher:
0.094–5.6 mg/l. The magnitude of the PECs obtained depended on the strip volume and
dilution factor used in the calculations. Styrene is a cargo for which the prewash
Tank cleaning in the Baltic Sea – Assessment of the ecotoxicity of tank cleaning effluents 73
procedure is not mandatory. However, there are ports in Finland where commercial
prewashes of styrene are performed (Keskitalo 2012 pers. comm; NesteOil 2006), and
therefore, in practice, both “with prewash” and “without prewash” concentrations
probably occur in the Baltic Sea.
6.5.2 Effects (PNEC for the aquatic environment)
All in all, 5 toxicity tests were selected for determining PNECstyrene (Table 5.18). Both
acute and chronic values were available for algae and fish, but for Daphnia, only results
from short-term toxicity studies were available. Based on the selected toxicity data,
styrene is toxic to all three trophic groups, both acutely and chronically, with algae
being the most sensitive trophic group (acute 48h EC50 for algae 4.7 mg/l; Cushman et
al. 1997). Among the selected toxicity data, the lowest toxicity value was the chronic
96h NOEC of 63 µg/l for algae (Cushman et al. 1997). Since only two chronic NOEC
values were available for the derivation of PNECstyrene, a safety factor of 50 had to be
used. The PNEC concentration obtained for styrene was 1.3 µg/l.
6.5.3 Bioaccumulation
A BCF of 13.5 in goldfish has been reported for styrene (HSDB 2012). The value
suggests that bioaccumulation of styrene is not significant, despite the relatively high
log Kow (2.76–3.16; Table 5.5). The low BCF probably results from the rapid
metabolism and excretion of styrene from organisms (CCME 1999).
6.5.4 Environmental fate and persistence
When styrene is released into the aquatic environment, the majority of the compound
can be expected to partition into the atmosphere due to its high vapour pressure and
Henry’ law constant (HSDB 2012) (vapour pressure: 807–880 Pa and Henry’s law
constant: 233–297 Pa m3/mol; Table 5.5). Volatilization of dissolved styrene from water
is particularly fast from the water surface. However, styrene dissolves into water very
slowly (water solubility 160–330 mg/l at 25 °C; Table 5.5) and based on its high Koc
(513–2,630; Table 5.5) styrene may also be adsorbed to suspended matter and sediment
when released to water (HSDB 2012). Consequently, styrene’s elimination from water
may be slowed down by these factors.
In the air, styrene is rapidly broken down by reactions with hydroxyl radicals and
ozone: half-lives of styrene for these reactions are 7 and 16 hours, respectively (HSDB
2012). Direct photolysis of styrene in the atmosphere is rather slow. Based on
modelling, half-lives of styrene have been estimated to be 3 hours in a shallow river
system, 3 days in a shallow pond, and 13 days in a lake (CCME 1999). According to
Gibbs & Mulligan (1997), the half-life of styrene in water in aerobic conditions is
approximately 5 days.
74 Honkanen, Häkkinen and Posti
6.5.5 PEC/PNEC ratio
When the dilution effect caused by prewashing was taken into account, the calculated
PEC/PNEC ratios for styrene mostly remained at accepted levels. The “with prewash”
risk ratios calculated by using 15 litres as the strip quantity were: 0.24 (dilution factor
1,000) and 0.080 (dilution factor 3,000) (Table 6.1). When 50 litres was used as the
strip quantity, the “with prewash” risk ratios for styrene were: 0.80 (dilution factor
1,000) and 0.27 (dilution factor 3,000). The “with prewash” risk ratios obtained for
styrene were only greater than 1 when calculated using 300 litres as the strip quantity.
In that case, the PEC/PNEC ratios obtained were: 4.8 (dilution factor 1,000) and 1.6
(dilution factor 3,000).
Without the effects of prewashing, the PEC/PNEC ratios calculated for styrene
exceeded 1 in all strip ranges and regardless of the dilution factor used (Table 6.1).
Consequently, the results indicate that prewashing of tanks from which styrene has been
unloaded is central in keeping the risk of tank cleaning slops containing styrene at
accepted levels. Styrene, however, belonging to category Y and being a low-viscosity
and non-solidifying substance, is a cargo that is not subjected to a mandatory in-port
prewash. As mentioned earlier, in some Finnish ports styrene is prewashed as there has
been environmental concerns from cargo owners relating to discharging styrene into the
sensitive environments of the Bothnian Bay and the Gulf of Finland without prewashing
(Keskitalo 2012 pers. comm.). However, since prewashing of styrene is not required by
MARPOL, the alarmingly high “without prewash” PECs can be assumed to occur at
least in some parts of the Baltic Sea area. Based on the findings of this study, it is clear
that some risk management actions should be taken to lower the risks of styrene,
particularly in the Baltic Sea, where the abiotic circumstances deteriorate the
elimination of hazardous substances (shallowness, long water turnover time, cold
climate etc.). The problem arising from styrene in the Baltic Sea may be further
emphasised due to the fact that styrene is one of the most frequently handled chemicals
in the Baltic Sea ports.
6.6 Xylenes
6.6.1 Exposure (local PEC)
The calculated predicted exposure concentrations for ortho-xylene, when the dilution
effect caused by prewashing was not considered, were 0.19–11 mg/l, depending on the
amount of chemical residue (15/50/300 l) and the dilution factor that was used in the
PEC calculations (1,000 or 3,000). When prewashing was accounted for, the obtained
PEC concentrations for o-xylene were significantly lower: 0.21–13 µg/l. In total, of the
evaluated target substances, o-xylene’s predicted exposure concentrations were the
second highest. Only sulphuric acid had PEC concentrations higher than o-xylene.
Tank cleaning in the Baltic Sea – Assessment of the ecotoxicity of tank cleaning effluents 75
6.6.2 Effects (PNEC for aquatic environment)
In selecting the predicted no effect concentration for xylenes, a total of 6 toxicity tests
were taken into account (one acute and one chronic test result for each of the three
trophic groups) (Table 5.18). According to the selected toxicity data, it is reasonable to
conclude that xylenes are not as toxic chronically as they are acutely. The acute toxicity
of xylenes is moderate, whereas the chronic toxicity of xylenes is only slight. Moreover,
in acute exposure, Daphnia seems to be the most sensitive species to xylenes (24h LC50:
1.0 mg/l; Galassi et al. 1988). The lowest toxicity value among the selected toxicity data
was the 8d NOEC of 0.9 mg/l for algae (CEDRE 2008). This value was obtained for
para-xylene. Since NOEC values were available for all three trophic groups, a safety
factor of 10 was used in deriving the PNECxylenes. The PNEC concentration obtained for
xylenes was 90 µg/l (Table 5.18).
6.6.3 Bioaccumulation
Only moderate bioaccumulation has been reported for xylene. Moreover, xylenes do not
bioconcentrate along food chains. For xylenes, the following BCFs have been reported:
BCF 6 in clam Tapes semidecussata (mixed isomers, 8-day exposure)
(Nunes & Benville 1979)
BCF 21.4 / 23.6 / 23.6 in eel Anguilla japonica (o-xylene / m-xylene/ p-xylene)
(Ogata & Miyake 1978)
BCF 14–14.7 in rainbow trout (56-day exposure; no increase in the xylene
concentrations in fish after day 2) (CEPA 1993).
Bioaccumulation of xylenes is most substantial in algae. In the green algae Selenastrum
capricornutum, BCFs of 257, 251 and 218 have been reported for para-, meta- and
ortho-xylenes, respectively (Herman et al. 1991).
6.6.4 Environmental fate and persistence
Xylenes have relatively high vapour pressures, moderate solubility in water and
moderately low octanol-water partitioning coefficients (Table 5.6). Subsequently,
xylenes are expected to partition mainly to the atmosphere in case they are released into
the environment (CEPA 1993). According to CEDRE (2008), 99.7% of xylene that is
released into the environment will end up in the air compartment. Similarly, when
xylenes are released into water, they will be rapidly volatised into the atmosphere,
particularly if they are released in surface waters (CEDRE 2008). The environmental
fate of the different xylene isomers is assumed to be the same, as the physico-chemical
properties of the isomers do not significantly differ from each other.
In the air, xylenes are rapidly degraded by reactions with hydroxyl radicals – the half-
life of xylenes in the air varies from 1 hour to 2 days (FIOH 2011d). In water, a half-life
of only 5.6 hours has been reported for xylenes (in 1-meter deep surface water)
(Mackay & Leinonen 1975). The half-life is short due to the rapid volatilisation.
76 Honkanen, Häkkinen and Posti
However, the half-life of xylenes varies depending on mixing events and the depth of
the water system (the half-life would, for example, be shorter in turbulent water due to
increasing volatilisation rates). For lakes, volatilisation rates of 8 days, and for streams
and rivers, volatilization rates of 1–2 days, have been calculated (CEPA 1993).
However, according to U.S. EPA (1987), volatilisation from streams and rivers takes
from 36 minutes to 47 days. The high variability in the reported values is due to
differences in depth and flow rates in streams and rivers.
In surface waters, xylenes are also degraded by microorganisms in both aerobic and
anaerobic conditions (CEPA 1993). In aerobic systems, half-lives for biodegradation in
water have been estimated to be 7–28 days for all three isomers. In anaerobic
conditions, the half-lives were longer for all isomers: 180–360 days for o-xylene and
28–112 days for m- and p-xylenes.
6.6.5 PEC/PNEC ratio
The risk relating to tank cleaning waters containing xylenes were characterised by
comparing the calculated PEC concentrations of o-xylene to its PNEC concentration.
Among the five target substances, the PEC/PNEC ratios calculated for o-xylene were
the lowest. The risk ratios ranged from 2.1 to 125 when the impact of prewashing was
not considered, and from 0.0024 to 0.14 when the dilution caused by prewashing was
considered (Table 6.1). The magnitude of the risk ratio depended on the amount of
chemical-/pre-washings residue (15/50/300 l) for which the ratio was calculated and on
the dilution factor used in the PEC calculations (1,000/3,000).
Based on the calculated risk ratios, it can be concluded that if cargo tanks are prewashed
subsequent to unloading of xylenes, the following main washings can be expected to be
dilute enough so that there will be no risk to aquatic organisms. Even if the strip
(consisting of remnants of xylene-pre-washings) is as large as 300 litres, the xylene
concentration in the main washings can be expected to stay so low that a risk to the
environment is unlikely (regardless of the dilution factor) (Table 6.1). This is in contrast
to the other target substances: when the strip amount of prewashings containing
chemical was assumed to be 300 litres, none of the risk ratios of the other four target
substances stayed at accepted levels. However, since there were some uncertainties
relating to the PEC calculations and the risk ratios calculated for the 300 litres strip
exceeded/were under 1 on such a small margin (Table 6.1, “with prewash” risk ratios),
the risk may also need to be refined for this strip range (e.g. by obtaining more detailed
exposure data, for example by measuring concentrations in the sea immediately after
discharging the slops).
As with nonylphenol, phenol, sulphuric acid and styrene, there is also an indication of a
risk when tank cleaning waters containing xylenes are discharged directly into the sea
without any previous washing. The risk is most evident if the amount of xylenes
remaining in a tank after unloading and stripping is 300 litres or greater. If the strip
quantity is around 50 litres, the risk is somewhat lower, and when the amount of
chemical residue is 15 litres, the risk is the smallest: risk ratios were 6.2 (dilution factor
Tank cleaning in the Baltic Sea – Assessment of the ecotoxicity of tank cleaning effluents 77
1,000) and 2.1 (dilution factor 3,000) (Table 6.1). Due to the uncertainties relating to the
method used in obtaining the PECs, the risk may need to be refined for the smallest strip
range. Even though risk ratios calculated in the present study indicate the presence of a
risk, the margins by which the ratios exceed 1 are relatively small.
In conclusion, if cargo tanks that have contained xylenes are prewashed prior to main
washing, the xylene concentrations in the generated main slops seem to stay dilute
enough so that there will be no negative consequences to the environment. When these
dilute concentrations of xylenes are released into the sea, they will be rapidly diluted
and since xylenes, having a density lower than that of sea water13
, are so called
“floaters”, and their evaporation from the water can be expected to be rapid. Based on
the calculated PEC/PNEC ratios, it is also reasonable to conclude that without
prewashing and discharging the first washings to ashore reception facilities, the xylene
concentrations in the main washings are likely to reach such high levels that the risk to
aquatic organisms will become plausible – particularly if the strip quantity is 300 litres.
13
Density of o-xylenes: 0.8755 kg/l (Lide 2009).
78 Honkanen, Häkkinen and Posti
7 SUMMARY AND CONCLUSIONS
This study examined a risk evaluation of tank cleaning wastes in the Baltic Sea area.
The risks were evaluated by conducting a literature survey and a small-scale risk
assessment on five target chemicals by following EU methodology laid down in the
Technical Guidance Document on Risk Assessment (EC 2003) where applicable. The
target chemicals were chosen on the basis of existing studies and projects where
chemicals were ranked based on their hazardousness in the aquatic environment and
their shipping volumes in the Baltic Sea. The selected chemicals for the evaluation were
nonylphenol ethoxylate, phenol, sulphuric acid, styrene and xylene.
For various reasons, tanks in chemical carriers are cleaned after they have been emptied
of cargo (Olson 1994). Requirements for the discharge of the generated effluents are
laid down in Annex II of the international convention MARPOL 73/78 (the Control of
Pollution by Noxious Liquid Substances Carried in Bulk). Tanks having contained
cargoes that fall in the most hazardous category X must be prewashed ashore until the
chemical concentration in the generated effluent is low enough according to MARPOL
limits (0.1% by weight). In-port prewashes are also required for high-viscosity and
solidifying cargoes in category Y (e.g. animal and vegetable oils) whose residues cannot
be pumped out of tanks as effectively as the residues of other substances. All slops
generated during prewashing must be discharged to ashore reception facilities.
Prewashing is not a sufficient cleaning method by itself, and cargo tanks practically
always have to be washed further in a subsequent main washing process, which may
take several hours. The slops generated during the main cleaning process can be
discharged directly into the sea (HELCOM 1993, Kunichkin 2006).
Literature survey
The literature survey revealed that studies on operational (legal or illegal) discharges
from the shipping industry are rather scarce and mainly focus on oil. The environmental
effects of chronic oiling have been well studied in the North Sea by means of systematic
beached bird surveys (Skov et al. 2011). In the Baltic Sea, however, the number of case
studies on the effects of chronic oiling on the environment has been low. On the basis of
several existing studies from the North Sea and the few focusing on the Baltic Sea, it
can be concluded that chronic operational oil discharges from tankers are a significant
threat to the marine environment, probably more so than the operational discharges of
chemicals (e.g. Skov et al. 2011; Larsson & Tydén, 2009, 2011).
In addition to mineral oil, oily substances such as vegetable oils had also been found to
cause massive bird kills on several occasions in the North Sea before they were included
in the scope of MARPOL and its cleaning and discharge requirements (e.g.
Camphuysen et al. 1999). At present, no studies have been conducted on the
environmental effects of tank cleaning effluents containing chemicals in the Baltic Sea.
However, general screening surveys have been carried out in different parts of the Baltic
Sea where the concentrations of certain high priority chemicals or chemical groups have
been measured in both water and organisms (e.g. Lilja et al. 2009, HELCOM. 2010c,
Andersson et al. 2012). Many of the targeted chemicals are not carried in bulk by
Tank cleaning in the Baltic Sea – Assessment of the ecotoxicity of tank cleaning effluents 79
chemical tankers (e.g. dioxins, furans, tributyltin and heavy metals). Moreover,
operational discharges from chemical tankers have not been identified as a possible
source of contamination in any of the projects mentioned above. In contrast to the Baltic
Sea, two surveys have been carried out in the North Sea where the chemical
concentrations resulting from tank cleaning were evaluated by both modelling and by
taking samples from sites near UK ports (Hurford et al. 1989, 1990). Based on these
studies, chronic discharges from tank cleaning waters containing chemicals did not
cause significant harm to the aquatic organisms in the North Sea. The findings from the
North Sea cannot be applied to the Baltic Sea without reservation, as the properties of
these seas (e.g. water exchange rates and depth) differ greatly from each other.
Therefore, the elimination of hazardous substances in the Baltic Sea can be expected to
take longer than it takes in the North Sea (Håkanson et al. 2003). The beached-bird
surveys and concentration measurements seem to complement each other, as the former
are the best indicator of chronic pollution of hydrophobic substances, whereas the latter
is best suited for detecting pollution caused by water soluble substances.
Risk assessment
In the risk assessment of this study, the Predicted Environmental Concentrations (PECs)
for all five target chemicals were determined. The PECs were calculated based on the
residual cargo quantity that was estimated to remain in a tank after unloading (= the
strip) and the water quantity that is used in the cleaning process. The water volume used
in tank cleaning depends on many things, most importantly on cargo properties
(Kunichkin 2006). The water volumes used for the target chemicals were determined by
utilising Dr. Verwey’s Tank Cleaning Guide (Verwey 2007). The cargo residue that
remains in a tank after unloading varies as well, depending on tank size and the
stripping technique used in a particular ship. Therefore, the PECs were calculated for a
hypothetical 1,000-m3 tank using three strips of different sizes: 15 litres, 50 litres and
300 litres. The 15-l and 50-l strips are more or less typical of modern tankers (e.g.
Kunichkin 2006, Tanker Operator 2008a). In practice, strips of 300 litres in volume are
rare (GESAMP 2002), but as this is the largest chemical volume that is allowed to
remain in a cargo tank by MARPOL Annex II, selecting this as the maximum strip
value was justified. The PECs were calculated with and without the dilution effect
caused by prewashing to evaluate the importance of these mandatory in-port prewashes.
Immediate dilution in the sea and adsorption into suspended solids were also accounted
for in determining the PECs.
In the risk characterisation, the PECs obtained for the target chemicals were compared
to their corresponding Predicted No Effect Concentrations (PNECs) which were derived
from toxicity data in available literature (by Häkkinen et al. 2010). Whenever the
calculated PEC/PNEC ratio exceeds 1, there is an indication of a risk. In such cases,
there are two possible conclusions to be made: 1) further studies on the subject are
needed or 2) the existing risk management measures are not sufficient, and the risk
needs to be mitigated by additional risk management actions (Nikunen & Leinonen
2002).
80 Honkanen, Häkkinen and Posti
The results of the risk assessment clearly demonstrated the importance of prewashing
cargo tanks ashore before the main washing. Without prewashing the cargo tanks and
discharging the generated prewashing effluents into reception facilities ashore, the
obtained PEC/PNEC ratios for the further washings exceed 1 – regardless of the
chemical and the quantity of the chemical residue (15/50/300 litres).
In contrast, if the cargo tanks are prewashed and the remaining prewash residues in the
tanks are small (≤ 15 l), the risk arising from tank cleaning effluents stays at accepted
levels and there seems to be no significant harm to the aquatic organisms. When the
prewash residue is around 50 litres, the risk arising from further washings mostly
remains at accepted levels as well. However, the results indicate that prewash remnants
of 300 litres can in most cases be expected to cause significant harm to the aquatic
organisms when they are discharged into the sea with further washings. In practice,
residues that remain in a tank after prewashing are virtually never as large as 300 litres;
they are more likely to be in the 15–100–litre range, possibly even smaller (GESAMP
2002, Kunichkin 2006, Keskitalo 2012 pers. comm.).
Even though the current study indicates that prewashing is essential to keep the risks
arising from tank cleaning wastes at accepted levels, of the target substances only
nonylphenol (ethoxylate), mandatory prewashing under MARPOL only applies to
nonylphenol (ethoxylate), phenol and sulphuric acid. Styrene and xylenes, on the other
hand, do not require prewashing of any kind – at least not by MARPOL.
Adequacy of the current cleaning and discharge requirements
When the current state of cleaning and stripping requirements is considered, of the
evaluated target substances the greatest risk seems to arise from styrene and xylenes.
Sulphuric acid and nonylphenol ethoxylate may also give rise to a risk in certain cases.
The risks of styrene and xylenes stem from the current state of the law: they do not need
to be pre-washed, whereas the risks of nonylphenol (ethoxylate) and sulphuric acid are
evident, even though they are subjected to a prewash. A risk in case of nonylphenol
(ethoxylate) and sulphuric acid may exist when the strip (which consists of prewashing
effluent) is in the medium range, i.e. around 50 litres, or larger. Phenol is also subjected
to a prewash, but the risk arising from tank cleaning effluents containing phenol
remains below the risk limit (assuming that strips of 300 litres after prewashing are non-
existent in practice). The sufficiency of the current risk management actions regarding
the cleaning and discharge of the target chemicals are summarised in the following.
Suggestions to improve the state of risk management are also given where needed.
Phenol
Phenol is subjected to a mandatory in-port prewash, as it is a solidifying substance
belonging to MARPOL pollution category Y. The results of this study indicate that a
strip value of 300 litres after prewash cannot be accepted from the environmental point
of view. At present, there are no requirements applicable to the amount of prewashing
effluent that is allowed to remain in a tank after prewashing, but fortunately, a volume
of washings as large as 300 litres remaining in a tank after prewash is very unlikely
Tank cleaning in the Baltic Sea – Assessment of the ecotoxicity of tank cleaning effluents 81
(GESAMP 2002). All in all, the current cleaning and discharge requirements for phenol
seem to be sufficient to keep the environment from harm by tank cleaning wastes
containing phenol. However, the results of this study suggest that the prewashing
remnants of phenol should not exceed 50 litres, at least not by a large margin.
Nonylphenol (ethoxylates)
At present, nonylphenol (ethoxylate) belongs to MARPOL category Y, and being a
high-viscosity substance, it is subjected to a mandatory prewash procedure. The risk
ratios that were calculated in this study indicate that prewashing may not be sufficient in
all cases to keep the hazard arising from tank cleaning effluents containing nonylphenol
ethoxylate at accepted levels. When prewash remnants in a tank are around 50 litres in
volume, there may be a risk to the aquatic organisms (risk ratios for this strip size were
0.46 and 1.4 depending on the calculation method). As there were some uncertainties
relating to calculating the PEC values, however, the risk may need to be refined. In
contrast, the results indicate that prewash residues of ≤ 15 litres seem to be small
enough in volume not to cause significant harm in the marine environment when
released in the sea with subsequent washings. Similarly to phenol, prewash residues of
300 litres are likely to cause harmful effects in the environment, but as mentioned
earlier, such strip amounts hardly ever occur in practice. In conclusion, there might be a
need to adjust the stripping and cleaning requirements for nonylphenol ethoxylate. At
present, there are no requirements applicable to the amount of prewashing effluent that
is allowed to remain in a tank after prewashing. The results of this study suggest that the
prewashing remnants of nonylphenol ethoxylate should not exceed 15 litres, at least not
by a large margin.
Sulphuric acid
Sulphuric acid is at present classified in MARPOL category Y. It is a solidifying
substance, and therefore subjected to a prewash procedure. According to the risk ratios
calculated in the study, it may be concluded that prewashing might in some cases be
insufficient to reduce the risk arising from tank cleaning effluents containing sulphuric
acid to a tolerated level. Similarly to nonylphenol ethoxylate in the 50-litre strip range,
there might be a risk to the aquatic organisms (risk ratios in this strip size were 0.88 and
2.6, depending on the calculation method). As with phenol and nonylphenol ethoxylate,
prewash residues of 300 litres are most likely to cause harmful effects in the
environment when released in the sea in the following washings. In practice, however,
such large strip quantities are rare (GESAMP 2002). Based on the results, it may be
concluded that the current cleaning and stripping requirements are otherwise
satisfactory but it could be recommended that the prewashing effluents that remain in a
tank after prewashing would not exceed 15 litres, at least not in excess.
82 Honkanen, Häkkinen and Posti
Xylenes
At present, xylenes are classified in MARPOL category Y, but they are not subjected to
a prewash procedure as they are neither high-viscosity nor solidifying cargoes. Based on
the results, without prewashing, the amounts of xylenes that are discharged into the sea
with tank washings are great enough to cause harm to aquatic organisms. The risk ratios
exceed 1 in all size ranges (15/50/300 litres) if xylenes are not prewashed. The risk to
the environment would be significantly reduced if xylenes were prewashed. The risk
ratios would then stay well below the risk limits in all strip ranges – even in the 300-
litre strip. In conclusion, the risk ratios obtained in this study indicate that the current
state of risk management seems to be insufficient to ensure low enough concentrations
of xylenes in the sea. An obligation to use tank prewashing for xylenes is
recommended.
Styrene
Styrene is currently classified as a category Y substance. It is a low-viscosity and non-
solidifying substance, and therefore, not subjected to a mandatory in-port prewash.
Based on the risk ratios obtained in this study, tank cleaning effluents containing
styrene give rise to a significant risk in the environment. Without prewashing, the
amount of styrene that ends up in the sea in tank cleaning effluents is so large that the
calculated risk ratios exceed 1 by a great deal, even when the chemical residue that
remains in a tank after unloading is as small as 15 litres. Consequently, the harm to
aquatic organisms from tank cleaning effluents containing styrene is likely to be
substantial. If tanks having contained styrene were prewashed, the risk would be
reduced to accepted levels in all but the 300-litre strip class. But once again, 300 litres
of prewashing effluents rarely remain in a tank after prewashing (GESAMP 2002). In
conclusion, there seems to be a clear shortcoming in the current state of stripping and
cleaning requirements for styrene. Based on the results of this study, it is suggested that
prewashing of tanks having contained styrene be enforced by a legislative measure.
Currently, as requested by cargo owners, voluntary commercial prewashes of styrene
are performed in some Finnish ports (Keskitalo 2012 pers. comm., NesteOil 2006),
which, in the light of the results of this study, is very positive. However, it would be
even better if this good practice was also enforced by law. Moreover, if/when styrene is
prewashed, it is also recommended that the prewashing remnants that remain in a tank
after prewashing would not exceed 50 litres by a large margin.
Conclusions
In conclusion, the results of the study showed that prewashing requirements for the
most hazardous category X cargoes and the high-viscosity and solidifying category Y
cargoes are without doubt needed to keep the hazards arising from these substances at
accepted levels. Without prewashing, the impact of such substances as vegetable oils on
sea birds would be detrimental. Moreover, based on the risk ratio calculations, it is
reasonable to suggest that prewashing be made mandatory for all category Y cargoes, at
least in the particularly sensitive Baltic Sea area. There are several toxic and persistent
cargoes in the Y category (Häkkinen et al. 2012) that at present, being non-solidifying
Tank cleaning in the Baltic Sea – Assessment of the ecotoxicity of tank cleaning effluents 83
and low-viscosity, may avoid the prewashing requirements. It can be hypothesised that
these substances can cause significant damage in the shallow and sensitive ecosystems
of Baltic Sea in the long run, if the discharges continue to be as substantial as they seem
to be without in-port prewashes. Alternatively, the high-risk category Y cargoes should
be carefully identified by future research and enforce mandatory prewashes only for
hazardous chemicals. This way unnecessary and costly prewashing of lower-risk
category Y cargoes could be avoided.
Finally, one possible way of reducing the hazards arising from tank cleaning is to
minimize the amount of cargo that remains in a tank after unloading. It might be
preferable to utilise a so-called super stripping system in the unloading process more
frequently. By using super stripping, the tank can be drained almost completely (Tanker
Operator 2008a), which would substantially reduce the volume of chemicals that are
released in the sea as a result of tank cleaning. Finally, as no case studies concerning the
effects of tank cleaning in the Baltic Sea area were found in this study, sampling
surveys or some other monitoring might be indicated in the future.
84 Honkanen, Häkkinen and Posti
REFERENCES
ABS, American Bureau of Shipping (2006). Understanding the Revisions to MARPOL
Annex II and the IBC Code. ABS Guide to Owners. Available at:
http://www.scribd.com/doc/69758863/MARPOL-IBCCODE-6219 (Accessed 18 June
2012).
Ahel, M. & Giger, W. (1993). Partitioning of alkylphenols and alkylphenol ethoxylates
between water and organic solvents. Chemosphere 26: 1471–1478.
Ahel, M., Scully, F. E., Hoigné, Jr, J. & Giger, W. (1994). Photochemical degradation
of nonylphenol and nonylphenol polyethoxylates in natural waters. Chemosphere 28:
1361–1368.
Allen, D. T. (2002). Evaluating environmental fate: Approaches based on chemical
structure. In: Allen, D.T. & Shonnard, D.R. (Eds.), Green Engineering: Environmentally
Conscious Design of Chemical Processes pp. 93–135, Prentice Hall, Upper Saddle
River, NJ, USA.
Andersson, H., Palm Cousins, A., Brorström-Lundén, E., Wickman, T., Pettersson, M.,
Holmström, K., Fischer, S. & Parkman, T. (2012). Summary report SWEDEN. Work
package 4: Identification of sources and estimation of inputs/impacts on the Baltic Sea.
21 p + Appendices. IVL. Stockholm.
Arnot, J. A. & Gobas, F. A. P. C. (2006). A review of bioconcentration factor (BCF)
and bioaccumulation factor (BAF) assessments for organic chemicals in aquatic
organisms. Environ. Rev. 14: 257–297.
ATSDR, Agency for Toxic Substances and Disease Registry (2007). Toxicological profile
for Xylene. 330 p. U.S. department of health and human services. Available at:
http://www.atsdr.cdc.gov/ (Accessed 18 June 2012).
ATSDR, Agency for Toxic Substances and Disease Registry (2008). Toxicological profile
for phenol. 226 p. U.S. department of health and human services. Available at:
http://www.atsdr.cdc.gov/ (Accessed 18 June 2012).
Benville, P.E. & Korn S. (1977). The acute toxicity of six monocyclic aromatic crude
oil components to striped bass (Morone saxatilis) and bay shrimp (Crago franciscorum).
California Fish and Game 63(4): 204–209.
Black, J. A., Birge, W. E., McDonnell, W. E., Westerman, A. G., Ramey, B. A. &
Bruser, D. M. (1982). The aquatic toxicity of organic compounds to embryo-larval
stages of fish and amphibians. Research report no 133, University of Kentucky, Water
Resources Institute, Lexington, Kentucky.
Tank cleaning in the Baltic Sea – Assessment of the ecotoxicity of tank cleaning effluents 85
BLG Working group (2009). Implementation of MARPOL Annex II. BLG Working
group. On the evaluation of safety and pollution hazards of chemical 15th
Session.
Agenda item 8 – IMO. BLG/ESPH 15/8.10/9/2009.
Bonn Agreement (2007). Hazardous Materials. Online. Available at:
http://www.bonnagreement.org/eng/html/counter-
pollution_manual/chapter26_hazardous%20materials.htm (Accessed 23 August 2012).
Brooke, L. T. (1993). Acute and chronic toxicity of nonylphenol to ten species of
aquatic organisms. Report to the U.S. Environmental Protection Agency, Duluth, MN
(contract no. 68-C1-0034). Lake Superior Research Institute, University of Wisconsin-
Superior, Superior, Wis. Julkaisematon, cited in U.S. EPA 2005.
Butterworth Inc. (2012). Product Data Sheet. Tank Cleaning Machine, Type: LT & LT-
FT. Available at:
http://www.butterworth.com/Data_Sheets/LT_LTFT_Tank_Clean_DS.pdf. (Accessed
14 August 2012).
Camphuysen, K. C. J., Barreveldà, H., Dahlmann, G. & Van Franeker, J. A. (1999).
Seabirds in the North Sea Demobilized and Killed by Polyisobutylene (C4H8)n (PIB).
Marine Pollution Bulletin 38: 1171–1176.
Camphuysen, K. C. J. (2007). Chronic oil pollution in Europe. A status report. Royal
Netherlands Institute for Sea Research. 85 p. International Fund for Animal Welfare
(IFAW). Brussels.
CCME, Canadian Council of Ministers of the Environment (1999). Canadian Water
Quality Guidelines for the Protection of Aquatic Life: Styrene. 3 p. Winnipeg.
CEDRE, Centre of Documentation, Research and Experimentation on Accidental Water
Pollution (2005). Chemical response guide. Sodium hydroxide 50% solution. 57 p.
France.
CEDRE, Centre of Documentation, Research and Experimentation on Accidental Water
Pollution (2006). Chemical response guide. Sulphuric acid. 64 p. France.
CEDRE, Centre of Documentation, Research and Experimentation on Accidental Water
Pollution (2008). Chemical response guide. Xylenes. 69 p. France.
CEDRE, Centre of Documentation, Research and Experimentation on Accidental Water
Pollution (2012). Understanding Chemical Pollution at Sea. Learning guide. Brest. 93 p.
Available at: www.cedre.fr, “Publications” section.
CEFIC (2005). Daphnia magna reproduction test with p-xylene. DHI water &
Environment.
86 Honkanen, Häkkinen and Posti
CEPA, Canadian Environmental Protection Act (1993). Priority substances list
assessment reports: Xylenes. 32 p. Minister of Supply and Services. Available at:
http://www.ec.gc.ca/CEPARegistry/subs_list/Priority.cfm (Accessed 14 August 2012).
CEPA, Canadian Environmental Protection Act (2000). Priority substances list
assessment reports: Phenol. 66 p. Minister of Supply and Services. Available at:
http://www.ec.gc.ca/CEPARegistry/subs_list/Priority.cfm (Accessed 14 August 2012).
CEPA, Canadian Environmental Protection Act (2001a). Priority substances list
assessment report: Ammonia in the Aquatic Environment. 96 p. Minister of Public
Works and Government Services. Available at:
http://www.ec.gc.ca/CEPARegistry/subs_list/Priority.cfm (Accessed 14 August 2012).
CEPA, Canadian Environmental Protection Act (2001b). Priority substances list
assessment report: Nonylphenol and its Ethoxylates. 97 p. Minister of Public Works and
Government Services. Available at:
http://www.ec.gc.ca/CEPARegistry/subs_list/Priority.cfm (Accessed 14 August 2012).
CHEMTEC Consulting GmbH (1999). CTC-Cleaner- VLC. 25 p. Dassendorf,
Germany.
Crompton, T. R. (2007). Toxicants in Aqueous Ecosystems. Springer-Verlag. Berlin
Heidelberg. 456 p.
CSID (2012). ChemSpider – The free chemical database. Available at:
http://www.chemspider.com/Chemical-Structure.1086.html (Accessed 25.8.2012).
Cushman J. R., Rausina, G. A., Cruzan, G., Gilbert, J., Williams, E., Harrass, M. C.,
Sousa, J. V., Putt, A. E., Garvey, N. A., St Laurent, J. P., Hoberg, J. R. & Machado, M.
V. (1997). Ecotoxicity hazard assessment of styrene. Ecotoxicology and Environmental
Safety 37: 173–180. Cited in Häkkinen et al. 2010.
Dahlmann, G., Timm, D., Averbeckt, C. H. R., Camphuysen, C., Skov, H. & Durinck, J.
(1994). Oiled Seabirds-Comparative Investigations on Oiled Seabirds and Oiled
Beaches in the Netherlands Denmark and Germany (1990–93). Marine Pollution
Bulletin 28: 305–310.
Drew Marine (2005). Tank cleaning manual. 5th Ed. 102 p. Ashland Inc. Boonton NJ,
USA.
EC, European Commission (2003). Technical Guidance Document on Risk Assessment
in support of Commission Directive 93/67/EEC on Risk Assessment for new notified
substances Commission Regulation (EC) No 1488/94 on Risk Assessment or existing
substances Directive 98/8/EC of the European Parliament and of the Council concerning
the placing of biocidal products on the market Part II. Office for official publications of
the European Communities. Luxembourg.
Tank cleaning in the Baltic Sea – Assessment of the ecotoxicity of tank cleaning effluents 87
Ekelund, R., Granmo, A., Magnusson, K., Berggren, M. & Bergman, A. (1993).
Biodegradation of 4-nonylphenol in seawater and sediment. Environ. Pollut.79: 59–61.
Envichem (2012). Data bank of environmental properties of chemicals. Maintained by
Finnish Environment Institute (SYKE). Available at:
http://wwwp.ymparisto.fi/scripts/Kemrek/Kemrek.asp?Method=MAKECHEMSEARC
HFORM (Accessed 14 August 2012).
Environment Canada (2011). Birds Oiled at Sea. Online. Available at:
http://www.ec.gc.ca/mbc-com/default.asp?lang=En&n=C6E52970-1#_1 (Accessed 24
August 2012).
FEA, Finland’s Environmental Administration (2012). Protection of the Baltic Sea.
Available at: http://www.ymparisto.fi/default.asp?node=17722&lan=en (Accessed 11
July 2012).
Fent, K. (2004). Ecotoxicological effects at contaminated sites. Toxicology 205: 223–
240.
Ferrari, G. M., Boa, F. G. & Babin, M. (2003). Geo-chemical and optical
characterizations of suspended matter in European coastal waters. Estuarine, Coastal
and Shelf Science 57: 17–24.
FIOH, Finnish Institute of Occupational Health (2011a). OVA-ohje: Onnettomuuden
vaaraa aiheuttavat aineet: Fenoli [Substances causing accident hazard: Phenol]. In
Finnish. Available at: http://www.ttl.fi/ova/fenoli.html (Accessed 11 July 2012).
FIOH, Finnish Institute of Occupational Health (2011b). OVA-ohje: Onnettomuuden
vaaraa aiheuttavat aineet: Rikkihappo [Substances causing accident hazard: Sulphuric
acid]. In Finnish. Available at: http://www.ttl.fi/ova/rikkiha.html (Accessed 11 July
2012).
FIOH, Finnish Institute of Occupational Health (2011c). OVA-ohje: Onnettomuuden
vaaraa aiheuttavat aineet: Styreeni [Substances causing accident hazard: Styrene]. In
Finnish. Available at: http://www.ttl.fi/ova/styreeni.html (Accessed 11 July 2012).
FIOH, Finnish Institute of Occupational Health (2011d). OVA-ohje: Onnettomuuden
vaaraa aiheuttavat aineet: Ksyleeni [Substances causing accident hazard: Xylene]. In
Finnish. Available at: http://www.ttl.fi/ova/ksyleeni.html (Accessed 11 July 2012).
Fliedner, A. (1993). Daphnia magna, Reproduction test (OECD No. 202).
FraunhoferBInstitute fur Umweltchemie und Okotoxikologie, Postfach 1260, WB5948
Schmallenberg B Grafschaft, Germany. Report No. UBAB002/4B22. Cited in U.S. EPA
2005. Cited in Häkkinen et al. 2010.
88 Honkanen, Häkkinen and Posti
French McKay, D. P., Whittier, N., Ward, M. & Santos, C. (2006). Spill hazard
evaluation for chemicals shipped in bulk using modelling. Environmental Modelling
and Software 21: 156–169.
Furman, E., Dahlström, H. & Hamari, R. (1998). Itämeri – luonto ja ihminen [Baltic Sea
– man and nature]. In Finnish. 159 p. Otava. Keuruu.
Galassi, S., Mingazzini, M., Vigano, L., Cesareo, D. & Tosato, M. L. (1988).
Approaches to modelling toxic responses of aquatic organisms to aromatic
hydrocarbons. Ecotoxicology and Environmental Safety 16: 158–169.
GESAMP, IMO/FAO/UNESCO-IOC/WMO/WHO/IAEA/UN/UNEP Joint Group of
Experts on the Scientific Aspects of Marine Environmental Protection (2002). The
Revised GESAMP Hazard Evaluation Procedure for Chemical Substances Carried by
Ships. Rep. Stud. GESAMP No. 64, 126 pp.
Gibbs, B. & Mulligan, C. (1997). Styrene toxicity: An ecotoxicological assessment.
Ecotoxicology and environmental safety 38: 181–194.
Guerbet, M. & Jouany, J. M. (2002). Value of the SIRIS method for the classification of
a series of 90 chemicals according to risk for the aquatic environment. Environmental
Impact Assessment Review 22: 377–391.
Grey, J. S. (2002). Biomagnification in marine systems: the perspective of an ecologist.
Marine Pollution Bulletin 45: 46–52.
Hallanaro, E.-L. (2010). Merkillinen Itämeri [The Extraordinary Baltic Sea]. In: Bäck,
S., Ollikainen, M., Bonsdorff, E., Eriksson, A., Hallanaro, E-L., Kuikka, S., Viitasalo,
M. & Walls, M. (eds.), Itämeren tulevaisuus [The Future of the Baltic Sea]. In Finnish:
23–25. Gaudeamus Helsinki University Press. Tampere.
Hampton, S., Kelly, P. R. & Carter, H. (2003). Tank vessel operations, seabirds, and
chronic oil pollution in California. Marine Ornithology 31: 29–34.
HASREP (2005). Response to harmful substances spilled at sea. Task 2. Risk
assessment methodology for the transport of hazardous and harmful substances in the
European Union maritime waters. CEDRE. Brest. 32 p.
Hassler, B. (2011). Accidental Versus Operational Oil Spills from Shipping in the Baltic
Sea: Risk Governance and Management Strategies. AMBIO 40: 170–178.
HELCOM (1993). Seminar on Reception Facilities in Ports. Turku, Finland, 16–19
November 1992. Balt. Sea. Environ. Proc. No. 50. Available at:
http://www.helcom.fi/stc/files/Publications/Proceedings/bsep50.pdf (Accessed 20
August 2012).
Tank cleaning in the Baltic Sea – Assessment of the ecotoxicity of tank cleaning effluents 89
HELCOM (2002). Response to accidents at sea involving spills of hazardous substances
and loss of packaged dangerous goods. HELCOM Manual on Co-operation in Response
to Marine Pollution within the framework of the Convention on the Protection of the
Marine Environment of the Baltic Sea Area (Helsinki Convention), Volume 2. 184 p.
Available at:
http://www.helcom.fi/stc/files/ResponseManual/ResponseManualVol_2.pdf (Accessed
24 August 2012).
HELCOM (2009). Overview of the shipping traffic in the Baltic Sea. Online. Available
at:
http://www.helcom.fi/stc/files/shipping/Overview%20of%20ships%20traffic_updateAp
ril2009.pdf (Accessed 23 August 2012).
HELCOM (2010a). Maritime Activities in the Baltic Sea – An integrated thematic
assessment on maritime activities and response to pollution at sea in the Baltic Sea
Region. Balt. Sea Environ. Proc. No. 123. 64 p. Available at:
http://www.helcom.fi/stc/files/Publications/Proceedings/bsep123.pdf (Accessed 12 July
2012).
HELCOM (2010b). Ecosystem Health of the Baltic Sea 2003–2007: HELCOM Initial
Holistic Assessment. Balt. Sea Environ. Proc. No. 122. 63 p. Available at:
http://www.helcom.fi/stc/files/Publications/Proceedings/bsep122.pdf (Accessed 2 July
2012).
HELCOM (2010c). Hazardous substances in the Baltic Sea – An integrated thematic
assessment of hazardous substances in the Baltic Sea. Balt. Sea Environ. Proc. No.
120B. 116 p. Available at:
http://www.helcom.fi/stc/files/Publications/Proceedings/bsep120B.pdf (Accessed 2 July
2012).
HELCOM (2010d). Illegal Discharges of Oil in the Baltic Sea. HELCOM Indicator Fact
Sheets 2010. Online. Available at:
http://www.helcom.fi/BSAP_assessment/ifs/ifs2010/en_GB/illegaldischarges/
(Accessed 18.7.2012).
HELCOM (2011). Annual 2011 HELCOM report on illegal discharges observed during
aerial surveillance. 13 p. Available at:
http://www.helcom.fi/stc/files/shipping/spills2011.pdf (Accessed 24 August 2012).
Helle, I. & Kuikka, S. (2010). Itämeren öljykuljetusten riskipeli [The risky business of
oil transportation]. In: Bäck, S., Ollikainen, M., Bonsdorff, E., Eriksson, A., Hallanaro,
E-L., Kuikka, S., Viitasalo, M. & Walls, M. (eds.), Itämeren tulevaisuus [The Future of
the Baltic Sea]. In Finnish: 190–205. Gaudeamus Helsinki University Press. Tampere.
Helsingin Sanomat (2003). Kalat kuolivat Crystal Rubinon myrkkyihin. [Fish died from
the poisons of Crystal Rubino in Hamina]. In Finnish. Newspaper Helsingin Sanomat
2.6.2003. Helsinki.
90 Honkanen, Häkkinen and Posti
Herman, D. C., Mayfield, C. I. & Inniss, W. E. (1991). The relationship between
toxicity and bioconcentration of volatile hydrocarbons by the algae Selenastrum
capricornutum. Chemosphere, 22: 665–676.
Hjalmarsson, S., Wesslanderb, K., Andersona, L. G., Omstedtb, A., Perttila, M. &
Mintropa, L. (2008). Distribution, long-term development and mass balance calculation
of total alkalinity in the Baltic Sea. Continental Shelf Research 28: 593–601.
Holma, E., Heikkilä, A., Helminen, R. & Kajander, S. (2011). Baltic Port List 2011 –
Annual cargo statistics of ports in the Baltic Sea Region. A publication from the Centre
for Maritime Studies, University of Turku. 180 p.
HSDB, Hazardous Substances Data Bank (2012). Maintained by U.S. National Library
of Medicine. Available at: http://toxnet.nlm.nih.gov/cgi-bin/sis/htmlgen?HSDB
(Accessed 18.7.2012).
Hurford, N., Law, R. J., Payne, A. P. & Fileman, T. W. (1989). Concentrations of
Chemicals in the North Sea Arising from Discharges from Chemical Tankers. Oil &
Chemical Pollution 5: 391–410.
Hurford, N., Law, R. J., Fileman, T. W., Payne, A. P. & Colcomb-Heiliger, K. (1990).
Concentrations of Chemicals in the North Sea due to Operational Discharges from
Chemical Tankers – Results from the Second Survey, October 1988. Oil & Chemical
Pollution 7: 251–270.
HUTA CYNKU (2011). Material safety data sheet. Sulphuric acid technical. HUTA
CYNKU Miasteczko Śląskie S.A. Poland. 12 p. Available at:
http://www.hcm.com.pl/sites/default/files/kch_kwas_siarkowy_techniczny_EN_12_12_
2011.pdf (Accessed 7 August 2012).
Håkanson, L., Lundin, L.-C., Savchuk, O., Ionov, V., Musielak, S. & Furmanczyk, K.
(2003). The Baltic Sea. In: Ryden, L., Migula, P. & Andersson ,M. (eds.),
Environmental Science: 120–146. The Baltic University Press. Uppsala.
Häkkinen, J., Kiiski, A., Malk, V., Myyrä, M. & Penttinen, O.-P. (2010).
Kemikaalikuljetusonnettomuuteen varautuminen Kymenlaaksossa – ympäristöriskien
arviointi ja puhdistusmenetelmien vertailu [Preparing for a chemical transport accident
in the Kymenlaakso area – comparison between different risk assessment and
remediation methods]. In Finnish. 142 p. Yliopistopaino, Helsinki.
Häkkinen, J., Malk, V., Penttinen, O.-P., Mäkelä, R. & Posti, A. (2012). Environmental
risk assessment of most transported chemicals in sea and on land – an analysis of
Southern Finland and the Baltic Sea – In: Töyli, J., Johansson, L., Lorentz, H., Ojala, L.
& Laari, S. (eds.), Nofoma 2012 – proceedings of the 24th
Annual Nordic logistics
research Network conference. 313–328.
Tank cleaning in the Baltic Sea – Assessment of the ecotoxicity of tank cleaning effluents 91
Hänninen, S. & Rytkönen, J. (2006). Transportation of liquid bulk chemicals by tankers
in the Baltic Sea. VTT Technical Research Centre of Finland. VTT Publications 595.
155 p. Available at: http://www.vtt.fi/inf/pdf/publications/2006/P595.pdf (Accessed 27
June 2012).
ICS, International Chamber of Shipping (1995). Tanker Safety Guide (Liquefied Gas)
2nd
Ed. Edward Mortimer Ltd. Halifax. West Yorkshire. 259 p.
ICS, International Chamber of Shipping (2002). Tanker Safety Guide (Chemicals) 3rd
Ed. Edward Mortimer Ltd. Halifax. West Yorkshire. 207 p.
IMO, International Maritime Organization (2008). IMO Marine Environment Policy.
Background paper. International Maritime Organization. Marine Environment Division.
20 p. In : Sixteenth OSCE Economic and Environmental Forum - Part 1: “Maritime and
inland waterways co-operation in the OSCE area: Increasing security and protecting the
environment” Vienna, 28–29 January 2008. Available at:
http://www.osce.org/eea/30453 (Accessed at 23 August 2012).
IMO, International Maritime Organization (2011a). Particularly Sensitive Sea Areas.
Online. Available at:
http://www.imo.org/OurWork/Environment/PollutionPrevention/PSSAs/Pages/Default.
aspx (Accessed 11 July 2012).
IMO, International Maritime Organization (2011b). International Code for the
Construction and Equipment of Ships carrying Dangerous Chemicals in Bulk (IBC
Code). Online. Available at:
http://www.imo.org/OurWork/Environment/PollutionPrevention/ChemicalPollution/Pag
es/IBCCode.aspx (Accessed 11 June 2012).
IMO, International Maritime Organization (2011c). International Convention for the
Safety of Life at Sea (SOLAS), 1974. Online. Available at:
http://www.imo.org/about/conventions/listofconventions/pages/international-
convention-for-the-safety-of-life-at-sea-%28solas%29,-1974.aspx (Accessed 23 August
2012).
IMO, International Maritime Organization (2011d). Chemical reporting forms. Online
Available at:
http://www.imo.org/ourwork/environment/pollutionprevention/chemicalpollution/pages
/chemicalsreportingforms.aspx (Accessed 8 June 2012).
INTERTANKO (2006). The Revisions to MARPOL Annex II - A Practical Guide. 42 p.
Available at: http://eliteblacksea.com/files/article/marpolannexiiguide.pdf (Accessed 23
August 2012).
92 Honkanen, Häkkinen and Posti
Isobe, T., Nishiyama, H., Nakashima, A. & Takada, H. (2001). Distribution and
behaviour of nonylphenol, octylphenol, and nonylphenol monoetoxylate in Tokyo
metropolitan area: Their Association with aquatic particles and sedimentary
distributions. Environ. Sci. Technol. 35: 1041–1049.
ITOPF, The International Tanker Owners Pollution Federation (2010). About Marine
Spills. Online. Available at: http://www.itopf.com/marine-spills/about-hns/#fate
(Accessed 11 July 2012).
IUCLID dataset (2000a). Phenol, Substance ID: 108-95-2. 175 p. European
Commission, European Chemicals Bureau.
IUCLID Dataset (2000b). Sulphuric acid, Substance ID: 7664-93-9. 178 p. European
Commission, European Chemicals Bureau.
Jo Tankers (1999). General tank cleaning guide. Jo Tankers B.V. 48 p.
John, D. M., House, W. A. & White, G. F. (2000). Environmental fate of nonylphenol
ethoxylates: differential adsorption of homologs to components of river sediment.
Environmental Toxicology and chemistry 19: 293–300.
Koskela, S., Seppälä, J., Hiltunen, M.-R. & Mattila, T. (2006). Kemikaalin
häiriöpäästön ympäristöriskinarviointi EUSES-mallilla. [Assessing the environmental
risk of a chemical release with the EUSES-model]. In Finnish. Suomen
ympäristökeskuksen raportteja 5/2006.
Kronberg, L. (1999). Content of Humic Substances in Freshwater. – In: Keskitalo, J. &
Eloranta, P. (eds.), Limnology of Humic Waters: 9–10. Backhuys Publishers, Leiden.
284 s.
Kumblad, L. & Rydin, E. (2012). Restoration measures in Björnöfjärden. Online.
Available at: http://www.balticsea2020.org/english/bibliotek/33-living-coast/199-
permanent-fixing-of-phosphorus-in-sediment (Accessed 28 August 2012).
Kunichkin, V. (2006). Chemical Tanker Notes. 234 p. Seamanship International Ltd.
Lanarkshire, UK.
Lakey, R. (1975/76). The 1973 Marine pollution convention’s impact on ships
transporting hazardous materials. Journal of Hazardous Materials 1: 113–128.
Larsson, K. & Tydén, L. (2005). Effekter av oljeutsläpp på övervintrande alfågel
Clangula hyemalis vid Hoburgs bank i centrala Östersjön mellan 1996/97 och 2003/04.
[Effects of oil spills on wintering Long-tailed Duck Clangula hyemalis at Hoburgs bank
in central Baltic Sea between 1996/97 and 2003/04]. In Swedish. ORNIS SVECICA 15:
161–171.
Tank cleaning in the Baltic Sea – Assessment of the ecotoxicity of tank cleaning effluents 93
Larsson, K. &Tydén, L. (2009). Inventeringar av oljeskadad alfågel längs Gotlands
sydkust under perioden 1996/97 till 2008/09. [Surveys on oiled long-tailed ducks in the
Eastern coast of Gotland from 1996/97 to 2008/09]. In Swedish. 13 p. Report. Gotland
University.
Larsson, K. & Tydén, L. (2011). Inventeringar av oljeskadad alfågel längs Gotlands
sydkust under perioden 1996/97 till 2010/11 [Surveys on oiled long-tailed ducks in the
Eastern coast of Gotland from 1996/97 to 2010/11]. In Swedish. 13 p. Report. Gotland
University.
Liber, K., Knuth, M. & Stay, F. (1999). An integrated evaluation of the persistence and
effects of 4-nonylphenol in an experimental littoral ecosystem. Environmental
Toxicology and Chemistry 18: 357–362.
Lide, D. R. (2005). CRC handbook of chemistry and physics. 86th
Ed. 2544 s. CRC
Press. Boca Raton. Florida.
Lide, D. R. (2009). CRC handbook of chemistry and physics. 89th
Ed. CRC Press. Boca
Raton. Florida.
Lilja, K., Norström, K., Remberger, M., Kaj, L., Egelrud, L., Junedahl, E., Brorström-
Lundén, E., Ghebremeskel, M. & Schlabach, M. (2009). Screening of Selected
Hazardous Substances in the Eastern Baltic Marine Environment. 57 p. IVL.
Stockholm.
Lloyd’s Register (2006). Revised MARPOL 73/78 Annex II and IBC Code – A guide to
changes for tankers and offshore supply vessels. 17 p. Lloyds register. Classification
News No 14/2006.
Lussier, S. M., Champlin, D., LiVolsi, J., Poucher, S. & Pruell, J. R. (2000). Acute
toxicity of para-nonylphenol to saltwater animals. Environmental Toxicology and
Chemistry 19: 617–621.
Luhtala, H. (2010). Maritime transport of chemicals in the Baltic Sea, Publications from
the Centre of Maritime Studies, University of Turku. 47 p.
McGeorge, H. D. (1995). Marine Auxiliary Machinery 7th
Ed. 525 p. Butterworth-
Heinemann, Elsevier Ltd. Great Britain.
Mackay, D. (1979). Finding fugacity feasible. Environmental Science & Technology:
13: 1218–1223.
Mackay, D. & Leinonen, P. J. (1975). Rate of evaporation of low solubility
contaminants from water body to atmosphere. Environ. Sci. Technol. 9: 1178–1180.
94 Honkanen, Häkkinen and Posti
Mackay, D., Shiu, W. Y., Ma, K. C., Lee, S. C. (2006). Handbook of physical-chemical
properties and environmental fate for organic chemicals. 2nd
Ed. 4182 p. Taylor &
Francis Group/CRC Press. Boca Raton. Florida.
Maffii, S. (2007). External costs and climate impacts of maritime transport. Note. –
Policy Department B. Structural and Cohesion Policies. Transport and tourism. Note PE
379.227. 43 p. Bruxelles. European Parliament. Available at:
http://www.trt.it/english/Schede-progetti/European-
parliament/External%20Costs%20of%20Maritime%20Transport.pdf (Accessed 24
August 2012).
Majima, T., Yamaguchi, K., Yamanouchi, H., Fujii, S. & Sakamoto, S. (2000).
Experiment using Scale Model of Cargo Tank to Estimate the Concentration of Benzene
Gas Emitted from Chemical Tanker During Loading Operation. 7 p. SPE International
Conference on Health, Safety and Environment in Oil and Gas Exploration and
Production, 26–28 June 2000, Stavanger, Norway.
Malmsten, C. L. (2001). Vaaralliset kemikaalionnettomuudet. [Hazardous chemical
accidents]. In Finnish. 330 p. Tammi. Tampere.
Mamaca, E., Bechmann R. K., Torgrimsen, S., Aas, E., Bjørnstad A, Baussant, T. & Le
Floch, S. (2005). The neutral red lysosomal retention assay and Comet assay on
haemolymph cells from mussels (Mytilus edulis) and fish (Symphodus melops) exposed
to styrene. Aquatic Toxicology 75(3): 191–201. Cited in Häkkinen et al. 2010.
Manzano, M. A., Perales, J. A., Sales, D. & Quiroga, J. M. (1999). The effect of
temperature on the biodegradation of a nonylphenol polyethoxylate in river water.
Water research 33: 2593–2600.
MEPC, Marine Environment Protection Committee (2012). List Of Special Areas
Under MARPOL And Particularly Sensitive Sea Areas. – IMO. MEPC.1 Circ. 778.
26/1/2012. 6 p. Available at:
http://www.imo.org/blast/blastDataHelper.asp?data_id=30979&filename=778.pdf
(Accessed 23 July 2012).
Mercier, J. A., Hires, R. I. & Wu, M. (1974). Model study on the dilution of soluble
liquids discharged from tankers. Final report. 106 p. Stevens Inst. of Tech. Davidson
Lab. Hoboken. New Jersey.
NesteOil (2006). Ympäristölupapäätös. Länsi-Suomen Ympäristölupavirasto.
Ympäristöpäätös Nro 29/2006/2. Dnro LSY-2004-Y-120.
Ng, A. K. & Song, S. (2010). The environmental impacts of pollutants generated by
routine shipping operations on ports. Ocean & Coastal Management 53: 301–311.
Tank cleaning in the Baltic Sea – Assessment of the ecotoxicity of tank cleaning effluents 95
Nikunen, E. & Leinonen, R. (2002). Ympäristölle vaaralliset kemikaalit – riskinarviointi
ja luokitus [Environmentally hazardous chemicals – Risk assessment and classification].
In Finnish. 142 p. Chemas Oy. Helsinki.
Nunes, P. & Benville, P. (1979). Uptake and depuration of petroleum hydrocarbons in
the Manila clam (Tapes semidecussata). Bulletin of Environmental Contamination and
Toxicology 21: 719–726.
Ogata, M. & Miyake, Y. (1978). Disappearance of aromatic hydrocarbons and organic
sulphur compounds from fish flesh reared in crude oil suspension. Water Research 12:
1041–1044.
OECD, Organization for Economic Co-operations and Development (1997). SIDS
(Existing Chemicals Program) Initial assessment report for 6th
SIAM. Prepared by M.
Thomas, Environment Agency, National Centre for Ecotoxicology and hazardous
substances. London. UK.
OECD, Organization for Economic Co-operations and Development (2001). SIDS.
Sulphuric Acid CAS N°: 7664-93-9. UNEP Publications.
OECD, Organization for Economic Co-operations and Development (2008). OECD
guidelines for the testing of chemicals. Bioaccumulation in Sediment-dwelling Benthic
Oligochaetes. OECD/OCDE Test No. 315.
Olson, P. (1994). Handling of Waste in Ports. Marine Pollution Bulletin. 29: 6–12: 284–
295.
Omstedt, A., Gustafsson, E. & Wesslander, K. (2009). Modelling the uptake and release
of carbondioxide in the Baltic Sea surface water. Continental Shelf Research 29: 870–
885.
Oost; R., Beyer, J & Vermeulen, N. P. E. (2002). Fish bioaccumulation and biomarkers
in environmental risk assessment: a review. Environmental Toxicology and
Pharmacology 13: 57–149.
Portman, J. E. (1981). Recent activities of GESAMP working group on the evaluation
of hazardous substances carried by ships. Ecotoxicology and Environmental Safety 5:
56–71.
Posti, A. & Häkkinen, J. (2012). Survey of transportation of liquid bulk chemicals in the
Baltic Sea. Publications from the Centre for Maritime Studies University of Turku, A
60. 78 p.
96 Honkanen, Häkkinen and Posti
Qureshi, A. A., Flod, K. W., Thompson, S. R., Janhurst, S. M., Inniss, C. S., & Rokosh,
D. A. (1982). Comparison of a luminescent bacterial test with other bioassays for
determining toxicity of pure compounds and complex effluents – In: Pearsonm J.G,
Foster, R.B., & Bishop,W.E. (eds.): Aquatic Toxicology and Hazard Assessment, 5th
Conference. 179–195 p. American Society for Testing and Materials, Philadelphia.
Available at: http://www.astm.org/DIGITAL_LIBRARY/STP/PAGES/STP36718S.htm
(subject for a fee, Accessed 25.7.2008).
Schumann, R., Rieling, T., Görs, S., Hammer, A., Selig, U. & Schiewer, U. (2003).
Viability of bacteria from different aquatic habitats. I. Environmental conditions and
productivity. Aquatic Microbial ecology 32: 121–135.
Servos, M. R. (1999). Review of the aquatic toxicity, estrogenic responses and
bioaccumulation of alkylphenol and alkylphenol polyetoxylates. Water Quality
Research Journal of Canada 34: 123–177.
Shang, D. Y., Macdonald, R. W. & Ikonomou, M. G. (2008). Persistence of
nonylphenol ethoxylate surfactants and their primary degradation products in sediments
from near a municipal outfall in the strait of Georgia, British Columbia, Canada.
Environmental Science & Technology 33: 1366–1372.
Skov, H., Heinänen, S., Žydelis, R., Bellebaum, J., Bzoma, S., Dagys, M, Durinck, J.,
Garthe, S., Grishanov, G., Hario, M., Kieckbusch, J. J., Kube, J., Kuresoo, A., Larsson,
K., Luigujoe, L., Meissner, W., Nehls, H. W., Nilsson, L., Krag Petersen, I., Mikkola
Roos, M., Pihl, S., Sonntag, N., Stock, A. & Stipniece, A. (2011). Waterbird
populations and pressures in the Baltic Sea. TemaNord 2011: XX. Nordic Council of
Ministers, Copenhagen 2011.
Soares, A., Guieysse, B., Jefferson, B., Carntmell, E. & Lester, J. N. (2008).
Nonylphenol in the environment: a critical review on occurrence, fate, toxicity, and
treatment in wastewaters. Environment International 34: 1033–1049.
Sormunen, O. (2012). Spill estimation of chemical tanker collisions in the Gulf of
Finland. Master's thesis. Aalto University School of Science. Espoo 116 p.
SYKE, Finnish Environment Institute (2004). Suomessa käytetyt
vesientutkintamenetelmät. Suomen Ympäristö [Research methods used in water
research]. In Finnish. SY683. 119 p.
Tanker Operator (2008a). The Science of Cargo Tank Cleaning. TankerOperator
Magazine. Vol 7 No 8. 2008. London.
Tanker Operator (2008b). Discharge requirements should be simplified. TankerOperator
Magazine. Vol 7 No 8. 2008. London.
U.K. Environment Agency (1997). Draft comprehensive risk assessment report for
nonylphenol. National centre for ecotoxicity and hazardous substances. London. U.K.
Tank cleaning in the Baltic Sea – Assessment of the ecotoxicity of tank cleaning effluents 97
U.S. EPA, Environmental Protection Agency (1987). Occurrence of synthetic organic
chemicals in drinking water, food and air. 175 p. PB89-192520. Office of drinking
water Washington, D.C.
U.S. EPA, U.S. Environmental Protection Agency (2005). Aquatic life ambient water
quality criteria – nonylphenol. Final. U.S. Environmental Protection Agency. Office of
water. Office of Science and Technology. Washington, DC.
Vadakayil, A. (2010). Marpol Rules For Annex 2 Chemical Tankers-- Capt Ajit
Vadakayil. Online. Available at: www.ajitvadakayil.blogspot.com (Accessed 24 August
2012).
Vazquez-Duhalt, R. Marquez-Rocha, F., Ponce, E., Licea, A. F. & Viana, M. T. (2005).
Nonylphenol, an integrated vision of a pollutant. Scientific review. Applied Ecology
and Environmental Research 4: 1–25.
Verwey, Dr. A. (2007). Tank Cleaning Guide 7th
Ed. 454 p. Verwey Chemical
Laboratories & Superintendence Company. Rotterdam.
Walker, C. H., Hopkin, S. P., Sibly, R. M. & Peakall, D. B. (2006). Principles of
Ecotoxicology 3rd
Ed. 303 p. Taylor & Francis Inc. New York.
Ward, T. J. & Boeri, R. L. (1990). Acute static toxicity of nonylphenol to the marine
alga (Skeletonema costatum). Prepared for the Chemical Manufacturers Association by
Resource Analysts, Hampton, New Hampshire (Study No.8970-CMA). Cited in U.S.
EPA 2005.
University of Turku
CENTRE FOR MARITIME STUDIES
FI–20014 TURUN YLIOPISTO
http://mkk.utu.fi