talis video study: national report
TRANSCRIPT
TALIS Video Study: National Report Research summary
November 2020
Jenni Ingram, Ariel Lindorff, Naomi Sani, Elaine McCann, and Anna Riggall University of Oxford and Education Development Trust
2
Acknowledgments The Teaching and Learning International Survey (TALIS) Video Study was led and managed by Education Development Trust in partnership with the Department of Education, University of Oxford, in England. The England Team consisted of Elaine McCann, TALIS Video Study National Project Manager, Naomi Sani, Education Development Trust Mathematics Expert, Anna Riggall, Education Development Trust Head of Research and TALIS Video Study Project Director, Jenni Ingram, University of Oxford Observation Expert, and Ariel Lindorff, University of Oxford Master Rater. Our thanks also extend to the team of Education Development Trust school recruiters, data collectors, videographers and data entry personnel, the team of University of Oxford video and artefact raters and analysts, and to Lowri Buckley, Data Collection Co-ordinator.
We would particularly like to thank the many mathematics teachers and their students who participated in the TALIS Video Study in England. They opened up their classrooms to us enabling the better understanding of the nature of, and variation within, the teaching of mathematics in secondary schools.
The TALIS Video Study is an international study involving eight countries and economies working together. We are grateful to all the members of the TALIS Video Study International Consortium whose hard work and support led to the successful design and implementation of the study. We would also like to thank colleagues at the Organisation for Economic Co-operation and Development (OECD) for their constant support.
Disclaimer The TALIS Video Study is an OECD project. The development of the Study’s instrumentation and data analyses and drafting of international reports were contracted by the OECD to RAND, Educational Testing Service (ETS) and Leibniz Institute for Research and information in Education (DIPF). The authors of this work are solely responsible for its content. The opinions expressed and arguments employed in this work do not necessarily represent the official views of the OECD or its member countries.

3
Contents
Acknowledgments 2
Disclaimer 2
List of figures 4
List of tables 5
What is the TALIS Video Study? 6
Documenting what has been learned from the TALIS Video Study 6
A suite of reports 7
Large-scale research into teaching and learning 8
What did the study involve? 8
A snapshot of what is happening in classrooms 9
The TALIS Video Study: England 10
Who took part in the England study? 10
What can be learned from the TALIS Video Study? 12
Findings from the observation of teaching 13
What were lessons like? 16
Opportunity to learn: common subtopics and methods 21
Relationship between student characteristics, teaching practices and student outcomes 22
Final comment 25
References 26

4
List of figures Figure 1: Participating schools, teachers and students .................................................... 10
Figure 2: Summary of key findings .................................................................................. 12
Figure 3: Teacher average ratings for the engagement with cognitively demanding subject matter domain...................................................................................................... 19
Figure 4: Relationship between class prior-attainment and student attainment on the post-test ........................................................................................................................... 23
5
List of tables Table 1: Summary of available reports .............................................................................. 7
Table 2: Teachers’ and students’ perceptions of their relationships with each other ...... 14
Table 3: Students’ sense of belonging in their mathematics lessons ............................... 15
Table 4: Teachers’ and students’ perceptions of the clarity of lessons ............................ 18

6
What is the TALIS Video Study? The Teaching and Learning International Survey (TALIS) Video Study, run by the Organisation for Economic Co-operation and Development (OECD), provides new information on the teaching of mathematics in secondary schools across the eight participating countries/economies: Biobío, Metropolitana and Valparaíso (Chile), Colombia, England (UK), Germany1, Kumagaya, Shizuoka and Toda (Japan), Madrid (Spain), Mexico, and Shanghai (China).
Data collection was conducted in England between October 2017 and October 2018. The TALIS Video Study complements the existing TALIS and Programme for International Student Assessment (PISA) studies by providing additional evidence on classroom processes by drawing on direct measures of classroom teaching and instruction. By looking directly into the classroom through video-recorded observation and lesson artefact collection, the TALIS Video Study addresses some of the limitations of using teacher self-reported data. The study aims to provide new and rich information about classroom processes and practices and contributes to current understanding of how they are related to student learning and other outcomes. The Department for Education (DfE) commissioned Education Development Trust (EDT) and the University of Oxford to conduct the TALIS Video Study in England.
Documenting what has been learned from the TALIS Video Study
The OECD is releasing data from the TALIS Video Study as part of two international reports. One is a policy-focused report2 entitled Global Teaching InSights A video study of teaching3 documenting the findings from all eight participating countries. The other is a technical report detailing how the study was undertaken4.
There are also three DfE published reports.
• The first report complements the OECD reports by providing a more focused and detailed analysis of the results in England and analysing differences within England across teachers and classes5.
• The second report documents the findings from a qualitative analysis of the videos focusing on interesting practices measured by the study in England6.
1 In Germany this was a convenience sample of volunteer schools. 2 OECD (2020a) 3 Also referred to as the TALIS Video Study 4 OECD (2020b) 5 Ingram and Lindorff (2020) 6 Ingram & Gorgen (2020)

7
• The third report is a technical report detailing how the study was conducted within England following the study protocol as set by the international consortium and noting the approved deviations7.
A suite of reports All reports are written with the intention of reaching a wide audience including policy makers, schools, and practitioners. A suite of research summaries based on the full reports have been produced specifically with schools and practitioners in mind. These reports contain the same material condensed and packaged for faster reading.
This report is one of three produced specifically for practitioners. It sits alongside the full England report offering a short version of the summary points and key findings. There are also similar summary reports documenting the findings from the OECD’s international policy report8 and a reflection on how schools and teachers can use the study’s findings to reflect on professional development and their own practice9.
Table 1: Summary of available reports
Report Publisher
Global Teaching InSights: Policy Report OECD
Global Teaching InSights: Technical Report OECD
TALIS Video Study: National Report DfE
TALIS Video Study: Technical Report DfE
TALIS Video Study: Case studies of mathematics teaching practices
DfE
TALIS Video Study: National Summary Report DfE
TALIS Video Study: International Summary Report DfE
TALIS Video Study and Professional Development DfE
Source: Education Development Trust
7 McCann et al. (2020) 8 Riggall et al. (2020) 9 Ingram & Sani (2020)

8
Large-scale research into teaching and learning The TALIS Video study focused on the teaching and learning of a single mathematics topic, quadratic equations.
The topic is rich, and connections can be made both within and between different representations, such as equations, graphs and diagrams, as well as between the different methods for solving quadratic equations, such as factorisation, using the quadratic formula and completing the square. Quadratic equations link to quadratic functions and the graphing of quadratic curves.
Quadratic equations can be used in a range of contexts, such as finding the area of rectangles or modelling the trajectory of a ball thrown into the air, supporting students to use and apply their knowledge. Connections can also be made between other topics within mathematics, such as factors, linear equations, or area of rectangles, and can support the development of this rich network of mathematical knowledge.
In the TALIS Video Study, the focus on one common topic was important; it enabled the collection of equivalent data across countries. The focal topic had to be one that was taught in all participating countries and economies and that was taught to students of a similar age. The study used new measurement tools specifically designed for the analysis of videos of mathematics teaching and the lesson artefacts accompanying that teaching. The study design was longitudinal, capturing the outcome measures before and after a sequence of lessons that included quadratic equations. The procedures for data collection and analysis of videos and artefacts were standardised across the participating countries and economies.
What did the study involve?
The TALIS Video Study required two lessons from the quadratic equations unit of work to be filmed. One of the lessons occurred during the first half of the unit and the second lesson occurred later in the unit.
The TALIS Video Study also required all participating teachers and students to complete two questionnaires.
Students took a pre-test focused on their general mathematics knowledge two weeks before the start of the unit of work that included quadratic equations. They then took a post-test within two weeks of the conclusion of the unit of work. The post-test had a narrower focus than the pre-test in order to provide more precise measures of students’ knowledge and understanding of quadratic equations.
In addition to the tests, questionnaires, and the videos of lessons, artefacts from those lessons, and the lessons that followed, were also collected. These artefacts included

9
lesson plans, handouts, and worksheets, and textbook pages, visual materials such as the projected slides shown, and/or any homework set, where they were available.
The videos of teaching were analysed by a team of raters who had been trained to look for comparable aspects of teaching – so they were all looking for the same behaviours and practices no matter what country the videos were from. Their ratings (of the video and artefact data within the study) were measured on a scale of 1 to 3 or 4, where a higher rating represented a higher quality or higher frequency of particular behaviours. A framework was designed specifically for the study to guide this. It focused on practices known from previous research to be related to student achievement as well as practices that were highly valued by the Mathematics Experts in each of the participating countries.
After the ratings were complete, analyses were possible. These analyses explored the variation, frequency, and prevalence of teaching practices and the relationships between teaching practices, student outcomes, and teachers and students’ perceptions of learning quadratic equations.
A snapshot of what is happening in classrooms The data collected through the TALIS Video Study will assist policy makers and practitioners to make evidence-informed decisions and to learn from mathematics teaching practices from several countries, including England.
For teachers in England, this research provides a snapshot into classroom environments and practices. As a resource, this summary report could also contribute to reflective practice and continuous professional development (CPD) within schools and departments.
Teachers may be particularly interested in the Case Studies (see Table 1).

10
The TALIS Video Study: England Initially, 100 schools were randomly selected from the school rosters used for TALIS 2018, with a further 200 replacement schools identified. Once a school agreed to participate, mathematics teachers were randomly selected within the school and approached for participation, one at a time in the order they were selected. Once a teacher agreed to participate, consent was sought from the teacher and their students. Only classes where at least 15 students and at least 50% of the class consented were included in the study.
Who took part in the England study? Figure 1 below summarises the key characteristics of the study’s participating schools, teachers, and pupils.
Figure 1: Participating schools, teachers and students

11
Key points to remember while reading the key findings:
• All differences and associations reported are statistically significant at the 5% level.
• The results refer to the mathematics teaching practices of participating teachers and relate to a particular topic in mathematics, thus they should not necessarily be taken as an indication of mathematics teaching practices more widely or at the present time.
• It should be noted that the analysis of the research uncovered associations (correlations) but cannot establish causal relationships among the different measures collected.
Further details about the study design and analysis can be found in the full England report and in the technical report for England.

12
What can be learned from the TALIS Video Study? In summary, analysis of the England data from the TALIS Video Study revealed the following (these points are elaborated below in Figure 2):
• Classes were well managed; teachers and classrooms were socially and emotionally supportive; and there was a mix of teacher and student discourse.
• Analysis revealed some practices were common, including the focus on the subtopic of handling algebraic expressions and a focus on factorising as a method for solving quadratic equations.
• Some practices were rarely observed – for example, pair and group work, the use of real-world connections, cognitively demanding subject matter, and the use of technology (beyond interactive whiteboards).
• There were some statistically significant relationships evident. These are explained in more detail later in this section and summarised in brief in Figure 2.
Figure 2: Summary of key findings

13
Findings from the observation of teaching
Classes were well managed; teachers and classrooms were socially and emotionally supportive; and there was a mix of teacher and student discourse.
Classroom management
Classes were generally well managed: mathematics teachers had organised and efficient routines, they monitored what was happening in the entire classroom and they dealt with disruptions quickly and effectively. Most lessons lost very little time to activities, tasks, or dialogue that was not focused on mathematical learning.
Most teachers and students reported few disciplinary issues, high levels of teacher awareness of the classroom, and efficient handling of disruptions. Teachers perceived fewer disruptions than their students.
The analysis that looked for relationships within and between the England data sets found:
• There were no relationships between how well managed classrooms were and teacher characteristics, such as years of teaching experience or different qualifications.
• There were also no associations between students’ experiences of classroom management according to different class demographics.
• On average, lower-attaining classes were observed to experience more disruptions, and fewer organised and efficient routines, compared to higher-attaining classes.
• The classes with the lowest average ratings for the classroom management domain were also some of the lowest-attaining classes on the pre-test.
Social and emotional support
Teachers and classrooms were generally socially and emotionally supportive. Teachers and students frequently and consistently demonstrated respect for one another through manners, language, and tone of voice. Teachers regularly provided encouragement to their students and shared moments of warmth in their lessons. Almost all teachers requested that students shared their thinking processes or rationales, such as by explaining or describing procedures taken or their reasoning behind procedures taken. Students in all classes sought guidance and shared their work publicly. Almost every teacher supported students to persist through their mathematical errors or mathematical struggle for a moderate length of time at least once in the videoed lessons.

14
Most teachers and students reported positive relationships within the classrooms, agreeing that the teacher got along well with their students, showed an interest in their students’ wellbeing, and really listened to their students. Teachers gave their students extra help when they needed it, helped their students with their learning and tried to make their students feel confident to do well in the topic. A majority of 82% of students had a sense of belonging in their mathematics class during the topic, whilst a minority of 12% of students felt awkward and out of place, generally and during the topic (see Tables 2 and 3 below).
Table 2: Teachers’ and students’ perceptions of their relationships with each other
Statement
Proportion of teachers in
general (during topic)
Proportion of students in
general (during topic)
I got along well with these students/my mathematics teacher 100%(98%) 90%(89%)
I showed interest in these students’ well-being/ My mathematics teacher was interested in my well-being
100%(100%) 81%(77%)
I/My mathematics teacher treated these students/me fairly 100%(99%) 93%(91%)
I/My mathematics teacher really listened to what these students/I had to say 96%(98%) 81%(79%)
I made students feel I really cared about them/ My mathematics teacher made me feel he/she really cared about me
96%(99%) 70%(68%)
Further information on responses to these items can be found in the England Technical Report Proportions are of teachers or students who agreed or strongly agreed Source: TALIS Video Study teacher and student data files for England
15
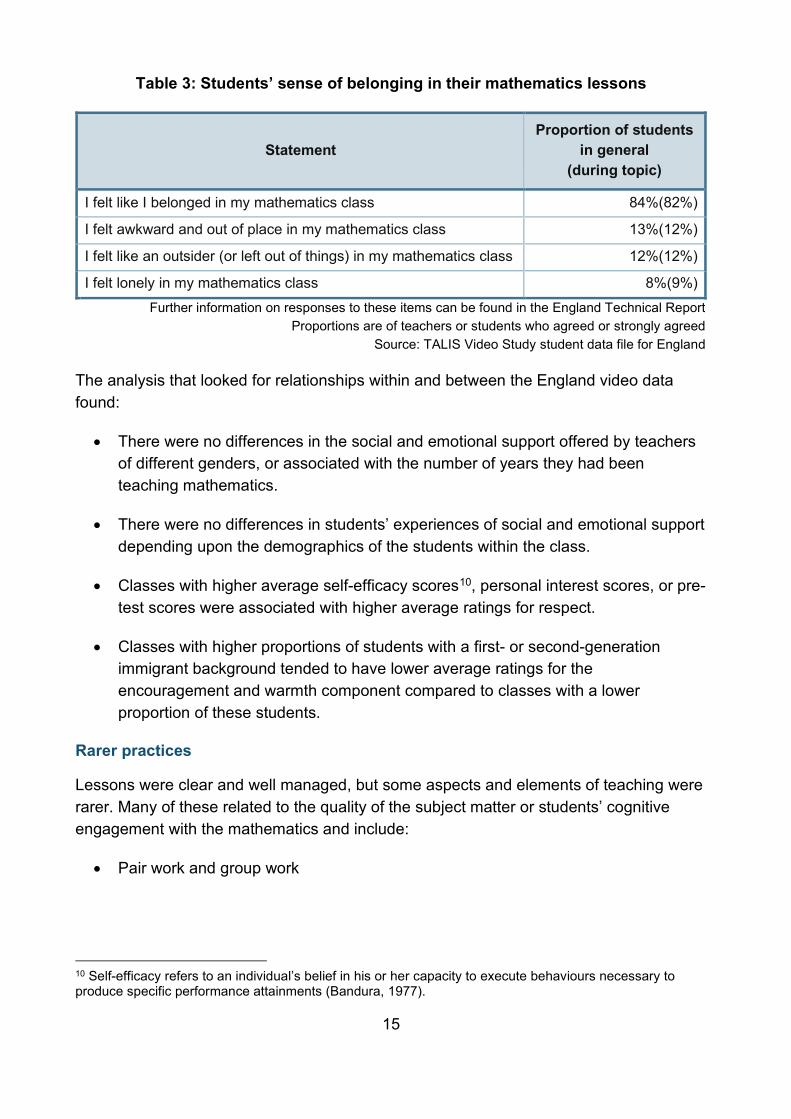
Table 3: Students’ sense of belonging in their mathematics lessons
Statement Proportion of students
in general (during topic)
I felt like I belonged in my mathematics class 84%(82%) I felt awkward and out of place in my mathematics class 13%(12%) I felt like an outsider (or left out of things) in my mathematics class 12%(12%) I felt lonely in my mathematics class 8%(9%)
Further information on responses to these items can be found in the England Technical Report Proportions are of teachers or students who agreed or strongly agreed
Source: TALIS Video Study student data file for England
The analysis that looked for relationships within and between the England video data found:
• There were no differences in the social and emotional support offered by teachers of different genders, or associated with the number of years they had been teaching mathematics.
• There were no differences in students’ experiences of social and emotional support depending upon the demographics of the students within the class.
• Classes with higher average self-efficacy scores10, personal interest scores, or pre-test scores were associated with higher average ratings for respect.
• Classes with higher proportions of students with a first- or second-generation immigrant background tended to have lower average ratings for the encouragement and warmth component compared to classes with a lower proportion of these students.
Rarer practices
Lessons were clear and well managed, but some aspects and elements of teaching were rarer. Many of these related to the quality of the subject matter or students’ cognitive engagement with the mathematics and include:
• Pair work and group work
10 Self-efficacy refers to an individual’s belief in his or her capacity to execute behaviours necessary to produce specific performance attainments (Bandura, 1977).

16
• Explicit connections both within the topic and to other mathematical topics or real-world contexts
• Using patterns to generalise from examples
• Comparing and contrasting different methods or solving problems with more than one method
• The use of technology or software to support understanding
What were lessons like?
Classroom discourse
Teachers and students were involved in classroom discourse. Lessons included questions requesting students to recall, report an answer, or define terms, and questions that requested students to summarise, explain, classify, or apply processes. Some lessons requested students to analyse, synthesise, justify, or conjecture. On average, lessons included explanations of why ideas or procedures are the way they are, though in many lessons these focused on brief or superficial features of the mathematics. In the lesson artefacts, which included worksheets, homework tasks and teacher presentations, students were not often asked for explanations of how or why mathematical procedures or relationships work.
Around three-quarters of teachers and students reported that there were frequent opportunities for students to explain their ideas. Around half of the teachers and half of the students reported that there were also frequent opportunities to critique arguments made by other students or that students had opportunities to engage in discussion amongst themselves.
The analysis that looked for relationships within and between the England data sets found:
• Classes with a higher average score on the pre-test had a positive association with the average video rating overall within the discourse domain, as well as higher ratings on each of the nature of discourse, questioning, and explanations components than classes with a lower average score on the pre-test. This means that there were more detailed student contributions and explanations, and students were asked more questions that required them to analyse, synthesise, justify, or conjecture in classes with higher average prior attainment compared to classes with a lower average prior attainment.
• Classes with higher proportions of students with a first- or second-generation immigrant background or lower proportions of students who spoke English at home
17
were more likely to be asked questions that required them to analyse or synthesise compared to classes with different proportions of these students.
Making connections to real-world and other mathematical topics was rare
Lessons were generally clear, although explicit connections and explicit patterns and generalisations (defined below) were not commonly used. Almost all teachers included some type of explicit goal in both their videoed lessons, and around two-thirds (68%) of the lessons had explicit goals that focused on student learning.
In the TALIS Video Study, explicit connections are defined as relationships or associations that are stated clearly, verbally, or in written form by a teacher or student. These connections can be between and among ideas, equations, representations (such as graphs, tables, diagrams, equations, or physical objects), perspectives, or procedures, and they can be within the topic of quadratic equations or can be between quadratic equations and other mathematical topics or real-world settings.
The potential to connect the teaching of quadratic equations to real life may be limited at GCSE level and, though there is potential to do this, it is not necessarily a topic where obvious connections spring to mind as easily and obviously as they might in other mathematics topics. Perhaps unsurprisingly, the use of real-world connections in both the lessons videos and artefacts was rare in all countries, but rarest in England. A minority (26%) of teachers did not include real-world connections in the artefacts from their four lessons. Less than half of the lessons included a connection to other mathematical topics. Equations were used frequently, as would be expected for lessons focusing on quadratic equations. Graphs were used by many teachers, and slightly fewer teachers used tables, drawings, or diagrams. Physical objects or models were very rarely used. Most teachers (89%) asked students to make a connection between mathematical representations in at least one lesson.
Teachers reported making connections between lessons, connecting new material or material previously covered in the unit or in the curriculum. In general, students reported this less than teachers did (see Table 4 below).

18
Table 4: Teachers’ and students’ perceptions of the clarity of lessons
Statement
Proportion of teachers in
general (during topic)
Proportion of students in
general (during topic)
I/My mathematics teacher presented a summary of recently learned content 70%(68%) 56%(56%)
I/My mathematics teacher set goals at the beginning of instruction 80%(79%) 64%(68%)
I/My mathematics teacher explained what I/they expected these students/us to learn 92%(81%) 82%(79%)
I/My mathematics teacher explained how new and old topics are related 86%(80%) 62%(62%)
Further information on responses to these items can be found in the England Technical Report Proportions represent the teachers or students who agreed or strongly agreed with each statement
Source: TALIS Video Study teacher and student data files for England
All teachers and students agreed that the teacher adapted the lessons to the class’s needs and knowledge and almost all teachers and students agreed that the teacher changed their way of explaining when a student had difficulty understanding a topic or task. This adaption of the lessons to meet the class’s needs and knowledge did not always involve giving different work to students with different attainment levels; 31% of teachers and 51% of students disagreed with the statement that different work was provided. Most teachers and students reported that lessons included a summary of recently learned content, that goals were set at the beginning of instruction, and that teachers explained how new and old topics were related.
The analysis that looked for relationships within and between the data sets found:
• Teachers reporting higher levels of self-efficacy were associated with higher average ratings for the clarity of their lessons.
• Lessons also had higher ratings for clarity for classes with higher average scores for student general self-efficacy in mathematics.
• Teachers were more likely to make more explicit connections when classes had higher average levels of students’ socio-economic status, but there were no differences in the use of explicit patterns and generalisations or the clarity of lessons on average.
19
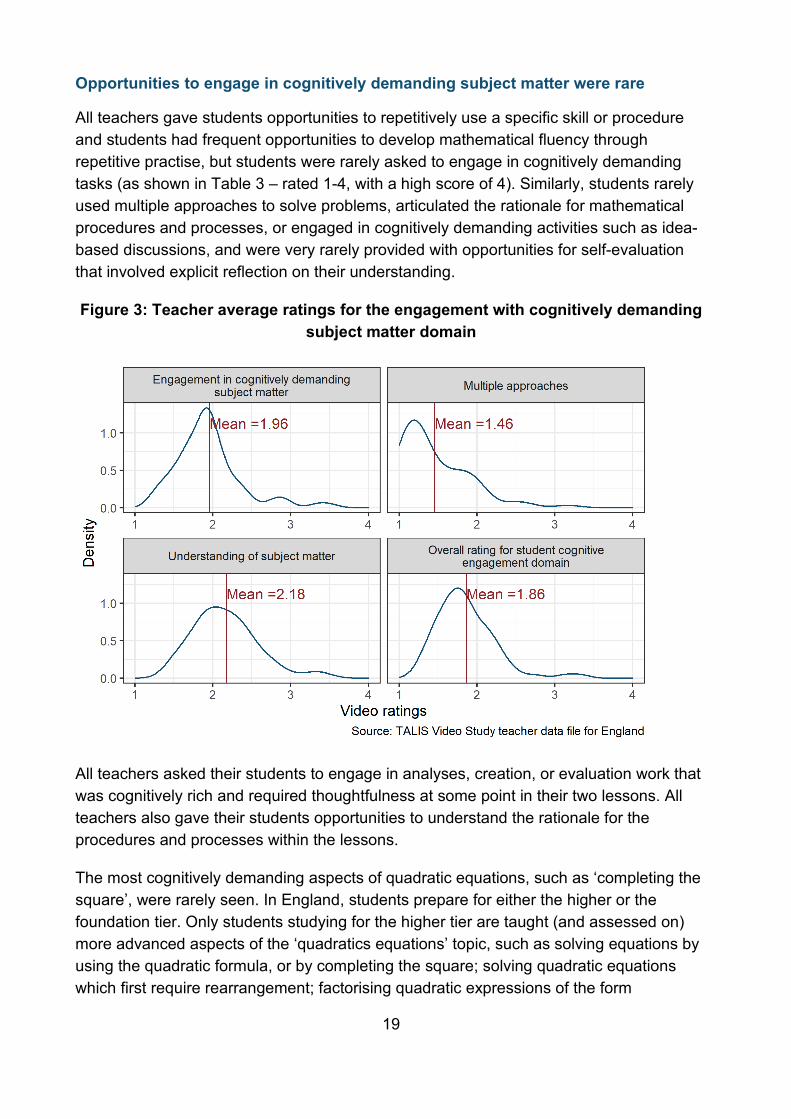
Opportunities to engage in cognitively demanding subject matter were rare
All teachers gave students opportunities to repetitively use a specific skill or procedure and students had frequent opportunities to develop mathematical fluency through repetitive practise, but students were rarely asked to engage in cognitively demanding tasks (as shown in Table 3 – rated 1-4, with a high score of 4). Similarly, students rarely used multiple approaches to solve problems, articulated the rationale for mathematical procedures and processes, or engaged in cognitively demanding activities such as idea-based discussions, and were very rarely provided with opportunities for self-evaluation that involved explicit reflection on their understanding.
Figure 3: Teacher average ratings for the engagement with cognitively demanding subject matter domain
All teachers asked their students to engage in analyses, creation, or evaluation work that was cognitively rich and required thoughtfulness at some point in their two lessons. All teachers also gave their students opportunities to understand the rationale for the procedures and processes within the lessons.
The most cognitively demanding aspects of quadratic equations, such as ‘completing the square’, were rarely seen. In England, students prepare for either the higher or the foundation tier. Only students studying for the higher tier are taught (and assessed on) more advanced aspects of the ‘quadratics equations’ topic, such as solving equations by using the quadratic formula, or by completing the square; solving quadratic equations which first require rearrangement; factorising quadratic expressions of the form

20
ax2+bx+c, where ‘a’ is not 1; determining turning points by completing the square; and solving quadratic inequalities. All GCSE students are assessed on some areas of quadratic equations, including solving quadratic equations algebraically by factorising, and finding approximate solutions using a graph. These differences may explain the rarity of some practices in the videos.
In the lesson artefacts, students were rarely required to or given the opportunity to use multiple mathematical methods. All teachers gave students opportunities to repetitively use a specific skill or procedure and this was evident in both the lesson videos and the accompanying artefacts.
Most students reported that their teacher gave them tasks that required them to think critically and tasks that required them to apply what they had learned to new contexts. The majority of both teachers and students also reported that teachers frequently explained why a mathematical procedure works, illustrated why a mathematical procedure works using concrete examples or graphics, and compared different ways of solving problems.
The analysis that looked for relationships within and between the England data sets found:
• There were no associations between classes with different demographics and students’ opportunities to engage in cognitively demanding tasks and activities, with the exception that classes with a higher average level of parental education were associated with classrooms in which multiple approaches were used.
• On average, classes with a higher average score on the pre-test were more likely to be asked to engage in cognitively demanding subject matter, use multiple approaches to or perspectives on reasoning and opportunities to understand the rationale for the procedures and processes within their lessons, compared to classes with a lower average score on the pre-test.
The use of technology (beyond interactive whiteboards) in lessons was rare
Teachers frequently used smartboards to communicate mathematical concepts, processes, and procedures. However, the use of all other technology was rare. Technology was also very rarely used to support students’ understanding of the mathematics, beyond the use of presentations. Less than 10% of teachers used technology to explore mathematical relationships and extend students’ understanding at least once.

21
Opportunity to learn: common subtopics and methods
The TALIS Video Study focused in part on opportunity to learn – how much time was devoted to the teaching of quadratic equations, and how much time was given to the different subtopics within the topic. These subtopics include different methods for solving quadratic equations, including by factorising, using the quadratic formula, completing the square, or finding the roots on a graph. They also include working with quadratic expressions, using the binomial formula (e.g. (𝑥𝑥 − 3)2), considering the different cases of quadratic equations that depend on which coefficients are present or not (e.g. discriminating between expressions of the form 𝑎𝑎𝑥𝑥2 + 𝑏𝑏𝑥𝑥 + 𝑐𝑐 depending on values of a, b, and c), as well as graphing quadratic functions and applying quadratic equations to different contexts.
The most common subtopic in the TALIS Video Study lessons was handling algebraic expressions, which included working with brackets and algebraic terms. The most common solution method that was taught was solving quadratic equations by factorising.
Fewer than a fifth of lessons included the consideration of applying quadratic equations to real-life contexts. Almost all teachers reported that students had opportunities to learn to use algebraic operations and just over half of teachers reported the opportunity to learn real-world applications of quadratic equations.
The analysis that looked for relationships within and between the England data sets found:
• Students’ prior attainment was associated with the extent of opportunity to learn reported by students, with students in classes with higher average pre-test scores indicating greater numbers of perceived opportunities to learn compared to students in classes with lower average pre-test scores.
• Students’ perceived opportunity to learn through the topic of quadratic equations was positively associated with students’ attainment on the post-test, their personal interest in mathematics, and their self-efficacy in mathematics.
• Students’ perceived opportunity to use quadratic functions was positively associated with students’ attainment on the post-test and their personal interest in mathematics and self-efficacy in mathematics.
• Students’ perceived opportunity to learn reasoning with quadratic equations was positively associated with students’ personal interest in mathematics and self-efficacy in mathematics.
• There was no association between students’ perceived opportunity to learn to apply quadratic equations to real-world contexts and students’ attainment on the

22
post-test, their personal interest in mathematics or self-efficacy in mathematics after the topic.
Relationship between student characteristics, teaching practices and student outcomes
As expected, students with higher scores on the pre-test tended to score higher on the post-test, and vice versa.
After pre-test scores had been accounted for, only socio-economic status (a student characteristic) had any significant relationships with the post-test scores11. Students with higher scores on the home possessions scale12 tended to have higher scores on the post-test. Given the short time between pre-test and post-test, the pre-test score likely accounts for relationships that exist between student demographic characteristics and attainment in general that has been shown in other research.
When classes were grouped into four groups (quartiles) by their average scores on the pre-test, students taught in classes with lower pre-test performance on average tended to have lower scores on the post-test even after taking into consideration their individual pre-test attainment (see Figure 4).
11 Home possessions is used as a proxy. 12 A scale derived from PISA which measures household wealth

23
Figure 4: Relationship between class prior-attainment and student attainment on the post-test
For students with higher individual pre-test scores, the average level of pre-test attainment in their class “makes more of a difference” to their post-test attainment; students in the lowest two groups of average class pre-test attainment are likely to have lower post-test scores than their peers with the same pre-test attainment in higher-attaining classes.
There was a positive relationship between opportunities to learn quadratic functions and post-test attainment, as well as a negative relationship between opportunities to learn to apply quadratic equations to real-world contexts and post-test attainment. The latter result should be interpreted with some caution, as opportunities to apply quadratic equations to real-world contexts were rare in this study.
The teaching practices were grouped according to whether they were maths-specific or not and these groupings were used to examine relationships between student outcomes and teaching practices. Discourse and the assessment of and responses to student understanding practices were grouped, as these reflected teaching practices that related to teaching in a range of curriculum areas. The quality of subject matter and student cognitive engagement were combined as these reflect teaching practices that are often specific to mathematics classrooms. There were no relationships between classroom management, social-emotional support, discourse, and assessment, or mathematics instruction and student attainment on the post-test, general self-efficacy with the current

24
teacher, or personal interest in mathematics with the current teacher before accounting for student and school characteristics. The same was true for classroom management, social-emotional support and the quality of instruction when all instructional practice groupings were combined.
Class average pre-test attainment “made more of a difference” to the post-test attainment of students in classes with teachers who had lower ratings for classroom management. Students in classes with lower average general self-efficacy with their previous teachers had lower general self-efficacy with their current teacher than students in other groups if the teacher’s classroom management ratings were low, and higher general self-efficacy with their current teacher than students in other groups if the teacher’s classroom management ratings were high.
For students in classes with the lowest average personal interest in mathematics with the previous teacher, the teacher’s ratings for social-emotional support made less of a difference to personal interest with the current teacher. For students in classes with higher personal interest in mathematics with the previous teacher, the higher a teacher’s social-emotional support ratings, the higher students’ personal interest in mathematics with the current teacher. There was also an overall positive relationship between social-emotional support and personal interest in mathematics with the current teacher after including this interaction.

25
Final comment The TALIS Video Study has attempted something important and ambitious. The OECD report says:
The TALIS Video Study has sought to break new methodological ground by observing teaching practices in greater depth and breadth; for example, measuring classroom discourse and analysing teaching materials for the first time at an international scale. Its lessons learnt and findings can be of interest to researchers, policymakers and practitioners alike who are interested in furthering the understanding of teaching and learning. – OECD, 2020a
The undertaking was significant and the outputs in terms of written materials are numerous as a result. This research summary has distilled key findings from the England National Report into a short format. Readers who want more detail are encouraged to read the other reports – in particular, the report detailing the qualitative analysis of mathematics teaching practices taken from the England data will be of interest to readers in schools and those who teach.
Building a strong evidence-base on “what works” in teaching has been a significant research focus in recent decades. The desire to understand teaching and the relationship between teaching practices and learning outcomes is strong and the potential is vast. Despite all the advances in the understanding of teaching and learning, a lot remains to be understood. This study provides a unique perspective and a solid basis for those wanting to consider and scrutinise professional practice in their desire to improve learning opportunities for all.

26
References Bandura, A. (1977). Self-efficacy: Toward a unifying theory of behavioral change.
Psychological Review, 84(2), 191-215. https://doi.org/10.1037/0033-295X.84.2.191
Ingram, J. & Lindorff, A. (2020). TALIS Video Study National Report, London, United Kingdom: DfE
Ingram, J. & Gorgen, K. (2020). TALIS Video Study case studies. London, United Kingdom: DfE.
Ingram, J. & Sani, N. (2020). TALIS Video Study and professional development. London, United Kingdom: DfE.
McCann, E., Riggall, A., Ingram, J., & Lindorff, A. (2020). TALIS Video Study: Technical report, London, United Kingdom: DfE.
OECD (2020a). Global Teaching InSights A Video Study of Teaching. Paris: OECD
OECD (2020b). Global Teaching InSights: Technical Report. Paris: OECD
Riggall, A., Sani, N. and McCann, E. (2020). TALIS Video Study international summary. London, United Kingdom: DfE.

27
© Department for Education 2020
Reference: DFE-RR1069
ISBN: 978-1-83870-211-3
For any enquiries regarding this publication, contact us at: [email protected] or www.education.gov.uk/contactus
This document is available for download at www.gov.uk/government/publications