talis video study - gov.uk
TRANSCRIPT

TALIS VIDEO STUDY Technical report
November 2020
Elaine McCann, Anna Riggall, Jenni Ingram, and Ariel Lindorff Education Development Trust and University of Oxford

1
Contents
List of tables 5
Acknowledgements 7
1 Study background 9
Introduction 9
What did the TALIS Video Study involve? 10
How the TALIS Video Study fits with PISA and TALIS 11
Managing and implementing the study 11
International Study Consortium (ISC) 11
International meetings 12
Focus on mathematics teaching 12
Country conceptualisations of good teaching 13
2 Sampling and recruitment 15
Sampling schools for the main study 15
Sampling plan for England 15
Description of sample received 16
Sample overlap of the TALIS Video Study and TALIS 2018 16
Recruitment of schools 16
Recruitment strategies and challenges 17
Sampling and recruitment of teachers 18
The role of the Study Lead 18
Sampling of teachers and classes 18
3 Instruments 20
Student and teacher questionnaires 20
Focus of student questionnaires 21
Focus of teacher questionnaires 21
Student tests 22
Focus of student tests 22
Test development 22
Construct and codes for observations and artefacts 23
Construct and code development 23

2
Description of codes for observations and artefacts 23
4 Fielding the TALIS Video Study 27
Timeline 27
Consent 27
Test and questionnaires 28
Test Administrators 28
Managing data collection for tests and questionnaires 28
Timing of visits 28
Data collection visits by Test Administrators 28
SEND students 30
Tracking data collected 30
5 Videoing of lessons 32
Training of videographers 32
Management of videographer visits 32
School communication 33
Protocol for videoing lessons 33
Checking rosters and managing consent 33
Collection of lesson artefacts 34
Quality control of videos 34
6 Quantitative data management 36
Data entry processes 36
Data verification and checking 36
Data transfer and storage 37
7 Rating in England 38
Master Raters: role and training 38
Training raters in England 38
Training materials 38
Delivery of training 39
Video component, indicator and artefact training 39
Allocation of rating 39
Allocation of rating for components 39

3
Allocation of rating for indicators 40
Allocation of rating for artefacts 40
Reliability and score validity: indicators and components 40
Assuring rater reliability and score validity: artefacts 41
Capturing scores and data transfer 41
Components and Indicators 41
Observed rating differences, reliability, and limitations 42
8 Analytic methods and detailed results 44
Characteristics of teachers, students, classes, and schools 47
Teacher characteristics 47
Student characteristics 49
School and Class Characteristics 50
Videos and artefacts 53
The classroom management domain 55
The social-emotional support domain 56
The discourse domain 58
The quality of subject matter domain 59
The student cognitive engagement in subject matter domain 63
The assessment of and responses to student understanding domain 67
Opportunity to learn 68
Modelling 72
Appendices 75
Appendix 1 Pilot for TALIS Video Study 76
Purpose 76
Instruments piloted 76
Adaptation of instruments for the pilot 76
Data collection procedures for the pilot 77
Recruitment of schools and teachers for the pilot 78
Pilot school visits 79
Videography and artefact collection in the pilot 79
Data entry and uploading of pilot data 79

4
Outcomes of the pilot 80
Appendix 2 Consent Forms 82
Parental consent form for OECD Video Study 82
Teacher consent form for OECD Video Study 84

5
List of tables Table 1. TALIS Video Study domains, components, indicators and artefact components ......................................................................................................................................... 25
Table 2. Data collected from participating teachers ......................................................... 46
Table 3. Data collected from participating students ......................................................... 47
Table 4. Teacher qualifications ........................................................................................ 48
Table 5. Teacher qualifications ........................................................................................ 48
Table 6.Teacher mathematics education experiences ..................................................... 49
Table 7. Years’ experience as a teacher and mathematics teacher ................................ 49
Table 8. Student demographic background ..................................................................... 50
Table 9. Distribution of classes and students across year groups ................................... 50
Table 16 shows the descriptives for each of the average teacher ratings for the video components within the social-emotional support domain. These were derived by taking the average rating over raters, then over lessons, then over teacher. The video components within this domain are respect, encouragement and warmth, and risk-taking and were measured on a scale of 1 (lowest presence or quality) to 4 (highest presence or quality). Table 16 shows the summary statistics for components in the social-emotional support domain. Risk-taking has been omitted from the overall domain rating by the ISC. ......................................................................................................................................... 56
Table 17. Frequencies for components in the social-emotional support domain ............. 57
Table 18. Summary statistics for indicators in the social-emotional support domain ....... 57
Table 25. Summary statistics for indicators in the quality of subject matter domain ........ 61
Table 26. Summary statistics for indicators measuring the use of representations ......... 62
Table 27. Summary statistics for artefacts in the quality of subject matter domain .......... 63
Table 28. Summary statistics for components in the student cognitive engagement in subject matter domain...................................................................................................... 63
Table 29. Frequencies for components in the student cognitive engagement in subject matter domain .................................................................................................................. 64
Table 30. Summary statistics for indicators in the student cognitive engagement in subject matter domain...................................................................................................... 65
Table 21. Summary statistics for indicators measuring the presence of technology ........ 66
Table 32. Summary statistics for artefacts in the student cognitive engagement in subject matter domain .................................................................................................................. 67

6
Table 33. Summary statistics for components in the assessment of and responses to student understanding domain ......................................................................................... 67
Table 34. Frequencies for components in the assessment of and responses to student understanding domain ..................................................................................................... 68
Table 35. Summary statistics for artefacts in the assessment of and responses to student understanding domain ..................................................................................................... 68
Table 36. Lesson timings across the topic ....................................................................... 70
Table 37. OTL solution strategies from teacher logs ....................................................... 71
Table 38. OTL content emphasis from Teacher Logs ...................................................... 71

7
Acknowledgements This report was written by Elaine McCann and Anna Riggall at Education Development Trust with Jenni Ingram and Ariel Lindorff at the Department of Education, University of Oxford. Our thanks also go to Rachael Fitzpatrick and Kristine Gorgen.
The England Teaching And Learning International Survey (TALIS) Video Study was led and managed by Education Development Trust in partnership with the Department of Education, University of Oxford. We would particularly like to thank Naomi Sani, Education Development Trust Mathematics Expert, the team of Education Development Trust data collectors, videographers and data entry personnel, the team of University of Oxford video and artefact raters, and Lowri Buckley, Data Collection Co-ordinator, Education Development Trust.
Education Development Trust and the Department of Education, University of Oxford would also like to thank staff at the Department of Education (DfE) who worked with us on the TALIS Video Study for their support throughout the project. Thanks also to the TALIS Video Study Advisory Group members for their support. The group played an important role advising on the design of the TALIS Video Study, and its implementation in England. The TALIS Video Study is an international study, led by the Organisation for Economic Co-operation and Development (OECD) involving a number of countries and economies working together. We are grateful to all the members of the TALIS Video Study International Consortium whose hard work and support led to the successful design and implementation of the study. We would also like to thank colleagues at the OECD for their constant support.
Last but not least, we thank the schools, mathematics teachers, and their students who participated in the study, whether in the main study in 2018, or in the piloting of the data collection instruments in 2016 and 2017, and for thereby providing the data that made this report possible. We are grateful for the time they gave and their efforts and cooperation throughout the data collection.

8
Disclaimer The TALIS Video Study is an OECD project. The development of the Study’s instrumentation and data analyses and drafting of international reports were contracted by the OECD to RAND, ETS1 and DIPF2. The authors of this work are solely responsible for its content. The opinions expressed and arguments employed in this work do not necessarily represent the official views of the OECD or its member countries.
1 Educational Testing Service 2 Leibniz Institute for Research and Information in Education

9
1 Study background
Introduction The Teaching and Learning International Survey (TALIS) Video Study of Teaching Practices, known as the TALIS Video Study3, is a pioneering international study, led by the OECD, which seeks to improve understanding of teaching practice in the eight participating countries and economies. Education Development Trust, in partnership with Oxford University, was commissioned by the Department for Education (DfE) to manage the delivery of the TALIS Video Study in England.
The TALIS Video Study focused particularly on the teaching of mathematics in secondary schools. The key goals were to:
1. Understand which components of mathematics teaching practices are related to student educational outcomes, including mathematics achievement as well as non-cognitive outcomes, and the nature of those relationships.
2. Observe and document how the teachers participating in the study from different countries and economies teach.
3. Examine the relationships between teaching practices and: teachers’ backgrounds and dispositions, students’ backgrounds and dispositions, and school characteristics.
4. Trial new methodologies to capture teaching practice in order to develop greater understanding of teaching and learning in different contexts.
Eight countries and economies4 participated in the study, including Biobío, Metropolitana and Valparaíso (Chile), Colombia, England (UK), Germany5, Kumagaya, Shizuoka and Toda (Japan), Madrid (Spain), Mexico and Shanghai (China). In total 533 schools, 700 teachers and around 17,500 students were involved. The TALIS Video Study was managed by the International Study Consortium (ISC) on behalf of the OECD.
The research findings will provide insight into the variety of mathematics teaching practices being used in classrooms across all eight participating countries and economies. They will facilitate understanding of the relationship between teaching practices and pupil and teacher perceptions of mathematics in England and internationally. The study seeks to inform policy development relating to teacher education, professional development and other areas of education policy. Additionally, it
3 Also referred to as the TALIS Video Study 4 Also referred to as “jurisdictions”. 5 In Germany this constituted a convenience sample of volunteer schools.

10
offers an opportunity to develop, at scale, the use of video observation to explore effective teaching, and support continuing professional development (CPD).
What did the TALIS Video Study involve? The TALIS Video Study involved the collection of data from students and mathematics teachers in schools across all participating countries/economies using a range of tools. The first stage involved a pilot, which informed the further development and finalisation of instruments for the main stage of data collection. Further details can be found in the OECD’s technical report6, and in Appendix 1 of this report.
During the main data collection phase, students completed a pre-test two weeks before the start of the quadratic equations unit, the topic of focus for the study, as discussed below. The pre-test was designed to assess general mathematics knowledge. A post-test, designed to be a more precise measure of students’ knowledge and understanding of quadratic equations, was then administered within two weeks of the end of the unit.
Students and teachers each completed two questionnaires, one in the two weeks prior to the unit beginning and one within two weeks of it ending. The teacher questionnaires asked teachers about their background and education, their beliefs, their motivation and their perception of the school environment. They were also asked about the class participating in the study, their teaching during the unit on quadratic equations, and the filming of lessons. Student questionnaires asked about background, attitudes and feelings towards mathematics, and the learning and teaching of mathematics. The first questionnaire focused on students’ attitudes and feelings towards mathematics with their previous mathematics teacher, whilst the second questionnaire focused on students’ attitudes and feelings with their current mathematics teacher.
During the quadratic equations unit, two lessons were also videoed, one in the first half of the unit and one in the second half. Artefacts (defined by the OECD as curriculum and instructional materials that help to guide student learning activities) from each of the videoed lessons and the subsequent lesson were submitted by teachers. Artefacts included lesson plans and any instructional materials used during the lesson (e.g. handouts, worksheets), in addition to homework assignments and any end-of-unit or end-of-term test that included quadratic equations.
In England, as in all countries/economies, schools were recruited from a randomly selected list of schools (sampling frame) provided by the ISC. Further details on sampling can be found in Chapter 2.
6 OECD (2020)

11
How the TALIS Video Study fits with PISA and TALIS The TALIS Video Study is an addition to the portfolio of OECD international surveys of teaching practices and student achievement which includes TALIS7 and the Programme for International Student Assessment (PISA)8. Both are large-scale, comparative studies which focus on understanding more about teaching practice and student achievement. TALIS surveys teachers and headteachers about a range of issues, including their own teaching practices, while PISA focuses on student performance in the areas of mathematics, reading, and science, as well as students’ perceptions of teachers’ classroom practices.
The TALIS Video Study is intended to complement both surveys by enabling a deeper understanding of and insight into classroom practice through the use of video-recorded lesson observation and the collection of lesson artefacts. While the study still uses student and teacher self-report measures, it overcomes some of the limitations of this type of data by providing direct measures of classroom teaching and instruction. The emphasis is on the conceptualisation and measurement of teaching practices, offering a rich pool of data against which to compare student and teacher self-report measures.
The TALIS Video Study has involved the development of new research and instruments that have not been applied on such a large scale before, especially for cross-cultural comparisons. However, the development of these research instruments has also been informed by the conceptual frameworks and questionnaires used by both TALIS and PISA to date. Ultimately, the study will significantly add to the PISA and TALIS datasets by capturing real teaching practices in the classroom, as well as teacher and student perceptions of these practices.
Managing and implementing the study
International Study Consortium (ISC)
The TALIS Video Study was managed by the International Study Consortium (ISC) on behalf of the OECD.
Each country/economy had its own team of national experts from areas such as mathematics, lesson observation and videography. The ISC worked in collaboration with experts from the national teams throughout the study.
7 http://www.oecd.org/education/talis/ 8 http://www.oecd.org/pisa/

12
International meetings
A series of international meetings was held throughout the duration of the study, in addition to a number of ISC-led webinars and one-to-one virtual meetings with each jurisdiction. These meetings enabled collaboration between the participating jurisdictions and the ISC, and consistency of approach in all aspects of the management and implementation of the TALIS Video Study.
Focus on mathematics teaching The TALIS Video Study required the selection of a specific subject through which the link between teaching and student outcomes could be explored across all participating countries/economies. Focusing on a common subject allowed for the targeted development of questionnaire and testing materials across all participating countries and economies. With the selection of mathematics as the target subject, it was then necessary to identify a topic that would be taught in multiple international contexts to students of similar age groups. The ISC, in consultation with Mathematics Experts from each country/economy, selected quadratic equations as the focal topic. Across all jurisdictions the topic was taught to students aged between 14 and 16.
The Mathematics Expert for England noted some challenges and idiosyncrasies regarding the choice of this topic such as:
• only some students in England, at that time, studied the subject of quadratic equations in its entirety.
• only Higher tier students (those aiming for grades 4-9) were assessed on more advanced elements of quadratic equations, such as solving by using the quadratic formula or by completing the square.
• it was hard to predict the Higher/Foundation tier split given the introduction of the new, more demanding exam syllabus which would be assessed for the first time in the summer of 2017.
To refine the focal topic and to ensure assessment content was being covered by teachers in all participating countries, Mathematics Experts identified the likelihood of different subtopics appearing throughout the quadratic equations unit in their country/economy. This resulted in agreement of the specific topics to be included in the student tests that would be developed for the study.
More information, particularly on the selection of subtopics and the definition of the “focal unit” can be found in the OECD technical report9.
9 OECD (2020)

13
Country conceptualisations of good teaching Prior to questionnaires and tests being developed, the ISC worked with participating jurisdictions to develop a shared conceptualisation of “good teaching”. The intention was to identify the main elements of good teaching found in all participating countries and economies. Experts from each jurisdiction were asked to provide the ISC with information about local conceptualisations of good teaching. This information was typically identified in reviews of research, practitioner-focused materials, or reports from inspection bodies, such as Ofsted in the case of England.
Experts, in addition to the submission of key literature, were also requested to produce a brief summary of the key elements of good teaching in each respective study, including: ways of thinking about high quality teaching; key divides or disagreements in what is meant by good teaching; historical changes; an assessment of the quality of empirical work submitted; a list of five of the most influential practitioner-focused materials; and up to five of the most influential reports from inspectorates or governing bodies.
The process of developing a conceptualisation of good teaching was also informed by a number of literature reviews carried out by the ISC, including one of the global observation literature (1970-2016) in peer-reviewed journals from pre-school to grade 12. Another focused on the question “How are observation protocols used to understand the relationships between teaching and student outcomes around the globe?”
In summary, the conceptualisation of teaching quality adapted for the TALIS Video Study was based on the integration of:
• Country/economy conceptualisations
• PISA 2012 and TALIS 2018 analytical frameworks
• Literature reviews carried out by the ISC
The final conceptualisation of good teaching was agreed between the ISC and participating jurisdictions. More information on how good teaching was conceptualised can be found in the OECD’s Technical Report10, particularly in relation to the following:
a. The goal of and strategy for integrating country conceptualisations of teaching quality
b. Collecting and summarising documents for each individual country
c. Building a shared understanding between country experts
10 OECD (2020)

14
d. Supplementing research evidence
e. Negotiating an integrated conceptualisation
f. Comparing the final model with the TALIS Video Study observation framework
The conceptualisation of good teaching was used in the design of the protocols for the analysis of the videos of teaching and classroom artefacts, and items on the teacher and student questionnaires that focused on the teaching practices demonstrated. Aspects of mathematics teaching practice that were important to some countries/economies but were likely to be rare were included alongside aspects that were more commonly measured in studies of mathematics teaching.

15
2 Sampling and recruitment
Sampling schools for the main study Initially, the ISC – through one of their partners, Statistics Canada – were to provide a random sample of schools to each country, organised into “triplets”. Countries were to look to recruit the “main sample” schools in the triplet first, and then only move on to the replacement schools if required. During the main study, this strategy was employed to a greater or lesser extent by each jurisdiction. The sampling deviations adopted and approved for each are detailed in the OECD’s Technical Report11, and those for England are summarised below.
Unlike in PISA and TALIS, the number of schools sampled in each country/economy was small and is not necessarily representative of the national population of schools or teachers. However, unlike PISA and TALIS, the TALIS Video Study does not seek to make system-level comparisons against teaching practices identified in different countries. Instead, it aims to provide descriptions of teaching practices and the relationship between these practices and student outcomes.
Sampling plan for England
Following discussions between the England team, the ISC, and Statistics Canada about the challenges of recruiting schools to a multi-layered study involving filming lesson videos, it was agreed that the England team would provide Statistics Canada with a list of 500 secondary schools (ISCED12 level 2) that they had good connections with, either directly or indirectly. These 500 schools constituted the main school sampling frame for England.
The main sampling frame provided the following information:
• school unique reference number (URN)
• teacher numbers
• pupil numbers
• region
• funding
All countries were encouraged to select a small number of key stratifiers (funding, region, and size for England) believed to be positively correlated to the questionnaire key output.
11 OECD (2020) 12 International Standard Classification of Education

16
Statistics Canada then used the stratifiers to organise the population frame before drawing the sample. The main sampling frame included no independent schools.
Description of sample received
A random sample of 85 schools (the minimum number that would allow the detection of effect between teaching and student outcomes) was selected for England from the main sampling frame of 500 “friendly” schools. An additional 15 schools were randomly selected from the TALIS 2018 sampling frame.
For each school selected, two “replacement” schools were drawn from the relevant sampling frame, each with a similar profile and location. Replacement schools were chosen from the same (explicit) stratum as the schools they replaced so that if a main sample school declined to participate, they were replaced by “a neighbour” – that is, a school that shared many of the same characteristics. This was done in order to boost the chances of recruiting the target of 85 schools. Where there were no suitable neighbours available to fill either or both of the replacement slots, they were left blank.
The intention was to provide England with 100 “triplets” (so a sample of 100 schools, each with two replacements). As the stratum did not always allow for one or both replacements to be provided, the final sample drawn consisted of 92 triplets and 8 pairs of schools (main and first replacement only), 292 schools in total.
Sample overlap of the TALIS Video Study and TALIS 2018
The sample for the TALIS Video Study, like that for TALIS 2018, was drawn in Autumn 2016. When drawing the samples, Statistics Canada prioritised minimising overlap between the main samples for both studies, while still ensuring probabilistic samples were drawn.
Any overlap that occurred for either main sample or replacement schools was, as directed by the ISC, managed by the project teams in-country. While the DfE facilitated direct communication between the two project teams, school details remained confidential. Each team was given priority over their main sample schools. In addition, the TALIS 2018 team had priority over their first replacements and all other schools were split between the two teams. Once recruitment and data collection for TALIS 2018 was complete, the TALIS Video Study team was able to approach all schools with an invitation to participate in the study.
Recruitment of schools Recruitment of schools began in March 2016 and continued until September 2018. An information letter was sent to all sampled schools, notifying them of England’s involvement in the study and indicating that schools selected to participate would be

17
notified in due course. Similarly, information was included in the bulletins of networks run by Education Development Trust, as well as the network newsletters of willing maths hubs all around the country, and on a dedicated TALIS Video Study web page. During recruitment, a promotional video with interviews from two teachers who took part in the pilot were added to the site (see Appendix 1 for details of the pilot).
Schools were invited to get in touch with the England project team if they were interested in participating in data collection and were subsequently checked against the school sample list. “Main sample” schools were recruited immediately, whilst first or second replacement schools were sent a holding email explaining the triplet system and confirming the team would be in touch with them at a later date.
Recruitment strategies and challenges
There were four main phases to recruitment:
1) Head teachers at the 100 main sample schools were sent a letter inviting them to participate in the TALIS Video Study, together with a leaflet outlining what the study involved and contact details for the project team.
2) Once data collection was underway, there was a risk that some schools were beginning to teach quadratic equations. The ISC agreed that the team could contact all remaining schools in the sample, irrespective of whether they were a first or second replacement, inviting them to participate in the study.
3) In the latter stages of data collection, letters then went out to schools that had initially declined to participate, had withdrawn from the study, or had already taught quadratic equations when first approached, notifying them that data collection had been extended to October 2018 and giving them another opportunity to be involved.
4) Finally, the team was given permission to recruit teachers for the last three slots from schools outside the main sample. Approaches were made to schools that were known to the England team including those that had participated in the pilot the previous year.
Initially, only one teacher was recruited from each school. However, the ISC then confirmed that if a second teacher from a school in England was willing, they could also participate in the study. The instances of two teachers from one school participating was, however, limited – with only seven cases in practice.
Details of recruitment efforts and responses for each school approached during the recruitment phase were recorded by the NPM in the School Sampling Resolution Form, provided by the ISC. In total, 85 teachers from 78 schools in England participated in the study.

18
Sampling and recruitment of teachers Once a school signed up to the TALIS Video Study, the emphasis was on sampling and recruiting mathematics teachers covering the focal topic with the target year groups (in England, typically students in Years 9 or 10). Details of the approach taken to sampling and recruitment are outlined in the following section.
The role of the Study Lead
In order to facilitate teacher recruitment and the data collection process, schools in England nominated a Study Lead from within their mathematics department. The Study Lead acted as the main point of contact and supported the promotion of the study within the school, particularly to parents/carers and colleagues in the mathematics department. Termly bulletins were sent to the Study Leads by the NPM to keep them up to date with progress on data collection across the schools involved in the study. This, together with regular contact from the Project Co-ordinator, was important to help with the retention of schools that were recruited early on and had a long lead time to the start of data collection at their school. Study Leads were usually but not exclusively Heads of Mathematics.
Sampling of teachers and classes
Once a school agreed to participate, the Study Lead provided key information to the national team, so that sampling of teachers and planning for data collection could begin. The information included:
• Year group(s) being taught quadratic equations
• Number of teachers teaching the target year group(s) and teachers’ initials
• Number of classes per teacher
• Details of when the quadratic equations unit would be taught and how long for
• Duration of mathematics lessons (including whether there would be double periods)
Instructions on randomising selected teachers were provided by the ISC – see the OECD Technical Report13. In each school, up to three teachers could be randomly selected, following the triplet system initially used for school recruitment. In turn, each teacher, where applicable, could have two replacement classes (also randomly selected) in the
13 OECD (2020)

19
event that the required threshold level of 50% student consent14 could not be achieved in the first class approached.
In England, the only element that could be randomised was teacher recruitment order, as teachers typically taught one class in the target year group. The ISC agreed that in order to maximise the opportunity for teacher recruitment, the team could work systematically through the list of randomised teachers until one agreed to be involved. Teachers could decline to participate in the study, or in some cases were ineligible as they had already taught the unit or at least started it by the time they were approached.
If a teacher was willing to be involved in the study, but the class did not meet target levels of consent, the next teacher on the randomised list was approached. This only happened in one school.
Once a sampled or replacement teacher had agreed to participate in the study, they were invited to provide information about the following so that dates for Test Administrator and videographer visits could be booked:
• Confirmation of the year group and class that data would be collected from
• The day and time of mathematics lessons
• Number of students in the target class
• Dates when the unit started and ended
• Number of lessons in the unit
Each country was required to complete a Teacher Sampling Resolution Form provided by the ISC which included a record for each teacher (by unique identifier, not name) invited to participate in the study, regardless of whether they agreed to or not.
14 As per OECD requirements.

20
3 Instruments A brief overview of the development and application of instruments used for data collection and coding is presented below. Further details about the development of student tests and both teacher and student questionnaires, as well as copies of each, can be found in the OECD Technical Report15. All instruments were developed by the ISC in collaboration with the relevant experts from each jurisdiction.
The reliability and validity of the items included in the student tests, and both teacher and student pre- and post-unit questionnaires, were tested in the pilot carried out in all countries early in 2017. In England, the pilot ran from January to June 2017 and overlapped with recruitment of schools for the main study. For more details on how the pilot was carried out and the outcomes, see Appendix 1. Following the pilot, finalised main sample instruments for England were agreed with the ISC.
Student and teacher questionnaires Both students and teachers in sampled classrooms completed two questionnaires: one prior to the teaching of the quadratic equation unit (pre-questionnaire) and another when the unit concluded (post-questionnaire). The focus of the questionnaires was on teaching processes, covering all six domains of teaching that the study intended to measure (see description of codes for observations and artefacts below), from the perspective of teachers and students. The questionnaires also explored content focus or opportunity to learn16 (OTL). The development of both teacher and student questionnaires was informed by:
• the conceptual frameworks developed for TALIS (TALIS 2018 for general aspects and the TALIS 2013 mathematics teacher module for domain-specific constructs) and PISA (PISA 2015/2018 for general aspects and PISA 2012 for mathematics-related constructs)
• classroom teaching and educational effectiveness research in general
• expert advisors from the participating jurisdictions
Questions were drawn and adapted from PISA and TALIS for the purposes of alignment and to validate the measures of teaching included in each. Certain items or constructs were measured from both the teacher and student perspective and so appear in pre- and/or post-questionnaires for both target groups. Questionnaire items were reviewed during collaborative international meetings and webinars.
15 OECD (2020) 16 Defined as learning opportunities to develop specific content knowledge.

21
Focus of student questionnaires
Student questionnaires included items on context, input, processes, and non-cognitive outcomes of student learning, all of which contributed to an understanding of the relationship between classroom teaching practices and student learning. For example, students were asked questions about their family background, learning time within and outside of school, perception of and participation in different classroom activities, and their self-efficacy beliefs in relation to mathematics.
Questions also focused on students’ perceptions of the video recording and testing. The pre-questionnaire focused on student experience of mathematics generally, while the post-questionnaire explored their experience of quadratic equations specifically.
Focus of teacher questionnaires
The goal of the teacher questionnaires was to provide information to enable the interpretation of the relationship between classroom teaching and student learning. The ISC developed items for the teacher questionnaires that reflected the focal topic of the lessons and aspects of quality understood through the teacher’s perspective. The teacher questionnaires covered the following areas: teacher background and education (for example, highest level of education and subjects studied); teachers’ beliefs; teachers’ motivation; teachers’ perception of the school environment (including teacher collaboration); teachers’ perception of the selected class; the selected unit, including lesson goals, mathematical content covered, teaching practices used, and teachers’ judgment of the effectiveness of the unit; and if the video-recorded lessons were representative of typical instruction.
Teachers were also asked to identify which sub-topics they had covered during each lesson in the quadratic equations unit and record them in a “Teacher Log” included with the pre-questionnaire. The list of sub-topics provided in the teacher pre-questionnaire, were based on common approaches used to solve quadratic equations (for example, completing the square, factorising) which had been agreed on by the Mathematics Experts from all eight countries and economies.
Each participating country had the opportunity to include additional items in the teacher questionnaires which were relevant to their local context. Responses to these questions were for analysis at local rather than international level. In England, the six country spe-cific questions added (three each to the pre- and post-questionnaires) focused on CPD and Teachers’ Standards, in addition to training and experience in mathematics.

22
Student tests
Focus of student tests
In order to understand the relationship between teaching practices and student outcomes, mathematics tests were administered to students before the quadratic equation unit and after its completion. The pre-test was administered within two weeks of the commencement of the quadratic equation unit and before classroom video recordings were made. It provided a baseline measure of students’ general mathematical knowledge, and in particular, the level of knowledge and skills believed to be necessary to understand quadratic equations. The post-test was administered to students within two weeks of the completion of the quadratic equations unit and examined students’ knowledge and understanding of quadratic equations.
Test development
The content and complexity for the pool of test questions was informed by a curriculum mapping exercise which identified the subtopics covered in each jurisdiction for the focal topic of quadratic equations. This was supplemented by a review of mathematics textbooks from different countries carried out by the ISC. The test blueprints were drafted and reviewed by Mathematics Experts from all participating economies in order to identify a final list of sub-topics for inclusion.
All jurisdictions consequently submitted at least 10 multiple choice items covering the specified range of sub-topics. It was agreed that the exact methods used to solve equations could vary, and therefore student tests would need to include problems that could be solved using a variety of learned methods. The items were reviewed by the ISC and Mathematics Experts, resulting in a pool of approximately 100 items selected for the pre-test and the post-test.
Compromises were inevitably made – England, for example, was keen to include graphical representations and functions, whilst other countries were not. This omission was of particular relevance to England given the limited range of quadratic equations topics taught to all students in England.
Two versions of each test were created for the pilot (see Appendix 1) to allow for the maximum number of items to be trialled. The test questions were reviewed during multiple collaborative international webinars with a focus on both the structure of questions and the cultural and contextual appropriateness for participating countries. During this review period, England included a simple question at the start of each test (pre- and post-) with the intention of providing all students access to some success. Other adaptations to the final tests (suggested by England and agreed and adopted by all countries) included clarification of symbols, with some symbols being explicitly explained (for example: ≠ means “is NOT equal to”). England also made appropriate local

23
adaptations, such as simple spelling changes (for example, meters to metres) and the replacement of brackets with the multiplication symbol in the possible solutions to product of primes questions. Once tested in the field, successful items from the pilot (A and B) tests were combined to create the final pre- and post-tests.
Construct and codes for observations and artefacts
Construct and code development
During the TALIS Video Study, two lessons from the quadratic equations unit were videoed. Lesson artefacts from the videoed lesson and the subsequent lesson were also gathered. A set of measures or codes for analysing video-recorded teaching practices and classroom artefacts was developed by the ISC in close collaboration with experts in the fields of both observation and mathematics from participating countries/economies. The aim was to ensure that the codes used to rate the videoed lessons and teaching artefacts reflected the conceptualisation of high quality teaching in all eight countries and economies, as suggested in the research literature and in the larger TALIS framework.
The initial international meetings focused on general issues such as the types of artefacts that might be found in different classrooms, how best to sample lessons for filming from the quadratic equations unit, what research might feed into the development of observation protocols and how to address the challenge of defining and measuring teaching quality in the observation codes.
Subsequent meetings focused on the specifics of the rubrics that the consortium had drafted for artefact and video coding. The rubrics drew on available research literature that identified constructs that would be worth measuring and how quality could be defined for each. Observation Experts and country/economy teams were given an opportunity to comment on, apply (to actual lesson videos and artefacts) and discuss the rubrics and any challenges they presented before the final versions were circulated. More detail of the process involved in developing the code frame for both artefacts and videos can be found in the OECD technical report17.
Description of codes for observations and artefacts
All videos of mathematics teaching and collected artefacts were analysed or coded against a framework that was developed specifically for this study (for further details see Chapter 7). The framework was grouped into six teaching practice domains or categories that other research has shown support students’ learning: classroom management, social -emotional support, discourse, quality of subject matter, student cognitive engagement, and assessment of and responses to student understanding.
17 OECD (2020)

24
Each domain was broken down further into aspects of mathematics teaching practice called components and indicators. The codes within each domain for each of the video components, video indicators, and artefact components are given in Table 1. Full details of the video component, video indicator and artefact component codes can be found in the OECD technical report18.
Video component ratings were given at 16-minute intervals throughout each lesson and video indicator ratings were given at 8-minute intervals. The artefacts for each lesson were rated as a complete set, with one rating for the collection of lesson plans, slides, worksheets, and other lesson materials. All video component ratings were on a 4-point scale where a rating of 4 represented a higher-quality or more frequently occurring teaching practice. All artefact component ratings were on a 3-point scale where a rating of 3 represented students’ engagement in the activity measured by the component, a rating of 2 represented the teacher or lesson materials engaging in the activity, and a rating of 1 represented an absence of the component activity from the lesson. Video indicators used varied scales and categories but most commonly used a 3-point scale.
18 OECD (2020)

25
Table 1. TALIS Video Study domains, components, indicators and artefact components
Domain Video components Video Indicators Artefact components
Classroom management
Routines Monitoring Disruptions Holistic classroom management domain rating
Time on task Activity structure and frequency Time of lesson
Not rated in artefacts
Social-emotional support
Respect Encouragement and warmth Risk-taking Holistic social-emotional support domain rating
Persistence Requests for public sharing
Not rated in artefacts
Quality of subject matter
Explicit connections Explicit patterns and generalizations Clarity Holistic quality of subject matter domain rating
Explicitness of learning goals Accuracy Real-world connections Connecting mathematical topics Mathematical summary Types of representation Organization of procedural instruction
Accuracy of materials Explicit learning goals Addressing diverse student needs Connecting mathematical representations Explicit patterns and generalisations Real-world connections

26
Domain Video components Video Indicators Artefact components
Student cognitive engagement
Engagement in cognitively demanding subject matter Multiple approaches to/perspectives on reasoning Understanding of subject matter procedures and processes Holistic student cognitive engagement domain rating
Metacognition Repetitive use opportunities Technology for understanding Classroom technology Student technology Software use for learning
Using multiple mathematical methods Opportunities to practice a skill or procedure Technology for understanding
Discourse Nature of discourse Questioning Explanations Holistic discourse domain rating
Discussion opportunities
Asking for explanations
Assessment of and responses to student understanding
Eliciting student thinking Teacher feedback Aligning instruction to present student thinking Holistic assessment of and responses to student understanding domain rating
Encouraging student self-evaluation

27
4 Fielding the TALIS Video Study
Timeline England was one of the first countries to begin data collection. Fieldwork began in October 2017 and ended a year later in October 2018. Completion dates varied across participating countries/economies, due to variance in the start and end dates of the academic years and the timing of the teaching of quadratic equations.
Consent Informed consent was sought from teachers and parents/carers. Consent forms (see Appendix 2) were disseminated to parents/carers via teachers.
Parents/carers were asked to indicate which elements of the study they were providing consent for. They could grant consent for none, one, or all of the following:
• Recording a video of their son/daughter in a classroom for two mathematics lessons
• Collecting their son/daughter’s response to questionnaires about his/her learning experience
• Collecting their son/daughter’s responses on two short mathematics tests
Students only participated in the elements of the study for which their parents/carers gave consent. If parents/carers opted for their son/ daughter not to be videoed, for example, then they were seated out of range of the camera. It was anticipated that this approach would result in higher rates of student participation.
Consent forms were distributed to parents/caregivers via students once class participation in the study was confirmed. Teachers recorded and submitted consent forms to the Project Co-ordinator ahead of data collection. The Project Co-ordinator liaised with the class teacher during the lead up to data collection, to gauge whether the threshold level of consent (set at 50% by the consortium) was likely to be met, on occasion confirming this during the visit.
In order to maximise student consent, webinars were offered for both parents/carers and students in the event of them having questions or concerns about the study. Only one school took up this option.

28
Test and questionnaires
Test Administrators
The majority of the data collection was carried out by trained Test Administrators. Training focused on the protocols for administering tests and questionnaires that each country/economy was required to follow.
Managing data collection for tests and questionnaires
The Project Co-ordinator had day-to-day responsibility for the logistics of data collection, as well as maintaining regular contact with teachers, particularly those who were teaching the unit later in the year, to ensure continued engagement and to monitor any changes in timing of the teaching of quadratic equations. Visits were rebooked if necessary, to fit the new teaching window.
Teachers were invited to sign up for a webinar which explained the data collection process and provided them with an opportunity to ask questions or voice any concerns.
Timing of visits
Each teacher involved in the study was visited before, during, and after the teaching of quadratic equations, in accordance with the rules specified by OECD.
• Within two weeks of the quadratic equation unit starting, a Test Administrator visited the school to administer a pre-test and questionnaire to students and a pre-questionnaire to the teacher. The last page of the teacher pre-unit questionnaire contained the Teacher Log, which the teachers were asked to detach and fill in each day during the quadratic equation unit.
• Within two weeks of the quadratic equations unit ending, the school received another visit from the Test Administrator to collect the Teacher Log and administer a post-unit test and questionnaire to the students and a post-unit questionnaire to the teacher.
Data collection visits by Test Administrators
Typically, Test Administrators visited each school at least twice, once to administer student pre-tests and the teacher and student pre-questionnaires (the teacher completed their questionnaire while the students were filling in theirs), and once to

29
administer all post-questionnaires and tests. Videographer visits were carried out separately (see Chapter 5).
The Test Administrator collected all hard copies of consent forms (including the teacher’s) from the teacher or students directly during their first school visit. Any student who had not received parental/carer consent did not complete a test or questionnaire, and were given alternate work to complete by their teacher.
The student test took up to 40 minutes to complete, whilst the student questionnaire took 30 minutes. Teacher questionnaires took a maximum of 35 minutes to complete. Some schools had double lessons which allowed enough time to administer the required test and questionnaire in one visit. However, where schools had single lessons only, four separate visits were required, unless the school had decided to extend the mathematics lesson. Whenever possible, the same Test Administrator carried out all pre- and post-visits to a school. The test was administered BEFORE the questionnaire, for both pre- and post-data collection visits.
In the case of both the pre- and post-unit mathematics tests, students were required to answer all questions unaided. Test Administrators could only answer questions about where students could do their rough work (in the booklet was fine) or where they put their answers (circle the appropriate letter).
The Test Administrators confirmed with the teacher on the day of the visit:
• Any changes to the class roster or additional last-minute completed consent forms.
• Alternative activities or tasks being undertaken by students who did not have consent to participate in the study.
• What to do in the event of students arriving too late for class to complete the test or questionnaire. Any consenting student arriving after the Test Administrator had finished reading the instructions for the test or questionnaire was asked to join the activities or tasks being undertaken by non-consenting students.
• Protocols for dealing with students becoming ill or needing the restroom and those for dealing with emergency drills or other incidences that could interrupt the test or questionnaire sessions that were pre-scheduled. (This typically resulted in the visit having to be rescheduled).

30
• The management of Special Educational Needs and Disabilities (SEND) students for whom an accommodation had been made (see below).
Administrators accompanied teachers to the classroom and administered the tests and/or questionnaires following the guidance that the ISC provided.
Completed test and questionnaire booklets were returned (within 48 hours of data collection) to the National Centre via Royal Mail tracked delivery.
SEND students
The ISC allowed accommodations for Students with Special Educational Needs and Disabilities (SEND) within specified parameters. The key directive was that accom-modations should be limited to those normally made for any similar tests taken. They needed both to be possible within the framework of the study, and not to result in any additional work for the teacher or the school. The Project Co-ordinator led on consulting with teachers about the presence of SEND students in the class and the accommodations required.
Two versions of the test and questionnaire booklets were produced for SEND students in England. The first was a large-font version for visually impaired students, whilst the second was produced for dyslexic students and involved the tests and questionnaires being printed on coloured paper.
Tracking data collected
Each item of data collected for teachers, together with details of any missing data, was logged in the Teacher Sampling Resolution Form.
A Student Sampling Resolution Form was also provided to all countries, where details of consent received and data collected could be logged. As survey and test booklets were returned to the National Centre, they were logged on the Student Resolution Form.
A Pupil Roster Data Entry Form was also submitted to the ISC, detailing:
• Student consent status
• Student date of birth (consenting students only)
• The date each item of data was collected (including video footage)

31
No student names appeared in either the Student Resolution Form or the Pupil Roster Data Entry Form; only Unique Identifiers were used.

32
5 Videoing of lessons This section provides an overview of the approach taken in England to the videoing of lessons. For more detail on the protocols used, see the OECD technical report19.
Training of videographers Videographers were provided with training ahead of their first school visit by the Videography Project Manager, who had been fully briefed by the ISC members responsible for the observation element of the study. Further guidance, based on the ISC protocols, was provided in a Videographer Manual which was drafted by the national team and covered each of the following:
• Logging availability for filming
• Equipment (Lumix GH4 and GH5)
• Communication with schools/teachers
• Camera placement during filming
• Recording sound (a two-microphone set up was used – a lapel microphone for the teacher and a mic stand for the students)
• Labelling of videos using unique IDs
• Digitalising and uploading of artefacts provided by teachers
All videographers were accompanied on their first school visit by the Videography Project Manager, to ensure all procedures were carried out correctly.
Management of videographer visits All countries were required to film one lesson in the first half of the quadratic equations unit and one lesson in the second half, with an even spread of filming taking place across the unit. This ensured that filming captured different lessons during the unit and were not all clustered around the start or end. This presented a challenge in England as the length of the quadratic equation unit varied across schools. In order to manage the
19 OECD (2020)

33
spread of filming, the quadratic equations unit in each school was broken down into quarters. Over the 85 participating teachers, there was a balance of lessons filmed in the “first half of the unit” falling into quarter one or quarter two, and similarly a balance of lessons filmed in the “second half of the unit” falling into quarter three or quarter four.
School communication Videographers contacted teachers ahead of their first lesson visit to discuss the logistics of filming, including whether:
• the videographer could have early access to the classroom to set up, including ensuring the layout allowed appropriate camera placement
• the teacher would be available prior to filming to test the mic
• all consent forms had been submitted by students and teachers, and staff and students without consent forms did not enter the class while filming was taking place
• the teacher would have any artefacts (such as presentations, workbook pages, and/or worksheets) available to photograph or email at the end of the session.
Protocol for videoing lessons During filming, the camera was positioned three-quarters of the way towards the back of the room, to capture the teacher and at least two-thirds of consenting students for 80% of the time. During the lesson, the camera was kept at the “base shot” – that is, a medium-wide shot – focused on the person who was speaking, and the mathematics that was being taught. The only exception was if the teacher moved to talk to a consenting pupil out of shot, in which case the videographer could pan to capture this and then return to the main shot.
Checking rosters and managing consent The videographer confirmed with the teacher at the start of the lesson that only consenting students were seated on camera. During filming, students without consent remained in the lesson but sat outside the camera’s range. If a teacher moved in their direction at any point, the camera did not follow the teacher, so the interaction was not captured.

34
Collection of lesson artefacts Artefacts were collected for each videoed lesson as well as the subsequent lesson. Artefacts included any materials a teacher used during a lesson, such as lesson plans, handouts, worksheets, textbook pages, and homework assignments. Teachers were also asked to provide a copy of the end of unit test or end of term test (if no end of unit test was used) that included quadratic equations. Artefacts were labelled with the unique teacher ID, together with the date on which they were used.
Once the artefacts were received, the National Project Manager led on adding additional labelling to them using the procedures outlined by the ISC. In summary, each page of an artefact had to be labelled with a unique code which included the teacher ID, the date the artefact was collected, an abbreviation of the type of artefact, and finally a number (01, 02 and so on) depending on how many of that particular artefact were used in the lesson.
Teachers were also asked to list each type of artefact used during the lesson and the number of pages in a dedicated Artefact Inventory Form (AIF) provided by the ISC. However, teachers in England rarely completed the form when submitting artefacts electronically, but they did signpost artefacts clearly so that the national team could identify which artefacts had been used in each lesson.
At the time of labelling, the NPM or Project Administrator checked that all artefacts had been submitted and that it was clear which day each had been used. Any inconsistencies or issues with missing artefacts were raised with the teacher. All artefacts were listed in the AIF by their unique identifier. Each artefact was checked for clarity and a quality score was recorded in the AIF. Artefact files and the AIF (one for each teacher) were then uploaded using a secure server. A list of individual artefact labels assigned across all 85 teachers was also uploaded to the ISC.
Quality control of videos The videography team ensured that all videos were checked for quality of sound, picture, and visibility prior to leaving a school. Any concerns or issues with filming or the video footage were reported to the Videography Project Manager before the videographer left the school.
All videos were subsequently checked by the Videography Project Manager using the quality control procedures provided by the ISC which necessitated scoring each video for sound, picture clarity, and camera position.

35
The ISC mandated that 10% of all lesson videos were also quality checked by the National Project Manager using the same scoring template. Records of quality control scores were kept, as these become part of the study documentation.

36
6 Quantitative data management
Data entry processes Manual key data entry was used across all tests and questionnaires. All data entry personnel were trained to ensure a consistent approach to data entry. Most items had a closed format, meaning the codes that appeared next to the response boxes had to be data-entered. There were some open-ended items, the majority of which were numerical, with a small number of exceptions which were string values.
In England, one person typically led on entering the data for any given class. At the very least, one person was responsible for entering the entirety of an instrument for a class, for example all student pre-unit tests. The tests and questionnaire data entry files adhered to the naming conventions outlined by the ISC.
Further information on data entry processes can be found in the OECD Technical Report20.
Data verification and checking Guidance for data verification and checking was provided by the ISC. All teacher pre- and post-questionnaires and 20% (the minimum required by the ISC) of all student tests and questionnaires were double entered, with a different person in each case doing the primary and double entry. Both sets of data entry were captured in different spreadsheets.
The error rate for data entry was calculated by adding the number of discrepancies found between the two data sets (primary and double entered) and dividing it by number of data values entered times 100. The error rate had to be less than 1%. Error rates were submitted to the ISC once data entry had been completed.
For the teacher questionnaires, all errors had to be checked and resolved by consulting the original booklet and correcting the errors in the main data capture files. For the student tests and questionnaires, the consortium initially asked that no correction be made to the data. However, once the data was submitted to the consortium, they
20 OECD (2020)

37
requested that where error rates were close to or above 1%, corrections to the main data capture file be made.
Verification checks were also completed during the data entry period, at least once a week as a minimum. Verification checks were repeated across all spreadsheets again once the files from all data entry personnel had been merged and before submission to the ISC. In the event of errors being discovered, the original teacher or student booklet were checked, and corrections made to the data file as needed.
A final crosscheck of all the data files was carried out before they were uploaded to the ISC.
Data transfer and storage All data files were stored securely and transferred between the project teams using a secure server. On completion of data entry, checked spreadsheets and all resolution forms were transferred to the ISC using their secure server. In addition, a Fielding Issues Report Form was uploaded, outlining issues encountered by countries and economies at each stage of the data collection process and the steps taken to address them.
Following ISC reviews of the submitted data, a final set of spreadsheets, revised resolution forms, and the pupil roster form was uploaded to the ISC in Spring 2019.

38
7 Rating in England The following section outlines the approach taken in England to the management of the rating of lesson videos and artefacts. Further detail on the development of training materials for rating, the training of Master Raters, and related quality assurance processes can be found in the OECD technical report21.
Master Raters: role and training Experts in lesson observation in each country were trained to be “Master Raters” (MRs). The training was run by the ISC, and the majority of it took place in person over two weeks. In addition, calibration exercises and practice ratings were undertaken remotely with calibration webinar meetings held by the ISC. The focus of training was to ensure the MRs understood and could carry out artefact and video coding to the required standards (See Chapter 3 for more detail on the codes).
The role of the MRs was to train raters for both the relevant types of codes – video components, video indicators, or artefact components – and to manage and quality assure the rating process.
The recruitment of raters for videos and artefacts followed the guidance developed by the ISC.
Training raters in England
Training materials
All training materials were developed and provided by the ISC. These included rating sheets and a manual for each type of rating. In addition, for video components and indicators, sets of videos were made available specifically to familiarise raters with the process of rating individual codes and sets of codes throughout the training programme. Similarly, sets of artefacts were selected by the ISC to familiarise artefact raters with the process of rating artefact components.
21 OECD (2020)

39
Delivery of training
Training for raters of artefacts, video indicators and video components (for further details see Chapter 3) was completed in accordance with the guidance provided by the ISC. All training was conducted in person and began with an introduction to the TALIS Video Study and the development of the codes across the study, before focusing on the detail of the specific rating type. The number of training sessions varied depending on the type of rating. For each type of rating, the final session of training involved a certification test.
Video component, indicator and artefact training
For component and indicator training, each session involved reading, discussing and then practicing watching video segments, taking notes, and rating on a selection of codes (generally this involved rating first on only the codes most recently reviewed, then building up to all codes reviewed to date). As was the case in the rating process following training, raters were given all artefacts to accompany each video when rating, and were advised to examine artefacts in order to understand details and context (for example, where it was not possible to see what problems students were answering in the video, artefacts might include worksheets or textbook pages that could be used to inform rating judgments for some codes).
Training for artefact raters was twofold – one part focusing on artefact components and then separate training on artefact subtopic codes. All training and certification of raters followed the procedures developed by the ISC.
Allocation of rating Original allocations of videos to raters for both components and indicators and allocations of artefact sets to raters was done by the international consortium and shared with the relevant MR.
Allocation of rating for components
Each components rater was originally allocated a total of 40-43 videos, including six validation videos. Assignments were made according to a clear set of rules set by the ISC: raters were to complete assignments in the order given, they were not to be sent large numbers of assignments at a time to avoid deviations from that order, and no rater was to rate two lessons from the same teacher.

40
Where assignments were reassigned to fit with rater availability, this was agreed with the ISC, to ensure that assignment rules, as outlined above, were followed as much as possible. The main deviation from rating rules was that not all raters could rate all validation videos, given the differences in total number of assignments completed, and raters who rated a greater number of videos than expected could not have the validation videos equally spaced as they received (unanticipated) reassignments after they had already completed all six available validation videos.
Allocation of rating for indicators
Each indicators rater was originally allocated a total of 37-39 videos, including six validation videos (see below). Again, assignments were made according to rules set by the ISC, and reassignments and deviations followed the same process as detailed above.
Allocation of rating for artefacts
Each artefact rater was originally allocated a total of 133-139 artefacts. Again, assignments were made according to the clear set of rules provided by the ISC.
For more detail on the coding of videos and artefacts, see the OECD technical report22.
Reliability and score validity: indicators and components The reliability and validity procedures developed by the ISC were followed, which included the rating of validation videos and artefact sets.
For components, all raters were originally assigned six validation videos. One rater (who completed five total assignments) rated only one validation video ratings, and the two raters who did the next smallest number of assignments (14 and 17) completed five validation video ratings. All others rated all validation videos.
For indicators, all raters were originally assigned five validation videos, equally spaced within the rating order. Seven raters completed all validation video ratings as planned, two completed four validation ratings, and one (who rated the smallest total number of videos) completed three validation ratings. The remaining validation videos from these raters were assigned to those in need of a sixth validation video due to reassignment.
22 OECD (2020)

41
In addition to validation videos, calibration exercises were held every 1-2 weeks for components and every 1-2 weeks for indicators. These exercises included meetings where the Master Rater would share the results of the exercise and discuss with the raters any codes identified as problematic, to refresh raters’ understanding of how to apply those codes. Although all raters were expected to participate in each calibration exercise, and the Master Rater usually held two duplicate calibration meetings for each exercise to accommodate different rater schedules, there were some instances in which raters had conflicting commitments and could not participate, or (as noted above) had communication issues and did not submit calibration ratings. In these instances, the Master Rater followed up with these raters individually when possible.
For components, a total of 10 calibration exercises were conducted over the duration of the rating process. For indicators, a total of 8 calibration exercises were conducted over the duration of the rating process.
Assuring rater reliability and score validity: artefacts
All raters took part in calibration exercises and these were spread out so that all raters would attend the same three calibration meetings. Where the calibration exercises occurred varied at the individual rater level, with only the rater who was recruited later in the recruitment cycle completing calibration separately and on a one-to-one basis. The majority of raters joined the calibration meetings via a virtual meeting. As with video rating, the calibration exercises for artefacts also involved meetings with the Master Rater to discuss the ratings and any issues raised.
Capturing scores and data transfer Ratings were checked, saved and backed up to a secure server by the Master Raters as they were received.
Components and Indicators
For components and indicators, quality assurance checks involved making sure that the number of segments was consistent with the time code entered by the rater (total time of video), that all identification information (date of video, school, country and teacher number, lesson A/B, rater number, date of rating) was correctly filled in, and that file names followed the appropriate protocol. Ratings were added to an aggregate spreadsheet with one row per rating assignment, and spot checks were performed on these data to ensure that formatting was preserved and that there were no obvious

42
errors (for example, out-of-range values). In several instances for both indicators and components, raters were alerted that selected ratings or time codes were missing, or about time codes that were inconsistent with the number of segments. In each case the relevant raters corrected the problem swiftly.
There were several cases where segments of videos were out of sequence and these had to be returned to the videography team for editing. Quality assurance checks by the videography team were carried out in accordance with the ISC guidelines, which required that other than the first ten minutes and last five minutes of a video, only one minute of footage for every ten was checked for quality of sound, quality of footage, and camera position. This meant that errors with sequencing were not easily identified.
Where problems with sequencing were noted, videos were moved to the end of the relevant raters’ assignment lists. The videography team produced a corrected version before the video was distributed to another rater. This solution was agreed with the ISC.
Artefacts
During the early stages of the artefact rating process, errors in the rating spreadsheet were identified and these were resolved by the ISC. Consequently, the artefact rating sheets were different for the first week of the rating process than in the subsequent weeks. All ratings were transferred by the Master Rater for artefacts to an aggregate spreadsheet with one row per rating assignment. Checks were carried out to ensure that formatting was preserved. The different spreadsheets provided by the international consortium formatted dates in different ways and so these were re-entered manually by the Master Rater where possible.
Observed rating differences, reliability, and limitations All ratings were screened by the Master Raters for missing, out-of-range, or inconsistent values, and these were discussed with raters when they were observed. In each case the relevant raters corrected the problem swiftly.
Results of calibration exercises for indicators, components, and artefacts suggested reasonable reliability according to the thresholds set by the international consortium. Where individual raters were below the required agreement thresholds (exact/adjacent), individual conversations were held between the Master Raters and the relevant raters to address this. As part of the analysis of indicator, component, and artefact rating data, interrater reliability checks were run, including for the main ratings and calibration videos.

43
For component and indicator rating, as noted above, there were some limitations arising from adjustments to the original plans and protocols by necessity – for example, re-assignment of videos to address differences in rater pace and availability, some instances of required deviation from rating rules with regard to validation video spacing and rating order when a video was not formatted correctly and had to be shifted to the end of several raters’ assignment lists, and several instances in which raters did not participate in some calibration exercises.

44
8 Analytic methods and detailed results Data analysis was conducted using seven data files resulting from the data collection and coding of videos and artefacts. Videos were coded for components and indicators by two independent trained raters and artefacts were coded for artefact components again by two independent trained raters. The data files included one for artefacts, schools, students, teachers, the teacher logs, video components and video indicators. These data files also included derived variables generated by the International Study Consortium as detailed below.
For all analyses involving the reporting on a latent trait (sometimes referred to as a construct) or other abstract trait, some questions from the student and teacher questionnaires were combined into an index or scale. Throughout the England National report23, the scales constructed by the International Study Consortium (ISC) were used and details of their derivation can be found in the OECD technical report24. The indices were constructed through simple arithmetical transformations or by recoding one or more items. The scale scores were derived using Item Response Theory. Examples of indices used are students’ personal interest in mathematics and levels of students’ parental education. Examples of scales used include pre- and post-test scores. The derived variable indicating the student’s international grade was recoded to match the year groups used in most state schools in England by adding one, where a student in international grade 7 is in Year 8 in most secondary schools in England.
There were two exceptions where indices were adjusted for the England data. 1) Students were asked in the questionnaires to report their year group. In England, students within the same class are all within the same year group. For students who did not complete this question, their year group was taken to be the same as reported by the majority of students in their class. In addition, there were a few students whose year group was different from the other students in their class and these were adjusted so that all students within the same class had the same year group. 2) The OECD measure of immigration status focuses on whether students were born in the UK and whether their parents were born in the UK. This derived a variable indicating whether a student was a first-generation immigrant, a second-generation immigrant or a native student. The derived variable indicating whether a student had a first- or second-generation immigrant background or not was coded as immigrant if the student was a first- or second- generation immigrant, and as native if both they and their parents were born in the UK. However, there were a few students where their answers indicated that they
23 Ingram and Lindorff (2020) 24 OECD (2020)

45
had a first- or second-generation immigrant background but not whether they were first- or second-generation. In the England national analyses these students were included in the derived first- and second- generation immigration variable.
For all questionnaire items not used to derive indices or scales that included scale scores, such as ratings from “strongly disagree” to “strongly agree”, the midpoint of the scale was calculated and descriptives were reported for the total proportion of teachers or students whose responses were higher in the scale than the midpoint. For example, those teachers who agreed or strongly agreed. Summaries of teachers’ and students’ responses to the questionnaire items can be found in the accompanying data tables.
R25 packages were used to conduct the statistical analyses of the data files. Where averages are given, these are the mean averages unless stated otherwise. Regression analyses were conducted only for those variables that met the assumptions and were conducted separately to explore relationships between different variables. Linear regression was used where the dependent variable, such as students’ general self-efficacy with their current teacher, was considered continuous. Selection of the independent variables included in each regression model was based on theoretical reasoning. For example, teacher characteristics were included where the outcome variable of interest related to the teaching practices, and student pre-test score was included in all models that included student post-test score. In the case of multiple linear regression models, the models’ explanatory power is also highlighted by the R-squared, which represents the proportion of the observed variation in the dependent (or outcome) variable that can be explained by the independent variables. The regression tables can be found in the accompanying data table.
As the data arises from a sample, all results include a degree of uncertainty.
The data collected from teachers is summarised in Table 2, with 85 teachers participating in most aspects of the data collection.
25 R version 3.6.3

46
Table 2. Data collected from participating teachers
Sample n Proportion
Total number of participating teachers 85 100.0 Completed pre-questionnaire 85 100.0 Completed post-questionnaire 84 98.8 Completed Teacher Log 85 100.0 Lesson videotapes collected 85 100.0 Lesson artefacts collected 84 98.8
Source: teacher data file for England
For the lesson videos, all 85 teachers consented to having two lessons video-recorded but in some cases only one lesson was recorded or was of sufficient quality for data analysis. In all, 82 teachers had both lessons video-recorded, with 84 lessons towards the beginning of the unit contributing to the analysis and 83 lessons later in the unit. For the artefacts, 75 teachers submitted four artefact sets, with nine teachers submitting three artefact sets, and one submitting two artefact sets.
The data collected from students is summarised in Table 3.

47
Table 3. Data collected from participating students
Sample N prop
Number of students participating 2,025 100.0 Consented to questionnaires 2,023 99.9 Consented to tests 2,003 98.9 Consented to videos 1,971 97.3 Completed pre-questionnaire 2,016 99.6 Completed post-questionnaire 2,021 99.8 Completed pre-test 1,983 97.9 Completed post-test 2,001 98.8 Test data included in test measures 1,862 92.0 Questionnaire data included in personal interest measures 1,854 91.6
Questionnaire data included in general self-efficacy measures 1,857 91.7
Source: student data file for England
Characteristics of teachers, students, classes, and schools This section provides summaries of the characteristics of the teachers, students, and schools in England that participated in the TALIS Video Study. The teacher and student characteristics were collected through items on the questionnaires and consequently there are some teachers and students for which this data was not collected.
Teacher characteristics
Of the 85 participating teachers, 58% were female. These teachers had an average age of 35.6 years, ranging from 23 to 54 years. Their qualifications are summarised in Table 4, Table 5, and Table 6.

48
Table 4. Teacher qualifications
Level of Education Number of Teachers
Proportion of Teachers
HNC, HND, NVQ at level 4+, Foundation degree or equivalent 1 1%
Bachelor’s Degree 61 73% Master’s Degree 20 24% Doctorate 1 1%
Source: teacher data file for England Data is missing for one teacher who did not complete the questionnaire and one teacher who
did not answer the questions about qualifications
Due to the small number of teachers completing a doctorate, the data was grouped into teachers with an undergraduate degree or below and teachers with a postgraduate degree for the analysis. Table 5 shows that that 58 (69%) mathematics teachers’ highest level of mathematics-related formal education was a Bachelor’s degree, compared to 61 (73%) mathematics teachers whose highest qualification in any subject area was a Bachelor’s degree.
Table 5. Teacher qualifications
Level of Education Mathematics All qualifications
Number of teachers
Proportion of teachers
Number of teachers
Proportion of teachers
GCE A levels or below, or equivalent 10 12% 0 0
HNC, HND, NVQ at level 4+, Foundation degree or equivalent 5 6% 1 1%
Bachelor’s Degree 58 69% 61 73% Master’s Degree 10 12% 20 24% Doctorate 1 1% 1 1%
Source: teacher data file for England and National Questions data file Data is missing for one teacher who did not complete the questionnaire and one teacher who did not
answer the questions about qualifications

49
Teachers were also asked what was included in their mathematics education or training. Table 6 shows the numbers and proportions of teachers who answered yes to each statement.
Table 6.Teacher mathematics education experiences
Statement Number of teachers
Proportion of Teachers
Mathematics course equivalent to those needed for a degree in mathematics 57 69%
Courses on how to teach mathematics 79 98% Practice teaching in mathematics 79 98%
Source: teacher data file for England Data is missing for one teacher who did not complete the questionnaire and one teacher who
did not answer this question
Teachers were also asked how many years of experience they had as a mathematics teacher, and how many years of experience they had as a teacher of any subject, including mathematics. The results of these questions are shown in Table 7 and further information is available in the accompanying data tables.
Table 7. Years’ experience as a teacher and mathematics teacher
Question N Mean SD Min Max
Number of years working as a mathematics teacher 85 9.89 6.97 1.00 29.00
Number of years working as a teacher 85 10.00 7.27 1.00 29.00
Source: teacher data file for England
Student characteristics
The following tables show the demographic backgrounds of the students who were included in the England sample for TALIS Video Study.

50
Table 8. Student demographic background
Characteristic Number of students
(n)
Proportion of students
(%)
Female 1,031 53.8 Male 884 46.2 Speak English at home 1,755 92.1 Immigrant background 302 15.8
Source: student data file for England
The data was collected from students in Years 8, 9, 10, and 11. The number of students and classes in each year group and the average age of students in each year group is shown in Table 9.
Table 9. Distribution of classes and students across year groups
Year group Number of students
Proportion of students
Number of classes
Average age (years)
8 59 3% 2 13.0 9 369 18% 14 14.1
10 1,443 71% 62 14.9 11 154 8% 7 15.6
Source: student data file for England
School and Class Characteristics
Schools were randomly selected by the ISC. In England the characteristics of the schools that participated is summarised in Table 10.

51
Table 10. School characteristics
Sample Number of
schools (n)
Proportion of schools
(%)
Urban School 58 76.3 Religious School 18 23.1 Selective School 9 11.5
Source: school data file for England
Within the classes that were videoed, the proportion of students who consented to each part of the data collection, the proportion of students who completed each part of the data collection, and the proportion of students who answered sufficient questions on the questionnaire or test to be included in the derived variables used in TALIS Video Study are given in Table 11.

52
Table 11. Class participation
Class characteristic Number
of classes
Mean SD Min Max
Proportion of students consenting to questionnaire 85 99.9% 0.50% 96.7% 100.0%
Proportion of students consenting to tests 85 98.8% 3.90% 73.9% 100.0%
Proportion of students consenting to videos 85 97.2% 4.78% 80.0% 100.0%
Proportion of students included in the derived variables for self-efficacy 85 91.4% 8.31% 62.5% 100.0%
Proportion of students included in the derived variables for personal interest 85 91.3% 8.40% 62.5% 100.0%
Proportion of students included in the derived variables for attainment 85 91.6% 9.05% 58.3% 100.0%
Proportion of students who completed the pre-questionnaire 85 99.6% 1.98% 83.3% 100.0%
Proportion of students who completed the post-questionnaire 85 99.8% 1.14% 90.5% 100.0%
Proportion of students who completed the pre-test 85 97.9% 6.40% 55.6% 100.0%
Proportion of students who completed the post-test 85 98.7% 4.26% 73.9% 100.0%
Source: student data file for England
The demographics of these participating classes are summarised in Table 12.

53
Table 12. Class characteristics
Class characteristic Number
of classes
Mean SD Min Max
Proportion of the class who were female 85 54.9% 23.39% 0.0% 100.0%
Average class measure of home possessions 85 -4.1% 39.98% -118.1% 70.8%
Proportion of the class who were immigrants 85 15.6% 18.80% 0.0% 86.7%
Proportion of the class who spoke English at home 85 92.2% 10.36% 57.7% 100.0%
Source: student data file for England
Videos and artefacts For the analysis of the data collected through the coding of videos, Pearson’s correlation coefficient was used to examine associations between component teacher mean ratings, and between component and indicator teacher mean ratings. To examine the associations between the classroom management components and teacher characteristics, Spearman correlation coefficients were calculated as not all the correlates met the assumptions for Pearson’s correlation coefficient and suggested that the relationship may not be linear. These correlations can be found in the accompanying data tables. The ISC omitted two components from their analysis: risk-taking and clarity. In the England data clarity also did not correlate well with the other components within the domain so was also omitted from the analysis of the England data. However, risk-taking showed sufficient variation within England and was positively correlated with the other components in the social-emotional support domain so was included in the modelling for England.
The data was also examined for relationships between the mean teacher ratings for each component and for the overall domain and teacher or class characteristics. The teacher characteristics included the gender of the teacher, whether the teacher had a postgraduate qualification or not (Master’s degree or Doctorate), whether they had gained their teaching qualification through an approved initial teacher training (ITT) provider (Standard) or not, and whether the teacher had taken mathematics courses

54
equivalent to degree level or not. The analysis did not include whether teachers’ teaching qualifications included courses on how to teach mathematics or practice teaching in mathematics, as almost all teachers had these included in their mathematics education or training. Similarly, very few teachers did not gain their teaching qualification through an approved ITT provider so this characteristic was only used as a predictor in combined models of teacher characteristics. The frequency density graphs were examined for each of the video components, and where they looked approximately normally distributed, a Shapiro-Wilk test was used to test for normality. For components that were normally distributed, the t-test was used to test for significant differences. Linear regression was also used to examine relationships between these components and teacher or class characteristics. Other components did not meet the assumptions required for a parametric test for significance, and in these cases the Wilcoxon test with a Benjamini and Hochberg adjustment for multiple comparisons was used unless stated otherwise. The results of these tests can be found in the data tables.
The interrater reliability for each component and indicator was also calculated using the percentage exact agreement, percentage adjacent agreement, Cohen’s weighted Kappa for ordinal values, and Krippendorff’s Alpha. As a result of these reliabilities, all analysis was conducted on average teacher ratings across lessons, segments, and raters. These interrater reliabilities can be found in the data tables.
Further details about each of the video components, video indicators and artefact components can be found in the England National Report (Chapters 3 to 8)26.
26 Ingram and Lindorff (2020)

The classroom management domain Table 13 shows the descriptives for each of the average teacher ratings for the video components within the classroom management domain. These were derived by taking the average rating over raters, then over lessons, then over teacher. The video components within this domain were routines, monitoring and disruptions and were measured on a scale of 1 (lowest presence or quality) to 4 (highest presence or quality).
Table 13. Summary statistics for components in the classroom management domain
Component N Mean SD Min Max
Routines 85 3.78 0.20 3.00 4.00 Monitoring 85 3.61 0.29 2.62 4.00
Disruptions 85 3.82 0.23 2.92 4.00 Average overall domain rating 85 3.74 0.20 3.11 4.00
Source: teacher data file for England
Table 14 shows the frequencies across the 1 to 4 scale for the average teacher ratings for the video components within the classroom management domain.
Table 14. Frequencies for components in the classroom management domain
Component Frequency of scores below
1.5
Frequency of scores between
1.5 and 2.5
Frequency of scores between
2.5 and 3.5
Frequency of scores between
3.5 and 4
Routines 0 0 6 79 Monitoring 0 0 20 65
Disruptions 0 0 6 79 Average overall
domain rating 0 0 9 76
Source: teacher data file for England
For the activity structures (whole group, small group, pair work, individual work) the values are the average percentage of segments in which the activity is present, averaged over raters, lessons, and teachers. The video indicators within this domain included time on task, activity structure (whole class, small group, pair, and individual work) and the time of the lesson as recorded in the video. Activity structures were measured on a 4-point scale ranging from not used (1) to used for the entire segment (4).

56
Table 15. Summary statistics for indicators in the classroom management domain
Indicator N Mean SD Min Max
Time on task 85 3.86 0.12 3.43 4.00 Whole group (average
percentage of segments) 85 94.62 8.26 60.71 100.00
Small group (average percentage of segments) 85 2.16 5.58 0.00 32.14
Pair work (average percentage of segments) 85 11.46 14.02 0.00 57.14
Individual work (average percentage of segments) 85 84.23 12.70 50.00 100.00
Source: teacher data file for England
The social-emotional support domain Table 16 shows the descriptives for each of the average teacher ratings for the video components within the social-emotional support domain. These were derived by taking the average rating over raters, then over lessons, then over teacher. The video components within this domain are respect, encouragement and warmth, and risk-taking and were measured on a scale of 1 (lowest presence or quality) to 4 (highest presence or quality). Table 10 shows the summary statistics for components in the social-emotional support domain. Risk-taking has been omitted from the overall domain rating by the ISC.
Table 16. Frequencies for components in the social-emotional support domain
Component N Mean SD Min Max
Respect 85 3.56 0.39 2.50 4.00 Encouragement and warmth 85 2.71 0.50 1.42 3.75
Risk-taking 85 2.93 0.42 1.56 4.00 Average overall domain rating 85 3.14 0.35 2.31 3.83
Source: teacher data file for England
Table 17 shows the frequencies across the 1 to 4 scale for the average teacher ratings for the video components within the social-emotional support domain.

57
Table 11. Frequencies for components in the social-emotional support domain
Component Frequency of scores below
1.5
Frequency of scores
between 1.5 and 2.5
Frequency of scores
between 2.5 and 3.5
Frequency of scores
between 3.5 and 4
Respect 0 0 25 60 Encouragement and
warmth 1 29 49 6
Risk-taking 0 11 67 7 Average overall
domain rating 0 5 69 11
Source: teacher data file for England
Table 18 shows the summary statistics for the indicators in the social-emotional support domain. The video indicators within this domain included persistence, which was also measured on a 1 to 4 scale, and requests for public sharing which was measured on a 1 (not present) to 3 (present and detailed) scale. Persistence is described using two different measures. The rating, when present, only includes segments where some persistence was observed and is consequently on a scale of 2 to 4. The other measure records the proportion of segments where some persistence was observed.
Table 12. Summary statistics for indicators in the social-emotional support domain
Indicator N Mean SD Min Max
Persistence (rating when present) 85 2.46 0.20 2.08 2.94
Persistence (average percentage of
segments present) 85 62.59 15.02 25.00 95.83
Requests for public sharing 85 1.92 0.30 1.21 2.75
Source: teacher data file for England

58
The discourse domain Table 19 shows the descriptives for each of the average teacher ratings for the video components within the discourse domain. These were derived by taking the average rating over raters, then over lessons, then over teacher. The video components within this domain were nature of discourse, questioning, and explanations and were measured on a scale of 1 (lowest presence or quality) to 4 (highest presence or quality).
Table 19. Summary statistics for components in the discourse domain
Component N Mean SD Min Max
Nature of discourse 85 2.54 0.35 1.58 3.83 Questioning 85 2.51 0.28 2.00 3.50
Explanations 85 2.29 0.31 1.58 3.52 Average overall domain
rating 85 2.44 0.26 2.00 3.39
Source: teacher data file for England
Table 20 shows the frequencies across the 1 to 4 scale for the average teacher ratings for the video components within the discourse domain.
Table 20. Frequencies for components in the discourse domain
Component Frequency of scores below
1.5
Frequency of scores between
1.5 and 2.5
Frequency of scores between
2.5 and 3.5
Frequency of scores between
3.5 and 4
Nature of discourse 0 31 53 1
Questioning 0 39 45 1 Explanations 0 w64 20 1
Average overall domain rating 0 47 38 0
Source: teacher data file for England
Table 21 shows the summary statistics for the video indicator in the discourse domain. The video indicator within this domain was discussion opportunities which was a dichotomous

59
measure of 1 if there were no discussion opportunities, and 2 where a segment engaged students in discussions that focused on the learning objective.
Table 21. Summary statistics for indicators in the discourse domain
Indicator N Mean SD Min Max
Discussion opportunities 85 1.04 0.10 1.00 1.50
Source: teacher data file for England
Table 22 shows the summary statistics for the artefact component in the discourse domain. The artefact component within this domain was asking for explanations and was measured on a scale of 1 (lowest presence) to 3 (highest presence).
Table 22. Summary statistics for artefacts in the discourse domain
Artefact component N Mean SD Min Max
Asking for explanations 85 1.42 0.32 1.00 2.62
Source: teacher data file for England
The quality of subject matter domain Table 23 shows the descriptives for each of the average teacher ratings for the video components within the quality of subject matter domain. The video components within this domain were explicit connections, explicit patterns and generalisations, and clarity, and were measured on a scale of 1 (lowest presence or quality) to 4 (highest presence or quality). These were derived by taking the average rating over raters, then over lessons, then over teacher. The clarity component was omitted from the overall average domain score due to the low correlations with the other components within the domain.

60
Table 23. Summary statistics for components in the quality of subject matter domain
Component N Mean SD Min Max
Explicit connections 85 1.93 0.45 1.12 3.10 Explicit patterns and
generalisations 85 1.59 0.35 1.00 2.42
Clarity 85 3.37 0.28 2.58 4.00 Average rating for overall domain
(Not including clarity) 85 1.76 0.36 1.12 2.74
Source: teacher data file for England
Table 24 shows the frequencies across the 1 to 4 scale for the average teacher ratings for the video components within the quality of subject matter domain.
Table 24. Frequencies for components in the quality of subject matter domain
Component Frequency of scores below
1.5
Frequency of scores
between 1.5 and 2.5
Frequency of scores
between 2.5 and 3.5
Frequency of scores
between 3.5 and 4
Explicit connections 16 58 11 0 Explicit patterns and
generalisations 35 50 0 0
Clarity 0 0 52 33 Average rating for
overall domain (not including clarity)
21 61 3 0
Source: teacher data file for England
Table 25 shows the descriptives for each of the average teacher ratings for the video components within the quality of subject matter domain. The video indicators within this domain were explicit learning goals, accuracy, real-world connections, connecting mathematical topics, organisation of procedural instruction, and mathematical summary. These indicators were measured on a scale of 1 (lowest presence or quality) to 3 (highest presence or quality). These were derived by taking the average rating over raters, then over lessons, then over teacher.
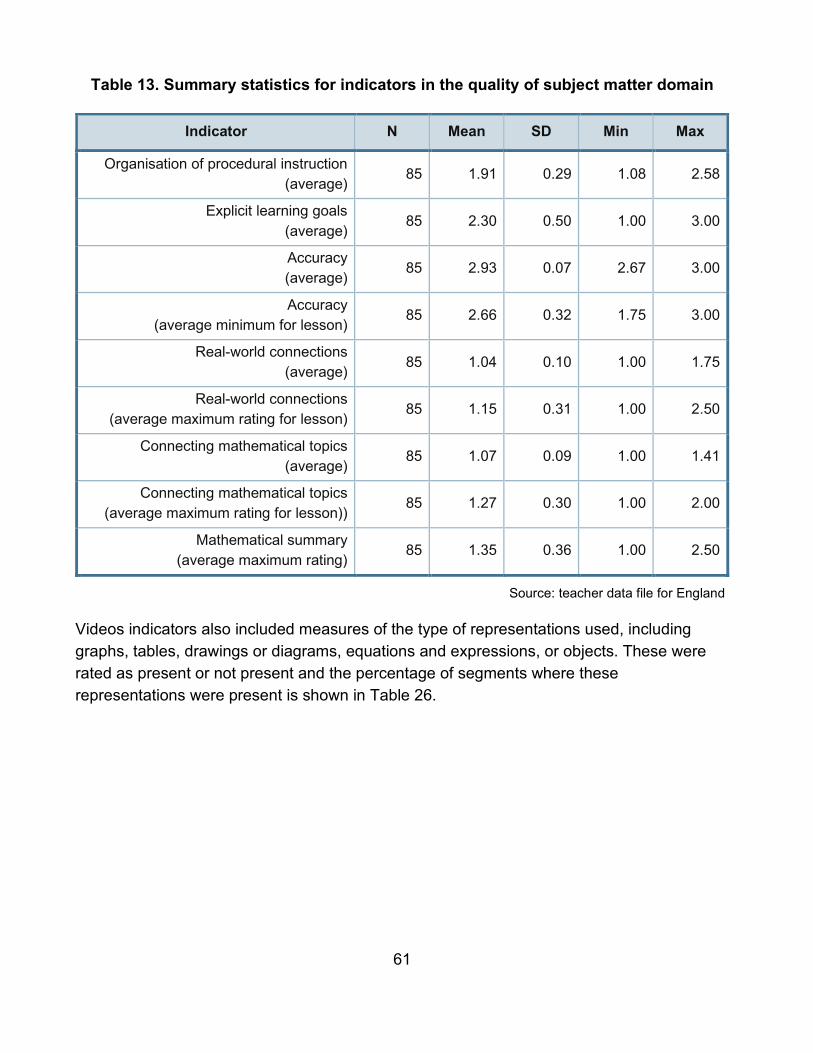
61
Table 13. Summary statistics for indicators in the quality of subject matter domain
Indicator N Mean SD Min Max
Organisation of procedural instruction (average) 85 1.91 0.29 1.08 2.58
Explicit learning goals (average) 85 2.30 0.50 1.00 3.00
Accuracy (average) 85 2.93 0.07 2.67 3.00
Accuracy (average minimum for lesson) 85 2.66 0.32 1.75 3.00
Real-world connections (average) 85 1.04 0.10 1.00 1.75
Real-world connections (average maximum rating for lesson)
85 1.15 0.31 1.00 2.50
Connecting mathematical topics (average) 85 1.07 0.09 1.00 1.41
Connecting mathematical topics (average maximum rating for lesson)) 85 1.27 0.30 1.00 2.00
Mathematical summary (average maximum rating) 85 1.35 0.36 1.00 2.50
Source: teacher data file for England
Videos indicators also included measures of the type of representations used, including graphs, tables, drawings or diagrams, equations and expressions, or objects. These were rated as present or not present and the percentage of segments where these representations were present is shown in Table 26.

62
Table 14. Summary statistics for indicators measuring the use of representations
Indicator N Mean SD Min Max
Types of Representations: Objects
(average percentage of segments present)
85 2.44 7.48 0.00 41.67
Types of Representations: Graphs
(average percentage of segments present)
85 22.46 21.67 0.00 70.00
Types of Representations: Tables
(average percentage of segments present)
85 16.15 20.39 0.00 84.52
Types of Representations: Drawings
(average percentage of segments present)
85 13.56 17.10 0.00 75.00
Types of Representations: Equations
(average percentage of segments present)
85 99.11 2.57 85.71 100.00
Source: teacher data file for England
Table 27 shows the descriptives for each of the average teacher ratings for the artefact components within the quality of subject matter domain. The artefact components within this domain were accuracy of materials, explicit learning goals, addressing diverse student needs, connecting mathematical representations, explicit patterns and generalisations, and real-world connections. These artefact components were measured on a scale of 1 (lowest presence) to 3 (highest presence).

63
Table 15. Summary statistics for artefacts in the quality of subject matter domain
Artefact component N Mean SD Min Max
Accuracy 85 1.94 0.09 1.50 2.00 Addressing diverse student needs 85 1.52 0.45 1.00 2.88
Mathematical connections 85 2.14 0.50 1.00 3.00 Explicit learning goals 85 2.29 0.45 1.00 3.00
Explicit patterns and generalisations 85 1.32 0.24 1.00 2.00
Real-world connections 85 1.31 0.35 1.00 2.38
Source: teacher data file for England
The student cognitive engagement in subject matter domain Table 28 shows the descriptives for each of the average teacher ratings for the video components within the student cognitive engagement in subject matter domain. The video components within this domain were engagement in cognitively demanding subject matter, multiple approaches, and understanding of subject matter and were measured on a scale of 1 (lowest presence or quality) to 4 (highest presence or quality). These were derived by taking the average rating over raters, then over lessons, then over teacher.
Table 16. Summary statistics for components in the student cognitive engagement in subject matter domain
Component N Mean SD Min Max
Engagement in cognitively demanding subject matter 85 1.96 0.42 1.25 3.50
Multiple approaches 85 1.46 0.43 1.00 3.17 Understanding of subject
matter 85 2.18 0.41 1.50 3.44
Average overall domain rating 85 1.86 0.37 1.25 3.33
Source: teacher data file for England
Table 29 shows the frequencies across the 1 to 4 scale for the average teacher ratings for the video components within the student cognitive engagement in subject matter domain.

64
Table 17. Frequencies for components in the student cognitive engagement in subject matter domain
Component Frequency of scores below
1.5
Frequency of scores
between 1.5 and 2.5
Frequency of scores
between 2.5 and 3.5
Frequency of scores
between 3.5 and 4
Engagement in cognitively
demanding subject matter
8 70 6 1
Multiple approaches 51 31 3 0 Understanding of
subject matter 0 68 17 0
Average overall domain rating 11 71 3 0
Source: teacher data file for England
Table 30 shows the descriptives for each of the average teacher ratings for the video indicators within the student cognitive engagement in subject matter domain. The video indicators within this domain were metacognition, repetitive use opportunities, and the use of technology for understanding. Metacognition and repetitive use opportunities were measured on a scale of 1 (lowest presence or quality) to 3 (highest presence or quality). Technology for understanding was measured on a scale of 1 (lowest presence or quality) to 4 (highest presence or quality). The indicators also measured software use for learning which was rated as present or not present.

65
Table 18. Summary statistics for indicators in the student cognitive engagement in subject matter domain
Indicator N Mean SD Min Max
Software for learning (average maximum rating) 85 1.08 0.18 1.00 2.00
Metacognition (average rating) 85 1.06 0.10 1.00 1.46
Metacognition (average maximum rating
for lesson) 85 1.29 0.42 1.00 2.75
Repetitive use opportunities (average maximum rating
for lesson) 85 2.96 0.14 2.00 3.00
Technology for understanding
(average rating when present)
85 2.10 0.18 2.00 2.86
Technology for understanding
(percentage of segments present)
85 77.05 17.73 16.67 100.00
Source: teacher data file for England
The video indicators also measured the presence of classroom technology and student technology. Each of these was coded as present or not present. The figures in Table 31 represent the average percentage of segments in which the technology was present.

66
Table 19. Summary statistics for indicators measuring the presence of technology
Indicator N Mean SD Min Max
Class tech - overhead projector 85 3.50 9.80 0.00 58.33 Class tech - smartboard 85 84.91 19.42 10.71 100.00
Class tech - graphing calculator 85 0.00 0.00 0.00 0.00 Class tech - non-graphing calculator 85 4.07 6.55 0.00 25.00
Class tech - computer laptop 85 0.41 2.91 0.00 25.00 Class tech - television 85 0.00 0.00 0.00 0.00
Class tech - tablet 85 0.49 2.69 0.00 20.00 Class tech - cell phone 85 0.00 0.00 0.00 0.00
Class tech - none 85 11.41 14.84 0.00 70.83 Student tech - graphing calculator 85 0.60 2.82 0.00 17.86
Student tech - non-graphing calculator 85 23.02 18.72 0.00 78.57
Student tech - computer 85 1.19 6.93 0.00 50.00 Student tech - tablet 85 2.05 7.38 0.00 40.00
Student tech - cell phone 85 0.37 1.82 0.00 12.50 Student tech - none 85 73.76 19.51 21.43 100.00
Source: teacher data file for England
Table 32 shows the descriptives for each of the average teacher ratings for the artefact components within the student cognitive engagement in subject matter domain. The artefact components within this domain were using multiple mathematical methods, opportunities to practice a skill or procedure, and technology for understanding. These artefact components were measured on a scale of 1 (lowest presence) to 3 (highest presence).

67
Table 20. Summary statistics for artefacts in the student cognitive engagement in subject matter domain
Artefact component N Mean SD Min Max
Multiple mathematical approaches 85 1.40 0.33 1.00 2.38 Opportunities for practice 85 2.84 0.22 2.00 3.00
Technology for understanding 85 1.16 0.23 1.00 2.25
Source: teacher data file for England
The assessment of and responses to student understanding domain Table 33 shows the descriptives for each of the average teacher ratings for the video components within the assessment of and responses to student understanding domain. The video components within this domain were eliciting student feedback, teacher feedback, and aligning instruction and were measured on a scale of 1 (lowest presence or quality) to 4 (highest presence or quality). These were derived by taking the average rating over raters, then over lessons, then over teacher.
Table 21. Summary statistics for components in the assessment of and responses to student understanding domain
Component N Mean SD Min Max
Eliciting student feedback 85 2.83 0.26 2.25 3.52 Teacher feedback 85 2.01 0.32 1.38 3.23
Aligning instruction 85 3.25 0.33 2.00 4.00 Average overall domain
rating 85 2.70 0.24 2.08 3.50
Source: teacher data file for England
Table 34 shows the frequencies across the 1 to 4 scale for the average teacher ratings for the video components within the assessment of and responses to student understanding domain.

68
Table 22. Frequencies for components in the assessment of and responses to student understanding domain
Component Frequency of scores below
1.5
Frequency of scores between
1.5 and 2.5
Frequency of scores between
2.5 and 3.5
Frequency of scores between
3.5 and 4
Eliciting student feedback 0 6 77 2
Teacher feedback 2 76 7 0 Aligning instruction 0 2 62 21
Average overall domain rating 0 16 68 1
Source: teacher data file for England
Table 35 shows the descriptives for each of the average teacher ratings for the artefact components within the assessment of and responses to student understanding domain. The artefact component within this domain was encourage student self-evaluation. This artefact component was measured on a scale of 1 (lowest presence) to 3 (highest presence).
Table 23. Summary statistics for artefacts in the assessment of and responses to student understanding domain
Artefact component N Mean SD Min p10th p20th p50th p80th p90th Max
Encourage student
self-evaluation 85 1.15 0.29 1.00 1.00 1.00 1.00 1.25 1.50 2.50
Source: teacher data file for England
Opportunity to learn The teachers participating in the TALIS Video Study were asked to keep a log of the subtopics they taught during the topic that included quadratic equations. This log included whether the subtopic was a major focus of the lesson(s) or a minor focus. These lessons included the ones for which videos and artefacts were collected as well as all the other lessons within the topic.

69
The subtopics teachers were asked to consider in the TALIS Video Study included:
• Solving quadratic equations by completing the square (adding or subtracting a constant from both sides so that one side is a squared linear term and the other is a real number)
• Solving quadratic equations by factorising (decomposing the complete or incomplete quadratic into the product of two linear terms)
• Deriving the quadratic formula or solving quadratic equations by using the quadratic formula (substituting the values of a, b, and c into the formula and computing the values of x)
• Solving quadratic equations by finding roots in a graphical representation (graphing the equation and identifying the values of x where the graph intersects the y-axis, that is, when the y value is zero)
• Factorising expressions (engaging in algebraic manipulations to simplify higher order polynomials whether or not a quadratic equation is solved in the process) (Note: this does not include multiplying linear terms to yield quadratic or higher-order expressions or polynomials)
• Discussing different cases of ax2+bx+c depending on values of a, b, and c (for example, which strategy is best for solving different complete and incomplete quadratic equations)
• Exploring quadratic functions (for example, defining quadratic functions, or plotting and transforming the graphs of quadratic functions)
• Applying mathematics to real-life situations (Note: questions related to properties of geometric shapes are not considered to be real life situations unless the shapes occur in the form of fences, paths, enclosures, etc.)
Following completion of the topic unit, participating students completed post-questionnaires where they indicated their perceptions of opportunity to learn experienced throughout the unit, identifying whether they had experienced learning opportunities to develop specific content knowledge across four relevant content subtopics. These constituent subtopics concerned:
• Opportunities to use quadratic functions

70
• Opportunities to learn algebraic operations
• Opportunities to learn reasoning about different types of quadratic equations
• Opportunities to apply quadratic equations to real-world contexts
The extent to which participating teachers supported opportunities for students to learn across these content subtopics was deduced based on the extent to which lessons (as reported in Teacher Logs) covered and emphasised relevant content, as well as the extent to which artefacts collected during the TALIS Video Study were determined to support learning opportunities across subtopics.
Descriptive statistics concerning lesson length were calculated based on Teacher Log reports of unit lesson length. Descriptive statistics concerning total unit instructional time for each class, as recorded in Teacher Logs, were calculated based on the aggregate of instructional time across lessons recorded by each teacher. Where the length of one lesson was missing from the Teacher Log, the lesson duration was replaced with the median length of the other lessons.
Table 24. Lesson timings across the topic
Measure Values
Average lesson length (mins) 60.65 Maximum lesson length (mins) 120 Minimum lesson length (mins) 30 Maximum number of lessons 16 Minimum number of lessons 4 Average number of lessons 7 Average total teaching time (hours) 7.56 Maximum total teaching time (hours) 16.00 Minimum total teaching time (hours) 4.00
Source: Teacher Logs data file for England
The proportion of lessons for which teachers reported minor or major focus on respective quadratic equation solution methods (completing the square, factorising, quadratic formula, and finding roots in a graphical representation) was calculated in order to identify the relative degree of teacher focus on each solution method over the course of the unit.

71
Table 25. OTL solution strategies from teacher logs
Subtopic Minor focus Major focus Total proportion
Solving quadratic equations by completing the square 11% 19% 30%
Solving quadratic equations by factorising 27% 36% 64% Solving quadratic equations by quadratic formula 11% 20% 30% Solving quadratic equations by finding roots in a graphical representation 24% 14% 38%
Source: Teacher Logs data file for England
The proportion of lessons for which teachers reported minor or major focus on respective subtopics (handling algebraic expressions, binomial formulae, introducing one form of a quadratic equation, discussing different cases depending on the values of the coefficients, quadratic functions, and real-world applications) was calculated in order to identify the relative degree of teacher focus on each solution method over the course of the unit.
Table 26. OTL content emphasis from Teacher Logs
Subtopic Minor focus Major focus Total proportion
Handling algebraic expressions 43% 30% 73% Binomial formulae 14% 4% 18% Introducing one form of a quadratic equation 32% 18% 50%
Discussing different cases depending on the values of the coefficients 28% 14% 42%
Quadratic functions 17% 11% 29% Real-world applications 12% 6% 17%
Source: Teacher Logs data file for England
The derived variables from the Teacher Log were calculated using the weighted sum of subtopic coverage ratings, with a weight of 1 if the subtopic was covered fully, a weight of 0.5 if the subtopic was covered to a minor extent, and a weight of 0 if the subtopic was not covered at all.

72
Possible differences in unit instructional time based on school location (urban/rural) were investigated. Non-parametric tests (Kruskal-Wallis tests followed by Wilcoxon rank sum tests with Benjamini and Hochberg correction for pairwise comparisons) were utilised due to heterogeneity of data and outliers. No significant differences in instructional time based on school location were identified. The results of these tests can be found in the accompanying data tables.
The association between student-perceived OTL, teacher-reported provision of OTL, and artefact-rated support of OTL across respective subtopics was examined through correlation analysis. Examination of the distribution of subtopic OTL variable revealed non-normal distributions throughout (primarily due to evidence of discrete levels) and, consequently, a linear relationship could not be reasonably inferred. Therefore, variables were treated as ordinal, with Kendall’s Tau correlation coefficient preferred as a method of calculation to Pearson’s correlation coefficient. Whilst Spearman’s Rho (or rank) correlation coefficient was also a valid alternative, Kendall’s Tau was preferred for reasons of interpretability.
Modelling Linear regression models were used:
• to investigate associations between student and class characteristics and student outcomes (post-test scores, general self-efficacy in mathematics with the current teacher, and personal interest in mathematics with the current teacher), and
• to investigate associations between teaching practices (based on video component domains) and the same three student outcomes, before and after accounting for student and class characteristics, by including these in the same regression models, and before and after accounting for opportunity to learn as reported by students.
For the analyses included in Chapter 7 of the England country report, only complete cases were included. The strategy (used by the international consortium, see the OECD technical report27) of including binary indicators of missing values alongside imputation of 0 for all missing values for each predictor was not employed, as this strategy is mainly appropriate for imputation of “incorrect” values and otherwise differentially affects results according to how a given predictor variable was coded. For example, imputation of zero for missing values for a categorical variable that already includes 0 sets all missing values to that category (for example, Female for gender); for a continuous variable (for example, pre-test score), imputation of zero for missing values introduces what may be seen as an implausibly
27 OECD (2020)

73
low estimate for relevant cases. An analysis of complete cases may also introduce some bias, but allows for inferences to be drawn based on actual responses.
Due to the nested nature of the sample, with students clustered within classrooms, cluster-robust standard errors were used. This was done to account for clustering at the class level rather than the school level to avoid assuming similarity across classes within schools.
Predictors at the student level included student scores on pre-unit measures corresponding to each outcome (pre-test score, general self-efficacy with the previous teacher, or personal interest in mathematics with the previous teacher), gender (binary, with Male as the reference group), first- or second-generation immigration status (with “not” as the reference group), year group (with Year 10 as the reference group), home possessions (a continuous, IRT-derived variable), language spoken at home (binary indicator of English or other, with English as the reference group) and parental education (GCSE or lower, A-level, non-University tertiary, University, with GCSE or lower as the reference group).
Predictors at the class level included class average pre-unit measures corresponding to each outcome (pre-test score, general self-efficacy with the previous teacher, or personal interest in mathematics with the previous teacher), class proportions of pupils by gender and migration status, class average parental education, and class average home possessions. Note that only class-level variables computed by the international consortium were used, so no class proportion home language variable was computed. Class average pre-unit measures were tested as continuous variables as well as in quartiles (Lowest, Low, High, and Highest, with Highest as the reference group) to allow for nonlinear relationships.
Measures of teaching practice were based on video component observation scores averaged across raters, segments, videos and then components within a given domain (as listed below) to produce teacher-level domain scores. Three versions of each model concerning teaching practices were run. One version used a 3-domain structure (classroom management, social-emotional support, and instruction). Components included in each of these domains are listed in Chapters 3 to 8 of the England country report. The second version used a 4-domain structure, with classroom management and social-emotional support (defined the same way as for the 3-domain model), discourse and assessment (including components relevant to discourse and to assessment of and response to student understanding), and mathematics instruction (including components relevant to quality of subject matter and cognitive engagement). The third version used all six original domains as defined in the video component rating instrument (classroom management, social-emotional support, discourse, quality of subject matter, cognitive engagement, and assessment of and response to student understanding).

74
All regression models were checked to ensure that relevant assumptions (for example, normality and heteroskedasticity of residuals, lack of influential outliers) were met or at least not substantially violated.
Groups of variables were entered as follows:
1. Teaching practices based on video domains (for models concerning teaching practices only)
2. Pre-unit measure corresponding to the relevant post-unit outcome (student attainment on the post-test, general self-efficacy in mathematics, or personal interest in mathematics)
3. Student characteristics
4. Class characteristics
5. Opportunity to learn (based on items from the student questionnaires) for subtopics including opportunities to use quadratic functions, opportunities to learn algebraic operations, opportunities to learn reasoning about different types of quadratic equations, and opportunities to apply quadratic equations to real-world contexts
6. Interactions between student and/or class characteristics (for example, class average pre-test score and individual pre-test score)
Tables for the regression analysis can be found in in the accompanying data tables.
Relationships between teaching practices were examined using correlational analysis between video component domains, and between different domains for each type of rating data (video components, video indicators, and artefacts). Pearson’s correlation coefficients were computed between video components in different domains. Spearman’s correlation coefficients were computed for other analyses (for example, between video indicators and artefact ratings in different domains) as the combinations of variables included in each correlational analysis did not collectively meet the assumptions for Pearson’s correlations (for example, linearity). Correlation coefficients can be found in in the accompanying data tables.

75
References Ingram, J. & Lindorff, A. (2020). TALIS Video Study National Report, London, United
Kingdom: DfE
OECD (2020b). Global Teaching InSights Technical Report. Paris: OECD

76
Appendices
Appendix 1 Pilot for TALIS Video Study Full details of the protocols to be followed by each country for the pilot video study were provided by the ISC.
Purpose
The aim of the pilot was to allow countries to test the planned data collection and videography procedures. Additionally, the pilot allowed the ISC to test the reliability and validity of the items included in the student tests and both teacher and student pre- and post-unit questionnaires. The pilot also offered the opportunity to finalise the data storage, transfer and security plans at national and international levels. Finally, the pilot provided a set of videos and artefacts that could be used to refine the observation codes and develop training materials for raters. In England, the pilot ran from January to June 2017 and overlapped with recruitment of schools for the main study.
Instruments piloted
All questionnaire instruments were piloted. In the case of both the pre- and post-unit tests for students, two versions were piloted, version A and version B (four versions in total). Each version had 31 items with the final 15 items being identical. The purpose of the pilot was to gauge how well the items functioned with a view to producing a final version of both tests.
Adaptation of instruments for the pilot
The tests and questionnaires were supplied to all countries in English as both a Microsoft Word document and a PDF file in advance of data collection beginning. In England, no translation of instruments was required; however, adaptations appropriate to the country context were. All adaptations were recorded in a National Adaptation Form (NAF) following the procedural guidelines provided by the consortium. To ensure international comparability, countries were provided with rules outlining what kinds of adaptations to the international instruments were permissible. Certain adaptations were not allowed, such as changing the question stem and collapsing or removing categories.
The England team received a copy of each instrument prior to the pilot phase of the study, highlighting mandatory adaptations that were required (e.g. National Study Centre contact

77
details), text that could be deleted if not relevant to the local context, and words that needed to be replaced with the country-appropriate term.
Any items or terms that had been adapted from PISA or TALIS were highlighted by the ISC, as adaptations made for the TALIS Video Study had to mirror these exactly. Each item was cross-referenced against the versions of the respective PISA and TALIS questionnaire used in England. All adaptations made at country level were submitted to the ISC for approval.
Data collection procedures for the pilot
The pilot study typically followed the data collection protocols for the main study although there were specific deviations defined by the ISC. The main differences are summarised below.
• At least 100 students needed to complete each of the pre- and post-unit tests and questionnaires. The same cohort of students had to complete either the pre-unit test and questionnaire or the post-unit test and questionnaire. It was not necessary for each participating class to complete all four instruments, although in England three classes of students did so, in order that the procedures for the main study could be fully tested. Once recruited, schools were typically allocated to either a “pre” or “post” slot depending on when they had or were planning to teach quadratic equations.
• Given there were two versions of both the pre- and post-unit test, each country needed to ensure at least 100 students completed each version.
• There were no restrictions relating to the timing of the administration of the pre- and post-unit instruments, so they did not have to be completed within two weeks of the unit starting or ending as per the main study requirements.
• The students piloting the tests and questionnaires did not have to be the students of the teachers being video-recorded in the pilot. However, in England the classes of all teachers videoed completed either pre- or post-tests and questionnaires, or both.
• Lessons from 12 mathematics teachers had to be filmed during the pilot. While the videoed lessons were to be of mathematics teaching, the topic covered did not need to be quadratic equations. However, it was preferable in order to support the ISC’s preparation for the training of raters, which necessitated having related clips available from each country. In England, all videoed lessons were of quadratic equations.

78
• End of unit tests were collected only from teachers who were teaching quadratic equations during data collection.
• All 12 lesson videos had to be subtitled and transcribed.
• All unique identifiers generated for schools, teachers and students had to be preceded by a “9” to differentiate it as pilot data.
• Videos and artefacts collected during the pilot were not rated. However, binary codes were entered into Microsoft Excel worksheets to test the flow of data and make sure all software and processes were working.
• Teachers only had to provide details of the sub-topics covered if they were teaching quadratic equations during the data collection period.
Recruitment of schools and teachers for the pilot
The school and teacher samples for the pilot did not need to be randomly selected; however, countries were encouraged to recruit a diverse sample (rather than a convenience sample) so as to test the recruitment processes to be used for the main study as far as possible. In order to be eligible to participate, a school should not have already taught quadratic equations to the target year groups (for England this was Years 9 and 10) and should ideally be teaching it around the time of recruitment.
Recruitment of schools in England for the pilot phase of the TALIS Video Study began in October 2016 and continued until January 2017. Schools around the country that were known to members of the National team were invited to take part in the pilot. There was an initial mailout to around 30 schools and subsequently a total of 15 teachers and 17 classes from twelve schools were recruited. One school dropped out just before the pilot began so a replacement was found.
Getting schools to put forward classes other than top sets was a challenge. Teachers either believed that the study would prefer to have this group participate or they thought they could better afford the class time to participate than lower-set classes. The project team emphasised the importance of testing the instruments with students of all levels of ability. The final sample was made up of mostly higher ability classes with one lower set class and several mixed ability classes.
Some teachers were unsure of whether their classes could be considered as “pre” given they had studied some related elements of quadratic equations. The England Mathematics Expert put together a set of bullet points outlining the basic content that might have been

79
covered yet would still mean a class could be counted as not yet having studied quadratic equations.
Pilot school visits
School visits for data collection and videography were booked by the Project Co-ordinator. Test administration was carried out by the NPM, the Project Co-ordinator and two test administrators recruited and trained specially to work on the project. Administration of tests and questionnaires typically took up two separate lessons in the pilot. However, the fact that all but three classes were doing either a pre- or a post-test made this less of a burden on schools.
Videography and artefact collection in the pilot
Only one lesson was filmed for each of the 12 teachers during the pilot. Videographers were required to follow the procedures for filming that were to be used in the main study. After the first two lessons had been filmed, footage was submitted to the consortium via a secure server for review. A meeting was then held with the England team to provide feedback on any issues that they had identified with filming – for example, the challenge of camera placement given the variety in layout of classrooms in England, the appropriateness of zooming, sound quality, and so on. The Videography Project Manager led on feeding back any comments or concerns to the ISC’s videography team with the ultimate aim of ensuring that all processes were being followed correctly. The process of reviewing videos and the ISC providing feedback to the country team continued throughout the pilot as necessary.
Videographers gathered any artefacts available electronically while in the classroom, and photographed any hard copy resources used. The central team then followed up with teachers and requested any outstanding/missing artefacts before labelling of artefacts began using ISC protocols.
Data entry and uploading of pilot data
For all test and questionnaire instruments, data was entered into spreadsheets provided by the ISC by a team of trained data entry personnel.
Twenty per cent of all data was double entered as part of the quality checks carried out on the data. The primary data entry and double data entry were then compared in order to calculate the error rates. Where the error rate was above 1% for the teacher questionnaires, the data had to be checked and corrected. Further range checks were carried out on variables prior to the spreadsheets being uploaded to the consortium using a secure server.

80
Outcomes of the pilot
Instruments
Further details of the rationale for removing questions and items from both the tests and questionnaires following the pilot can be found in the OECD Technical Report28.
Student tests
Following the pilot, the number of questions in the first student test which was administered before the quadratic equations unit (pre-test) was reduced to 30. The second test, taken after the quadratic equations unit (post-test), was reduced to 25 questions.
Student questionnaires
Following the pilot, items were removed from both student questionnaires. A total of 235 items were removed from the student pre-questionnaire, with the number of questions reducing from 38 to 33. Similarly, 17 items were removed from the student post-questionnaire, although there was no change in the total number of questions.
Teacher questionnaires
Following the pilot, 225 items were removed from the teacher pre-questionnaire and 143 items from the teacher post-questionnaire. The pilot version of the teacher pre-questionnaire included 29 questions (excluding country-specific questions) which was then reduced to 22 for the main study. The pilot version of the teacher post-questionnaire included 24 questions (again, not including the country-specific questions) which was subsequently reduced to 23 following the pilot. Country-specific questions remained unchanged.
In light of feedback from the participating jurisdictions, the format of the table used to gather information on subtopics was amended so that all subtopics were listed with an option for the teachers to choose one of three levels of coverage for each.
General
While the pilot provided a valuable opportunity to test the data collection processes, it also allowed the England team to trial strategies for the management of data collection and communication with schools and teachers. This led to:
28 OECD (2020)

81
• The preparation of both a Study Lead Guide and a Teacher Guide providing detailed breakdown of the steps involved in data collection for the main study and the role of the teacher.
• A suite of standard emails prepared for communication with teachers at key points in the data collection process.
• Clear guidance for study leads/teachers on the basic content relating to quadratic equations that might have been covered yet would still mean a class could be put forward for the study.

82
Appendix 2 Consent Forms
Parental consent form for OECD Video Study I, the undersigned [FULL NAME], parent or legal guardian of [FULL NAME OF CHILD] have read the information sheet provided by the Organisation for Economic Co-operation and Development (OECD) on the Video Study and understand its content. I have decided that my child may participate in this voluntary study and have therefore agreed to sign this consent form. I hereby authorise the OECD, RAND Corporation and Education Development Trust to (please tick yes or no):
- record a video of my child in a classroom for two mathematics lessons and fully dispose of still or moving images of my child as well as audio elements of which my child is the source (the video will be of the whole class and will only record side-view of the students)
Yes No
- collect my child’s responses to a questionnaire about his/her learning experiences which will be administered both before and after the recorded lessons (the data will be anonymised and used only for research purposes)
Yes No
- collect my child’s responses to a short mathematics test which will be adminis-tered both before and after the recorded lesson (the results will be anonymised and used only for research purposes)
Yes No
- fully dispose of still or moving images of my child as well as audio elements of which my child is the source.
I understand that the video and other materials collected during this study will not be made public, and will be used for research or training purposes only. They will be transcribed by the Education Development Trust into anonymised coded data files, which will then be analysed by the international consortium in charge of reporting on the results of the study. While the results of the study will be made public in reports, neither the teachers, nor the students, nor the schools nor any school personnel will be identified in any report of the results of the study.
I understand that these images and audio elements are intended to be reproduced, displayed and/or adapted, in whole or in part, for the purposes of an OECD Video Study aiming at improving understanding on the relationship between dif-ferent teaching practices and student learning. I understand that neither I nor my child will have any intellectual property rights in the video study or its supporting materials.
I understand that my child’s participation in the OECD Video Study is entirely voluntary and that s/he can withdraw from this study at any time without giving a reason and without any impact on his or her school record. I have explained to my child that this is the case.
I understand that the videos and other materials will be processed in accordance with the OECD principles governing computerised personal data processing. In particular, I understand that the recordings and other material will be treated in confidence and stored and transferred using secure methods. I understand that while children’s and teachers’ faces will be visible and their voices audible, all other personal information identifying my child, his/her teacher and school will be kept confidential. In a report about this study, the study results will be described in an aggregated manner so that my child’s work cannot be identified. I understand that my child’s face and voice may reveal sensitive personal information, for example regarding his or her race, religion and physical condition. I understand that video recordings and other study materials will be securely transferred and stored in locations outside of the European Economic Area, including the United States, where RAND and other consortium members are based.
I grant this authorisation on a worldwide, free of charge basis, without any time limit.

83
I note that I have, at any given time, the right to request, in writing to RAND Corporation, the OECD, the Department for Education (DfE) or its contractors the correction or deletion of the data referred to above concerning my child in any video which may have been produced.
I understand that I am free to contact the Education Development Trust at [email protected], DfE at [email protected], or the OECD and [email protected] regarding any questions I may have.
Signature of Parent or Guardian: …………………………………… Name of Child: ……………………………………
Date: ……………………………………

84
Teacher consent form for OECD Video Study I, the undersigned, [FULL NAME], have read the information sheet provided by the Organisation for Economic Co-opera-tion and Development (the OECD) on the Video Study and understand its content.
I have decided to participate in the Video Study and have therefore agreed to sign this consent form.
I hereby authorise the OECD, RAND Corporation and Education Development Trust to:
- record a video of my classroom for two mathematics lessons; and
- fully dispose of still or moving images of myself, as well as audio elements of which I am the source.
I understand that the videos and materials collected will not be made public, and will be used for research or training purposes only. They will be transcribed by Education Development Trust into anonymised coded data files, which will then be analysed by the international consortium in charge of reporting on the results of the study. While the results of the study will be made public in reports, neither the teachers, nor the students, nor the schools nor any school personnel will be identified in any report of the results of the study.
I understand that these images and audio elements are intended to be reproduced, displayed and/or adapted, in whole or in part for the purposes of an OECD Video Study aiming at improving understanding how different teaching practices relate to student learning. I understand that I will not have any intellectual property rights in the Video Study or its sup-porting materials.
I also agree to complete two questionnaires on my background and education, my pedagogical and mathematical beliefs, my motivation and perception of the school environment and selected class, and to submit general information on plan-ning, organisation and conduct of the lessons to the videographer, all of which will be scanned and uploaded on to RAND’s secure server. I understand that at the end of each questionnaire there are questions that have been included by the Department for Education (DfE) with a view to gaining insight into the professional background of maths teachers in Eng-land and their experience of Continuing Professional Development (CPD). I authorise the OECD, the RAND Corporation and DfE or its contractors to use this information for the Video Study, as well as for future research projects.
I understand that my participation in the Video Study is entirely voluntary and that I can withdraw from the study at any time without giving a reason and without any impact on my working conditions or career.
I understand that the recordings and other materials will be processed in accordance with the OECD principles governing computerised personal data processing. In particular, I understand that the recordings and other material will be treated in confidence and stored and transferred using secure methods. I understand that while children’s and teachers’ faces will be visible and their voices audible, all other personal information identifying me, my students, and my school will be kept confidential. In a report about this study, the study results will be described in an aggregated manner so that I cannot be identified. I understand that my face and voice may reveal sensitive personal information, for example regarding my race, religion and physical condition. I understand that video recordings and other study materials will be securely transferred and stored in locations outside of the European Economic Area, including the United States, where RAND and other con-sortium members are based.
I grant this authorisation on a worldwide, free of charge basis, without any time limit.
I note that I have, at any given time, the right to request, in writing to the OECD, the RAND Corporation, or DfE or its contractors (Education Development Trust and Oxford University), the correction or deletion of the data referred to above in any video or data which may have been produced.

85
I understand that I am free to contact the Education Development Trust at [email protected], DfE at [email protected], the international research team at [email protected] or the OECD at [email protected] regarding any questions I may have.
Signature of Teacher: ……………… Name: …………………………………… Date: ……………………………………

© Department for Education 2020
Reference: DFE-RR1069
ISBN: 978-1-83870-211-3
For any enquiries regarding this publication, contact us at: [email protected] or www.education.gov.uk/contactus
This document is available for download at www.gov.uk/government/publications