table of contents of contents introduction 5 section 1: crashes involving a motor vehicle and a...
TRANSCRIPT


Table of Contents
Introduction 5
Section 1: Crashes Involving a Motor Vehicle and a Train 7
Section 2: Motor Vehicle Crashes Occurring at a Rail Grade Crossing 15
Section 3: Combination of Data Presented in the First Two Sections 21
Figure 1: Rail Grade Crossings and Train Crashes: 2003-2007 27 Section 4: County Information 2003-2007 29
Section 5: Metropolitan Effects on Crash Totals 33
Section 6: Considerations for Further Research 37
3

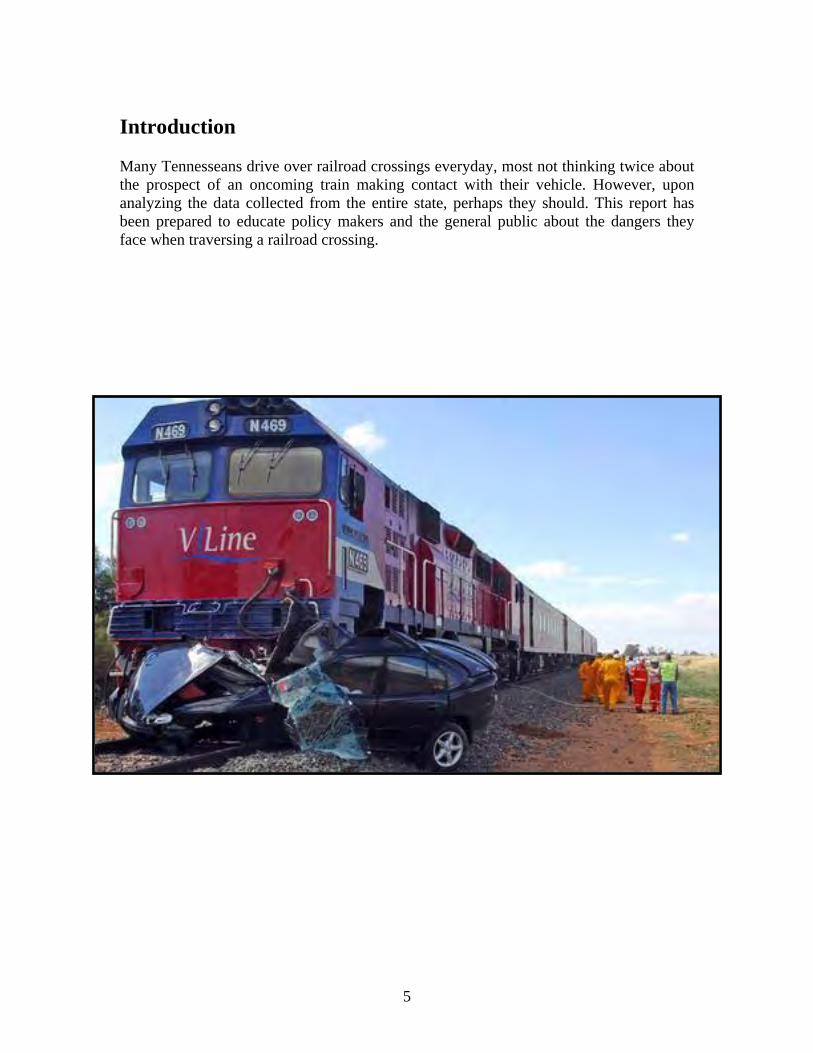
Introduction
Many Tennesseans drive over railroad crossings everyday, most not thinking twice about the prospect of an oncoming train making contact with their vehicle. However, upon analyzing the data collected from the entire state, perhaps they should. This report has been prepared to educate policy makers and the general public about the dangers they face when traversing a railroad crossing.
5


Section 1: Crashes Involving a Motor Vehicle and a Train This section deals with collisions of motor vehicles and trains. More specifically, it reflects the data collected in Tennessee Uniform Traffic Crash Reports that indicate the most harmful event of the crash as a collision with a railway train. These reports are submitted to the Department of Safety from law enforcement agencies throughout the state. The table below illustrates the dangers faced at Tennessee railroad crossings. Numbers in the fatal column represent the number of crashes that had at least one traffic death. The injury column shows the number of crashes that involved at least one traffic injury. The property damage column represents the number of crashes where there were no deaths or injuries, but damage to at least one vehicle exceeded 400 dollars.
Traffic Crashes Involving Collision with a Train Year Fatal Injury Property Damage >$400 Total 2003 7 24 43 74 2004 4 18 32 54 2005 4 20 24 48 2006 5 13 21 39 2007 1 14 14 29 Total 21 89 134 244
The graph below shows train crash data for the last five years. There is a strong downward trend in the number of injury and property damage crashes. It is important to note that 2007 data is preliminary and may increase slightly as more reports are entered into the database.
Traffic Crashes Involving Collision with a Train by Crash Type
0
5
10
15
20
25
30
35
40
45
50
2003 2004 2005 2006 2007
Year
Cras
hes
Fatal Injury Property Damage >$400
7
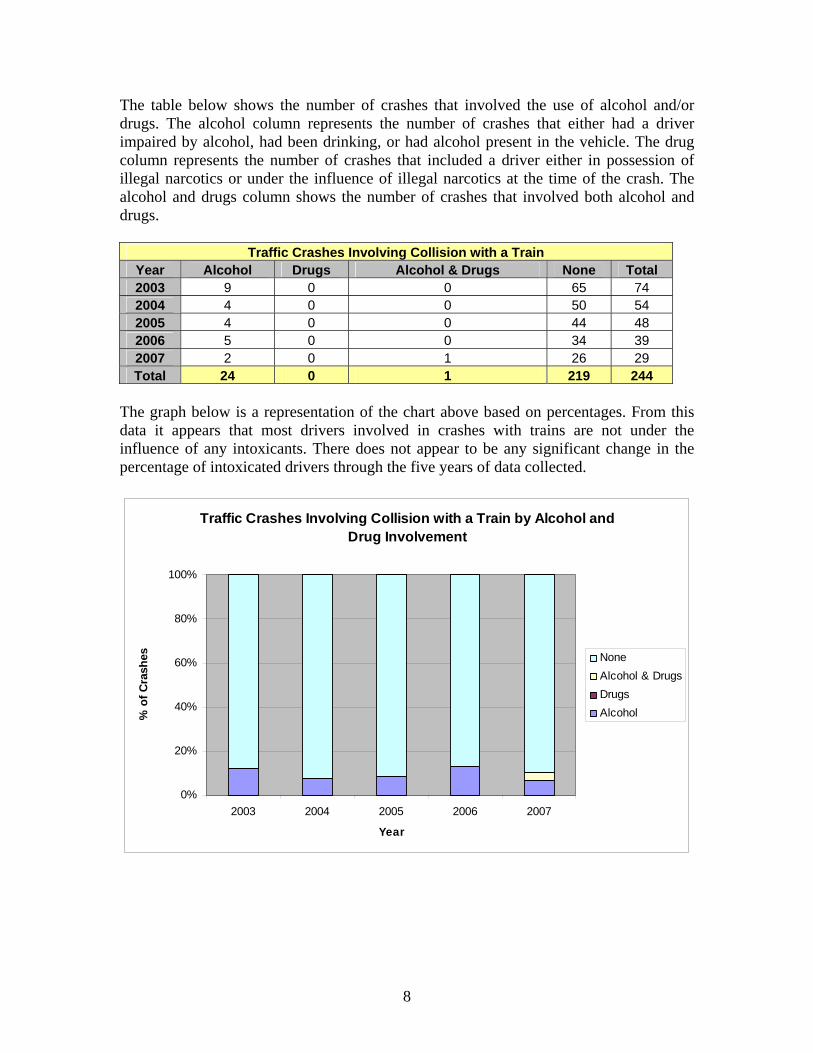
The table below shows the number of crashes that involved the use of alcohol and/or drugs. The alcohol column represents the number of crashes that either had a driver impaired by alcohol, had been drinking, or had alcohol present in the vehicle. The drug column represents the number of crashes that included a driver either in possession of illegal narcotics or under the influence of illegal narcotics at the time of the crash. The alcohol and drugs column shows the number of crashes that involved both alcohol and drugs.
Traffic Crashes Involving Collision with a Train Year Alcohol Drugs Alcohol & Drugs None Total 2003 9 0 0 65 74 2004 4 0 0 50 54 2005 4 0 0 44 48 2006 5 0 0 34 39 2007 2 0 1 26 29 Total 24 0 1 219 244
The graph below is a representation of the chart above based on percentages. From this data it appears that most drivers involved in crashes with trains are not under the influence of any intoxicants. There does not appear to be any significant change in the percentage of intoxicated drivers through the five years of data collected.
Traffic Crashes Involving Collision with a Train by Alcohol and Drug Involvement
0%
20%
40%
60%
80%
100%
2003 2004 2005 2006 2007
Year
% o
f Cra
shes None
Alcohol & DrugsDrugsAlcohol
8
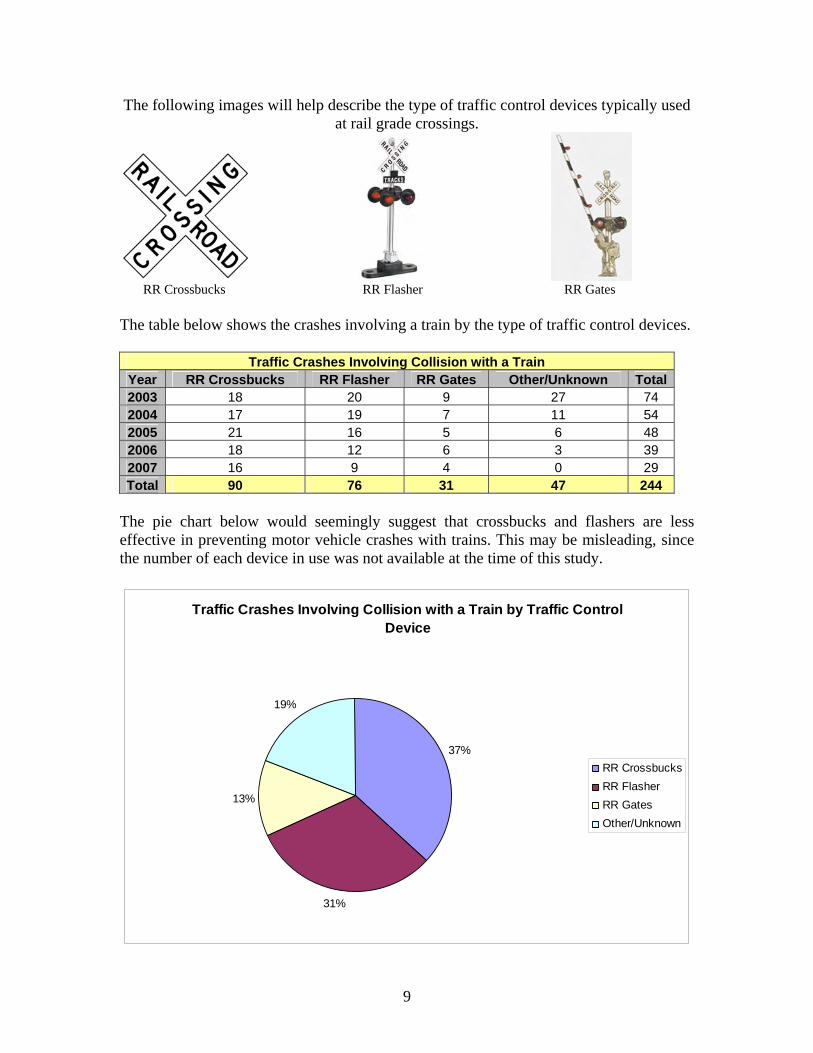
The following images will help describe the type of traffic control devices typically used at rail grade crossings.
RR Crossbucks RR Flasher RR Gates The table below shows the crashes involving a train by the type of traffic control devices.
Traffic Crashes Involving Collision with a Train Year RR Crossbucks RR Flasher RR Gates Other/Unknown Total2003 18 20 9 27 74 2004 17 19 7 11 54 2005 21 16 5 6 48 2006 18 12 6 3 39 2007 16 9 4 0 29 Total 90 76 31 47 244
The pie chart below would seemingly suggest that crossbucks and flashers are less effective in preventing motor vehicle crashes with trains. This may be misleading, since the number of each device in use was not available at the time of this study.
Traffic Crashes Involving Collision with a Train by Traffic Control Device
37%
31%
13%
19%
RR CrossbucksRR FlasherRR GatesOther/Unknown
9
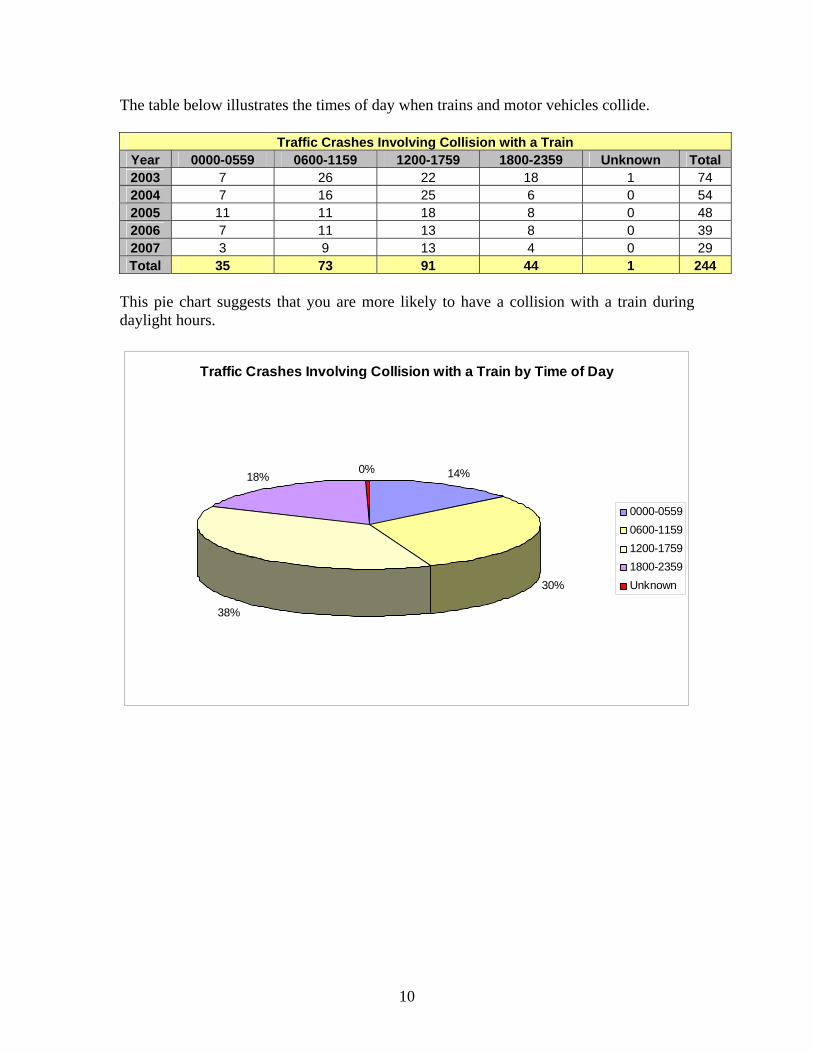
The table below illustrates the times of day when trains and motor vehicles collide.
Traffic Crashes Involving Collision with a Train Year 0000-0559 0600-1159 1200-1759 1800-2359 Unknown Total 2003 7 26 22 18 1 74 2004 7 16 25 6 0 54 2005 11 11 18 8 0 48 2006 7 11 13 8 0 39 2007 3 9 13 4 0 29 Total 35 73 91 44 1 244
This pie chart suggests that you are more likely to have a collision with a train during daylight hours.
Traffic Crashes Involving Collision with a Train by Time of Day
14%
30%
38%
18%0%
0000-05590600-11591200-17591800-2359Unknown
10
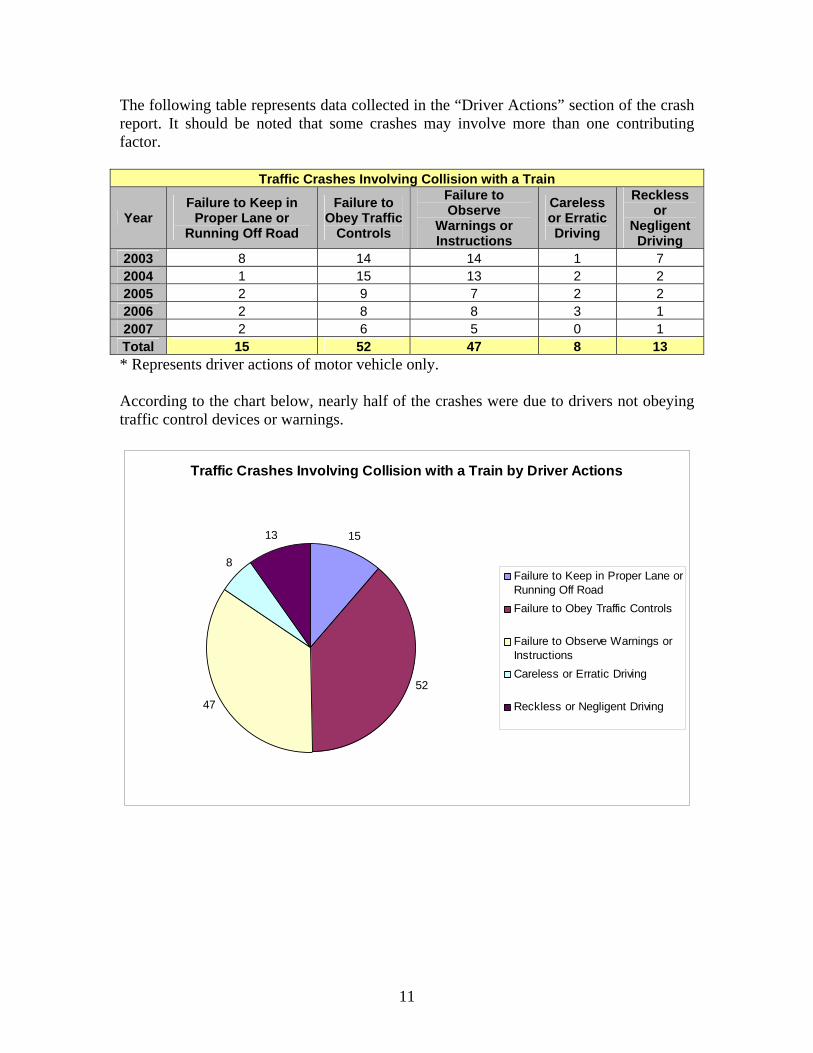
The following table represents data collected in the “Driver Actions” section of the crash report. It should be noted that some crashes may involve more than one contributing factor.
Traffic Crashes Involving Collision with a Train
Year Failure to Keep in
Proper Lane or Running Off Road
Failure to Obey Traffic
Controls
Failure to Observe
Warnings or Instructions
Careless or Erratic Driving
Reckless or
Negligent Driving
2003 8 14 14 1 7 2004 1 15 13 2 2 2005 2 9 7 2 2 2006 2 8 8 3 1 2007 2 6 5 0 1 Total 15 52 47 8 13 * Represents driver actions of motor vehicle only. According to the chart below, nearly half of the crashes were due to drivers not obeying traffic control devices or warnings.
Traffic Crashes Involving Collision with a Train by Driver Actions
15
52
47
8
13
Failure to Keep in Proper Lane orRunning Off RoadFailure to Obey Traffic Controls
Failure to Observe Warnings orInstructionsCareless or Erratic Driving
Reckless or Negligent Driving
11
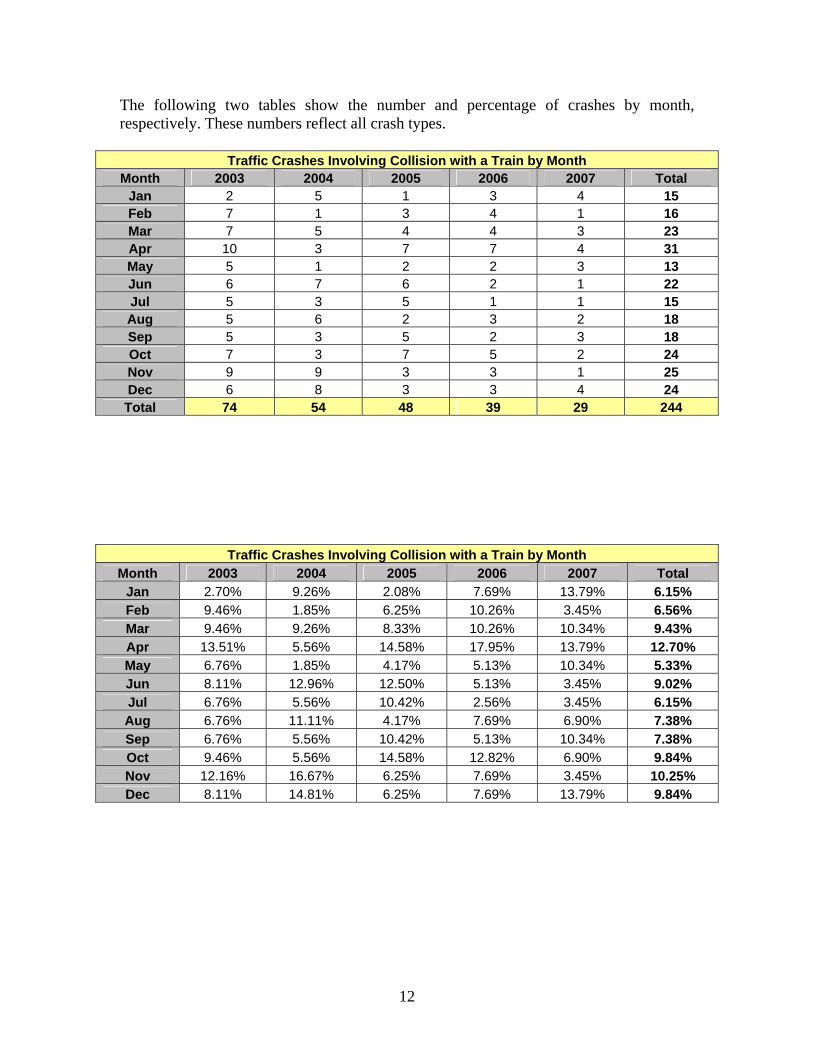
The following two tables show the number and percentage of crashes by month, respectively. These numbers reflect all crash types.
Traffic Crashes Involving Collision with a Train by Month Month 2003 2004 2005 2006 2007 Total
Jan 2 5 1 3 4 15 Feb 7 1 3 4 1 16 Mar 7 5 4 4 3 23 Apr 10 3 7 7 4 31 May 5 1 2 2 3 13 Jun 6 7 6 2 1 22 Jul 5 3 5 1 1 15 Aug 5 6 2 3 2 18 Sep 5 3 5 2 3 18 Oct 7 3 7 5 2 24 Nov 9 9 3 3 1 25 Dec 6 8 3 3 4 24 Total 74 54 48 39 29 244
Traffic Crashes Involving Collision with a Train by Month Month 2003 2004 2005 2006 2007 Total
Jan 2.70% 9.26% 2.08% 7.69% 13.79% 6.15% Feb 9.46% 1.85% 6.25% 10.26% 3.45% 6.56% Mar 9.46% 9.26% 8.33% 10.26% 10.34% 9.43% Apr 13.51% 5.56% 14.58% 17.95% 13.79% 12.70% May 6.76% 1.85% 4.17% 5.13% 10.34% 5.33% Jun 8.11% 12.96% 12.50% 5.13% 3.45% 9.02% Jul 6.76% 5.56% 10.42% 2.56% 3.45% 6.15% Aug 6.76% 11.11% 4.17% 7.69% 6.90% 7.38% Sep 6.76% 5.56% 10.42% 5.13% 10.34% 7.38% Oct 9.46% 5.56% 14.58% 12.82% 6.90% 9.84% Nov 12.16% 16.67% 6.25% 7.69% 3.45% 10.25% Dec 8.11% 14.81% 6.25% 7.69% 13.79% 9.84%
12

The following bar graph displays the percentage of crashes by month when there was a train collision (2003-2007). It is interesting to note that April has a higher than normal number of crashes, while there is a sharp drop in May. The expected percentage for each month is displayed by the red line (8.33%).
Traffic Crashes Involving Collision with a Train by Month
4.00%
5.00%
6.00%
7.00%
8.00%
9.00%
10.00%
11.00%
12.00%
13.00%
14.00%
Jan Feb Mar Apr May Jun Jul Aug Sep Oct Nov Dec
13


Section 2: Motor Vehicle Crashes Occurring at a Rail Grade Crossing This section deals with the data collected by Tennessee Uniform Traffic Crash Reports that indicate the relation to junction at the first harmful event as a rail grade crossing.. These reports can be found in a database that collects information from crashes all over the state. These crashes involved single or multiple vehicle crashes only. Please note that none of these crashes involved a collision with a train.
Traffic Crashes Occurring at Rail Grade Crossing Year Fatal Injury Property Damage >$400 Total 2003 2 38 147 187 2004 2 35 117 154 2005 3 36 102 141 2006 1 38 125 164 2007 1 32 108 141 Total 9 179 599 787
Traffic Crashes Occurring at Rail Grade Crossing by Crash Type
0
20
40
60
80
100
120
140
160
2003 2004 2005 2006 2007
Year
Cras
hes
Fatal Injury Property Damage >$400
15

The table below shows the number of crashes that involve the use of alcohol and/or drugs. The categories are defined the same as in section one.
Traffic Crashes Occurring at Rail Grade Crossing
Year Alcohol Drugs Alcohol & Drugs None Total 2003 5 0 0 182 187 2004 11 2 1 140 154 2005 12 0 1 128 141 2006 11 0 2 151 164 2007 14 1 1 125 141 Total 53 3 5 726 787
Traffic Crashes Occurring at Rail Grade Crossing by Alcohol and Drug Involvement
0%
10%
20%
30%
40%
50%
60%
70%
80%
90%
100%
2003 2004 2005 2006 2007
Year
% o
f Cra
shes None
Alcohol & DrugsDrugsAlcohol
16

The table below shows the crashes occurring at a rail grade crossing by the type of traffic control devices. The categories are defined the same as in section one.
Traffic Crashes Occurring at Rail Grade Crossing Year RR Crossbucks RR Flasher RR Gates Other/Unknown Total2003 33 27 28 99 187 2004 24 23 27 80 154 2005 18 17 35 71 141 2006 30 16 39 79 164 2007 31 16 28 66 141 Total 136 99 157 395 787
Traffic Crashes Occurring at Rail Grade Crossing by Traffic Control Device
17%
13%
20%
50%
RR CrossbucksRR FlasherRR GatesOther/Unknown
17

The table below illustrates the times of day when motor vehicles crash at rail grade crossings.
Traffic Crashes Occurring at Rail Grade Crossing Year 0000-0559 0600-1159 1200-1759 1800-2359 Unknown Total 2003 23 45 75 37 7 187 2004 20 38 54 34 8 154 2005 16 38 47 37 3 141 2006 23 53 57 27 4 164 2007 18 38 54 30 1 141 Total 100 212 287 165 23 787
Traffic Crashes Occurring at Rail Grade Crossing by Time of Day
13%
27%
36%
21%3%
0000-05590600-11591200-17591800-2359Unknown
18

The following table represents data collected in the driver actions section of the crash report. It should be noted that some crashes may involve more than one driver action.
Traffic Crashes Occurring at Rail Grade Crossing
Year Failure to Keep in
Proper Lane or Running Off Road
Failure to Obey Traffic
Controls
Failure to Observe
Warnings or Instructions
Careless or Erratic Driving
Reckless or
Negligent Driving
2003 20 10 15 12 5 2004 31 7 9 1 7 2005 19 10 7 3 9 2006 32 7 14 8 12 2007 23 9 5 6 14 Total 125 43 50 30 47
Traffic Crashes Occurring at Rail Grade Crossing by Driver Actions
125
43
50
30
47
Failure to Keep in Proper Laneor Running Off RoadFailure to Obey Traffic Controls
Failure to Observe Warnings orInstructionsCareless or Erratic Driving
Reckless or Negligent Driving
19

The following two tables show the number and percentage of crashes by month, respectively. These numbers reflect all crash types.
Traffic Crashes Occurring at Rail Grade Crossing by Month
Month 2003 2004 2005 2006 2007 Total Jan 14 21 4 15 10 64 Feb 20 8 13 14 17 72 Mar 14 17 15 4 13 63 Apr 23 8 12 22 7 72 May 14 9 11 16 14 64 Jun 13 14 12 11 16 66 Jul 13 11 18 13 9 64 Aug 10 17 11 12 9 59 Sep 17 10 12 18 17 74 Oct 24 13 15 14 8 74 Nov 17 14 11 11 7 60 Dec 8 12 7 14 14 55 Total 187 154 141 164 141 787
Traffic Crashes Occurring at Rail Grade Crossing by Month Month 2003 2004 2005 2006 2007 Total
Jan 7.49% 13.64% 2.84% 9.15% 7.09% 8.13% Feb 10.70% 5.19% 9.22% 8.54% 12.06% 9.15% Mar 7.49% 11.04% 10.64% 2.44% 9.22% 8.01% Apr 12.30% 5.19% 8.51% 13.41% 4.96% 9.15% May 7.49% 5.84% 7.80% 9.76% 9.93% 8.13% Jun 6.95% 9.09% 8.51% 6.71% 11.35% 8.39% Jul 6.95% 7.14% 12.77% 7.93% 6.38% 8.13% Aug 5.35% 11.04% 7.80% 7.32% 6.38% 7.50% Sep 9.09% 6.49% 8.51% 10.98% 12.06% 9.40% Oct 12.83% 8.44% 10.64% 8.54% 5.67% 9.40% Nov 9.09% 9.09% 7.80% 6.71% 4.96% 7.62% Dec 4.28% 7.79% 4.96% 8.54% 9.93% 6.99%
20

Section 3: Combination of the Data Presented in the First Two Sections
Traffic Crashes Involving Collision with a Train or Occurring at Rail Grade Crossing
Year Fatal Injury Property Damage >$400 Total 2003 9 62 190 261 2004 6 53 149 208 2005 7 56 126 189 2006 6 51 146 203 2007 2 46 122 170 Total 30 268 733 1,031
Traffic Crashes Involving Collision with a Train or Occurring at Rail Grade Crossing by Crash Type
0
20
40
60
80
100
120
140
160
180
200
2003 2004 2005 2006 2007
Year
Cras
hes
Fatal Injury Property Damage >$400
21

Traffic Crashes Involving Collision with a Train or Occurring at Rail Grade
Crossing Year Alcohol Drugs Alcohol & Drugs None Total 2003 14 0 0 247 261 2004 15 2 1 190 208 2005 16 0 1 172 189 2006 16 0 2 185 203 2007 16 1 2 151 170 Total 77 3 6 945 1,031
Traffic Crashes Involving Collision with a Train or Occurring at Rail Grade Crossing by Alcohol and Drug Involvement
0%
10%
20%
30%
40%
50%
60%
70%
80%
90%
100%
2003 2004 2005 2006 2007
Year
% o
f Cra
shes None
Alcohol & DrugsDrugsAlcohol
22
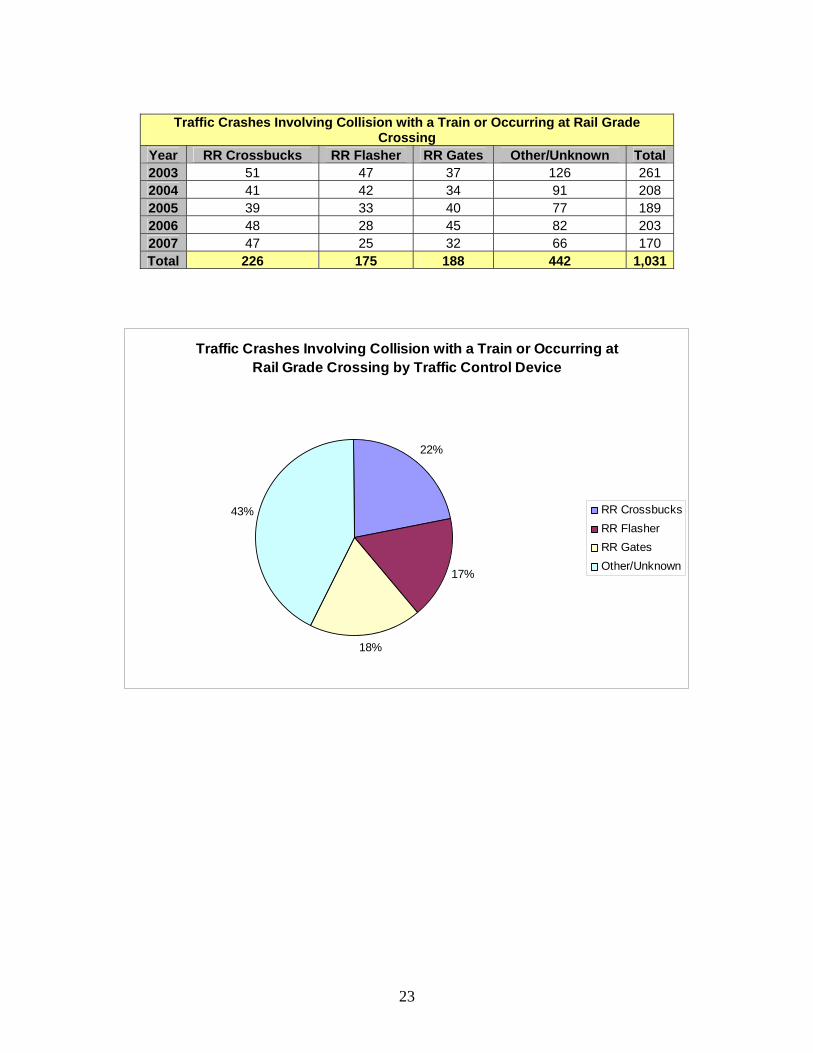
Traffic Crashes Involving Collision with a Train or Occurring at Rail Grade
Crossing Year RR Crossbucks RR Flasher RR Gates Other/Unknown Total 2003 51 47 37 126 261 2004 41 42 34 91 208 2005 39 33 40 77 189 2006 48 28 45 82 203 2007 47 25 32 66 170 Total 226 175 188 442 1,031
Traffic Crashes Involving Collision with a Train or Occurring at Rail Grade Crossing by Traffic Control Device
22%
17%
18%
43% RR CrossbucksRR FlasherRR GatesOther/Unknown
23
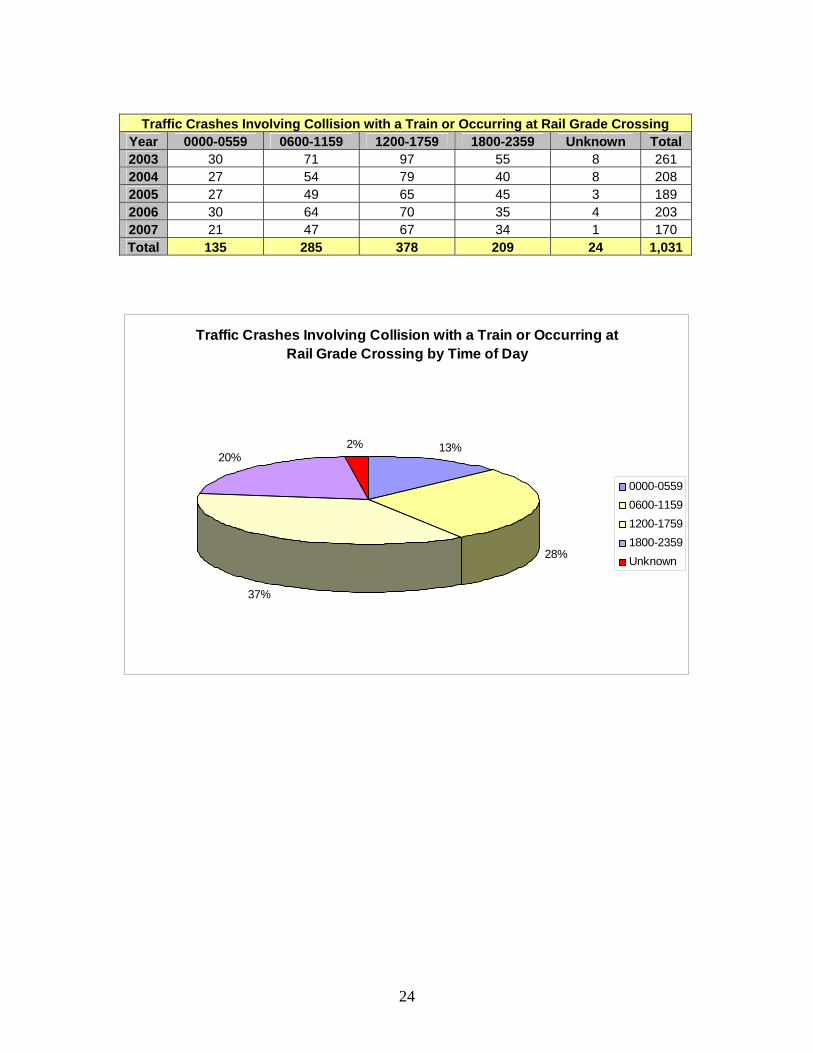
Traffic Crashes Involving Collision with a Train or Occurring at Rail Grade Crossing
Year 0000-0559 0600-1159 1200-1759 1800-2359 Unknown Total 2003 30 71 97 55 8 261 2004 27 54 79 40 8 208 2005 27 49 65 45 3 189 2006 30 64 70 35 4 203 2007 21 47 67 34 1 170 Total 135 285 378 209 24 1,031
Traffic Crashes Involving Collision with a Train or Occurring at Rail Grade Crossing by Time of Day
13%
28%
37%
20%2%
0000-05590600-11591200-17591800-2359Unknown
24

Traffic Crashes Involving Collision with a Train or Occurring at Rail Grade Crossing
Year Failure to Keep in
Proper Lane or Running Off Road
Failure to Obey Traffic
Controls
Failure to Observe
Warnings or Instructions
Careless or Erratic Driving
Reckless or
Negligent Driving
2003 28 24 29 13 12 2004 32 22 22 3 9 2005 21 19 14 5 11 2006 34 15 22 11 13 2007 25 15 10 6 15 Total 140 95 97 38 60
Traffic Crashes Involving Collision with a Train or Occurring at Rail Grade Crossing by Driver Action
140
95
97
38
60
Failure to Keep in Proper Lane orRunning Off RoadFailure to Obey Traffic Controls
Failure to Observe Warnings orInstructionsCareless or Erratic Driving
Reckless or Negligent Driving
25

Traffic Crashes Involving Collision with a Train or Occurring at Rail Grade Crossing
Month 2003 2004 2005 2006 2007 Total Jan 16 26 5 18 14 79 Feb 27 9 16 18 18 88 Mar 21 22 19 8 16 86 Apr 33 11 19 29 11 103 May 19 10 13 18 17 77 Jun 19 21 18 13 17 88 Jul 18 14 23 14 10 79 Aug 15 23 13 15 11 77 Sep 22 13 17 20 20 92 Oct 31 16 22 19 10 98 Nov 26 23 14 14 8 85 Dec 14 20 10 17 18 79 Total 261 208 189 203 170 1,031
Traffic Crashes Involving Collision with a Train or Occurring at Rail Grade Crossing Month 2003 2004 2005 2006 2007 Total
Jan 6.13% 12.50% 2.65% 8.87% 8.24% 7.66% Feb 10.34% 4.33% 8.47% 8.87% 10.59% 8.54% Mar 8.05% 10.58% 10.05% 3.94% 9.41% 8.34% Apr 12.64% 5.29% 10.05% 14.29% 6.47% 9.99% May 7.28% 4.81% 6.88% 8.87% 10.00% 7.47% Jun 7.28% 10.10% 9.52% 6.40% 10.00% 8.54% Jul 6.90% 6.73% 12.17% 6.90% 5.88% 7.66% Aug 5.75% 11.06% 6.88% 7.39% 6.47% 7.47% Sep 8.43% 6.25% 8.99% 9.85% 11.76% 8.92% Oct 11.88% 7.69% 11.64% 9.36% 5.88% 9.51% Nov 9.96% 11.06% 7.41% 6.90% 4.71% 8.24% Dec 5.36% 9.62% 5.29% 8.37% 10.59% 7.66%
26

TDOS-RPD, ORSM - September 2008
Rail Grade Crossings and Train Crashes: 2003 - 2007
LegendRailroad Tracks
Types of Crash
at Rail Grade Crossings
with a Train
# of Crashes by County
01 -
10
11 - 3
6
76 - 1
20 212
Figure 1.
27
CountyCrash at Rail
Grade CrossingCollision with
TrainTotal
Crashes CountyCrash at Rail
Grade CrossingCollision with
TrainTotal
Crashes CountyCrash at Rail
Grade CrossingCollision with
TrainTotal
CrashesShelby 158 54 212 Putnam 9 0 9 Polk 3 0 3Davidson 106 14 120 Obion 6 3 9 Tipton 3 0 3Knox 78 16 94 Carroll 5 3 8 Cheatham 2 1 3Hamilton 61 15 76 Fayette 5 3 8 Grainger 2 1 3Rutherford 32 4 36 Unicoi 5 3 8 Bedford 1 2 3Sumner 26 5 31 Carter 2 6 8 Lauderdale 1 2 3Greene 24 3 27 Coffee 6 0 6 McNairy 2 0 2Madison 22 2 24 Jefferson 5 1 6 Claiborne 1 1 2Hamblen 14 10 24 Marshall 5 1 6 White 1 1 2Dickson 14 5 19 Monroe 4 2 6 Chester 1 0 1McMinn 13 6 19 Williamson 3 3 6 Cumberland 1 0 1Washington 13 5 18 Loudon 2 4 6 Giles 1 0 1Anderson 11 7 18 Humphreys 1 5 6 Hickman 1 0 1Bradley 12 5 17 Haywood 4 1 5 Lake 1 0 1Blount 15 1 16 Henry 4 1 5 Lewis 1 0 1Hawkins 11 4 15 Rhea 1 4 5 Warren 1 0 1Maury 13 1 14 Campbell 3 1 4 Benton 0 1 1Gibson 10 4 14 Franklin 3 1 4 Hardeman 0 1 1Roane 9 5 14 Montgomery 3 1 4 Lincoln 0 1 1Cocke 9 4 13 Lawrence 2 2 4Wilson 8 5 13 Weakley 2 2 4Dyer 8 4 12Sullivan 9 2 11Robertson 6 5 11
.
The 21 TN Counties with the Next Highest Incidence ofRail Grade Crossings and Train Crashes (by Total)
The 19 TN Counties with the Next Highest Incidence ofRail Grade Crossings and Train Crashes (by Total)
The 24 TN Counties with the Highest Incidence ofRail Grade Crossings and Train Crashes (by Total)


Section 4: County Information 2003-2007
Traffic Crashes Involving Collision with a Train County Fatal Injury PD >$400 Total County Fatal Injury PD >$400 Total
Anderson 0 4 3 7 Lauderdale 0 1 1 2 Bedford 1 0 1 2 Lawrence 0 0 2 2 Benton 0 1 0 1 Lewis 0 0 0 0 Bledsoe 0 0 0 0 Lincoln 0 1 0 1 Blount 0 1 0 1 Loudon 0 2 2 4
Bradley 0 1 4 5 McMinn 0 4 2 6 Campbell 0 0 1 1 McNairy 0 0 0 0 Cannon 0 0 0 0 Macon 0 0 0 0 Carroll 0 1 2 3 Madison 0 1 1 2 Carter 0 1 5 6 Marion 0 0 0 0
Cheatham 0 1 0 1 Marshall 0 0 1 1 Chester 0 0 0 0 Maury 0 1 0 1
Claiborne 0 1 0 1 Meigs 0 0 0 0 Clay 0 0 0 0 Monroe 0 0 2 2
Cocke 0 3 1 4 Montgomery 1 0 0 1 Coffee 0 0 0 0 Moore 0 0 0 0
Crockett 0 0 0 0 Morgan 0 0 0 0 Cumberland 0 0 0 0 Obion 0 1 2 3
Davidson 1 3 10 14 Overton 0 0 0 0 Decatur 0 0 0 0 Perry 0 0 0 0 De Kalb 0 0 0 0 Pickett 0 0 0 0 Dickson 1 0 4 5 Polk 0 0 0 0
Dyer 0 2 2 4 Putnam 0 0 0 0 Fayette 2 0 1 3 Rhea 1 0 3 4 Fentress 0 0 0 0 Roane 0 3 2 5 Franklin 1 0 0 1 Robertson 0 1 4 5 Gibson 0 2 2 4 Rutherford 3 1 0 4 Giles 0 0 0 0 Scott 0 0 0 0
Grainger 0 1 0 1 Sequatchie 0 0 0 0 Greene 0 2 1 3 Sevier 0 0 0 0 Grundy 0 0 0 0 Shelby 4 9 41 54
Hamblen 0 8 2 10 Smith 0 0 0 0 Hamilton 0 8 7 15 Stewart 0 0 0 0 Hancock 0 0 0 0 Sullivan 0 1 1 2
Hardeman 0 1 0 1 Sumner 1 4 0 5 Hardin 0 0 0 0 Tipton 0 0 0 0
Hawkins 1 3 0 4 Trousdale 0 0 0 0 Haywood 0 0 1 1 Unicoi 1 0 2 3
Henderson 0 0 0 0 Union 0 0 0 0 Henry 0 0 1 1 Van Buren 0 0 0 0
Hickman 0 0 0 0 Warren 0 0 0 0 Houston 0 0 0 0 Washington 1 1 3 5
Humphreys 0 5 0 5 Wayne 0 0 0 0 Jackson 0 0 0 0 Weakley 0 1 1 2 Jefferson 1 0 0 1 White 0 0 1 1 Johnson 0 0 0 0 Williamson 0 1 2 3
Knox 0 5 11 16 Wilson 1 2 2 5 Lake 0 0 0 0 Total 21 89 134 244
29

Traffic Crashes Occurring at Rail Grade Crossing County Fatal Injury PD >$400 Total County Fatal Injury PD >$400 Total
Anderson 0 3 8 11 Lauderdale 0 0 1 1 Bedford 0 0 1 1 Lawrence 0 0 2 2 Benton 0 0 0 0 Lewis 0 0 1 1 Bledsoe 0 0 0 0 Lincoln 0 0 0 0 Blount 0 5 10 15 Loudon 0 0 2 2
Bradley 0 1 11 12 McMinn 0 3 10 13 Campbell 0 1 2 3 McNairy 0 1 1 2 Cannon 0 0 0 0 Macon 0 0 0 0 Carroll 0 2 3 5 Madison 0 5 17 22 Carter 0 0 2 2 Marion 0 0 0 0
Cheatham 0 0 2 2 Marshall 0 0 5 5 Chester 0 0 1 1 Maury 0 1 12 13
Claiborne 0 1 0 1 Meigs 0 0 0 0 Clay 0 0 0 0 Monroe 0 0 4 4
Cocke 0 3 6 9 Montgomery 0 1 2 3 Coffee 0 0 6 6 Moore 0 0 0 0
Crockett 0 0 0 0 Morgan 0 0 0 0 Cumberland 0 1 0 1 Obion 0 0 6 6
Davidson 2 24 80 106 Overton 0 0 0 0 Decatur 0 0 0 0 Perry 0 0 0 0 De Kalb 0 0 0 0 Pickett 0 0 0 0 Dickson 1 4 9 14 Polk 0 0 3 3
Dyer 0 3 5 8 Putnam 0 2 7 9 Fayette 0 1 4 5 Rhea 0 0 1 1 Fentress 0 0 0 0 Roane 0 3 6 9 Franklin 0 0 3 3 Robertson 1 1 4 6 Gibson 0 1 9 10 Rutherford 1 12 19 32 Giles 0 0 1 1 Scott 0 0 0 0
Grainger 0 2 0 2 Sequatchie 0 0 0 0 Greene 0 5 19 24 Sevier 0 0 0 0 Grundy 0 0 0 0 Shelby 0 33 125 158
Hamblen 0 2 12 14 Smith 0 0 0 0 Hamilton 0 16 45 61 Stewart 0 0 0 0 Hancock 0 0 0 0 Sullivan 0 3 6 9
Hardeman 0 0 0 0 Sumner 1 5 20 26 Hardin 0 0 0 0 Tipton 0 0 3 3
Hawkins 0 1 10 11 Trousdale 0 0 0 0 Haywood 0 1 3 4 Unicoi 0 1 4 5
Henderson 0 0 0 0 Union 0 0 0 0 Henry 0 0 4 4 Van Buren 0 0 0 0
Hickman 0 0 1 1 Warren 0 0 1 1 Houston 0 0 0 0 Washington 0 2 11 13
Humphreys 0 1 0 1 Wayne 0 0 0 0 Jackson 0 0 0 0 Weakley 0 0 2 2 Jefferson 1 2 2 5 White 0 0 1 1 Johnson 0 0 0 0 Williamson 0 2 1 3
Knox 2 24 52 78 Wilson 0 0 8 8 Lake 0 0 1 1 Unknown 0 0 2 2
Total 9 179 599 787
30

Traffic Crashes Involving Collision with a Train or Occurring at Rail Grade Crossing County Fatal Injury PD >$400 Total County Fatal Injury PD >$400 Total
Anderson 0 7 11 18 Lauderdale 0 1 2 3 Bedford 1 0 2 3 Lawrence 0 0 4 4 Benton 0 1 0 1 Lewis 0 0 1 1 Bledsoe 0 0 0 0 Lincoln 0 1 0 1 Blount 0 6 10 16 Loudon 0 2 4 6
Bradley 0 2 15 17 McMinn 0 7 12 19 Campbell 0 1 3 4 McNairy 0 1 1 2 Cannon 0 0 0 0 Macon 0 0 0 0 Carroll 0 3 5 8 Madison 0 6 18 24 Carter 0 1 7 8 Marion 0 0 0 0
Cheatham 0 1 2 3 Marshall 0 0 6 6 Chester 0 0 1 1 Maury 0 2 12 14
Claiborne 0 2 0 2 Meigs 0 0 0 0 Clay 0 0 0 0 Monroe 0 0 6 6
Cocke 0 6 7 13 Montgomery 1 1 2 4 Coffee 0 0 6 6 Moore 0 0 0 0
Crockett 0 0 0 0 Morgan 0 0 0 0 Cumberland 0 1 0 1 Obion 0 1 8 9
Davidson 3 27 90 120 Overton 0 0 0 0 Decatur 0 0 0 0 Perry 0 0 0 0 De Kalb 0 0 0 0 Pickett 0 0 0 0 Dickson 2 4 13 19 Polk 0 0 3 3
Dyer 0 5 7 12 Putnam 0 2 7 9 Fayette 2 1 5 8 Rhea 1 0 4 5 Fentress 0 0 0 0 Roane 0 6 8 14 Franklin 1 0 3 4 Robertson 1 2 8 11 Gibson 0 3 11 14 Rutherford 4 13 19 36 Giles 0 0 1 1 Scott 0 0 0 0
Grainger 0 3 0 3 Sequatchie 0 0 0 0 Greene 0 7 20 27 Sevier 0 0 0 0 Grundy 0 0 0 0 Shelby 4 42 166 212
Hamblen 0 10 14 24 Smith 0 0 0 0 Hamilton 0 24 52 76 Stewart 0 0 0 0 Hancock 0 0 0 0 Sullivan 0 4 7 11
Hardeman 0 1 0 1 Sumner 2 9 20 31 Hardin 0 0 0 0 Tipton 0 0 3 3
Hawkins 1 4 10 15 Trousdale 0 0 0 0 Haywood 0 1 4 5 Unicoi 1 1 6 8
Henderson 0 0 0 0 Union 0 0 0 0 Henry 0 0 5 5 Van Buren 0 0 0 0
Hickman 0 0 1 1 Warren 0 0 1 1 Houston 0 0 0 0 Washington 1 3 14 18
Humphreys 0 6 0 6 Wayne 0 0 0 0 Jackson 0 0 0 0 Weakley 0 1 3 4 Jefferson 2 2 2 6 White 0 0 2 2 Johnson 0 0 0 0 Williamson 0 3 3 6
Knox 2 29 63 94 Wilson 1 2 10 13 Lake 0 0 1 1 Unknown 0 0 2 2
Total 30 268 733 1,031
31

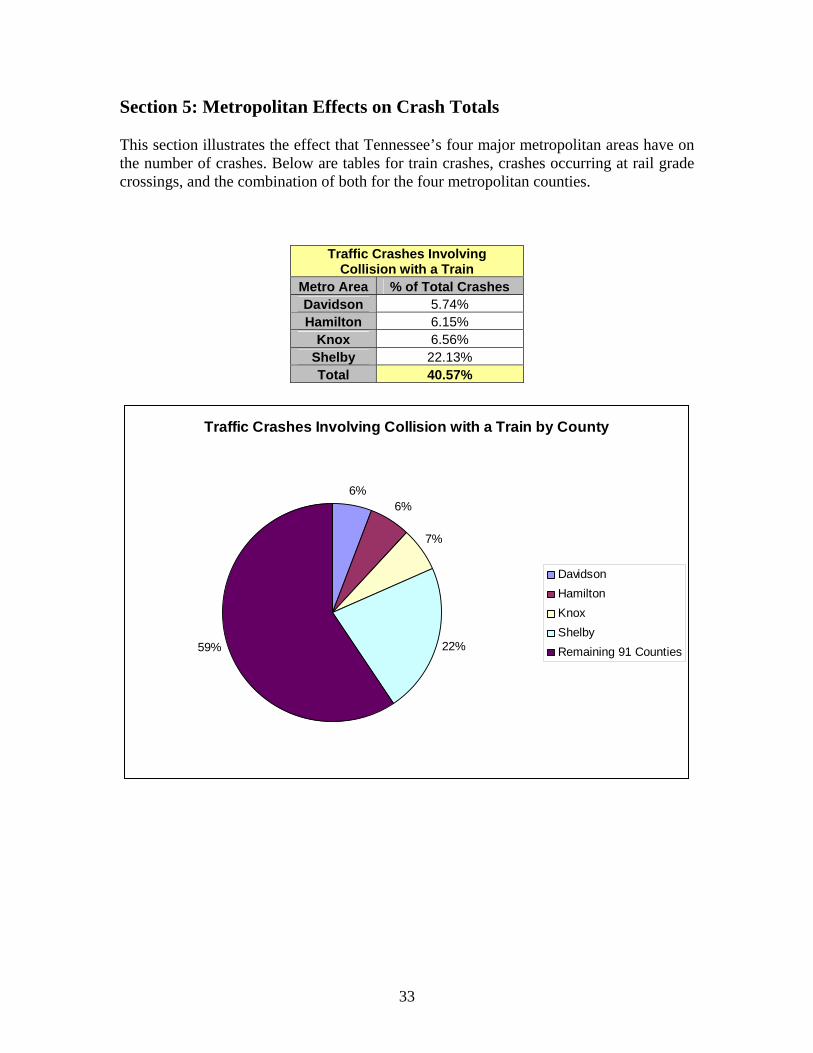
Section 5: Metropolitan Effects on Crash Totals This section illustrates the effect that Tennessee’s four major metropolitan areas have on the number of crashes. Below are tables for train crashes, crashes occurring at rail grade crossings, and the combination of both for the four metropolitan counties.
Traffic Crashes Involving Collision with a Train
Metro Area % of Total Crashes Davidson 5.74% Hamilton 6.15%
Knox 6.56% Shelby 22.13% Total 40.57%
Traffic Crashes Involving Collision with a Train by County
6%6%
7%
22%59%
DavidsonHamiltonKnoxShelbyRemaining 91 Counties
33

Traffic Crashes Occurring at Rail
Grade Crossing Metro Area % of Total Crashes Davidson 13.47% Hamilton 7.75%
Knox 9.91% Shelby 20.08% Total 51.21%
Traffic Crashes Occurring at Rail Grade Crossing by County
13%
8%
10%
20%
49%
DavidsonHamiltonKnoxShelbyRemaining 91 Counties
34
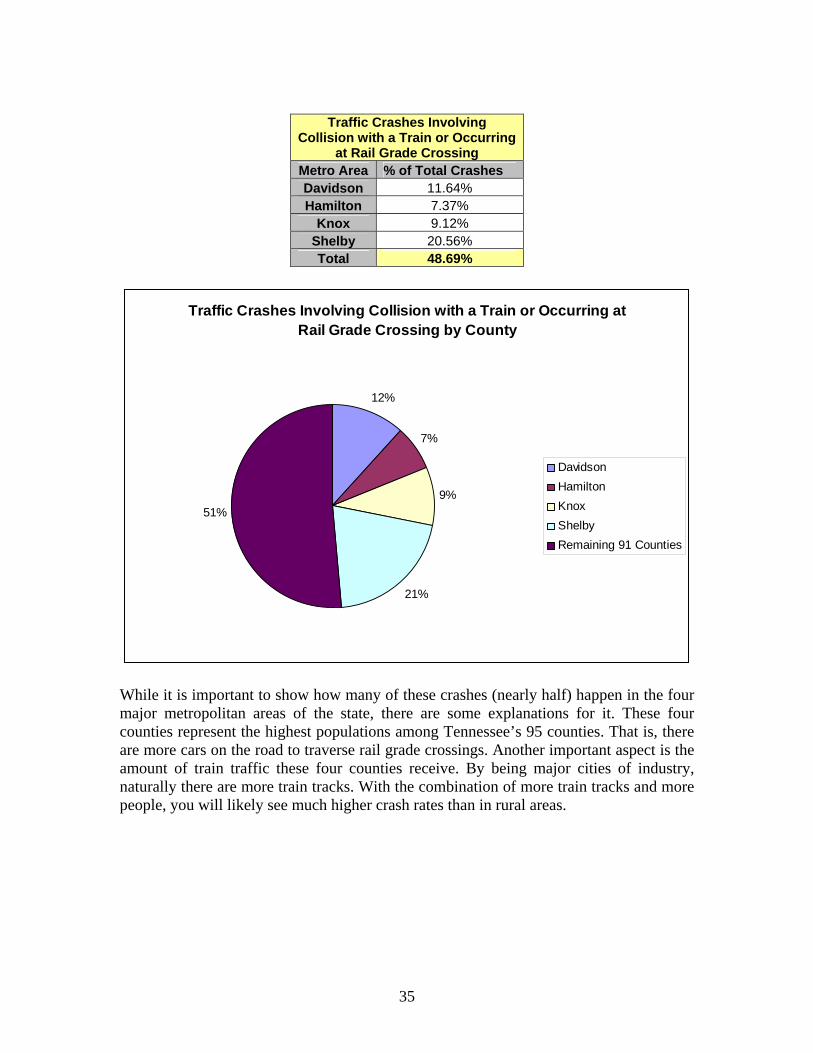
Traffic Crashes Involving
Collision with a Train or Occurring at Rail Grade Crossing
Metro Area % of Total Crashes Davidson 11.64% Hamilton 7.37%
Knox 9.12% Shelby 20.56% Total 48.69%
Traffic Crashes Involving Collision with a Train or Occurring at Rail Grade Crossing by County
12%
7%
9%
21%
51%
DavidsonHamiltonKnoxShelbyRemaining 91 Counties
While it is important to show how many of these crashes (nearly half) happen in the four major metropolitan areas of the state, there are some explanations for it. These four counties represent the highest populations among Tennessee’s 95 counties. That is, there are more cars on the road to traverse rail grade crossings. Another important aspect is the amount of train traffic these four counties receive. By being major cities of industry, naturally there are more train tracks. With the combination of more train tracks and more people, you will likely see much higher crash rates than in rural areas.
35


Section 6: Considerations for Further Research There are a few areas that could improve the research described in this report. One would be to obtain figures that describe train traffic by time of day. By doing this, you could more easily decipher if visibility or volume are bigger factors in train collisions. Another would be train traffic by month. This may help explain why April appears to be more dangerous than other months, while May is less dangerous. By obtaining county populations and number of trains passing through daily, more conclusions could be drawn about the metropolitan areas. Links to Related Sources: Federal Transit Administration: fta.dot.gov Federal Highway Administration: fhwa.dot.gov National Highway Traffic Safety Administration: nhtsa.dot.gov Federal Motor Carrier Safety Administration: fmcsa.dot.gov Tennessee Department of Transportation: tdot.state.tn.us Federal Railroad Administration: fra.dot.gov
37

Prepared By:
Tennessee Department of Safety Research, Planning, and Development Division
Menzler-Nix Building, 1150 Foster Avenue Nashville, TN 37243
615-687-2400